Headlines
|
|
Consumers pull back while investors churn:
Over the past two months, consumers have pulled back their record high expectations for stocks this year but still remain net positive. Their changing expectations led to a further surge in trading activity at major retail-facing brokerage firms.
Surge in money growth does not have a consistent record:
With massive fiscal and monetary stimulus, the M2 money supply has exploded. This always triggers strong opinions about what it means for inflation, stocks, and other assets. If we look at the evidence going back to the 1960s, then we can see it's not quite so clear.
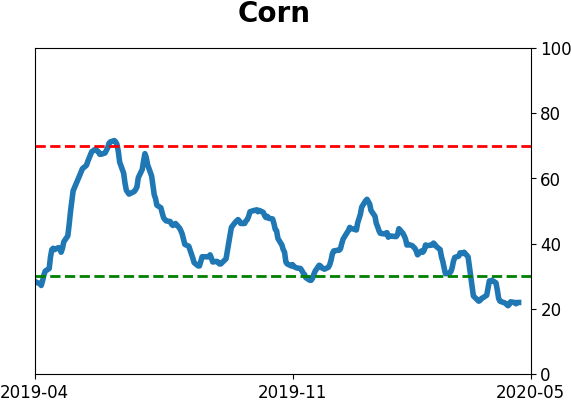
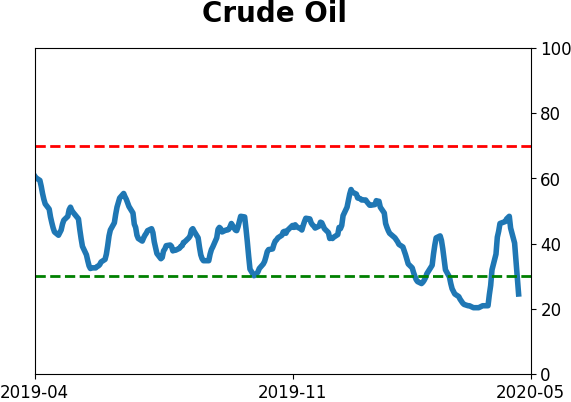
The latest Commitments of Traders report was released, covering positions through Tuesday: There weren't any new major extremes of note, though "smart money" hedgers have been steadily accumulating positions in corn and are now net long more than 5% of the open interest. According to the Backtest Engine, over the past 6 years, this has led to a rally in that contract over the next 2 months after 35 out of 39 weeks, averaging 8.8%. Suggesting widespread liquidations, hedgers have been selling crude oil, which runs counter to their usual pattern of buying into lower prices. They're net short more than 25% of the open interest, the most since January.
Tech recovery: The long-term McClellan Summation Index for the Nasdaq 100 (NDX) is about to turn positive. This will be its first positive reading in well over a month, after having been severely negative. The Backtest Engine shows good returns for the NDX over the next two months, with a 75% win rate and 4.4% average return. If we stipulate that the Summation Index must have been negative for at least 30 days, and reached at least -750, then 11 of the 12 signals were positive two months later, averaging 5.2%. The loss was from June 2004, which recovered soon after. Some of the winners, though, especially in 2001, rolled over into losses longer-term.
|
Smart / Dumb Money Confidence
|
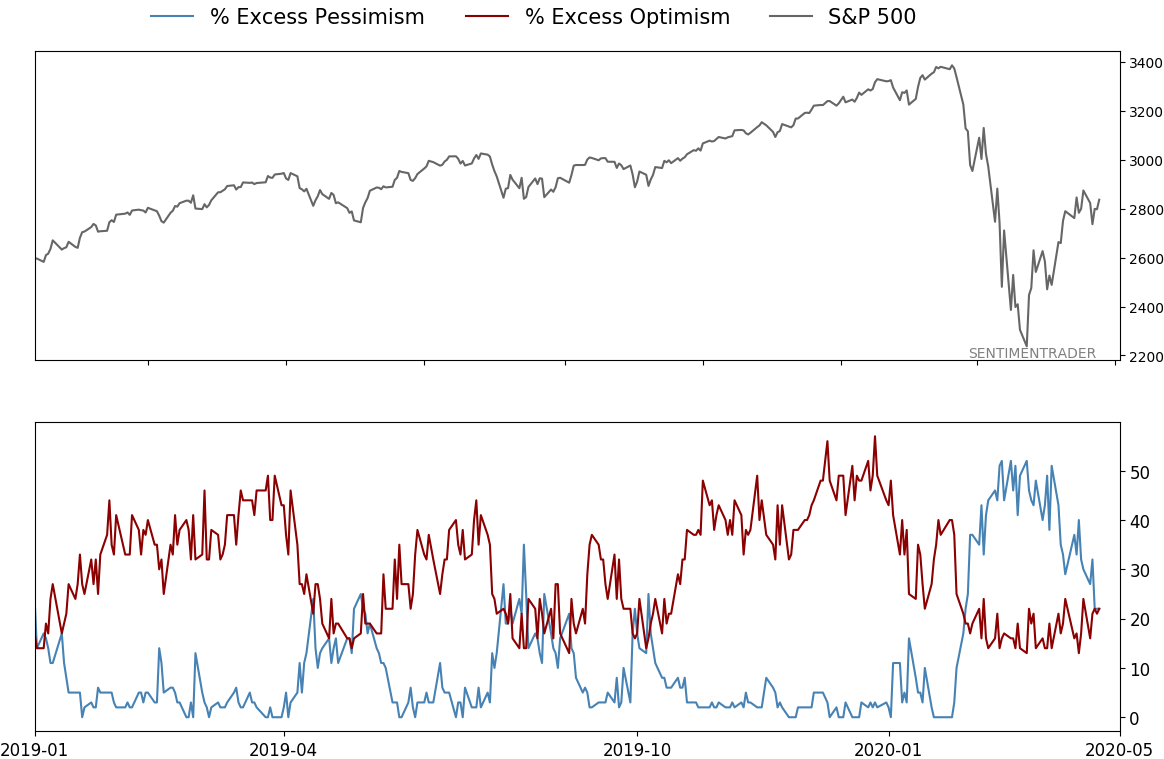
Smart Money Confidence: 73%
Dumb Money Confidence: 46%
|
|
Risk Levels
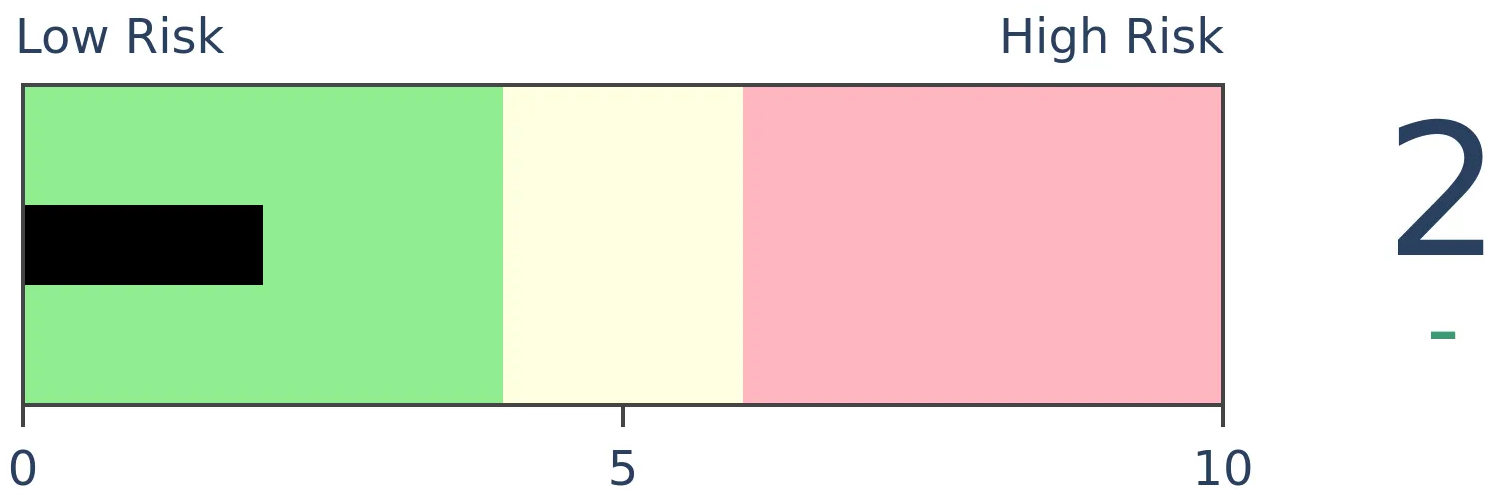
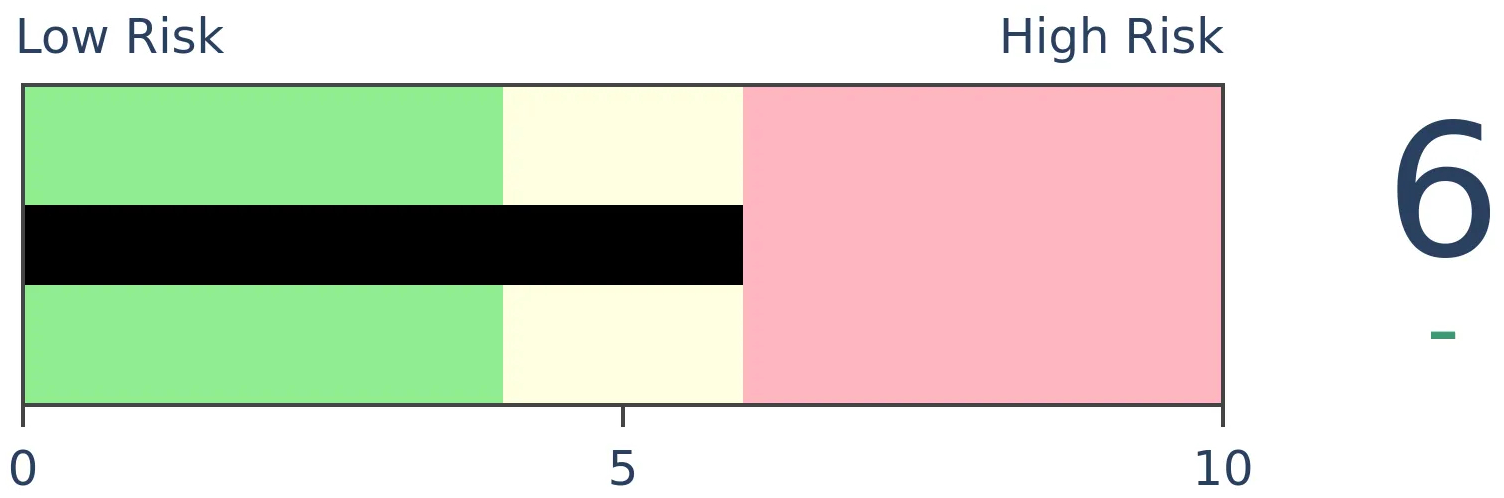
Stocks Short-Term
|
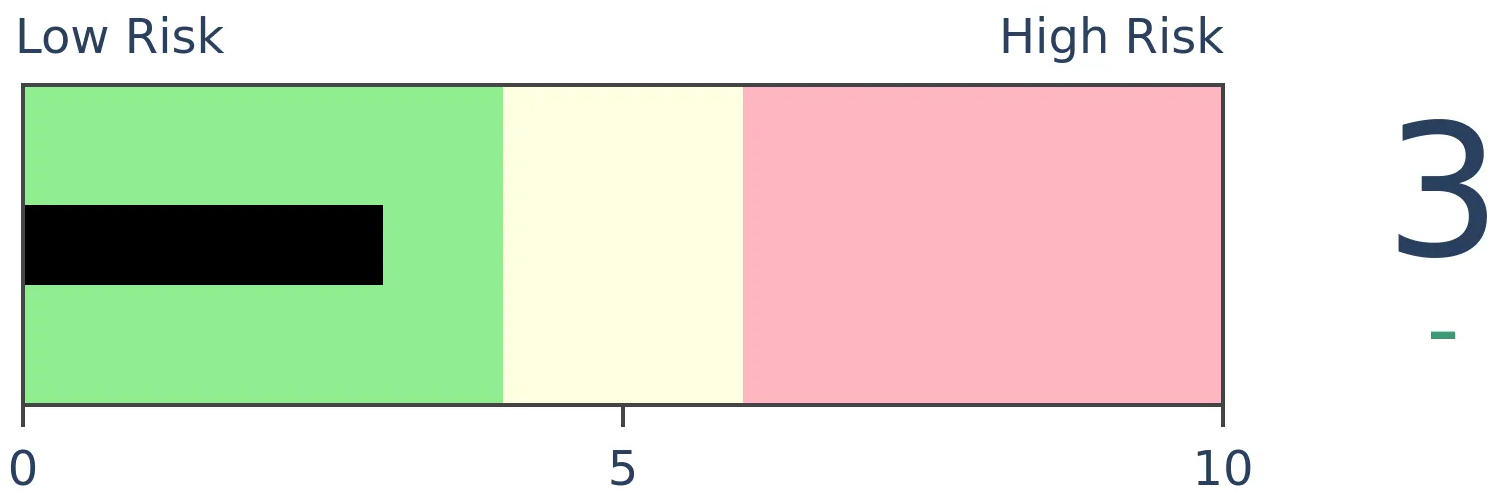
Stocks Medium-Term

|
|
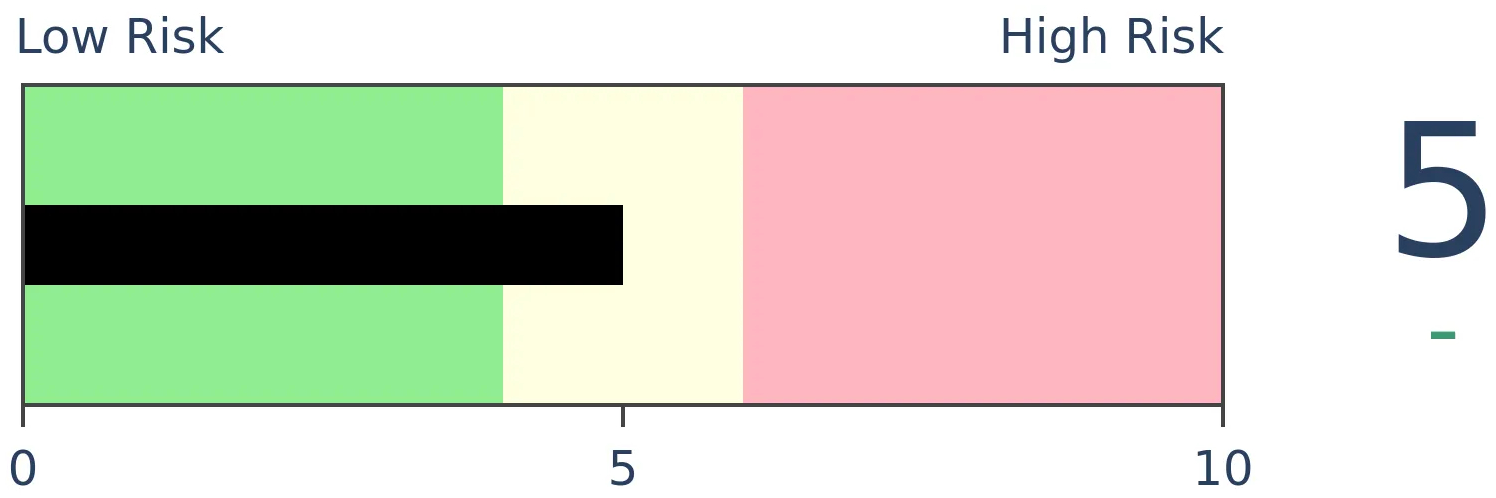
Bonds
|
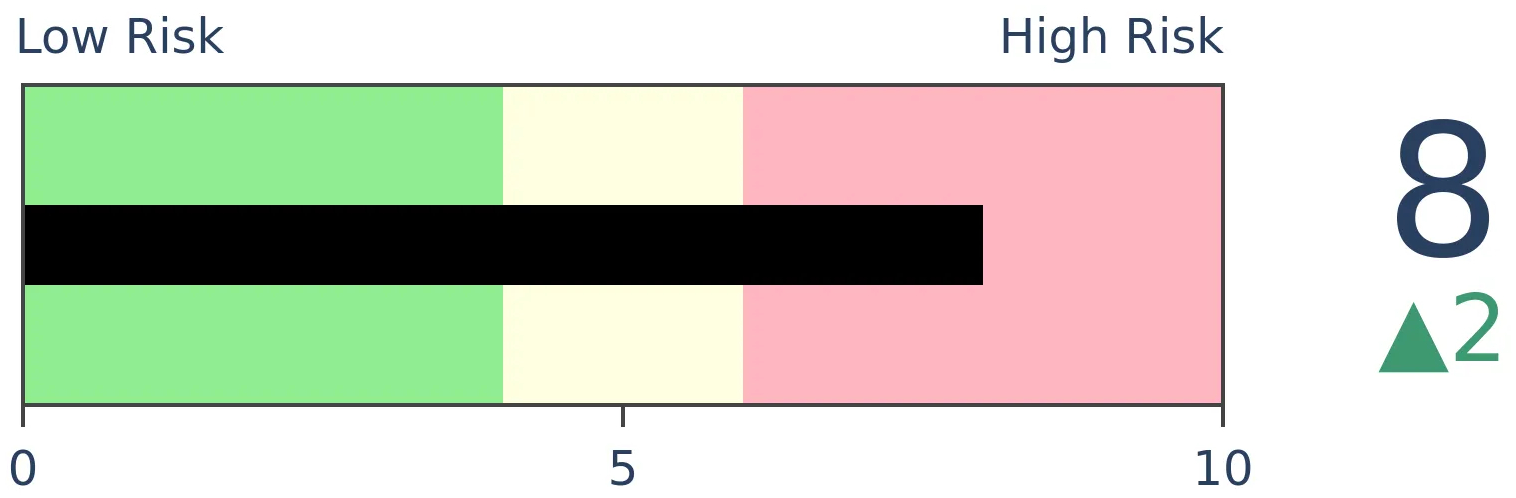
Crude Oil
|
|
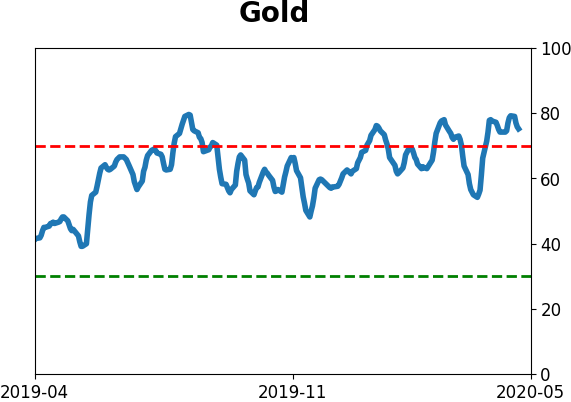
Gold
|
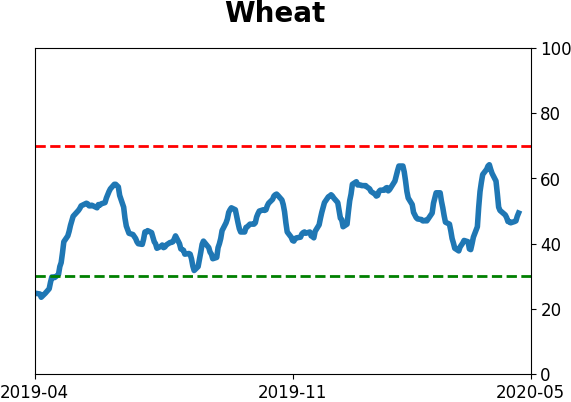
Agriculture
|
|
Research
BOTTOM LINE
Over the past two months, consumers have pulled back their record high expectations for stocks this year but still remain net positive. Their changing expectations led to a further surge in trading activity at major retail-facing brokerage firms.
FORECAST / TIMEFRAME
None
|
In February, we saw that retail investors were busy trading stocks. Activity in the major retail-facing brokers had exploded, which had negative implications since it suggested a "get me in while the getting is good" kind of mentality.
It's difficult to rely on this data any longer since the brokers moved to free commissions. But just-released data shows that not only did investors pare back during the decline, but they doubled down - literally. Activity in March was more than double what it was just a few months prior.
In releasing the Q1 results, E-Trade notes that:
"The first quarter was truly extraordinary, as the global pandemic altered the dynamics of how we live and work, while rocking the financial markets—propelling volatility and testing multi-year lows across asset classes. We shattered customer activity records and generated unprecedented organic growth—January, February, and March represented our three highest individual trading months ever. In fact, the 42 highest trading days on record were all realized during the first quarter."
Aggregating the Daily Average Revenue Trades (DARTs) for E-Trade, TD Ameritrade, and Schwab, we can see that the explosion in activity that was no doubt triggered by free commissions continued unabated as the pandemic unfolded.
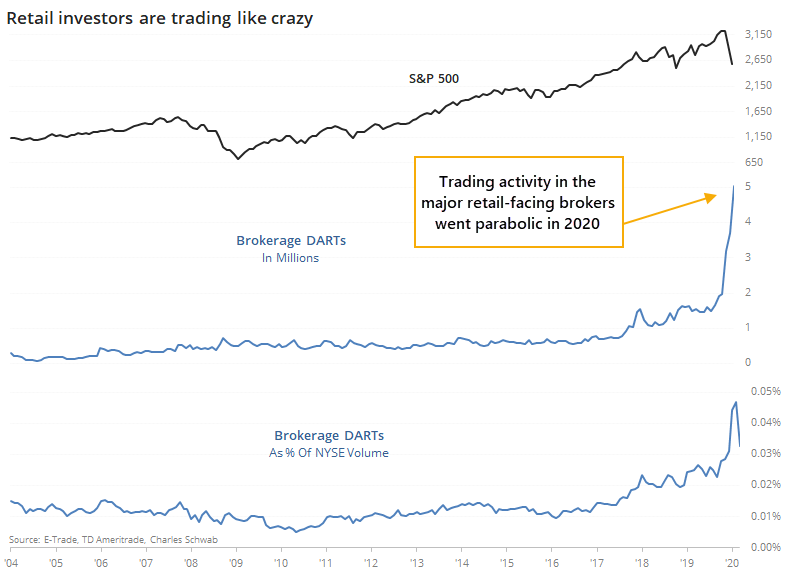
Even so, overall volume on the NYSE jumped in March as well, so retail activity actually dropped relative to the total. Maybe that's a good sign, but it's hard to tell from the data because there aren't really any precedents for this kind of activity.
According to what they're saying, anyway, investors (and by extension, consumers), have pared back their expectations for stocks. In February, we saw that consumers had never been more confident about a continuing rally. Over the past two months, they've reduced those expectations quite a lot.
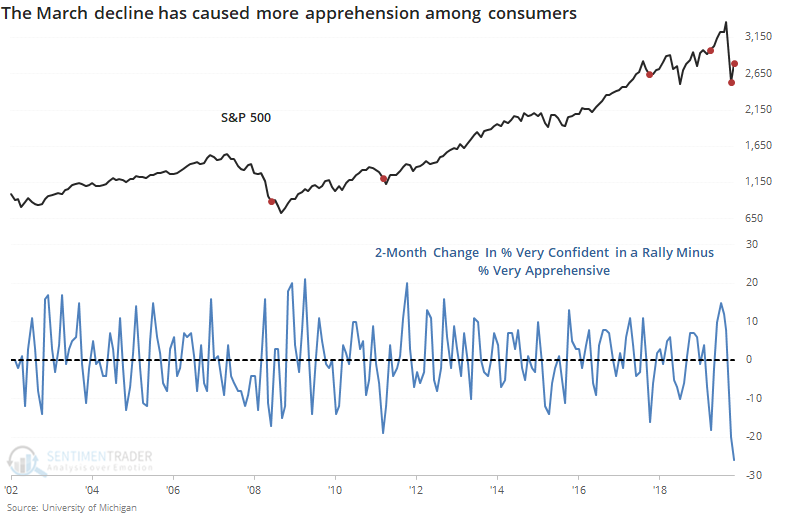
Other times they reduced expectations so much, so quickly, were a good sign for stocks, though those all came during the past decade of rising prices.
Even with the drop in expectations, there are still more consumers who are at least 75% confident in stocks rising than those who are 25% or less confident.
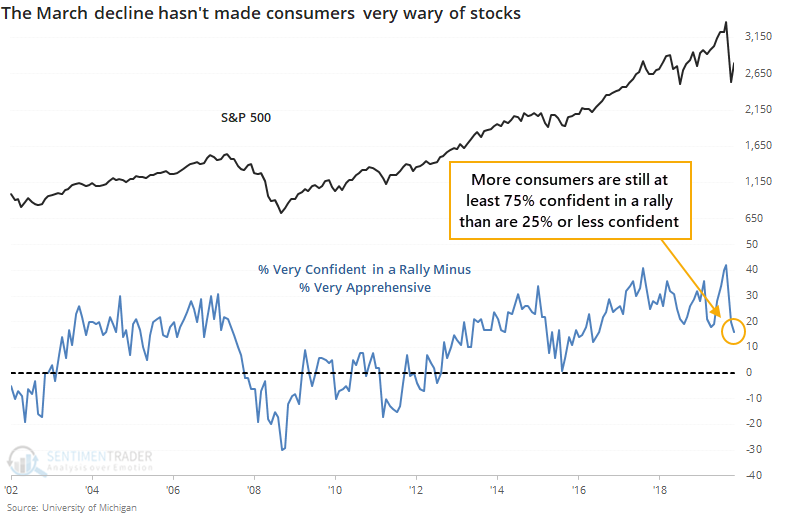
This is a far cry from the bottoms of the 2002 and 2008 bear markets when there were many more consumers who were apprehensive than confident. Even in 2015-16, consumers were more apprehensive than they are now.
A decline in stocks takes time to filter down through to general consumers, so it's not a big shock that the survey hasn't shown enough of a decline to be outright pessimistic. From a contrary standpoint, though, it would be a much better sign had it declined more than it has. So far, it's not enough to consider it a positive going forward.
BOTTOM LINE
With massive fiscal and monetary stimulus, the M2 money supply has exploded. This always triggers strong opinions about what it means for inflation, stocks, and other assets. If we look at the evidence going back to the 1960s, then we can see it's not quite so clear.
FORECAST / TIMEFRAME
None
|
Economies are collapsing, governments are responding, and central banks are printing money. In the U.S. it has resulted in a massive increase in the money supply, which brings the usual chorus of commentary about this triggering inflation.
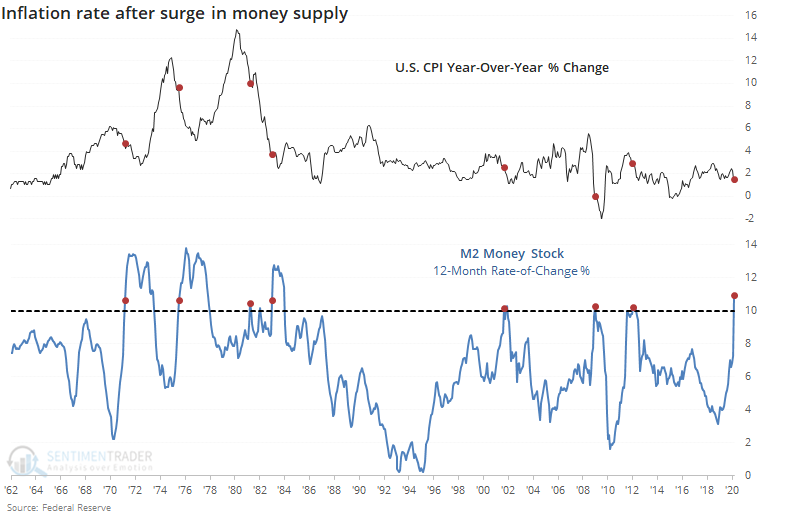
There is little point in adding another opinion to the chorus, so let's just look at the evidence, going back as far as we can. We'll compare times when M2 money supply rose at least 10% from a year ago, and see how that impacted inflation and various assets.
Per the St. Louis Fed:
"M2 includes a broader set of financial assets held principally by households. M2 consists of M1 plus: (1) savings deposits (which include money market deposit accounts, or MMDAs); (2) small-denomination time deposits (time deposits in amounts of less than $100,000); and (3) balances in retail money market mutual funds (MMMFs)."
For inflation itself, the argument that a rapid rise in money supply directly leads to a jump in inflation is a curious one because every single time, the rate of CPI growth decreased in the months ahead.
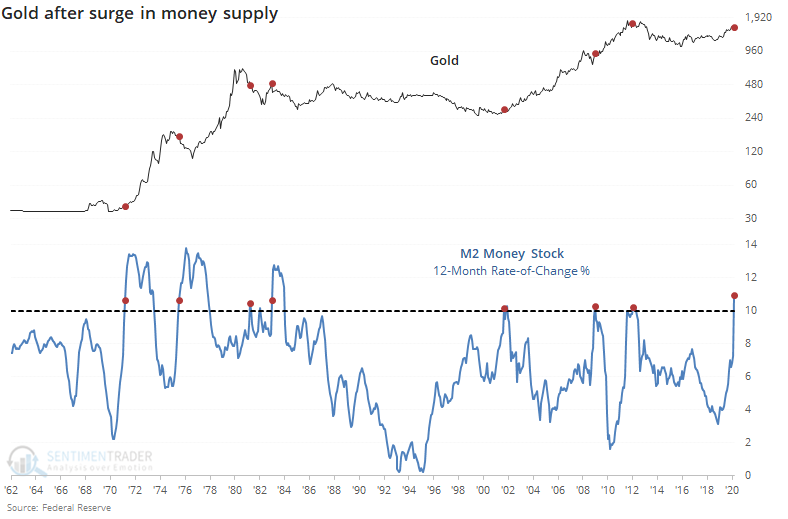
Usually, there is also an argument that it will lead to a surge in assets like gold. Here, the evidence is mixed, with a couple of them in the 2000s leading to rising gold prices, but most of the others leading to declines.
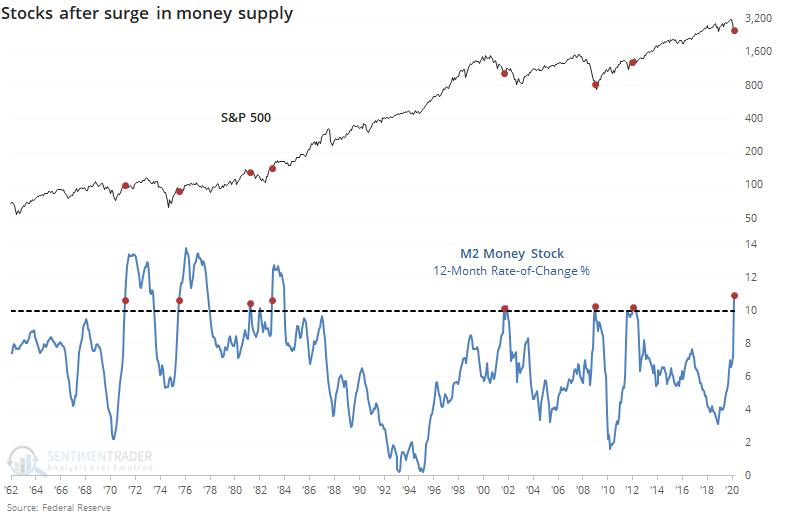
There was a similarly mixed picture for stocks. Some will argue it should be a negative, others a positive. The historical record shows about half of each.
Most of these came during a time of ever-lower note and bond yields, but there was a modest bias toward a quick rise in yields at some point in the next year after these jumps in the money supply.

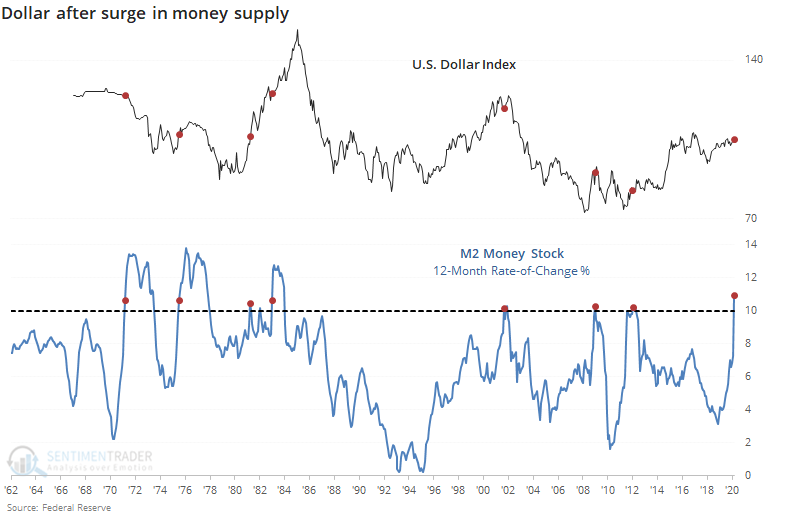
For the U.S. dollar, it's difficult to see any consistent bias.
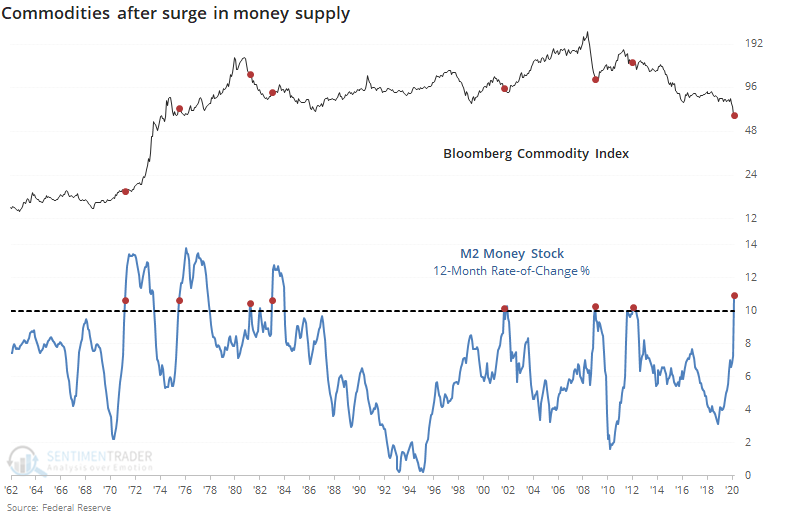
The same goes for the broader commodity market. There was mostly a positive bias to the Bloomberg Commodity Index after these signals, but in the early 1980s and again in 2012, commodities slid in the months ahead.
There are a lot of erudite suppositions out there about what this growth in money supply is going to mean, and they're worth considering. It's also worth considering that we have to rely on those opinions and selected historical precedents, because if we just rely on the data alone, then we can maybe say that inflation usually fell, while commodities and bond yields usually rose. Other than that, the record was mixed.
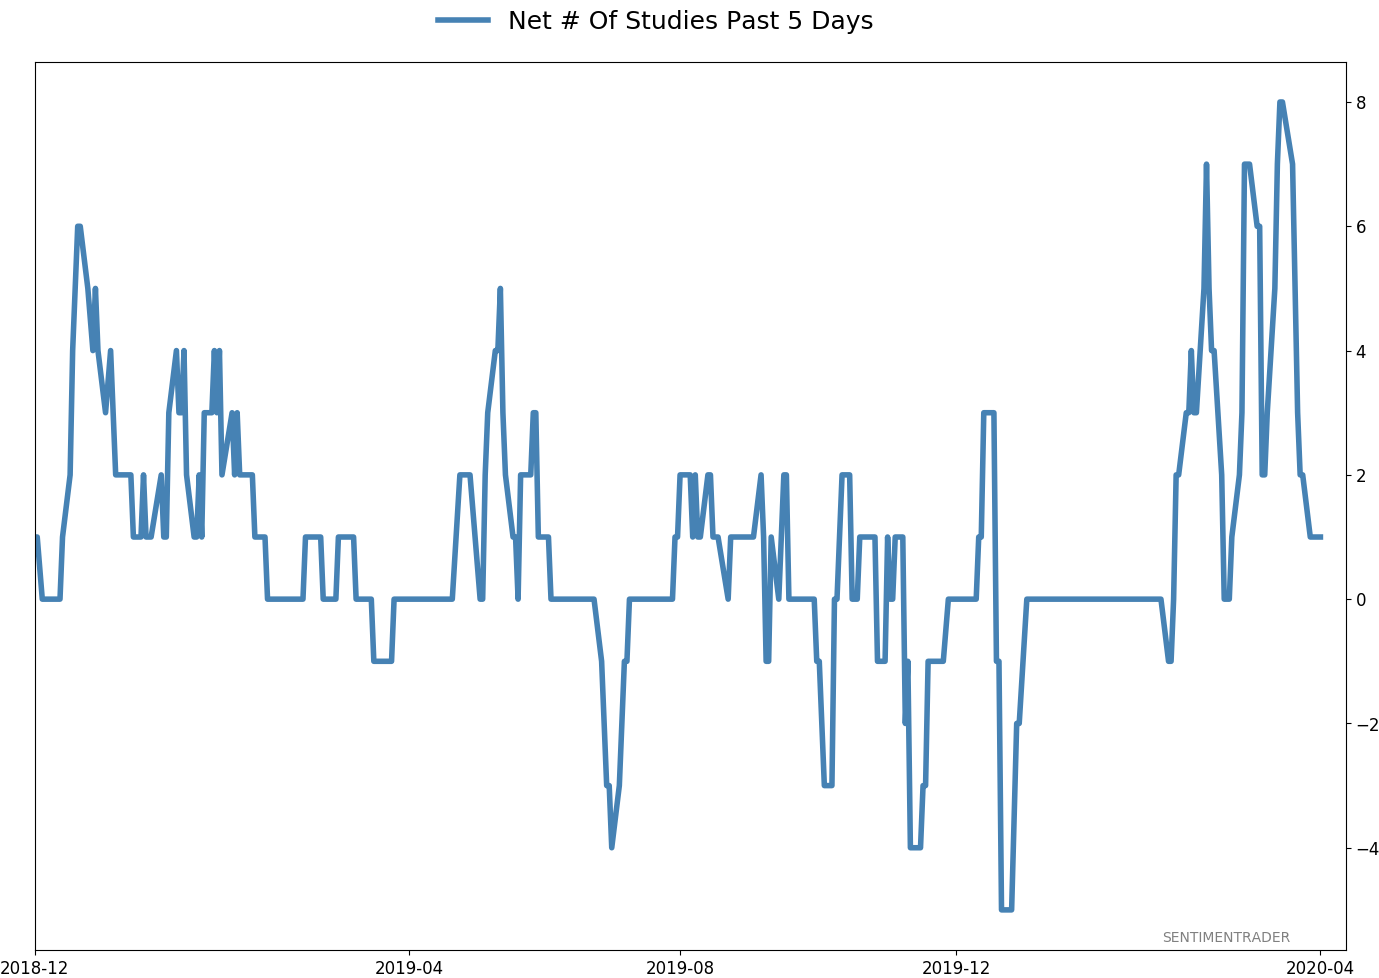
Active Studies
| Time Frame | Bullish | Bearish | | Short-Term | 0 | 4 | | Medium-Term | 11 | 0 | | Long-Term | 34 | 3 |
|
Indicators at Extremes
Portfolio
| Position | Weight % | Added / Reduced | Date | | Stocks | 49.9 | Reduced 10.3% | 2020-04-23 | | Bonds | 0.0 | Reduced 6.7% | 2020-02-28 | | Commodities | 5.1 | Added 2.4%
| 2020-02-28 | | Precious Metals | 0.0 | Reduced 3.6% | 2020-02-28 | | Special Situations | 0.0 | Reduced 31.9% | 2020-03-17 | | Cash | 45.0 | | |
|
Updates (Changes made today are underlined)
In the first months of the year, we saw manic trading activity. From big jumps in specific stocks to historic highs in retail trading activity to record highs in household confidence to almost unbelievable confidence among options traders. All of that came amid a market where the average stock couldn't keep up with their indexes. There were signs of waning momentum in stocks underlying the major averages, which started triggering technical warning signs in late January. The kinds of extremes we saw in December and January typically take months to wear away, but the type of selling in March went a long way toward getting there. When we place the kind of moves we saw into March 23 into the context of coming off an all-time high, there has been a high probability of a multi-month rebound. After stocks bottomed on the 23rd, they enjoyed a historic buying thrust and retraced a larger amount of the decline than "just a bear market rally" tends to. While other signs are mixed that panic is subsiding, those thrusts are the most encouraging sign we've seen in years. Shorter-term, there have been some warning signs popping up and our studies have stopped showing as positively skewed returns. I reduced my exposure some on Monday and a little more on Thursday and will consider further reducing it if we drop below last week's lows on SPY. Long-term suggestions from the studies remain robust, but shorter-term ones are significantly less so, and stocks still have to prove that we're in something other than a protracted, recessionary bear market.
RETURN YTD: -9.9% 2019: 12.6%, 2018: 0.6%, 2017: 3.8%, 2016: 17.1%, 2015: 9.2%, 2014: 14.5%, 2013: 2.2%, 2012: 10.8%, 2011: 16.5%, 2010: 15.3%, 2009: 23.9%, 2008: 16.2%, 2007: 7.8%
|
|
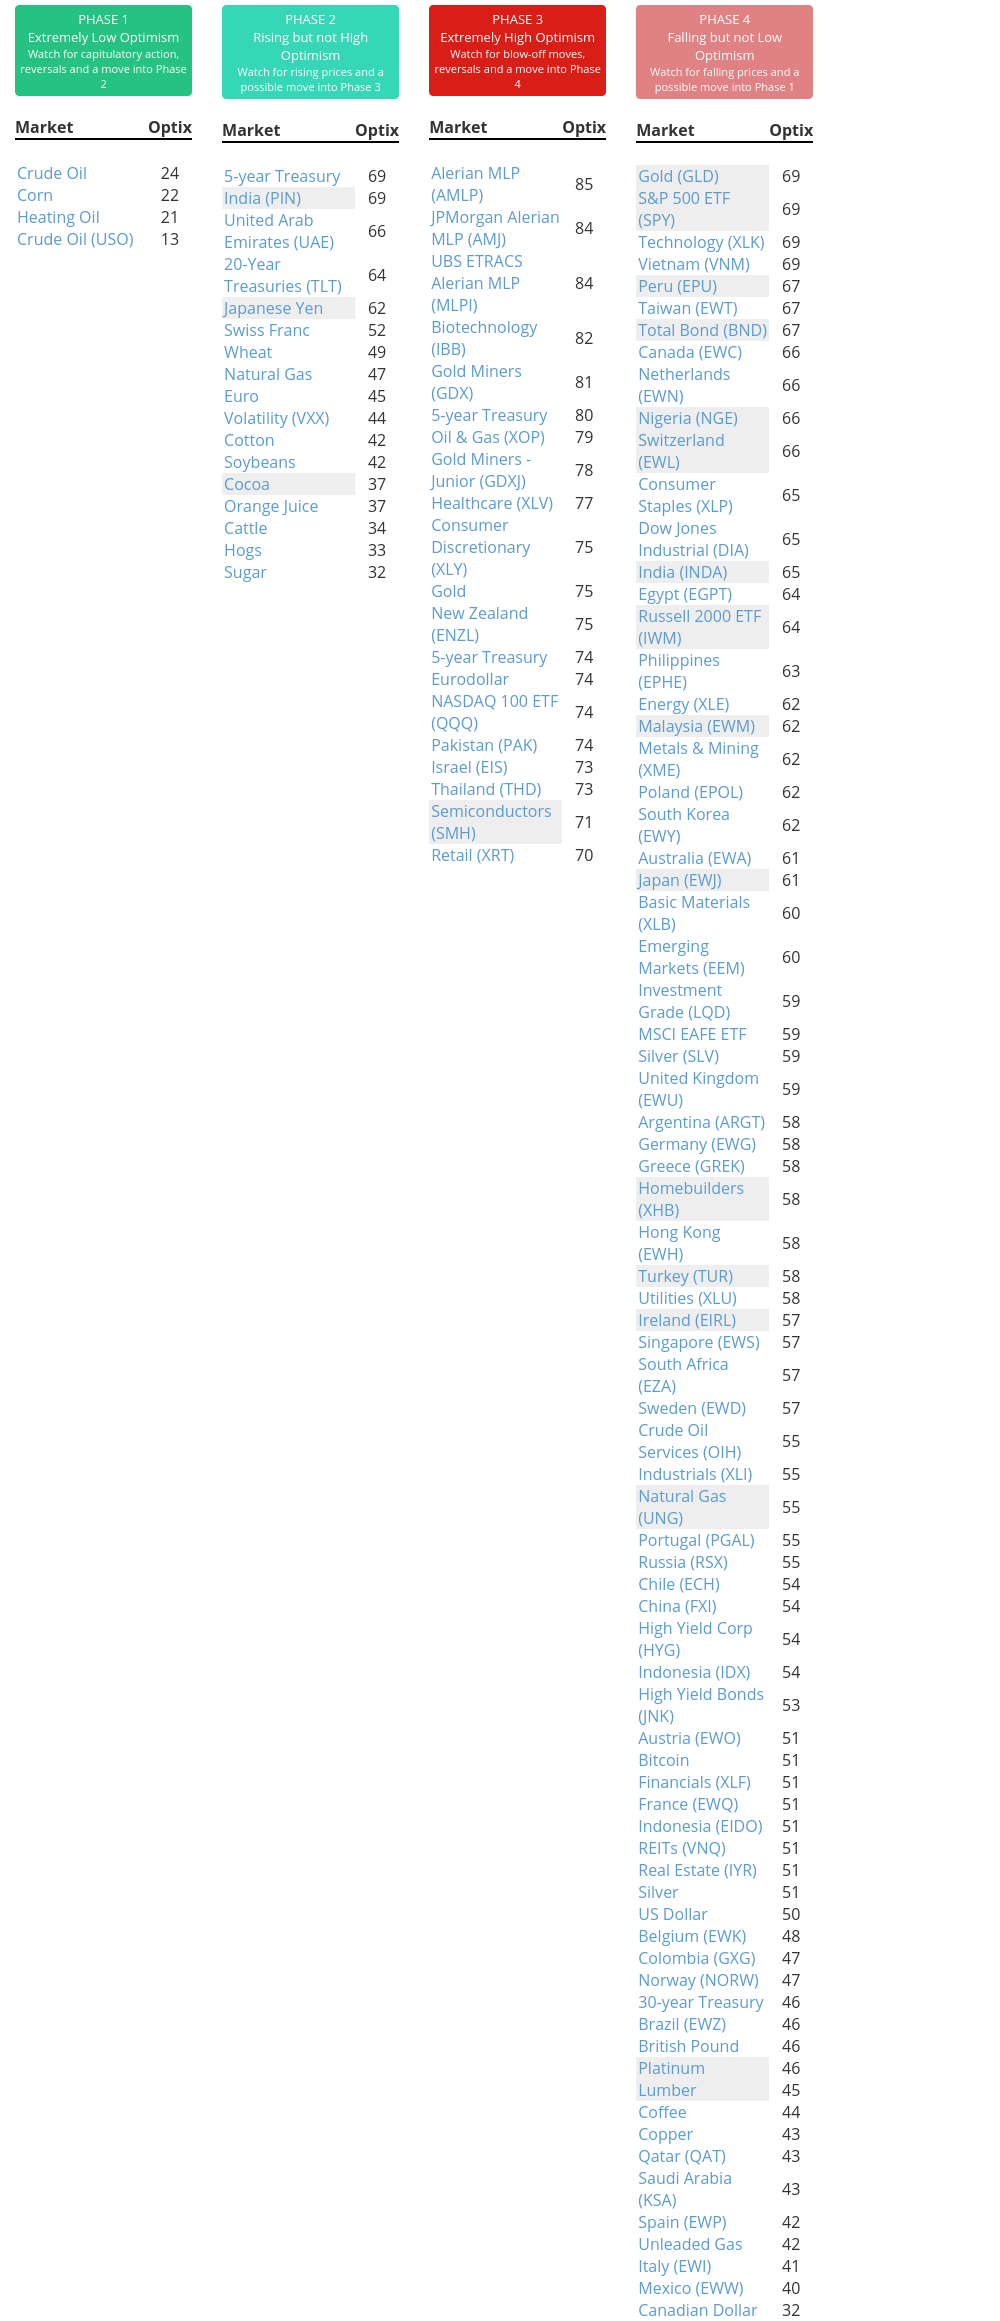
Phase Table
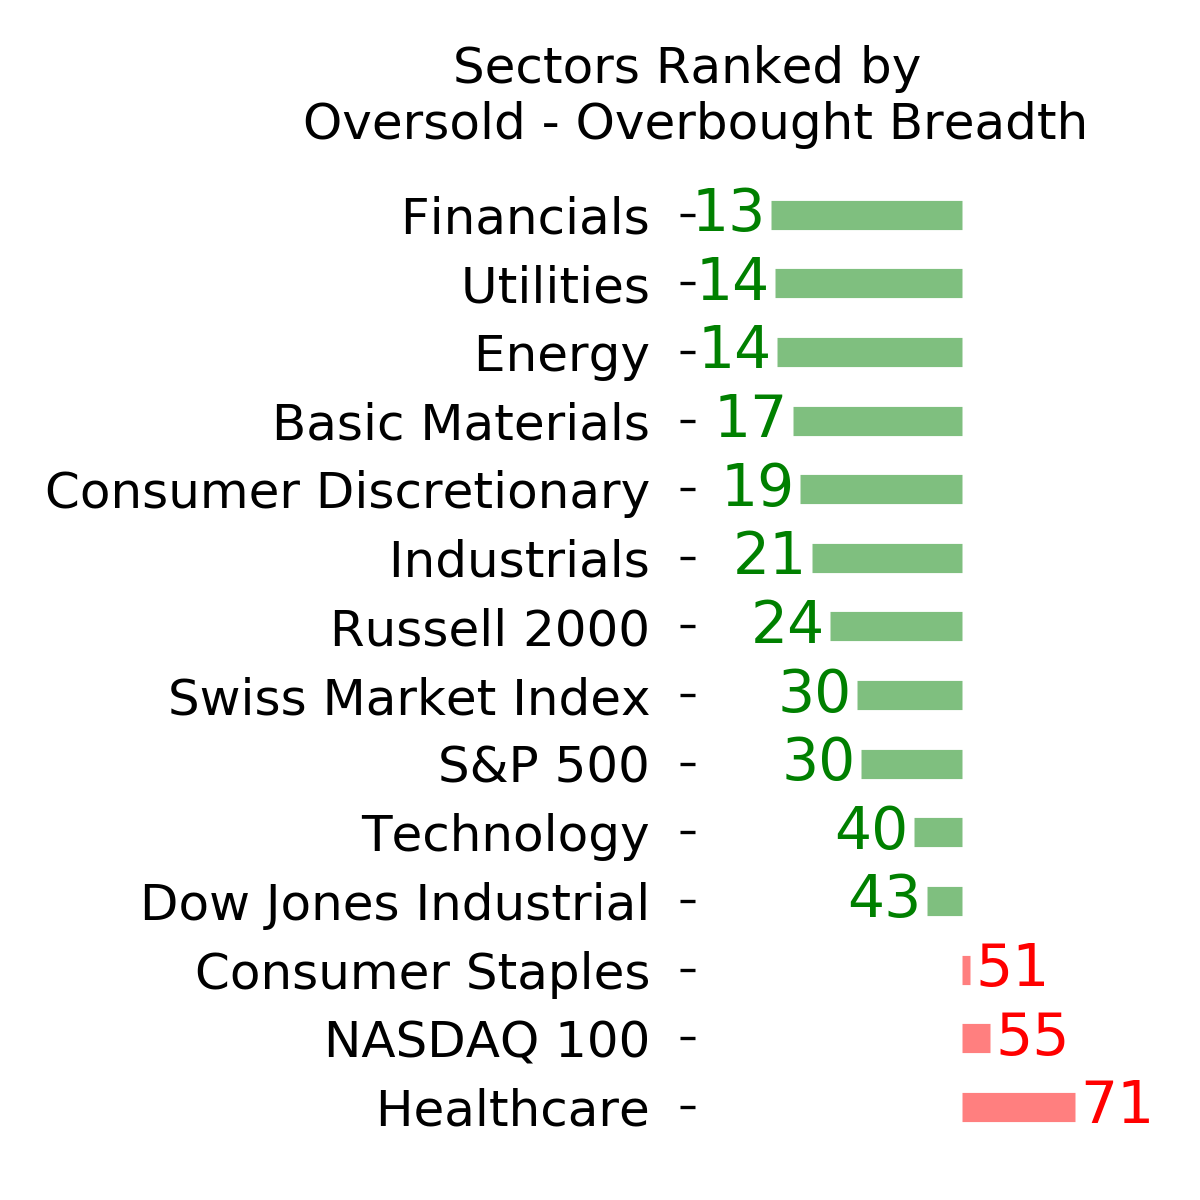
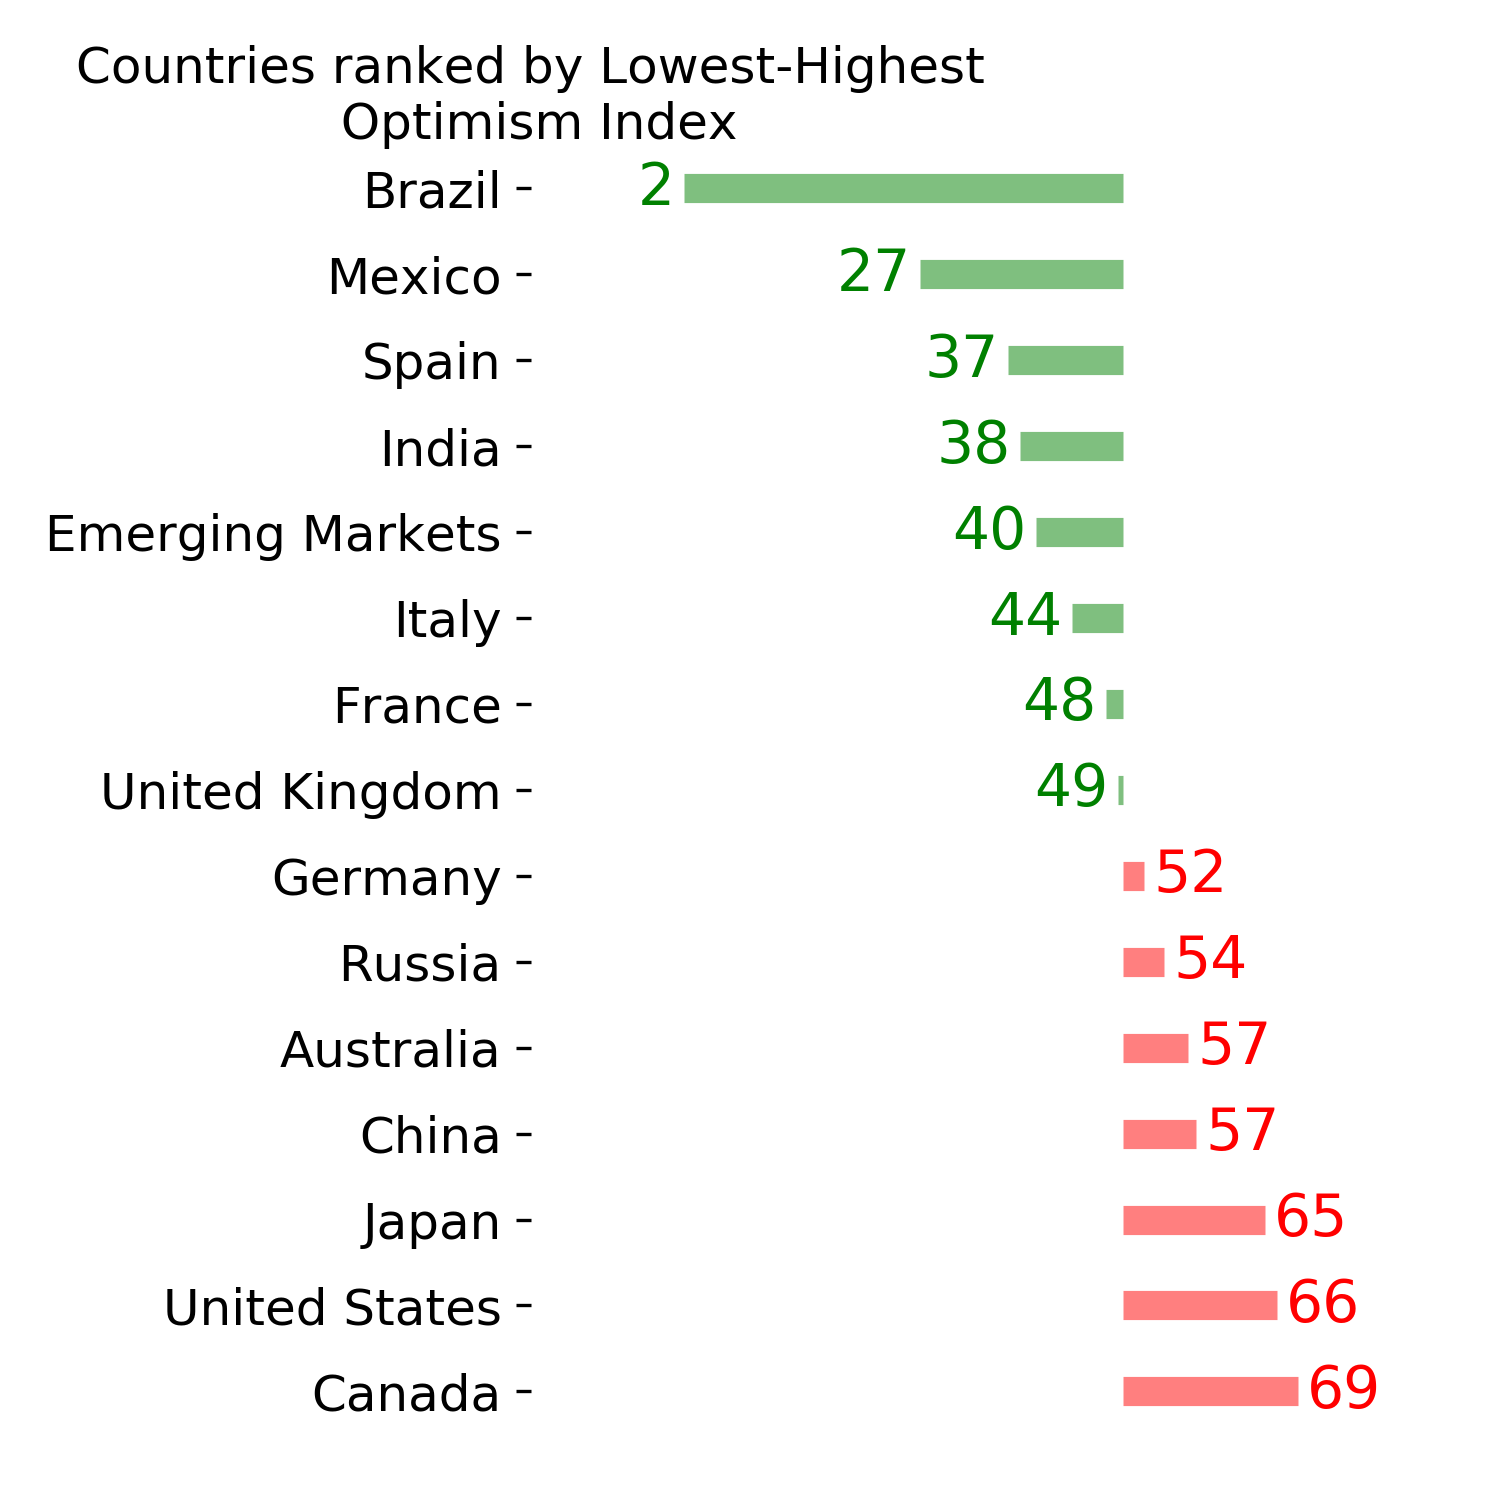
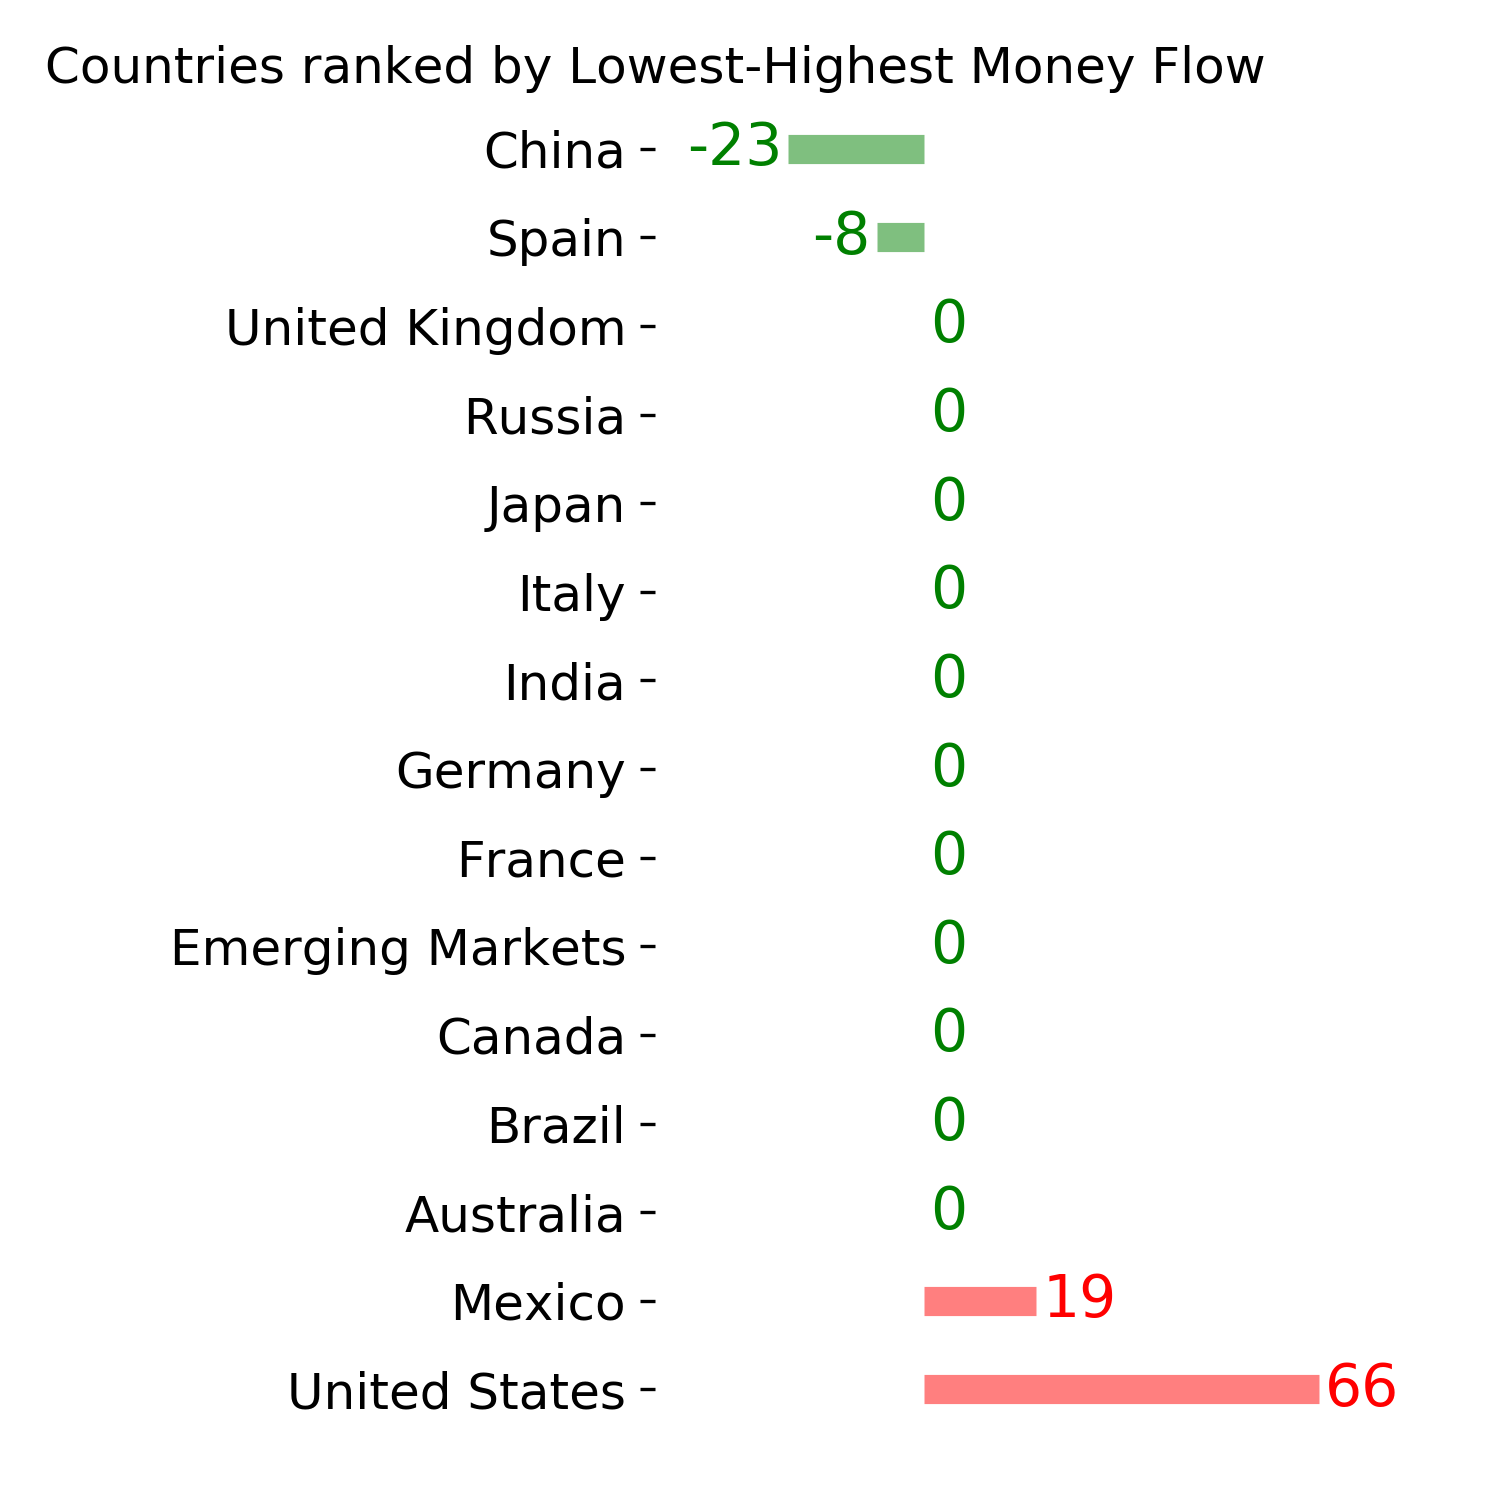
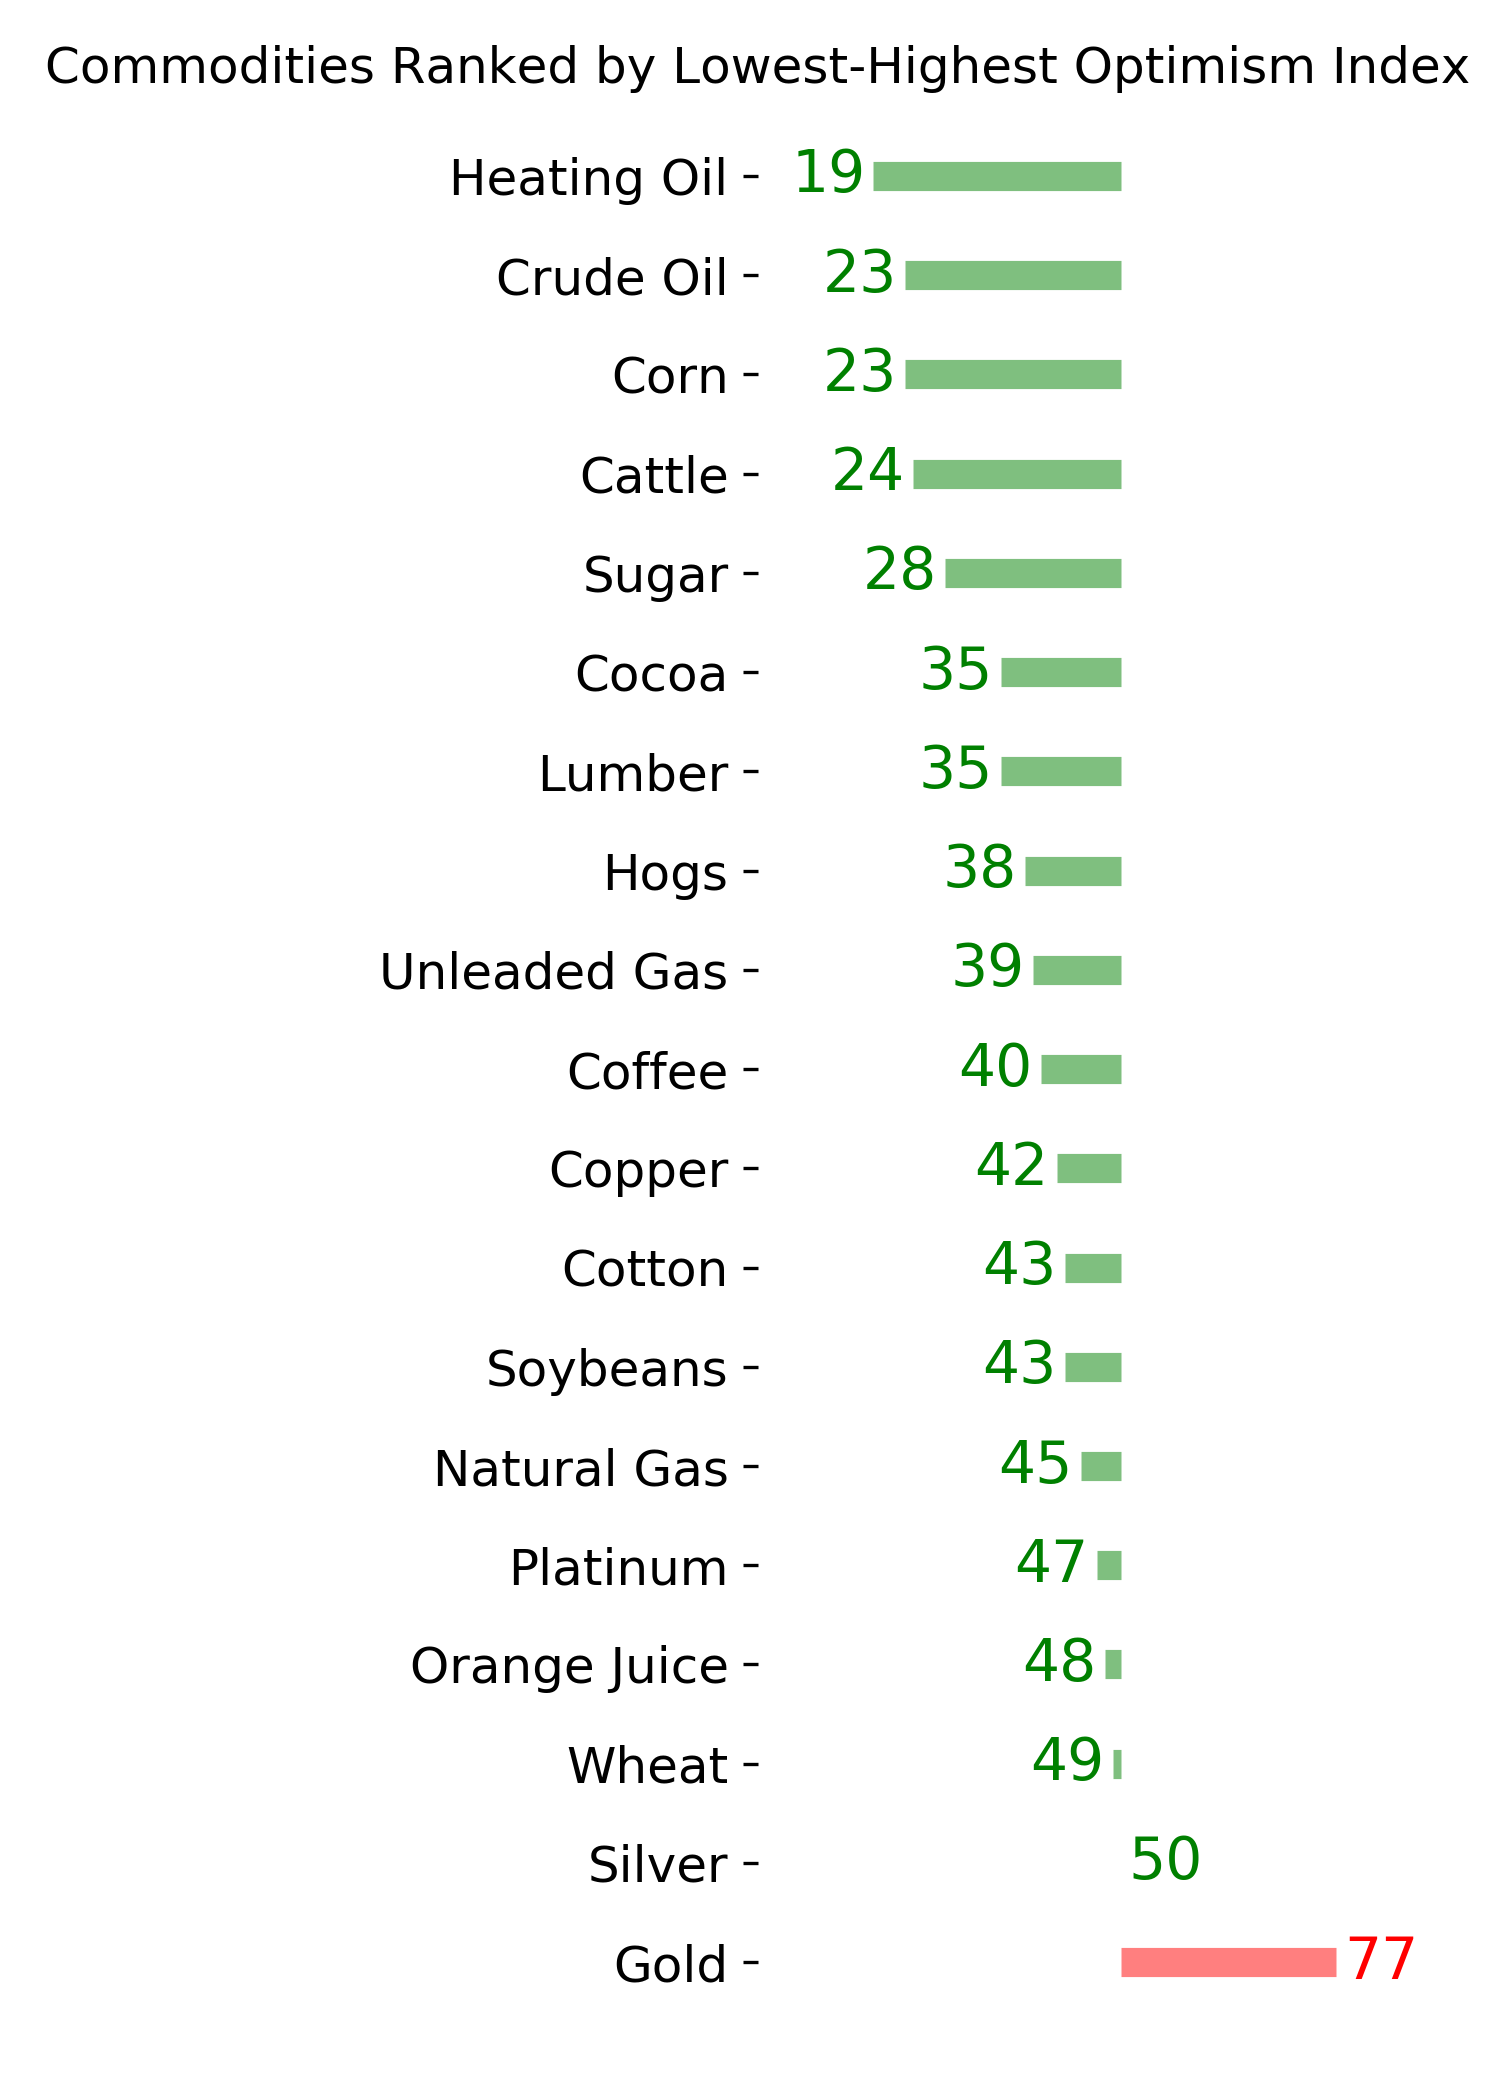
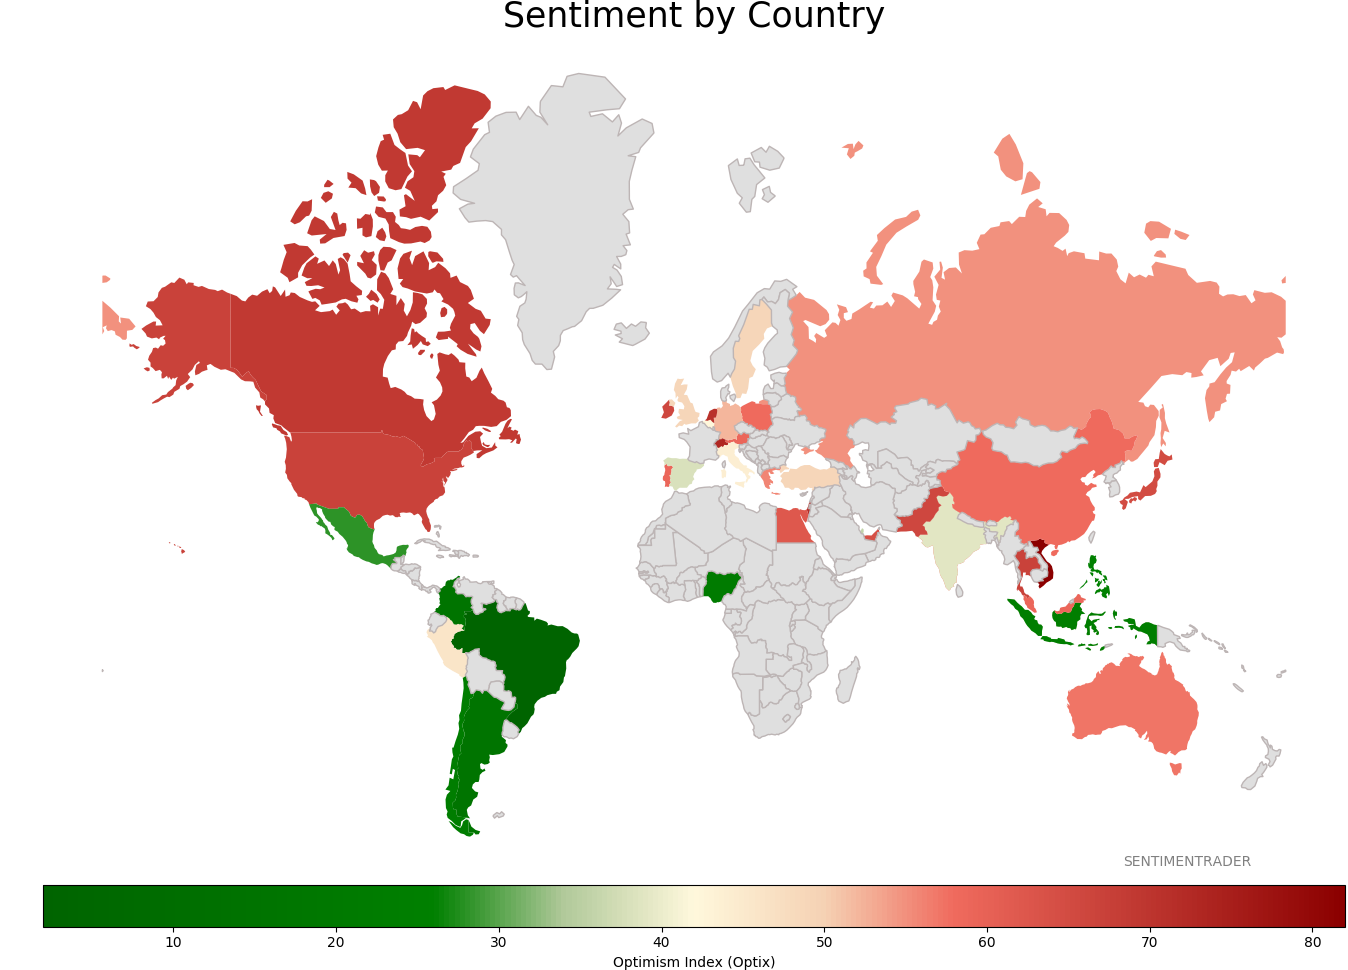
Ranks
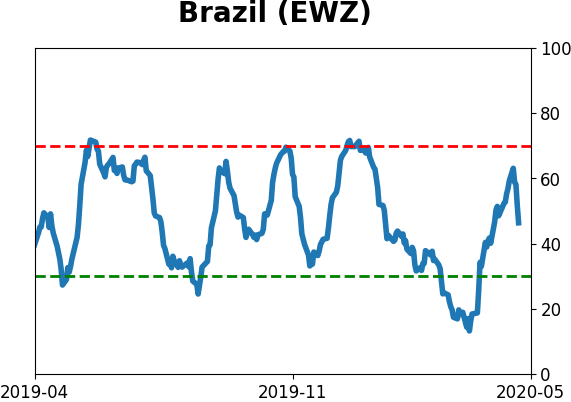
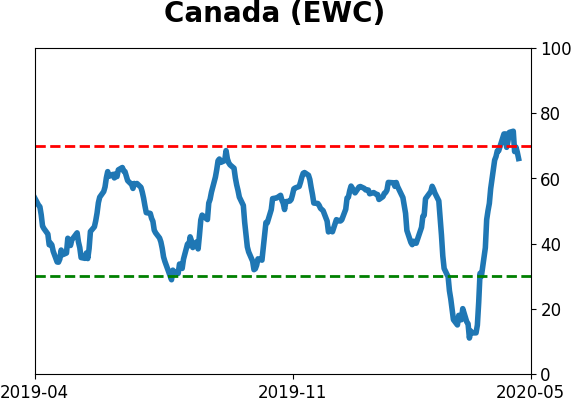
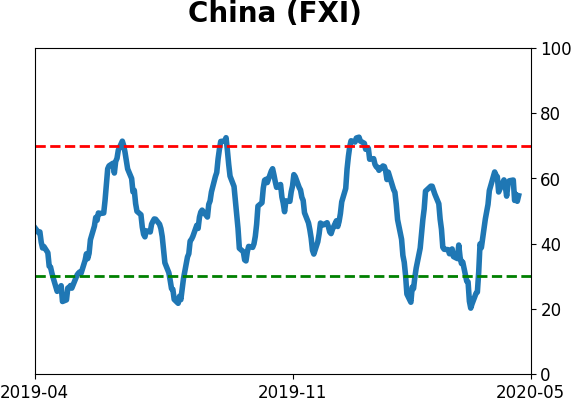
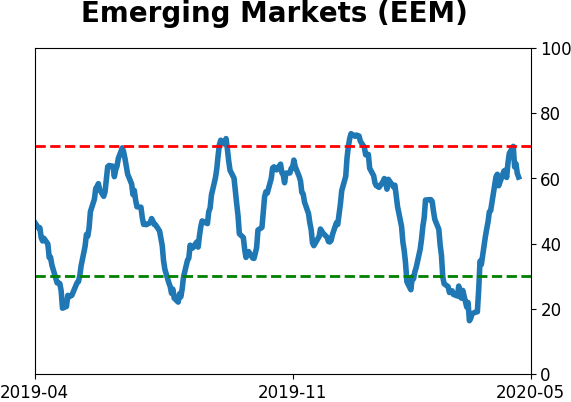
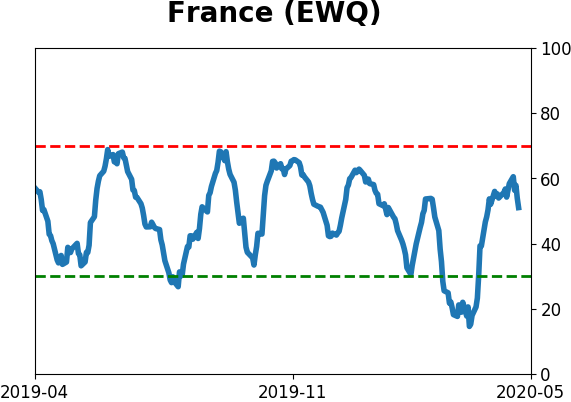
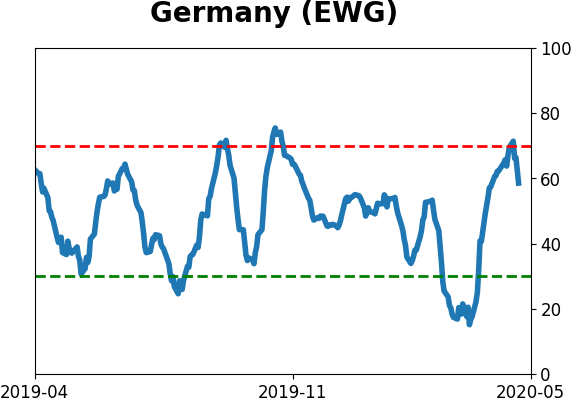
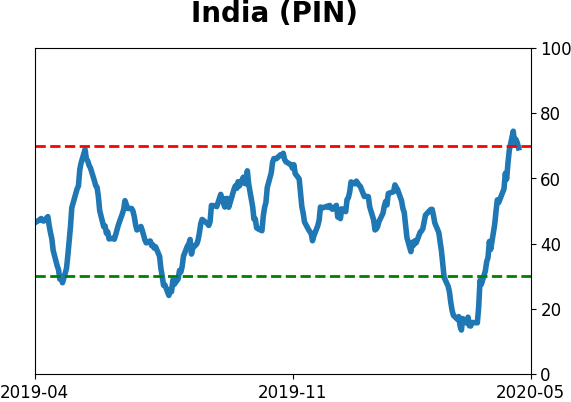
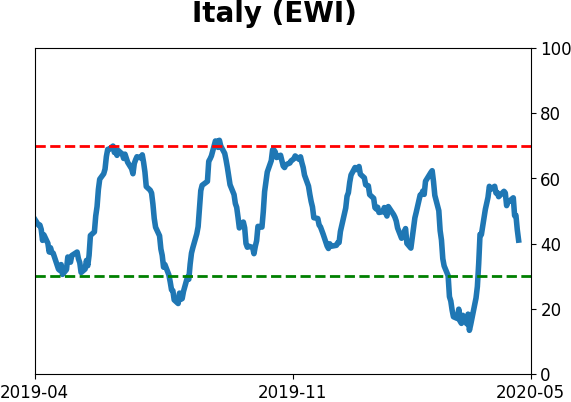
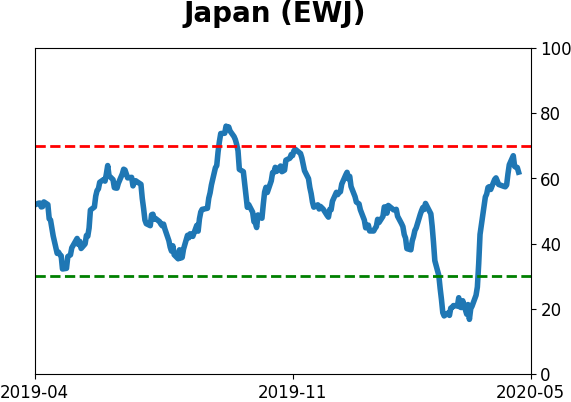
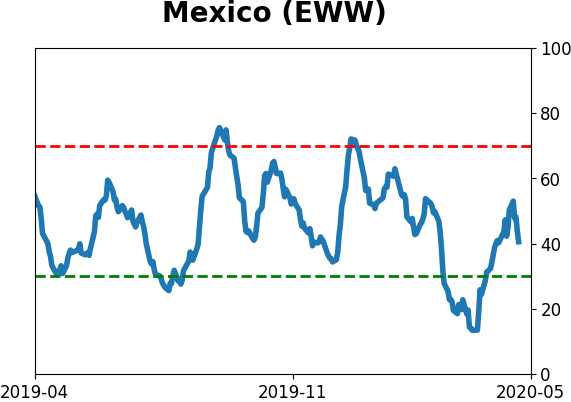
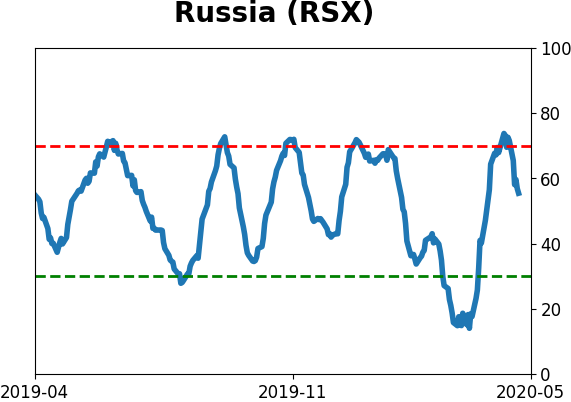
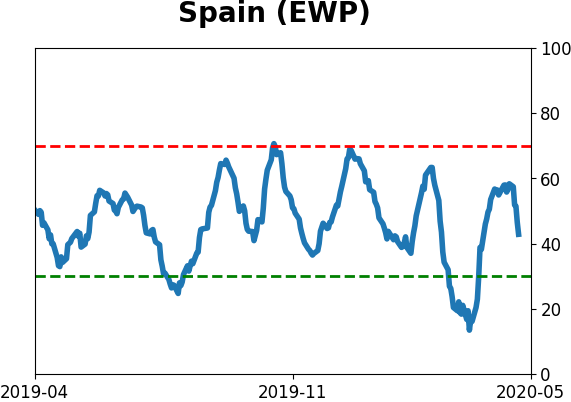
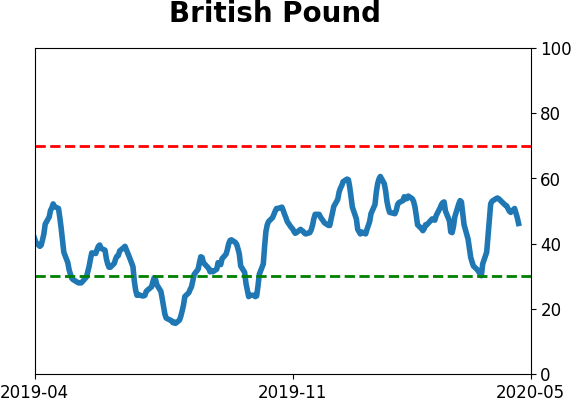
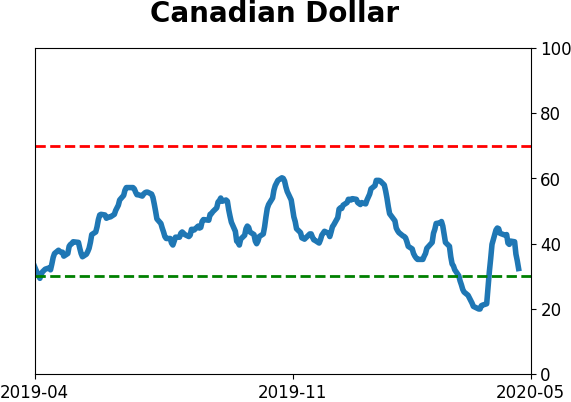
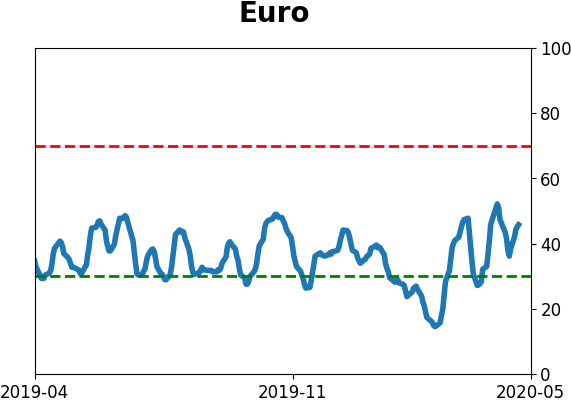
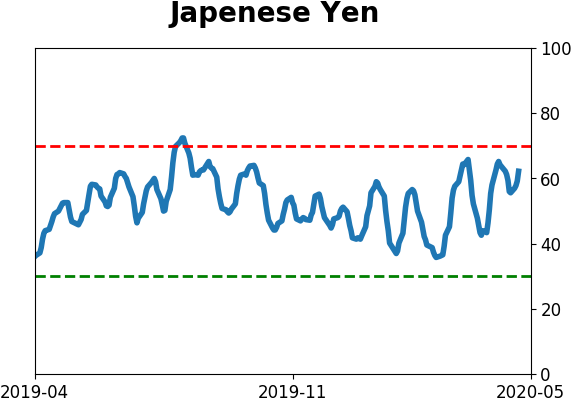
Sentiment Around The World
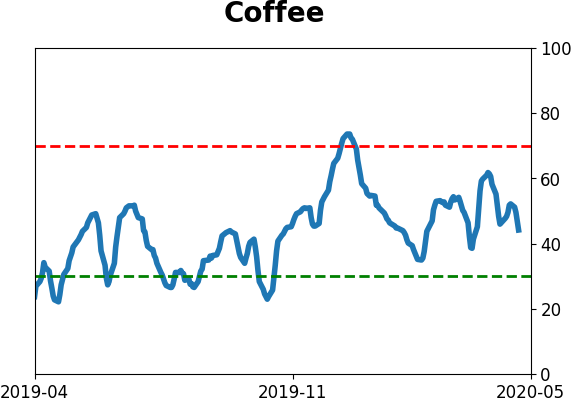
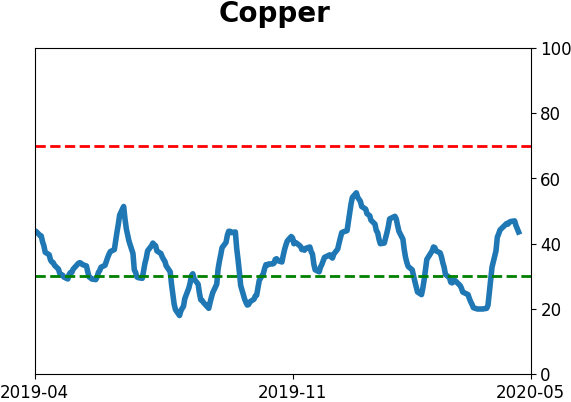
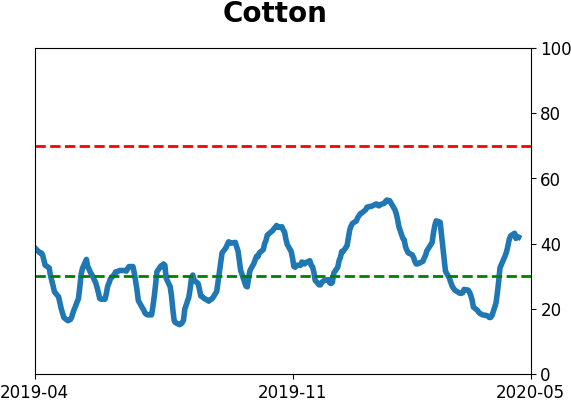
Optimism Index Thumbnails
|
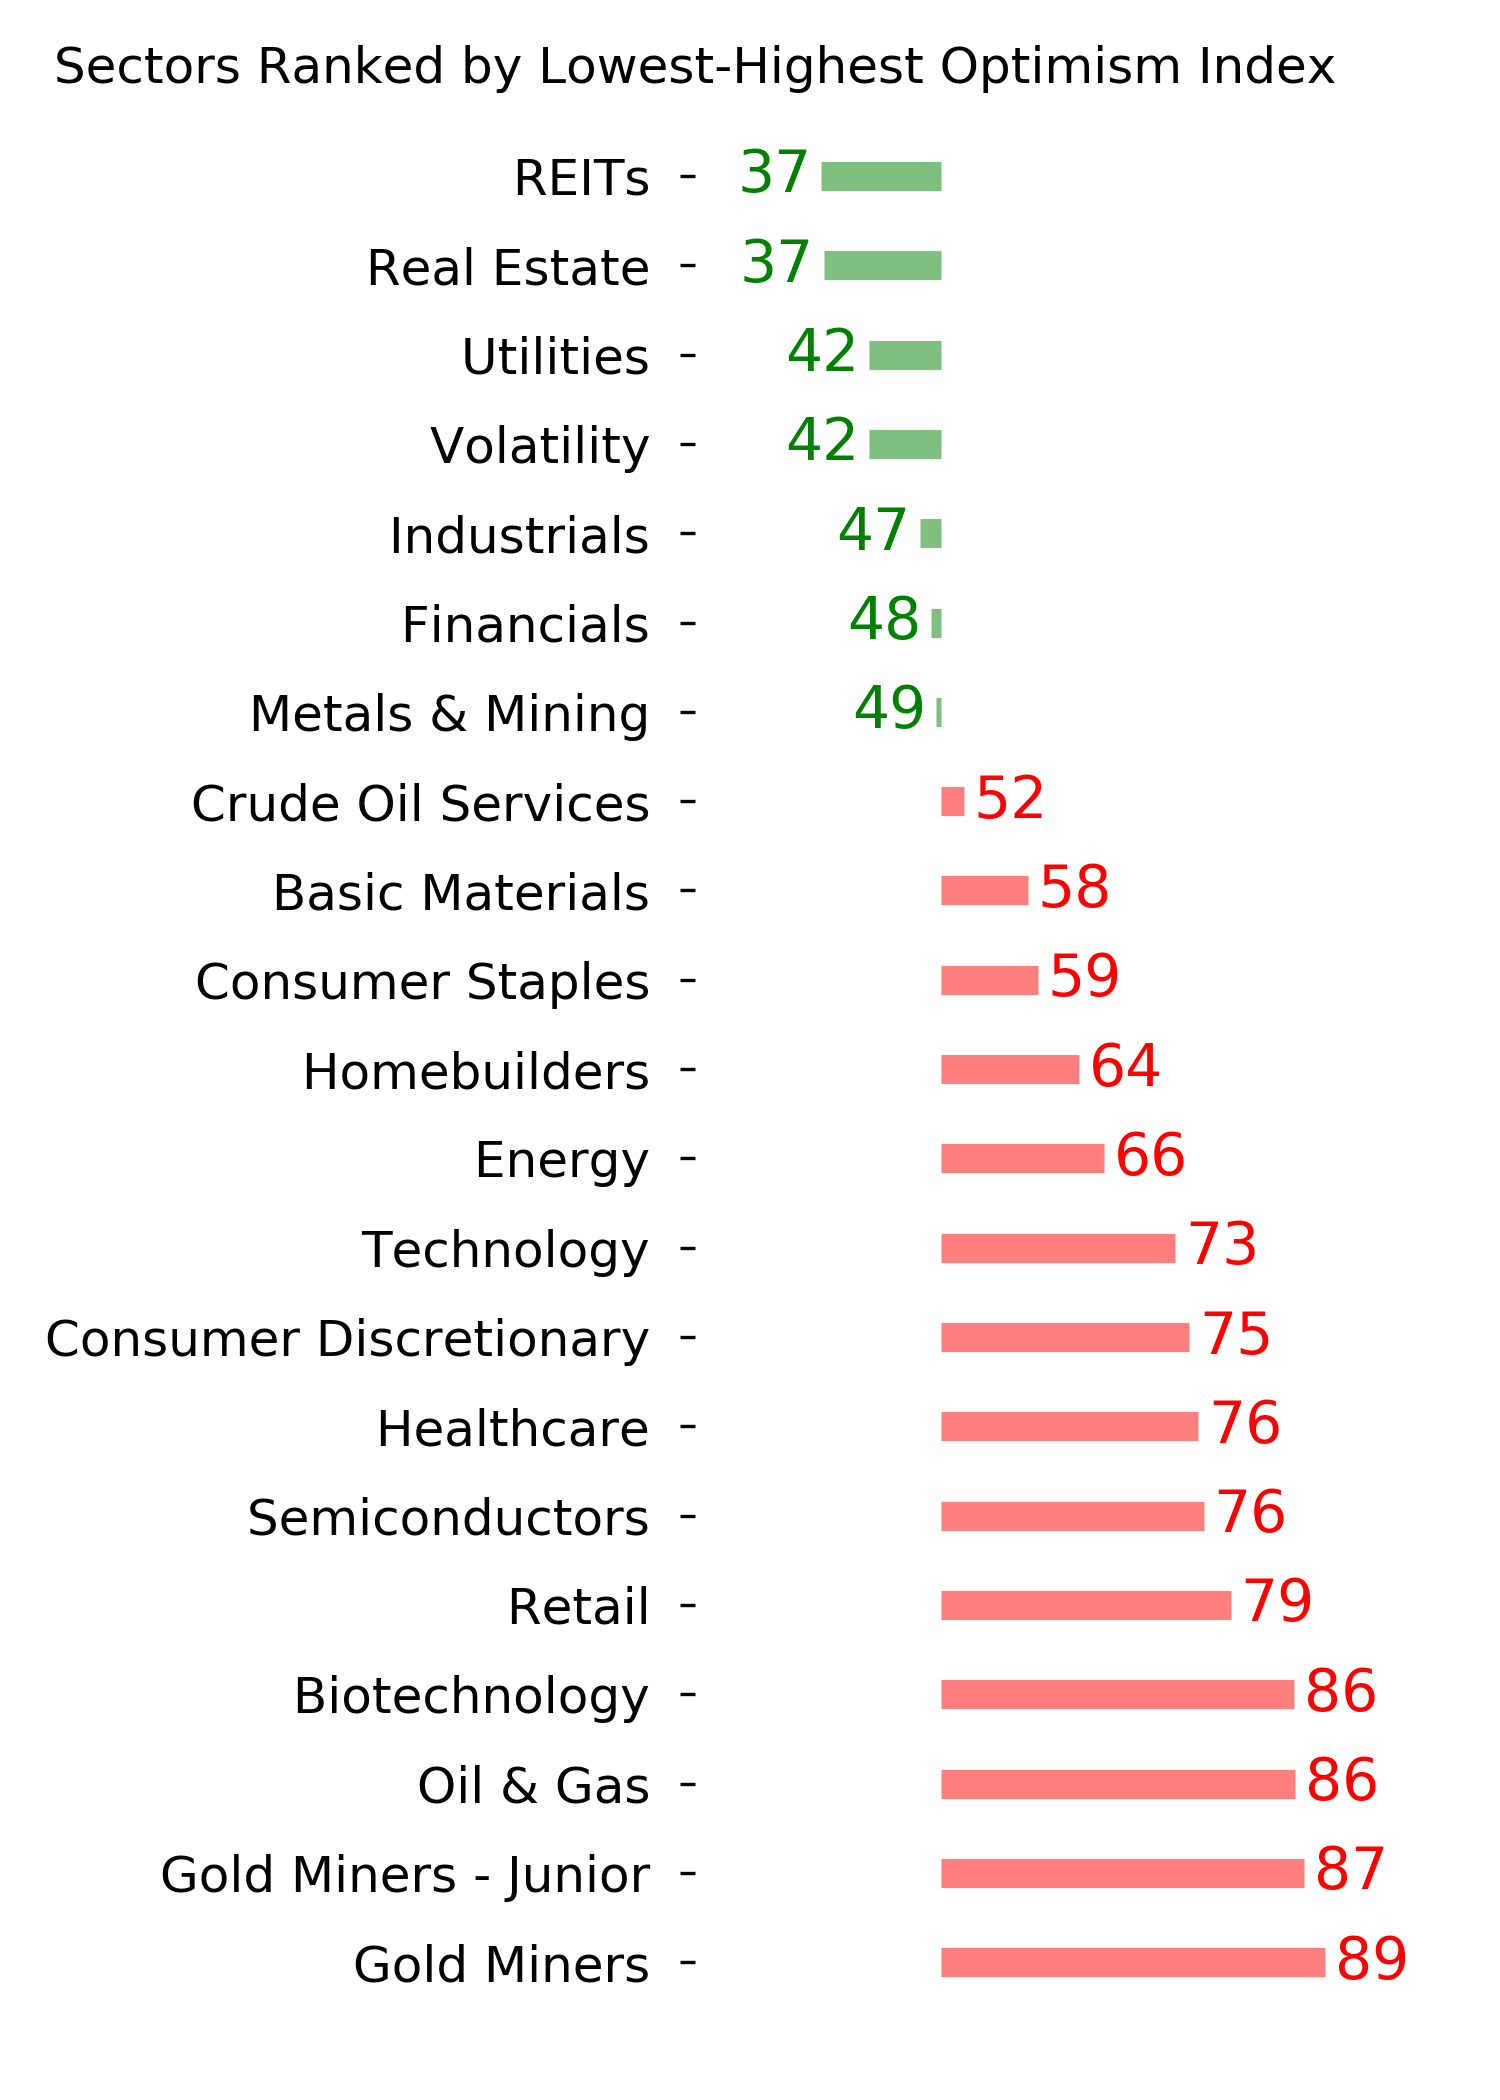
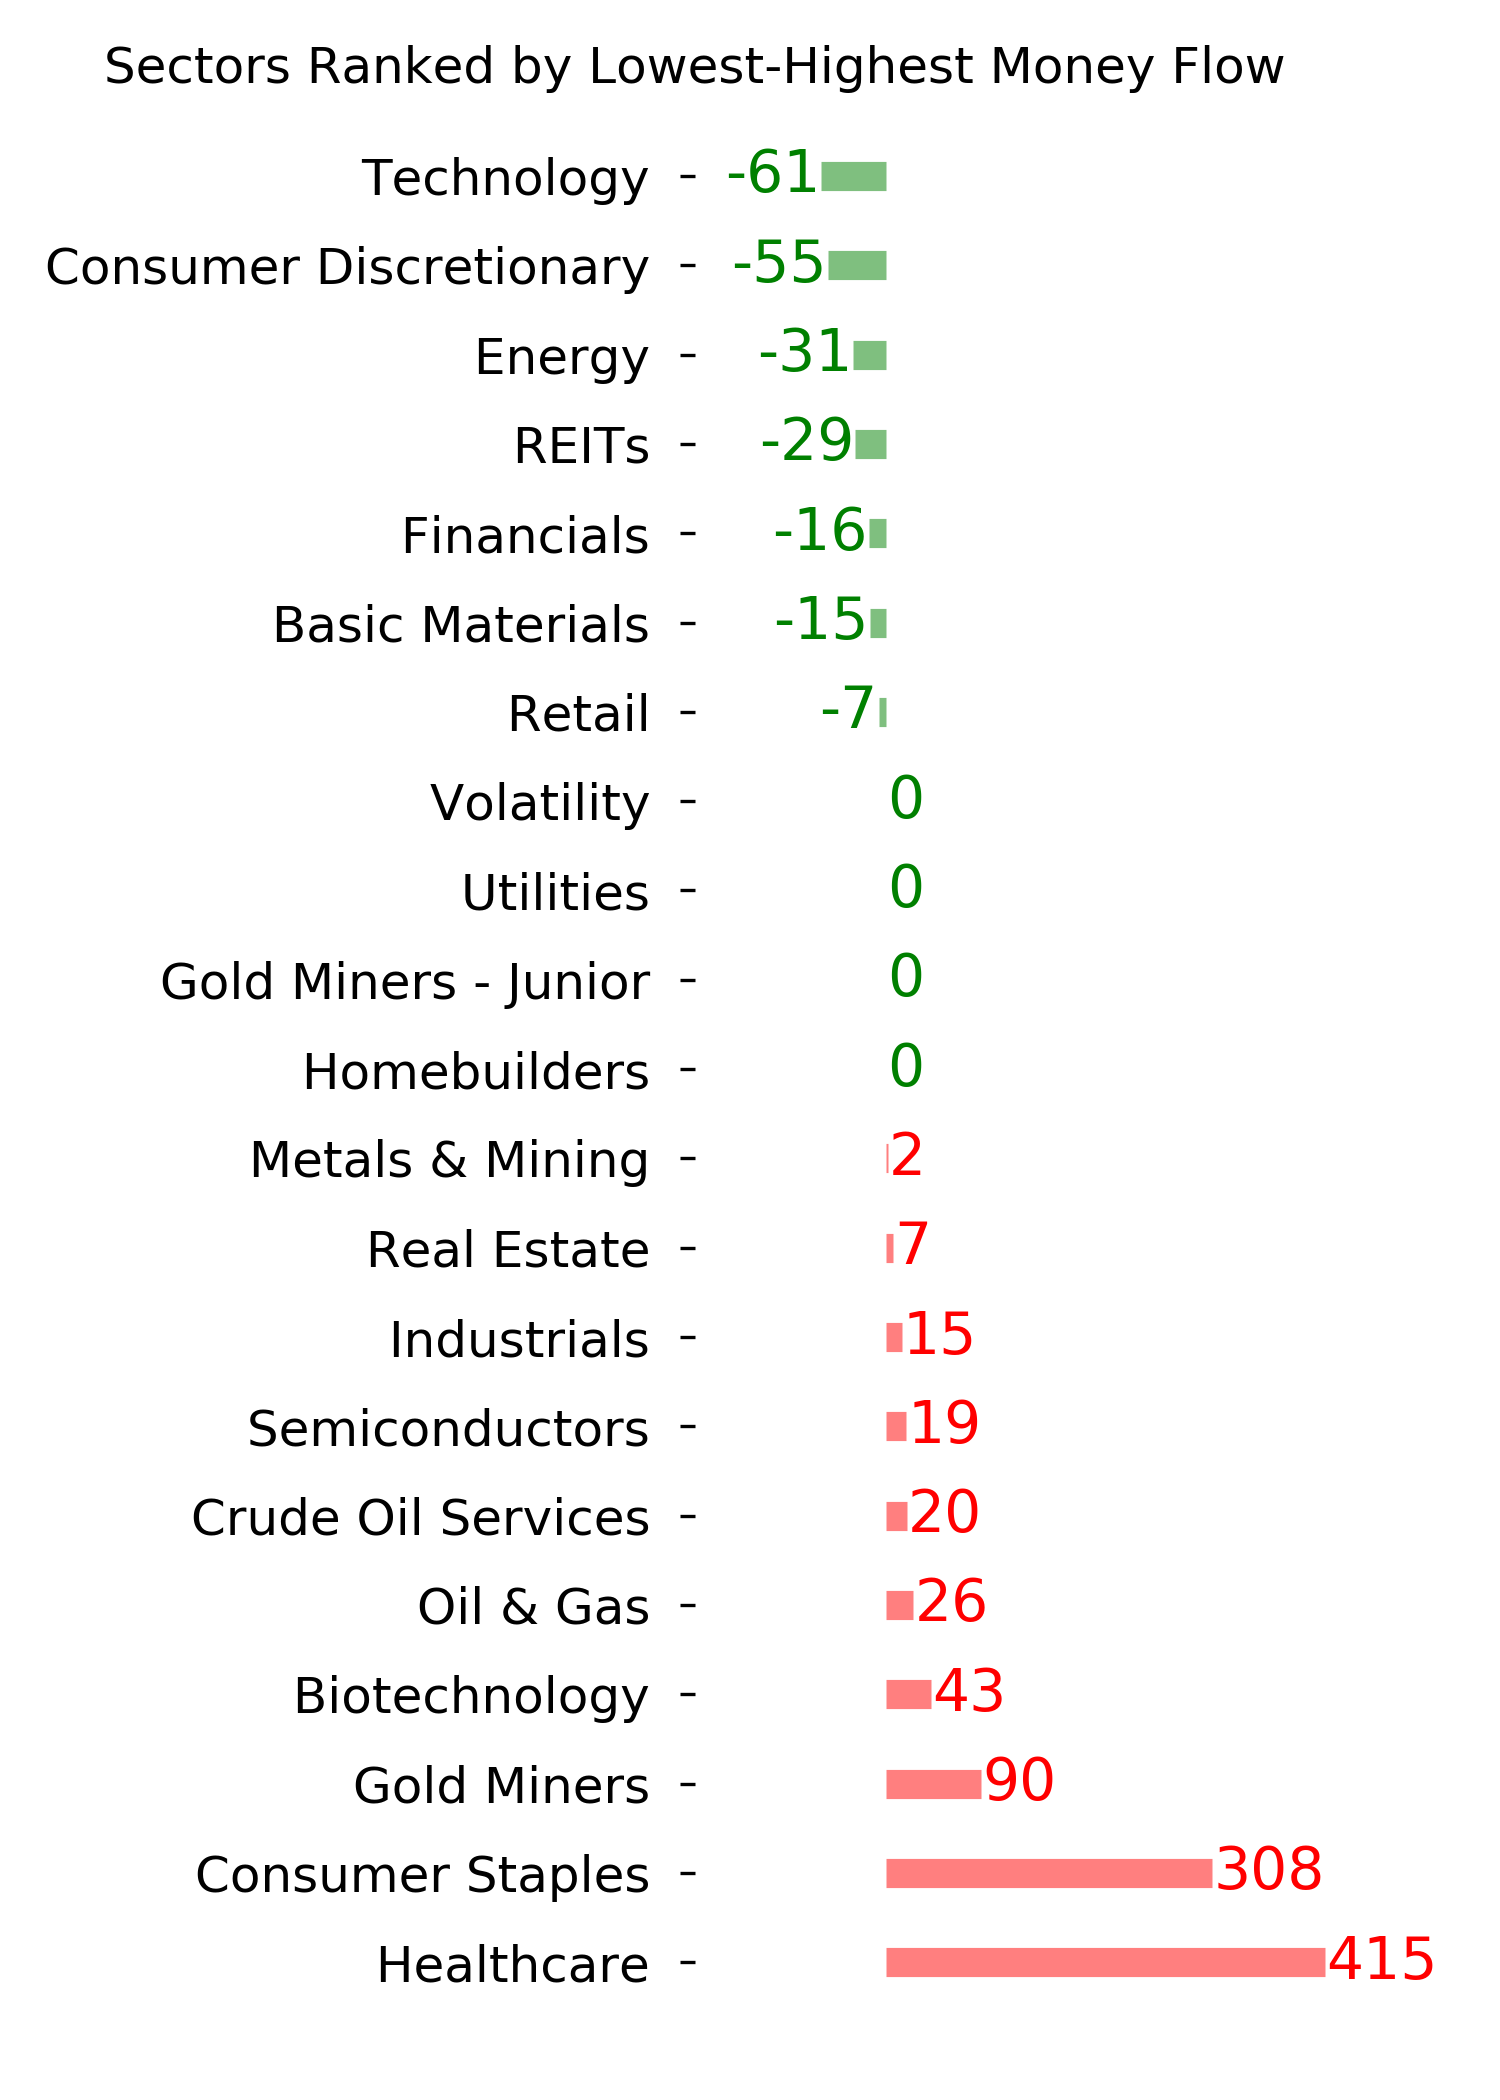
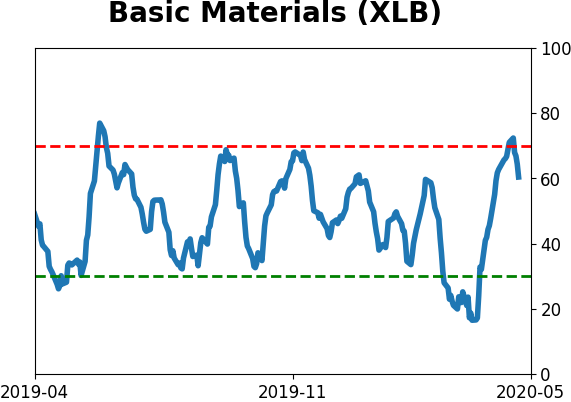
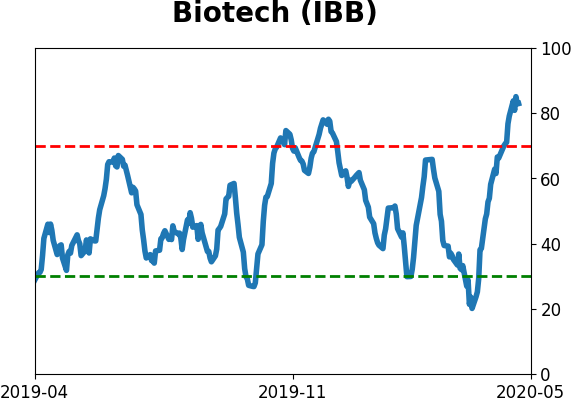
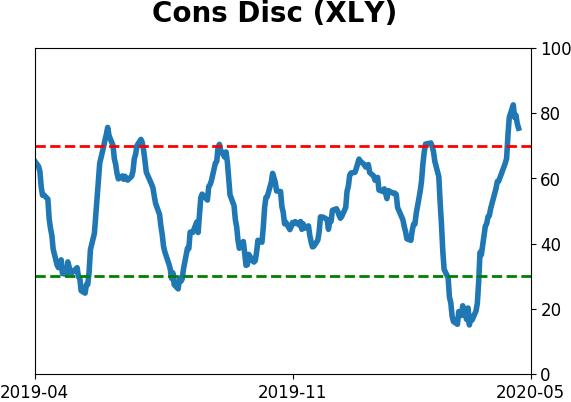
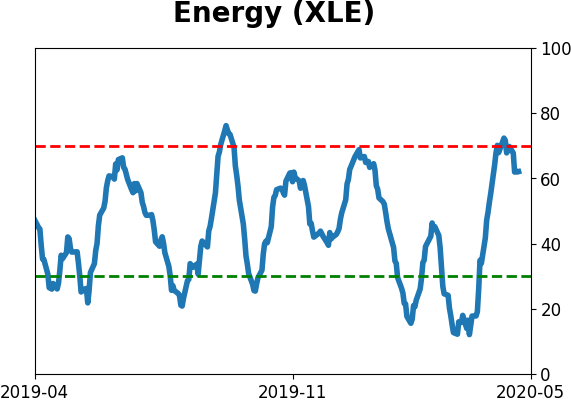
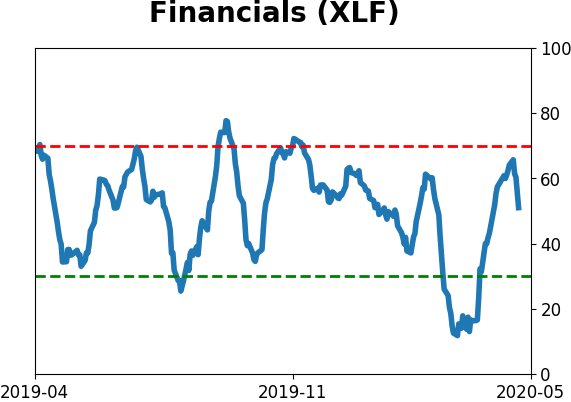
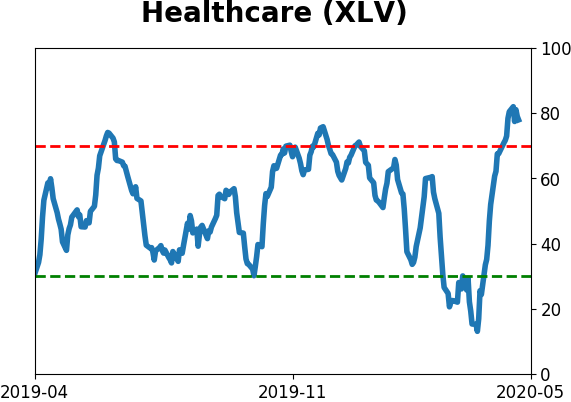
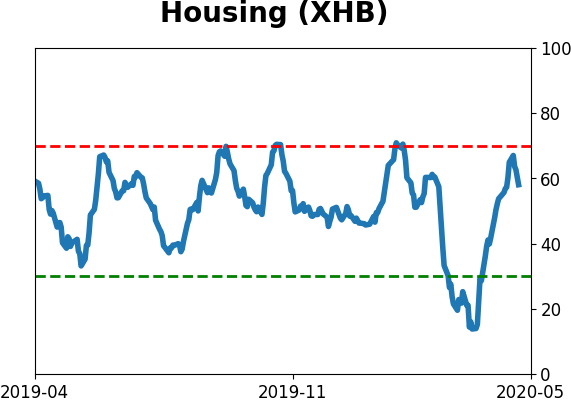
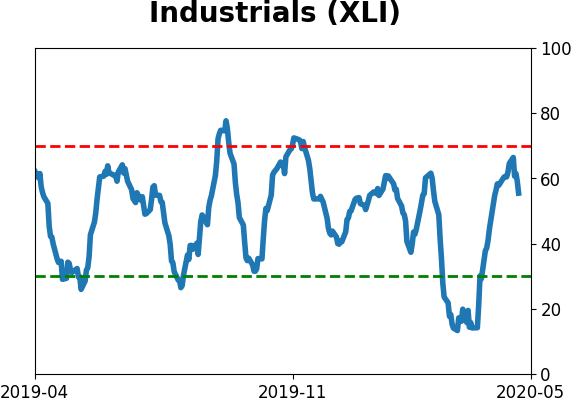
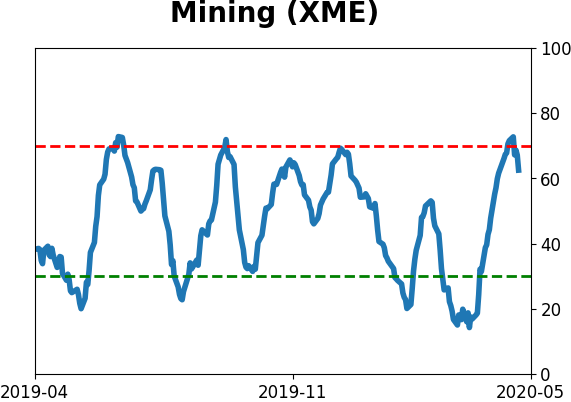
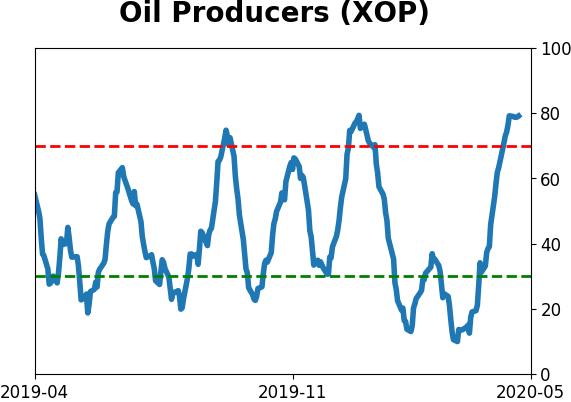
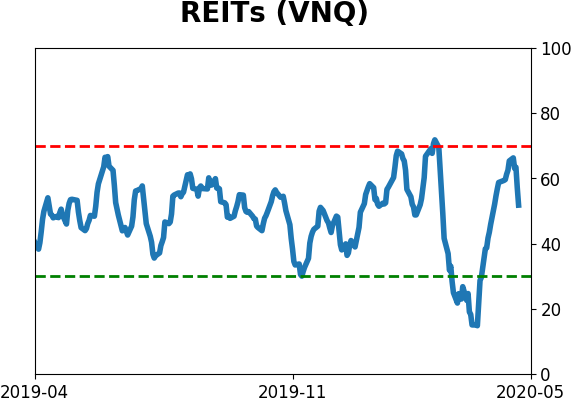
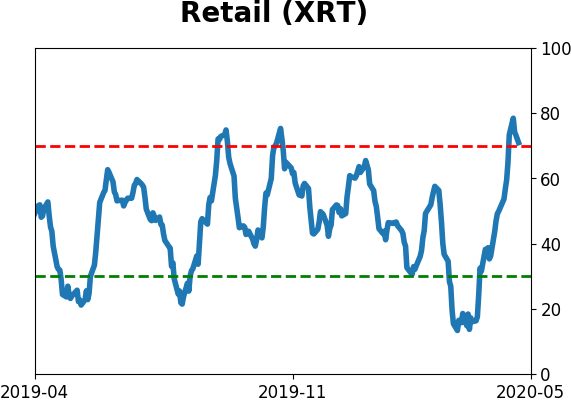
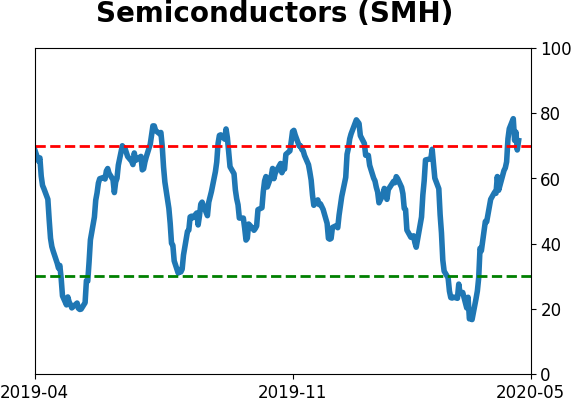
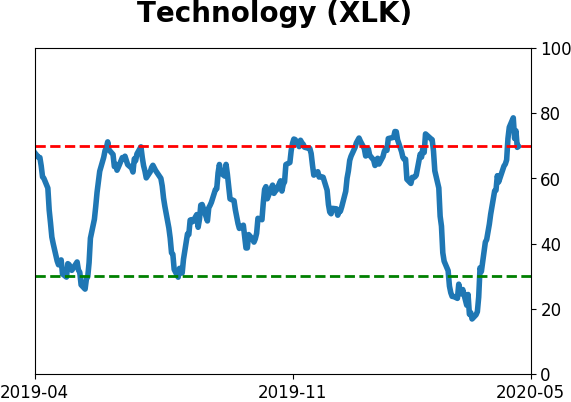
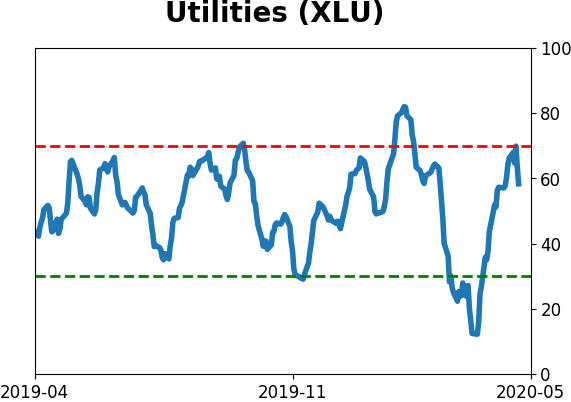
Sector ETF's - 10-Day Moving Average
|
|
|
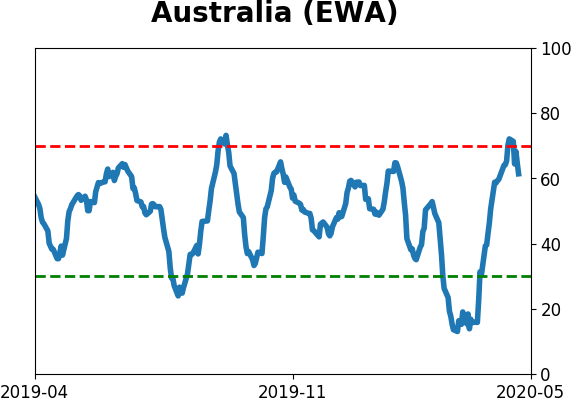
Country ETF's - 10-Day Moving Average
|
|
|
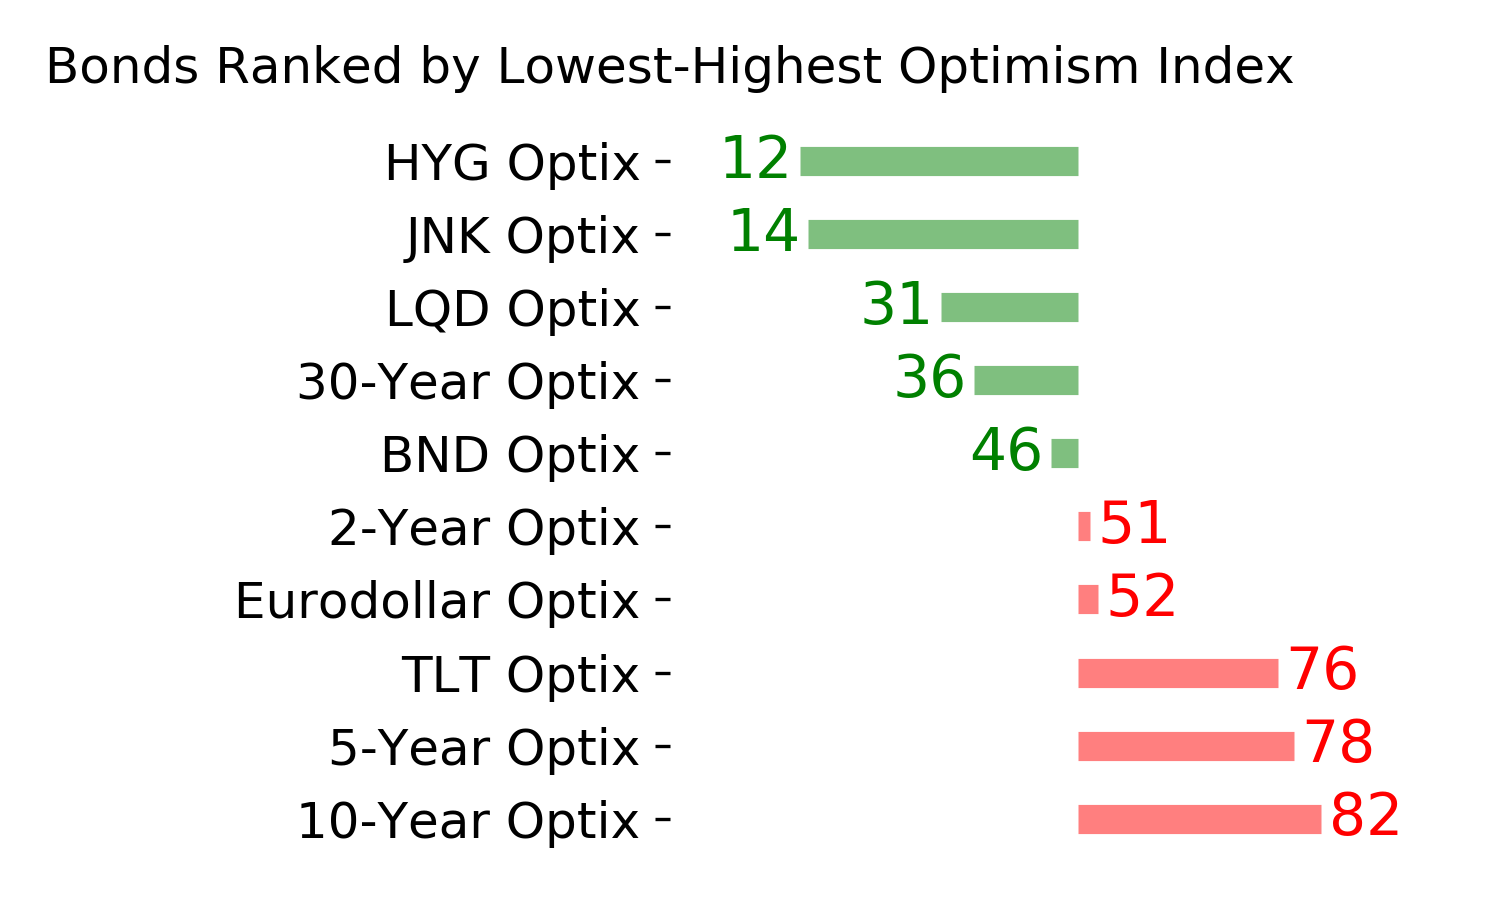
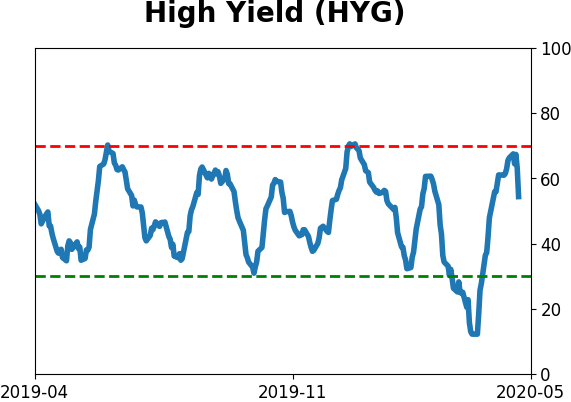
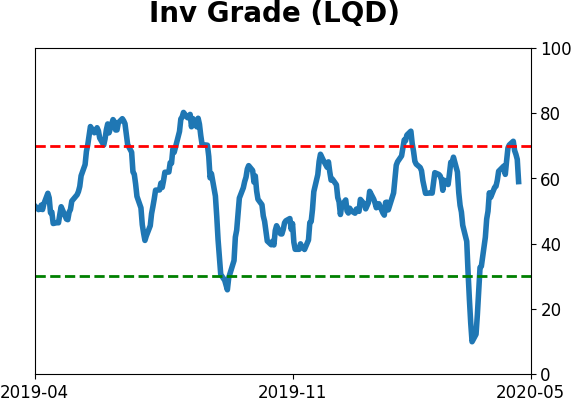
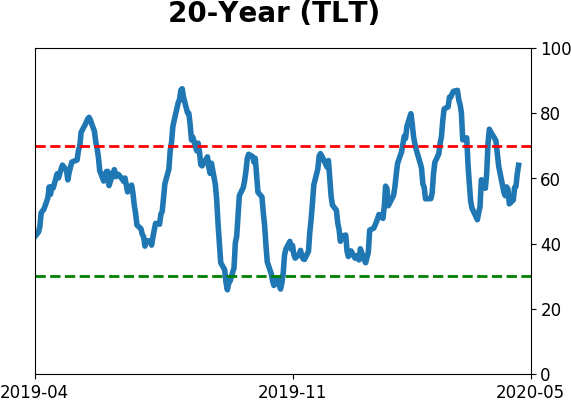
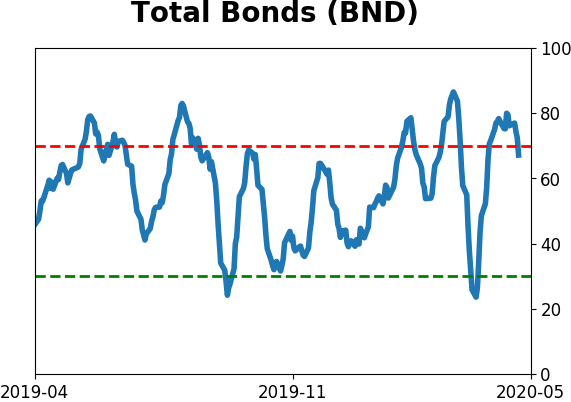
Bond ETF's - 10-Day Moving Average
|
|
|
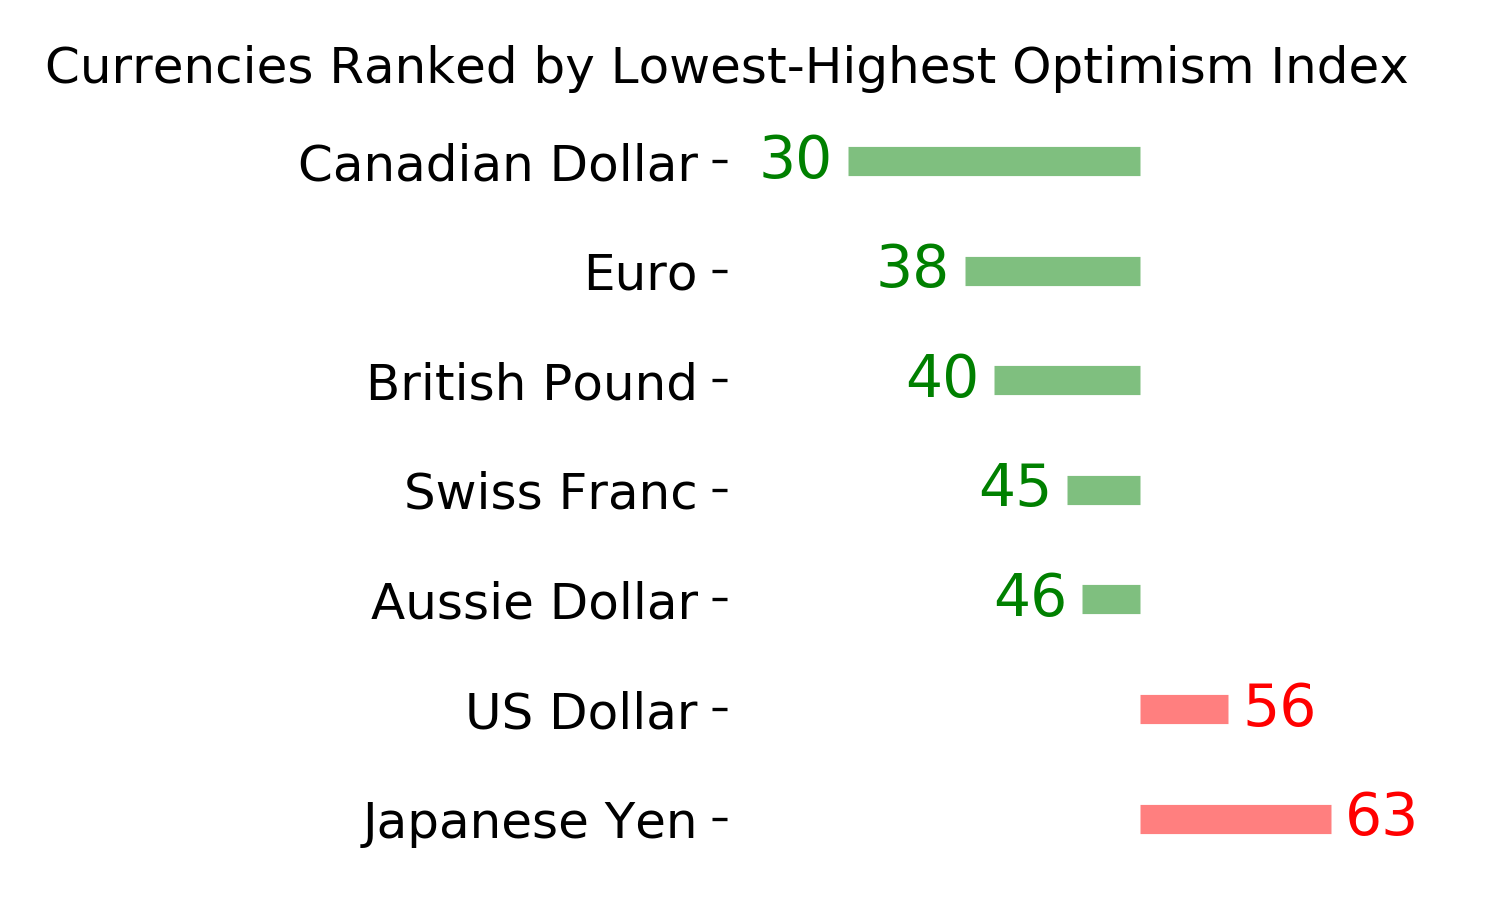
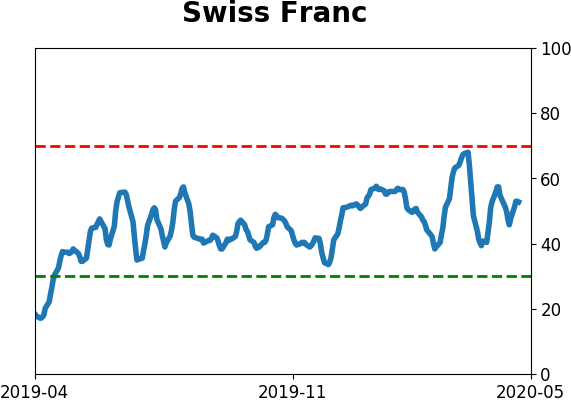
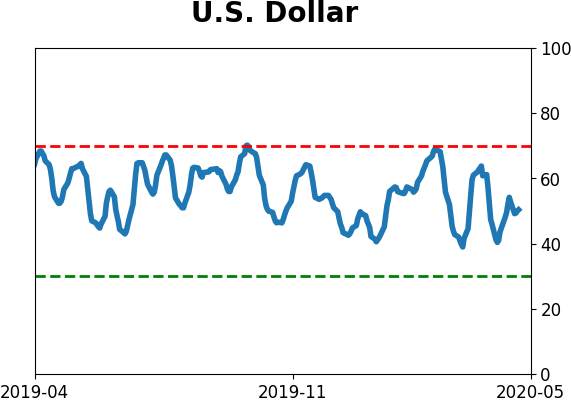
Currency ETF's - 5-Day Moving Average
|
|
|
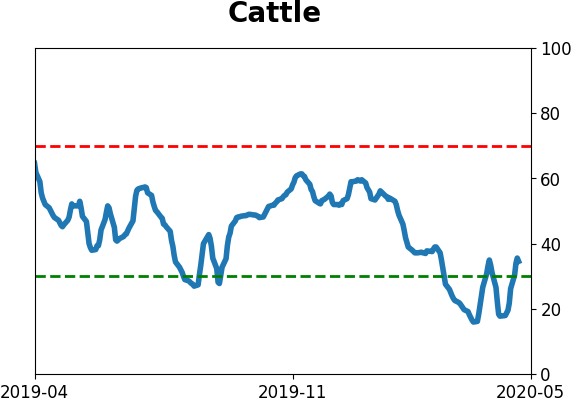
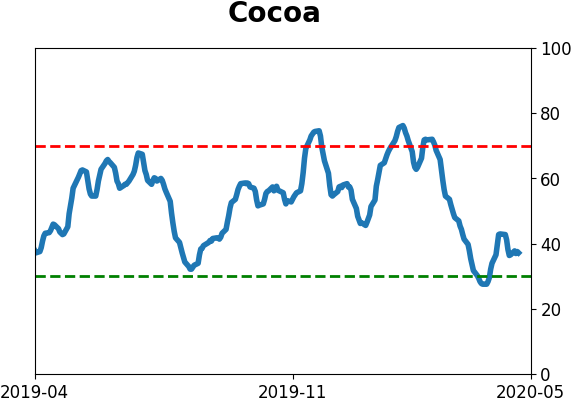
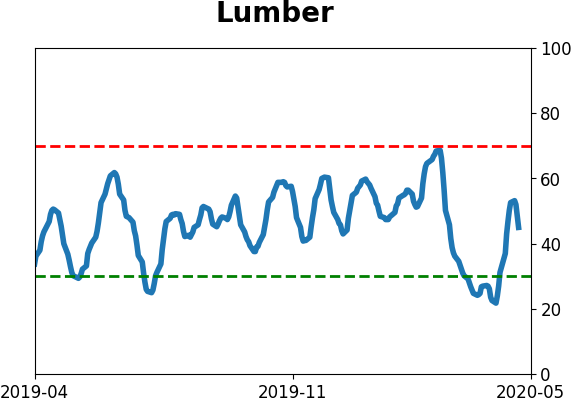
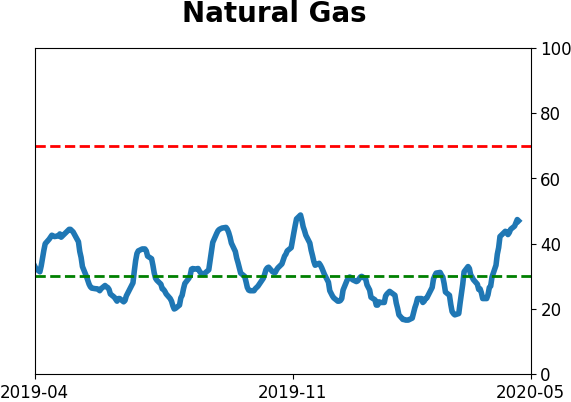
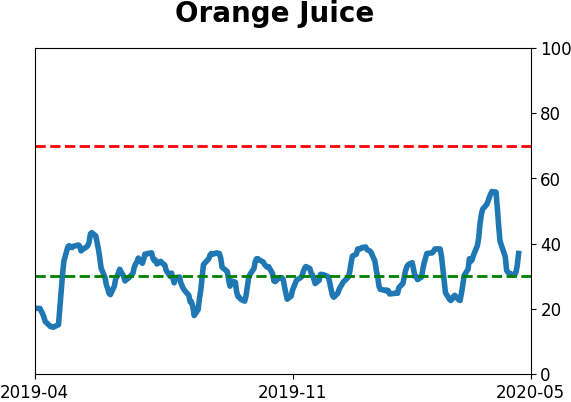
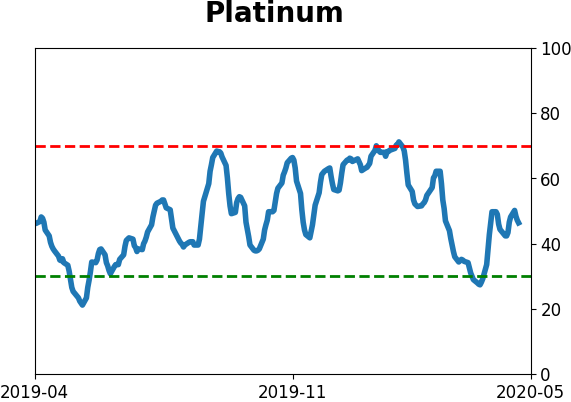
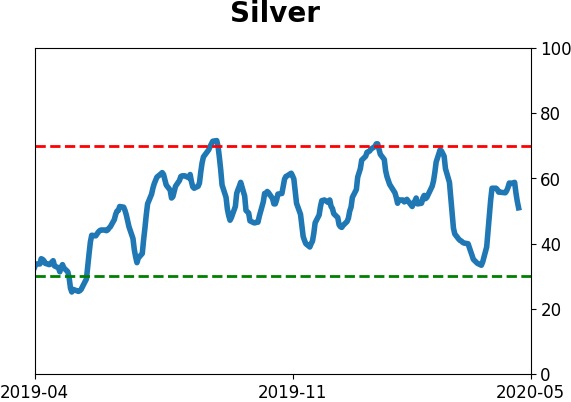
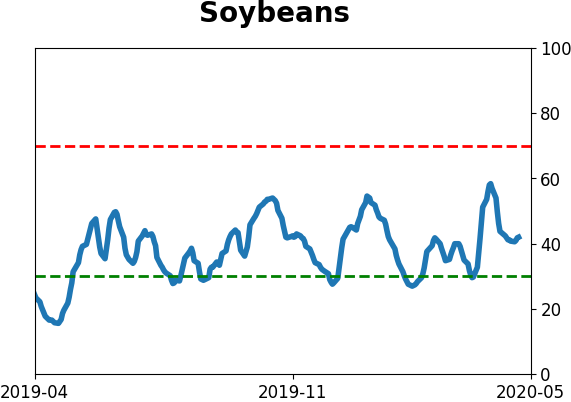
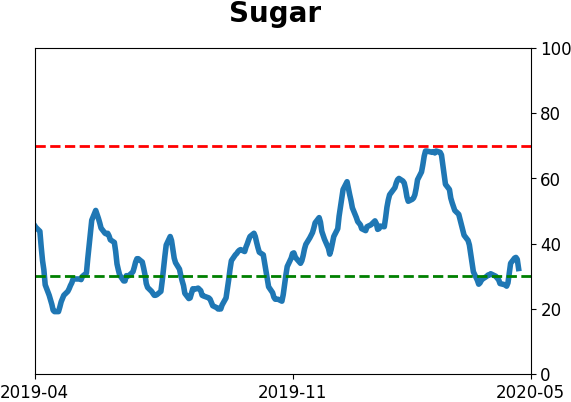
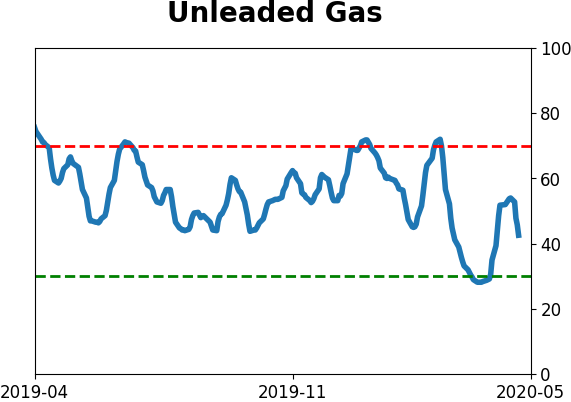
Commodity ETF's - 5-Day Moving Average
|
|