Headlines
|
|
Surveys show persistent pessimism:
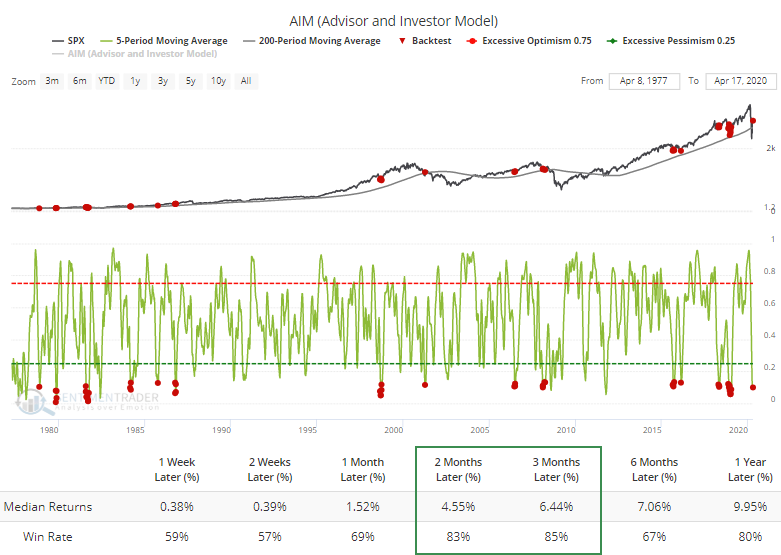
The latest batch of investor surveys continues to show apathetic sentiment, with low optimism or even outright pessimism. This is unusual to see after stocks have staged large multi-week rallies. Our AIM model is showing the lowest-ever amount of optimism after such a large gain.
Hedge funds remain short despite rally:
Over the past month, stocks have rallied hard, but trend-following hedge funds appear to have a net short position. After a rally this large, their models would typically have flipped to long positions, so this is unusual and suggests they think we're still in a downtrending market.
Recessionary plunge: "A Chicago Federal Reserve measure of the national economy plunged to recessionary levels in March," notes a recent Reuters article. The Chicago Fed National Activity Index dropped to -4, the lowest level since 2008, and one of the lowest in more than 50 years. In a premium note, Troy shows that only two other time periods exceeded this low of an Activity Index, at the ends of 1974 and 2008. While the interim might have seen some swings, over the next year stocks rose by more than 20%.
|
Smart / Dumb Money Confidence
|
Smart Money Confidence: 76%
Dumb Money Confidence: 42%
|
|
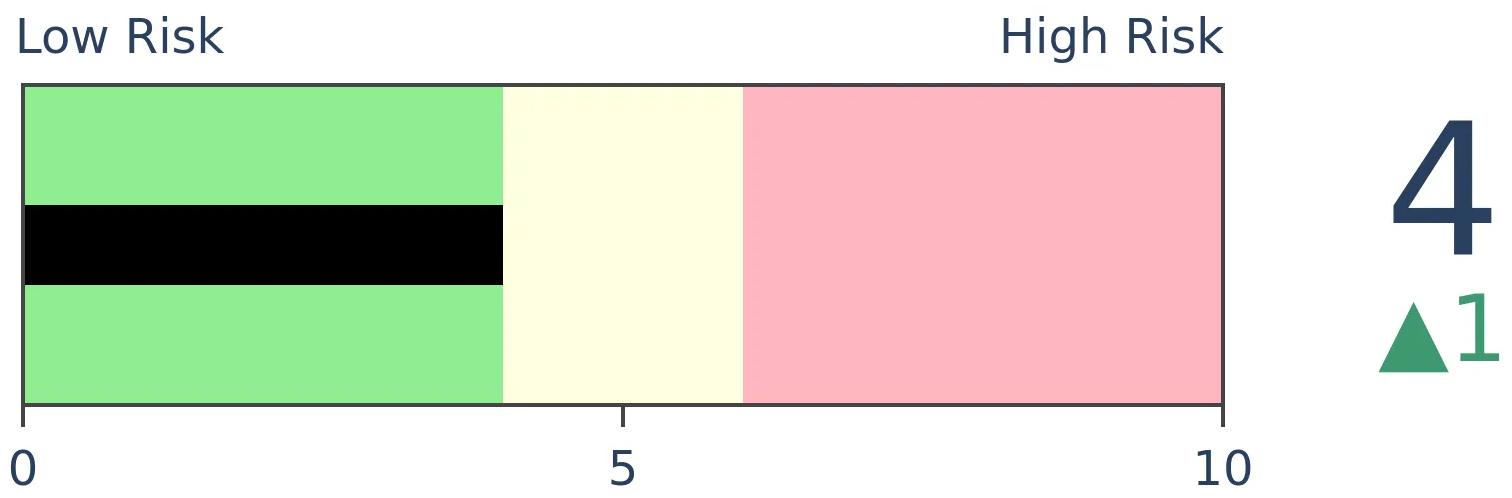
Risk Levels
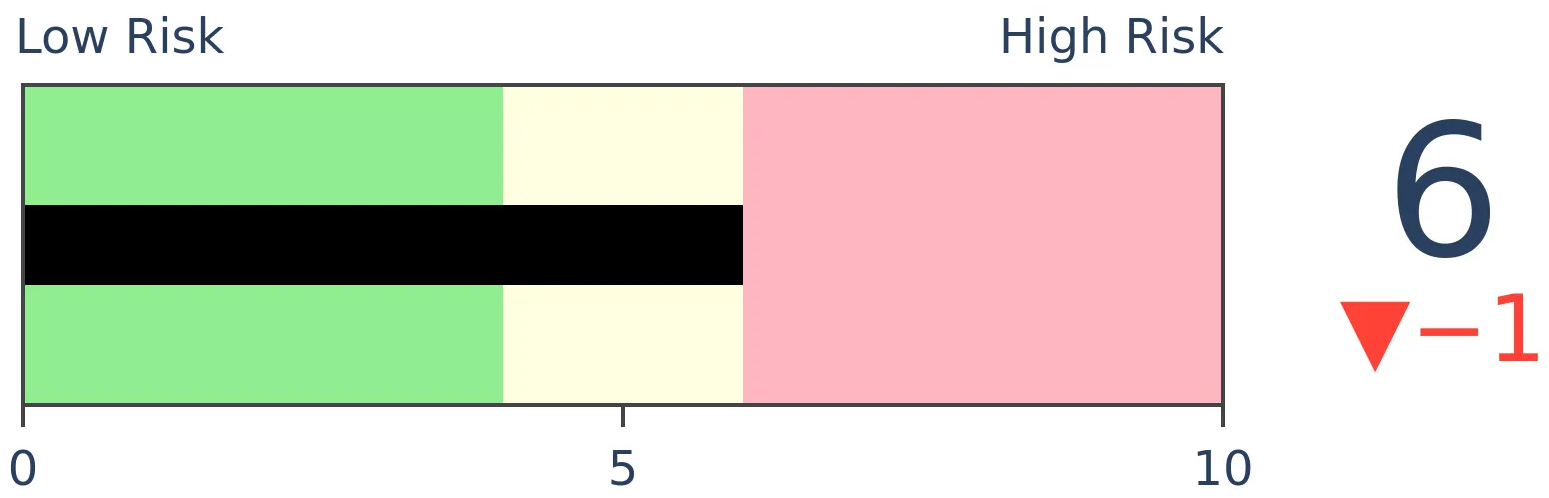
Stocks Short-Term
|
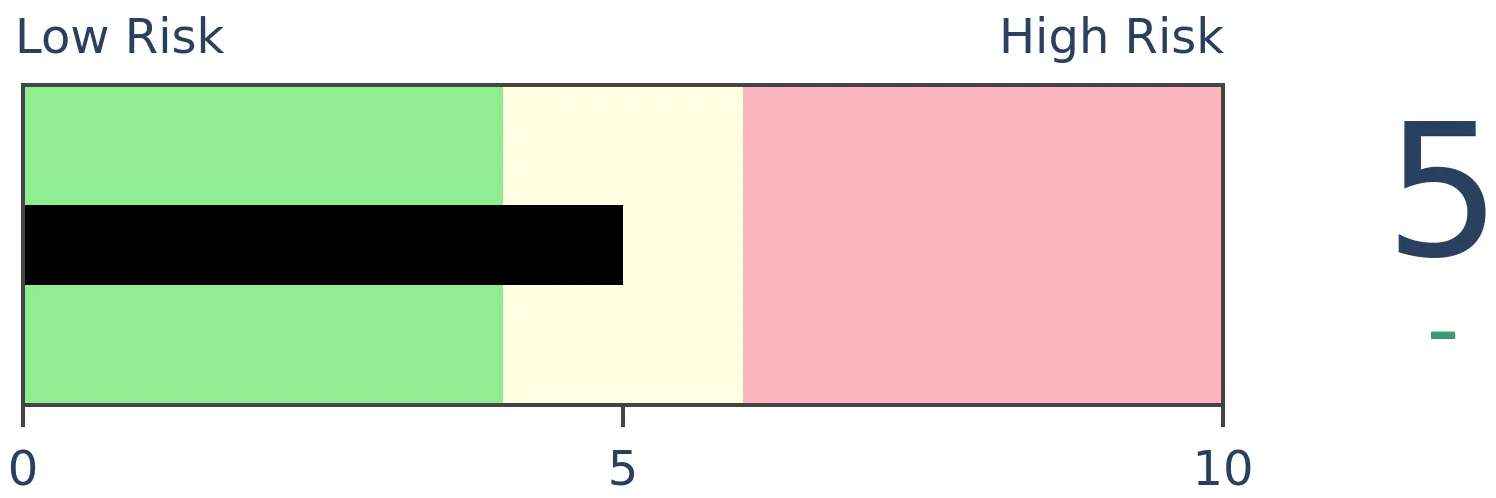
Stocks Medium-Term
|
|
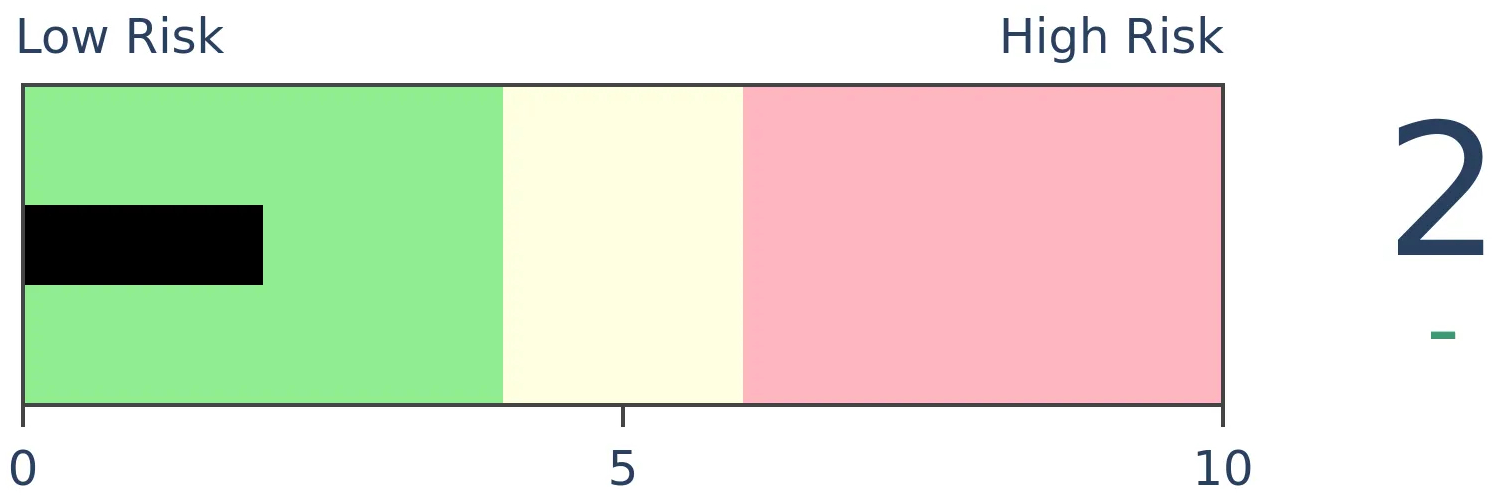
Bonds

|
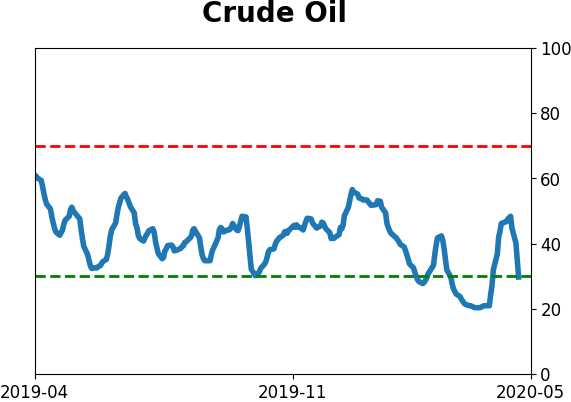
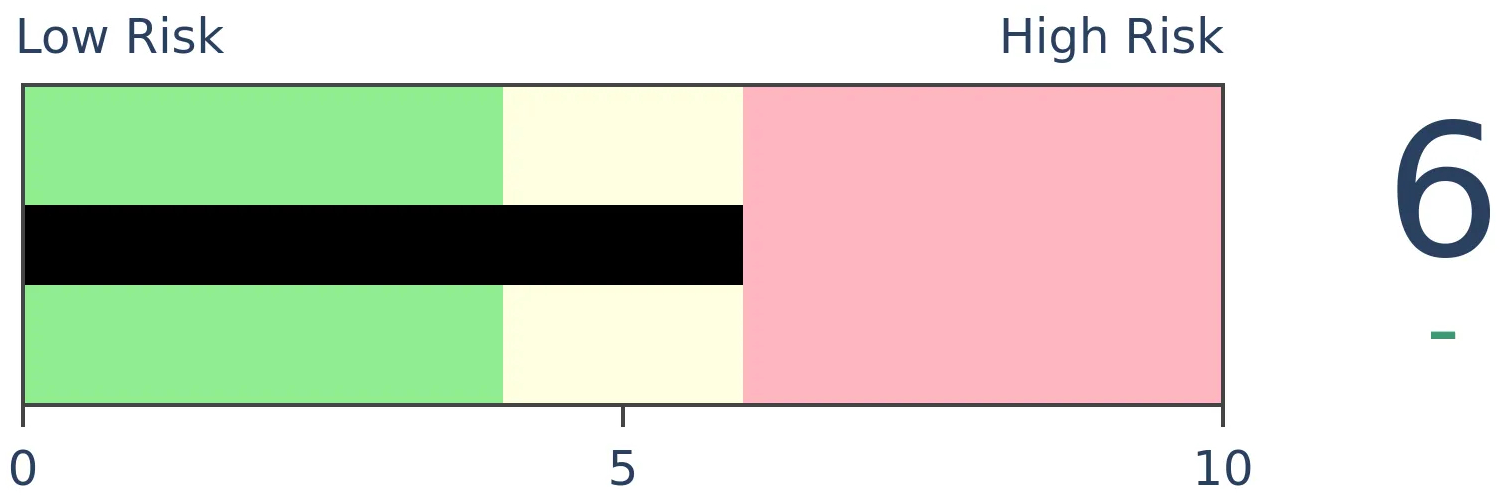
Crude Oil
|
|
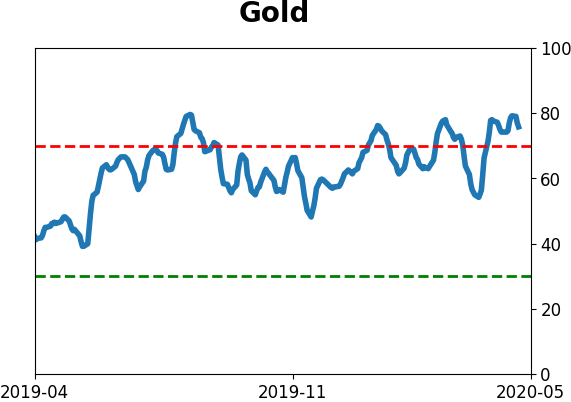
Gold
|
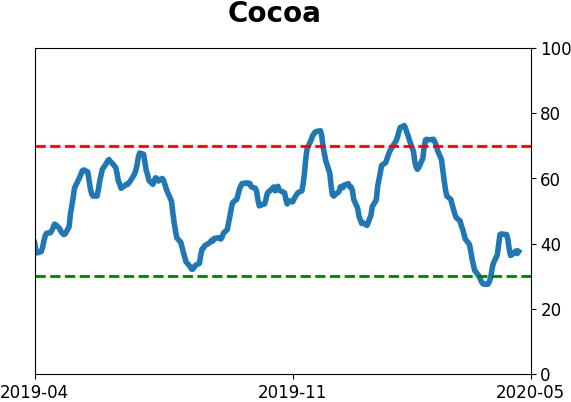
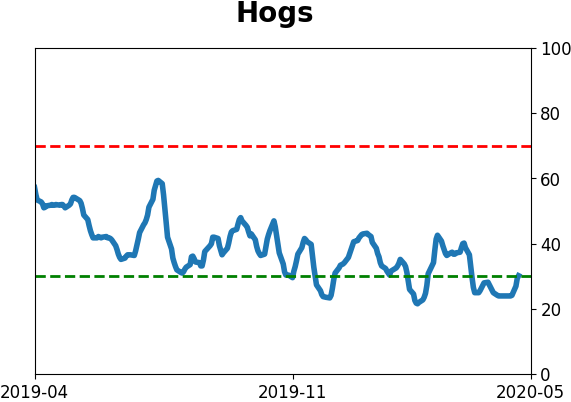
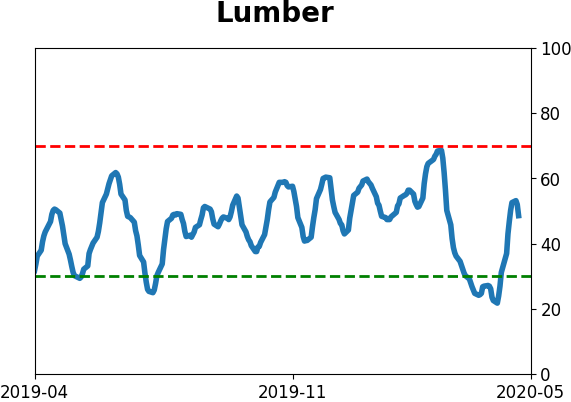
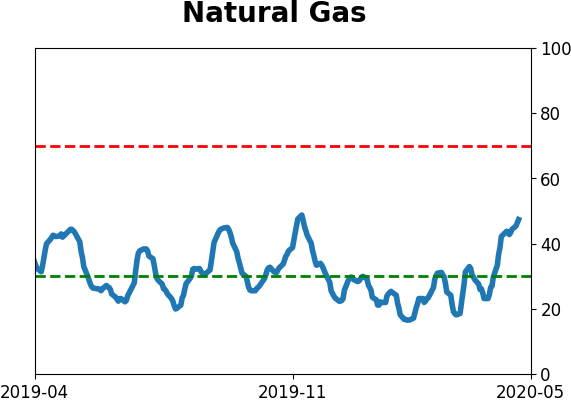
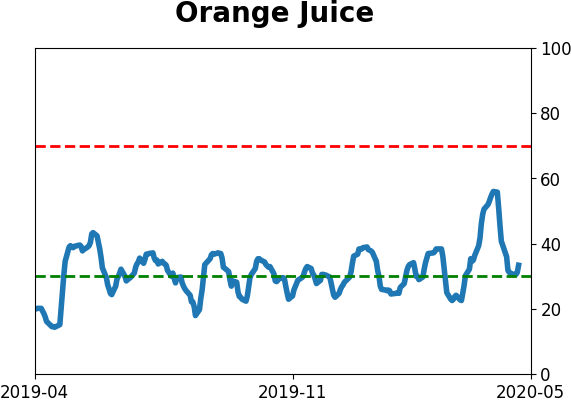
Agriculture
|
|
Research
BOTTOM LINE
The latest batch of investor surveys continues to show apathetic sentiment, with low optimism or even outright pessimism. This is unusual to see after stocks have staged large multi-week rallies. Our AIM model is showing the lowest-ever amount of optimism after such a large gain.
FORECAST / TIMEFRAME
SPY -- Down, Short-Term
|
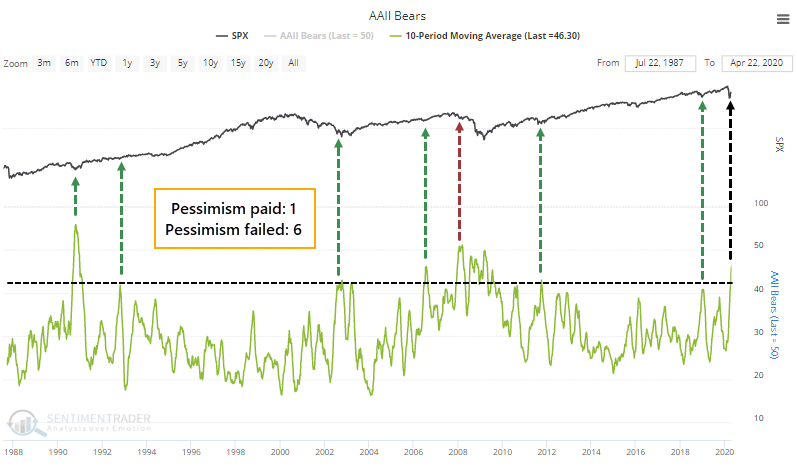
Last week, we saw that despite a big rally in stocks, individual investors in the AAII survey were not showing much optimism that it could continue. That continued this week, with half of the respondents expecting stocks to drop in the months ahead.
Over the past 10 weeks, bears have averaged more than 46% of total respondents, among the most persistent bouts of pessimism in the survey's history. All but once (and that "once" was a major exception), the pessimism was unwarranted.
When we aggregate surveys covering a broad swath of investor types, it's apparent that the mom-and-pop types who frequent the AAII survey are not alone. The AIM Model this week is on track to decline from last week's still-low 23%. In the face of a huge rally off the lows, folks still aren't buying into it. Or at least, that's what they're saying.
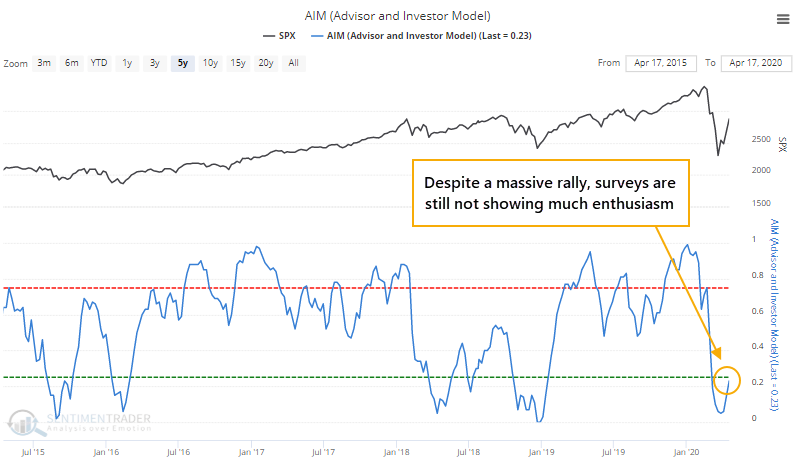
We saw this kind of behavior last January, too, though on a smaller scale. The S&P had jumped more than 10% over five weeks, yet the AIM Model remained below 50%. This time, the S&P has rallied twice as much, and the model is about half of where it was then.
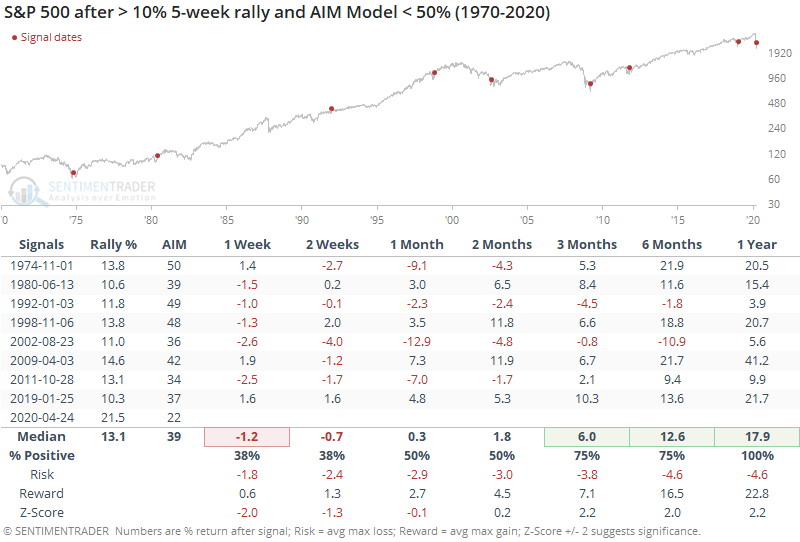
Shorter-term returns were poor because stocks have a tendency to back off a bit after big multi-week surges. But the positive momentum combined with apathetic sentiment led to consistently positive medium- to long-term gains, with all of them showing a gain a year later.
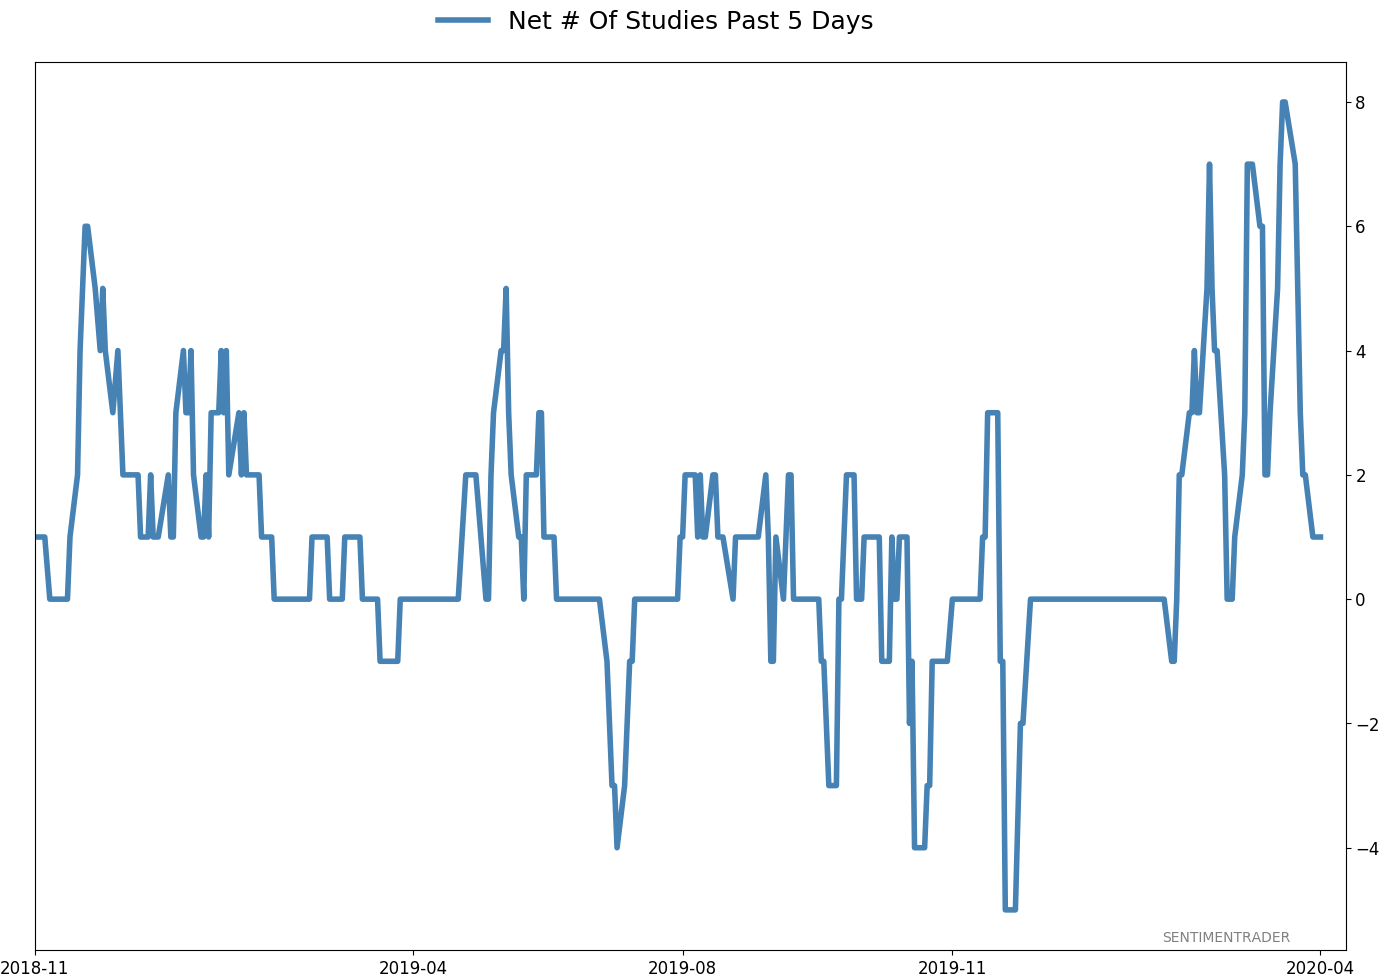
The pervasive pessimism in surveys has pushed the 5-week average of the model to a lowly 13%. And with the rally in recent weeks, the S&P has been able to hold above its rising 200-week average. According to the Backtest Engine, that's been a good - though not perfect - sign over the medium-term.
BOTTOM LINE
Over the past month, stocks have rallied hard, but trend-following hedge funds appear to have a net short position. After a rally this large, their models would typically have flipped to long positions, so this is unusual and suggests they think we're still in a downtrending market.
FORECAST / TIMEFRAME
None
|
Like individual investors and some other survey-based sentiment measures, trend-following hedge funds don't seem to have much faith that this has been anything but a bear market rally.
This is a gross simplification, to be sure, but if we approximate the positioning of hedge funds according to their rolling beta to the S&P 500, then it's apparent that they haven't ramped up along with the S&P in recent weeks.
Despite more than a 20% gain in the S&P, Hedge Fund Exposure has actually decreased a bit and remains negative. All this means is that an index of hedge fund returns from Hedge Fund Research, Inc. has shown a negative beta to returns in the S&P 500 index over the past month.
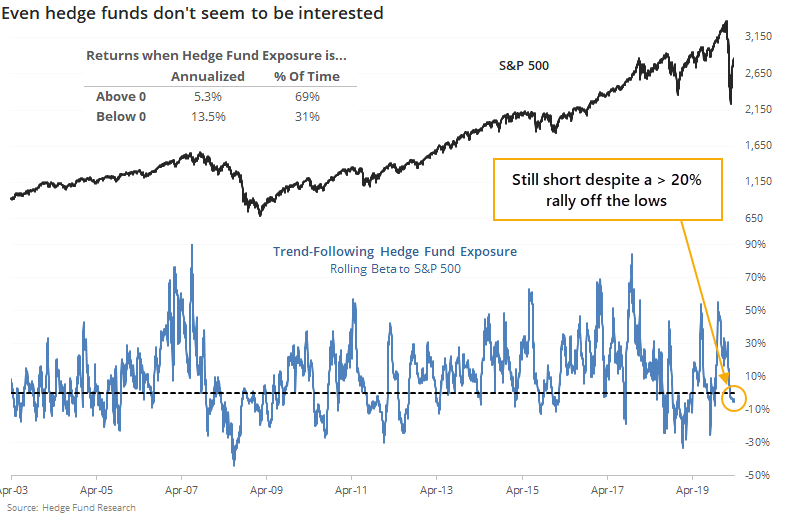
Just eyeballing the chart above, it's apparent that this is unusual. When stocks rally, trend followers tend to add to their positions. That's the whole point of being a trend follower. This suggests that the quantitative models that many of them use have not yet triggered long entries, which are sometimes based on fairly basic triggers like multiple closes above the 200-day average, 50-day highs, etc.
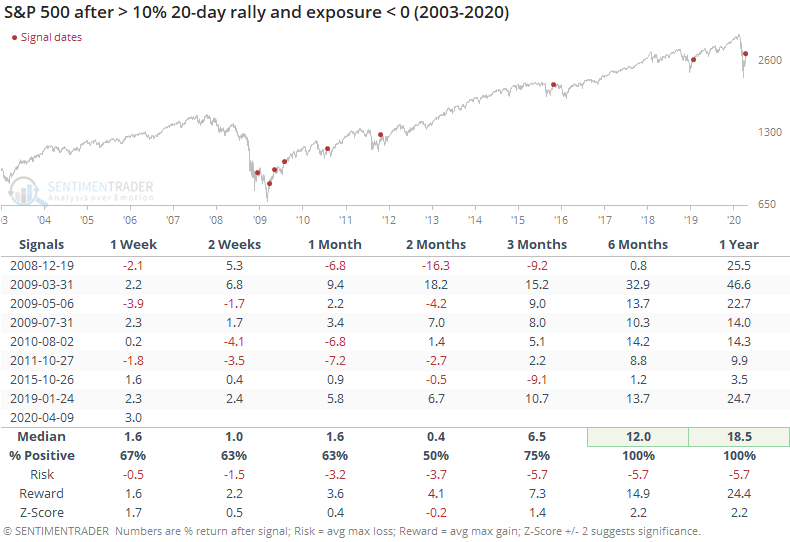
While history is limited, if stocks rally hard but Exposure suggests a net short position, then stocks have shown above-average returns in the medium- to long-term. This is less meaningful given the nearly one-sided market over the past decade.
It's easy to suggest that everybody's bullish just because prices have rallied, but they're not. Many surveys, and even hard data, suggest that there are only pockets of buyers. This isn't necessarily a good thing, but so far the evidence suggests that it mostly is, at least longer-term.
It does raise the question of exactly who is buying, and we don't know. The usual culprits seem to be holding back.
Active Studies
| Time Frame | Bullish | Bearish | | Short-Term | 0 | 4 | | Medium-Term | 11 | 0 | | Long-Term | 34 | 3 |
|
Indicators at Extremes
Portfolio
| Position | Weight % | Added / Reduced | Date | | Stocks | 49.9 | Reduced 10.3% | 2020-04-23 | | Bonds | 0.0 | Reduced 6.7% | 2020-02-28 | | Commodities | 5.1 | Added 2.4%
| 2020-02-28 | | Precious Metals | 0.0 | Reduced 3.6% | 2020-02-28 | | Special Situations | 0.0 | Reduced 31.9% | 2020-03-17 | | Cash | 45.0 | | |
|
Updates (Changes made today are underlined)
In the first months of the year, we saw manic trading activity. From big jumps in specific stocks to historic highs in retail trading activity to record highs in household confidence to almost unbelievable confidence among options traders. All of that came amid a market where the average stock couldn't keep up with their indexes. There were signs of waning momentum in stocks underlying the major averages, which started triggering technical warning signs in late January. The kinds of extremes we saw in December and January typically take months to wear away, but the type of selling in March went a long way toward getting there. When we place the kind of moves we saw into March 23 into the context of coming off an all-time high, there has been a high probability of a multi-month rebound. After stocks bottomed on the 23rd, they enjoyed a historic buying thrust and retraced a larger amount of the decline than "just a bear market rally" tends to. While other signs are mixed that panic is subsiding, those thrusts are the most encouraging sign we've seen in years. Shorter-term, there have been some warning signs popping up and our studies have stopped showing as positively skewed returns. I reduced my exposure some on Monday and a little more on Thursday and will consider further reducing it if we drop below last Monday's lows on SPY. Long-term suggestions from the studies remain robust, but shorter-term ones are significantly less so, and stocks still have to prove that we're in something other than a protracted, recessionary bear market.
RETURN YTD: -10.6% 2019: 12.6%, 2018: 0.6%, 2017: 3.8%, 2016: 17.1%, 2015: 9.2%, 2014: 14.5%, 2013: 2.2%, 2012: 10.8%, 2011: 16.5%, 2010: 15.3%, 2009: 23.9%, 2008: 16.2%, 2007: 7.8%
|
|
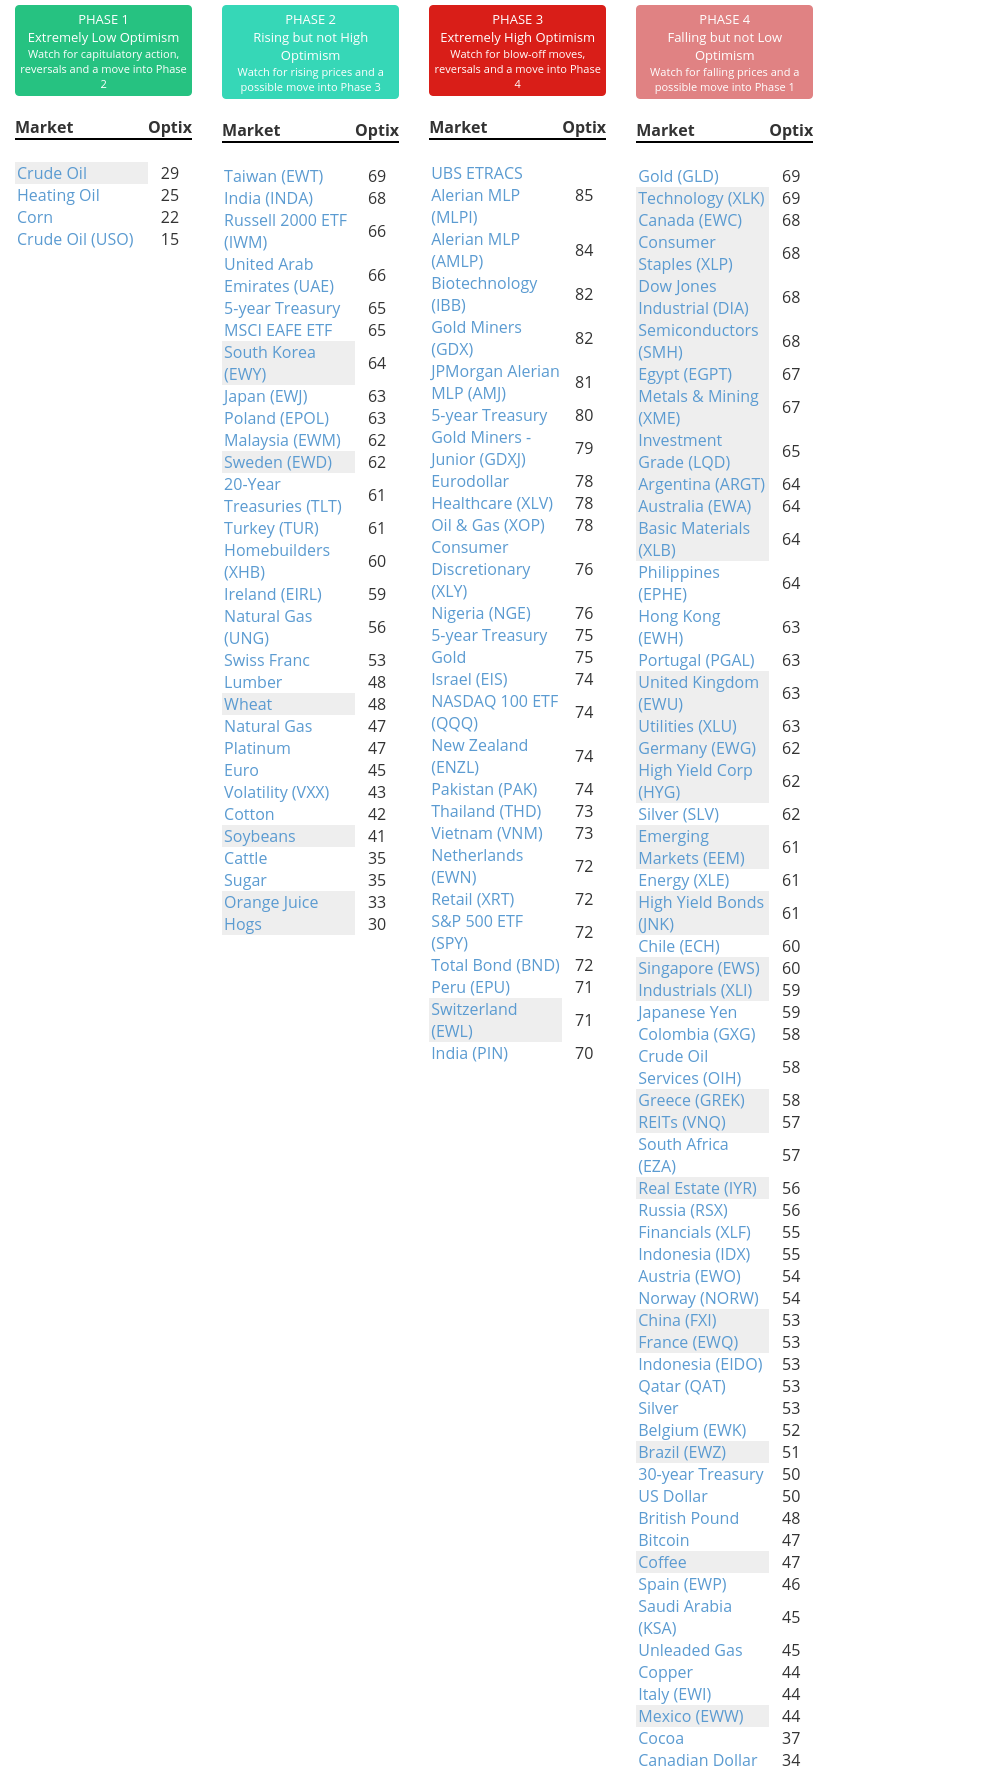
Phase Table
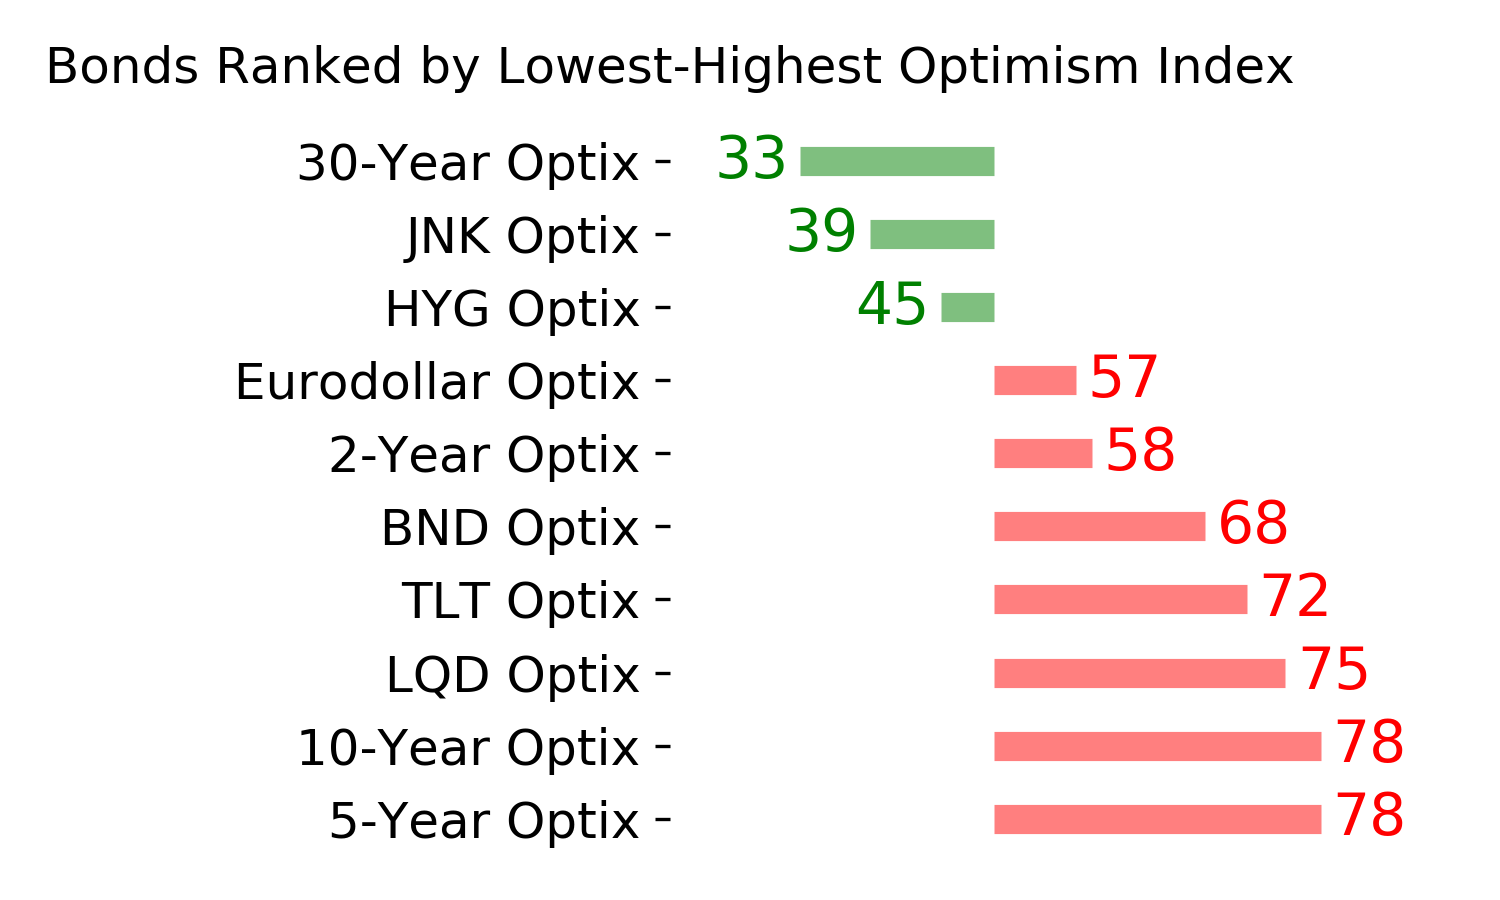
Ranks
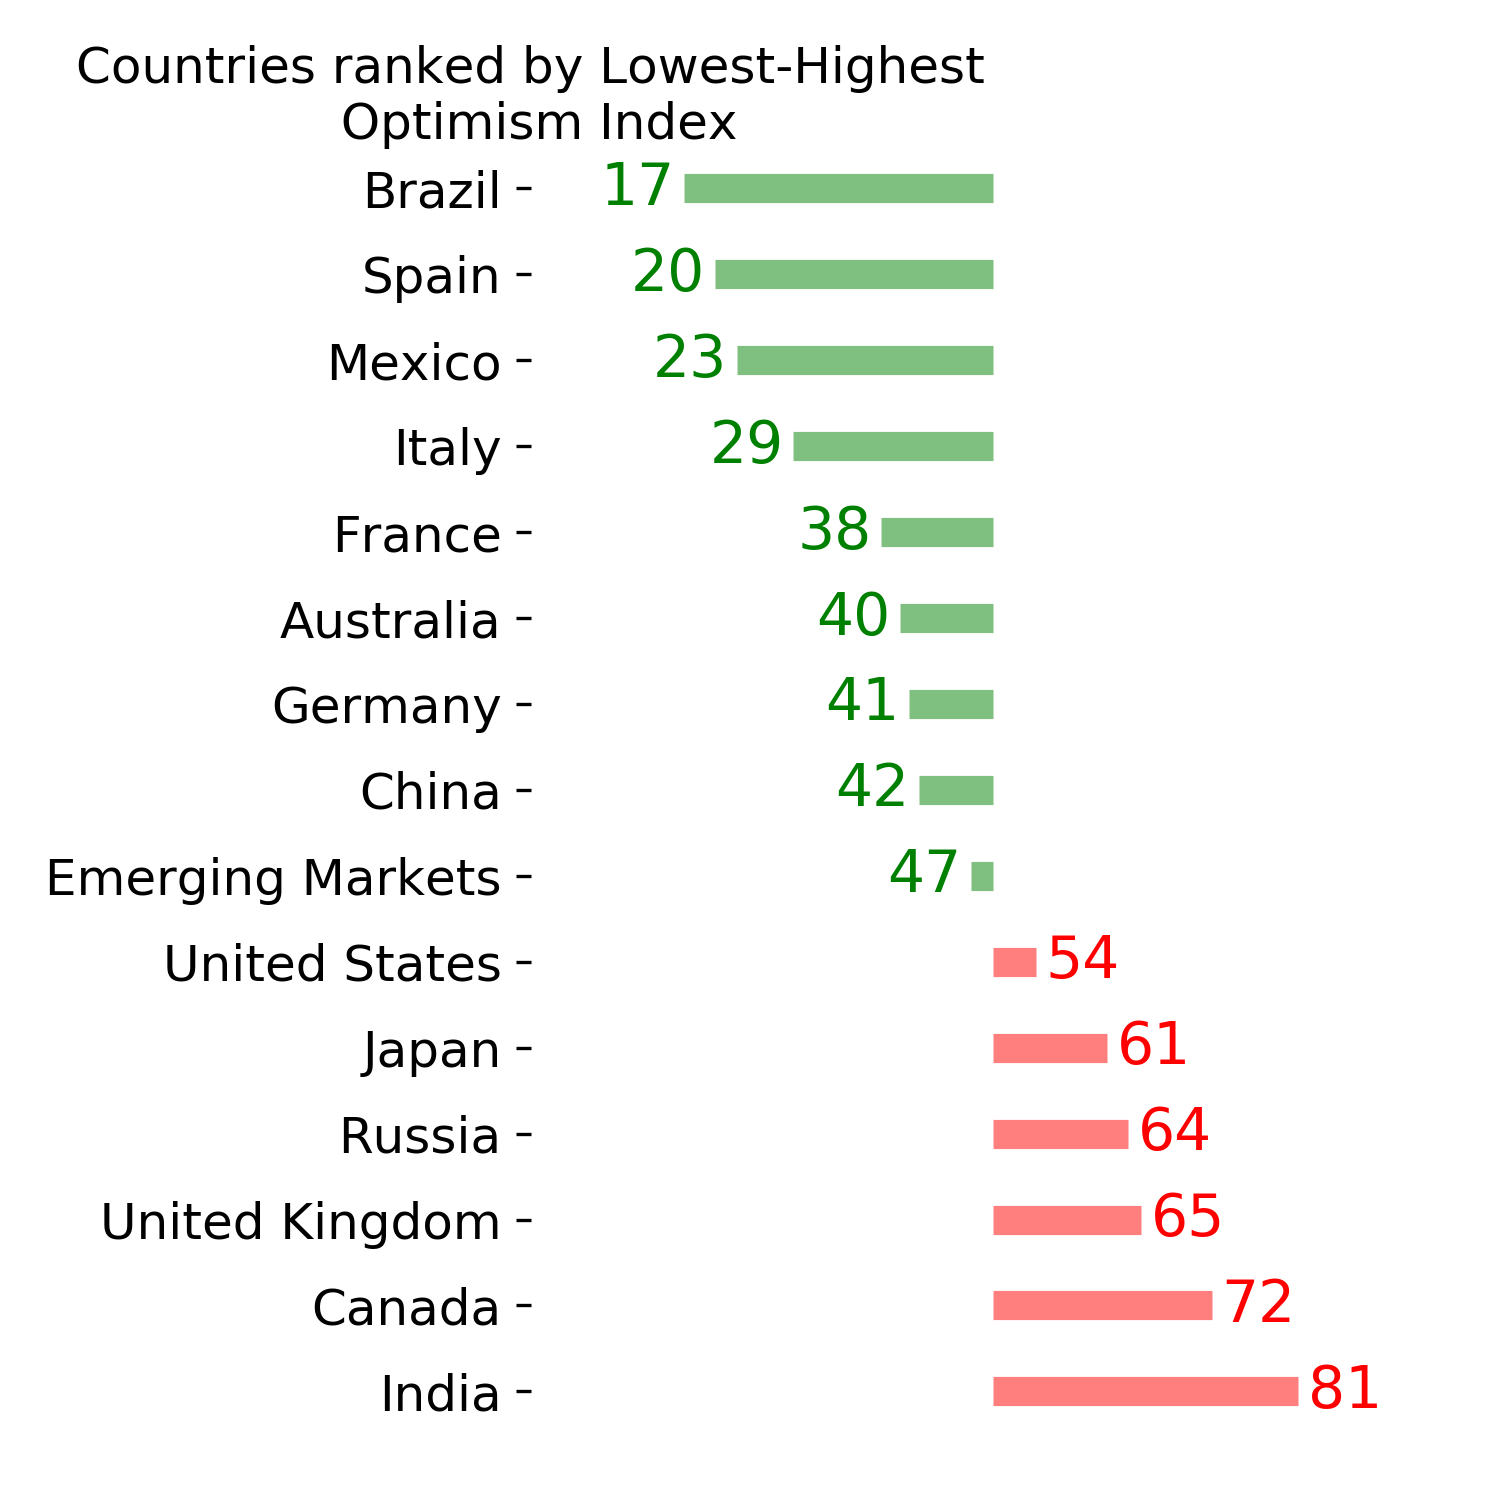
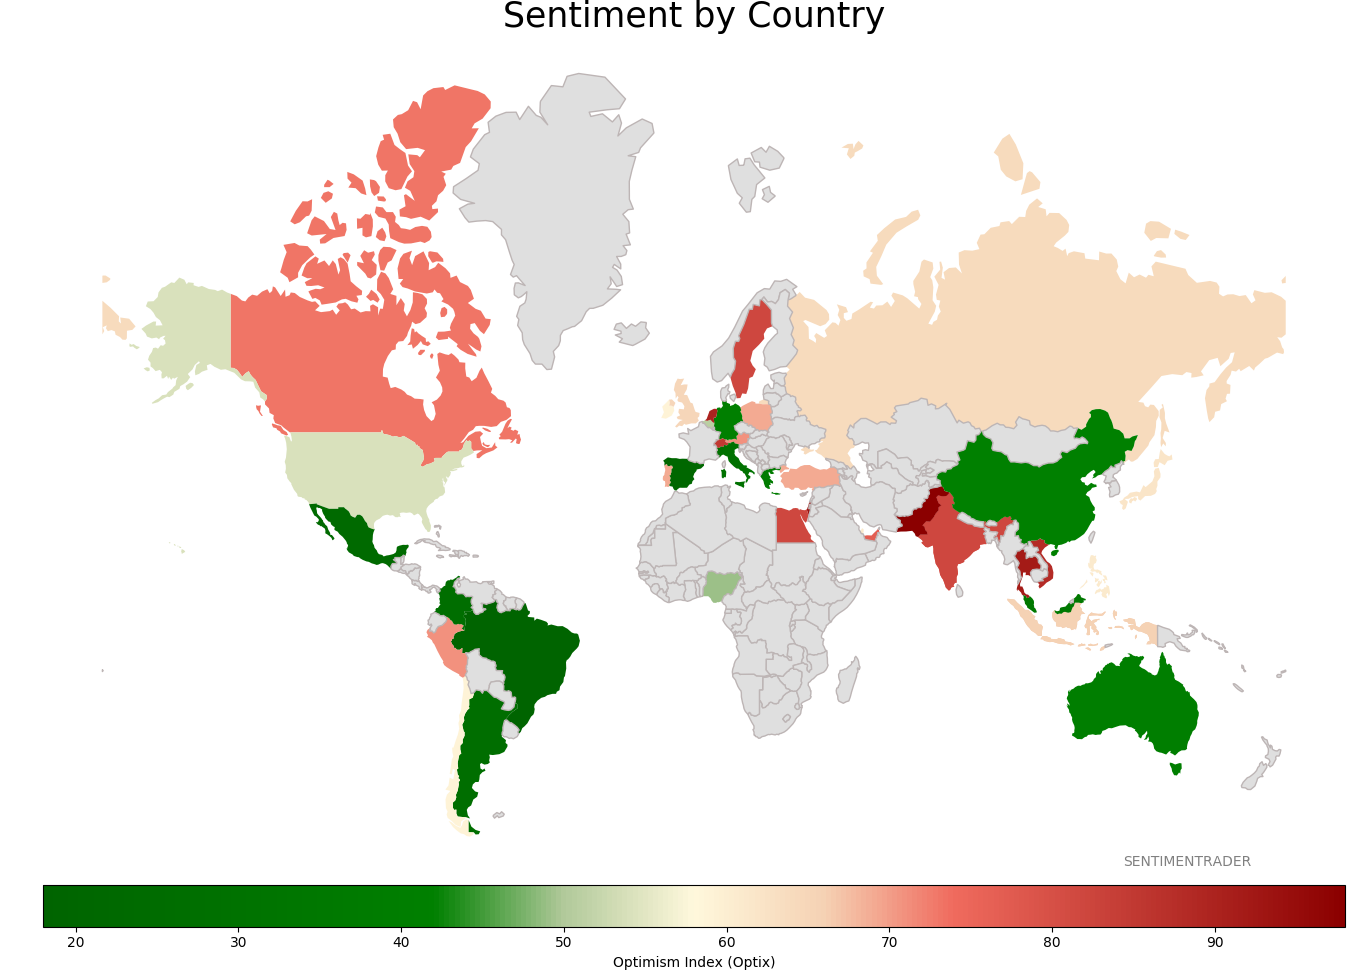
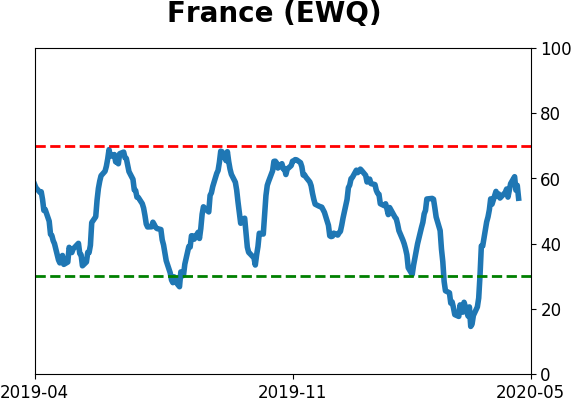
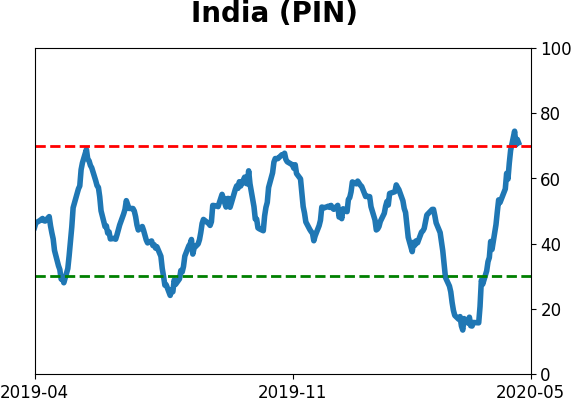
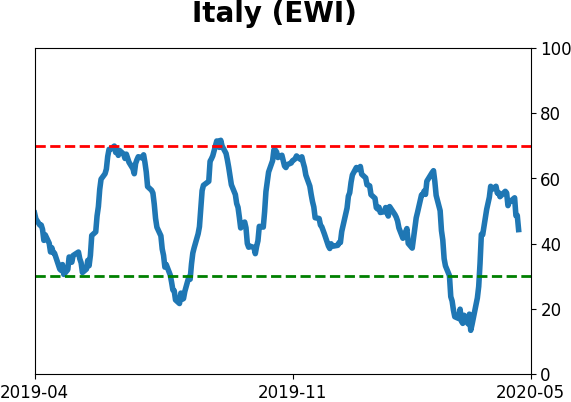
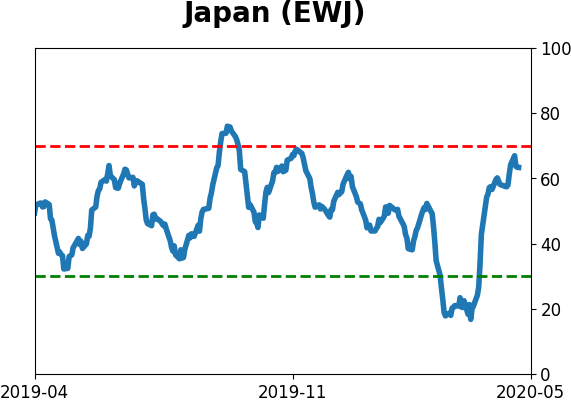
Sentiment Around The World
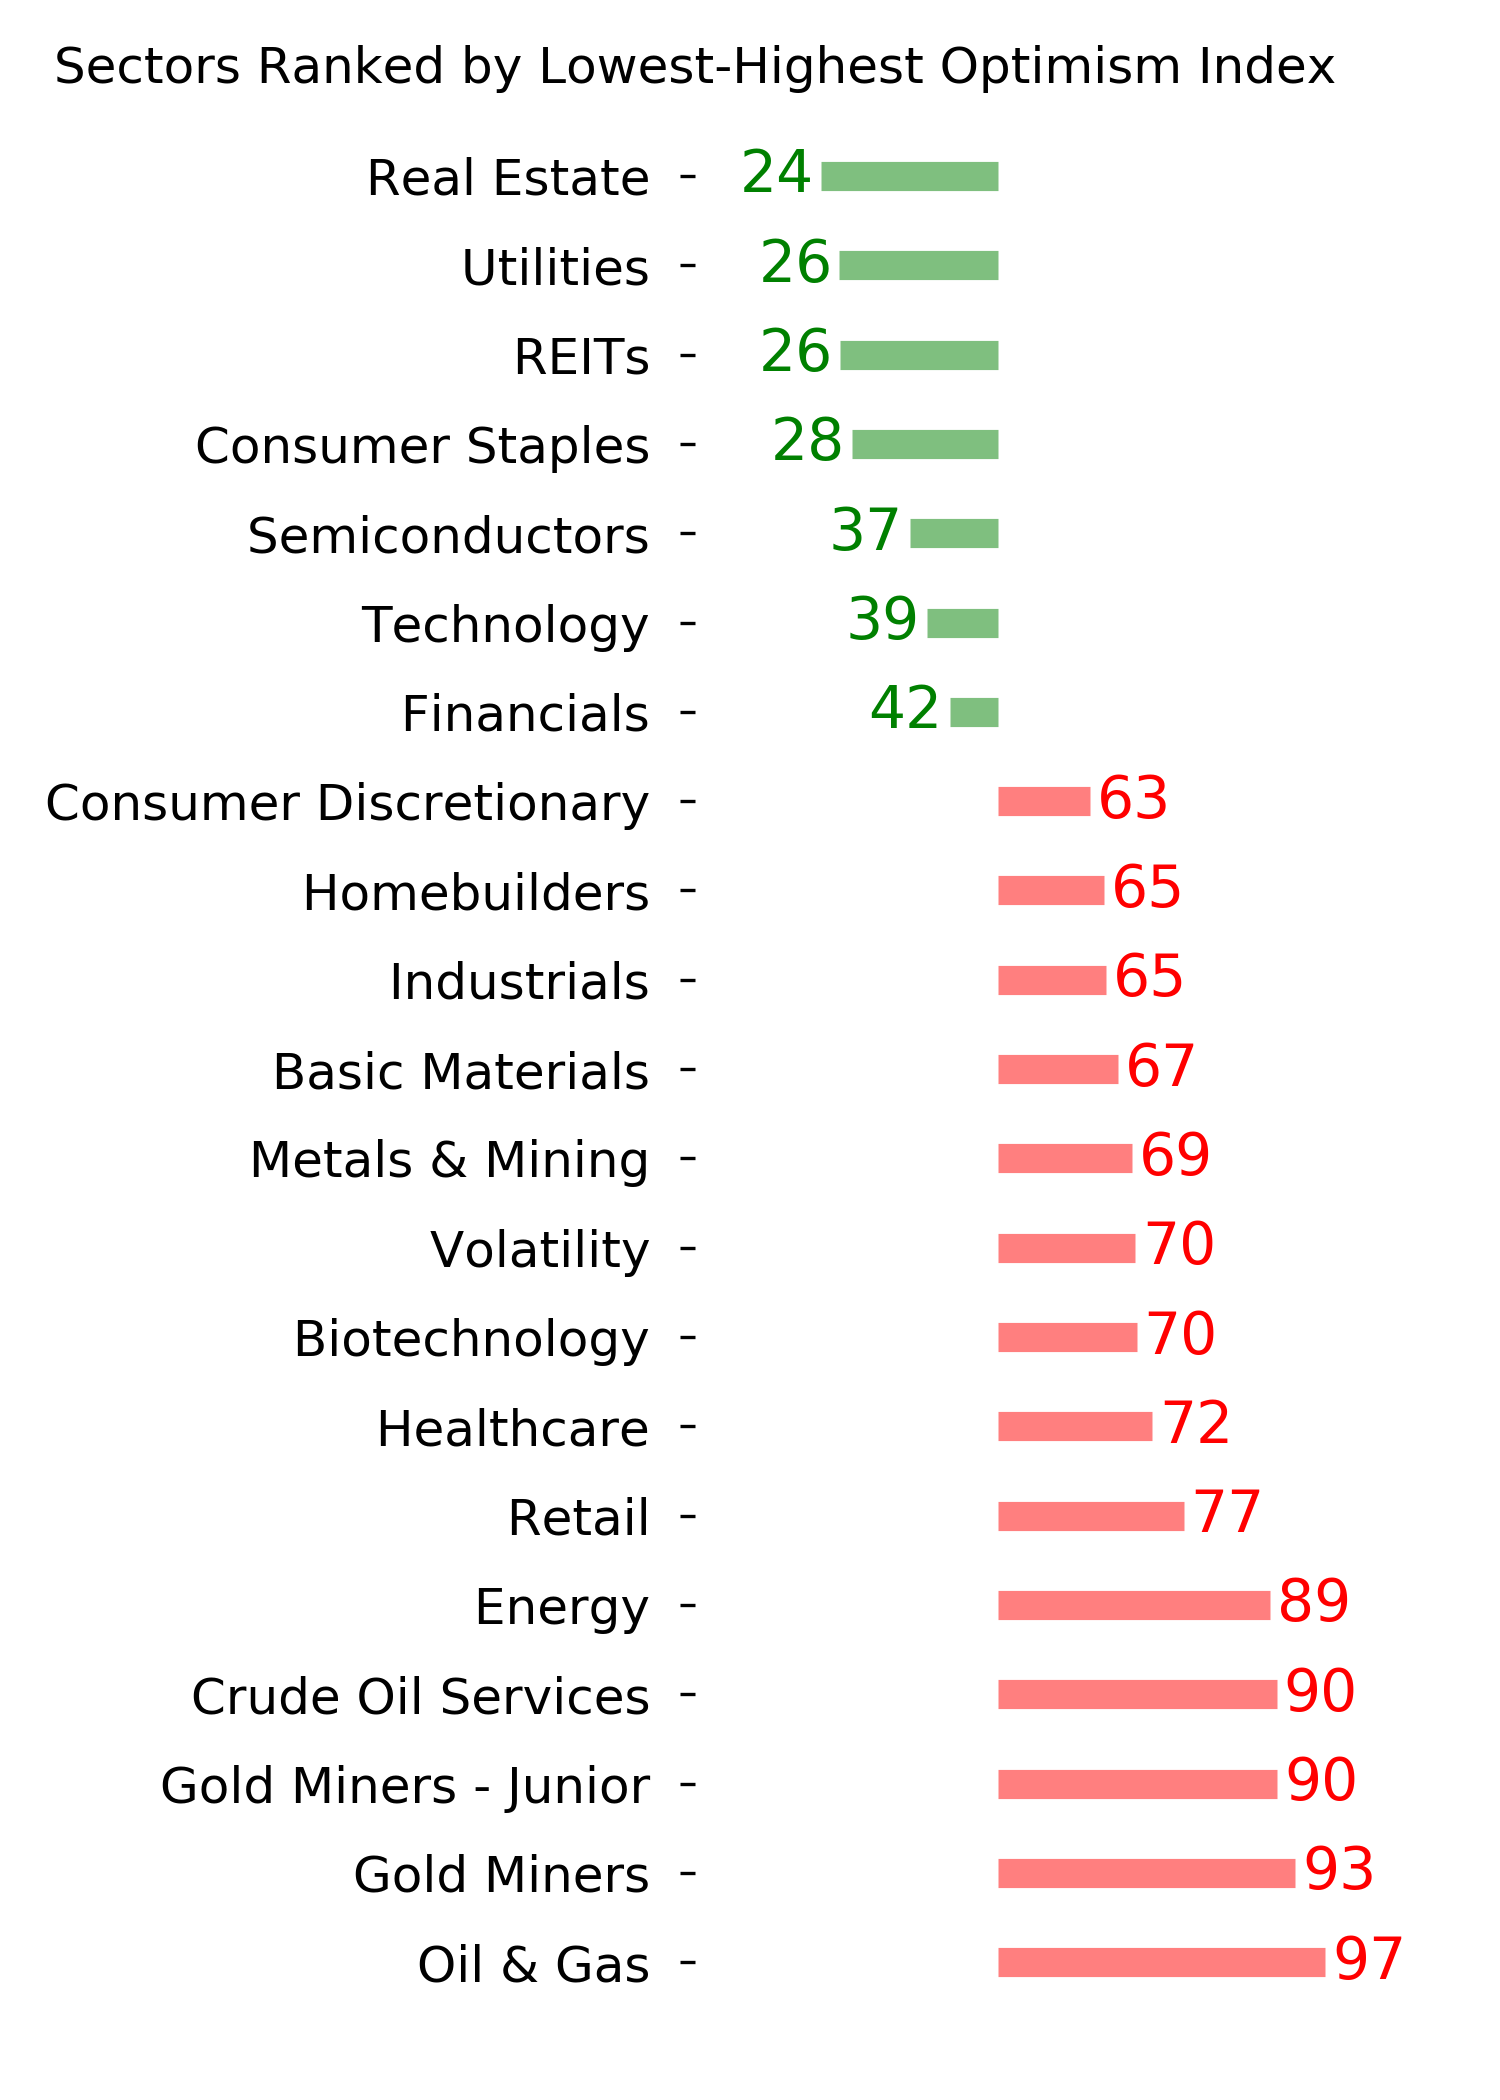
Optimism Index Thumbnails
|
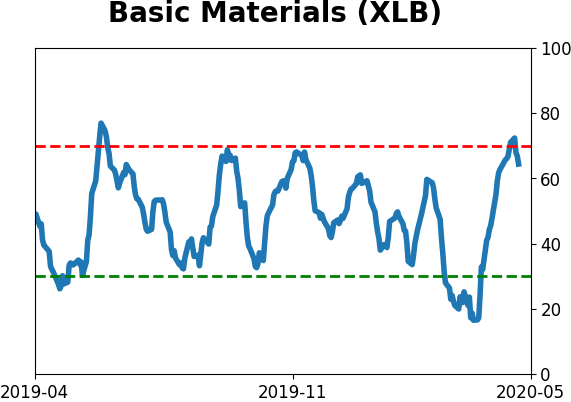
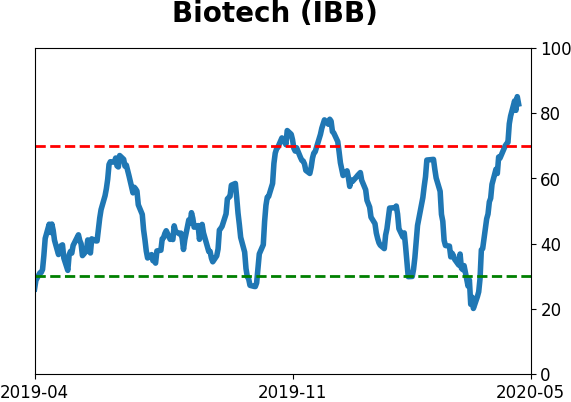
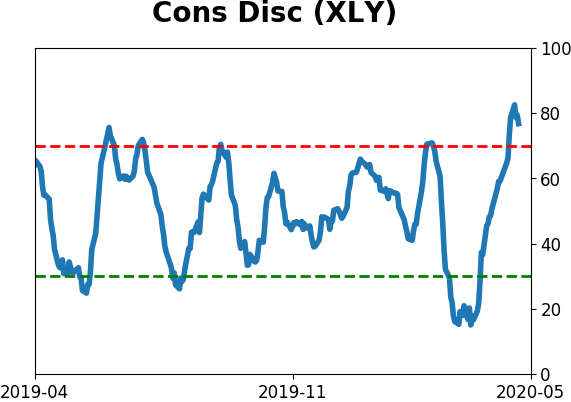
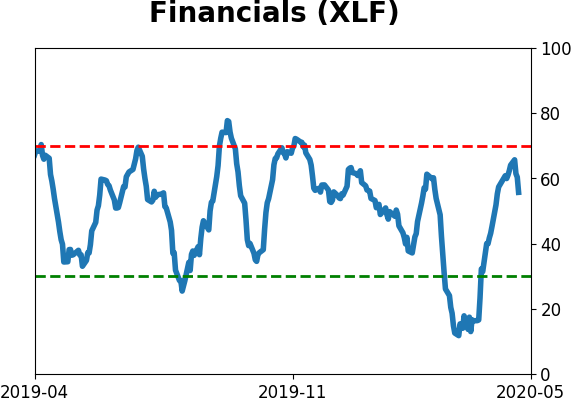
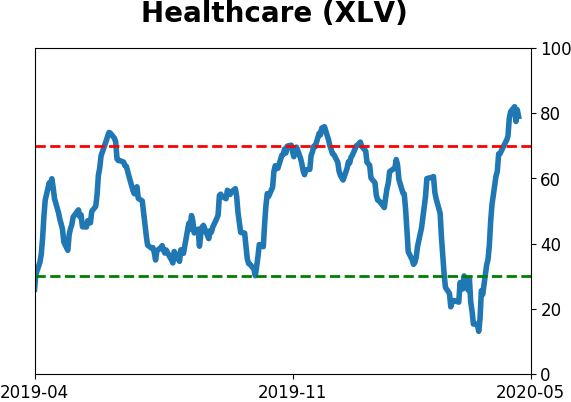
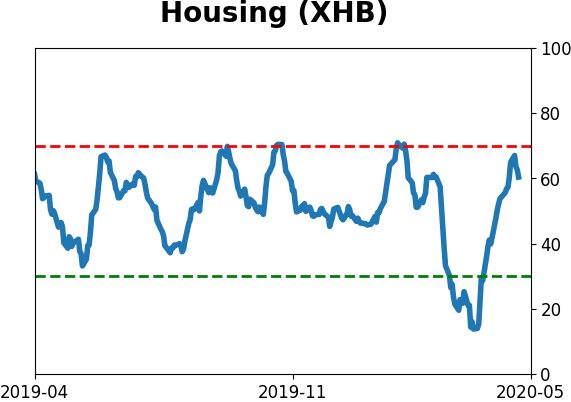
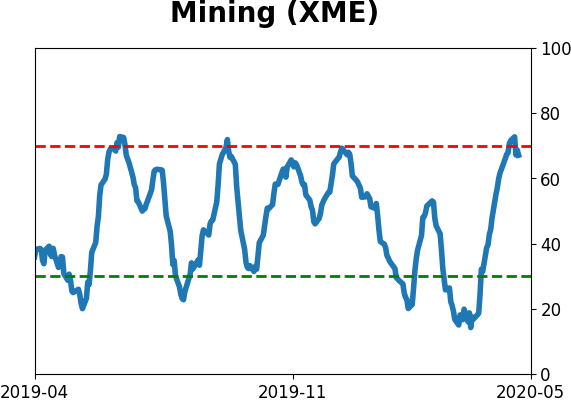
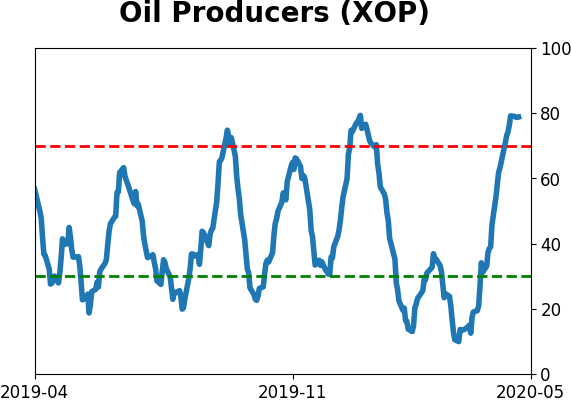
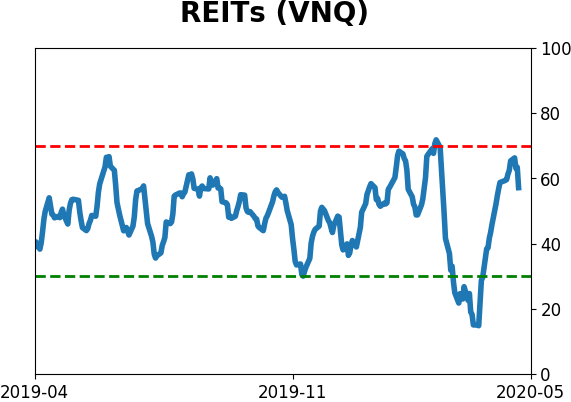
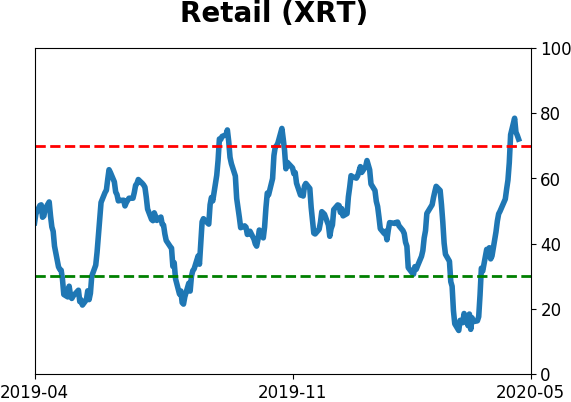
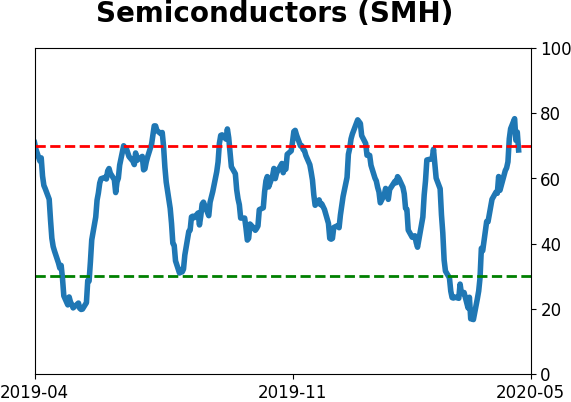
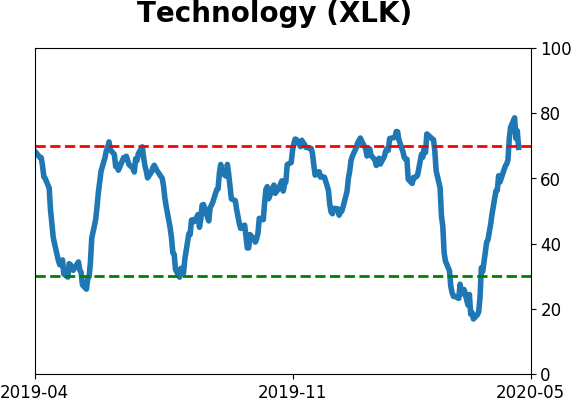
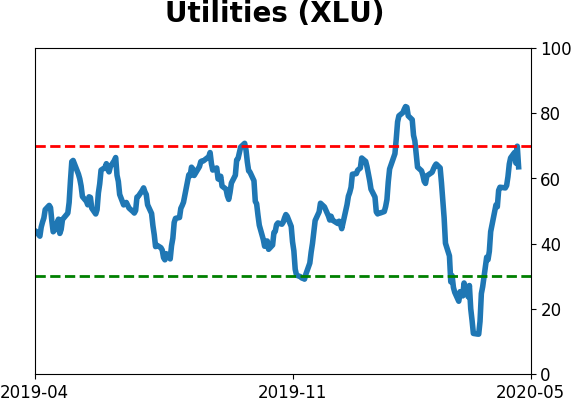
Sector ETF's - 10-Day Moving Average
|
|
|
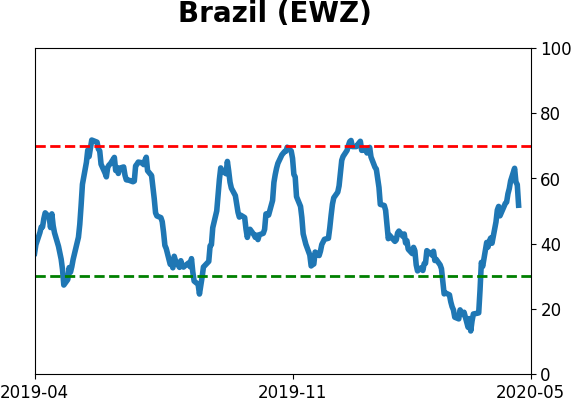
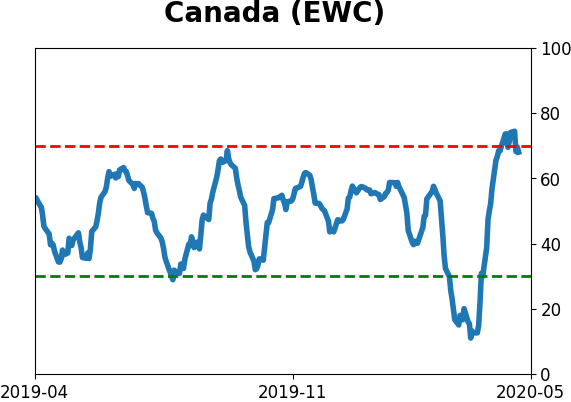
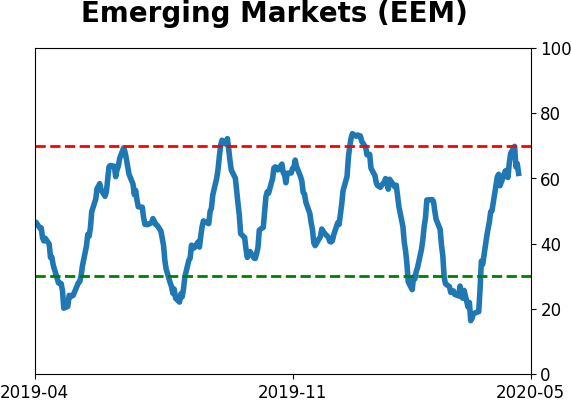
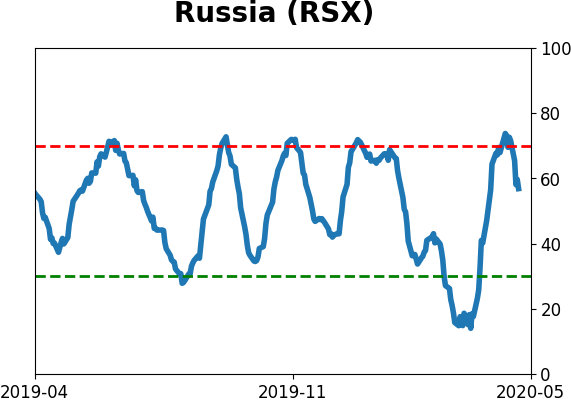
Country ETF's - 10-Day Moving Average
|
|
|
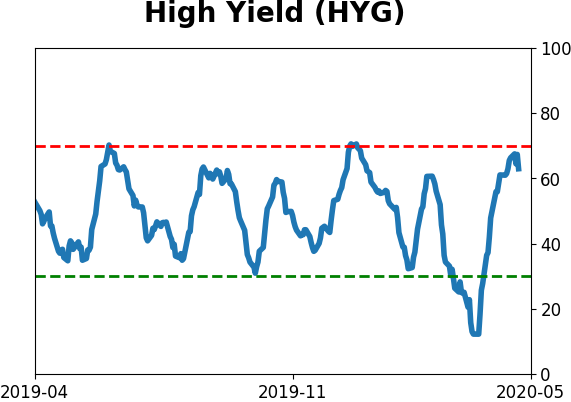
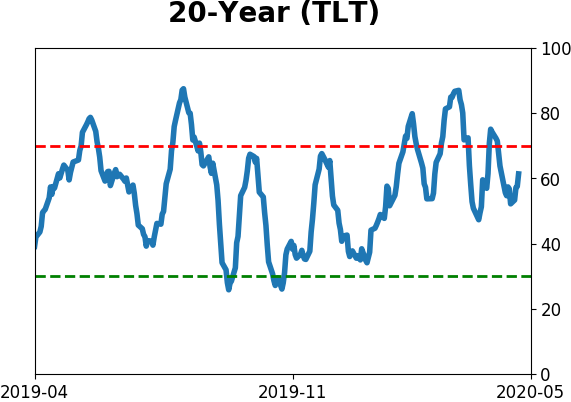
Bond ETF's - 10-Day Moving Average
|
|
|
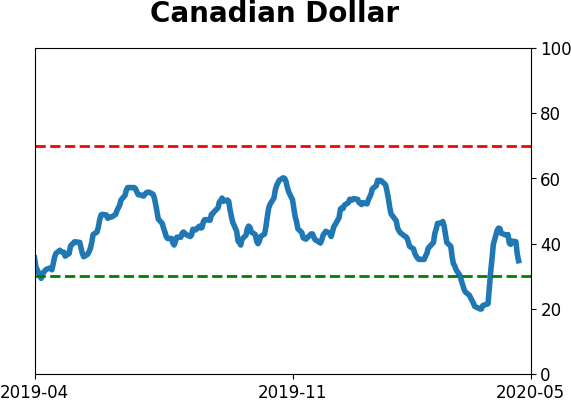
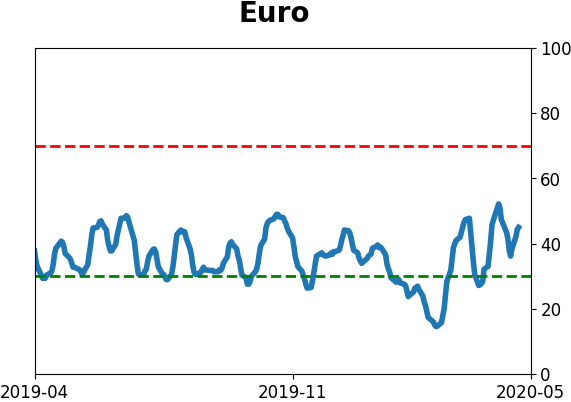
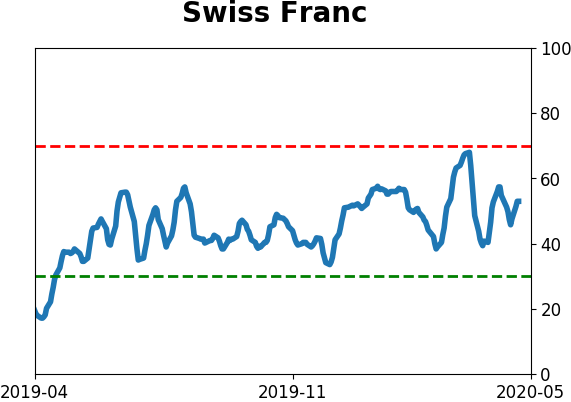
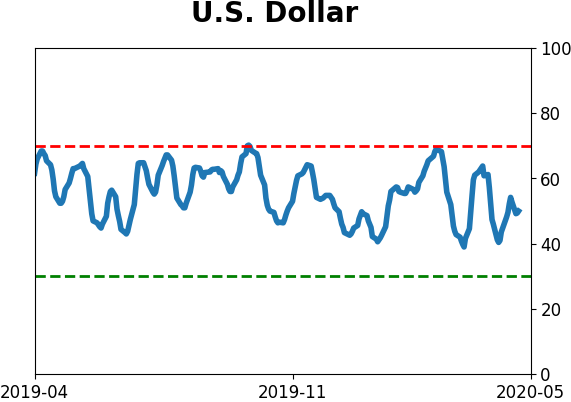
Currency ETF's - 5-Day Moving Average
|
|
|
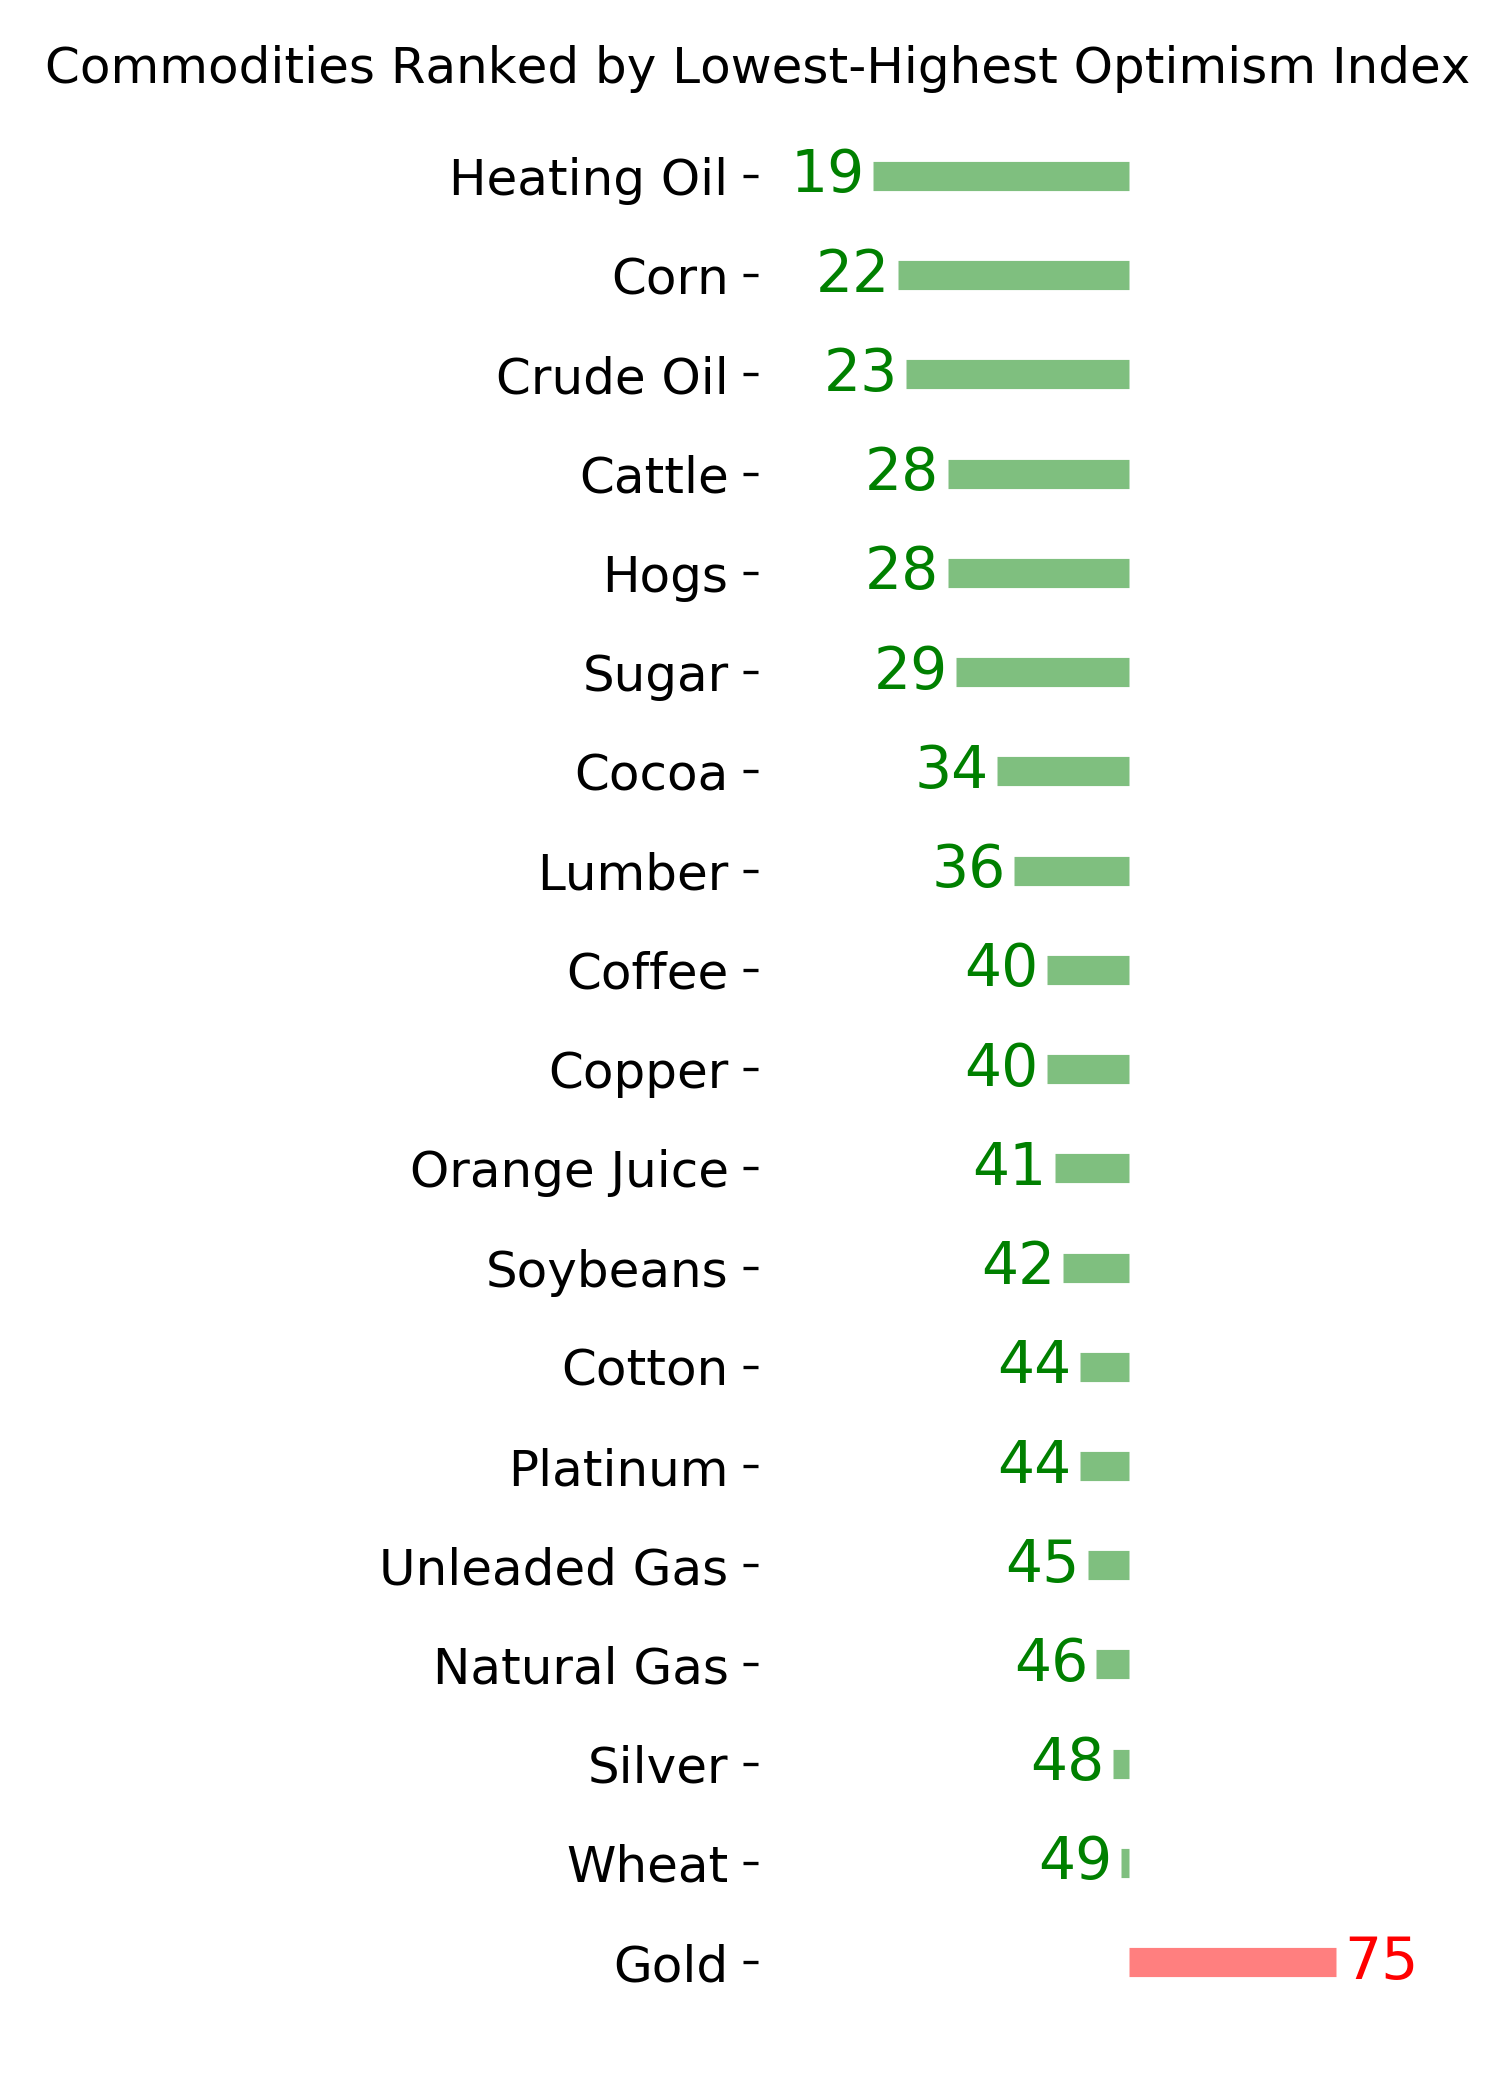
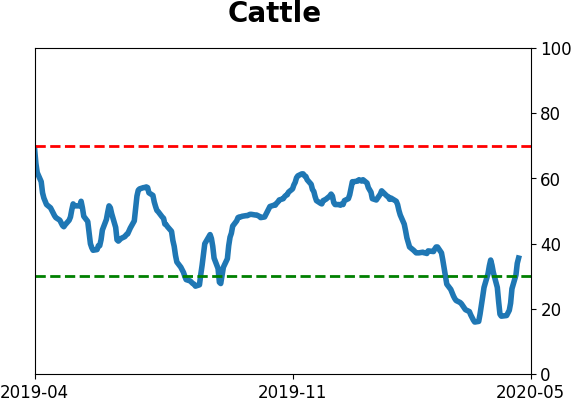
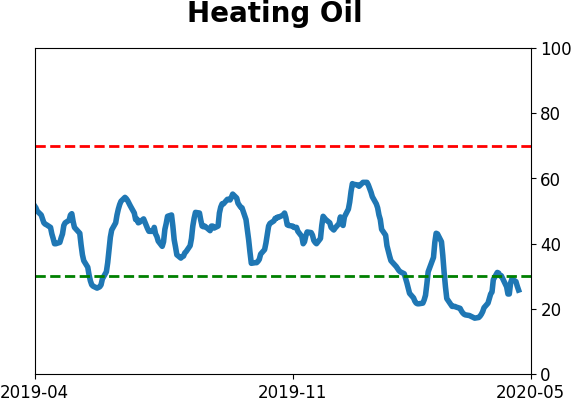
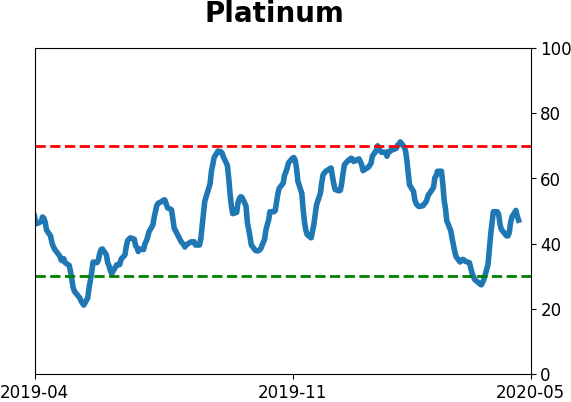
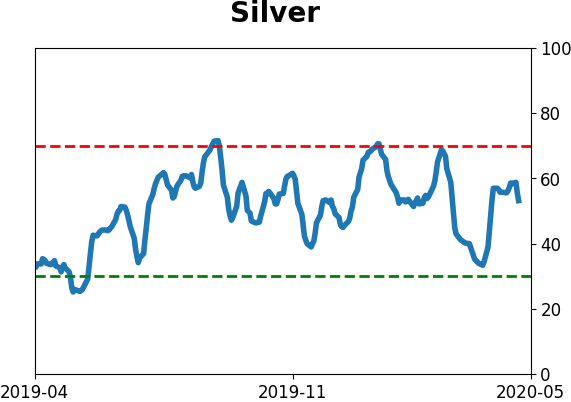
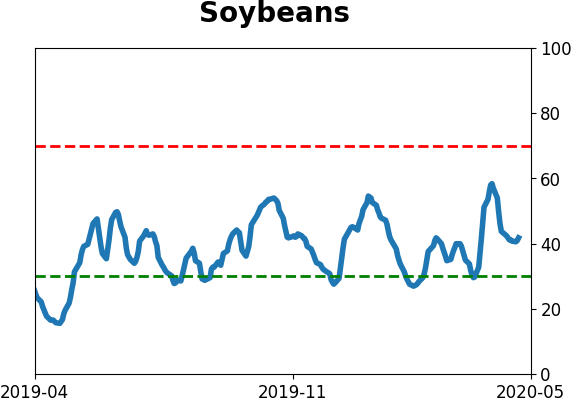
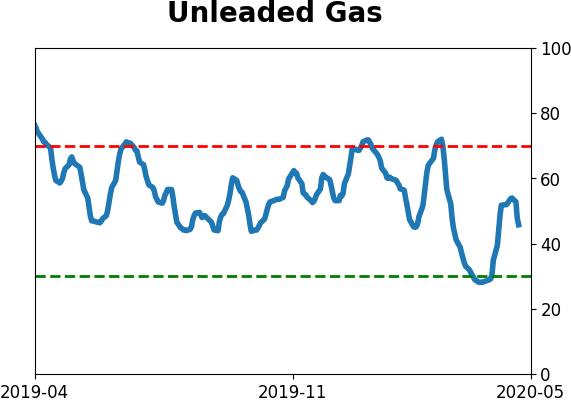
Commodity ETF's - 5-Day Moving Average
|
|