Headlines
|
|
Oil and energy funds suffer record adverse actions:
Exchange-traded products focused on energy companies or crude oil have had a horrid month. Now, fund companies are scrambling to adjust, either undertaking reverse splits or even outright delistings of the funds from major exchanges. This has been a minor contrary indicator in the past.
Underlying momentum has turned negative:
The average sector is now showing a negative McClellan Oscillator. This comes soon after most sectors showed extremely high positive momentum. The first negative momentum reading following a very positive one has tended to lead to well above-average longer-term returns.
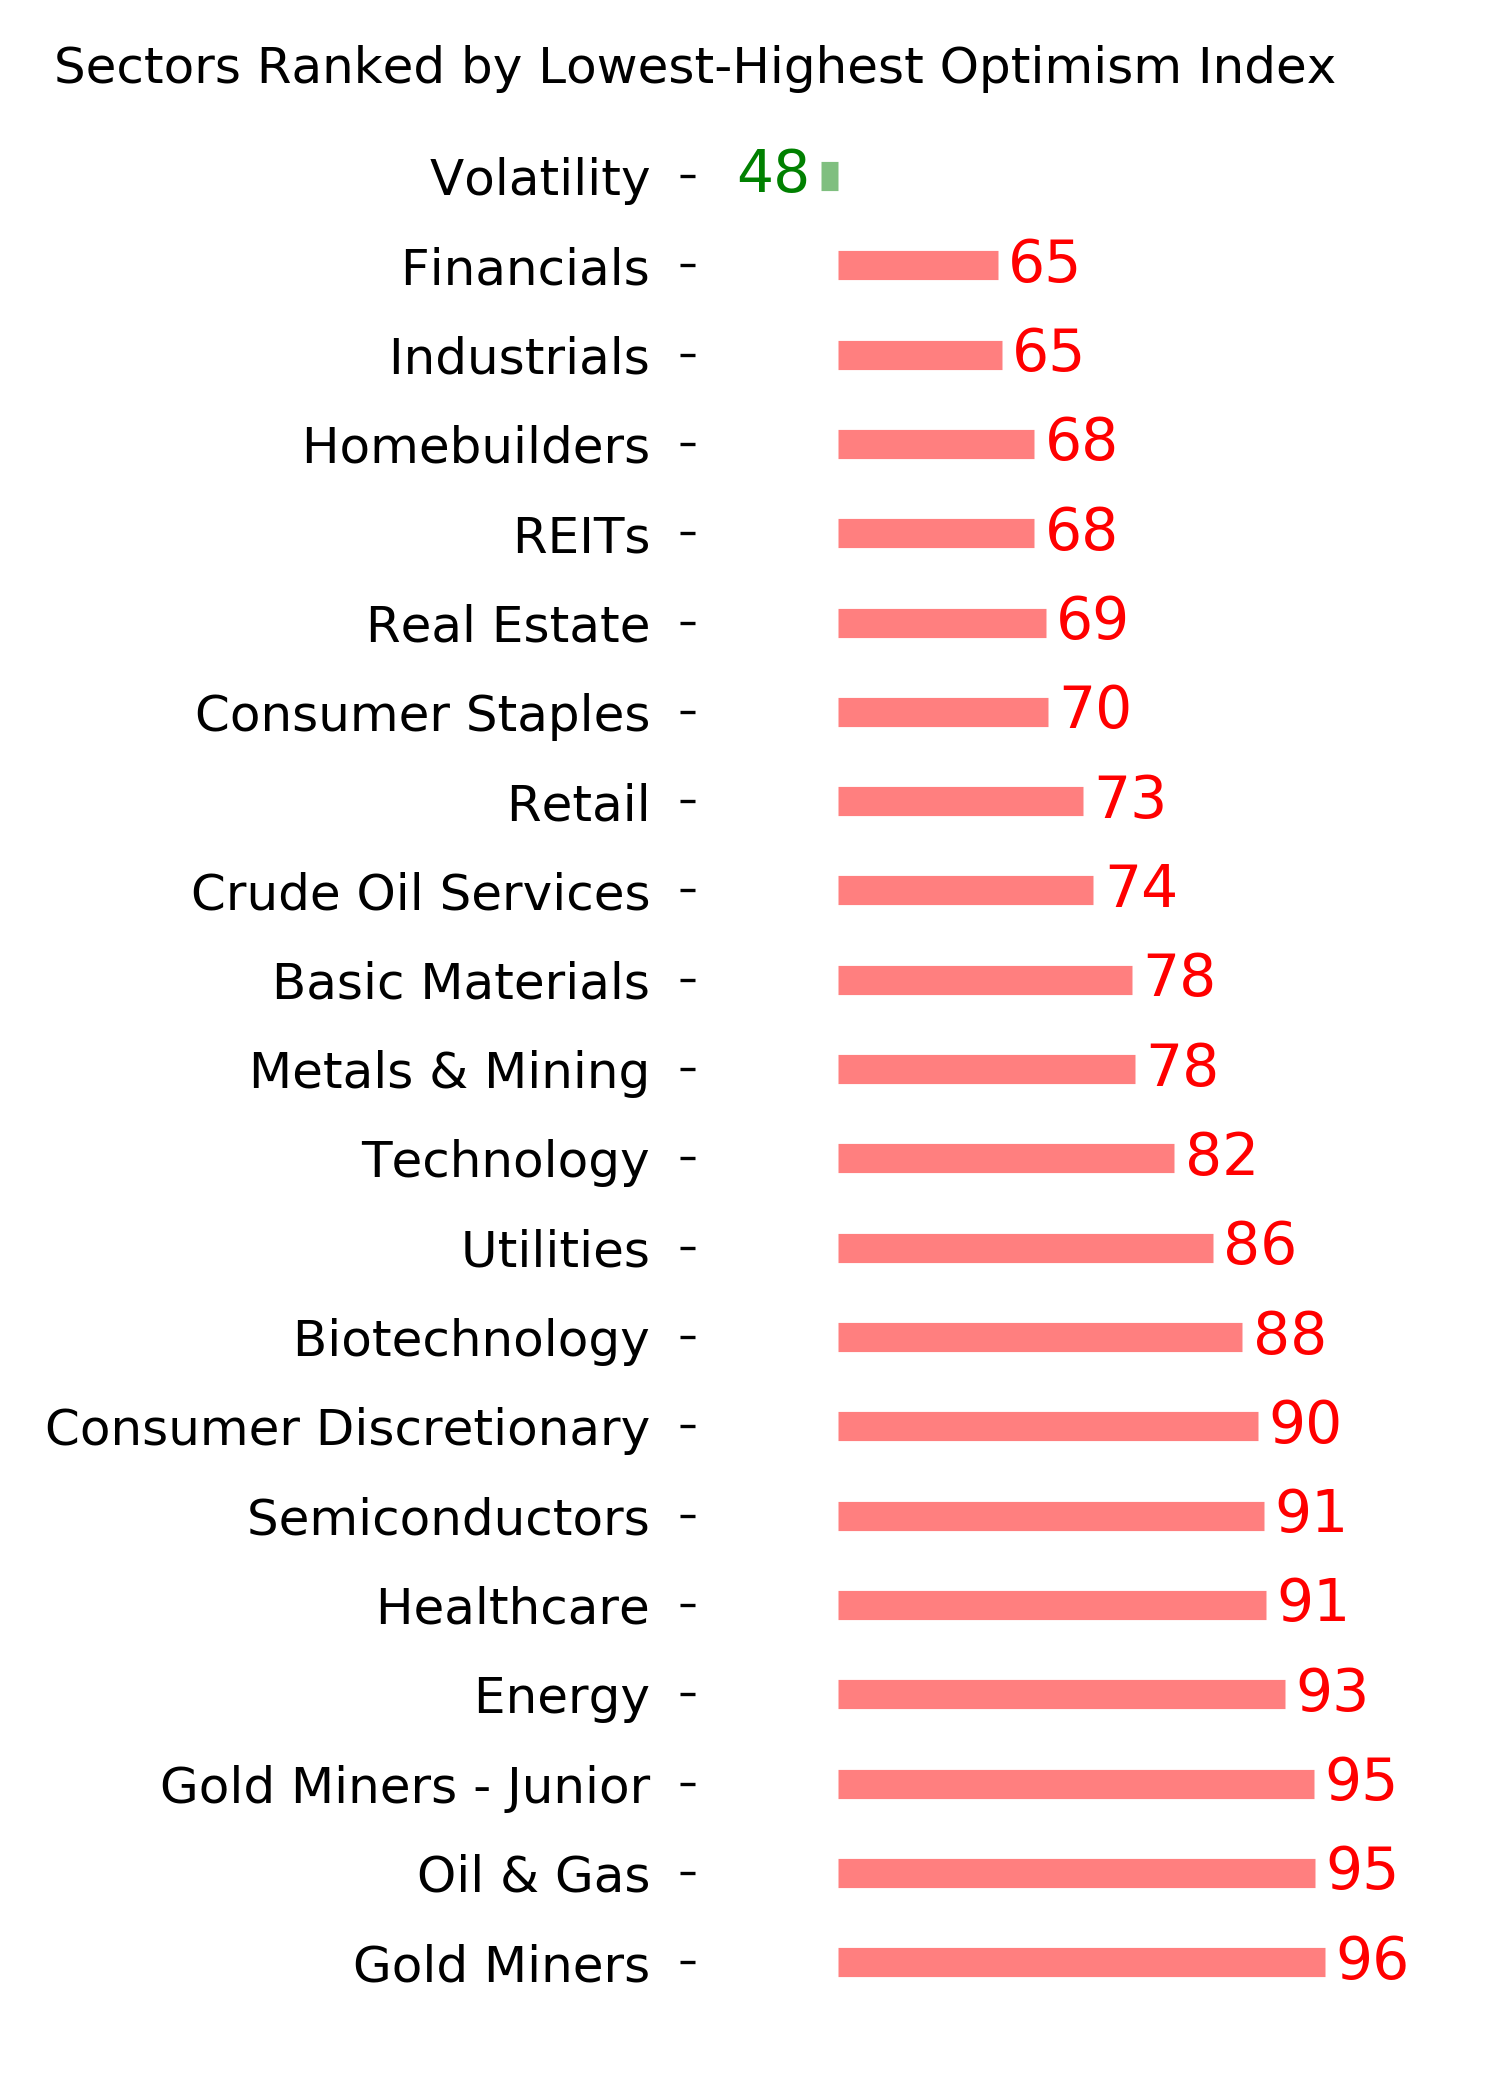
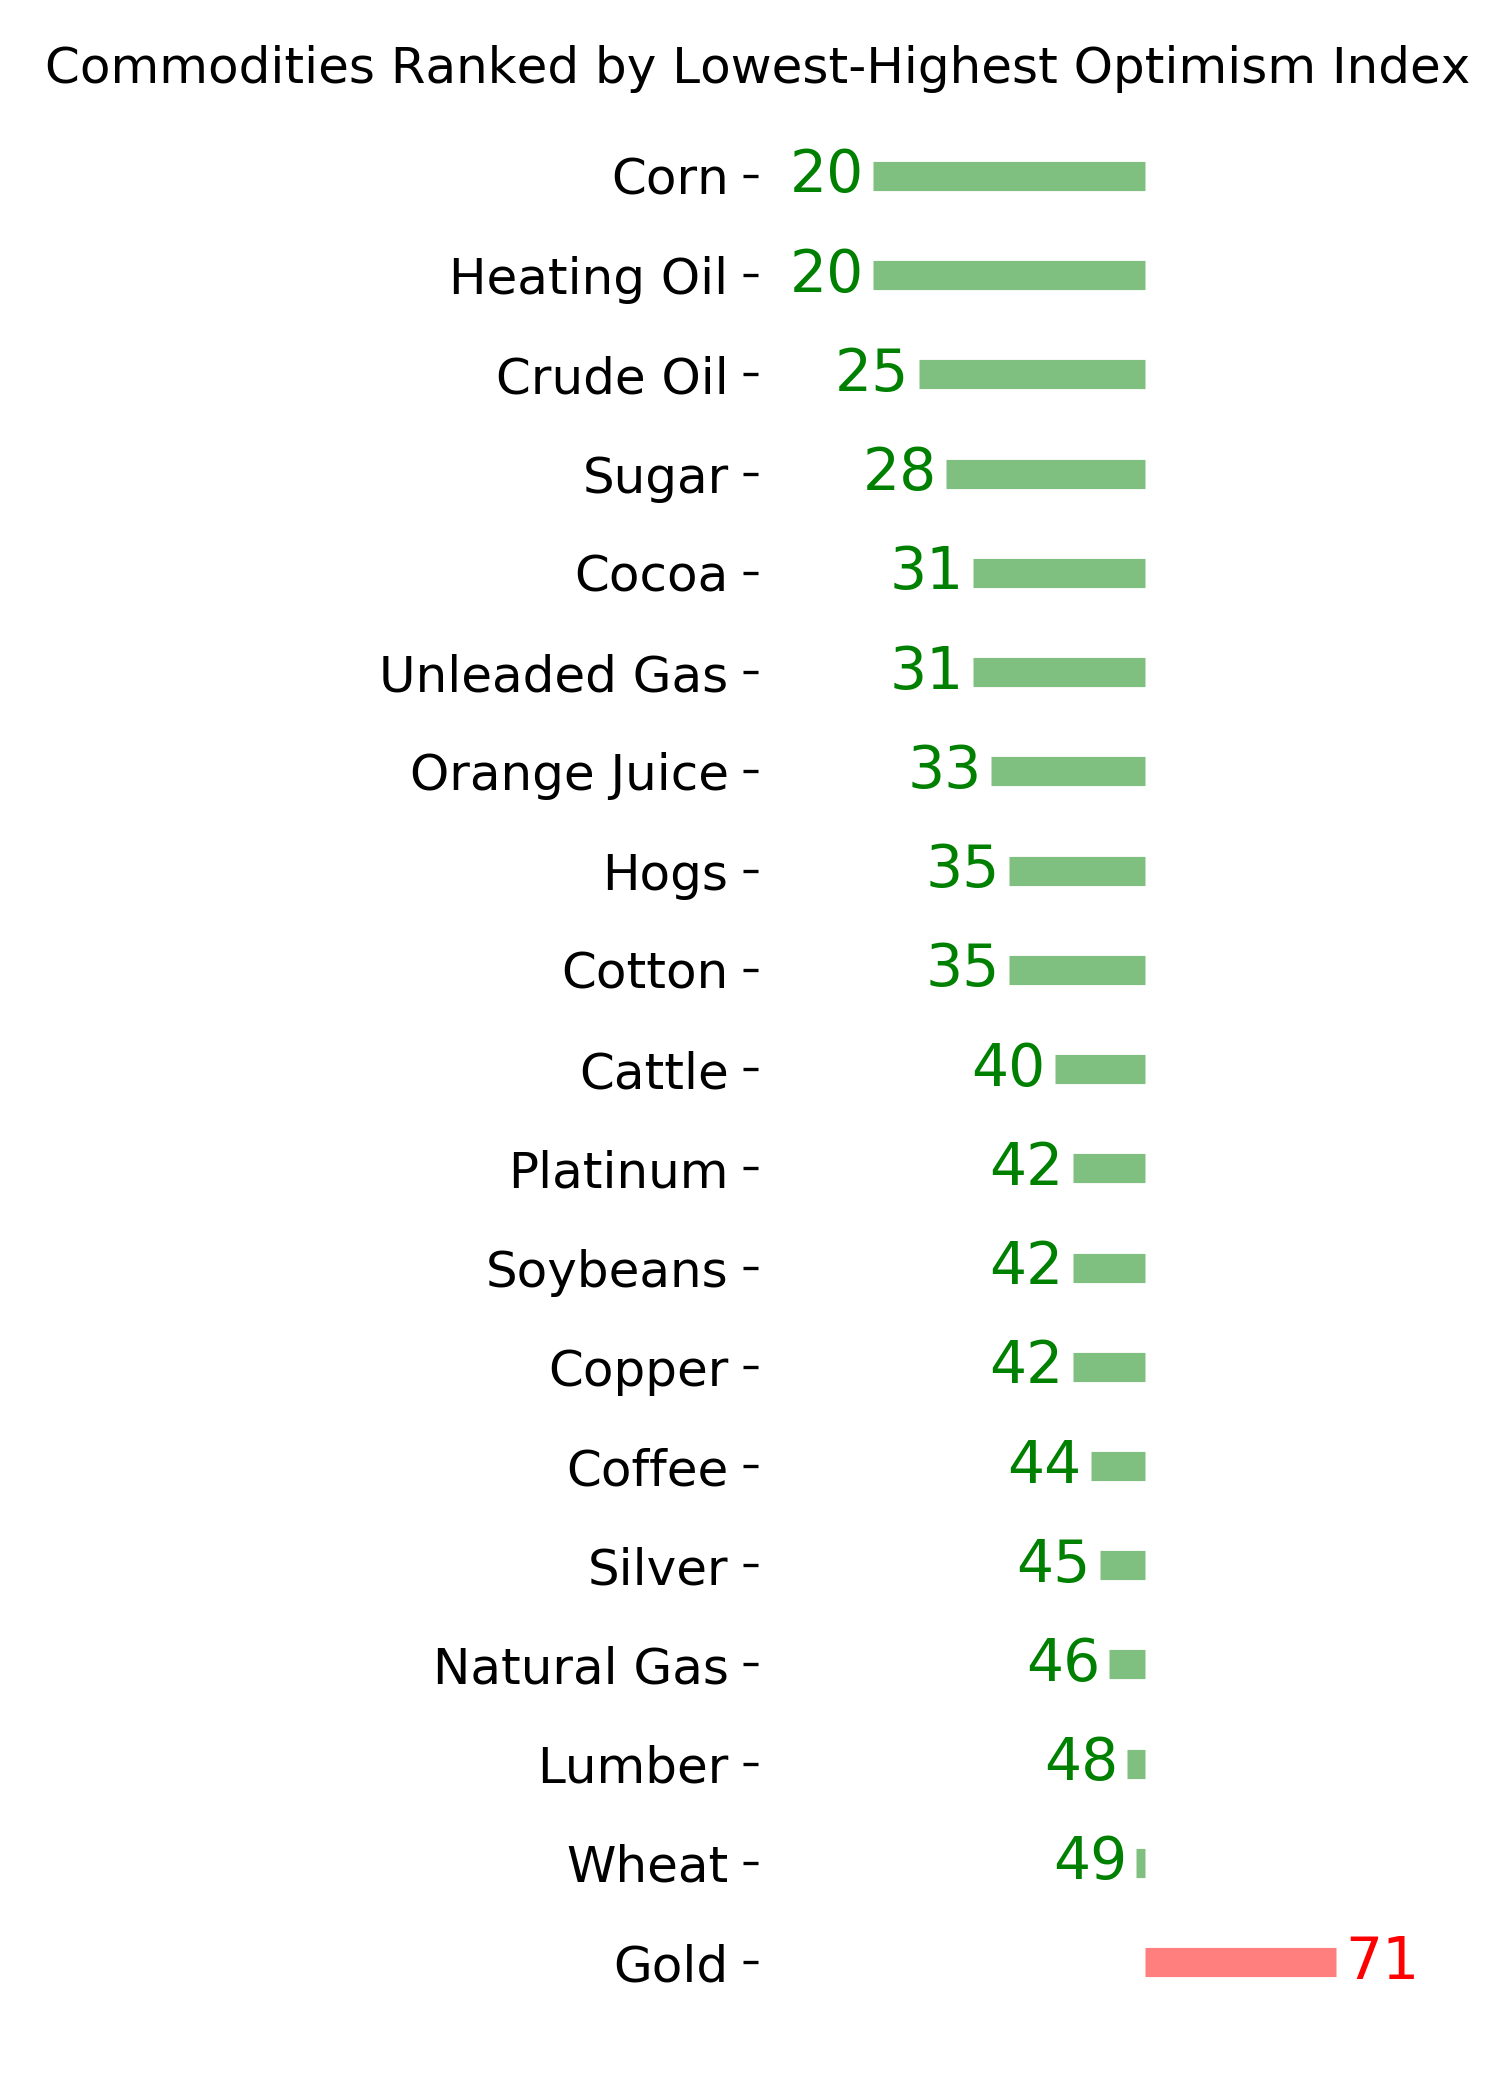
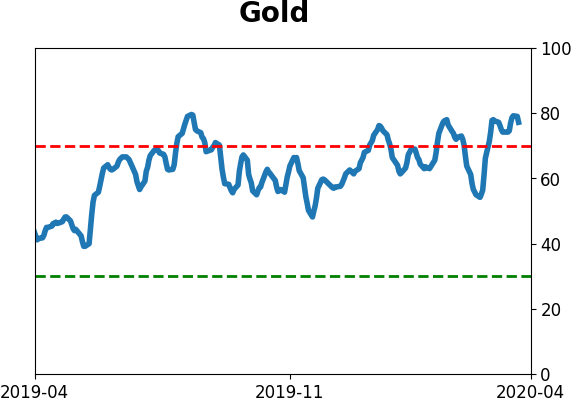
Gold glitters: The 20-day moving average of the Optimism Index for gold has crossed above 75. According to the Backtest Engine, that has happened 21 times over the past 30 years. Of those, 19 of them saw a drop in gold either 1-12 weeks later, even though most of them triggered during the 2000-2010 bull market.
|
Smart / Dumb Money Confidence
|
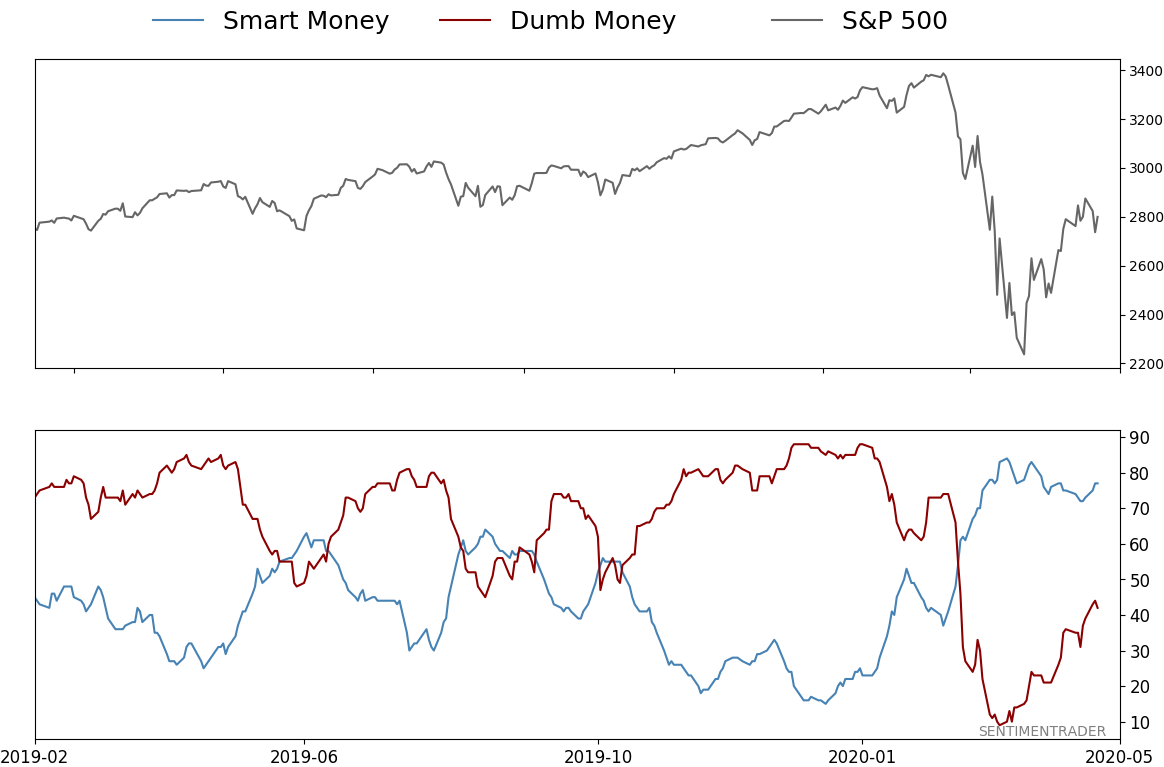
Smart Money Confidence: 77%
Dumb Money Confidence: 42%
|
|
Risk Levels
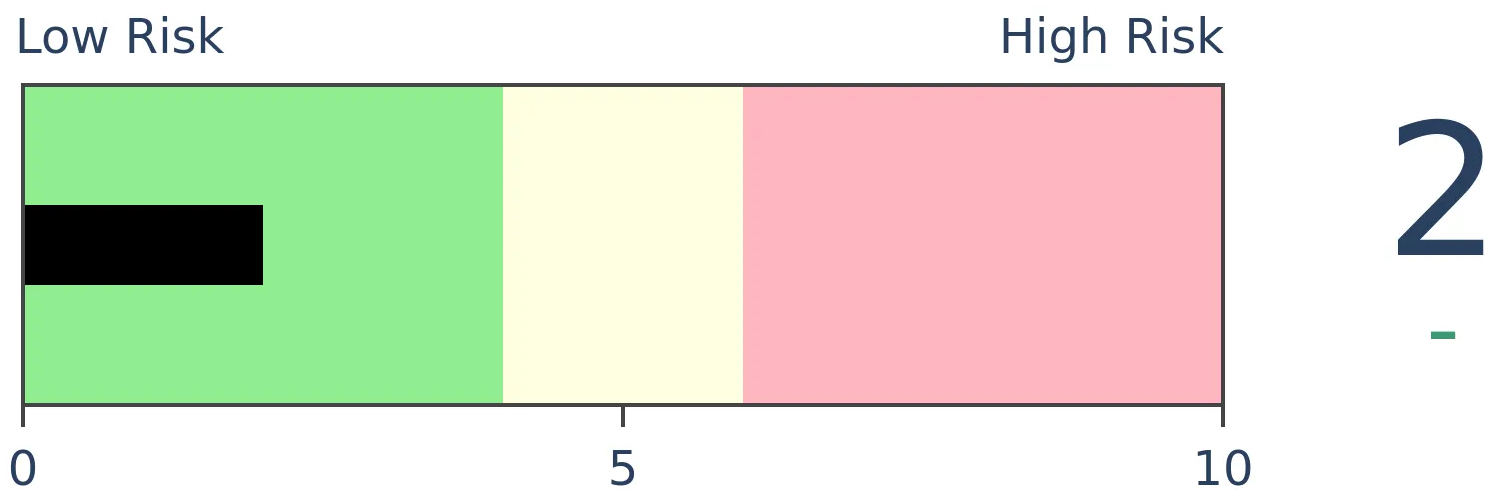
Stocks Short-Term
|
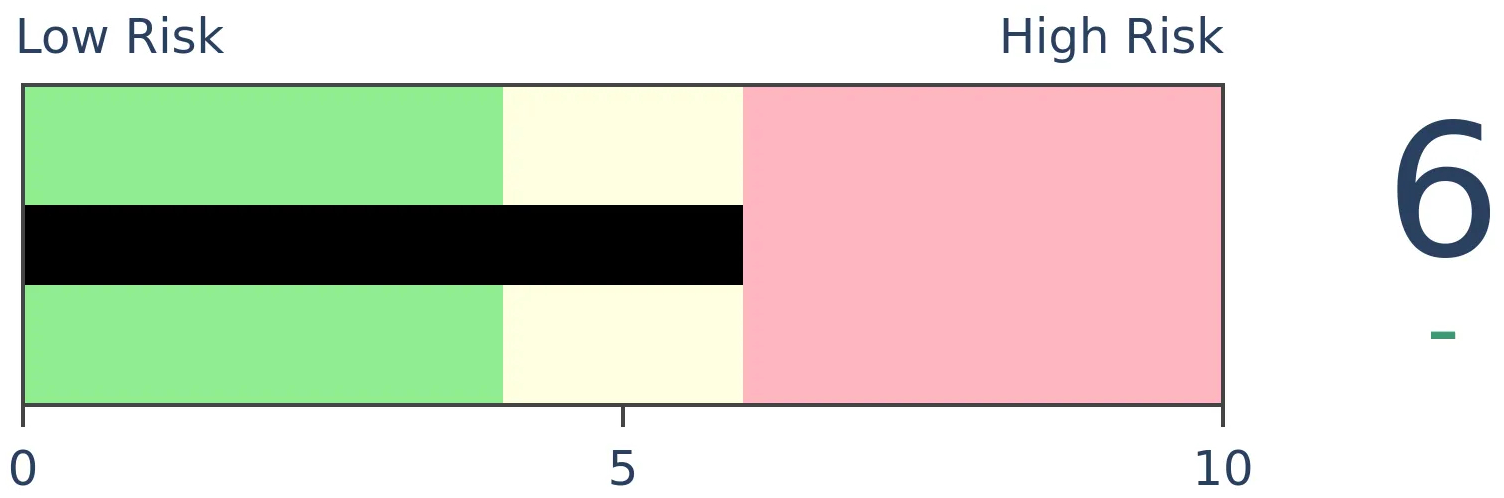
Stocks Medium-Term

|
|
Bonds
|
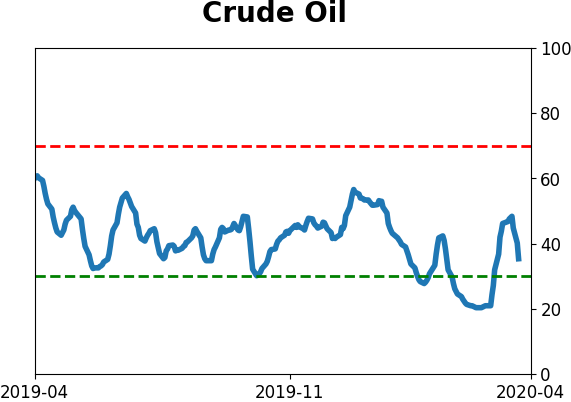
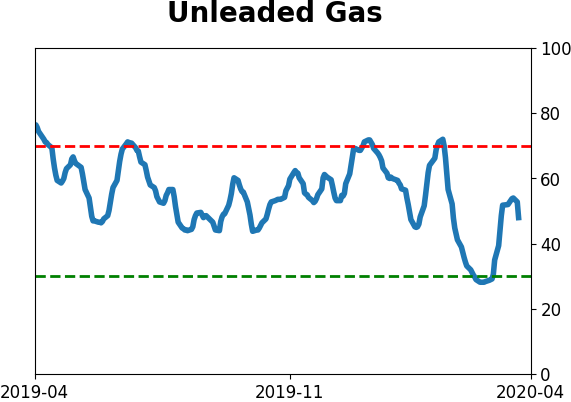
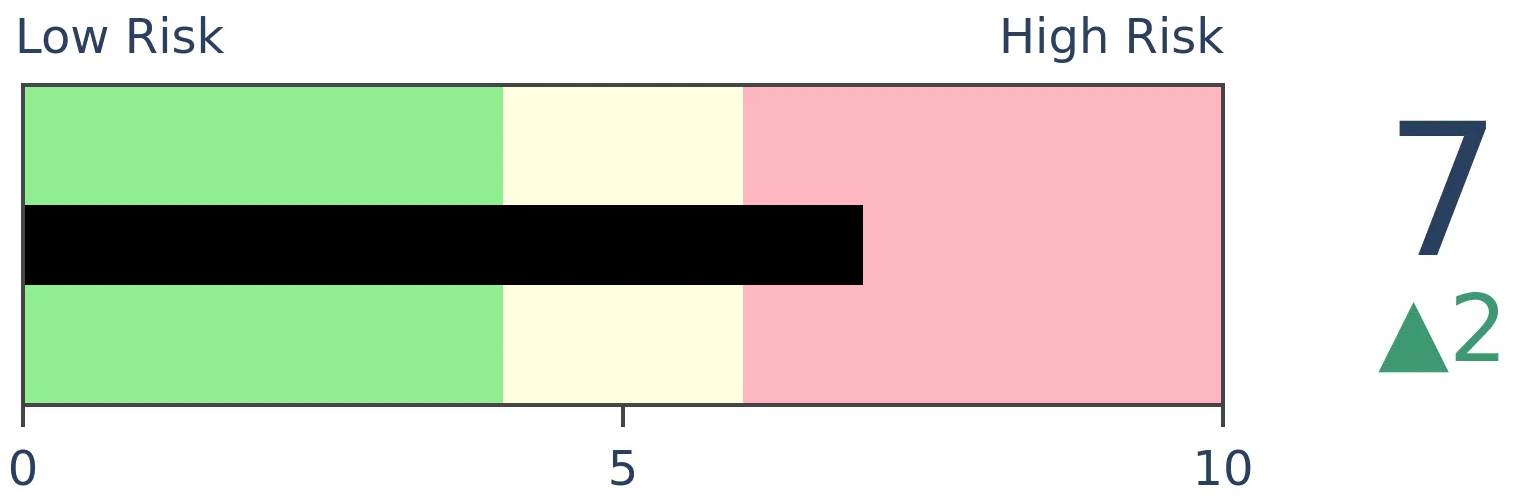
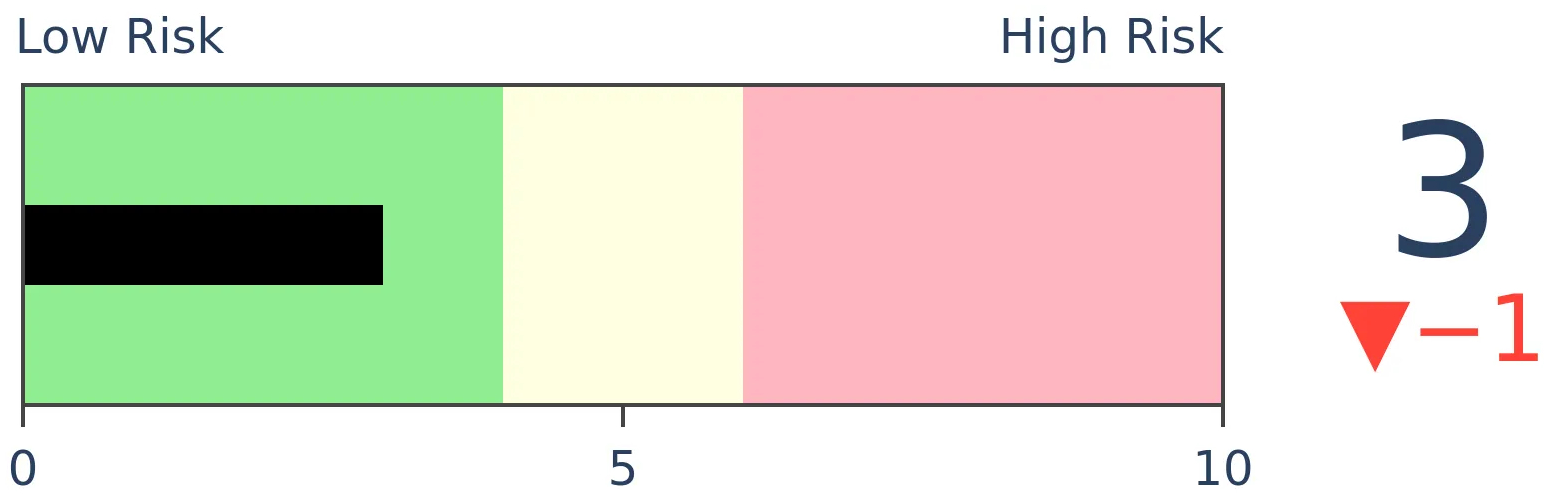
Crude Oil
|
|
Gold
|
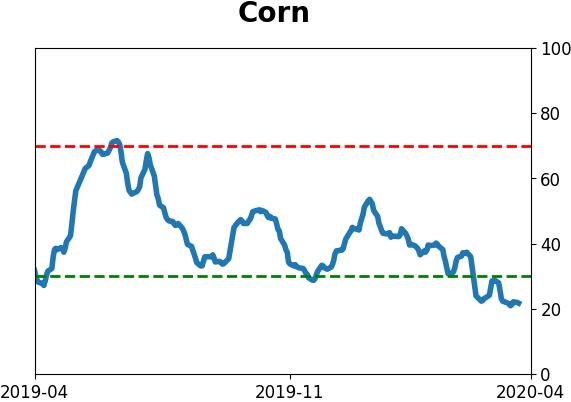
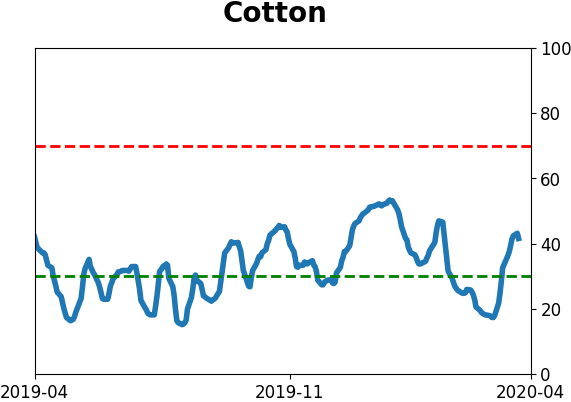
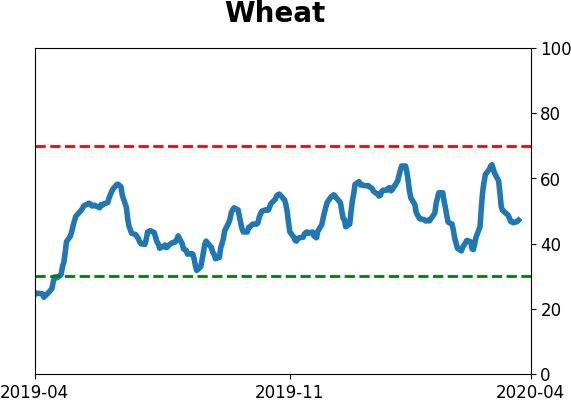
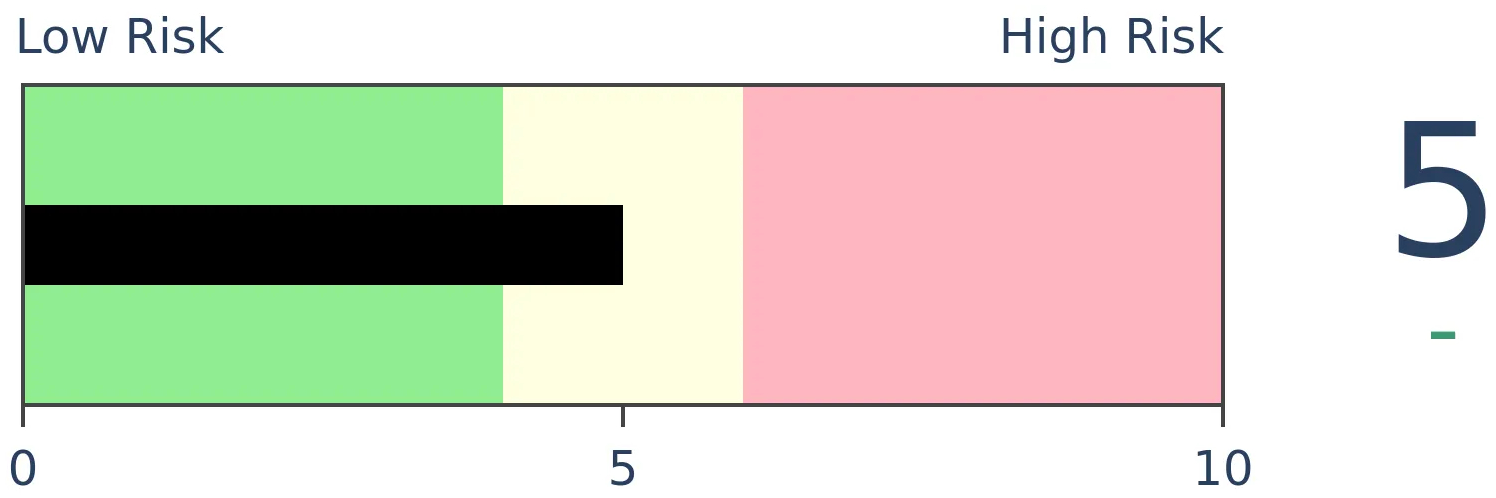
Agriculture
|
|
Research
BOTTOM LINE
Exchange-traded products focused on energy companies or crude oil have had a horrid month. Now, fund companies are scrambling to adjust, either undertaking reverse splits or even outright delistings of the funds from major exchanges. This has been a minor contrary indicator in the past.
FORECAST / TIMEFRAME
None
|
For all the unprecedented action over the past month, nothing beats the moves in oil.
The reasons for front-month oil futures going negative have been well-documented, as have most other aspects of the volatile commodity. One thing that sticks out is the numerous exchange-traded products focused on energy and oil, and how fund companies are reacting.
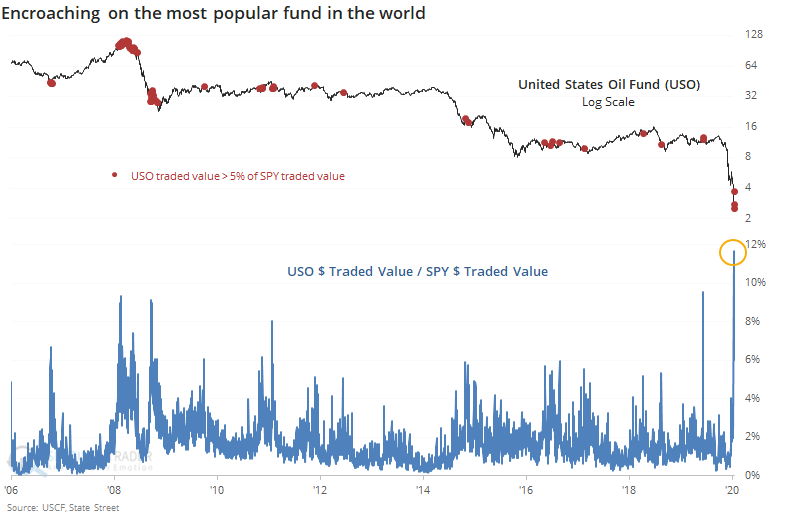
Shares outstanding in the most popular fund, USO, have gone parabolic. While this has triggered the usual round of "this won't end well for mom and pop" kinds of comments, it's not that simple. Every time USO has plunged, shares outstanding have skyrocketed, a combination of buy-the-dippers and short-sellers scrambling to trade the fund. The chart below uses a log scale for both USO and its shares.
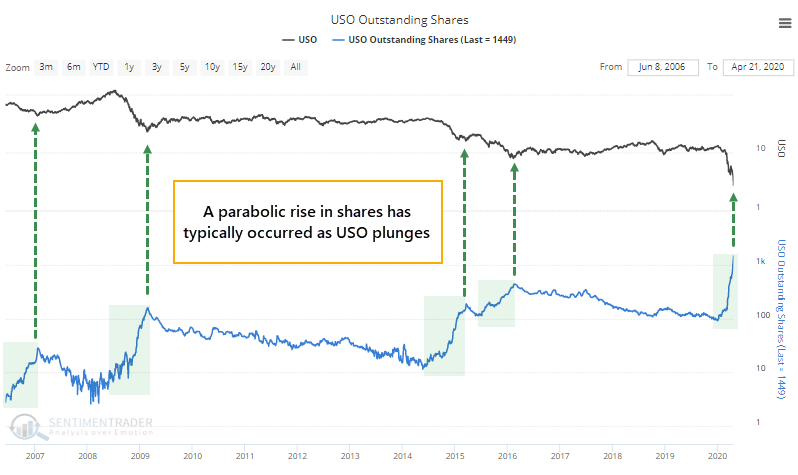
The turnover in the fund has been remarkable. In recent days, the dollar value of shares traded in USO has hit a record relative to the most popular fund in the world. Other times it exceeded 5% of the value of shares traded in SPY roughly equated with turning points, but it was not very consistent.
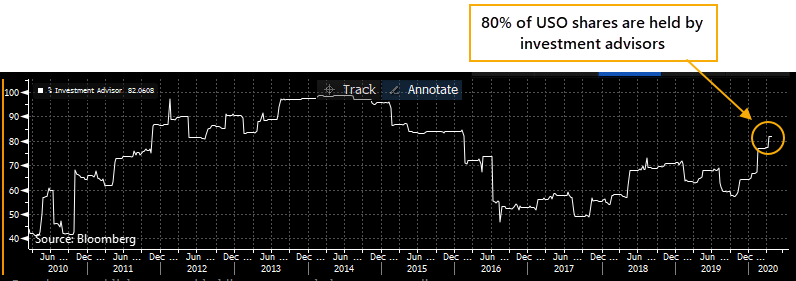
It's not just mom and pop, though. While underlying ownership is sometimes hard to decipher, more than 80% of USO's outstanding shares are held by investment advisors, up from less than 60% last fall.
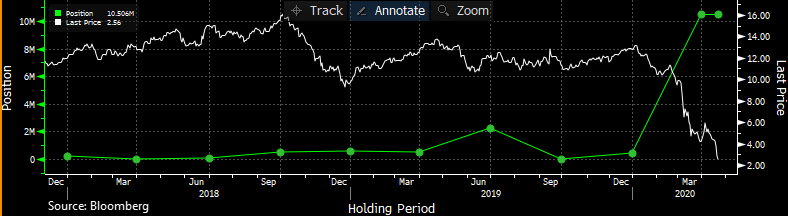
Among those advisors, the biggest holder is XR Securities, which made a dramatic increase to its position in the latest quarter, for what that's worth.
It's been a heck of a ride for some of the other funds, too, especially if they're leveraged. That has triggered a rash of corporate actions like reverse splits or even outright delistings, just this month alone.
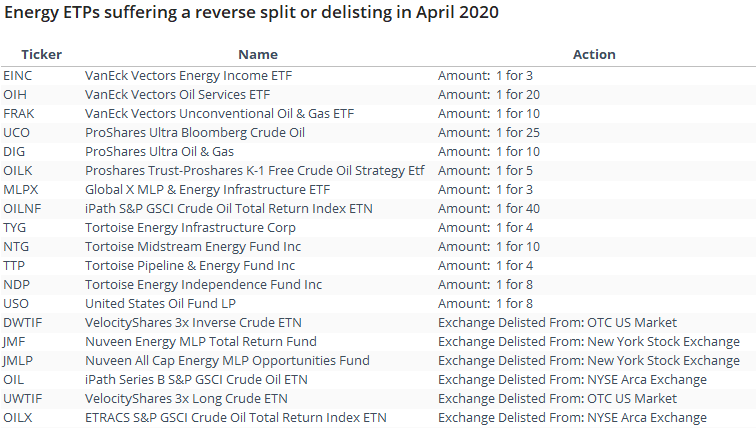
Cumulatively since the year 2000, nearly 160 of these funds have suffered an adverse corporate action, meaning either a reverse split or a delisting.
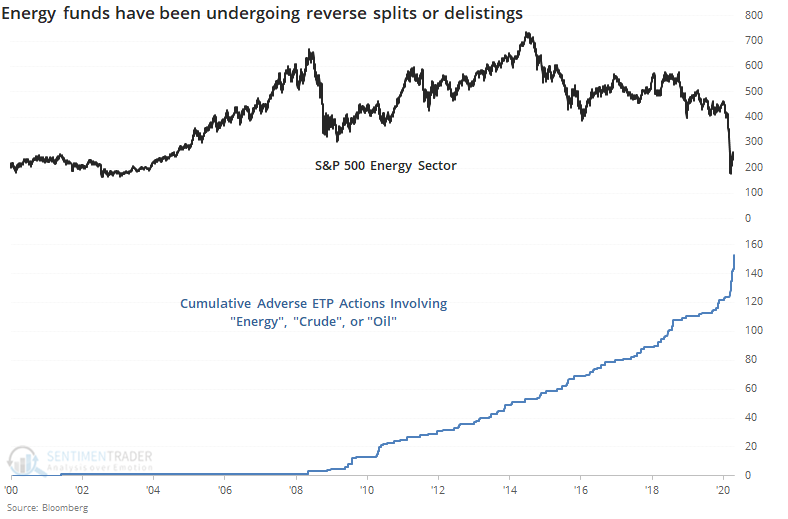
It seems like this should be an excellent contrary sign, but the record has been mixed.
If we compare the ETP actions to crude oil itself, it's even less consistent.
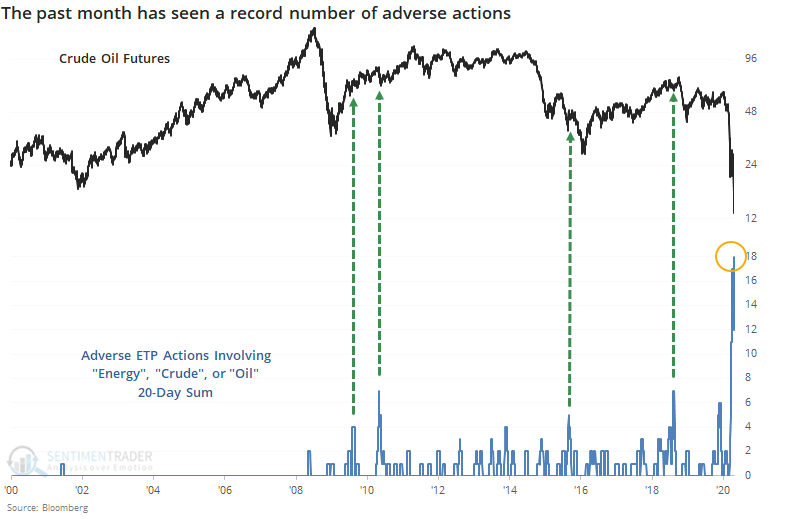
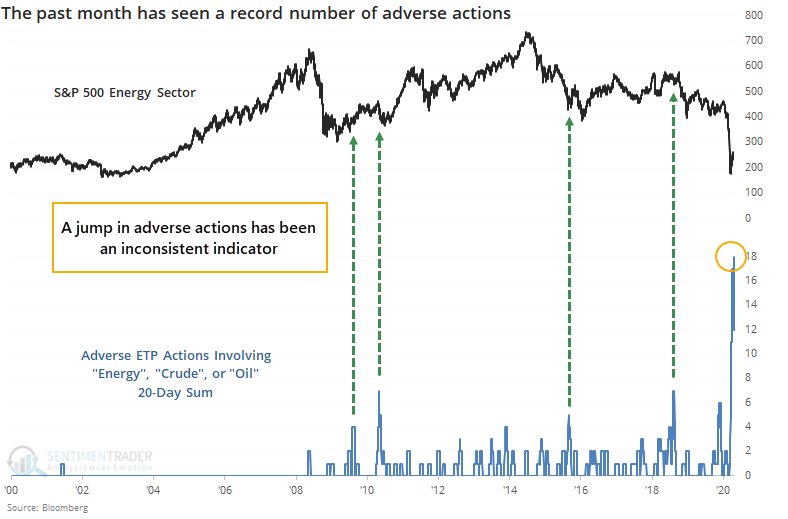
We haven't seen anything like the past month in oil, and the adverse fund actions reflect that. Over the past 20 days, the surge in funds going through either a reverse split or delisting is nearly 3 times the next-greatest spike since these funds' inceptions.
It seems like this recent bout of actions should be a sign that volatility has become so great, and pessimism so prevalent, that it's bullish for the energy sector. We could say that generally, that's the case, including other times we've seen it in other markets, but it's not a slam-dunk signal, and often takes a long time to play out.
BOTTOM LINE
The average sector is now showing a negative McClellan Oscillator. This comes soon after most sectors showed extremely high positive momentum. The first negative momentum reading following a very positive one has tended to lead to well above-average longer-term returns.
FORECAST / TIMEFRAME
SPY -- Up, Long-Term
|
Momentum is ebbing, in the major indexes and below the surface.
One of the better gauges for this is the McClellan Oscillator. Most of the major sectors are now showing a negative Oscillator.
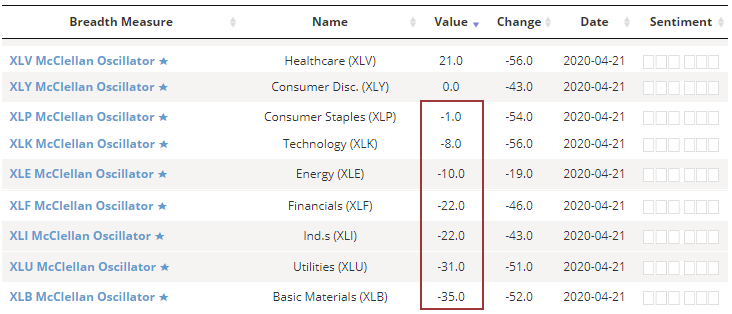
The negative readings come soon after most of them saw big positive momentum. On average, the sector Oscillators were recently above +100.
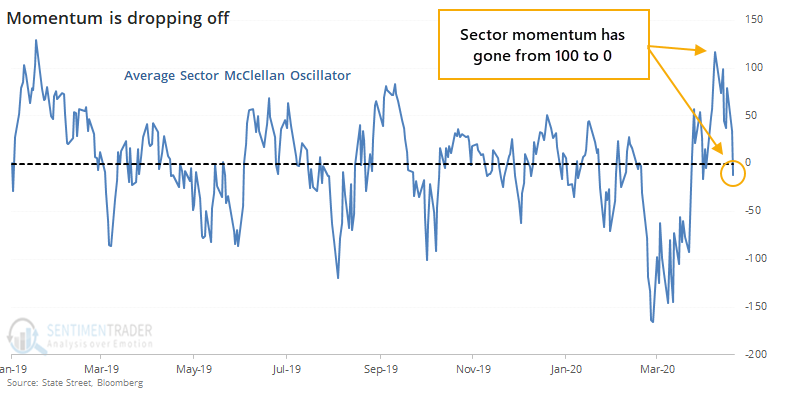
This is the quickest cycle from extremely positive to negative momentum since 2013. Below, we can see every time since 1990 when the average Oscillator for sectors was higher than 100, then dropped into negative territory.
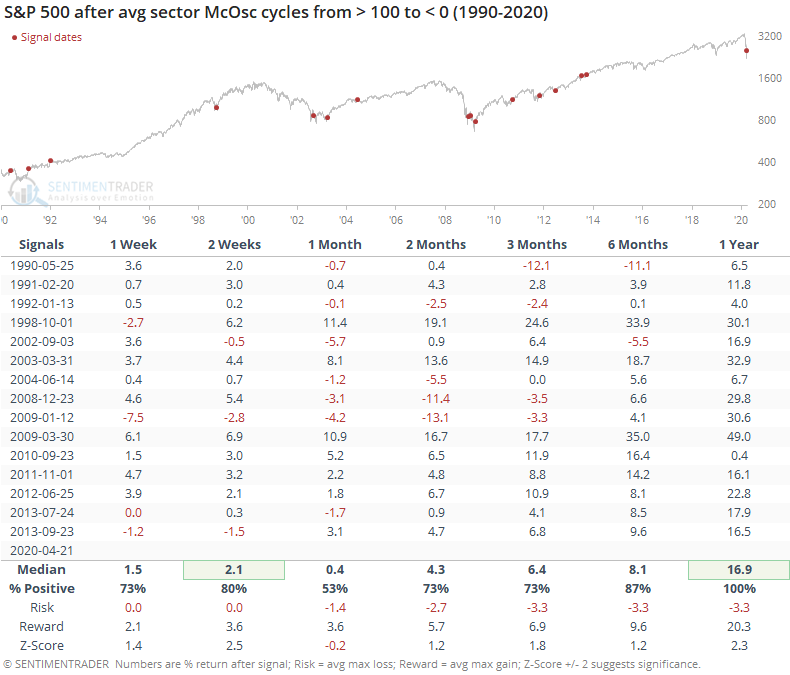
There was some choppiness over the next month or so, but with a positive bias. Over the next 6-12 months, returns were heavily skewed to the upside.
In a premium note, Troy showed that the Oscillator for the entire NYSE has dropped into negative territory, too. Similar to what Troy did, if look for the first sub-zero reading in the Oscillator following a surge above +100, then we get the following. The "# Days" column shows how long it took to cycle from above 100 to below zero.
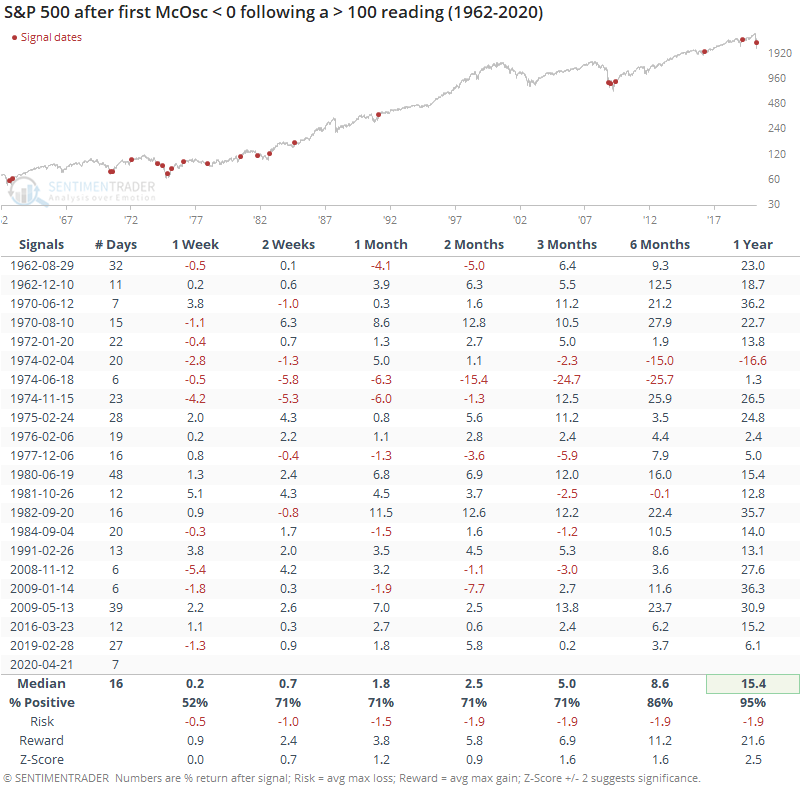
Returns were mostly good, especially longer-term. What sticks out in the table is that this has been one of the fastest cycles from very positive to negative momentum, taking only 7 sessions.
So, let's filter the table to include only those instances when the cycle took less than a month.
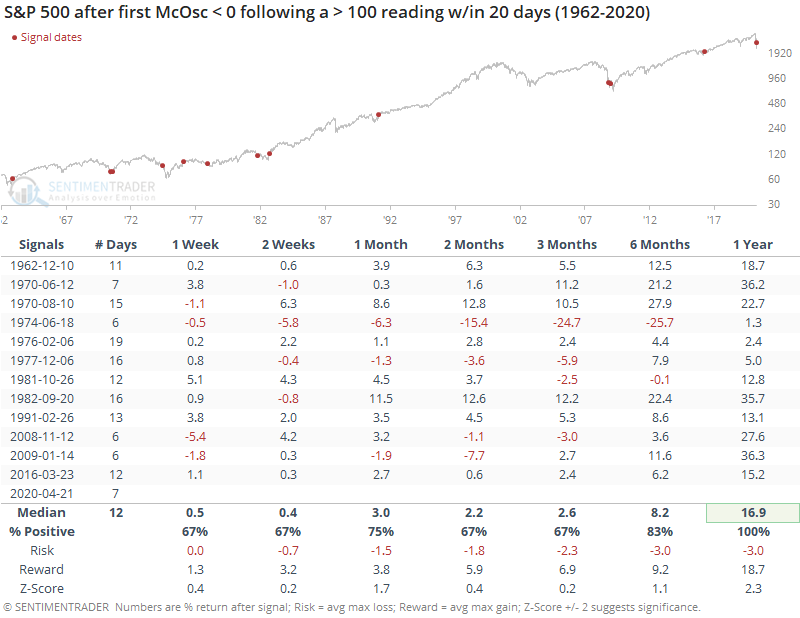
Here, there was a perfect record a year later. We should always be suspect of "perfect" results, especially with relatively small sample sizes, but it confirms what we often see - bouts of extremely positive momentum that turn negative might lead to choppy shorter-term returns, but almost always lead to significantly positive longer-term ones.
There are some reasons to be wary of the recent rally, including the idea that the "right" sectors haven't been leading, but ebbing momentum is not one of those reasons. When we see a positive thrust as we did, the first bout of negative readings usually doesn't imply a longer-term rollover.
Active Studies
| Time Frame | Bullish | Bearish | | Short-Term | 0 | 3 | | Medium-Term | 11 | 0 | | Long-Term | 33 | 3 |
|
Indicators at Extremes
Portfolio
| Position | Weight % | Added / Reduced | Date | | Stocks | 60.2 | Reduced 13% | 2020-04-20 | | Bonds | 0.0 | Reduced 6.7% | 2020-02-28 | | Commodities | 5.2 | Added 2.4%
| 2020-02-28 | | Precious Metals | 0.0 | Reduced 3.6% | 2020-02-28 | | Special Situations | 0.0 | Reduced 31.9% | 2020-03-17 | | Cash | 34.6 | | |
|
Updates (Changes made today are underlined)
In the first months of the year, we saw manic trading activity. From big jumps in specific stocks to historic highs in retail trading activity to record highs in household confidence to almost unbelievable confidence among options traders. All of that came amid a market where the average stock couldn't keep up with their indexes. There were signs of waning momentum in stocks underlying the major averages, which started triggering technical warning signs in late January. The kinds of extremes we saw in December and January typically take months to wear away, but the type of selling in March went a long way toward getting there. When we place the kind of moves we saw into March 23 into the context of coming off an all-time high, there has been a high probability of a multi-month rebound. After stocks bottomed on the 23rd, they enjoyed a historic buying thrust and retraced a larger amount of the decline than "just a bear market rally" tends to. While other signs are mixed that panic is subsiding, those thrusts are the most encouraging sign we've seen in years. Shorter-term, there have been some warning signs popping up and our studies have stopped showing as positively skewed returns. I reduced my exposure some on Monday and considered further reducing it when we dropped below the mid-week lows from last week, but we're still holding above last Monday's lows on SPY, so holding for now.
RETURN YTD: -10.6% 2019: 12.6%, 2018: 0.6%, 2017: 3.8%, 2016: 17.1%, 2015: 9.2%, 2014: 14.5%, 2013: 2.2%, 2012: 10.8%, 2011: 16.5%, 2010: 15.3%, 2009: 23.9%, 2008: 16.2%, 2007: 7.8%
|
|
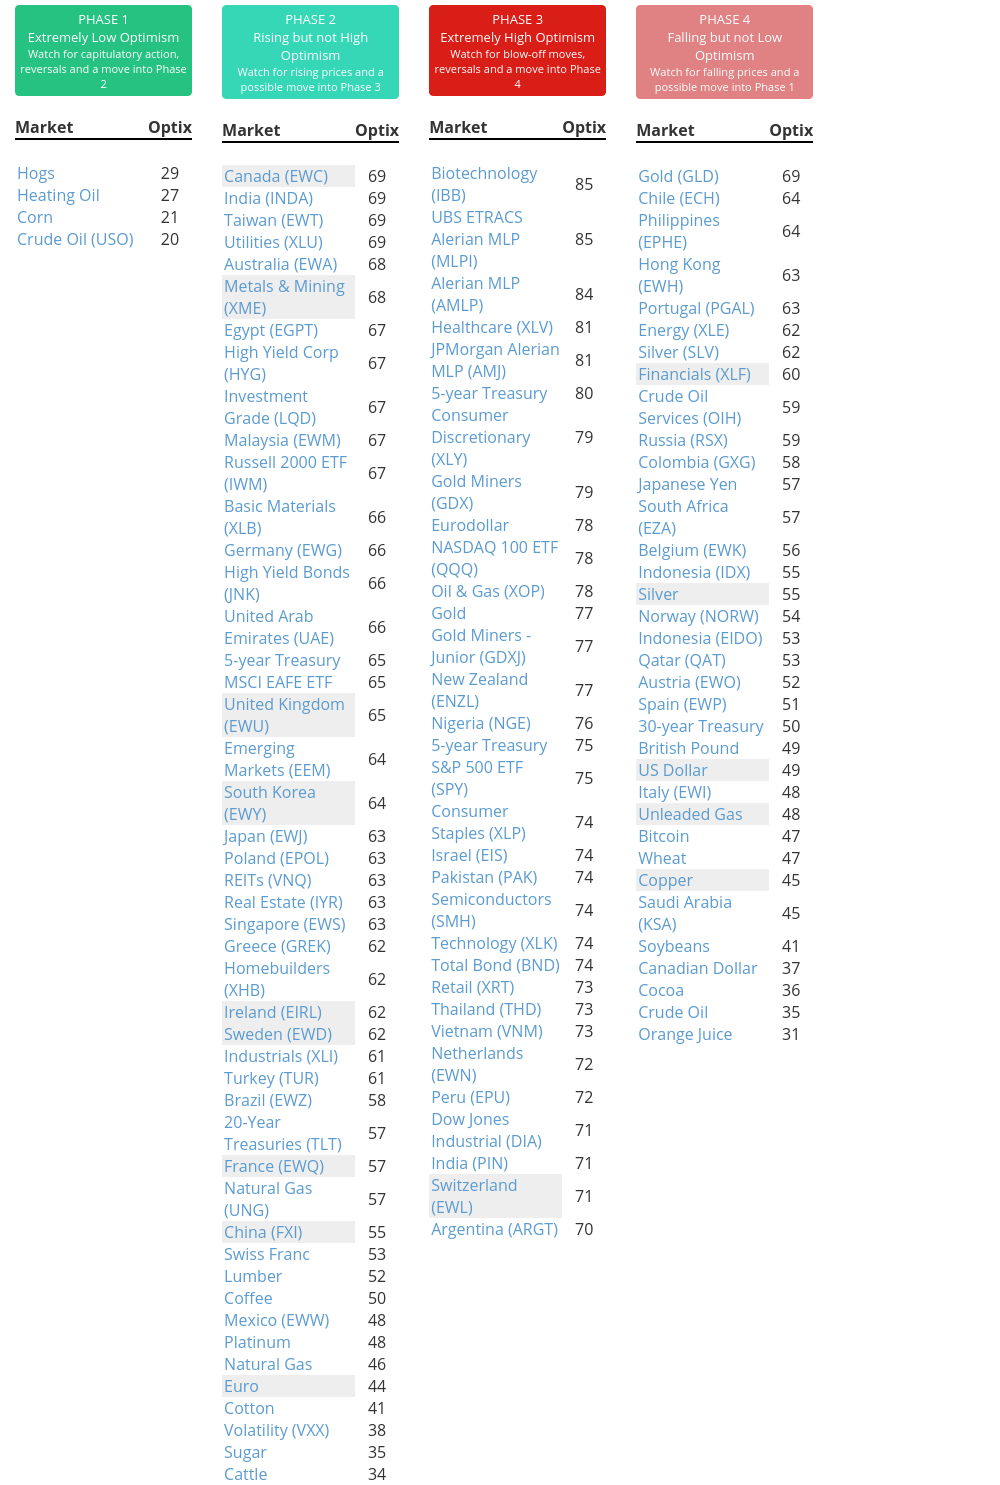
Phase Table
Ranks
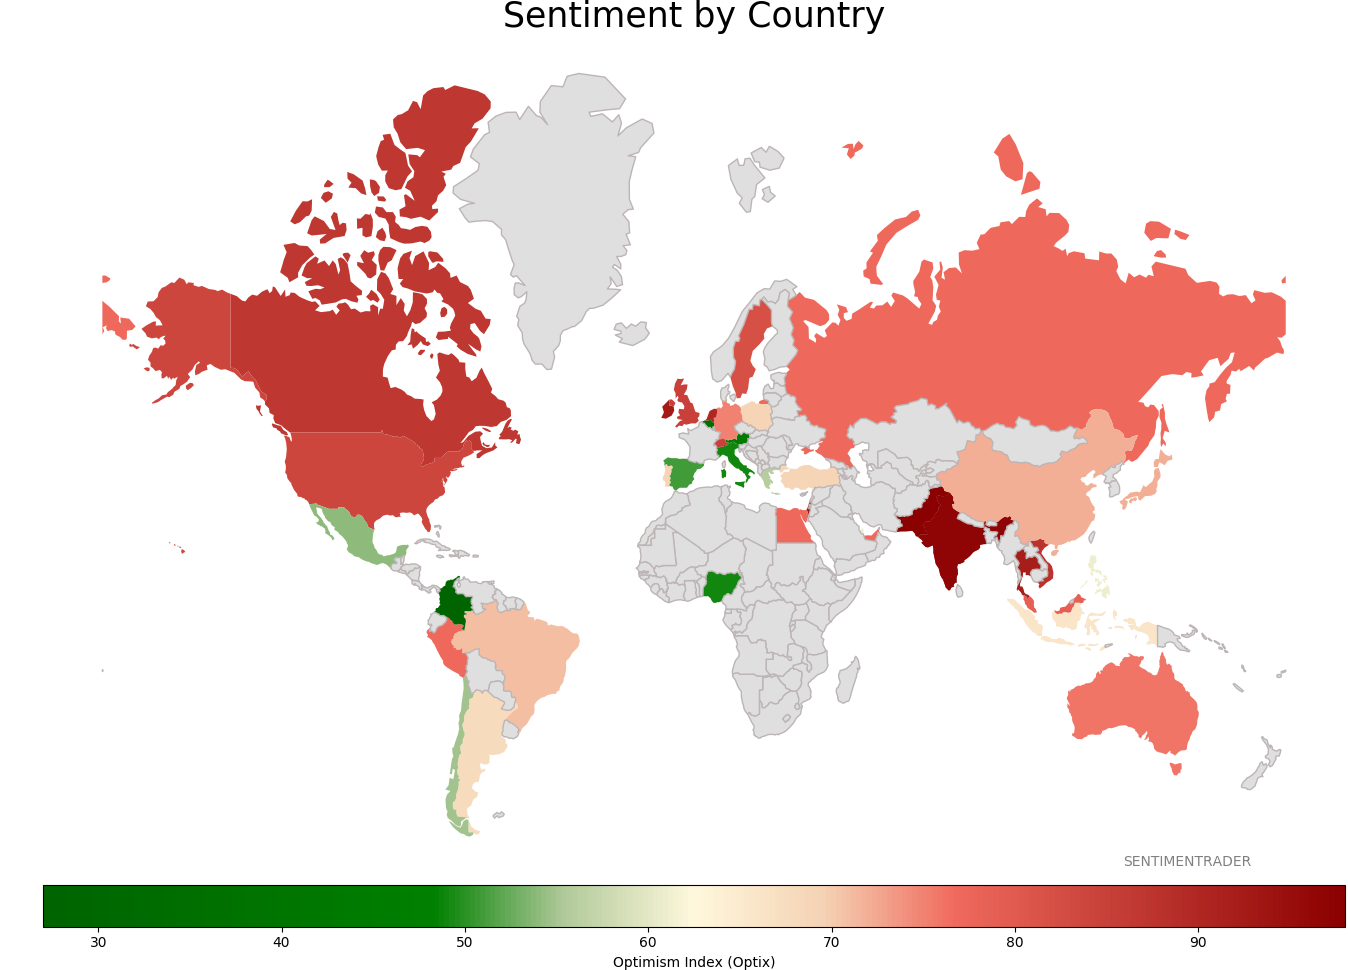
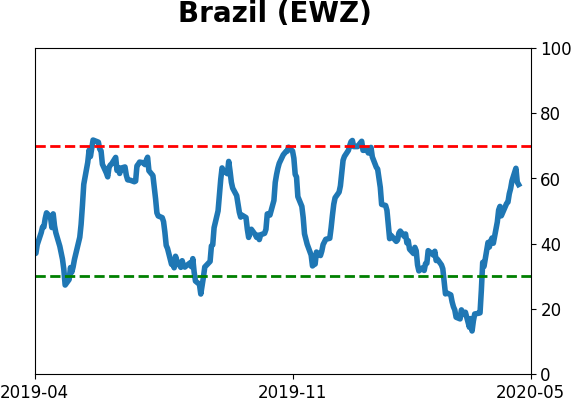
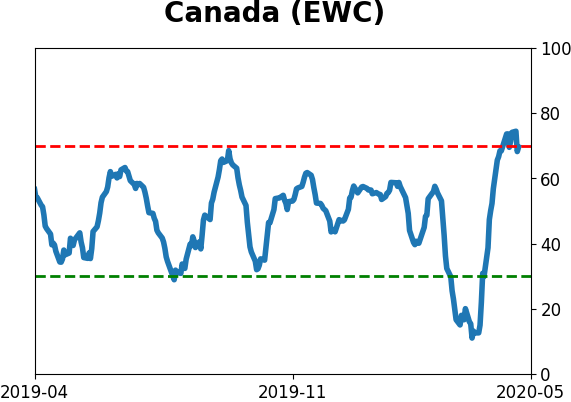
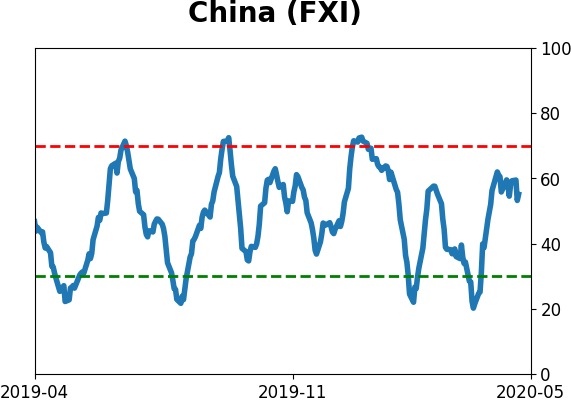
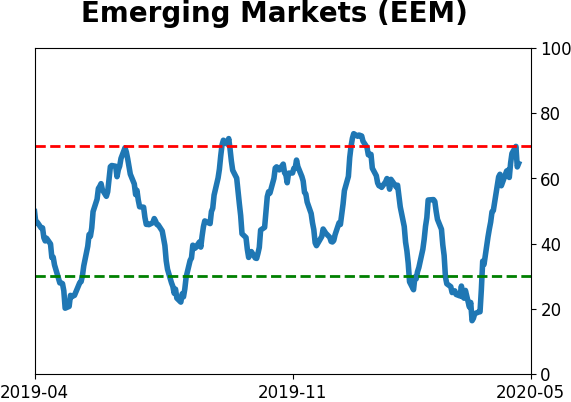
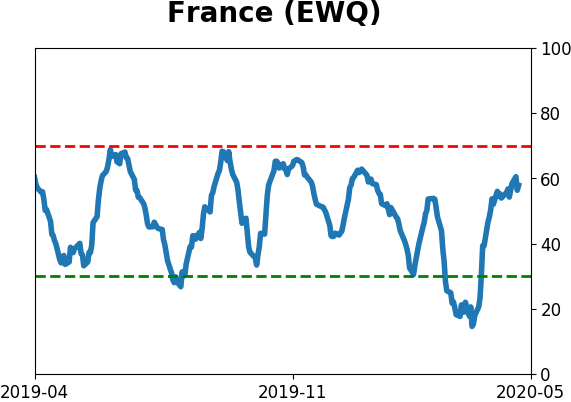
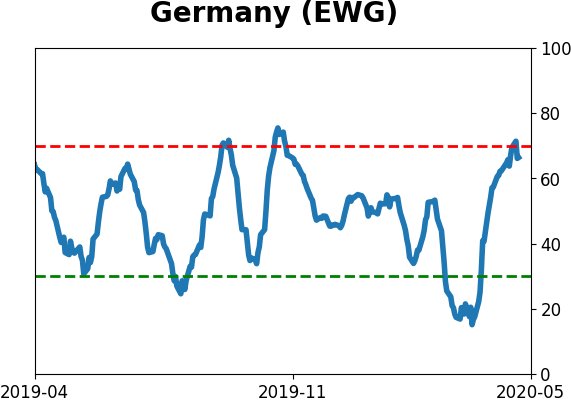
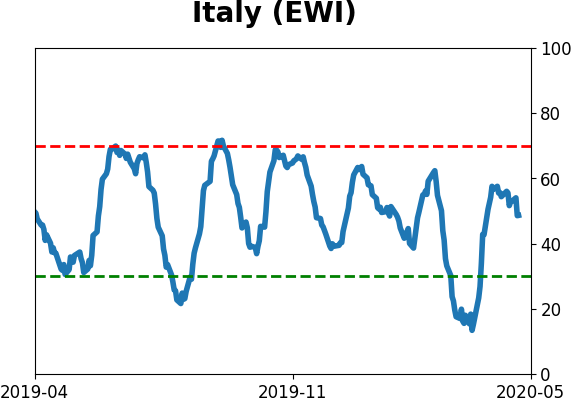
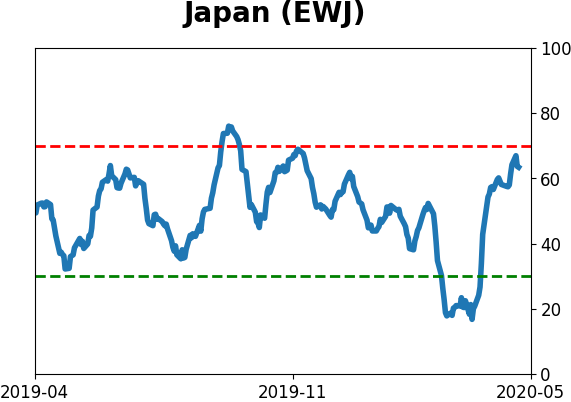
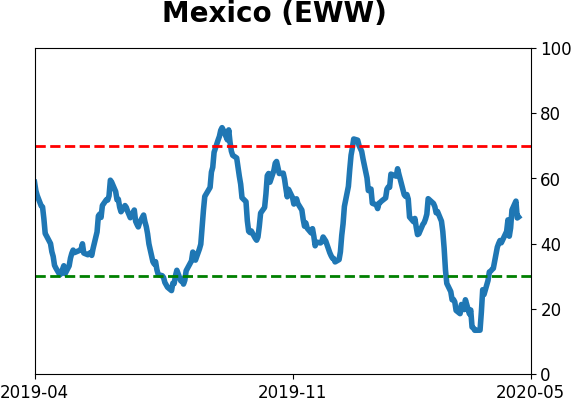
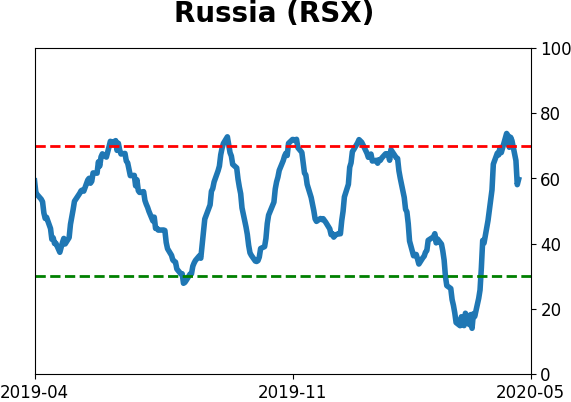
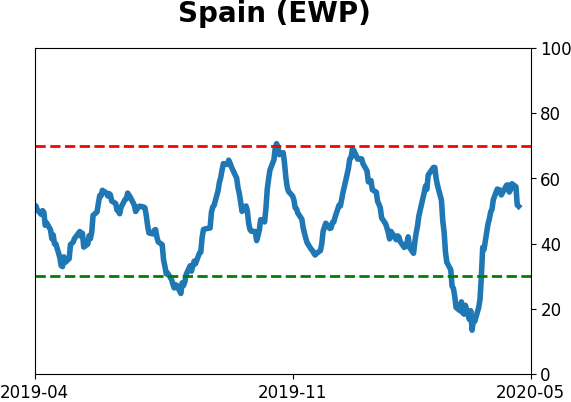
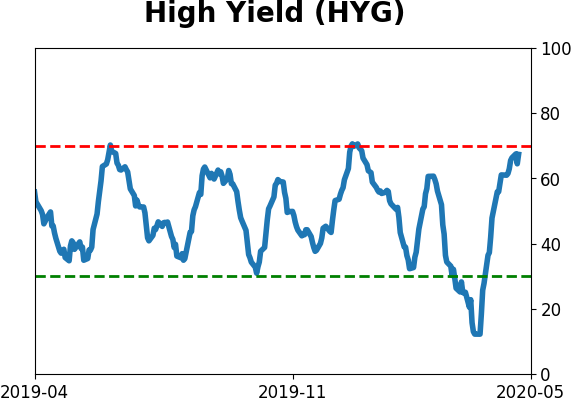
Sentiment Around The World
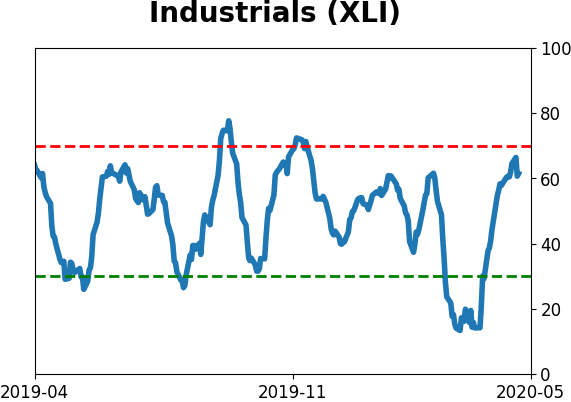
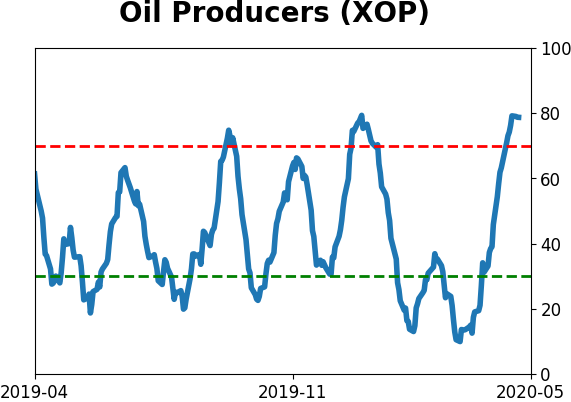
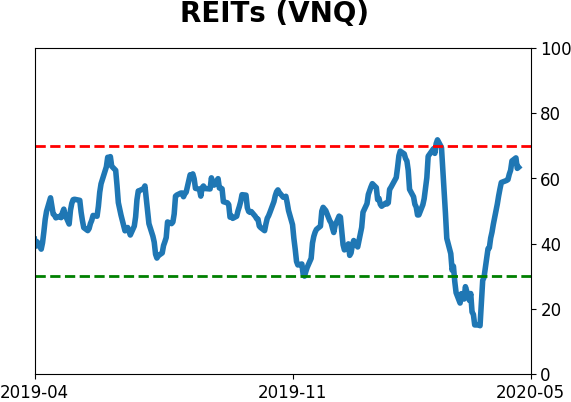
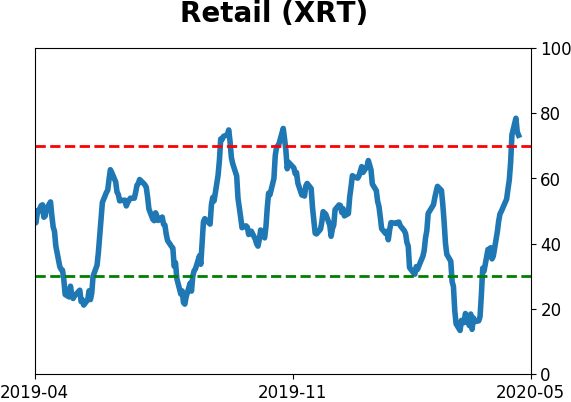
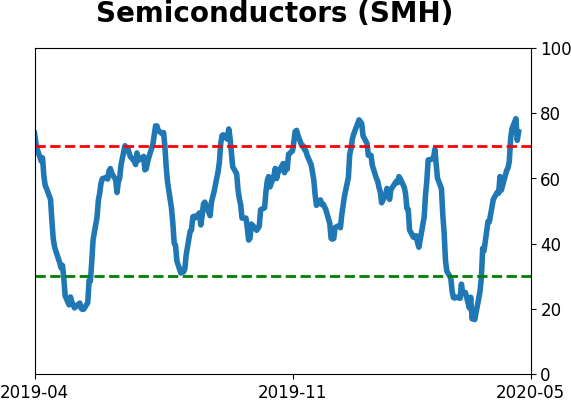
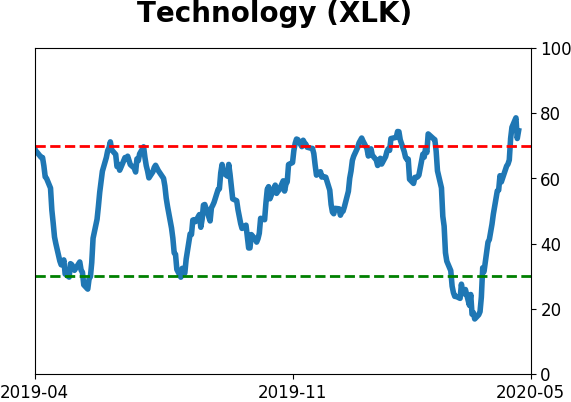
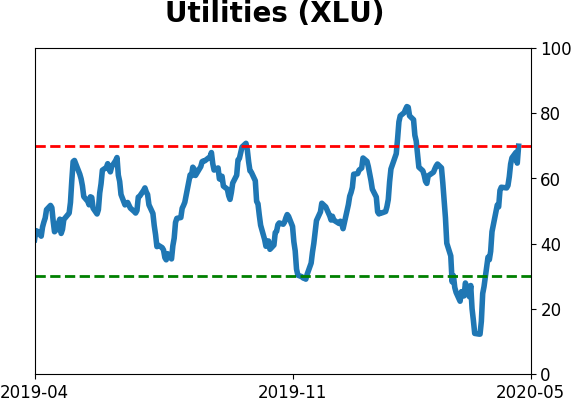
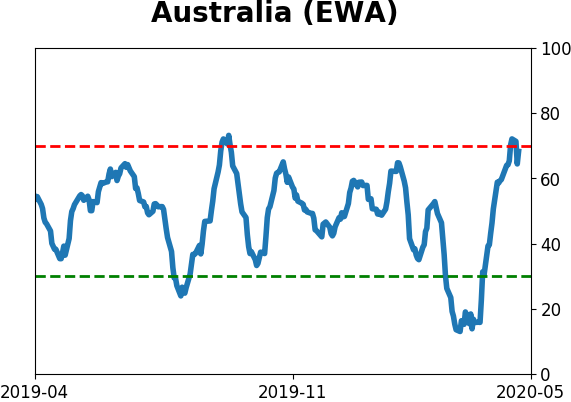
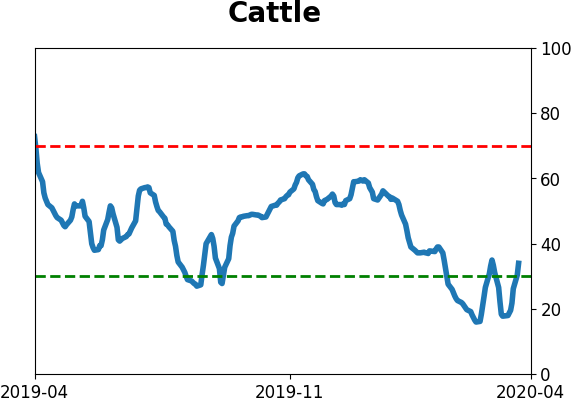
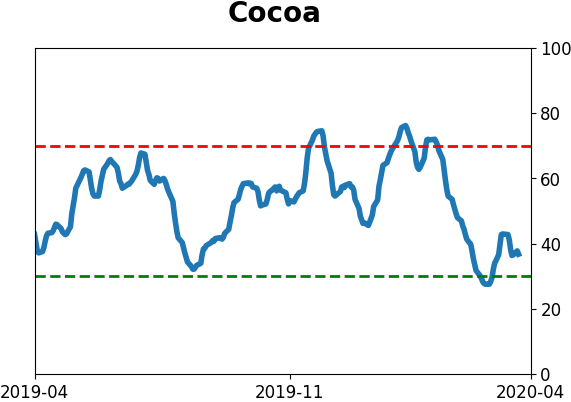
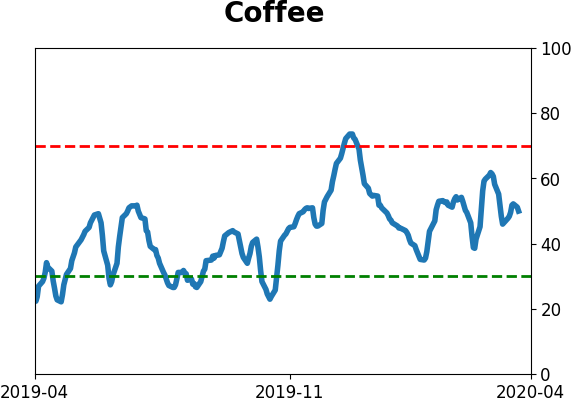
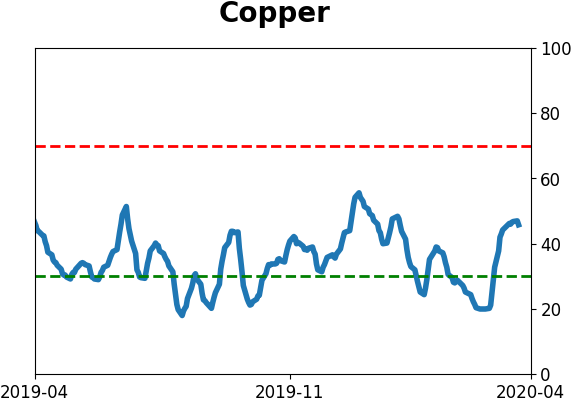
Optimism Index Thumbnails
|
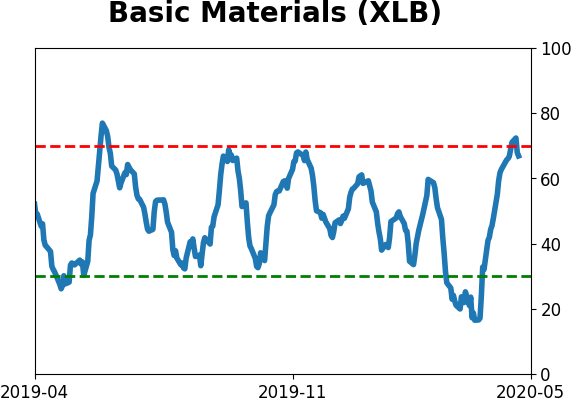
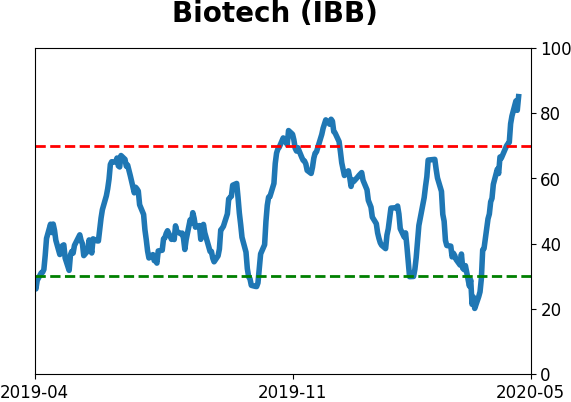
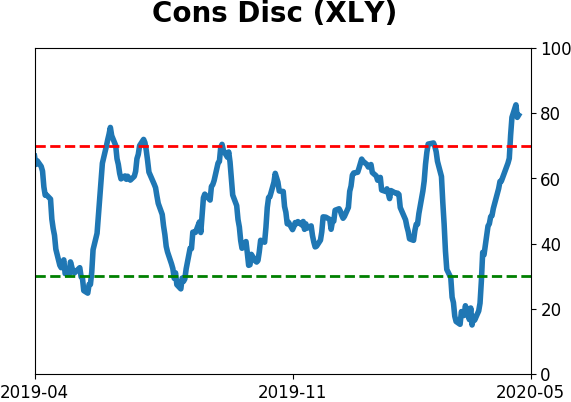
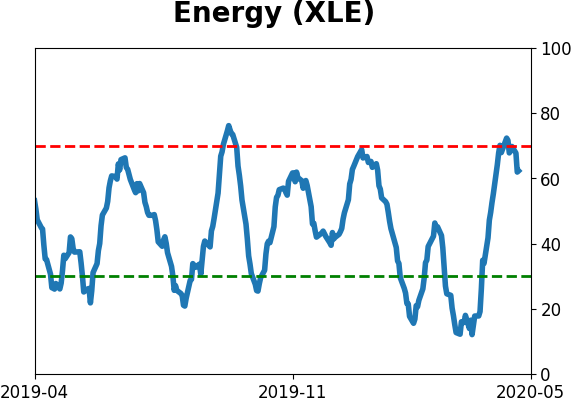
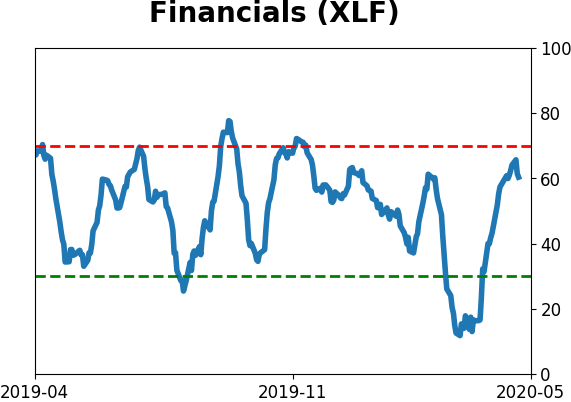
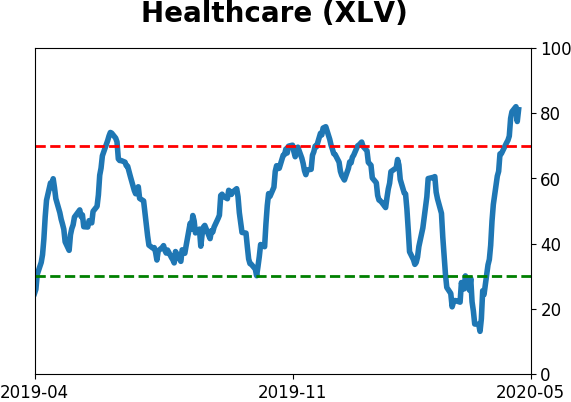
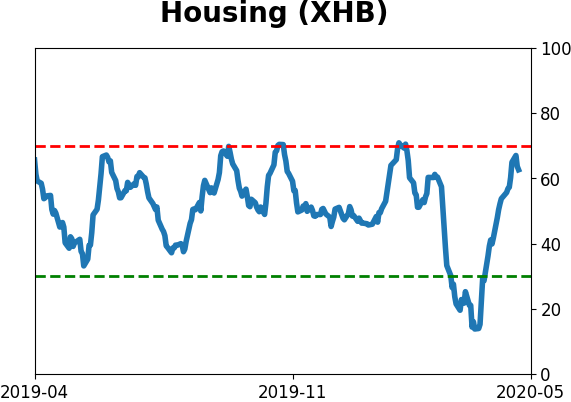
Sector ETF's - 10-Day Moving Average
|
|
|
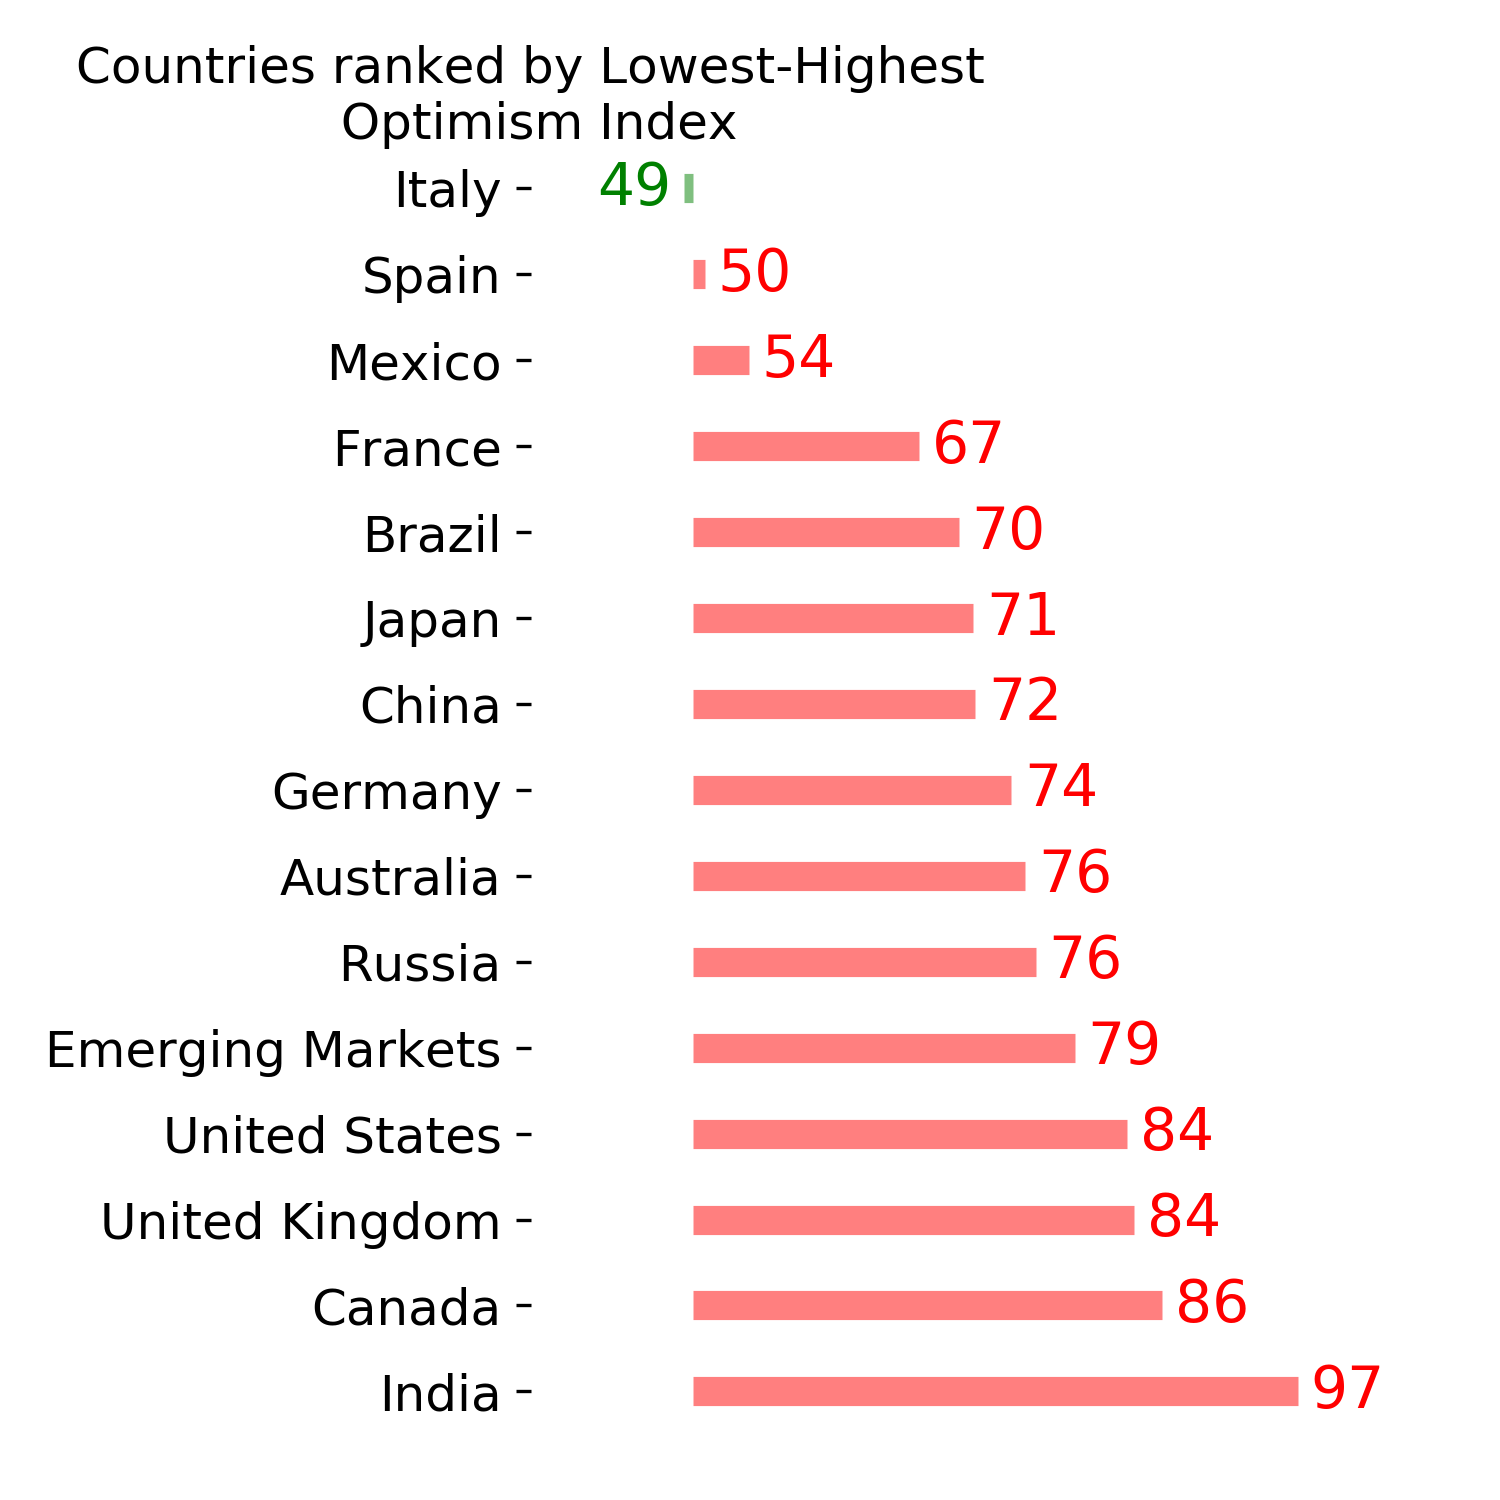
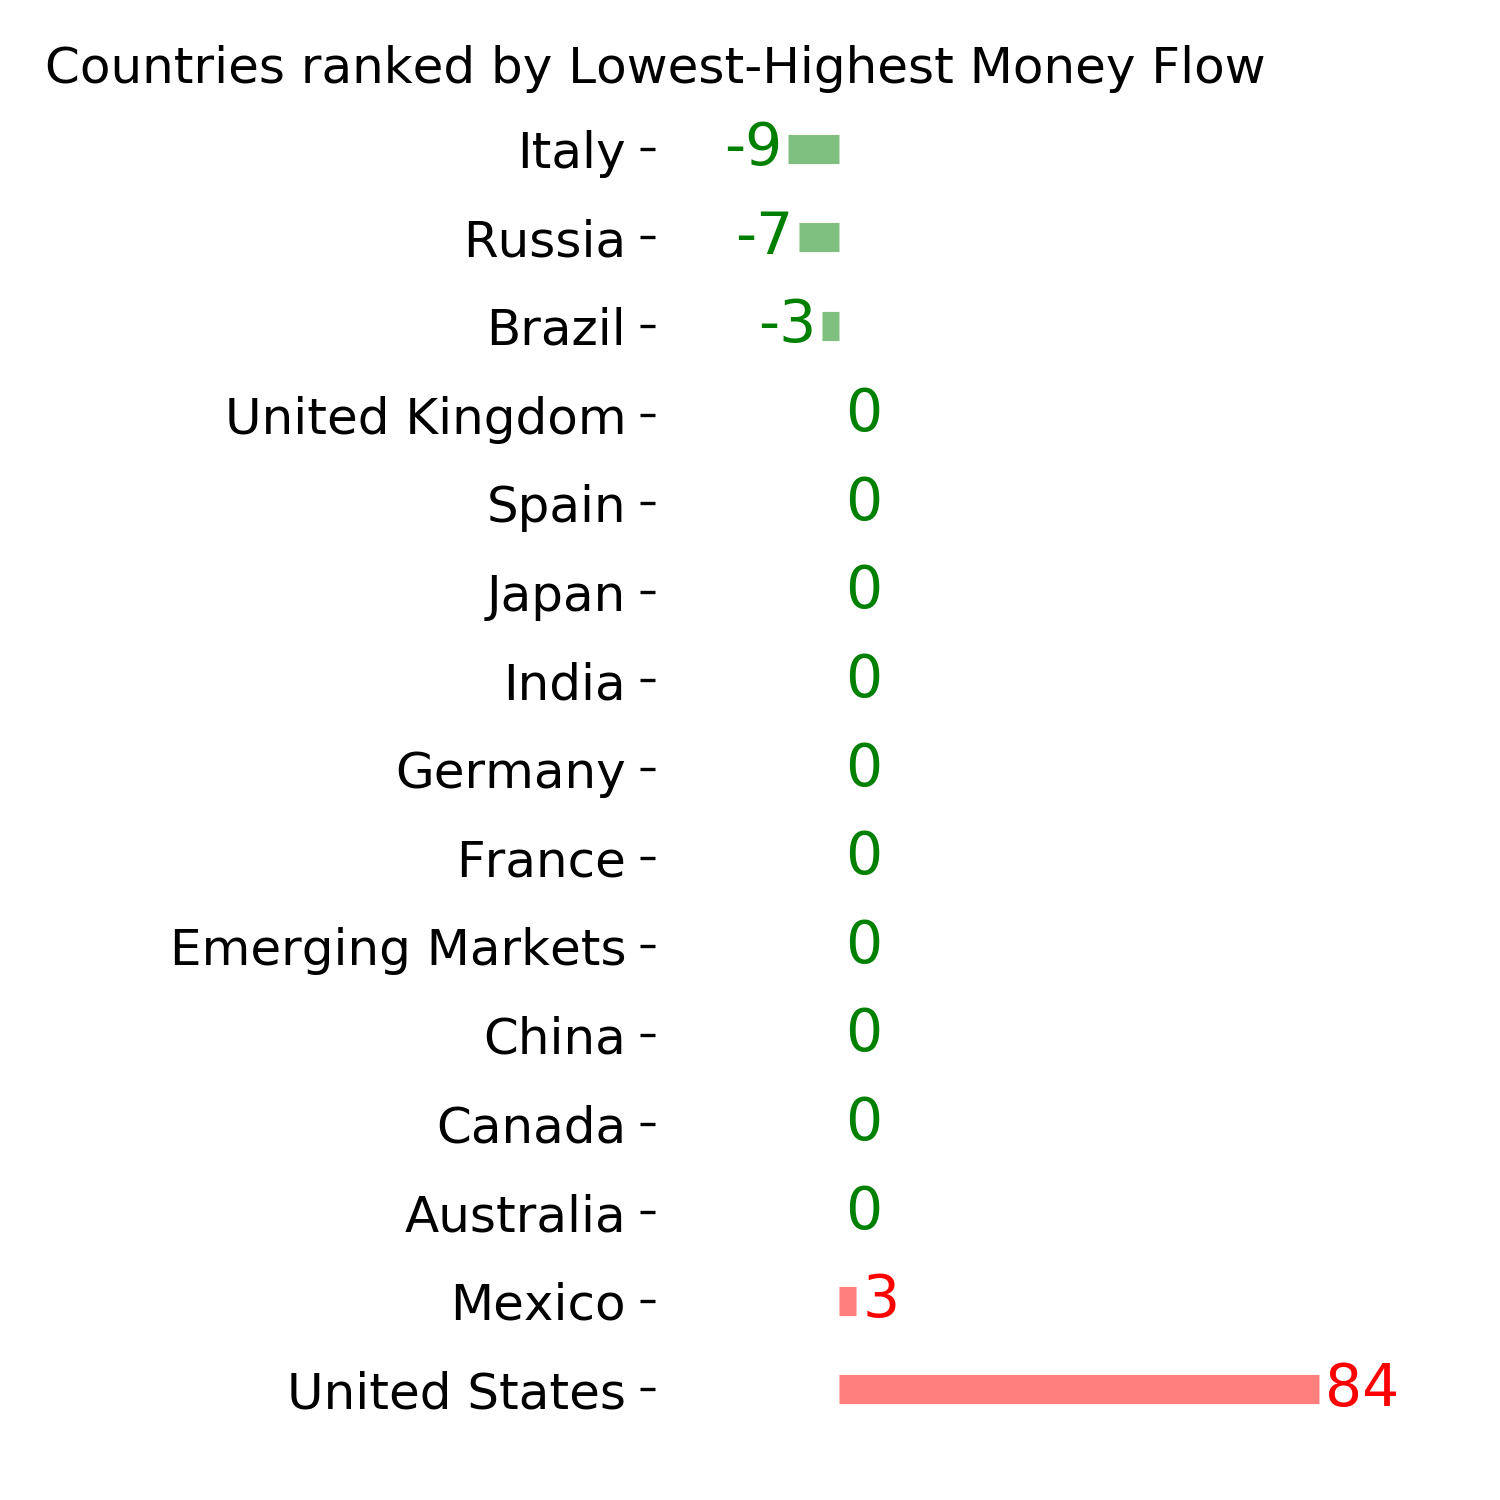
Country ETF's - 10-Day Moving Average
|
|
|
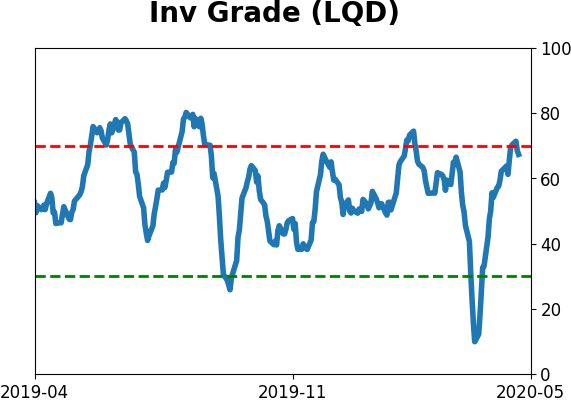
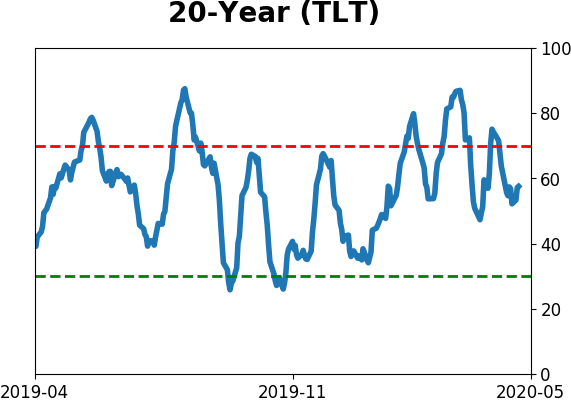
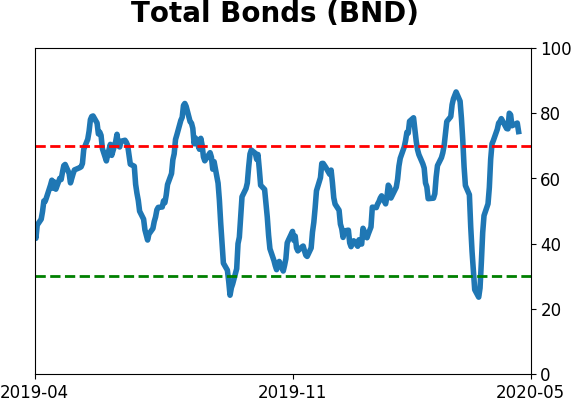
Bond ETF's - 10-Day Moving Average
|
|
|
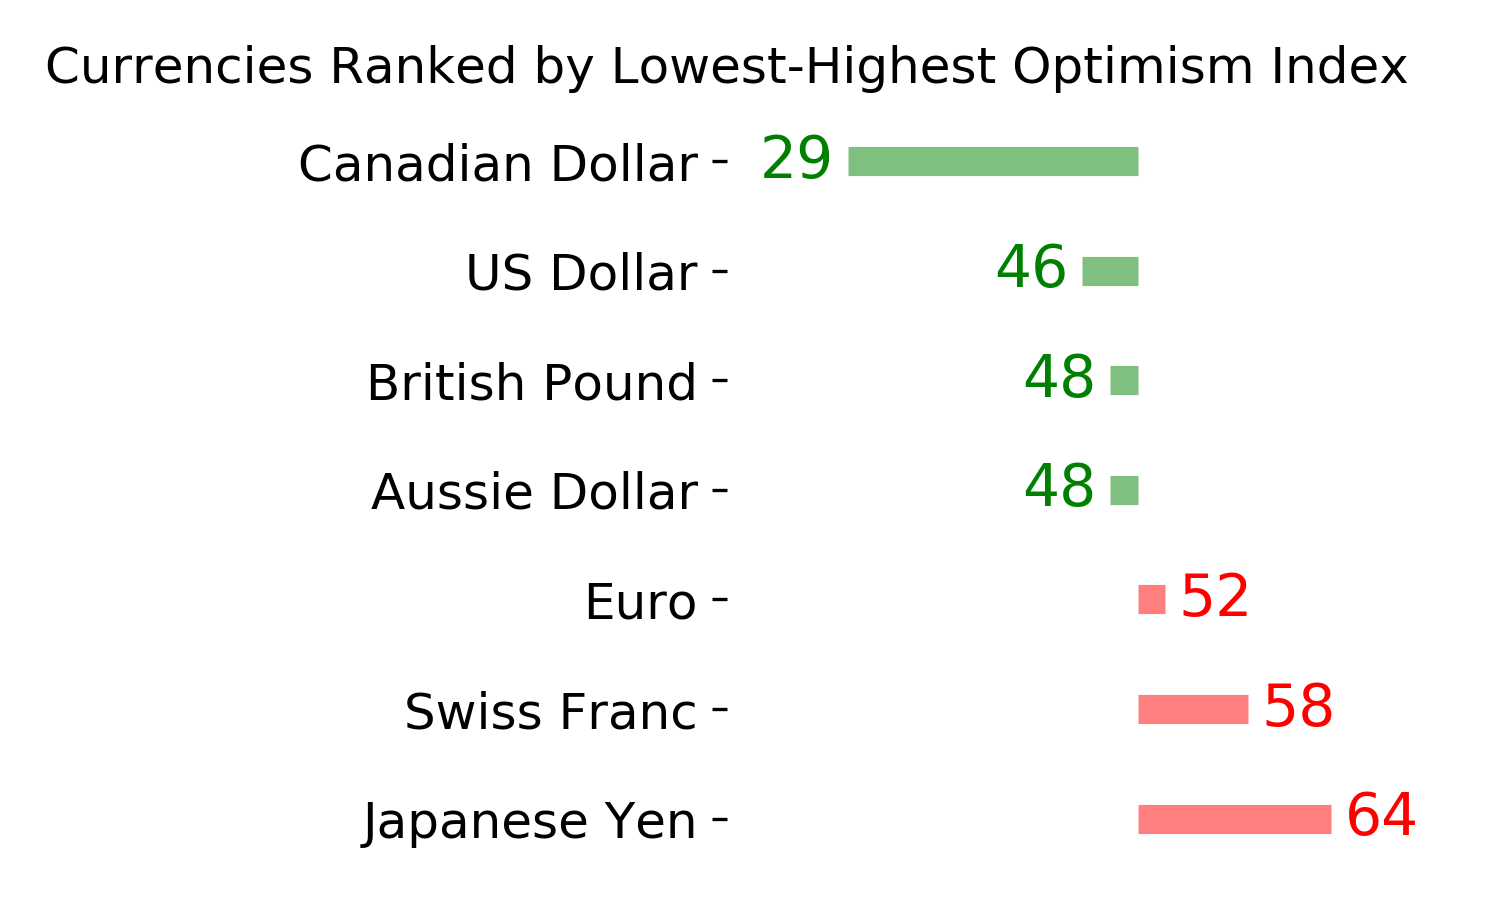
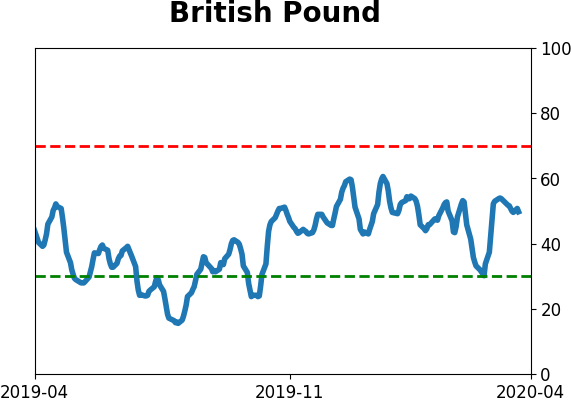
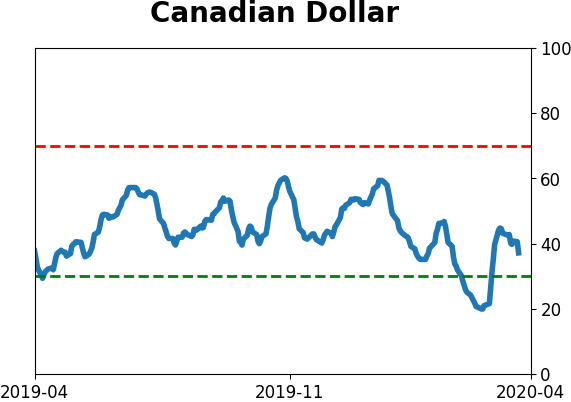
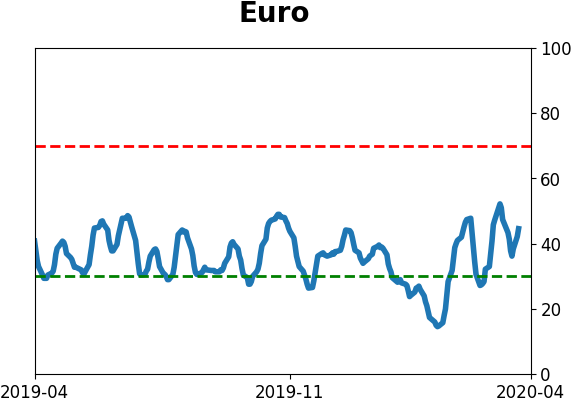
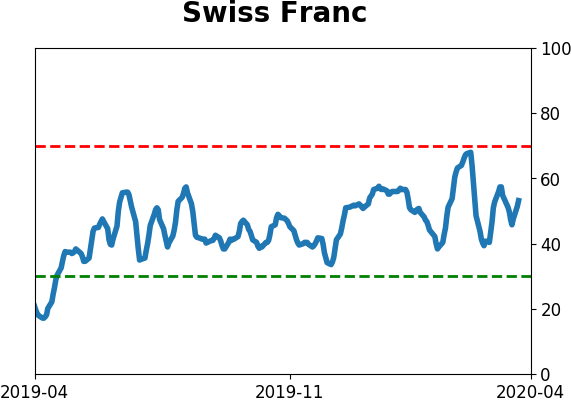
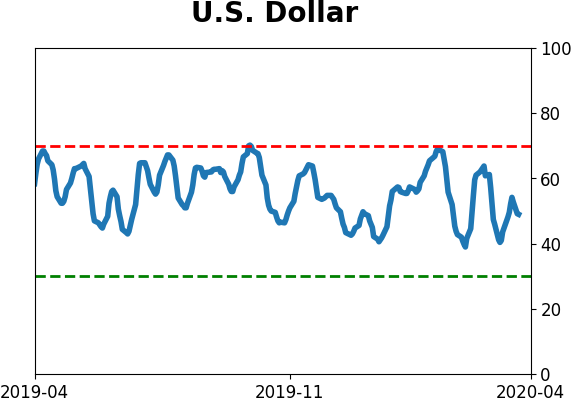
Currency ETF's - 5-Day Moving Average
|
|
|
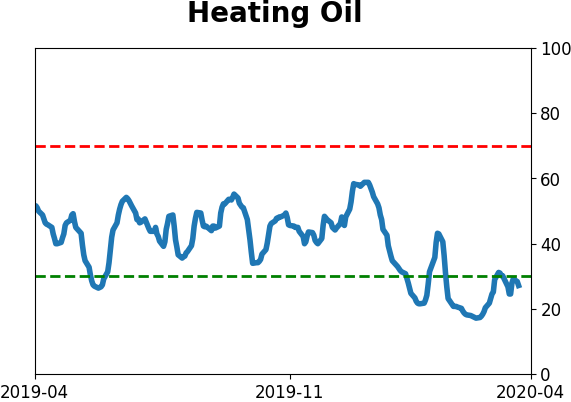
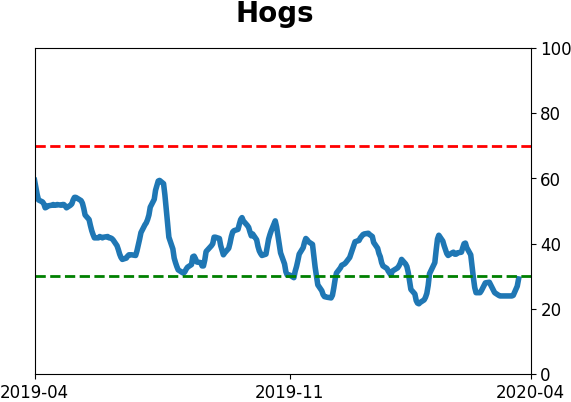
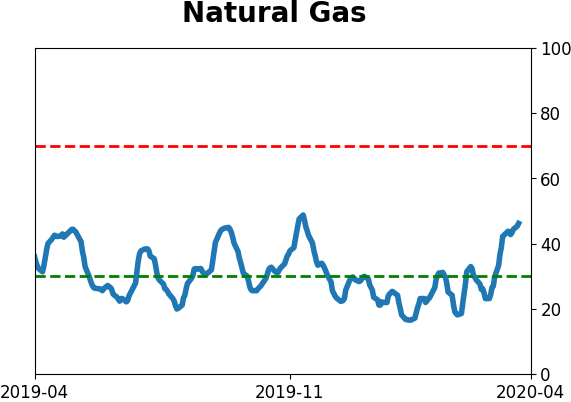
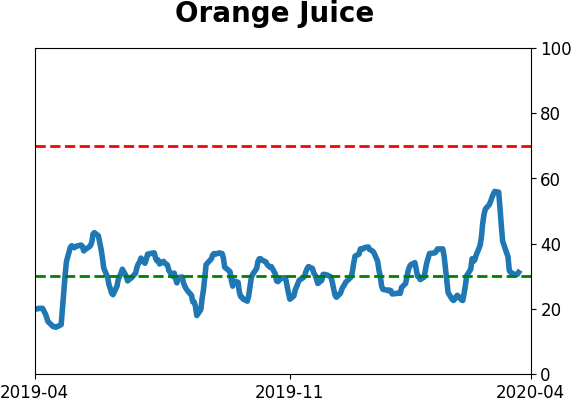
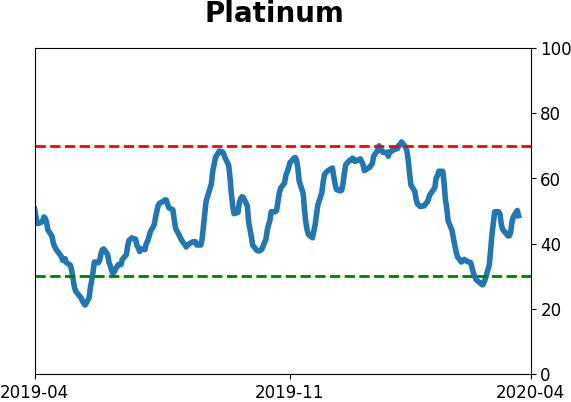
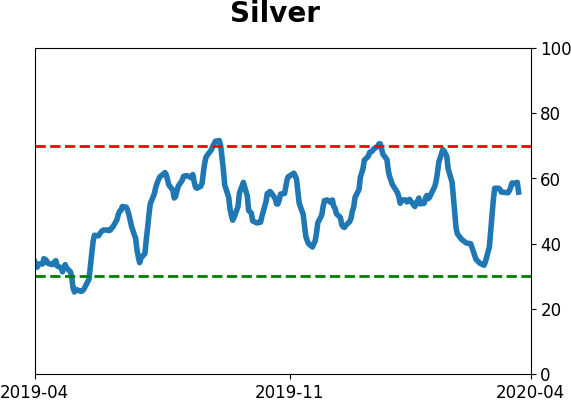
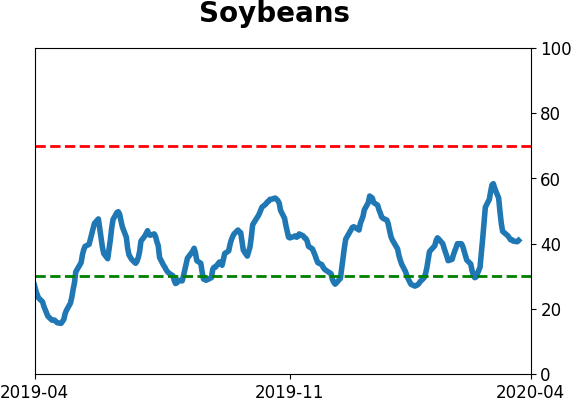
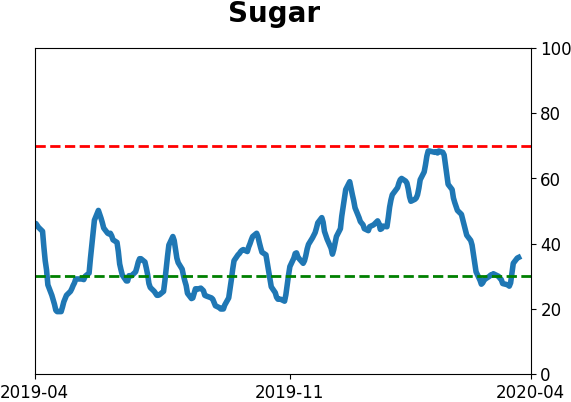
Commodity ETF's - 5-Day Moving Average
|
|