Headlines
|
|
A big divergence in riskier stocks:
A large number of stocks within the S&P 500 are holding above their 50-day moving averages. Within the Nasdaq Composite and Russell 2000, however, there are vastly fewer. There has never been a greater divergence.
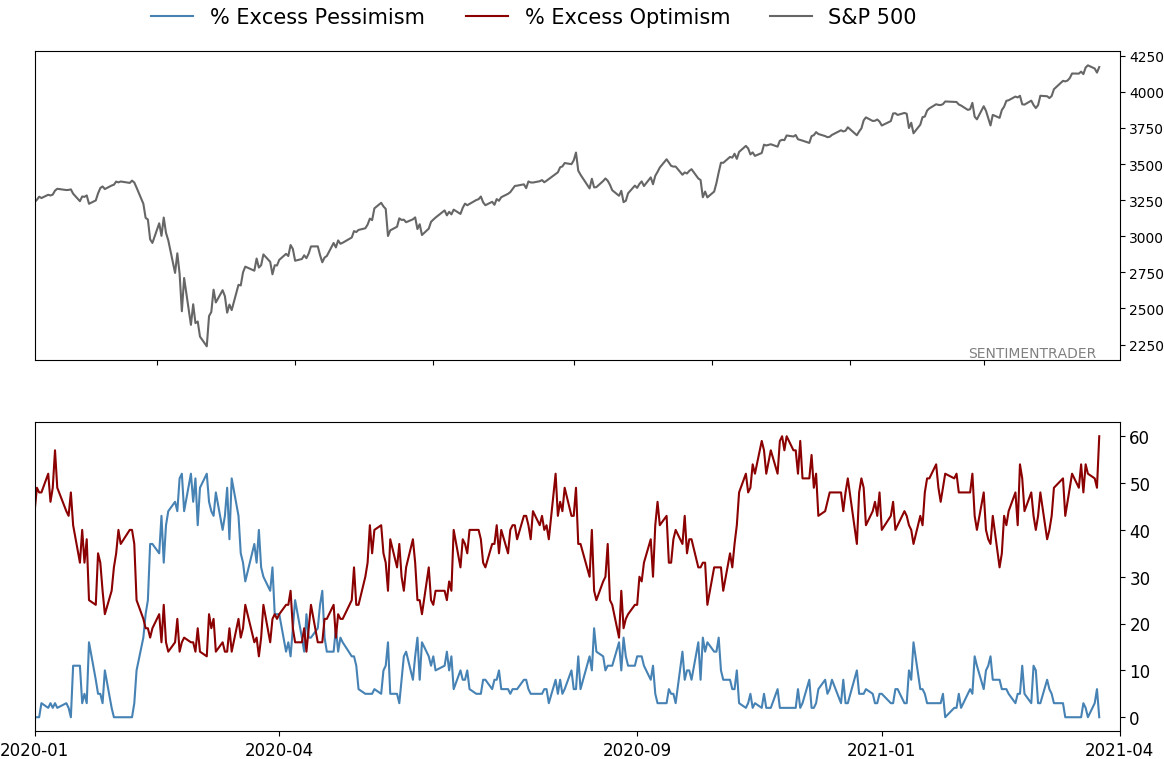
Yet another sentiment record: This says it all. Since we began computing this in 2000, there has never been a day when 60% or more of our core indicators showed excessive optimism while 1% or fewer indicators showed excessive pessimism. Until today.
Bottom Line:
See the Outlook & Allocations page for more details on these summaries STOCKS: Weak sell
The extreme speculation registered in January and February is starting to get wrung out. Internal dynamics have mostly held up, so a return to neutral sentiment conditions would improve the forward risk/reward profile substantially. We're still a ways off from that. BONDS: Weak buy
Various parts of the market have been hit in recent weeks, with mild oversold conditions. The Bond Optimism Index is now about as low as it gets during healthy bond market environments. Fixed income isn't responding well, so that needs to be monitored in case it's transitioning to a longer-term negative market environment. GOLD: Weak buy
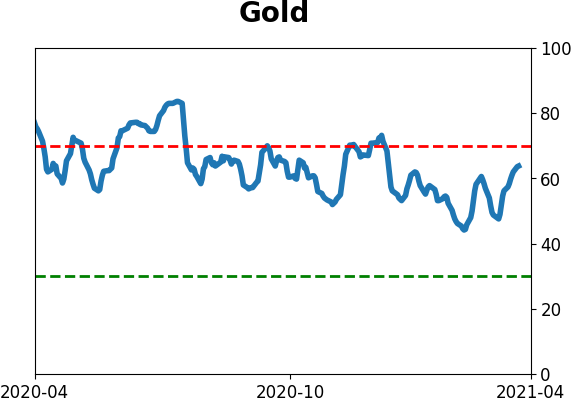
A dollar trying to rebound from a severe short position has weighed on gold and miners. The types of signals they've given in recent weeks, within the context of their recent surge, have usually resulted in higher prices over a medium- to long-term time frame. Like bonds, gold and miners aren't responding very well, and this needs to be monitored.
|
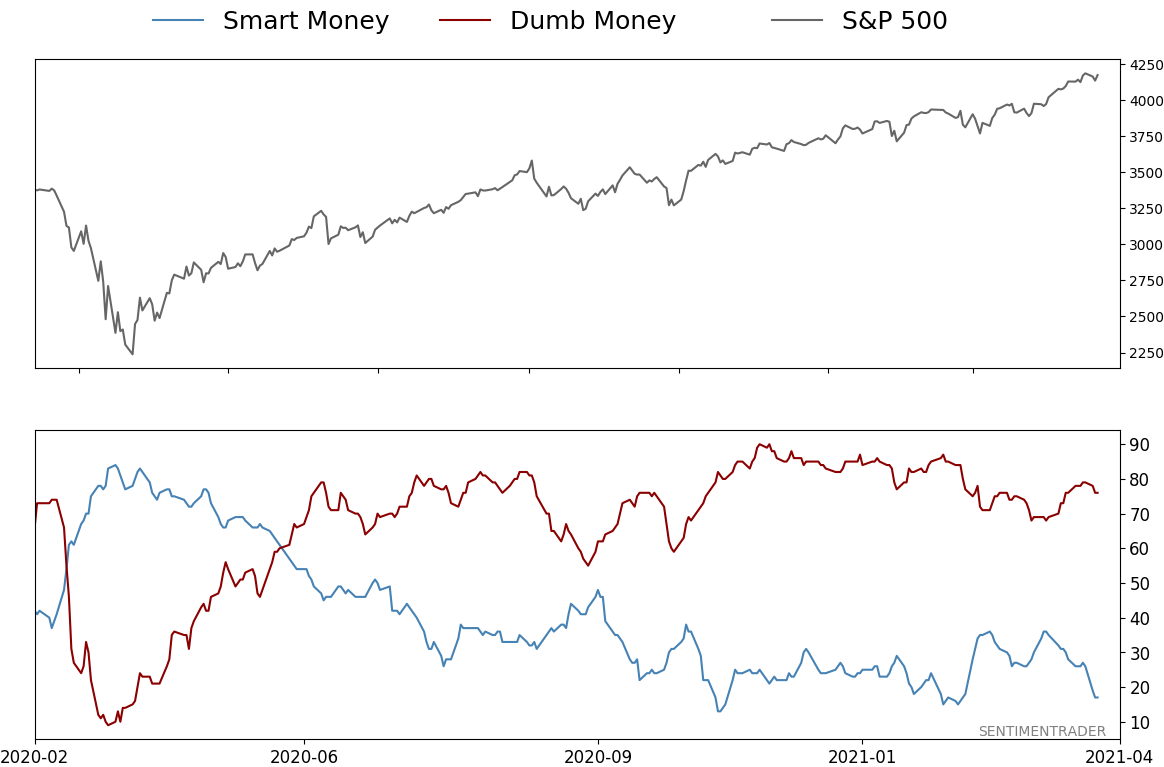
Smart / Dumb Money Confidence
|
Smart Money Confidence: 17%
Dumb Money Confidence: 76%
|
|
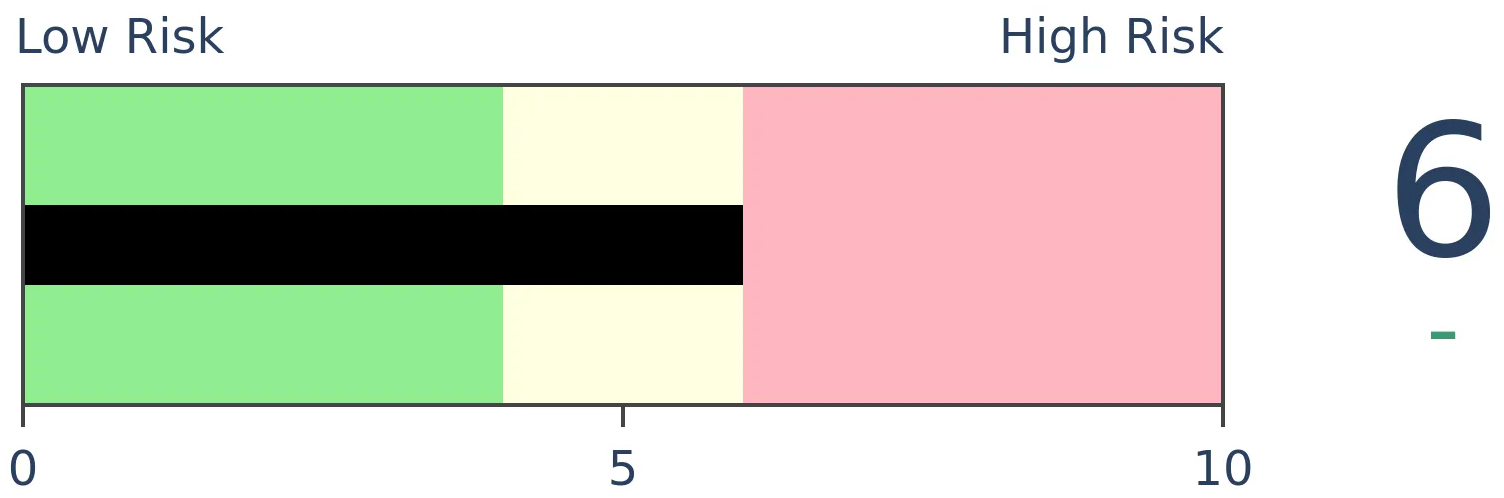
Risk Levels
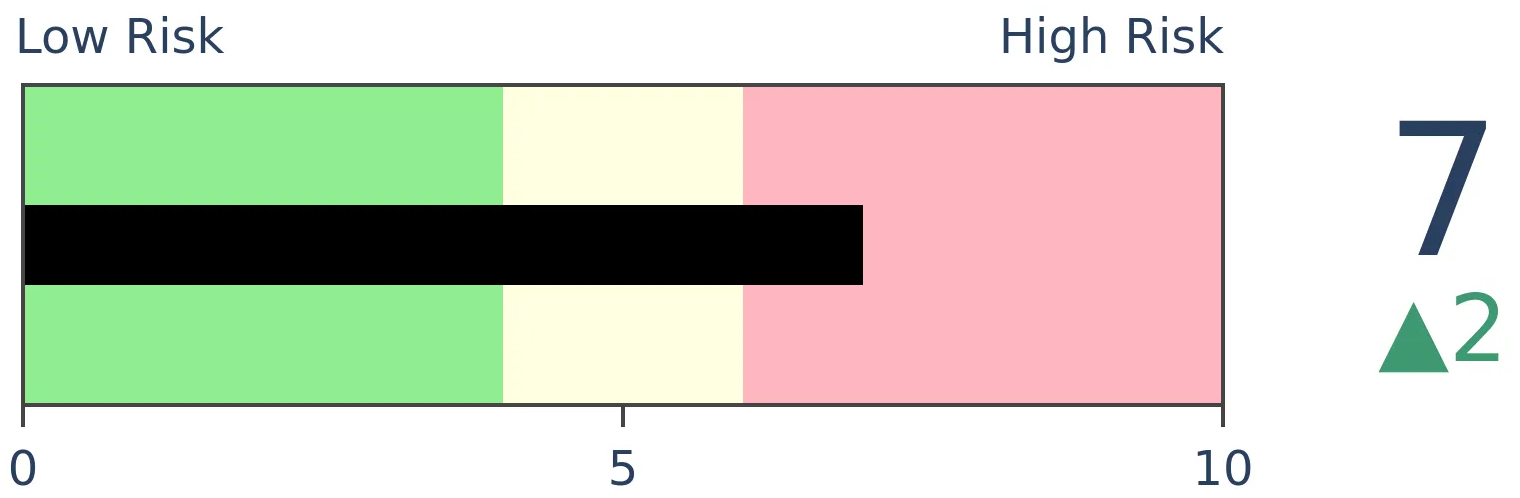
Stocks Short-Term
|
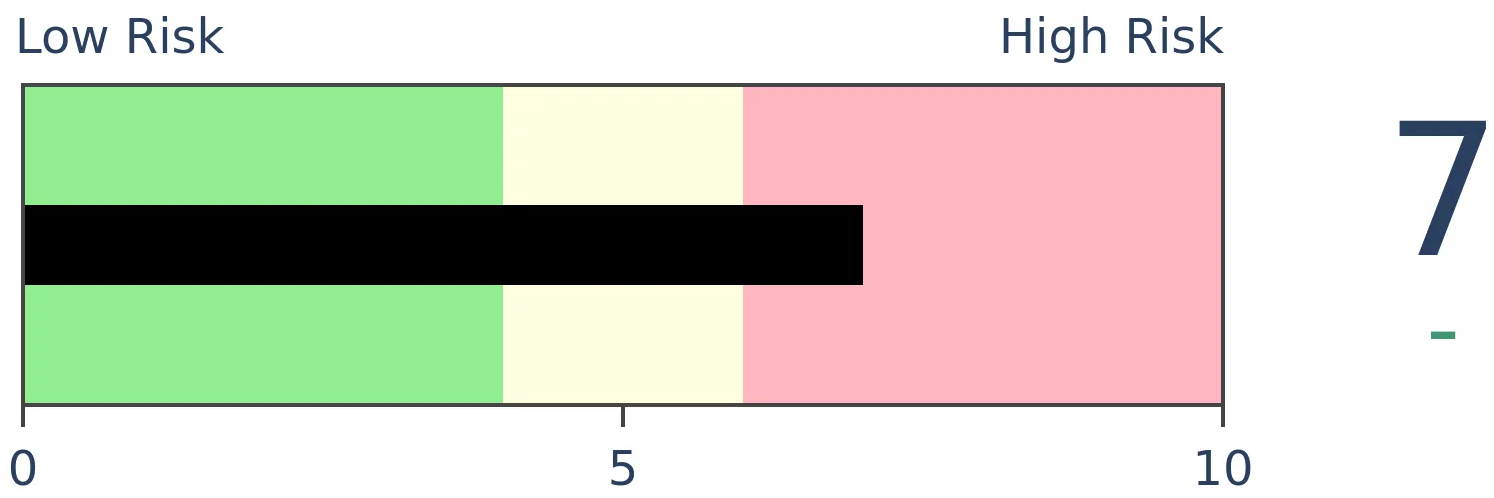
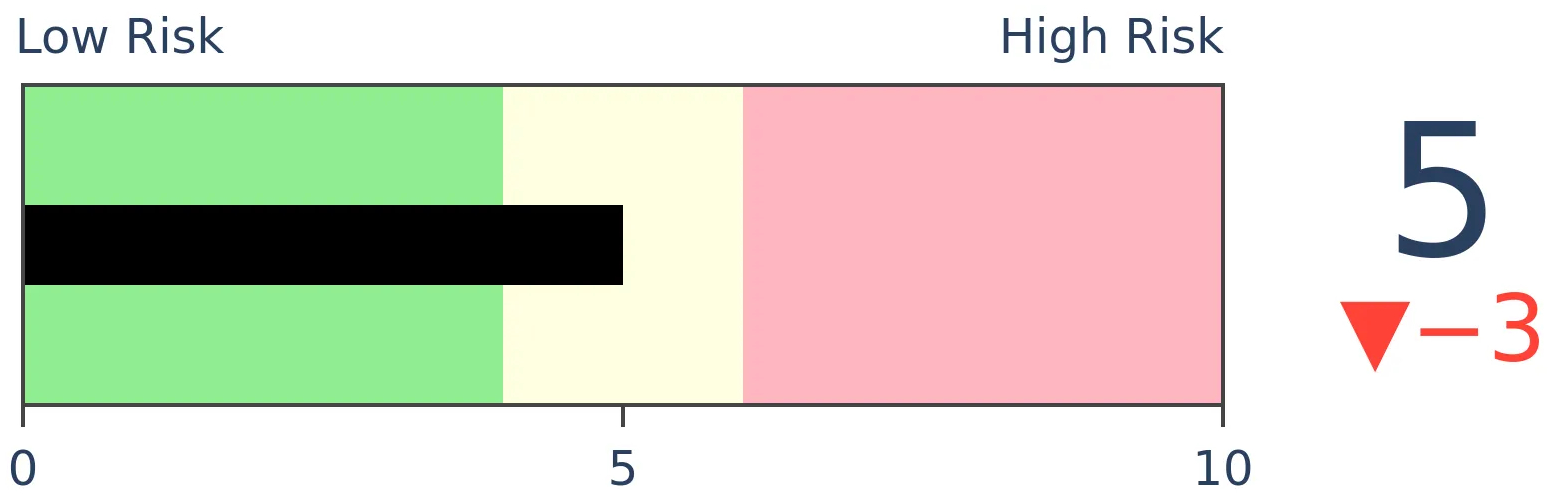
Stocks Medium-Term
|
|
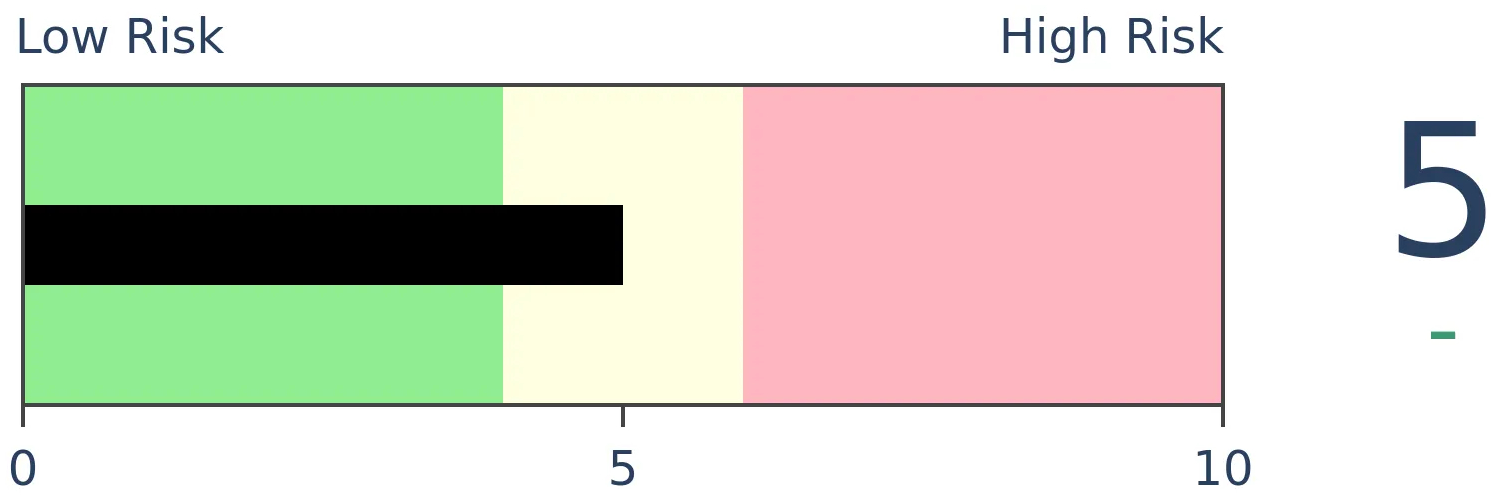
Bonds
|
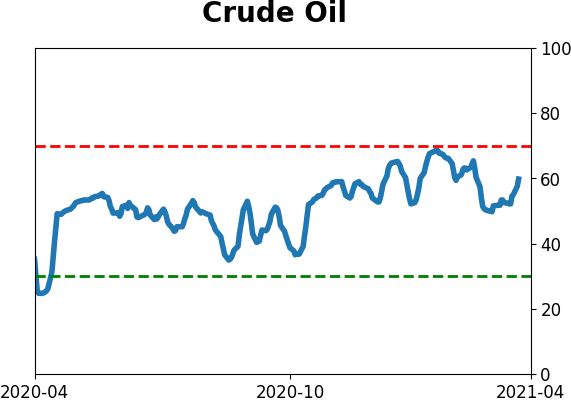
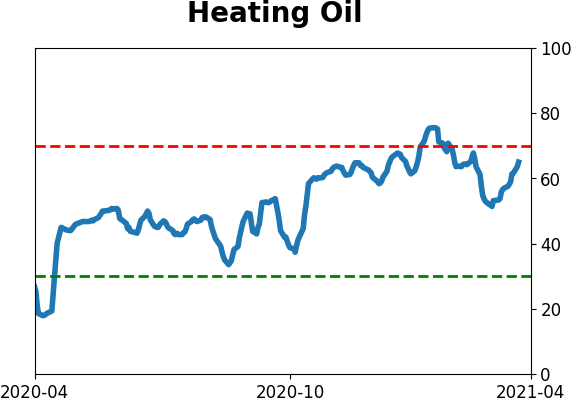
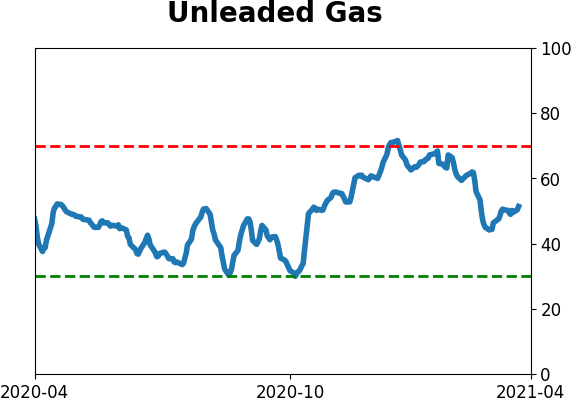
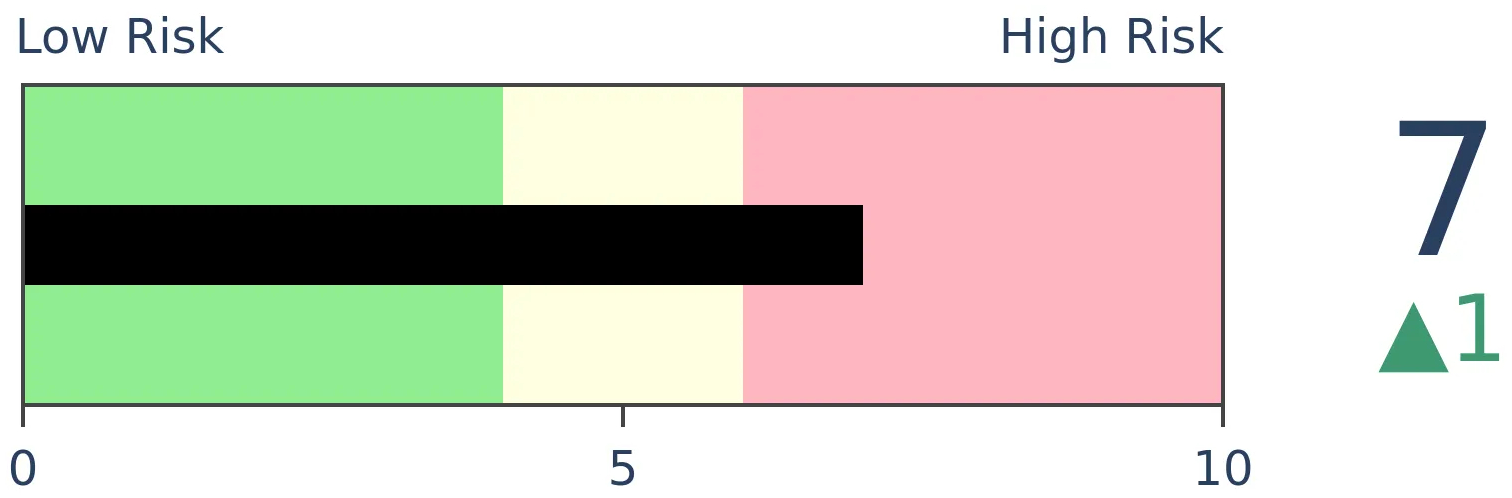
Crude Oil
|
|
Gold
|
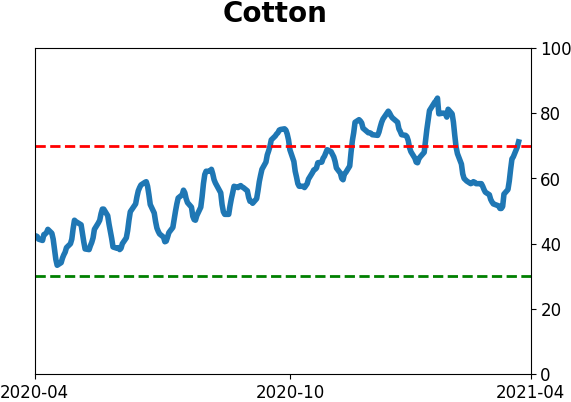
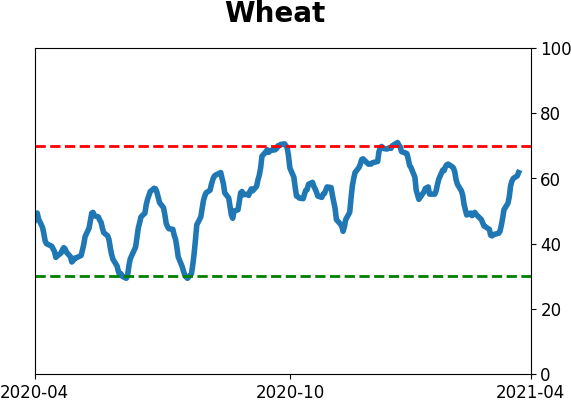
Agriculture
|
|
Research
BOTTOM LINE
A large number of stocks within the S&P 500 are holding above their 50-day moving averages. Within the Nasdaq Composite and Russell 2000, however, there are vastly fewer. There has never been a greater divergence.
FORECAST / TIMEFRAME
SPY -- Down, Medium-Term
|
For months, we've seen that sentiment has oscillated around extreme levels of optimism, yet stocks were holding firm. Not just the popular indexes, but most stocks, industries, sectors, even global markets.
That has started to shift in recent days.
It's too early to tell whether this can morph into something larger, but already there are splits that we haven't seen for a long time. As Bloomberg noted, around 80% of S&P 500 members are still holding above their 50-day moving averages, but within the Nasdaq Composite and Russell 2000, it is a vastly different story.
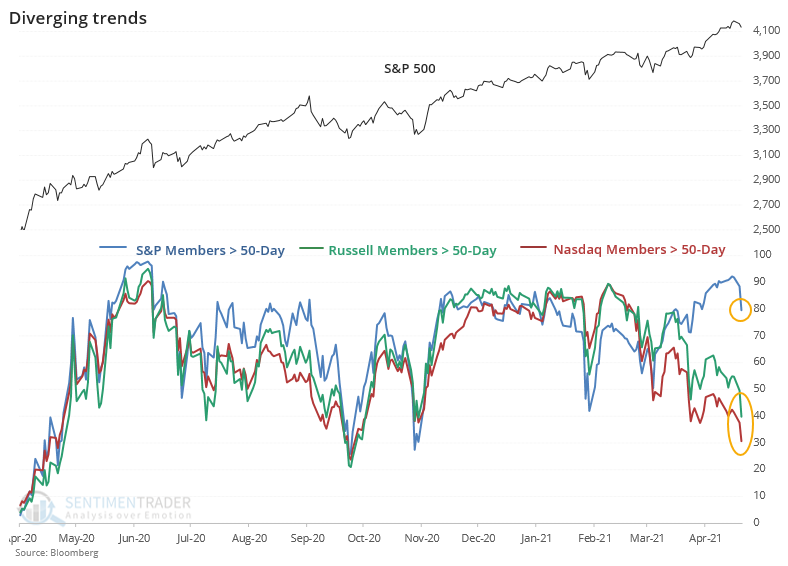
Going back more than 25 years, there has never been a day - until yesterday - when 80% of S&P 500 members were above their 50-day averages at the same time so few Nasdaq and Russell members were above their own averages. This is the widest such divergence in available history.
With Wednesday's rally, the picture didn't change much. The S&P had more than 85% of stocks above their 50-day averages, while both the Nasdaq Composite and Russell 2000 had fewer than 50% of members above their 50-day. That's never happened before.
To get a larger sample size, we have to relax the parameters. The table below shows each instance when 80% or more S&P members were above their averages, while fewer than 50% of Nasdaq and Russell members were above theirs.
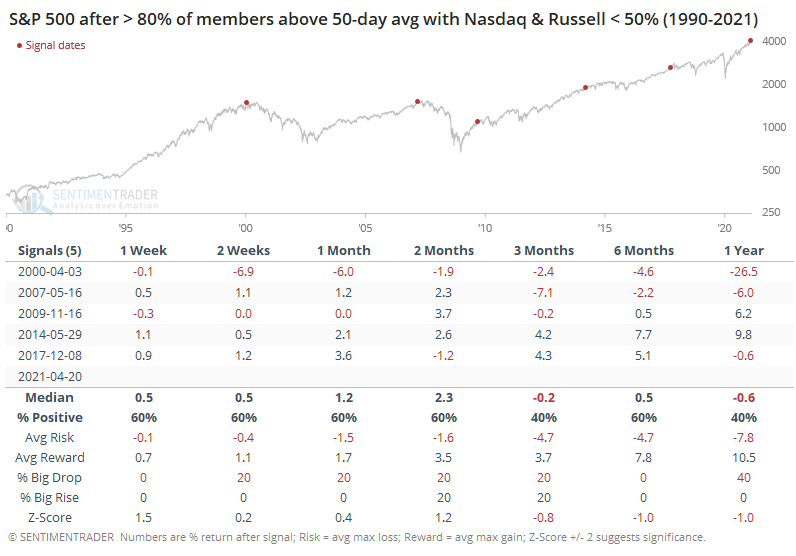
The overall results aren't too bad, but this is one of those times when the chart tells a better story than the numbers. It's pretty clear from the dots on the chart that these conditions wiped out any further gains in the S&P in the months. How long it took varied, from immediately to half a year, but it happened every time. Granted, the sample size is small but the message was consistent.
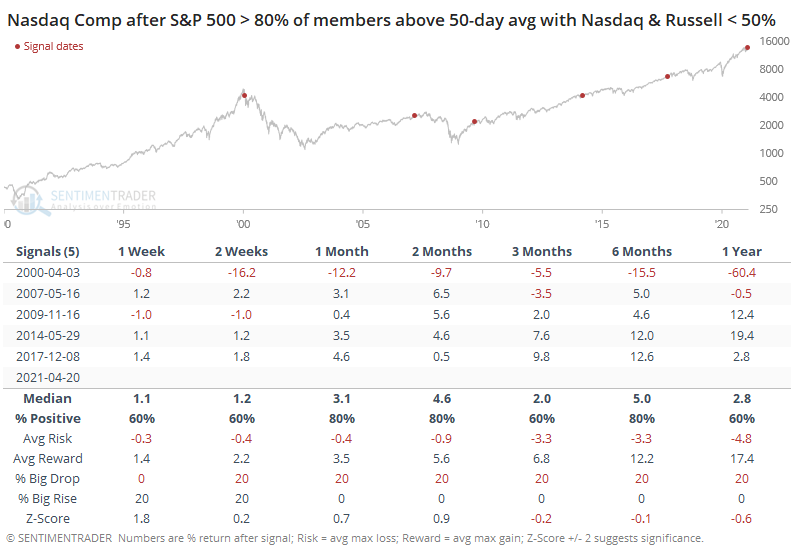
The Nasdaq Composite was a vaguely similar story, though it held up significantly better after the 2009, 2014, and 2017 signals.
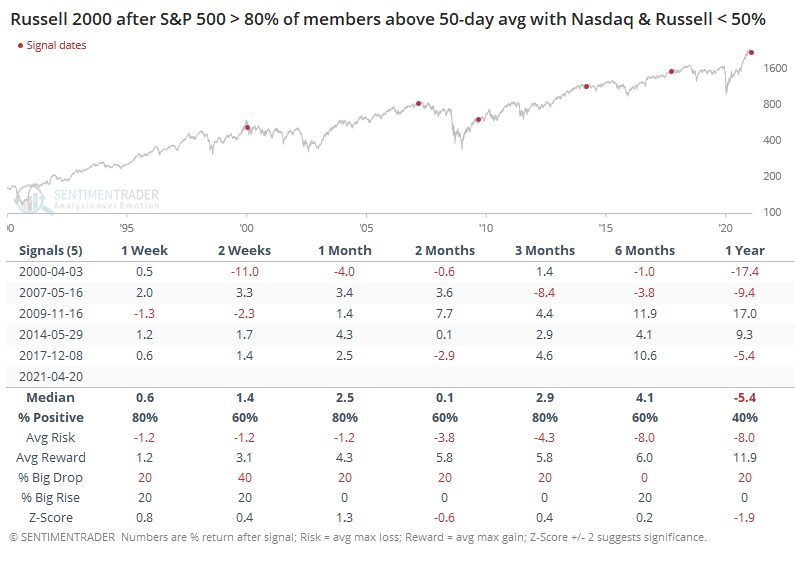
The small-cap Russell 2000 fared worse. It did manage to score sustainable gains in 2009, but the others saw some big losses.
We've been on the lookout for more sustained signs of deteriorating participation, and it's been like waiting for Godot. There have been isolated days with odd readings, usually thanks to the flood of SPACs or, lately, biotech stocks.
Shorter-term measures were about the only ones showing any kind of curious readings, and that's spreading now to some of the longer-term ones, which is more of a worry. There still haven't been widespread warning signs triggering, but if this kind of behavior continues, it's only a matter of time.
Active Studies
| Time Frame | Bullish | Bearish | | Short-Term | 0 | 0 | | Medium-Term | 0 | 11 | | Long-Term | 11 | 4 |
|
Indicators at Extremes
Portfolio
| Position | Description | Weight % | Added / Reduced | Date | | Stocks | RSP | 4.9 | Reduced 4% | 2021-02-09 | | Bonds | 30.0% BND, 8.8% SCHP | 38.8 | Added 15.1% | 2021-02-18 | | Commodities | GCC | 2.3 | Reduced 2.1%
| 2020-09-04 | | Precious Metals | GDX | 9.0 | Added 0.1% | 2021-02-18 | | Special Situations | 7.3% XLE, 4.8% PSCE | 12.1 | Reduced 5.6% | 2021-02-18 | | Cash | | 32.8 | | |
|
Updates (Changes made today are underlined)
With a market that has seen the kinds of broad participation and big breath thrusts like we did in the fall, it's hard to become too negative. Those kinds of conditions have consistently preceded higher returns over the next 6-12 months. It's the interim that's more of an issue. Even conditions like that haven't prevented some shorter-term pullbacks. And when we combine an environment where speculation is rampant and recent days have seen an increase in cracks under the surface of the indexes, it's enough to become more defensive over a short- to medium-term time frame. We still don't have much confirmation from the price action in the indexes, so those who are more conservative would likely wait before increasing cash levels. I've decreased risk exposure a bit more, mainly in terms of energy stocks and the ANGL fund, while adding more to the broader bond market. RETURN YTD: 7.2% 2020: 8.1%, 2019: 12.6%, 2018: 0.6%, 2017: 3.8%, 2016: 17.1%, 2015: 9.2%, 2014: 14.5%, 2013: 2.2%, 2012: 10.8%, 2011: 16.5%, 2010: 15.3%, 2009: 23.9%, 2008: 16.2%, 2007: 7.8%
|
|
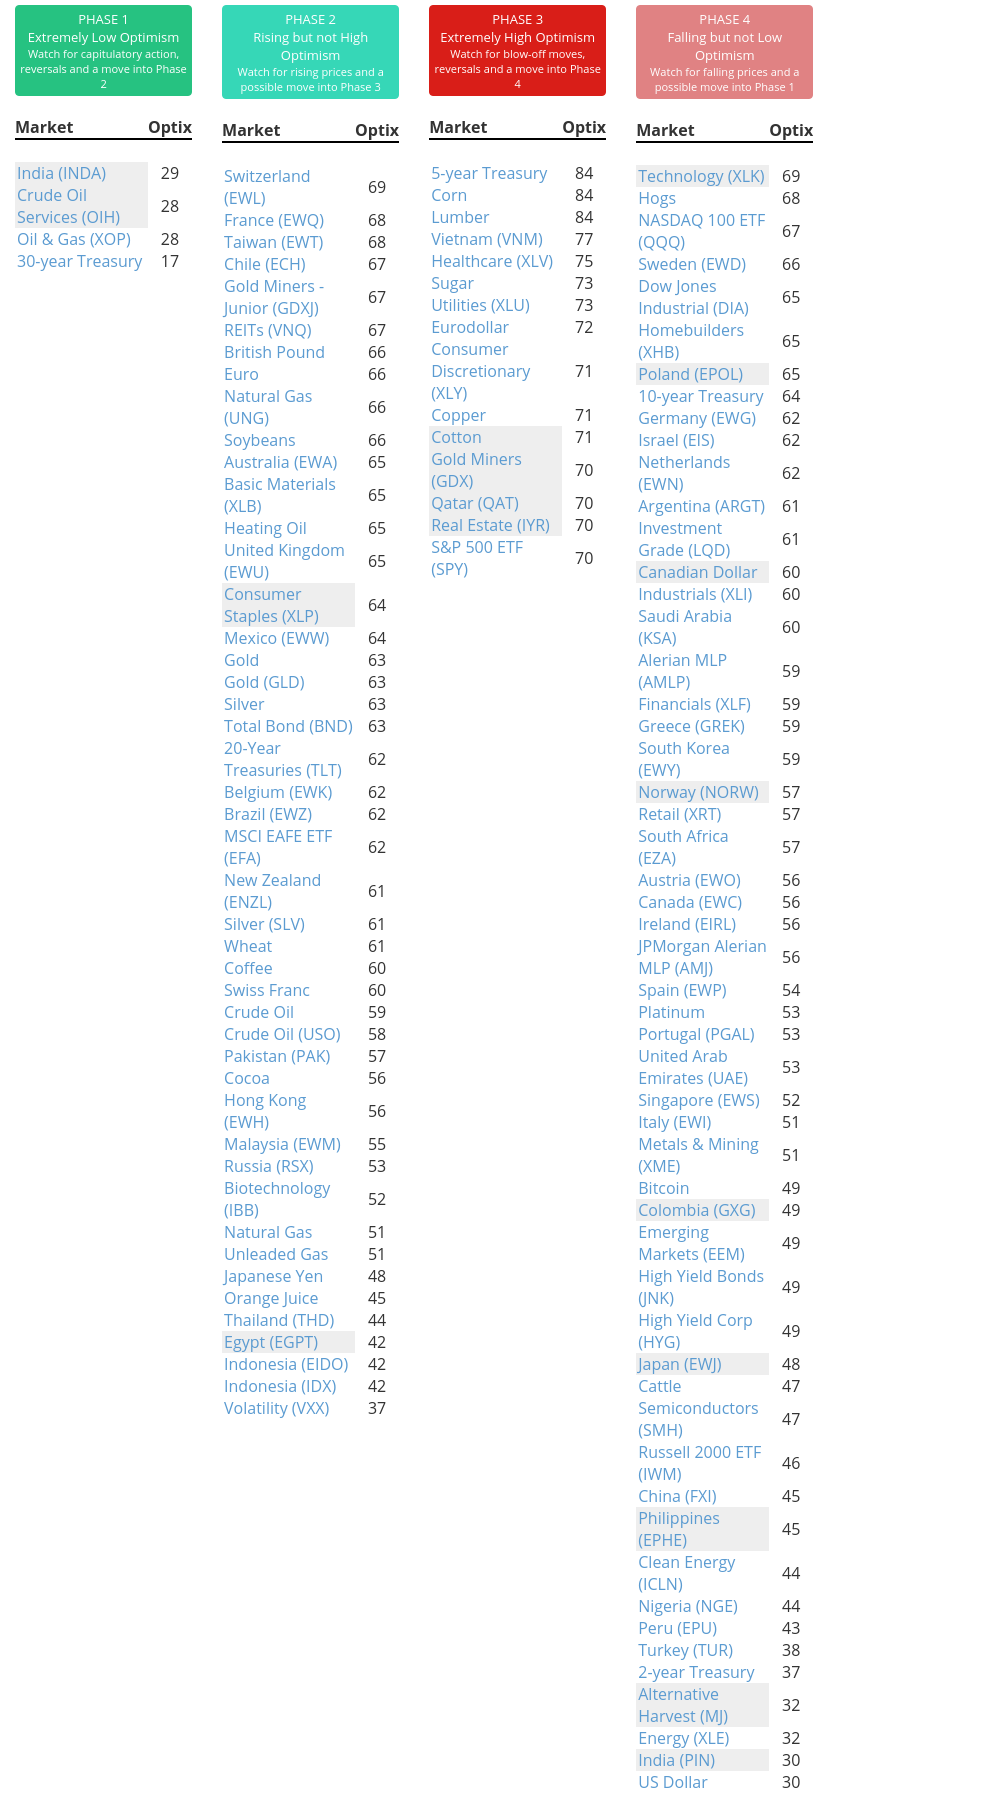
Phase Table
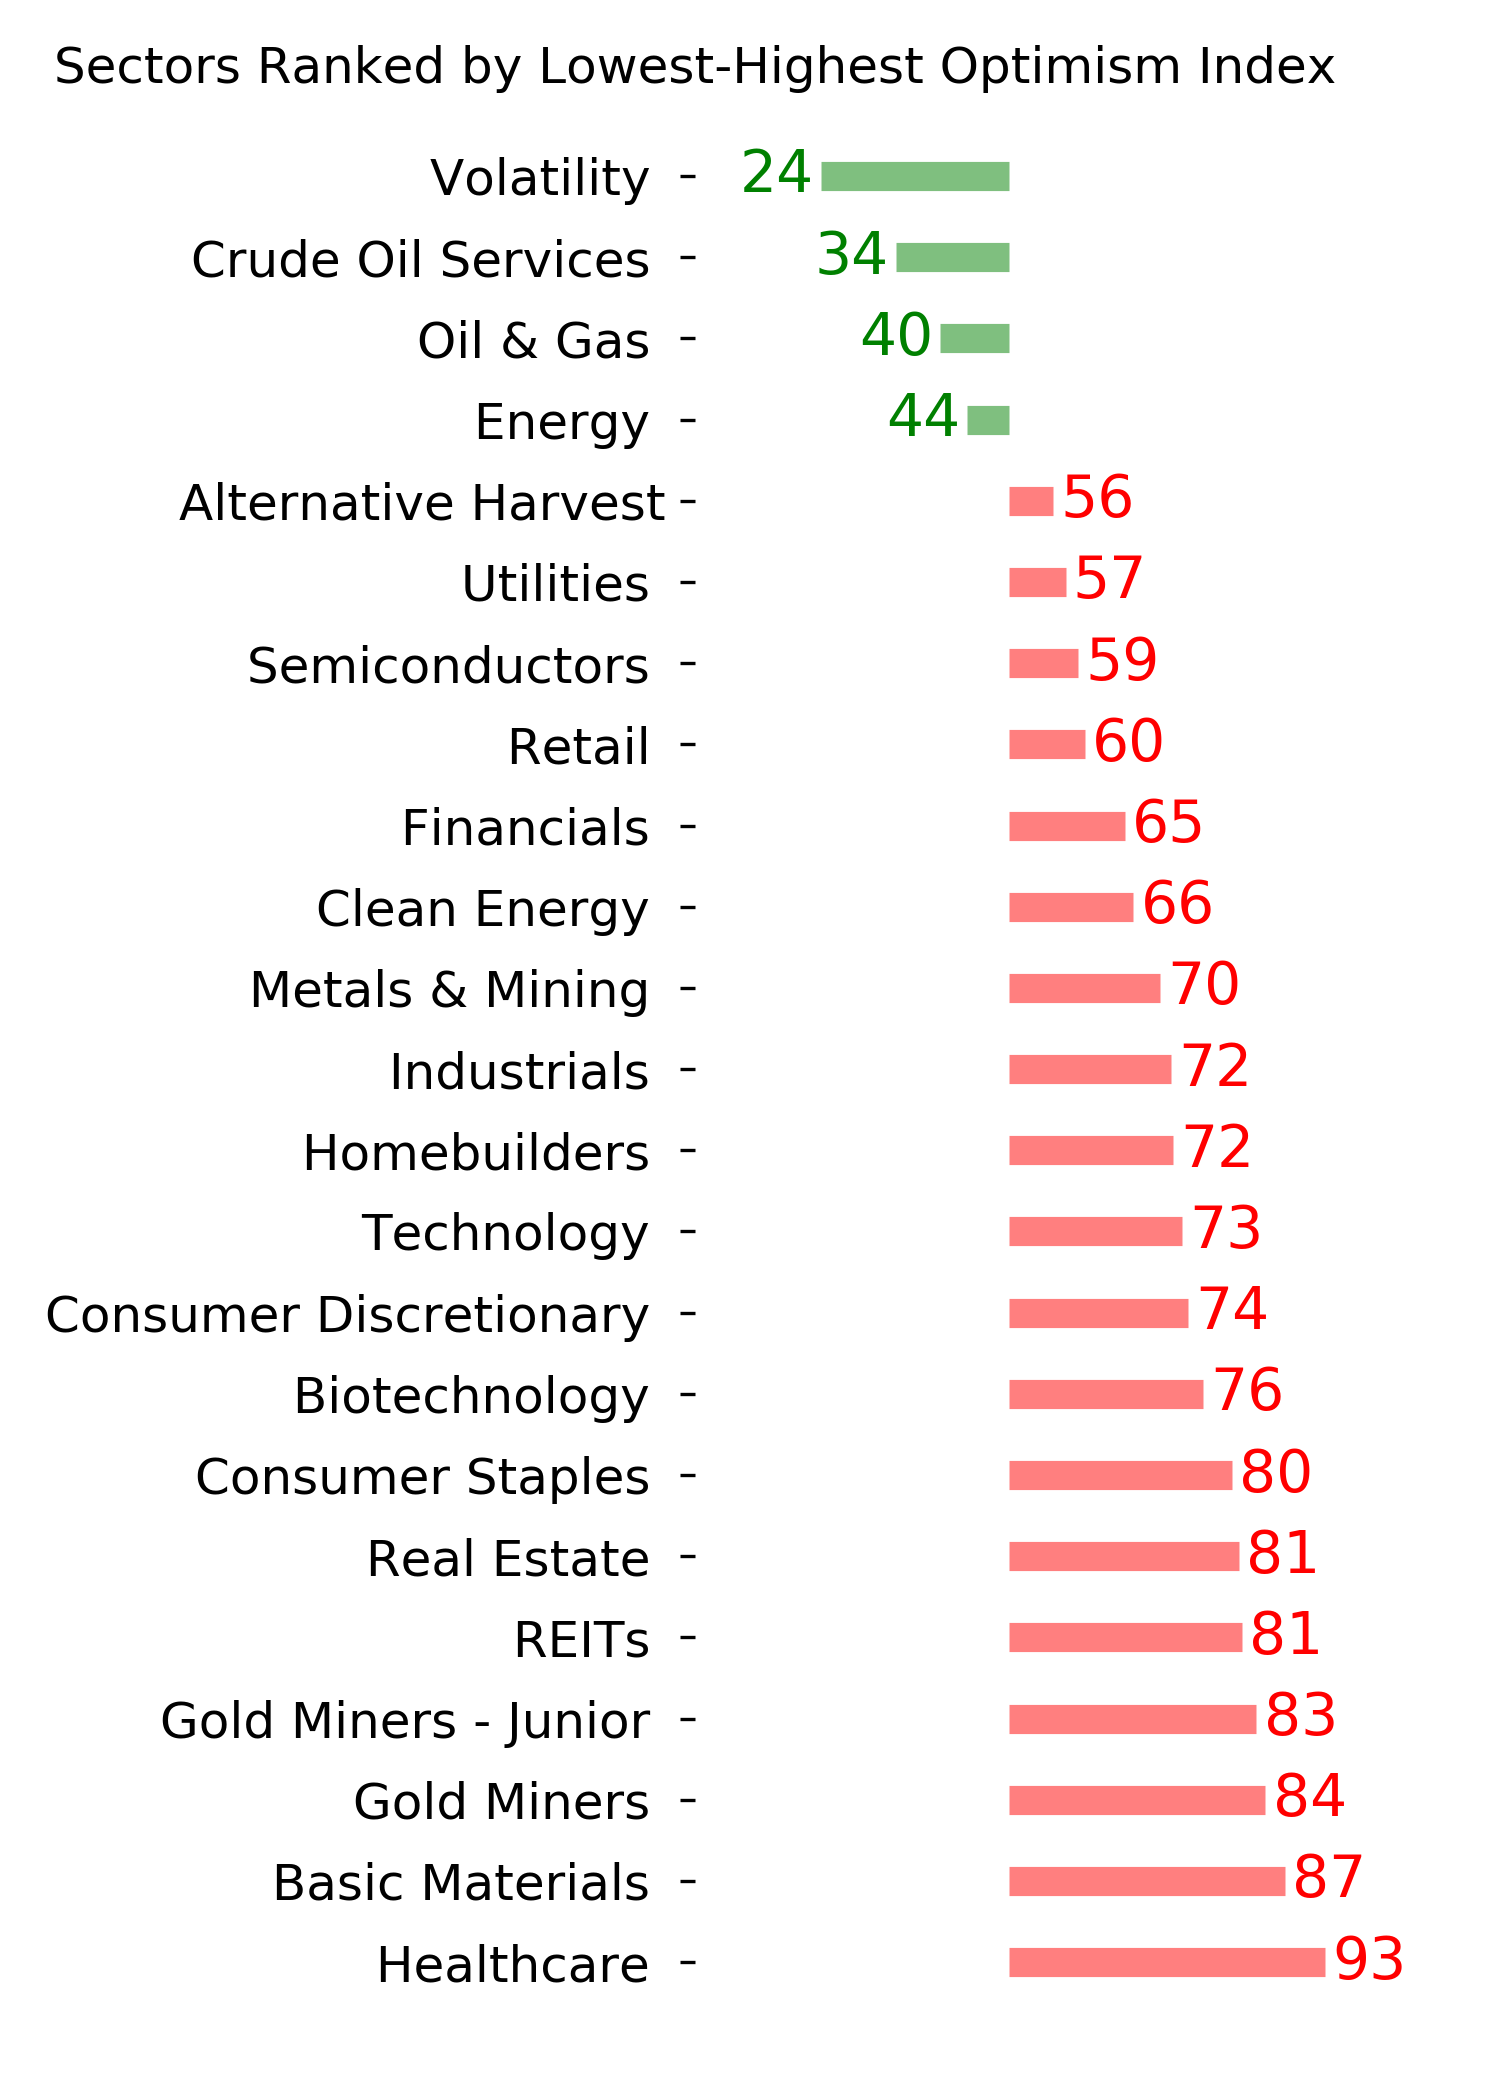
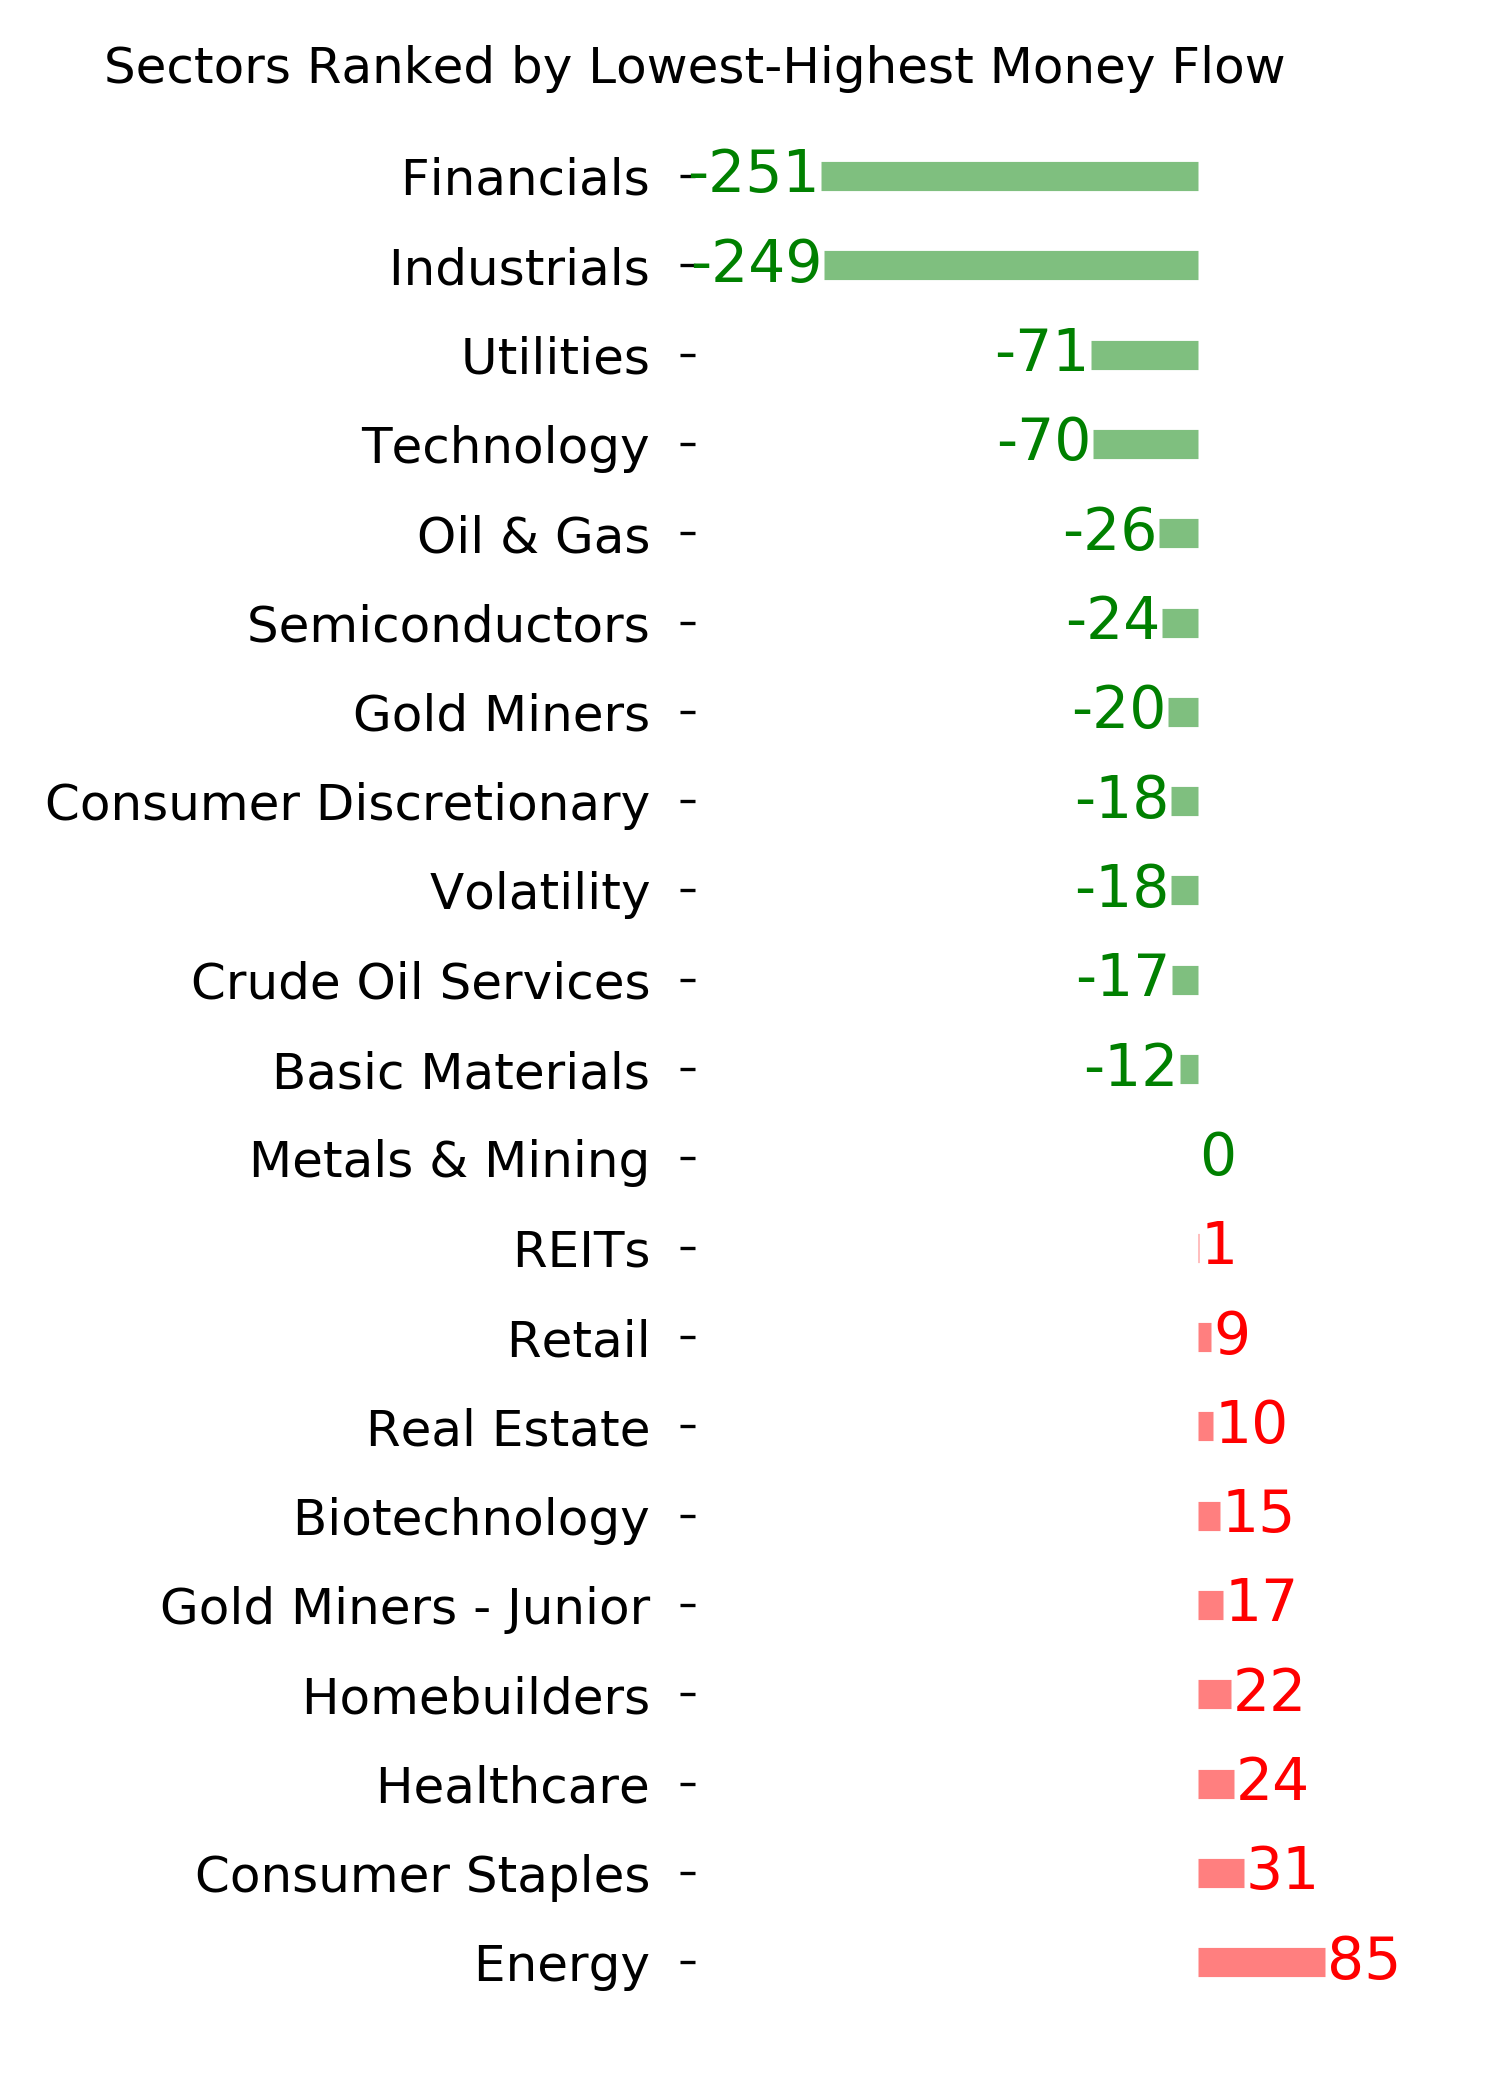
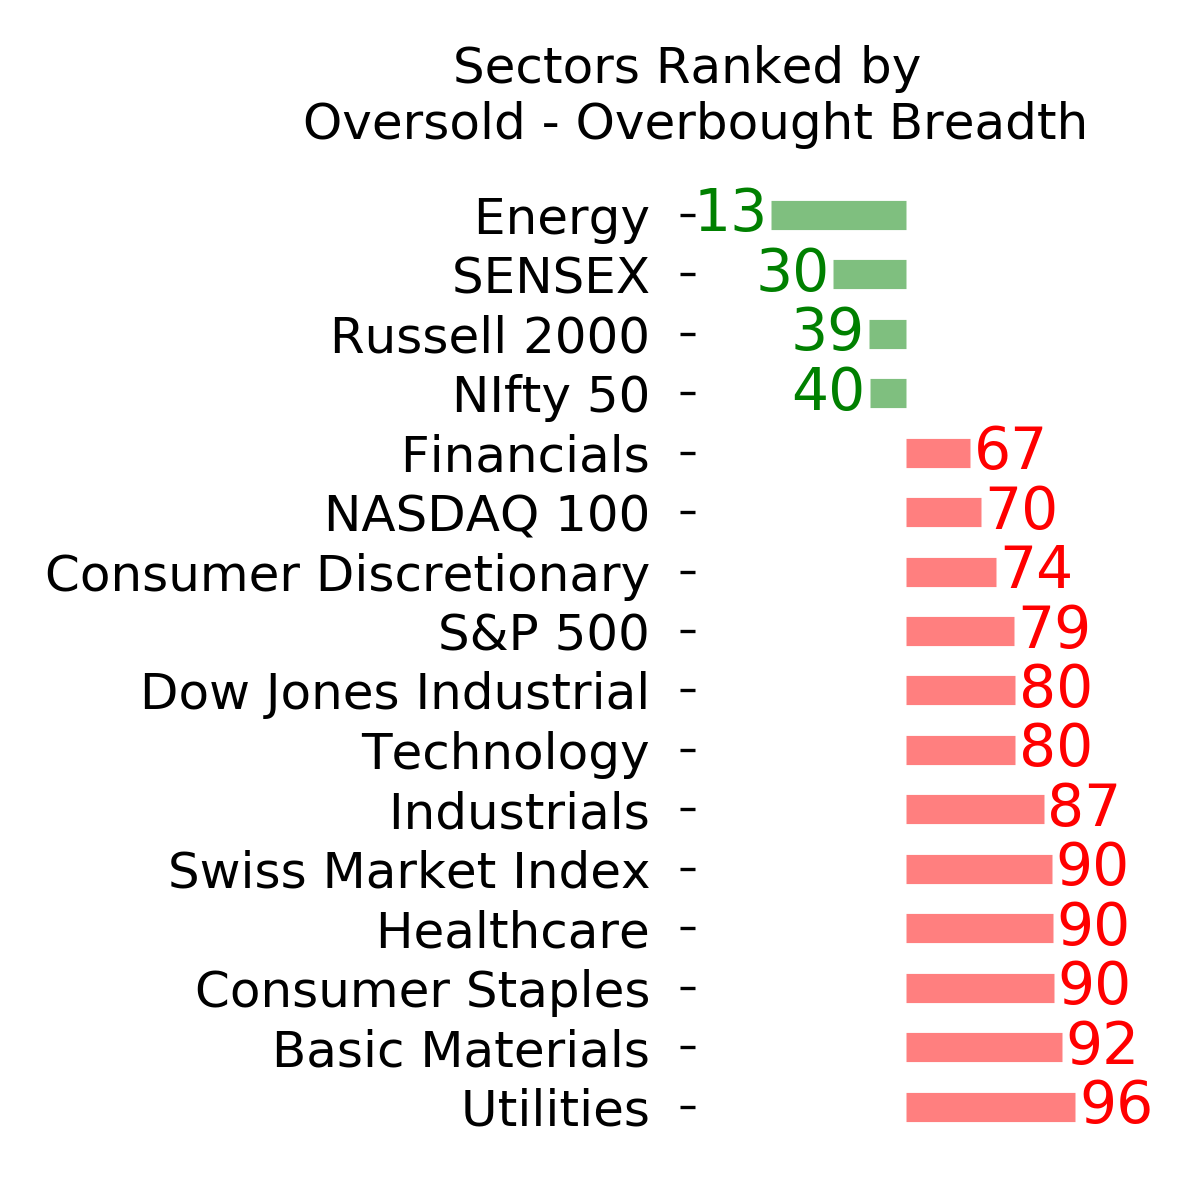
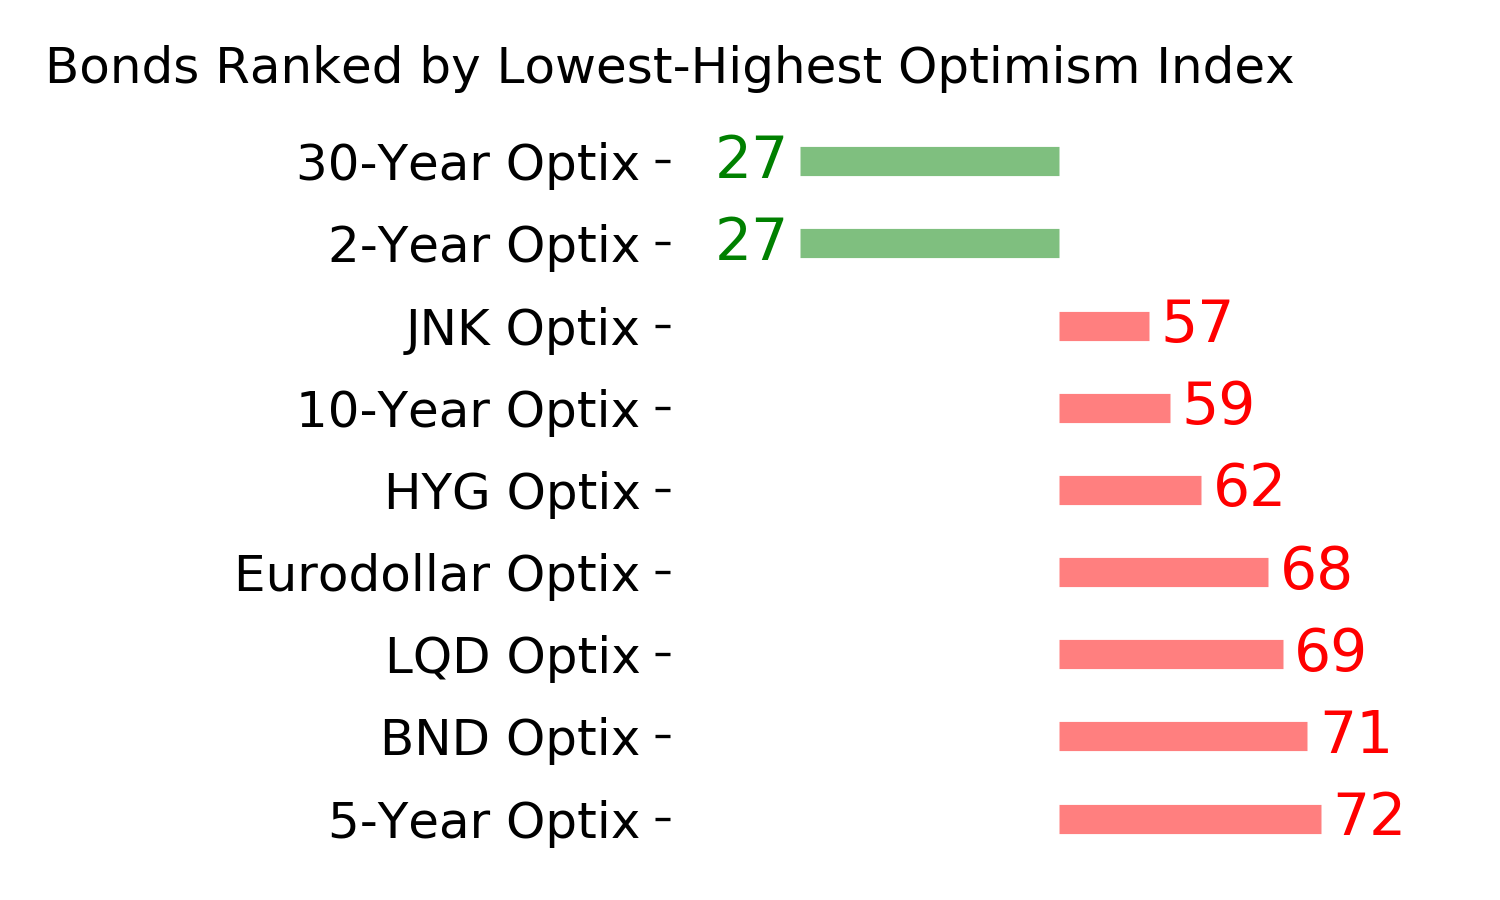
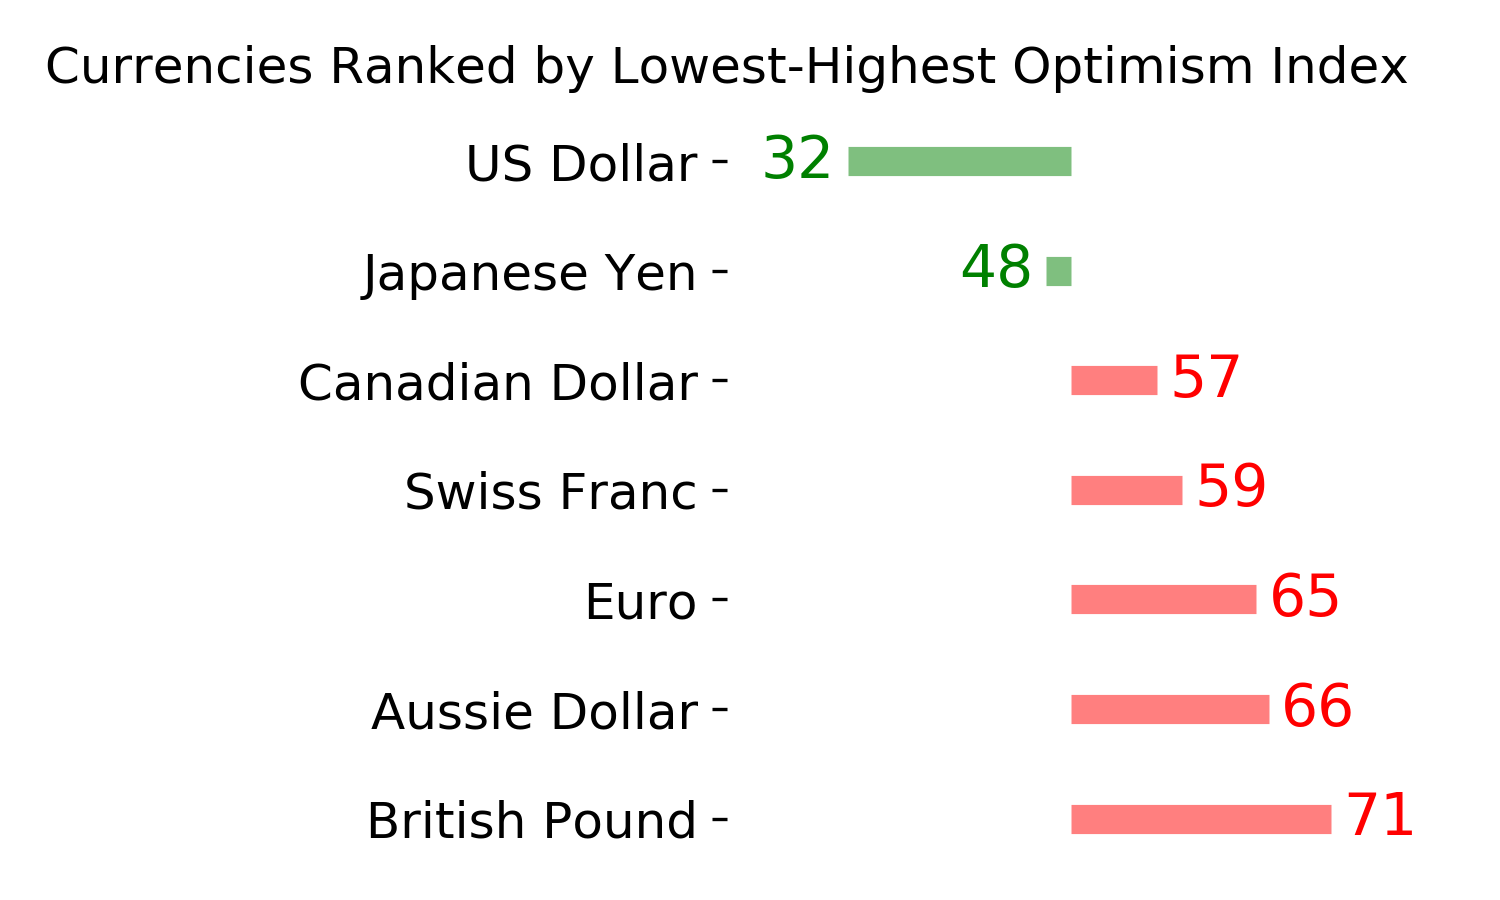
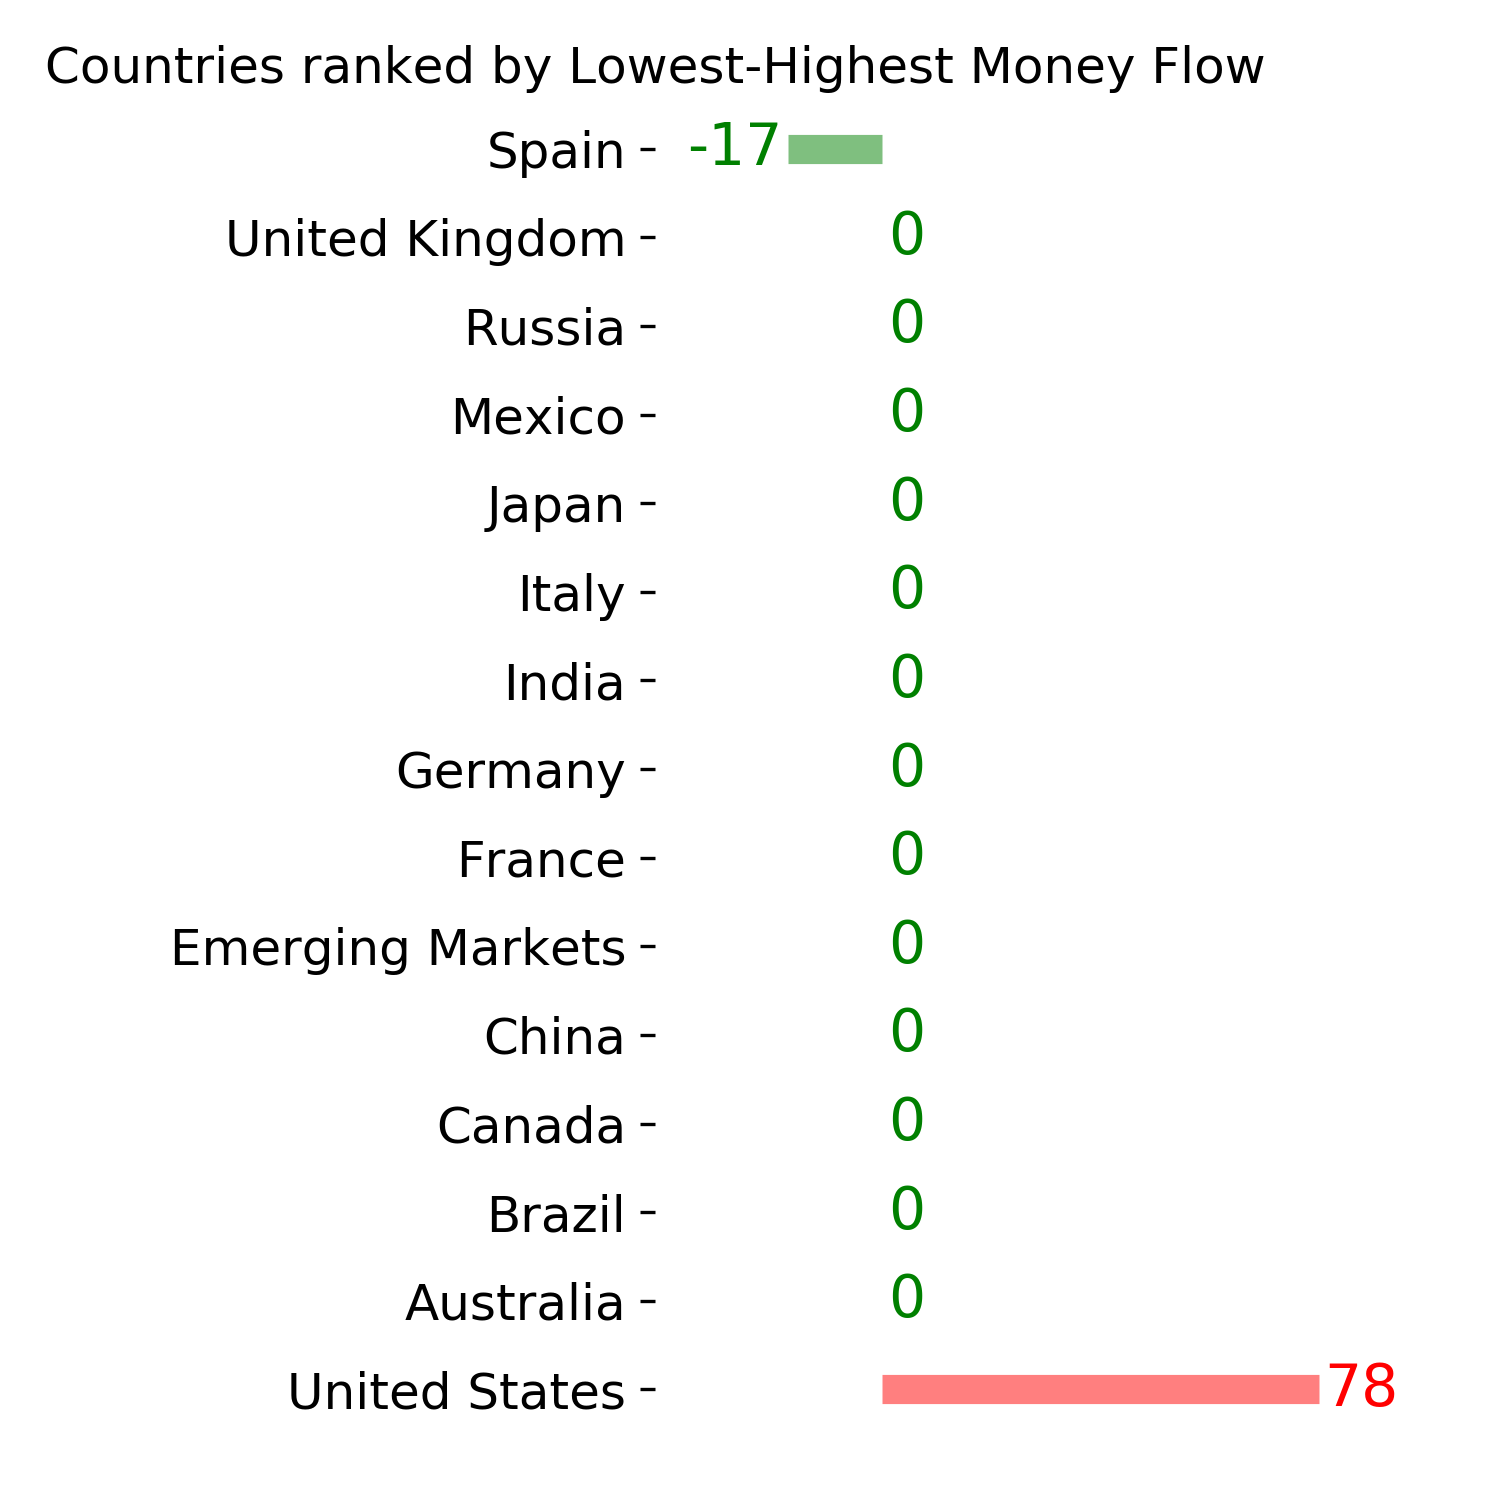
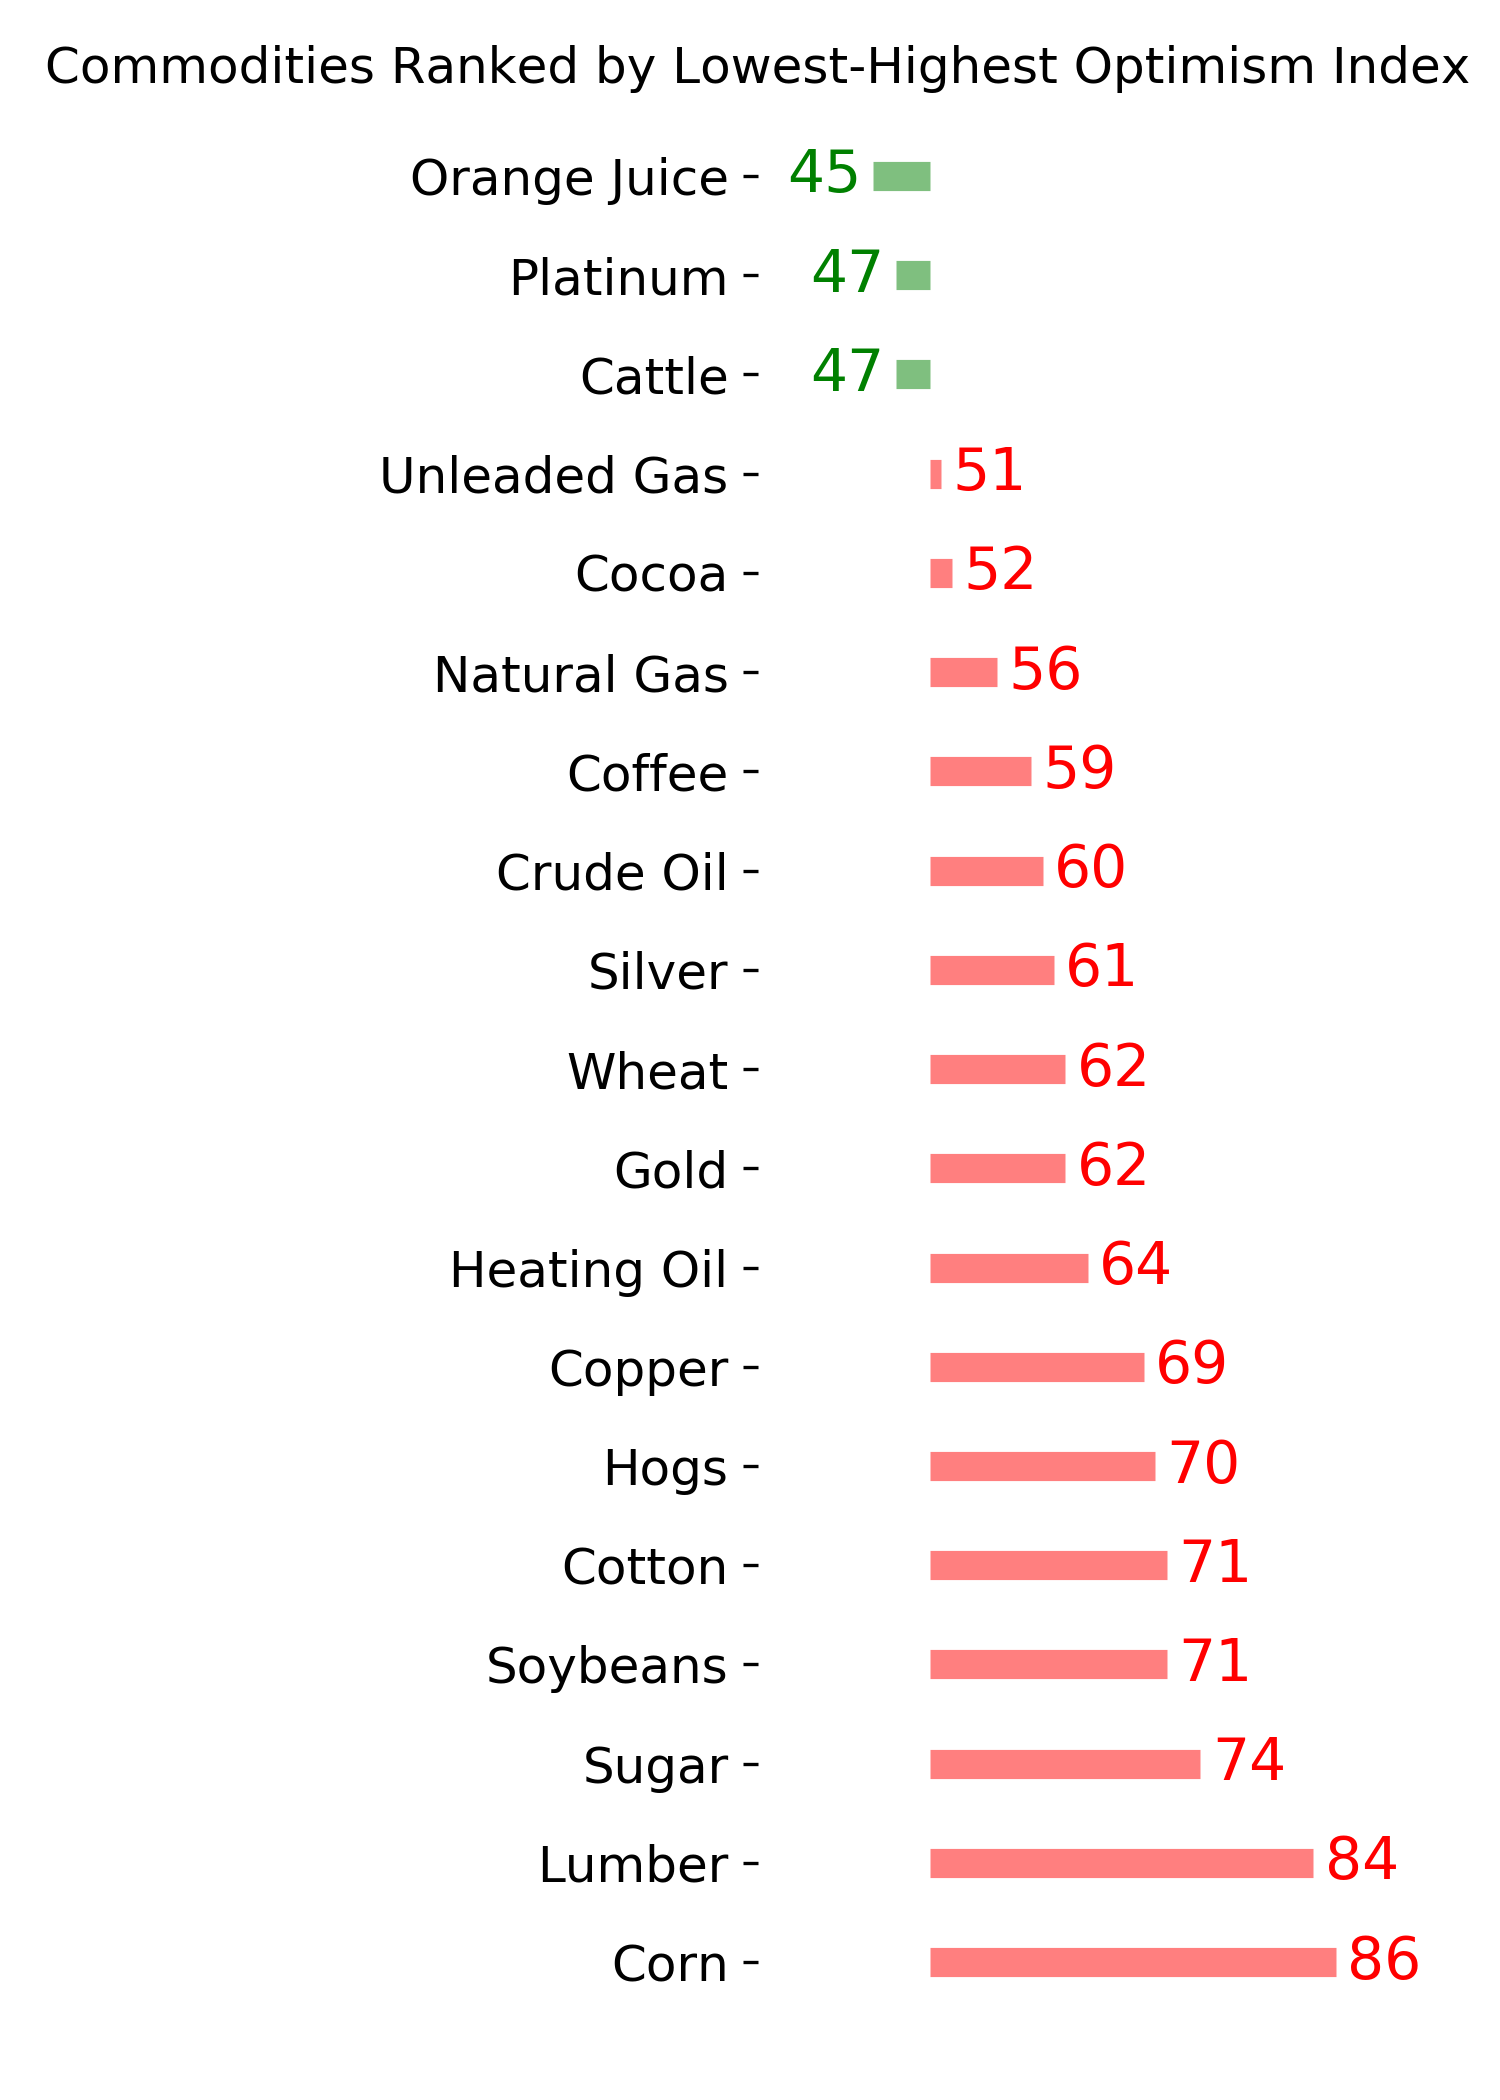
Ranks
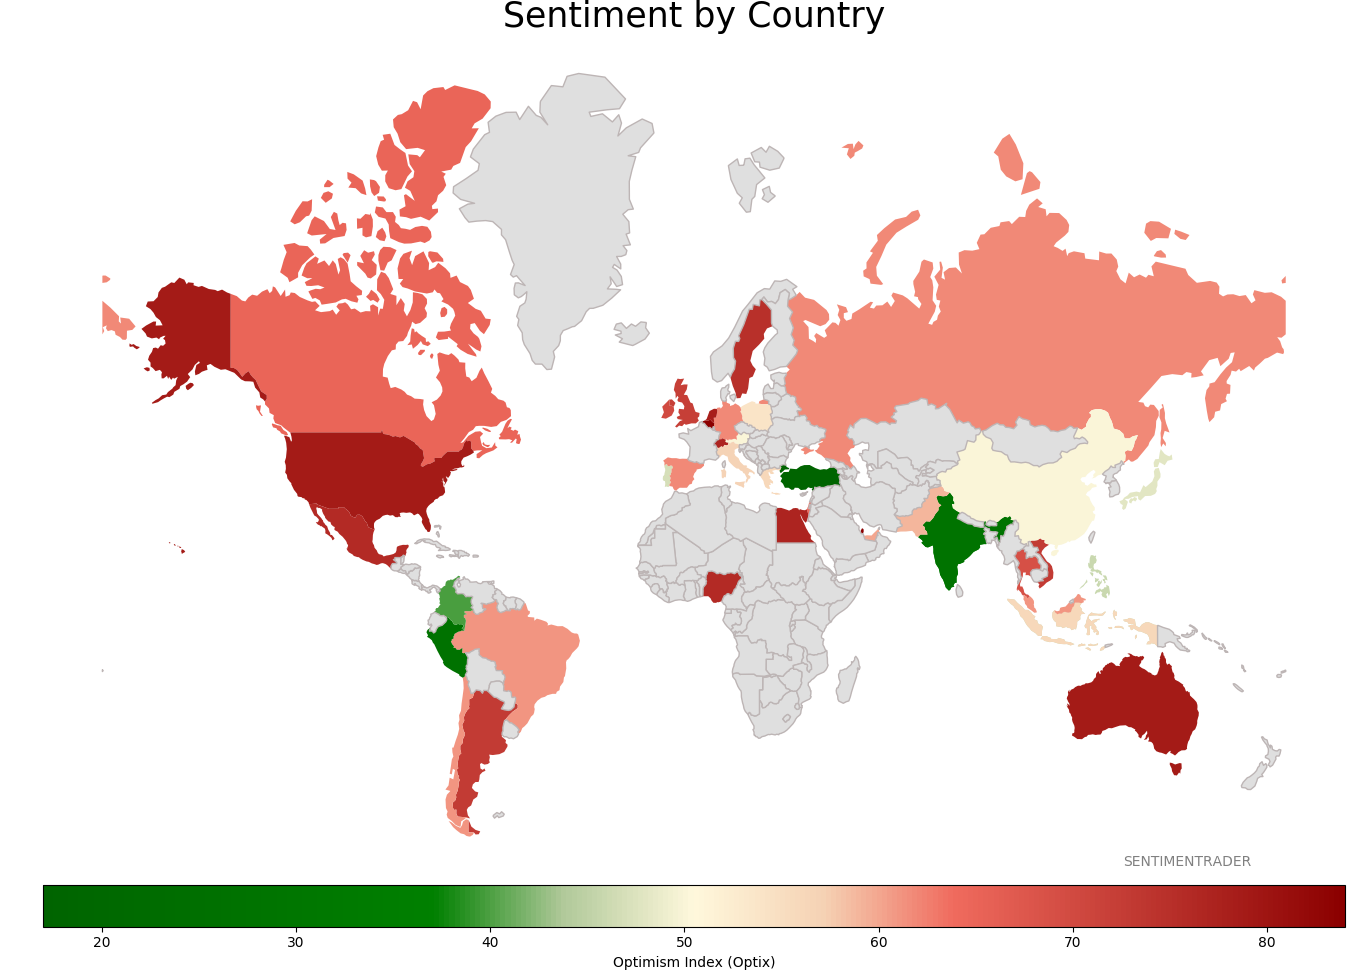
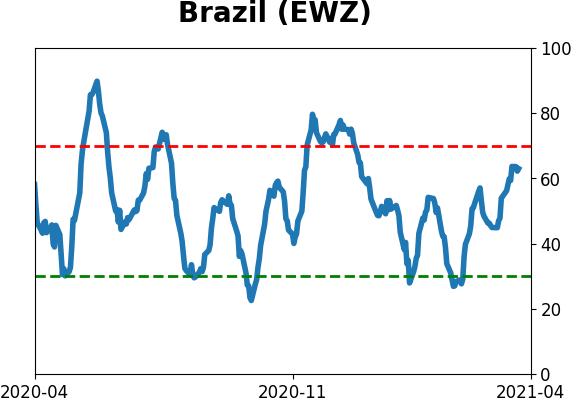
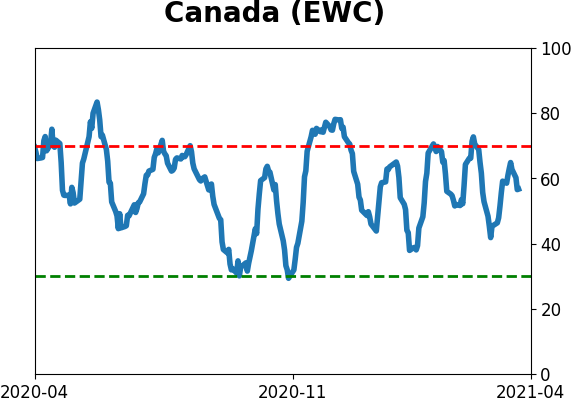
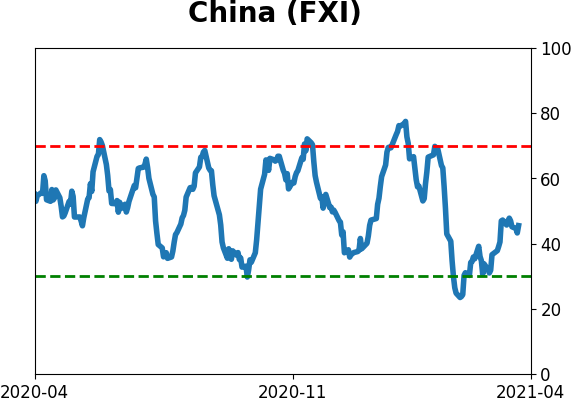
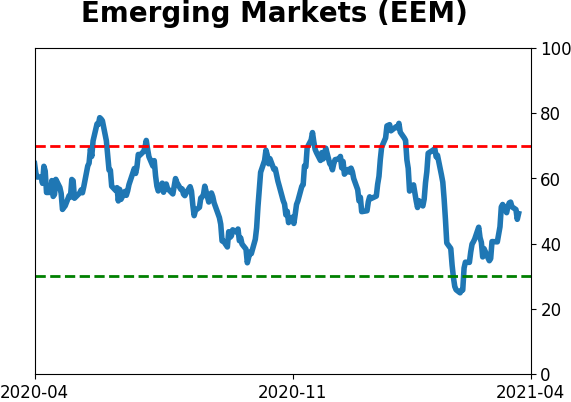
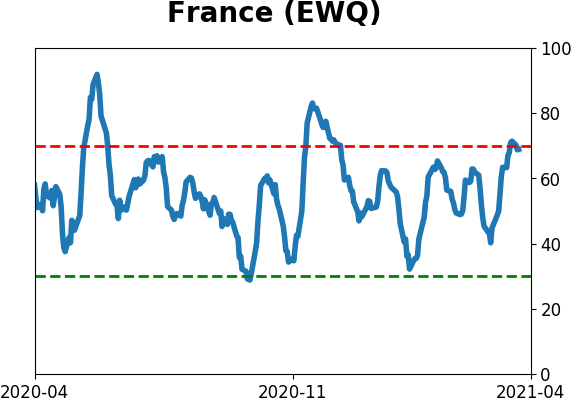
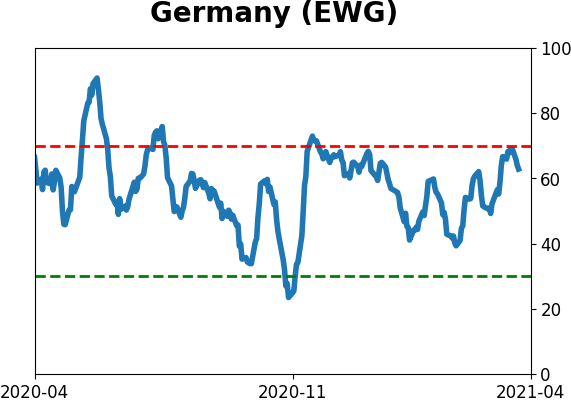
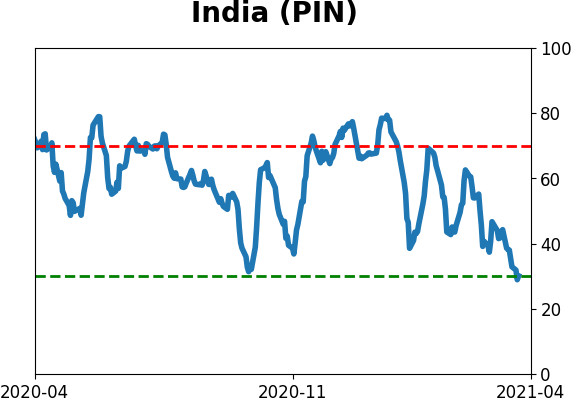
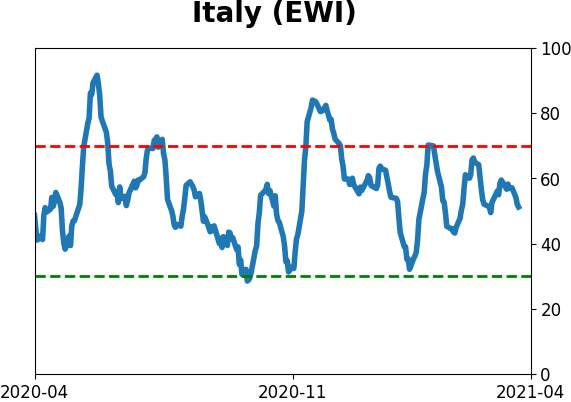
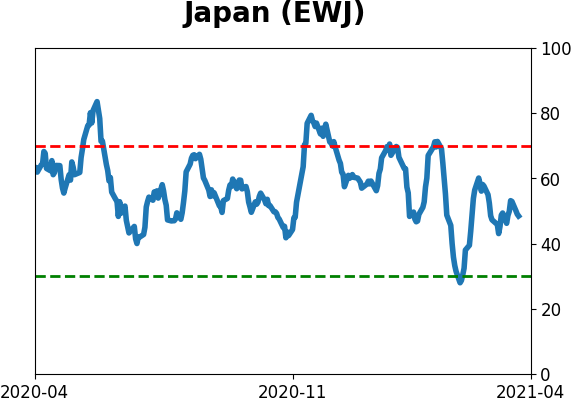
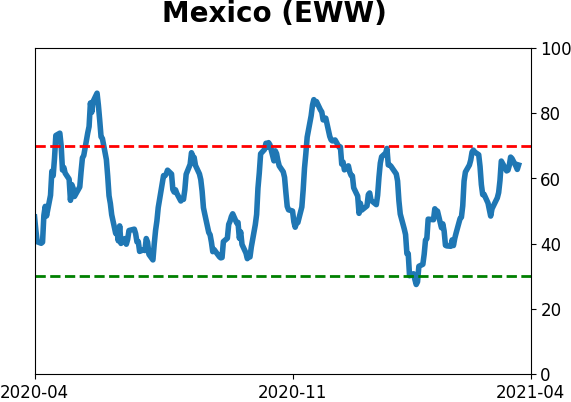
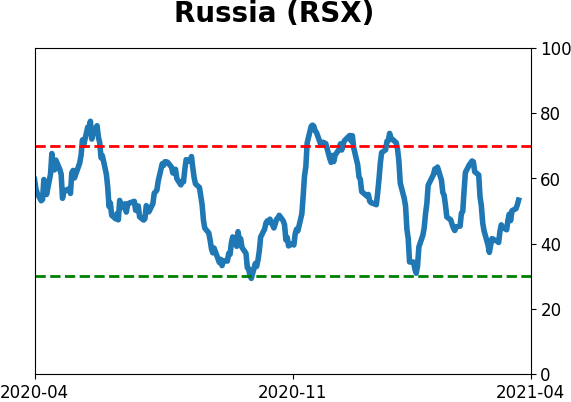
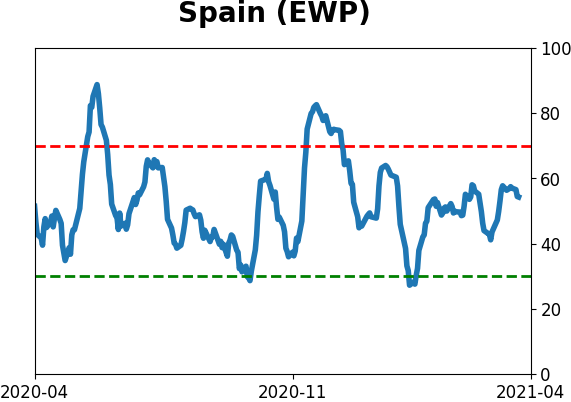
Sentiment Around The World
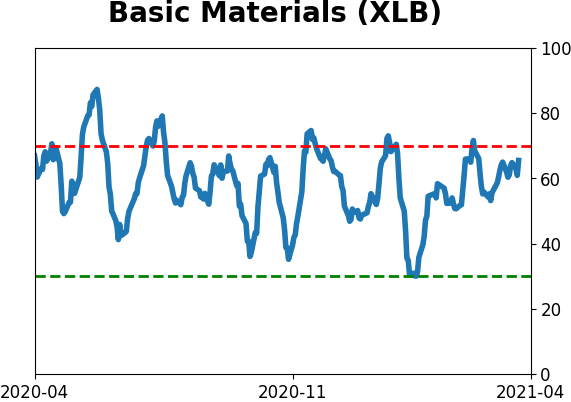
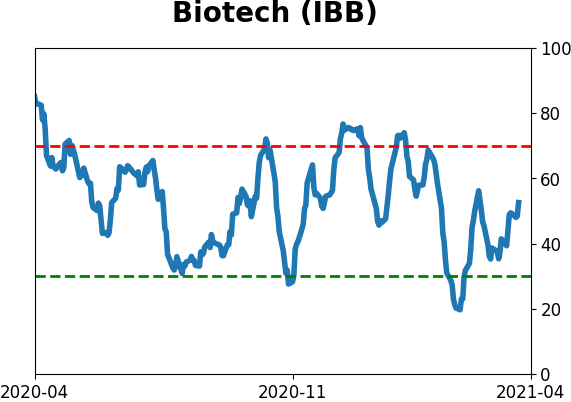
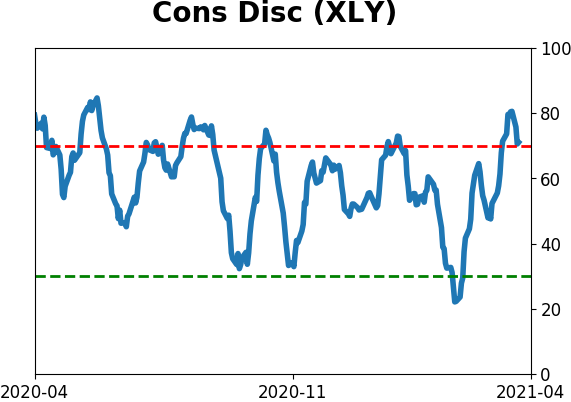
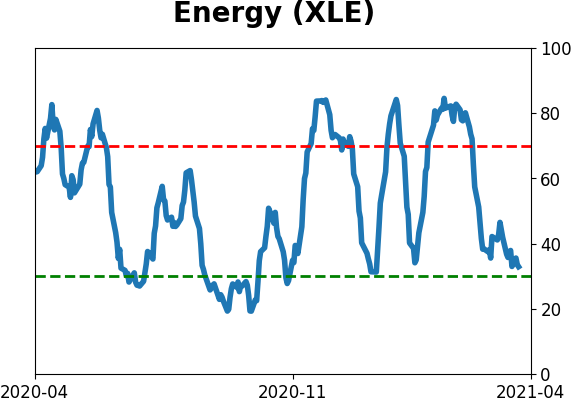
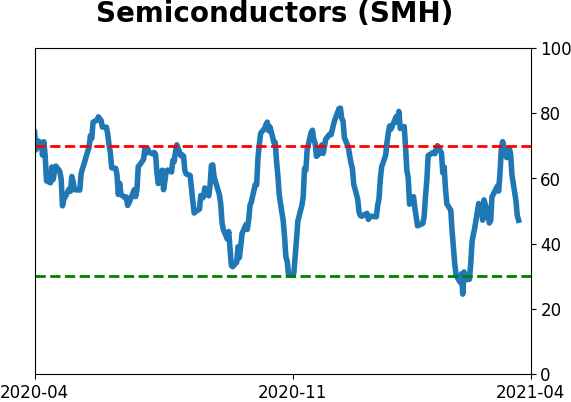
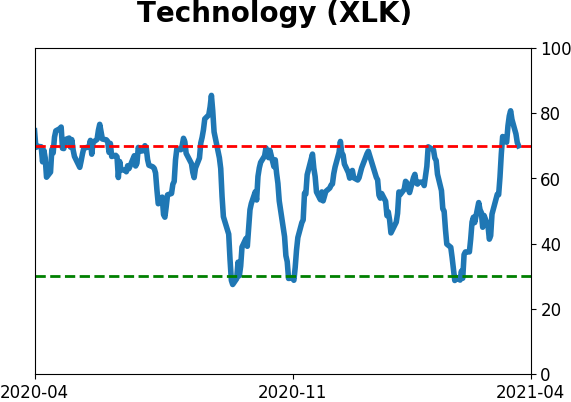
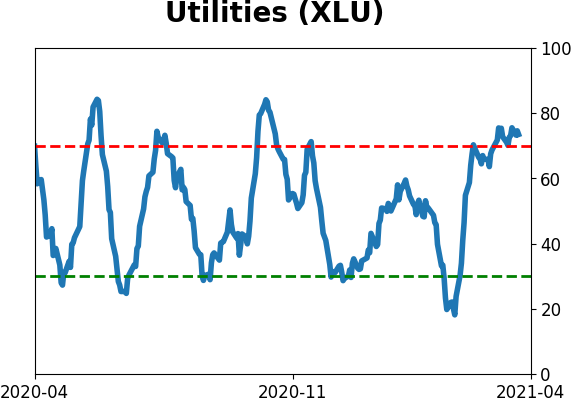
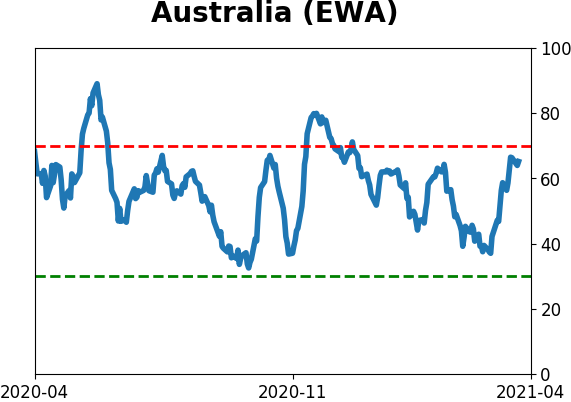
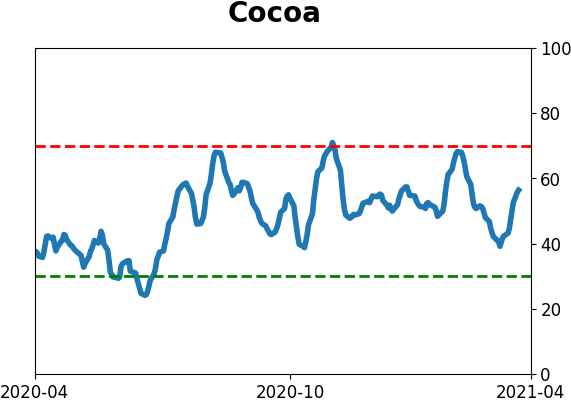
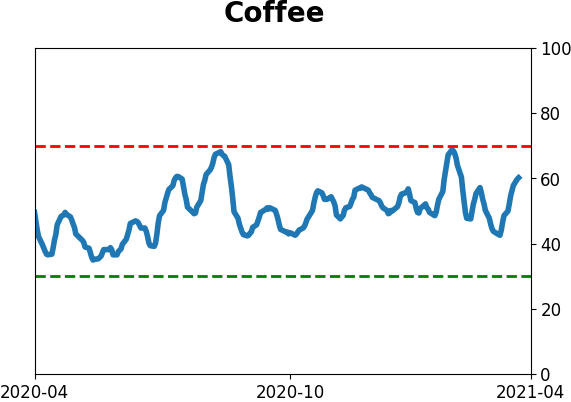
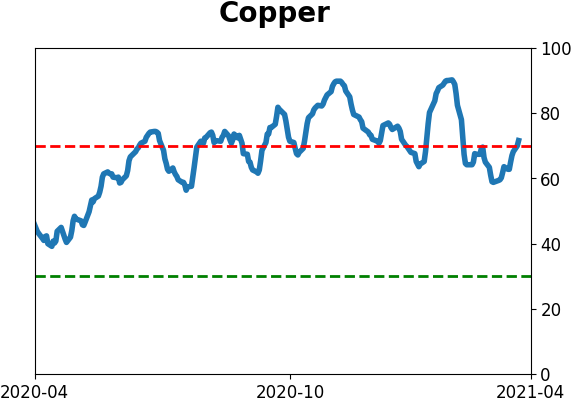
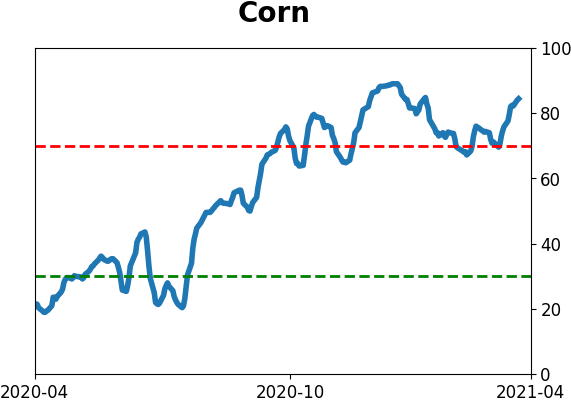
Optimism Index Thumbnails
|
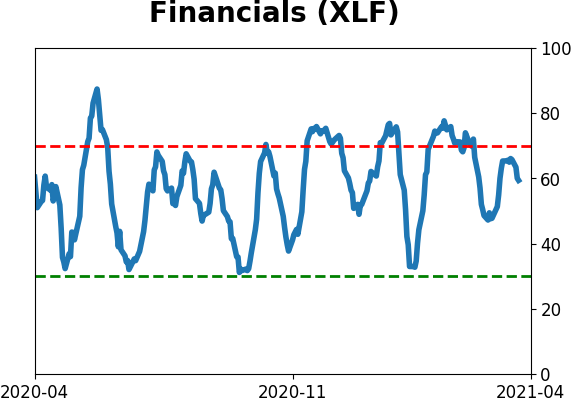
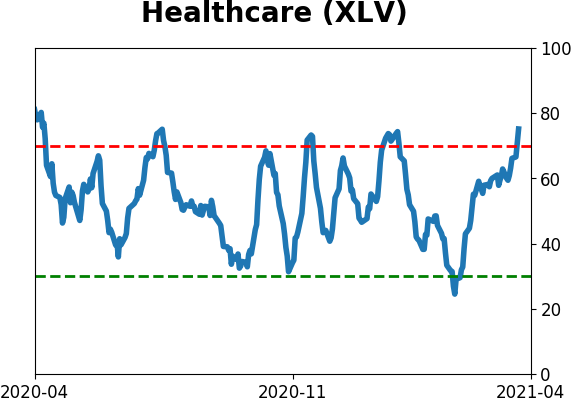
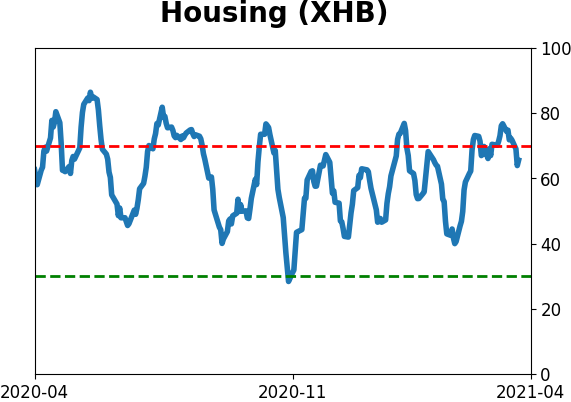
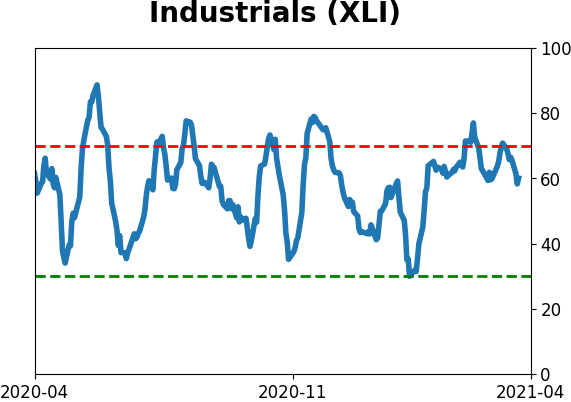
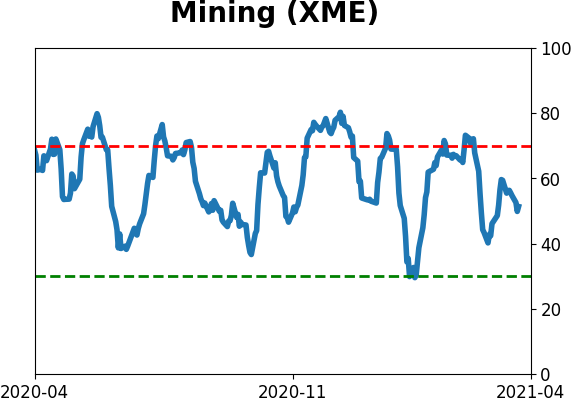
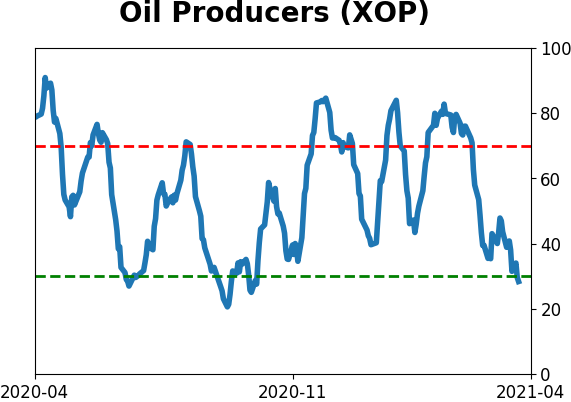
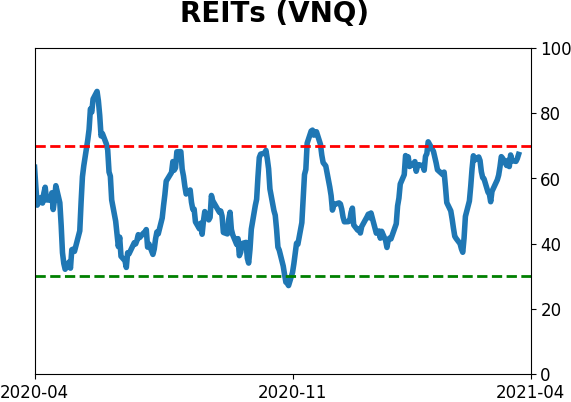
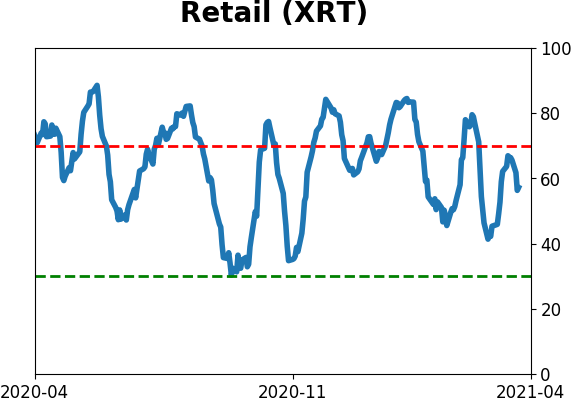
Sector ETF's - 10-Day Moving Average
|
|
|
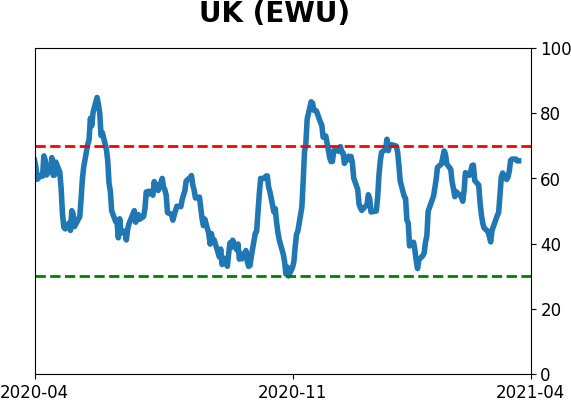
Country ETF's - 10-Day Moving Average
|
|
|
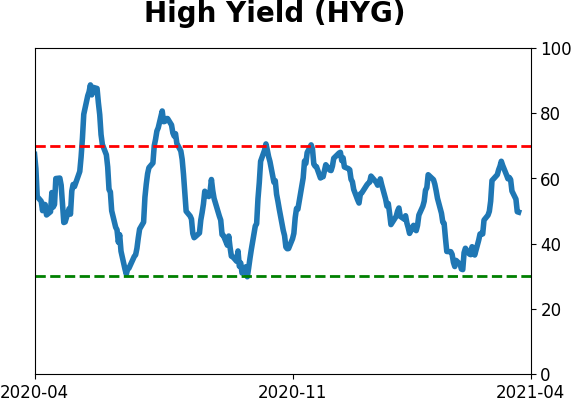
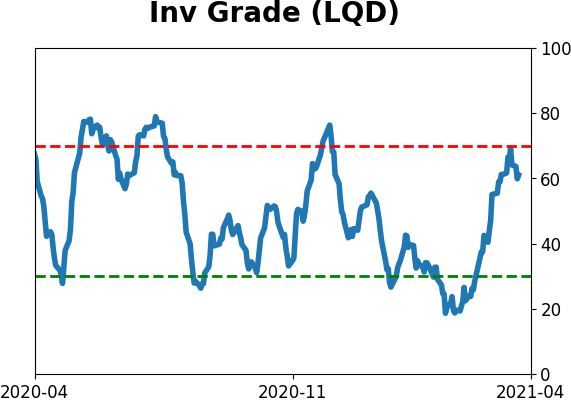
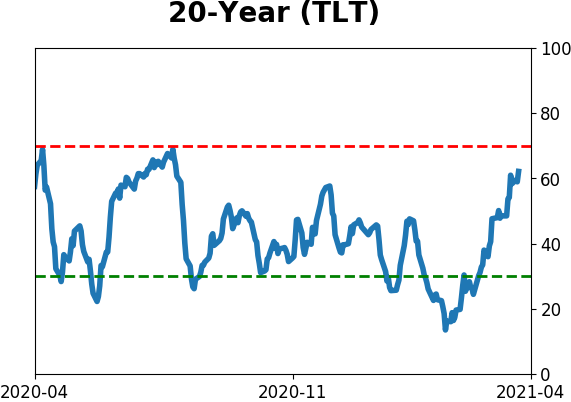
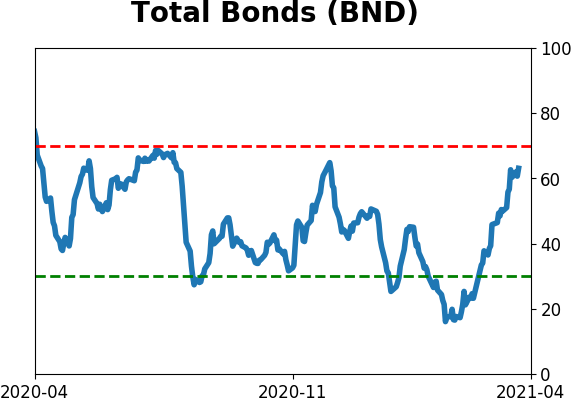
Bond ETF's - 10-Day Moving Average
|
|
|
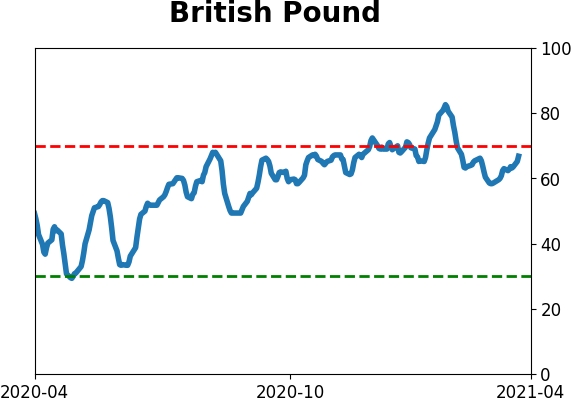
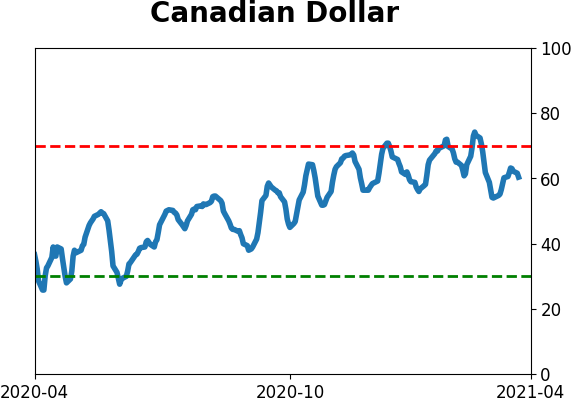
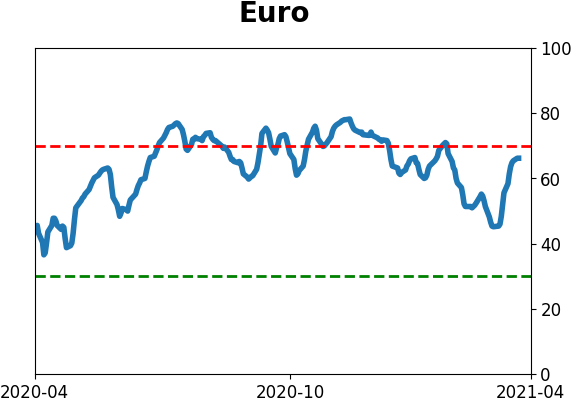
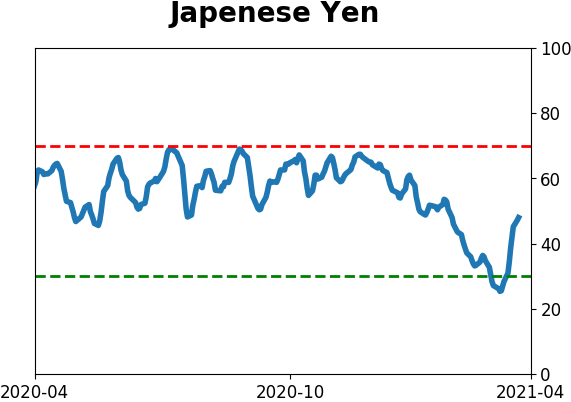
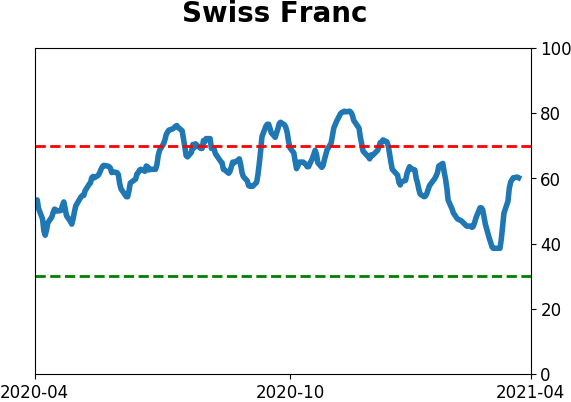
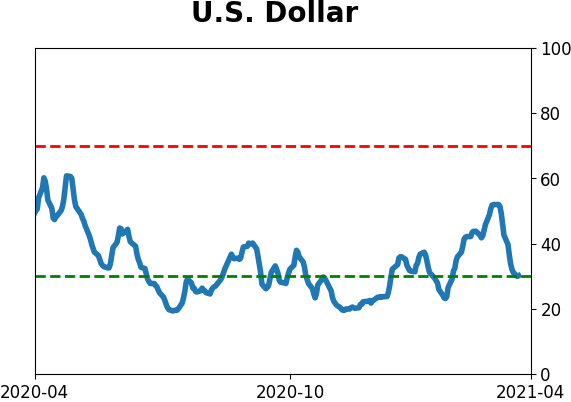
Currency ETF's - 5-Day Moving Average
|
|
|
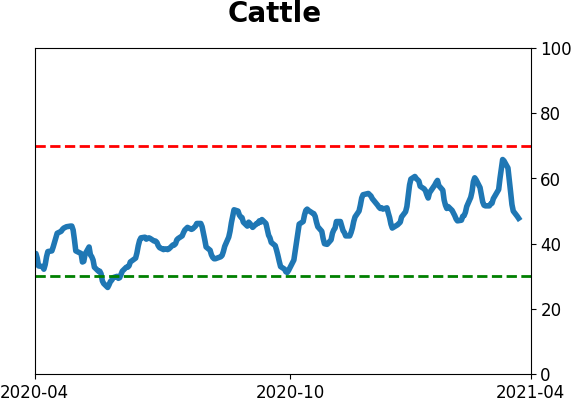
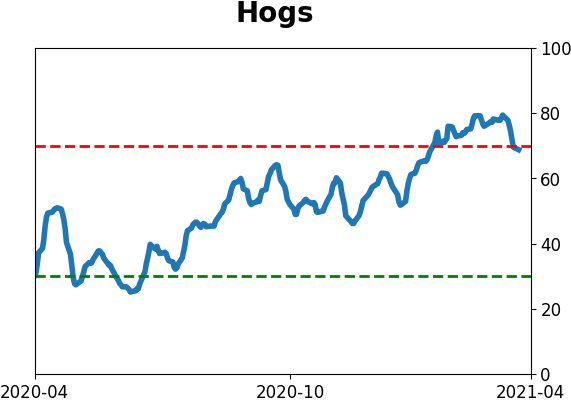
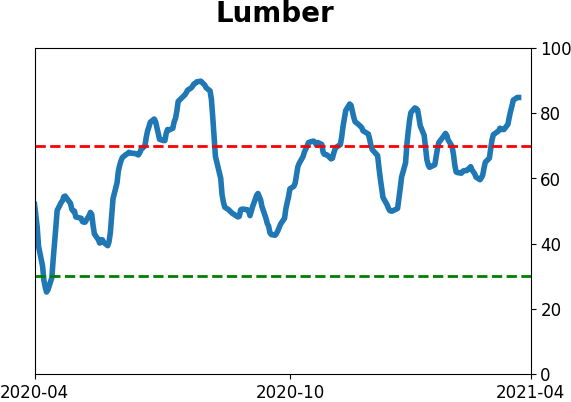
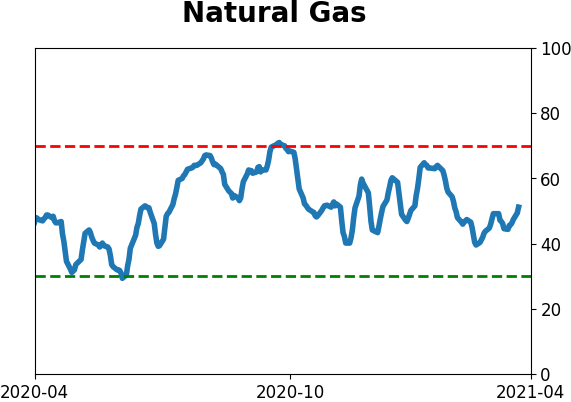
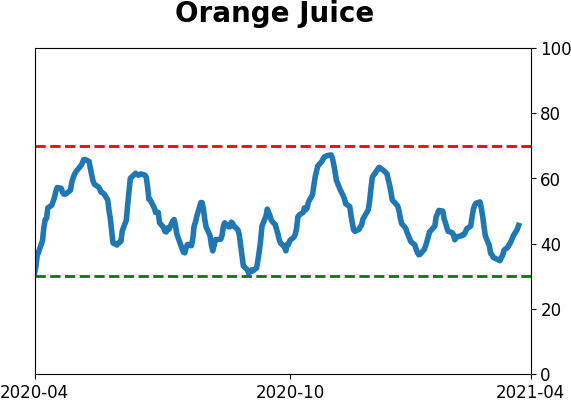
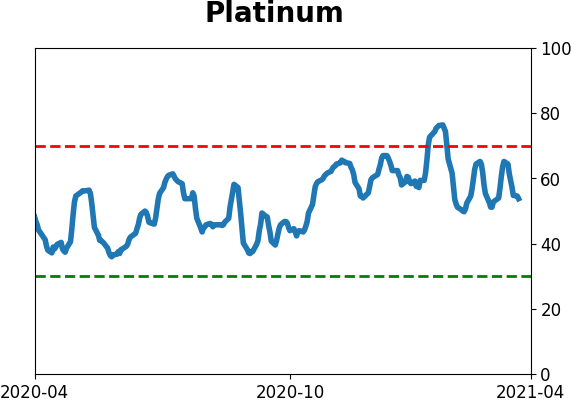
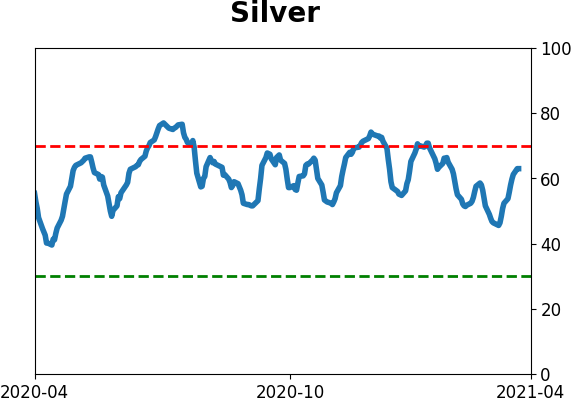
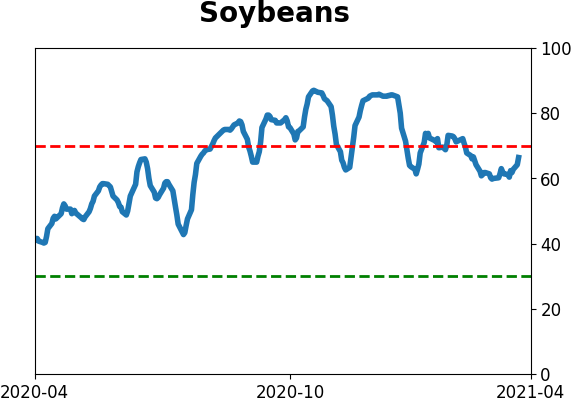
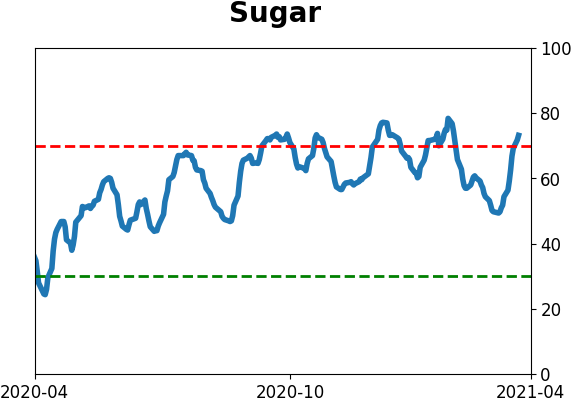
Commodity ETF's - 5-Day Moving Average
|
|