Headlines
|
|
Highly valued and with few consequences:
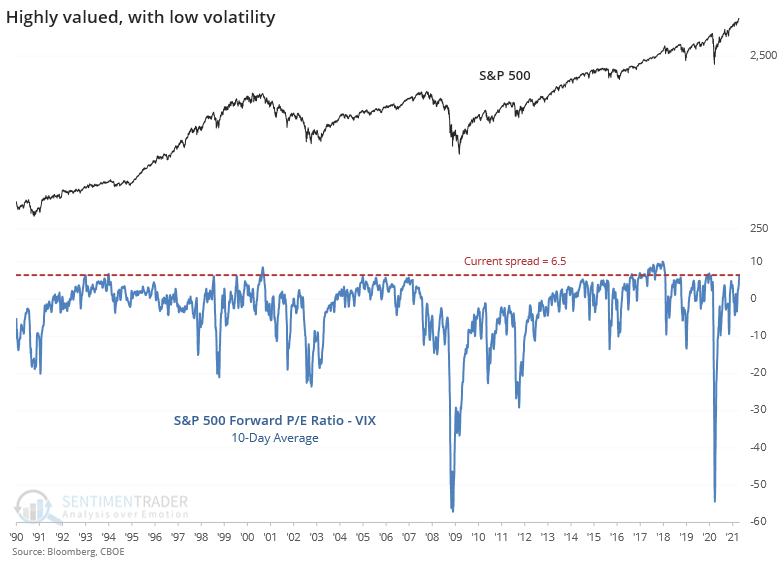
The ratio of the S&P 500's forward price/earnings multiple to the VIX "fear gauge" has reached an extreme rarely seen over the past 30 years. Other extremes preceded a decline in valuation and a rise in volatility.
Iceberg ahead: Thanks to continued deterioration in SPACs accompanied by biotech troubles, there were more 52-week lows than 52-week highs on the Nasdaq on Tuesday. This comes only days after the drivers of the rally pushed the Nasdaq 100 to an all-time high. This triggered a Titanic Syndrome warning, which isn't a big worry given that so far it's been isolated. If it continues over multiple sessions and spreads to the NYSE, then it will be more of an issue. The Backtest Engine shows that even over the past 3 years, the Nasdaq 100 managed to show a gain a month after other signals only 18 out of 38 times, averaging a return of -0.9.
Bottom Line:
See the Outlook & Allocations page for more details on these summaries STOCKS: Weak sell
The extreme speculation registered in January and February is starting to get wrung out. Internal dynamics have mostly held up, so a return to neutral sentiment conditions would improve the forward risk/reward profile substantially. We're still a ways off from that. BONDS: Weak buy
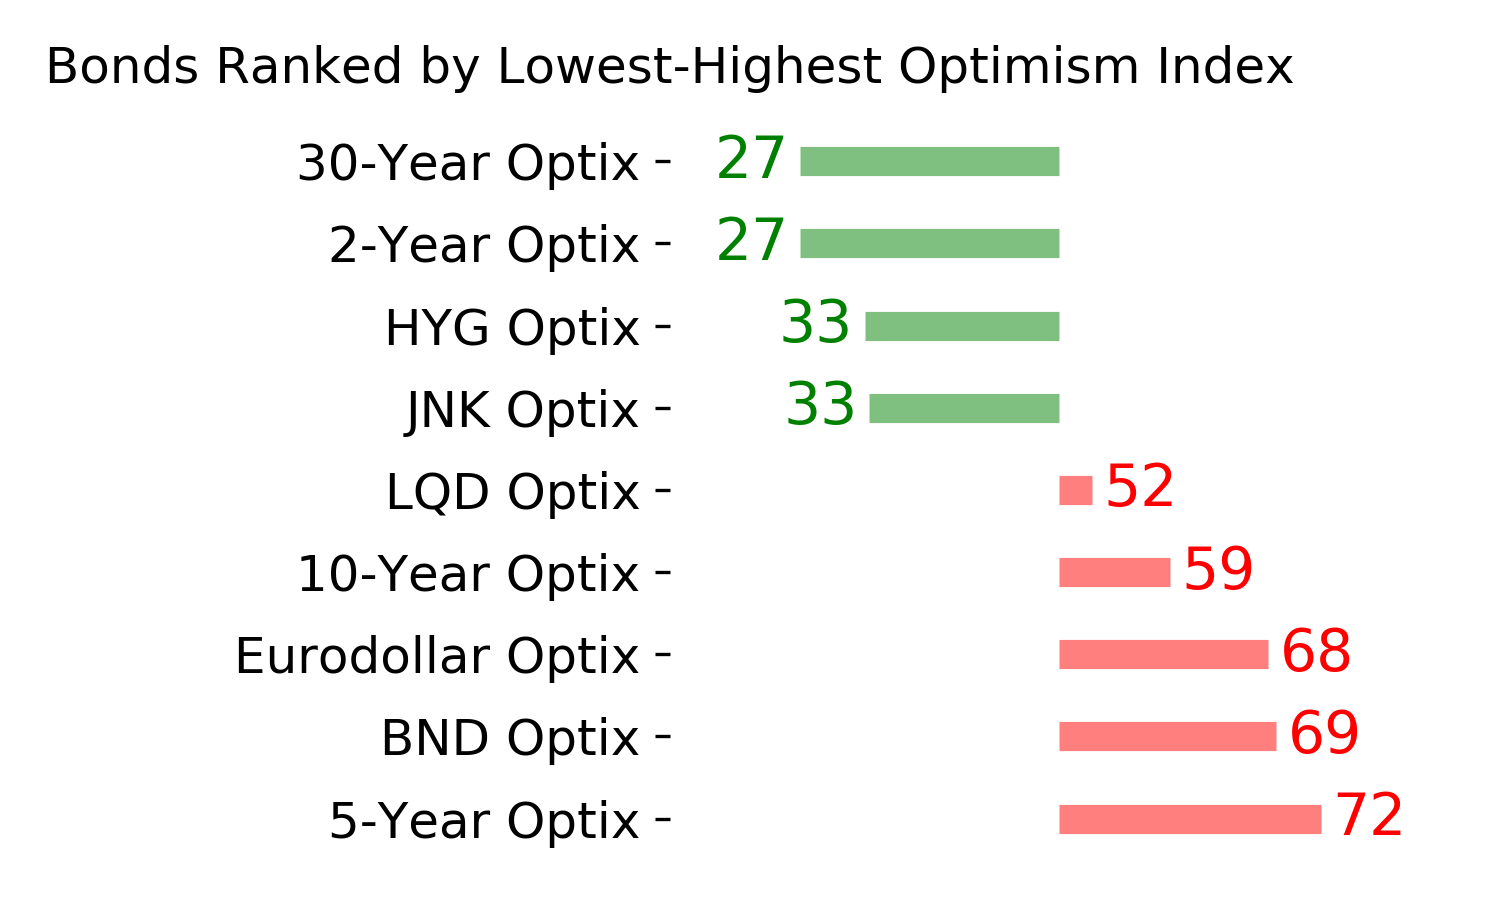
Various parts of the market have been hit in recent weeks, with mild oversold conditions. The Bond Optimism Index is now about as low as it gets during healthy bond market environments. Fixed income isn't responding well, so that needs to be monitored in case it's transitioning to a longer-term negative market environment. GOLD: Weak buy
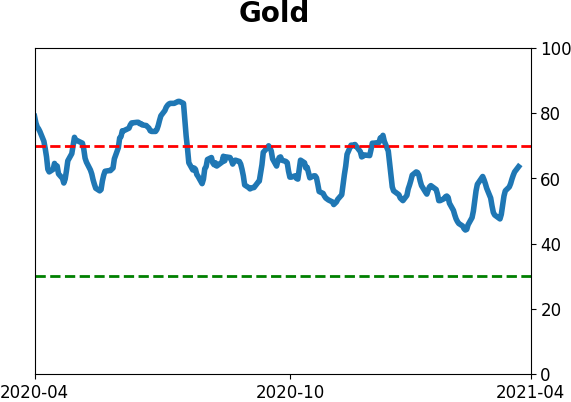
A dollar trying to rebound from a severe short position has weighed on gold and miners. The types of signals they've given in recent weeks, within the context of their recent surge, have usually resulted in higher prices over a medium- to long-term time frame. Like bonds, gold and miners aren't responding very well, and this needs to be monitored.
|
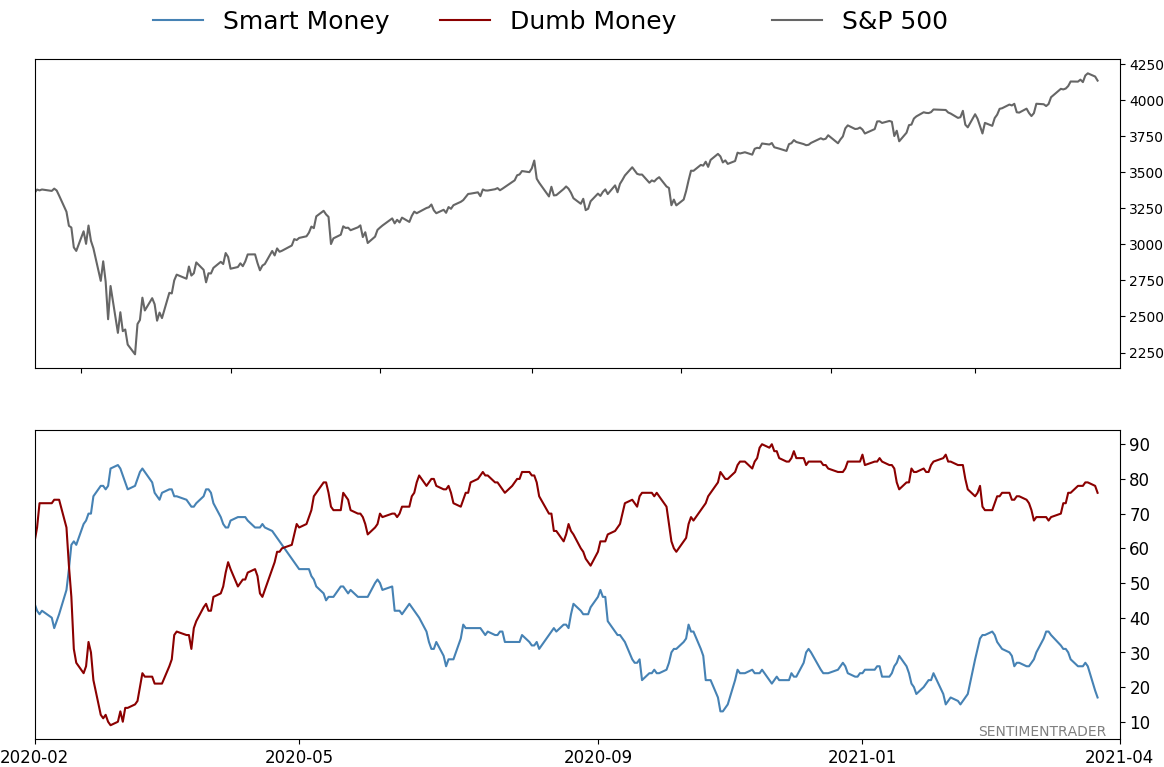
Smart / Dumb Money Confidence
|
Smart Money Confidence: 17%
Dumb Money Confidence: 76%
|
|
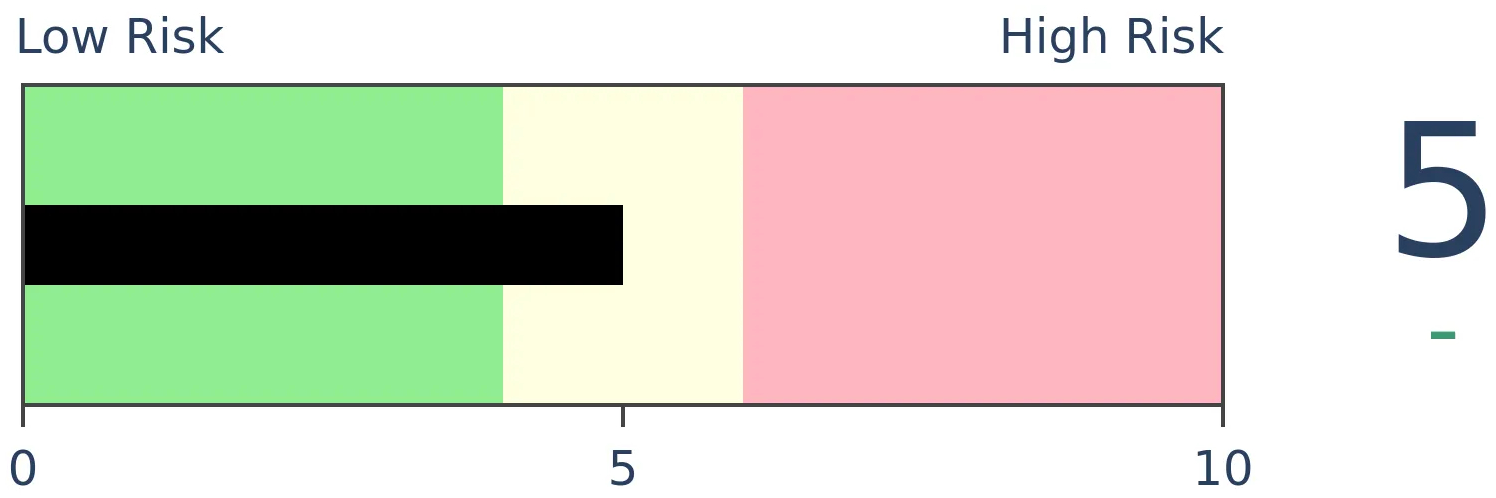
Risk Levels
Stocks Short-Term
|
Stocks Medium-Term
|
|
Bonds

|
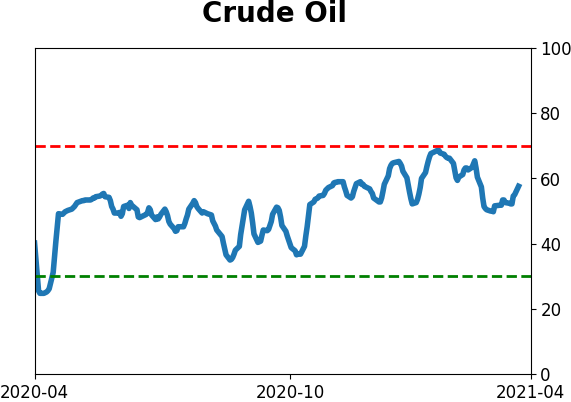
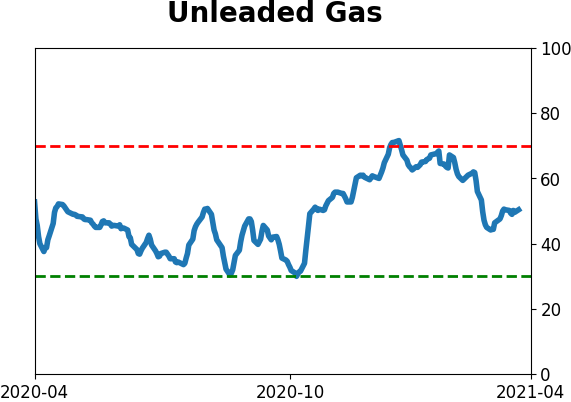
Crude Oil
|
|
Gold

|
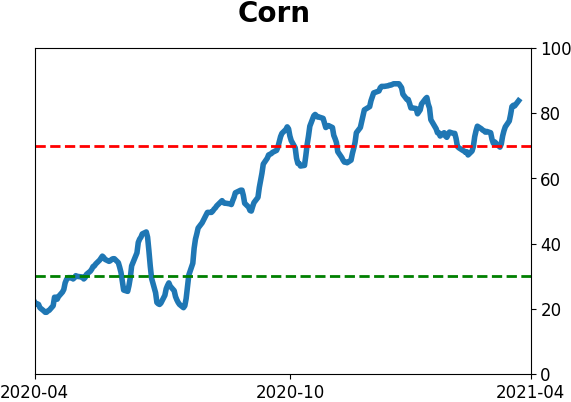
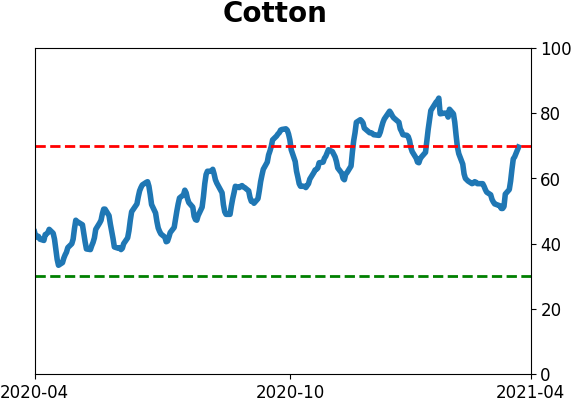
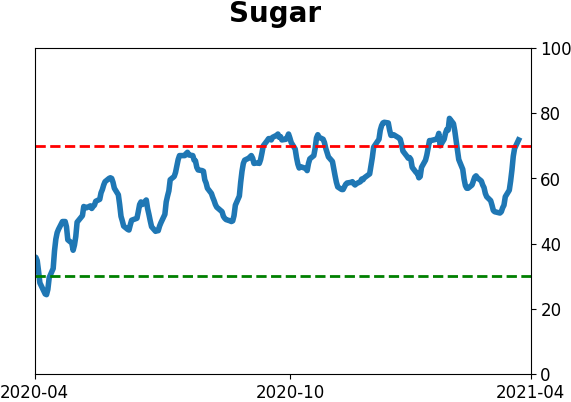
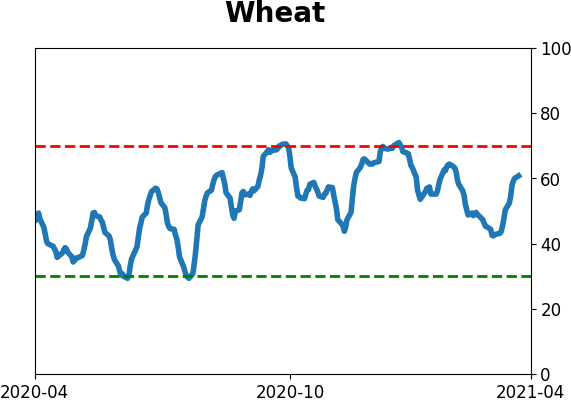
Agriculture
|
|
Research
BOTTOM LINE
The ratio of the S&P 500's forward price/earnings multiple to the VIX "fear gauge" has reached an extreme rarely seen over the past 30 years. Other extremes preceded a decline in valuation and a rise in volatility.
FORECAST / TIMEFRAME
None
|
Investors are pushing the valuation of stocks to extreme heights, and not even having to suffer much volatility along the way. That started to change in a minor way over the last 2 sessions, so we'll have to see if it lasts.
One of the ways we've looked at a shorthand for sentiment over the years is by comparing the S&P 500's forward price/earnings multiple to the VIX "fear gauge." The higher the ratio, the more investors are getting away with pushing valuations higher without much of a consequence.
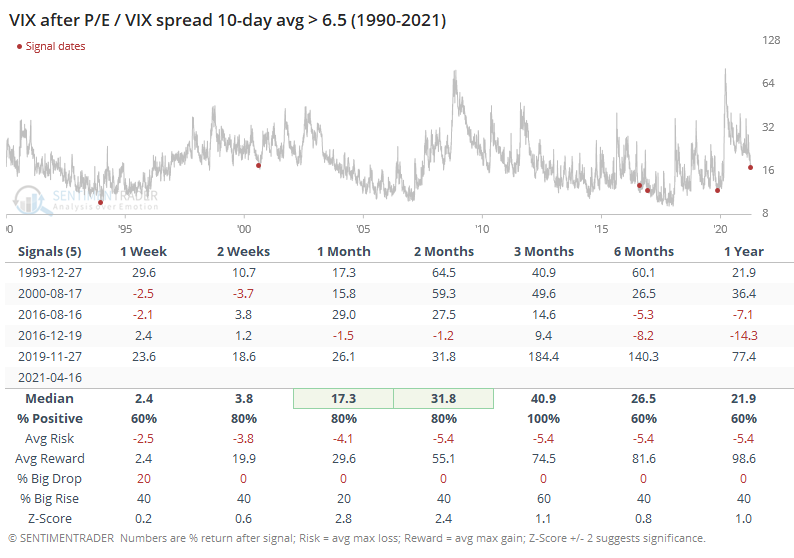
A 10-day average of the spread between those two factors just reached its highest level in a year. This has now been added as a premium chart for daily updates and backtesting.
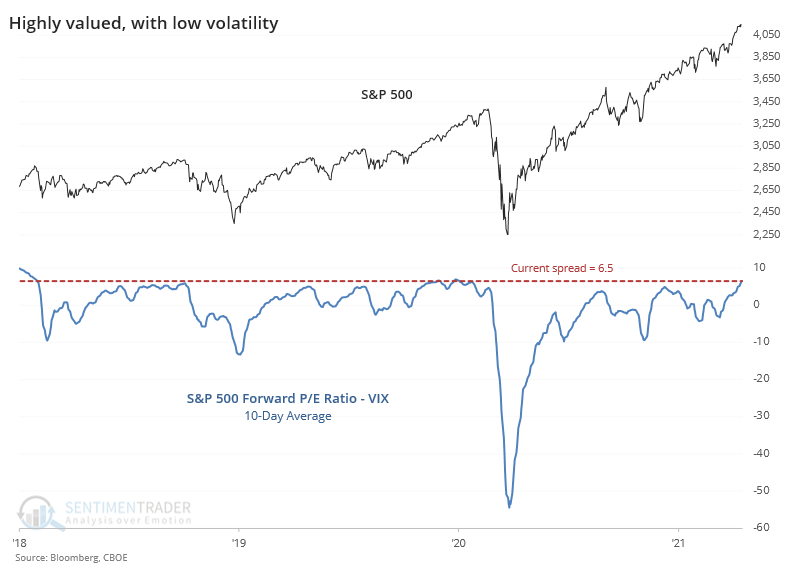
Zooming out over the past 30 years, the current spread is still among the highest readings.
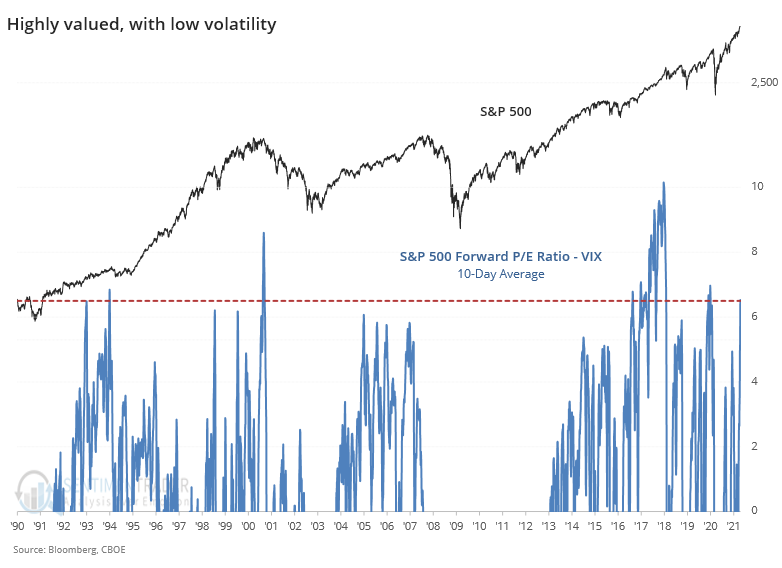
Some of the big selloffs really skewed the negative stretches for this spread, so if we only look at the positive ones, then the current extreme sticks out a bit more.
After other times the 10-day average of the spread reached its current level, the S&P struggled, except for the "nothing matters" market of 2017. Certainly, it's hard to rely on a small sample size, especially when one of the signals was a big outlier.
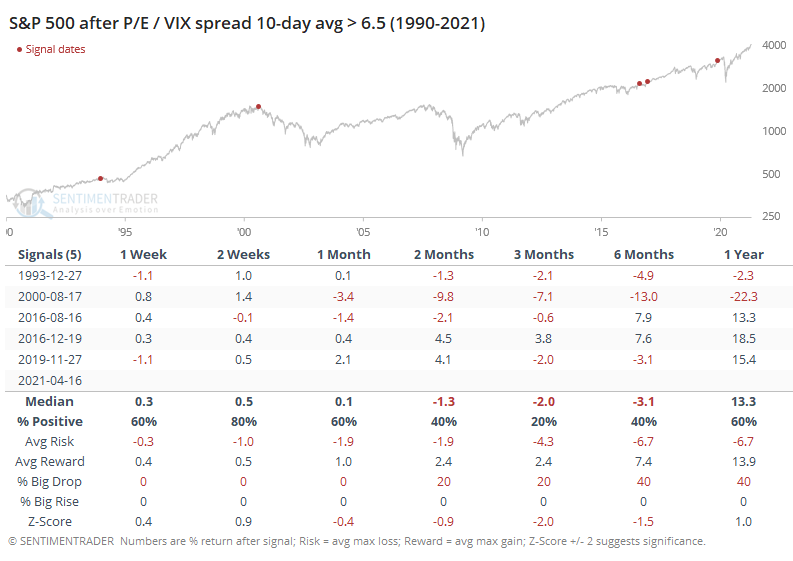
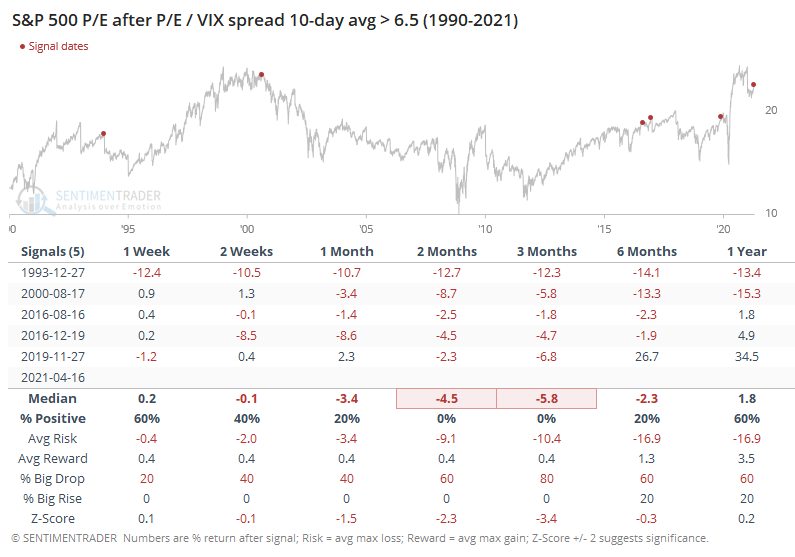
Notably, the S&P's price/earnings multiple declined every time, even after the 2017 signal. This was not a good setup if you want to believe that investors will be willing to keep pushing valuation multiples higher.
Also notable is that the VIX rose every time. Even during the 2017 mo-mo market, the VIX managed to rise over the next few months.
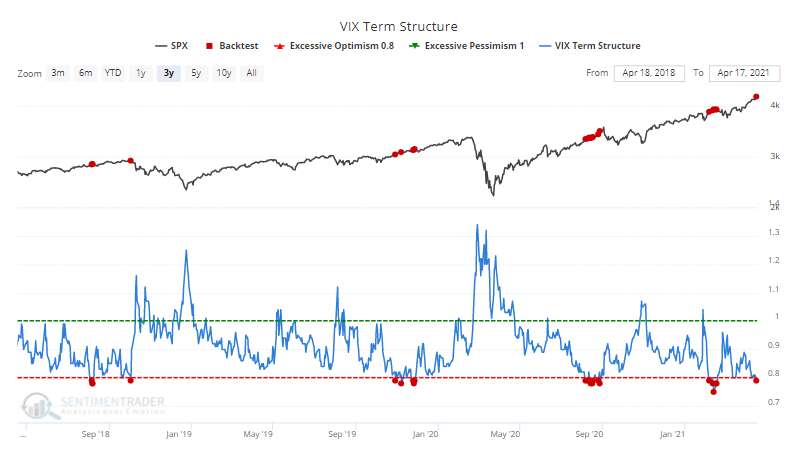
These calm conditions in the VIX are focused mostly on the nearer-term. Traders are pricing in a higher likelihood of bigger movements in the months ahead, so the VIX Term Structure is extreme. That didn't matter at all in 2017; other years typically saw any further gains given back.
We've seen before that valuations are exceptionally high and it has only gotten more extreme. One change since then is that investors have become much more complacent with those valuations, assuming they will just keep growing. That's when it becomes dangerous.
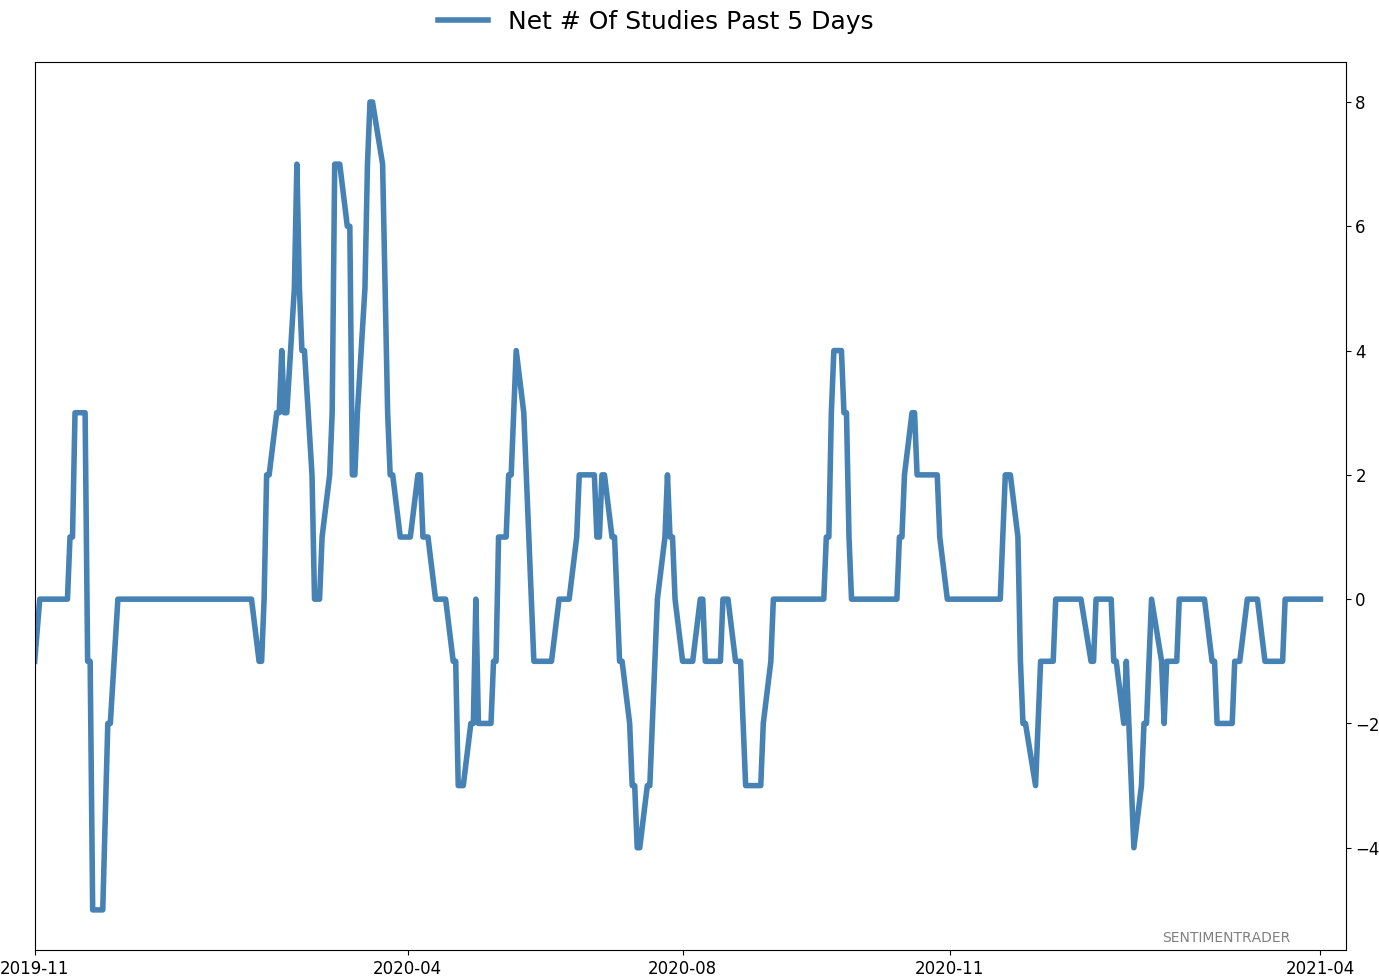
Active Studies
| Time Frame | Bullish | Bearish | | Short-Term | 0 | 0 | | Medium-Term | 0 | 10 | | Long-Term | 11 | 4 |
|
Indicators at Extremes
Portfolio
| Position | Description | Weight % | Added / Reduced | Date | | Stocks | RSP | 4.9 | Reduced 4% | 2021-02-09 | | Bonds | 30.0% BND, 8.8% SCHP | 38.8 | Added 15.1% | 2021-02-18 | | Commodities | GCC | 2.3 | Reduced 2.1%
| 2020-09-04 | | Precious Metals | GDX | 9.0 | Added 0.1% | 2021-02-18 | | Special Situations | 7.3% XLE, 4.8% PSCE | 12.1 | Reduced 5.6% | 2021-02-18 | | Cash | | 32.8 | | |
|
Updates (Changes made today are underlined)
With a market that has seen the kinds of broad participation and big breath thrusts like we did in the fall, it's hard to become too negative. Those kinds of conditions have consistently preceded higher returns over the next 6-12 months. It's the interim that's more of an issue. Even conditions like that haven't prevented some shorter-term pullbacks. And when we combine an environment where speculation is rampant and recent days have seen an increase in cracks under the surface of the indexes, it's enough to become more defensive over a short- to medium-term time frame. We still don't have much confirmation from the price action in the indexes, so those who are more conservative would likely wait before increasing cash levels. I've decreased risk exposure a bit more, mainly in terms of energy stocks and the ANGL fund, while adding more to the broader bond market. RETURN YTD: 6.7% 2020: 8.1%, 2019: 12.6%, 2018: 0.6%, 2017: 3.8%, 2016: 17.1%, 2015: 9.2%, 2014: 14.5%, 2013: 2.2%, 2012: 10.8%, 2011: 16.5%, 2010: 15.3%, 2009: 23.9%, 2008: 16.2%, 2007: 7.8%
|
|
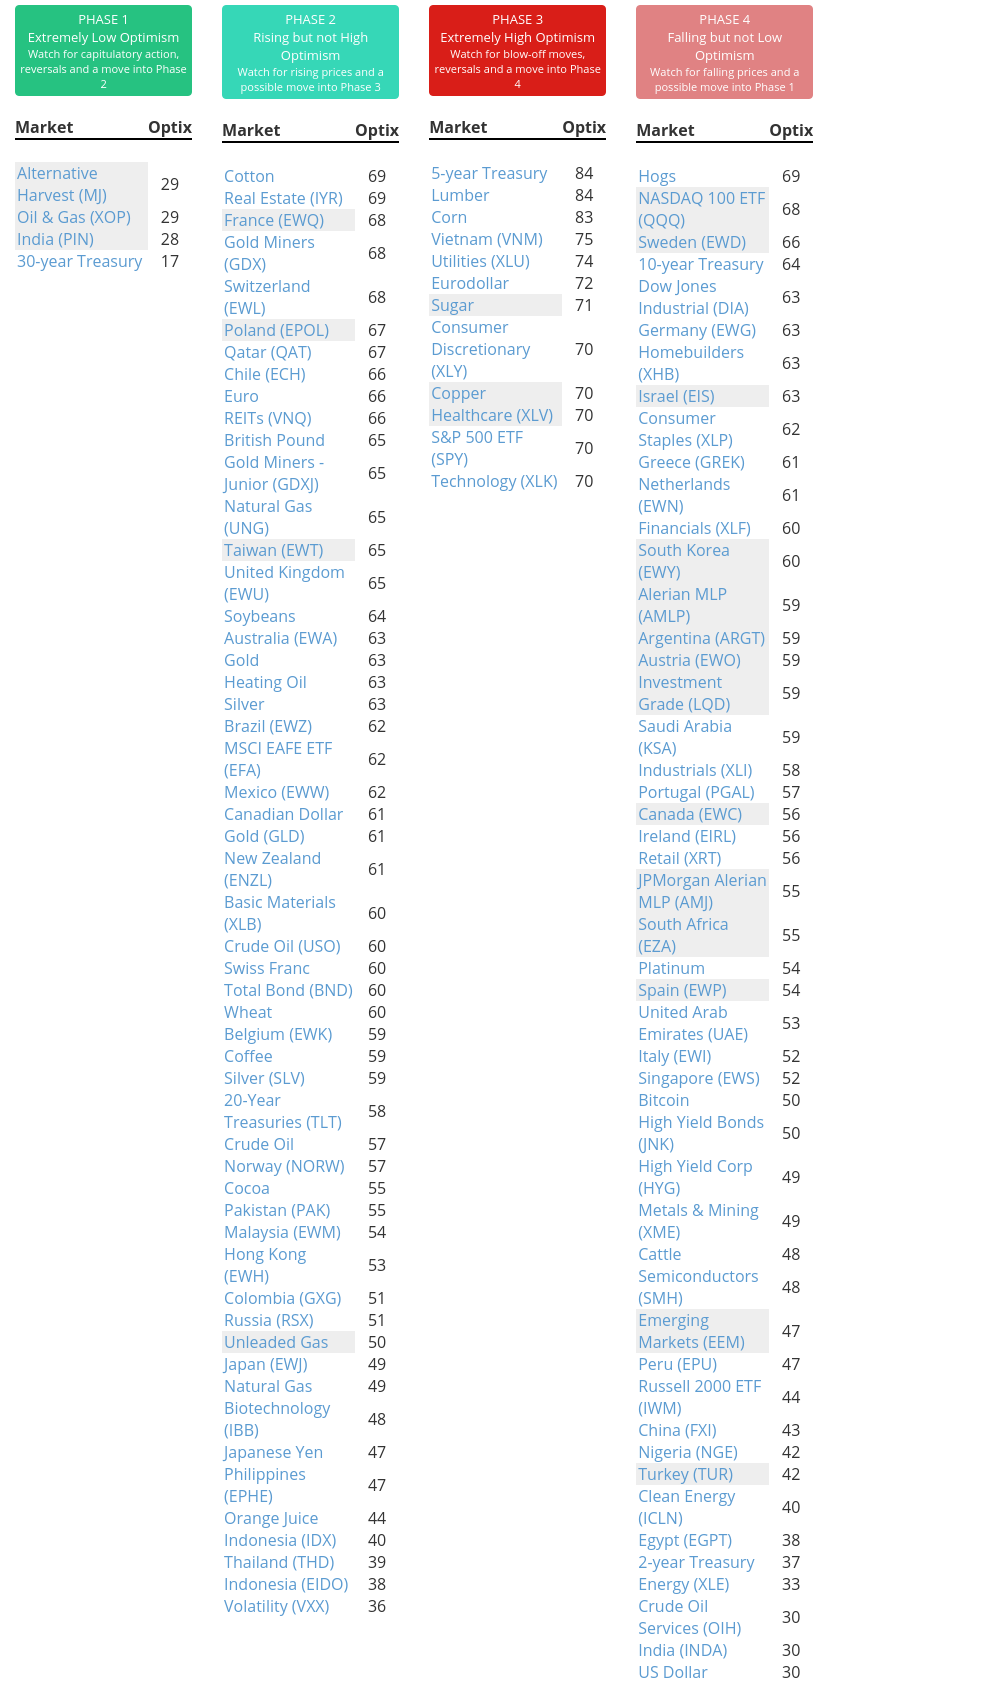
Phase Table
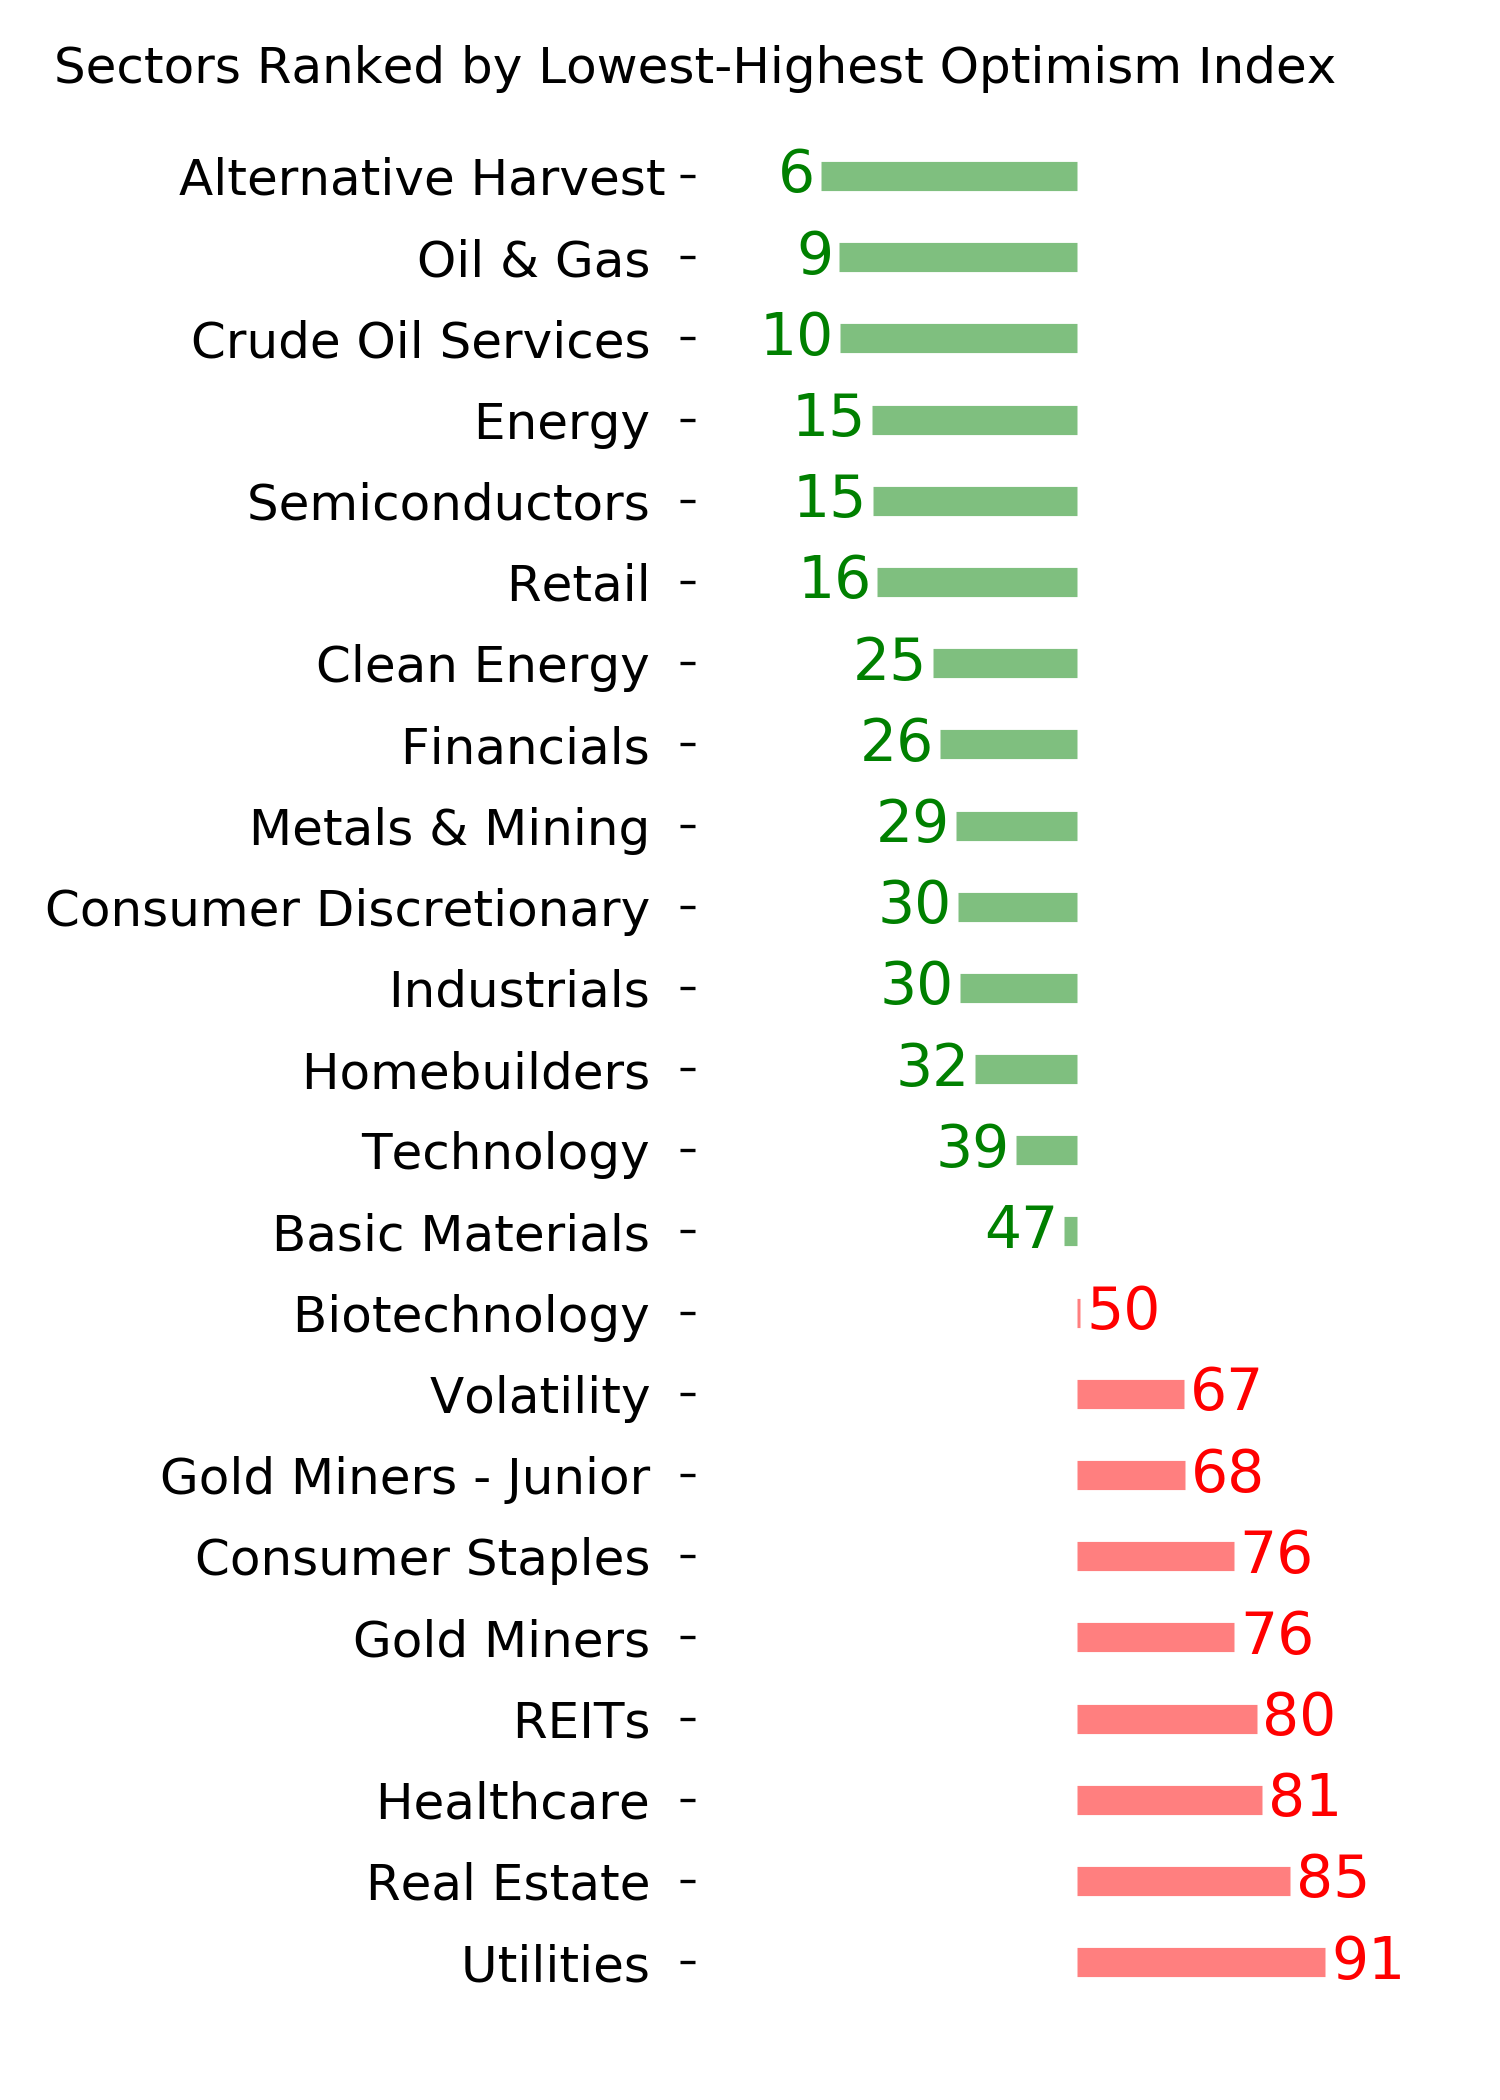
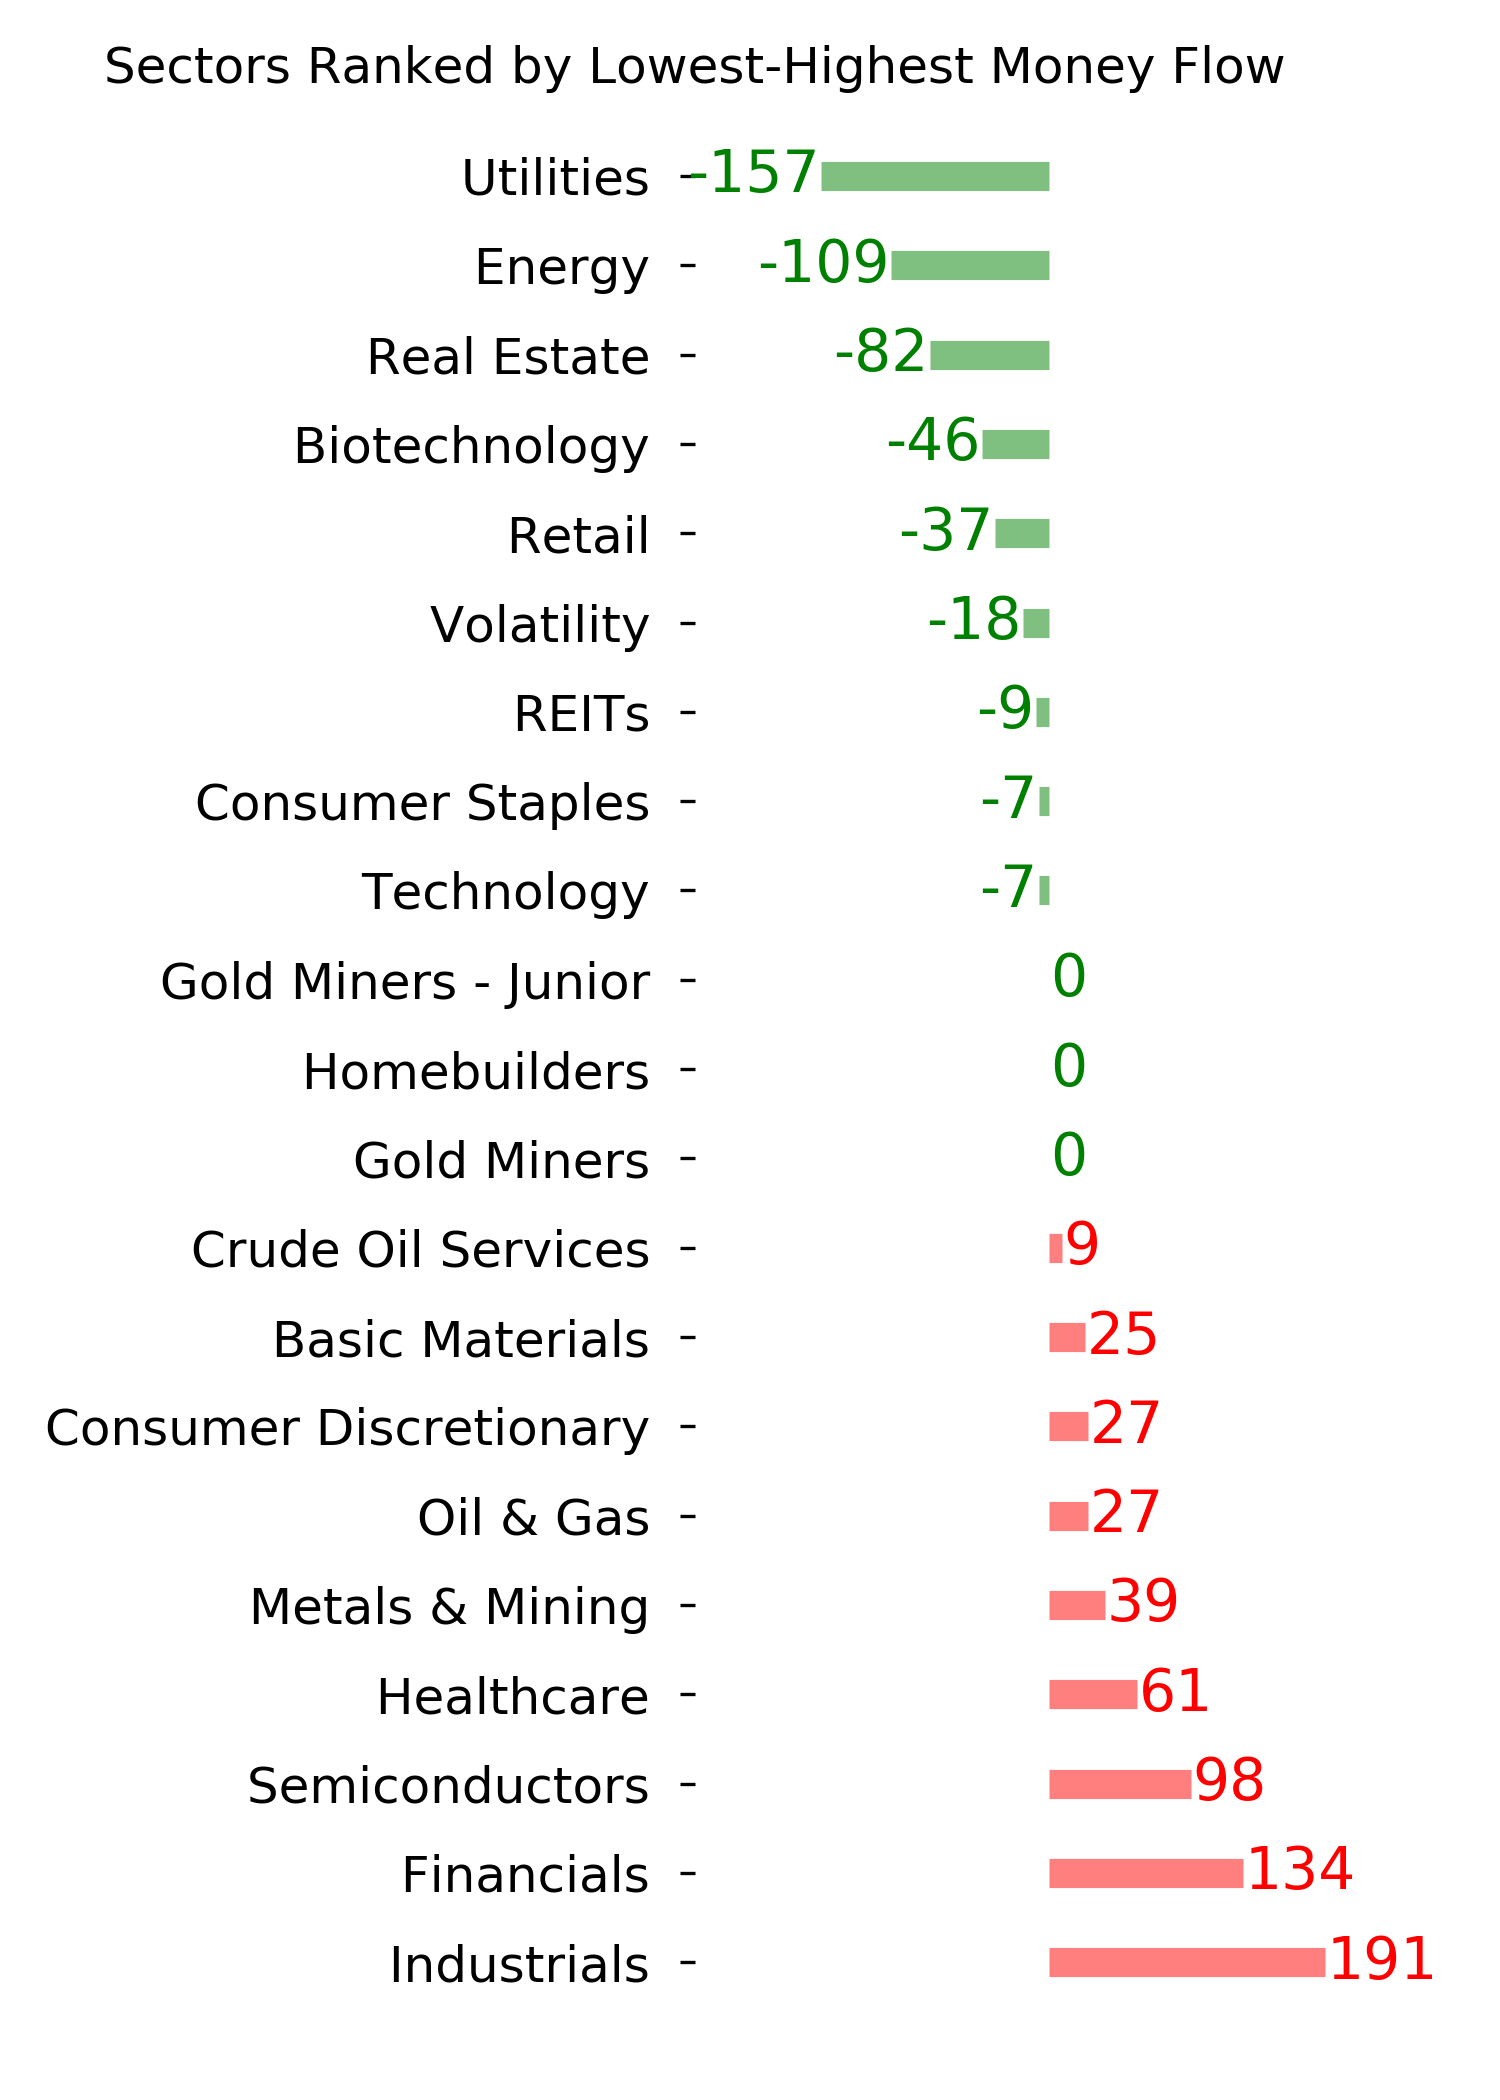
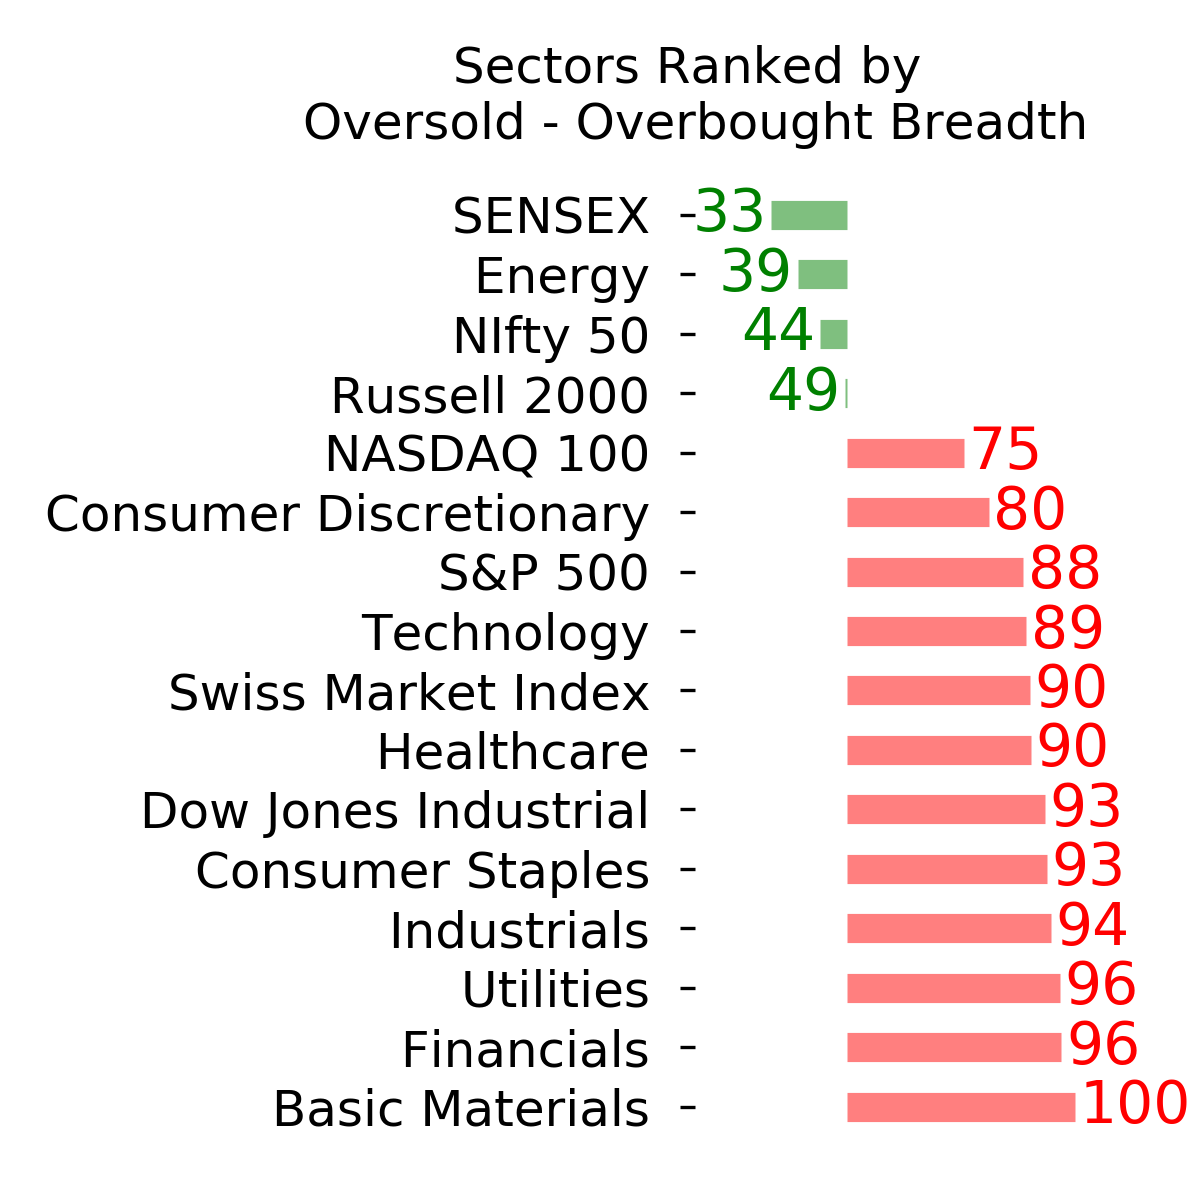
Ranks
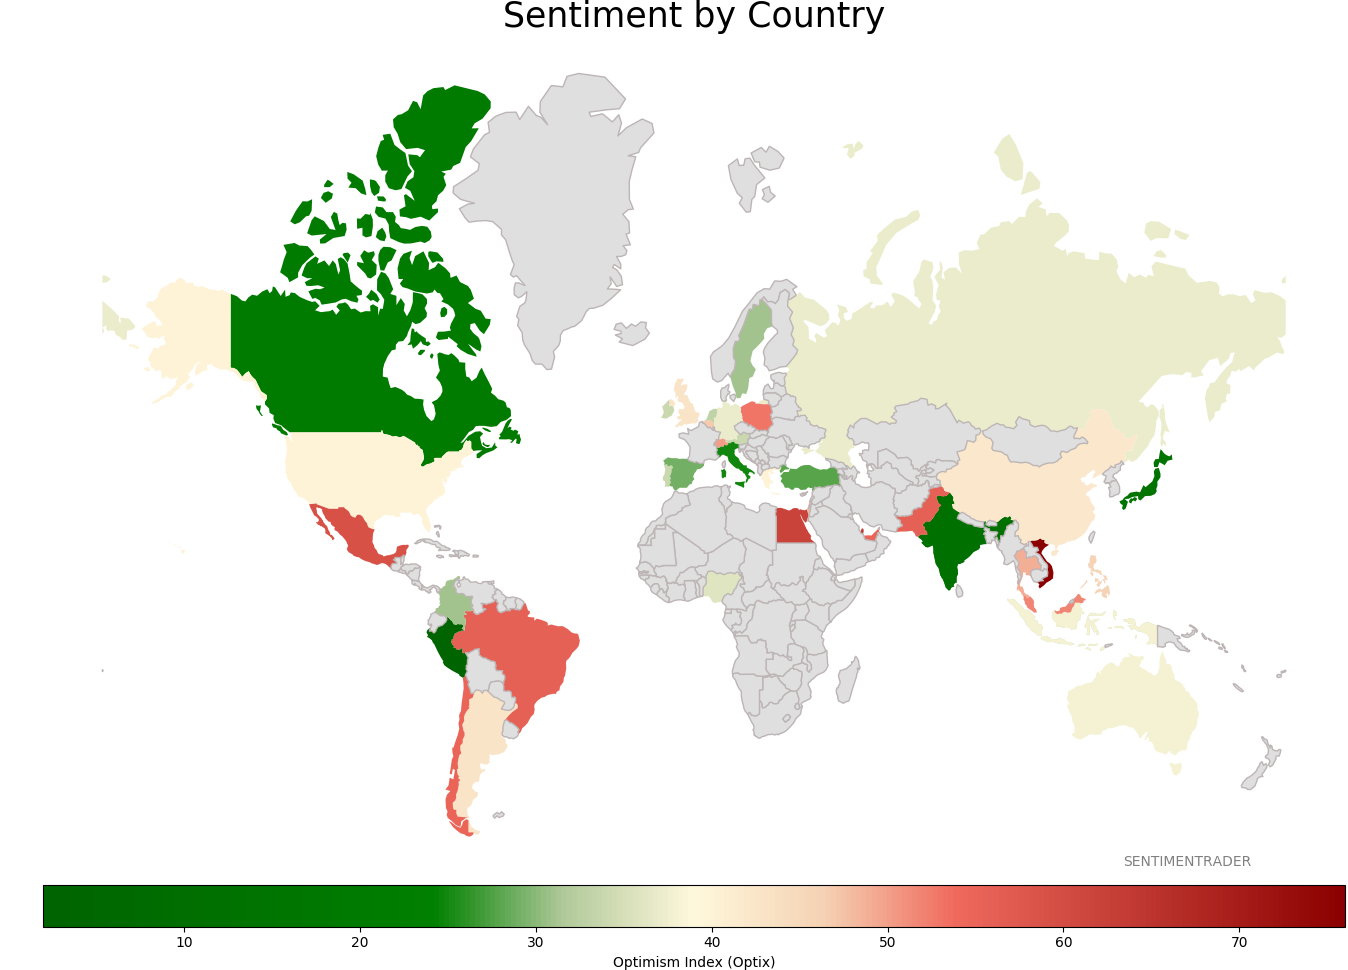
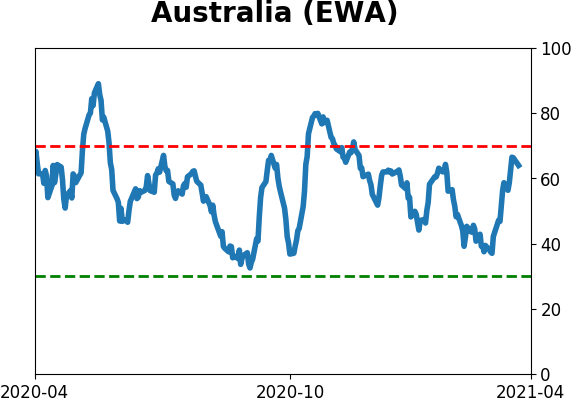
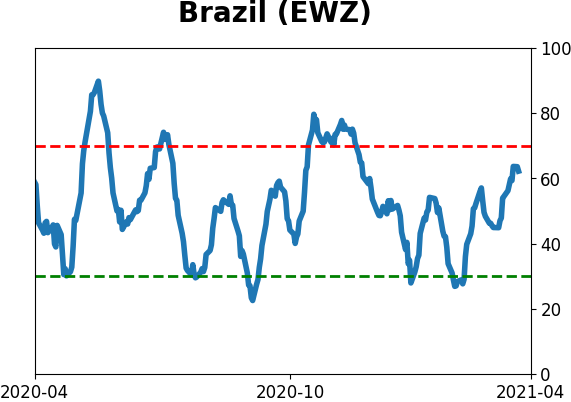
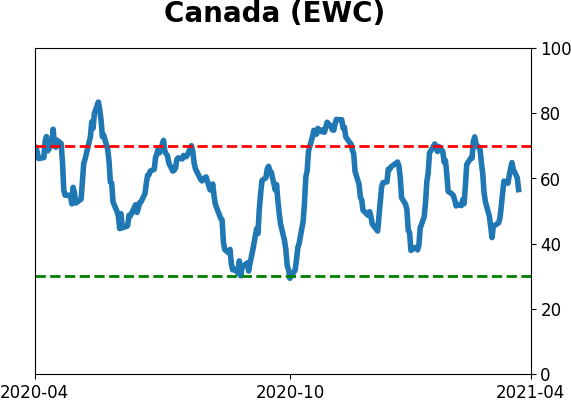
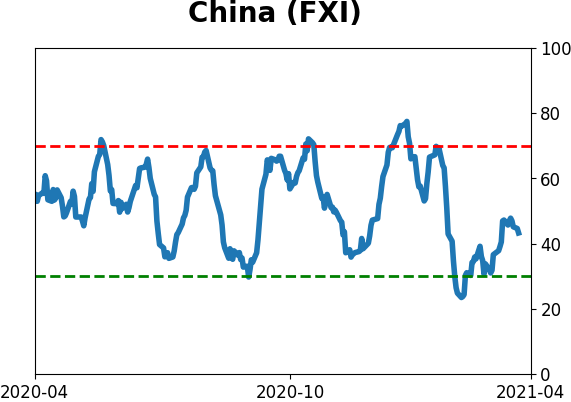
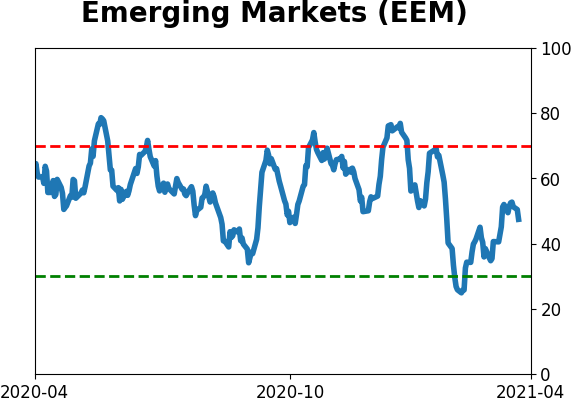
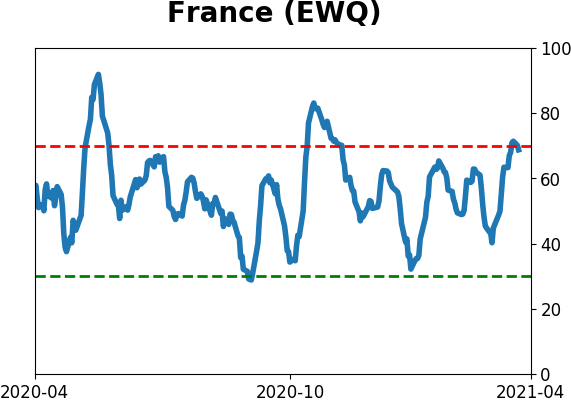
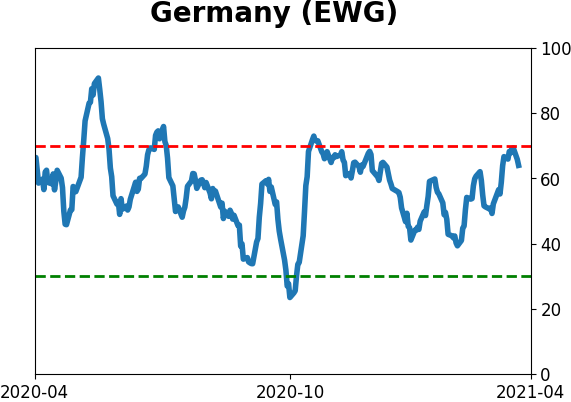
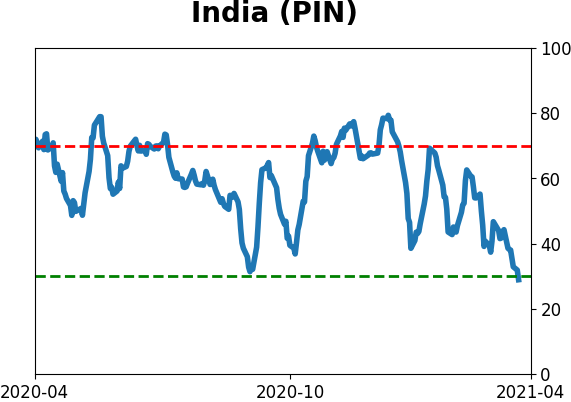
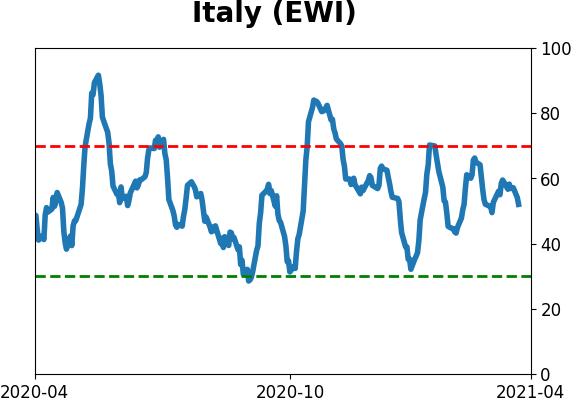
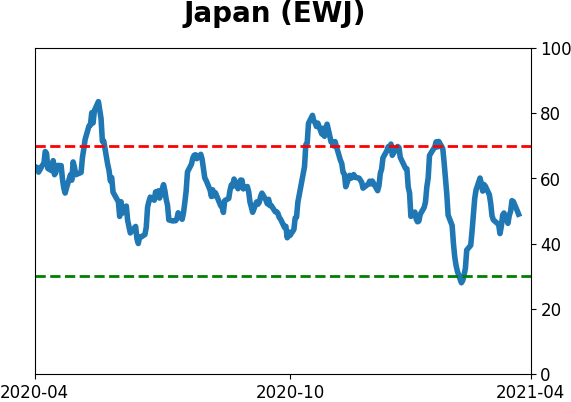
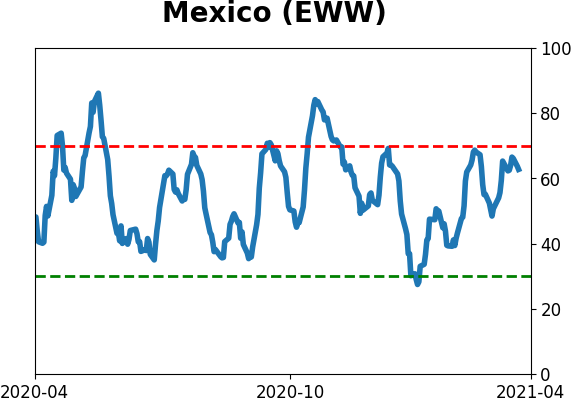
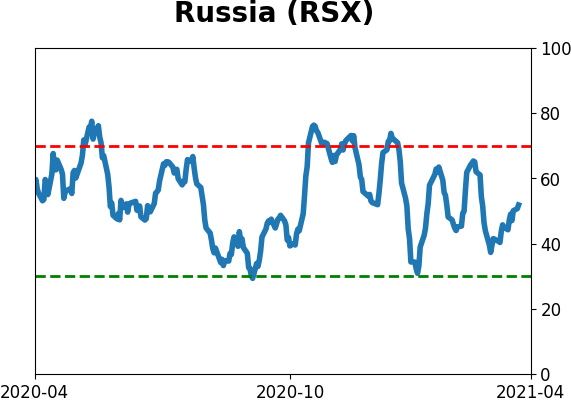
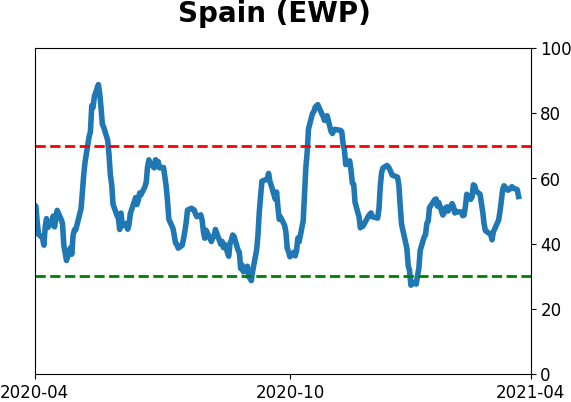
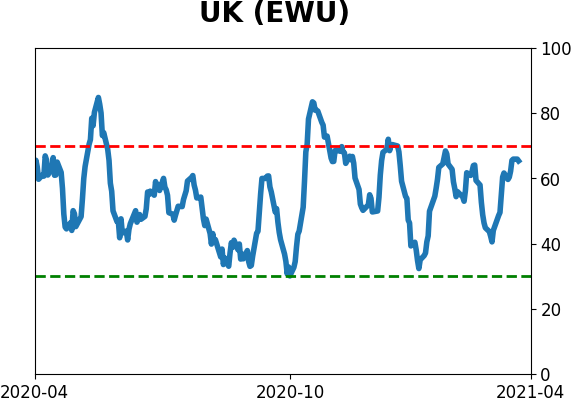
Sentiment Around The World
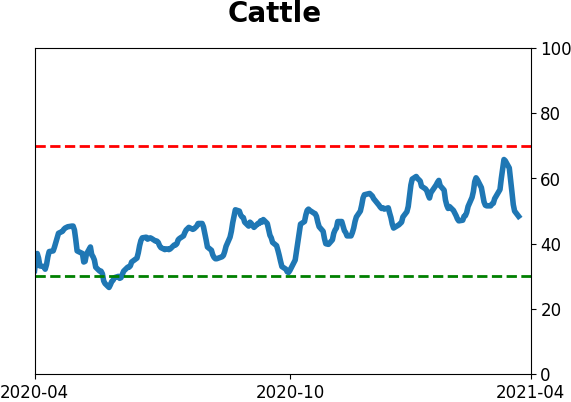
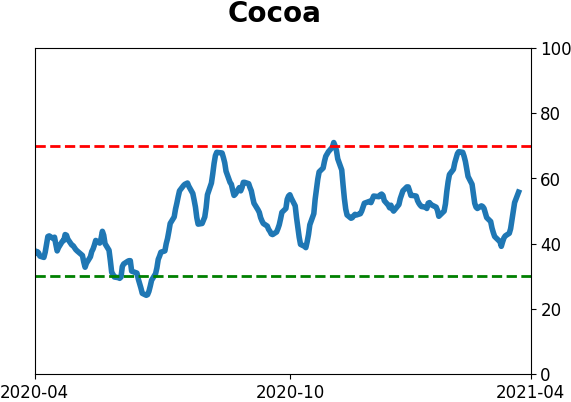
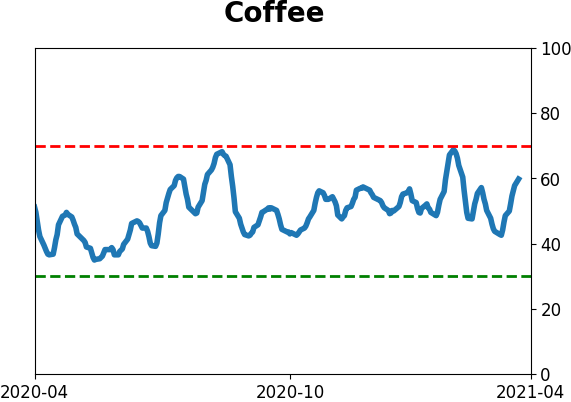
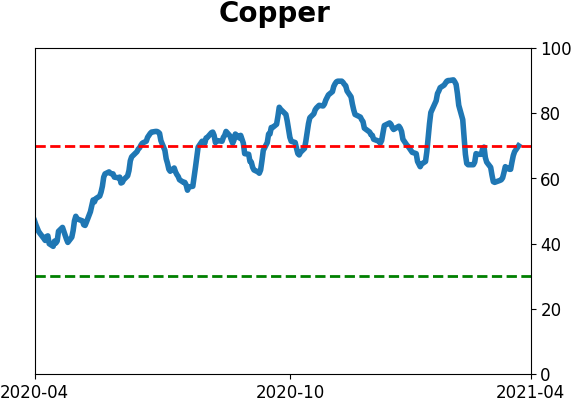
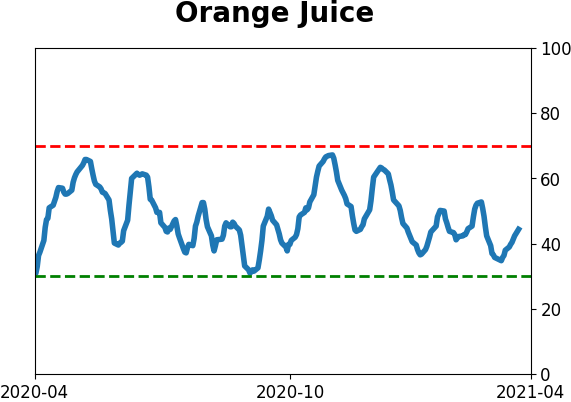
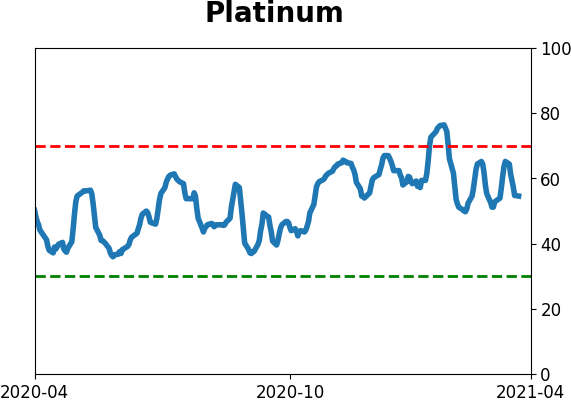
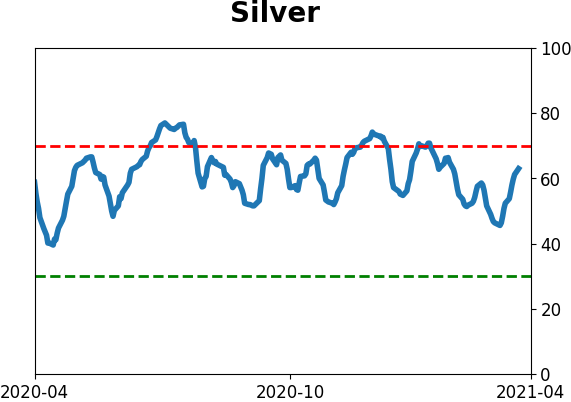
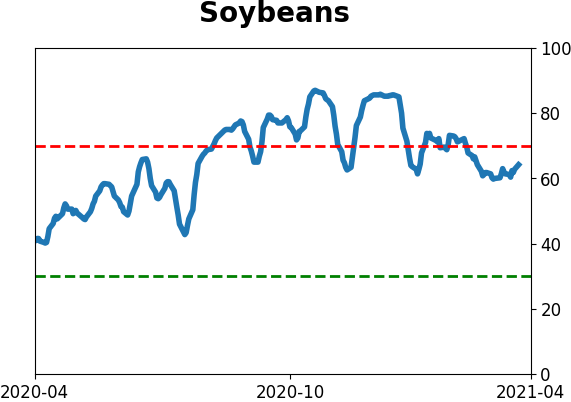
Optimism Index Thumbnails
|
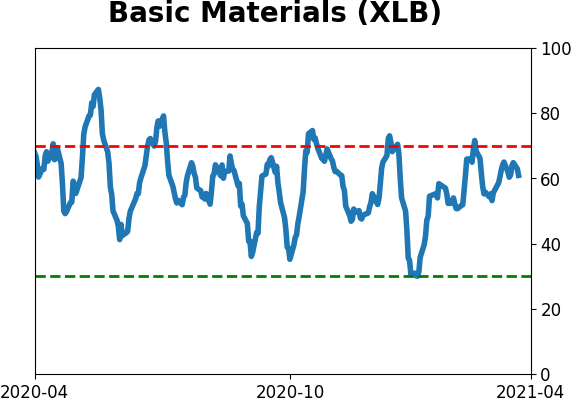
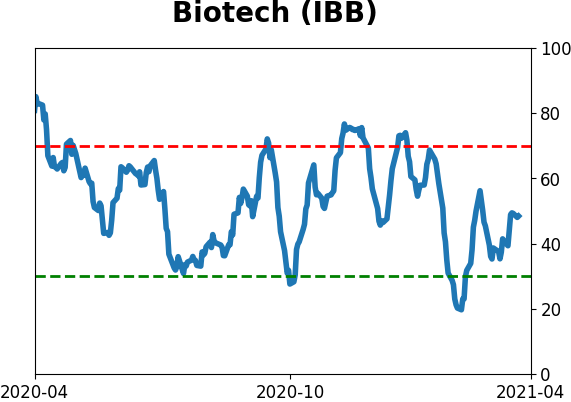
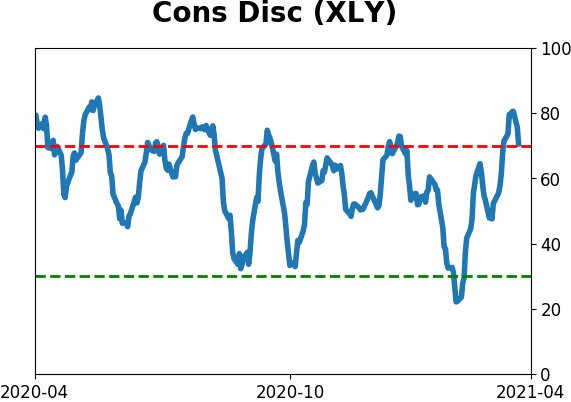
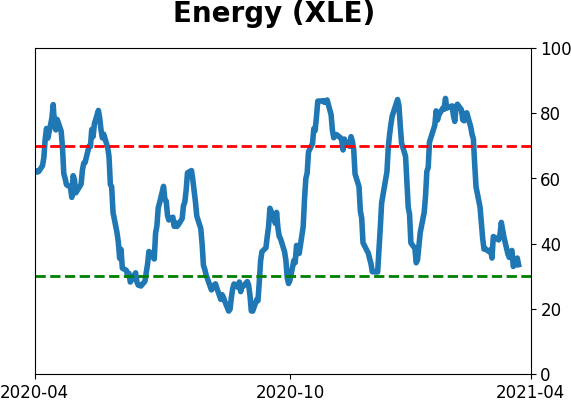
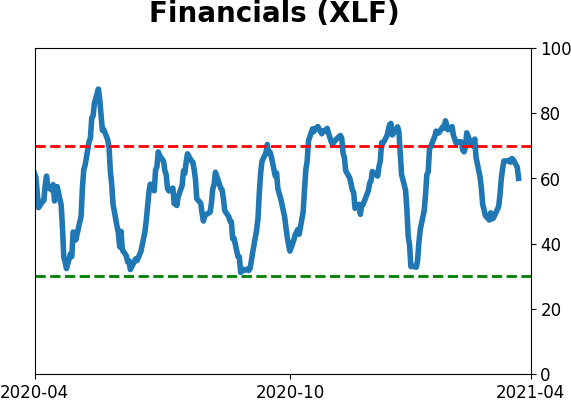
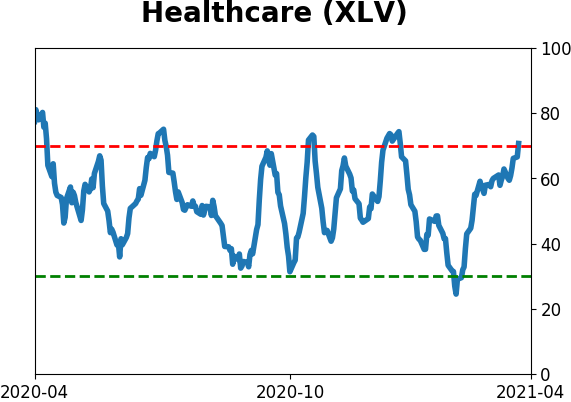
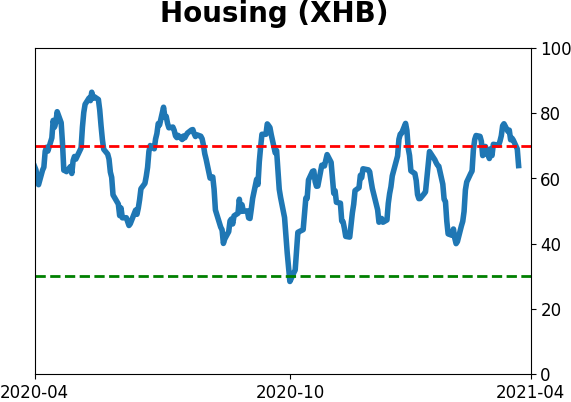
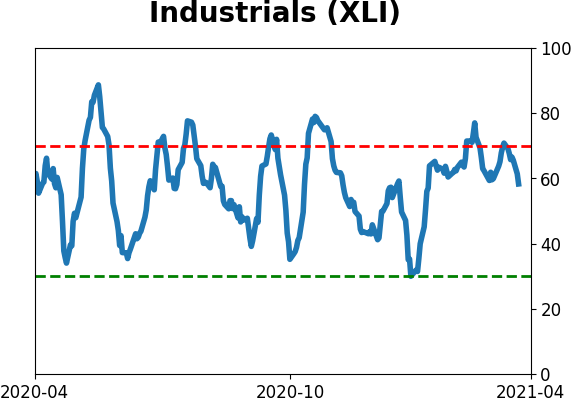
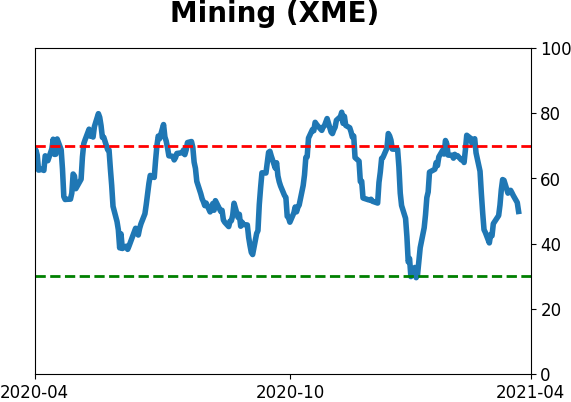
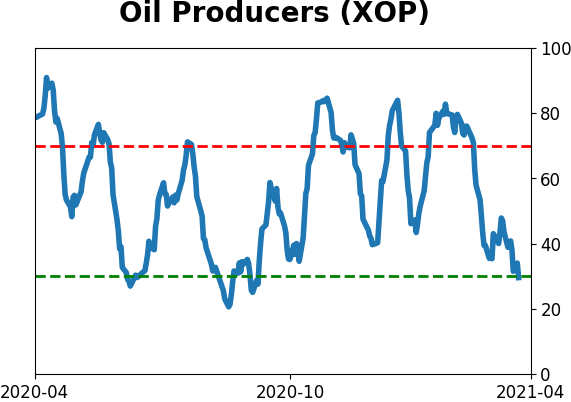
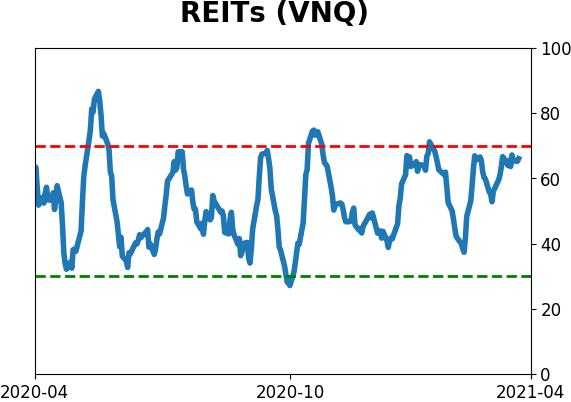
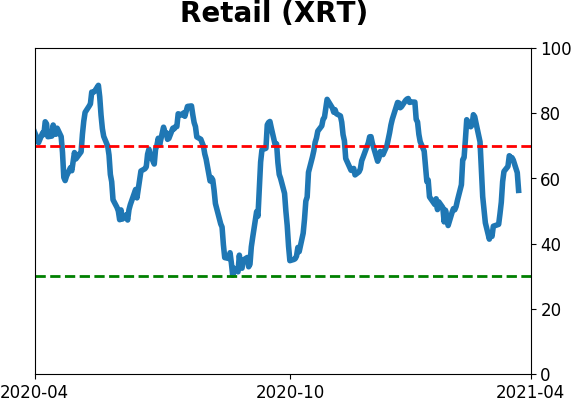
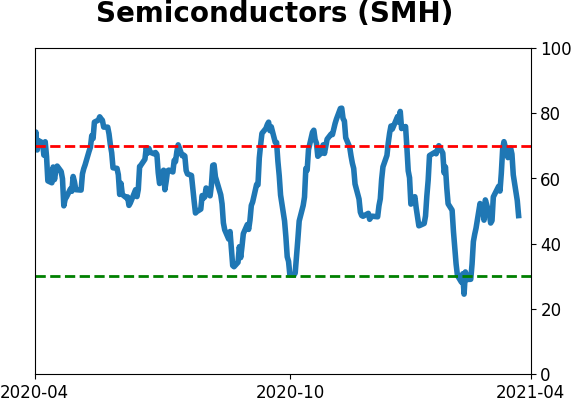
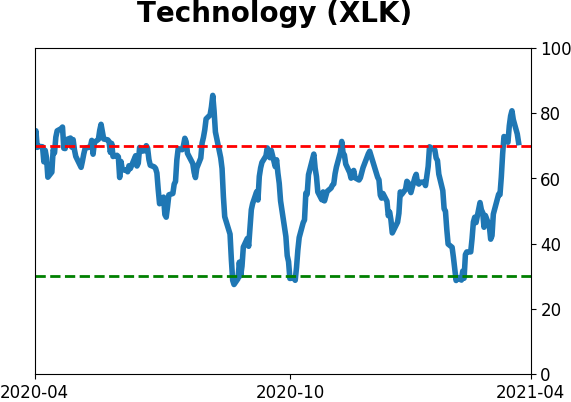
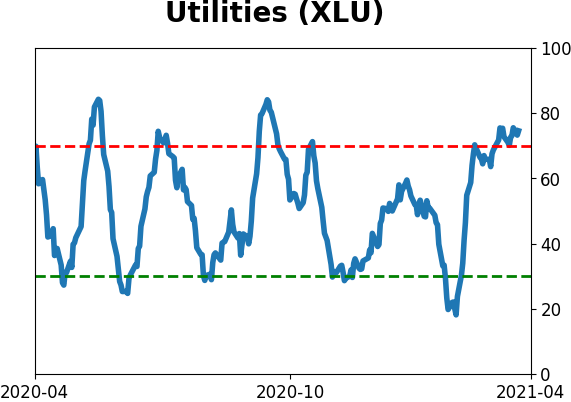
Sector ETF's - 10-Day Moving Average
|
|
|
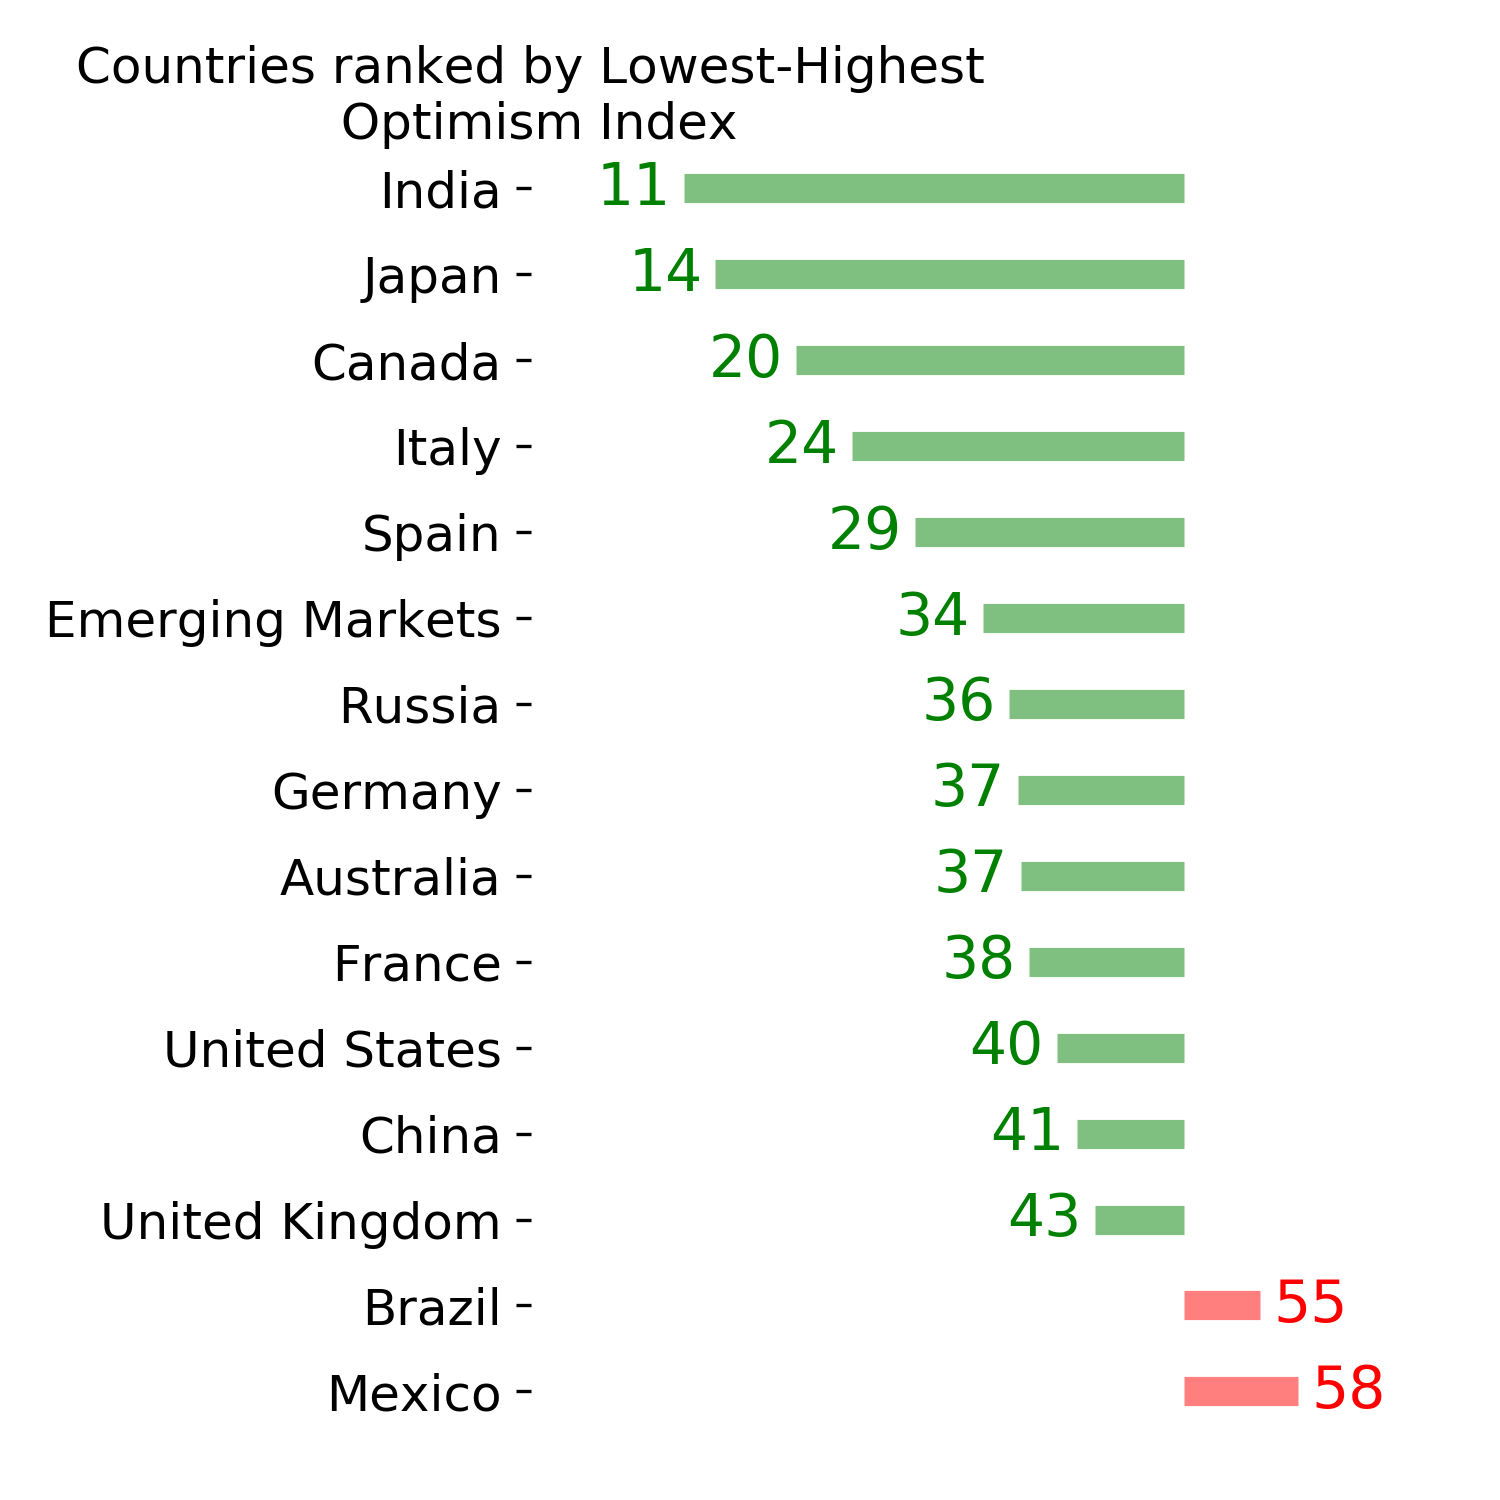
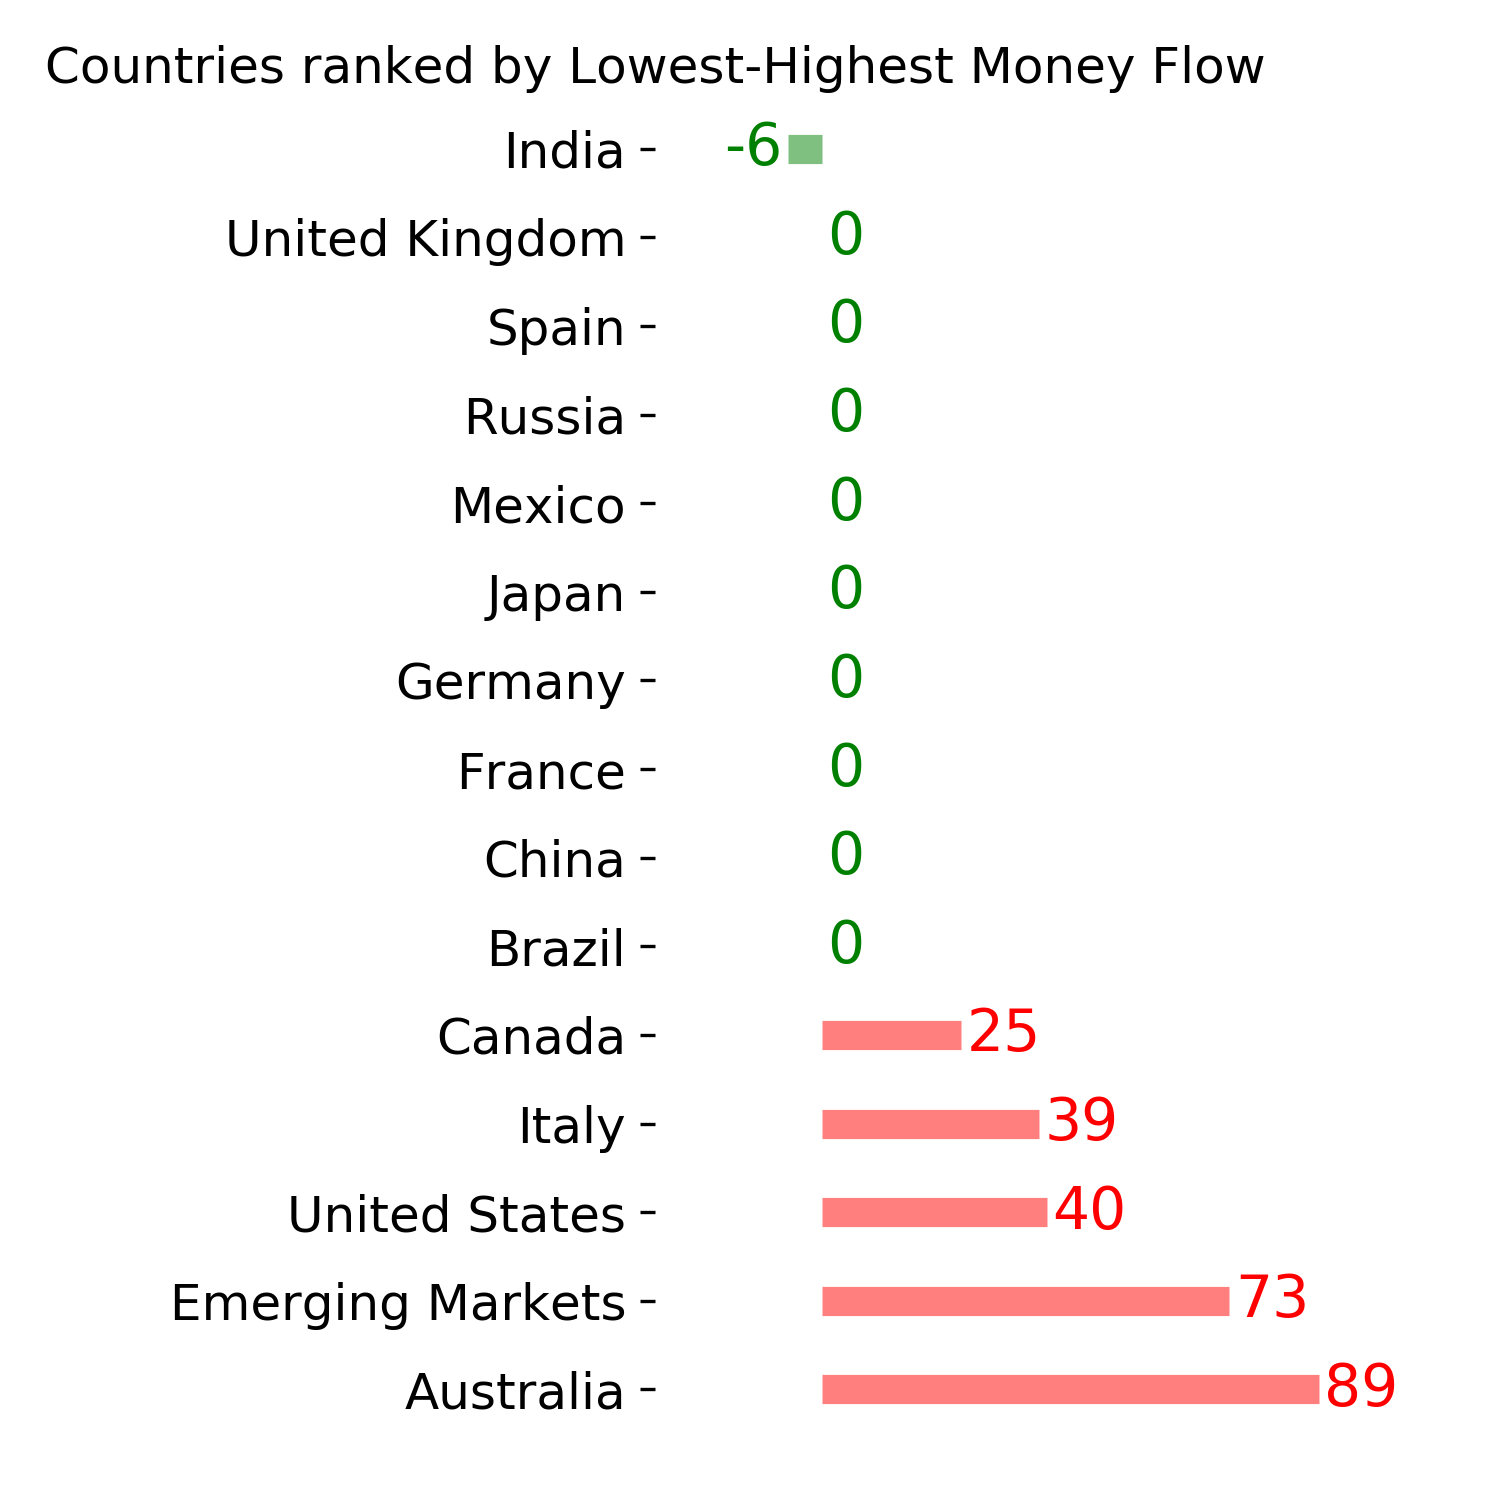
Country ETF's - 10-Day Moving Average
|
|
|
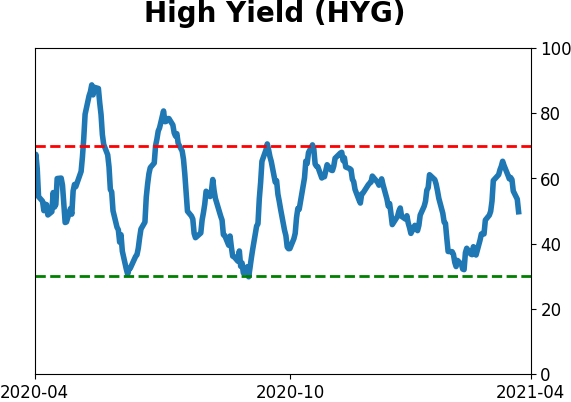
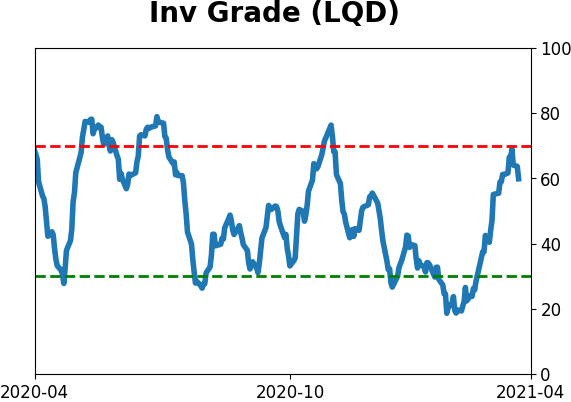
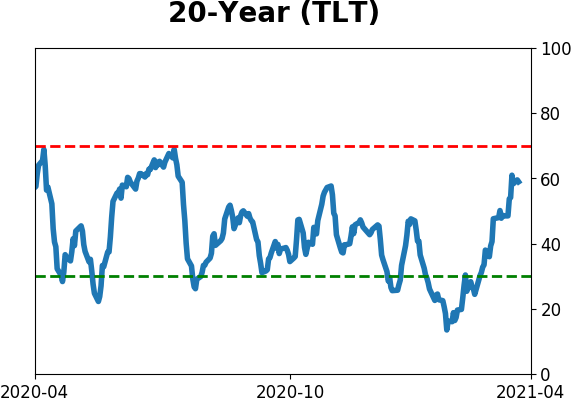
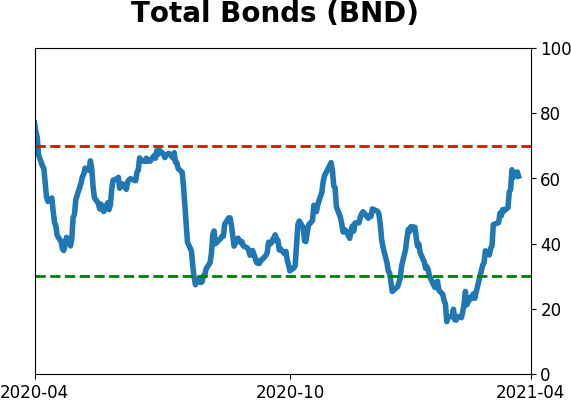
Bond ETF's - 10-Day Moving Average
|
|
|
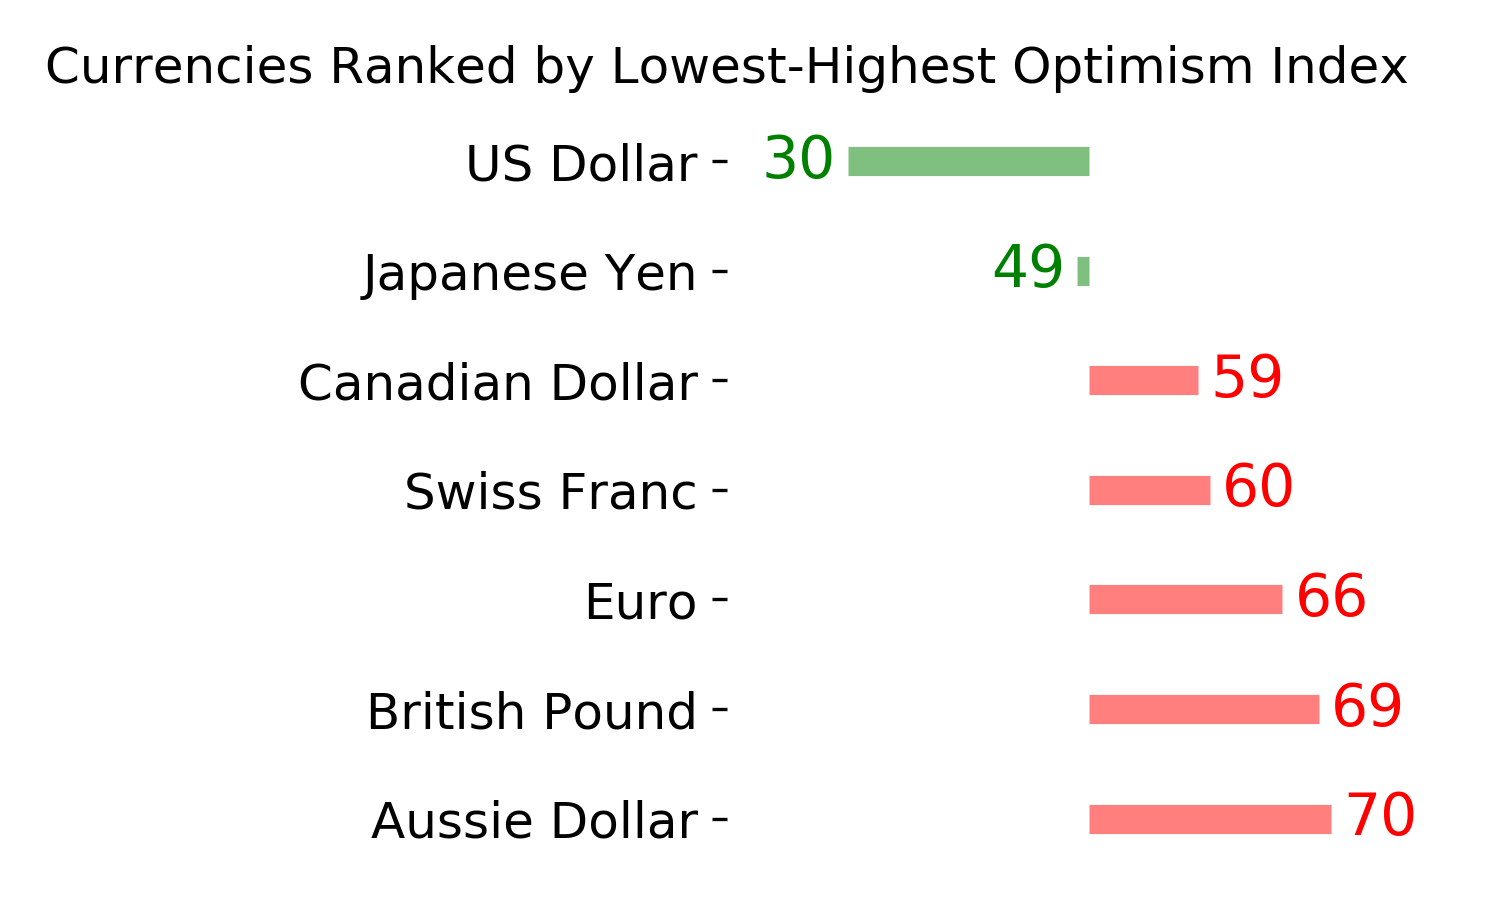
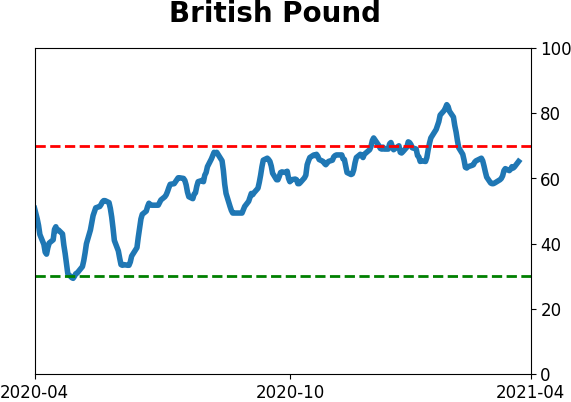
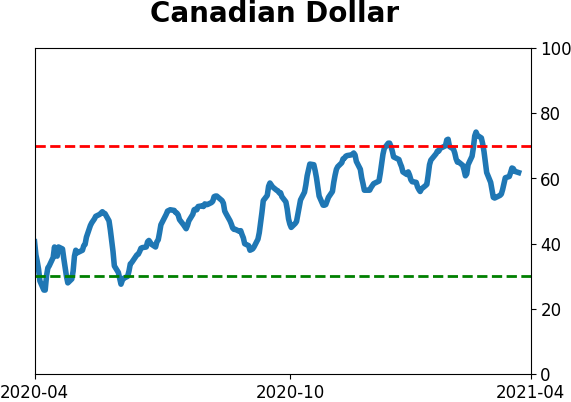
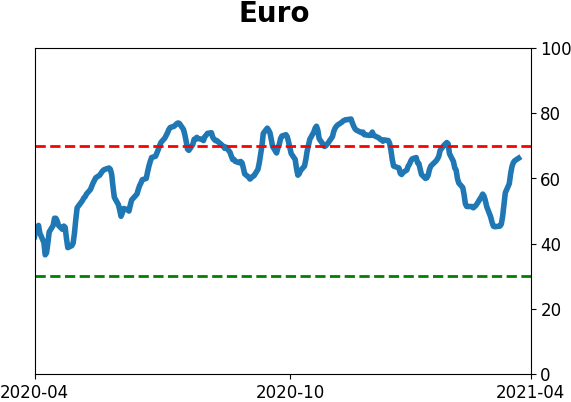
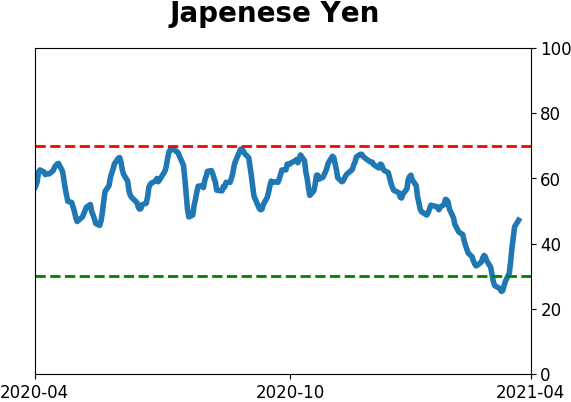
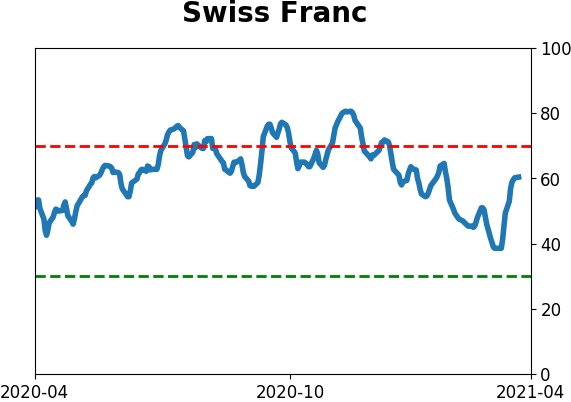
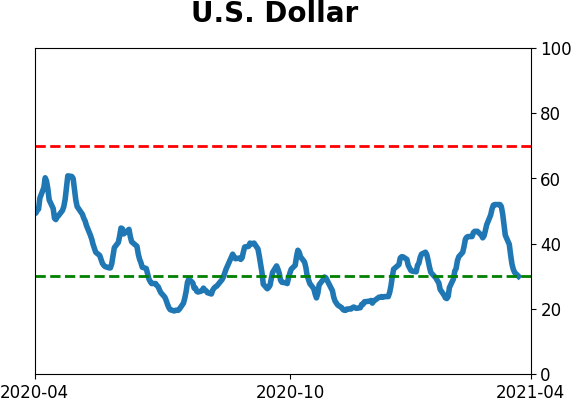
Currency ETF's - 5-Day Moving Average
|
|
|
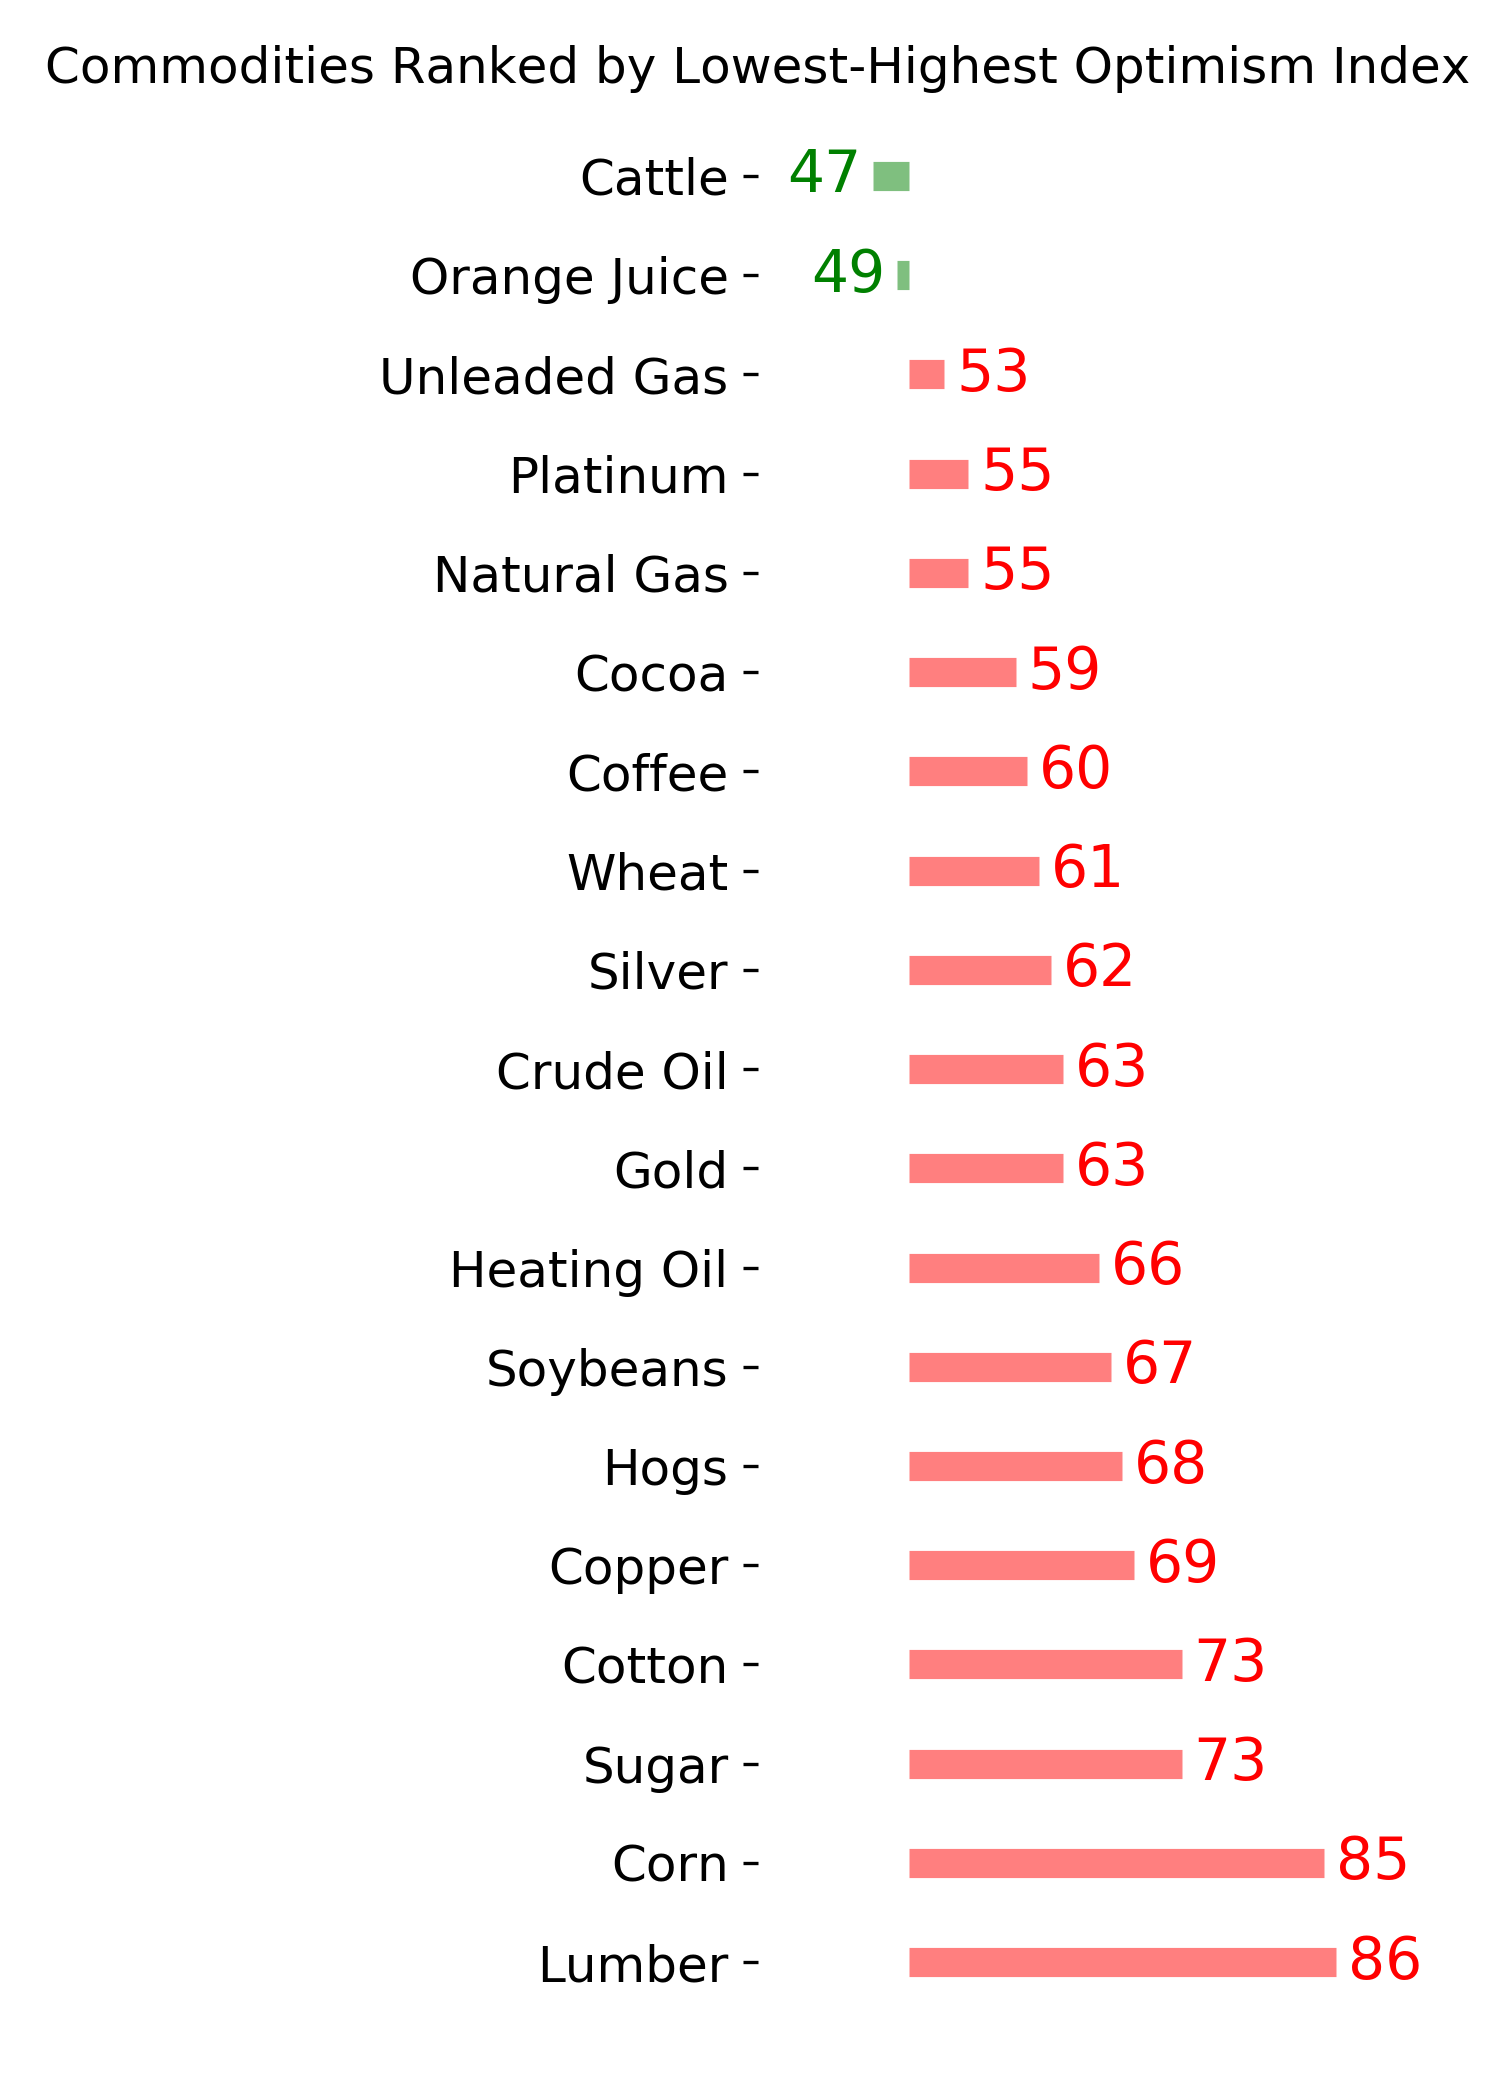
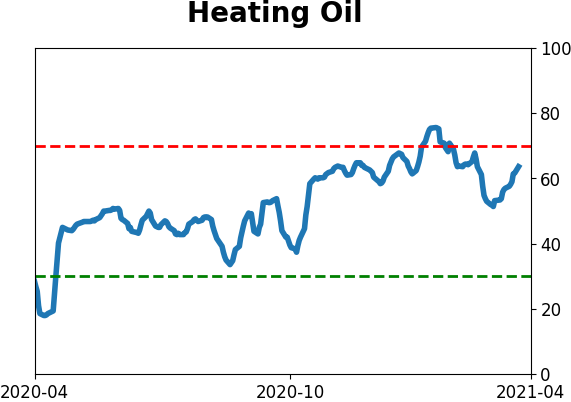
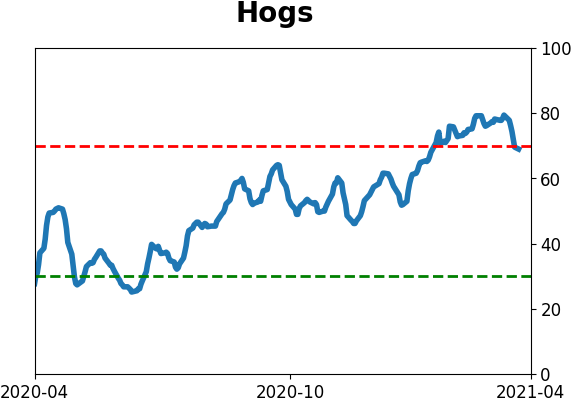
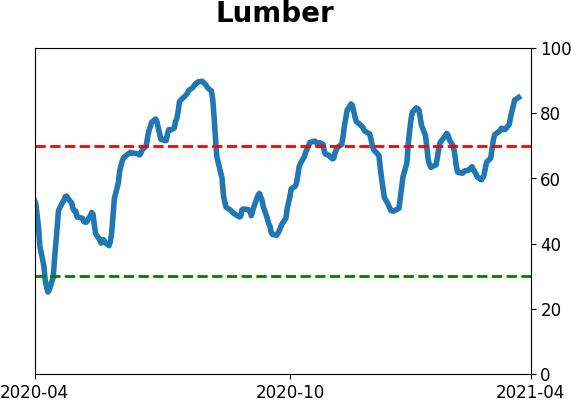
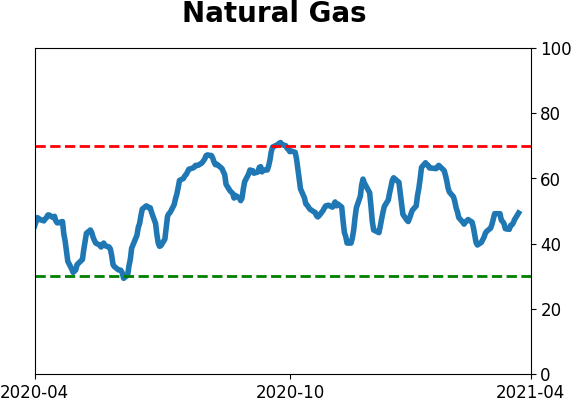
Commodity ETF's - 5-Day Moving Average
|
|