Headlines
|
|
Failed vs successful bear market rallies:
Stocks have enjoyed a historic rally from a 52-week low. Even during failed rallies that end up leading to lower prices longer-term, the initial rally has usually led to a pullback then another rally attempt. Successful lows also see some shorter-term pullbacks, with a plateau over the next 1-3 months.
Small traders are buying call options...and puts, too:
The smallest of options traders bought a lot of speculative call options last week, among the most in 15 years. But they're still buying a lot of protective puts, too. Overall speculation has increased and is high for a downtrending market.
Impact on stocks: The biggest single-day drops in crude oil futures have had little impact on the broader stock market. It depends on what the cutoff time is used for the front-month futures, but using Bloomberg continuous contract data, there have been 13 one-day declines of 10% or more in oil futures. The S&P 500 was higher a week later 11 times, a month later 7 times, three months later 6 times, and a year later 8 times, with a median one-year return of 20.1%.
Oil. Ugh.: There isn't much to add about the move in crude oil. We can't find another occurrence of the front-month future of a major commodity contract trading in negative territory. It might have happened at some point, but we can't find it. It's at least worth pointing out the folly of "this won't end well" kinds of comments related to the surge of shares in funds like USO, assuming that mom-and-pop are rushing into the oil fund. Shares outstanding have skyrocketed, but much of that may be due to short sales. Just pull up this chart - when USO has bottomed, it has coincided with shares outstanding going parabolic every time.
|
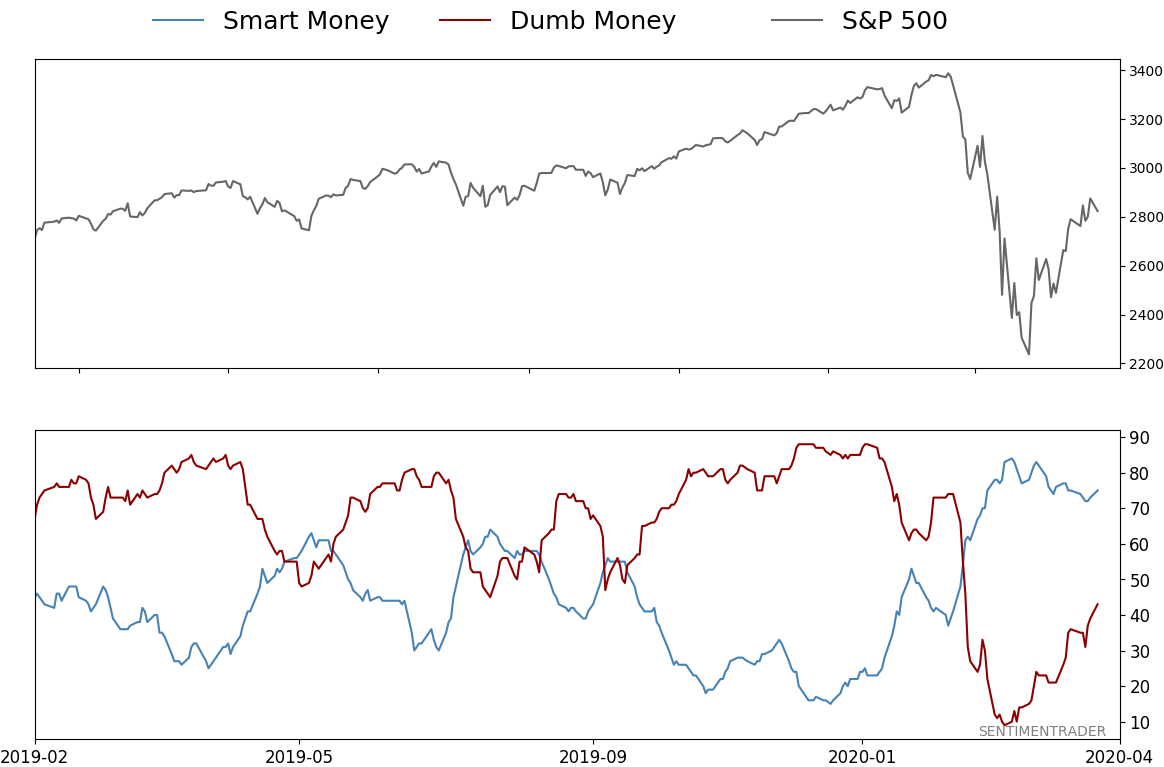
Smart / Dumb Money Confidence
|
Smart Money Confidence: 75%
Dumb Money Confidence: 43%
|
|
Risk Levels
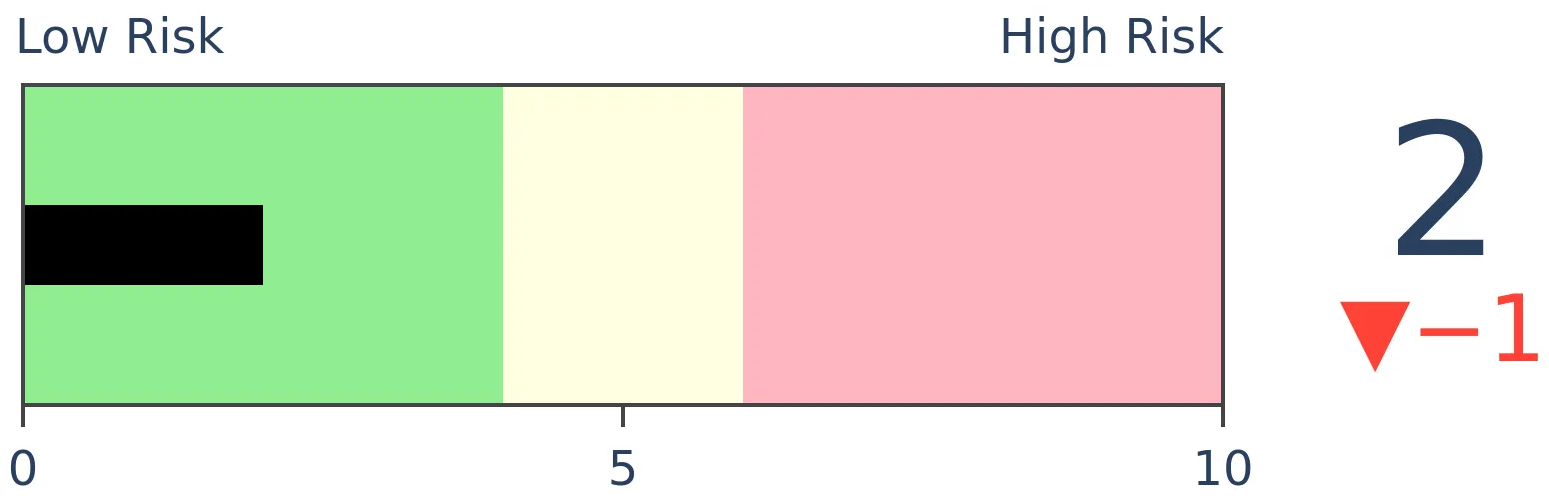
Stocks Short-Term
|
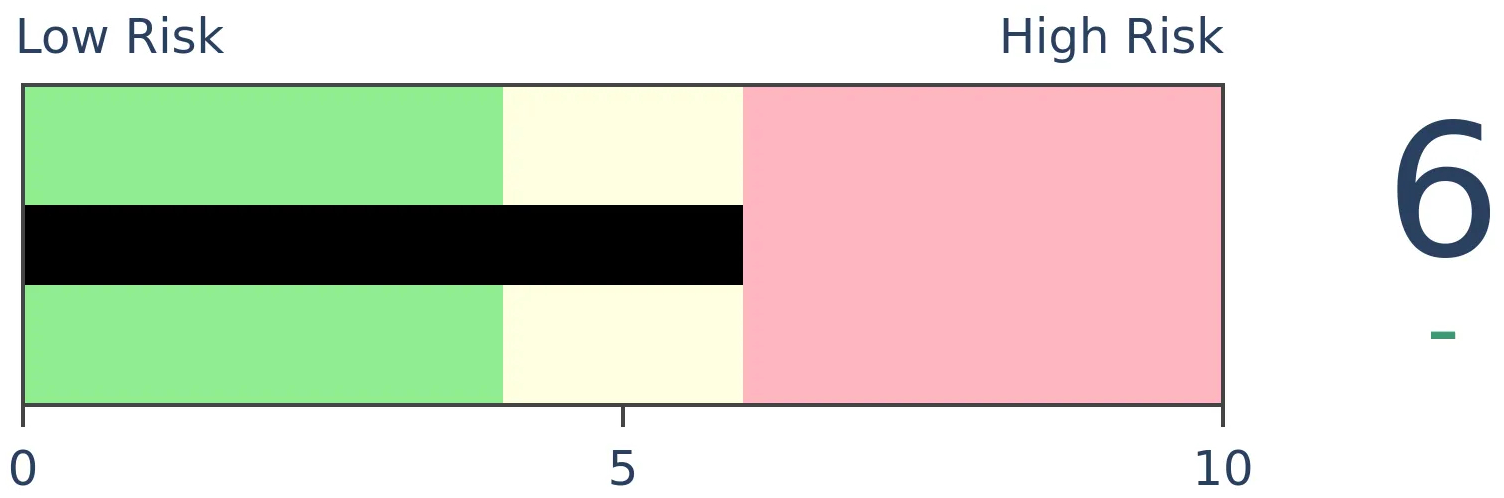
Stocks Medium-Term
|
|
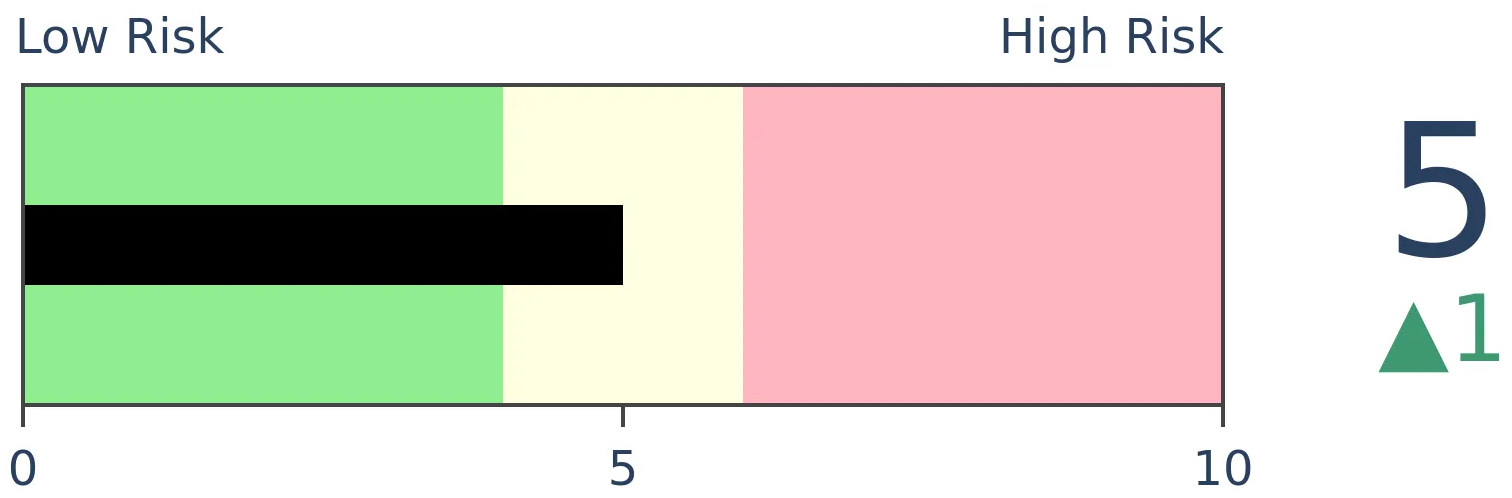
Bonds
|
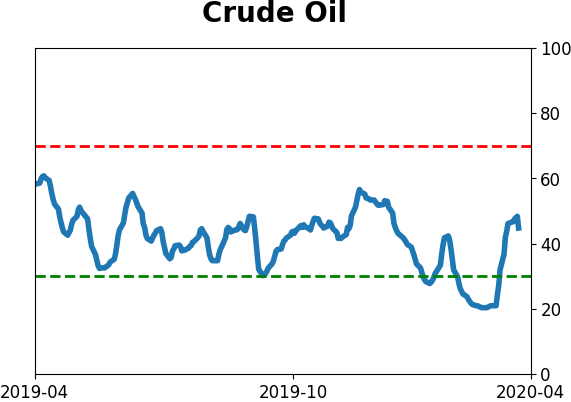
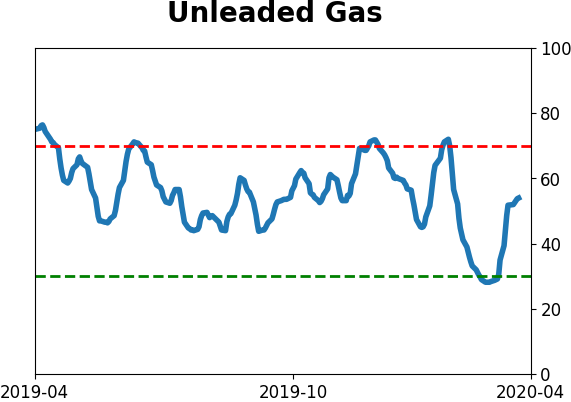
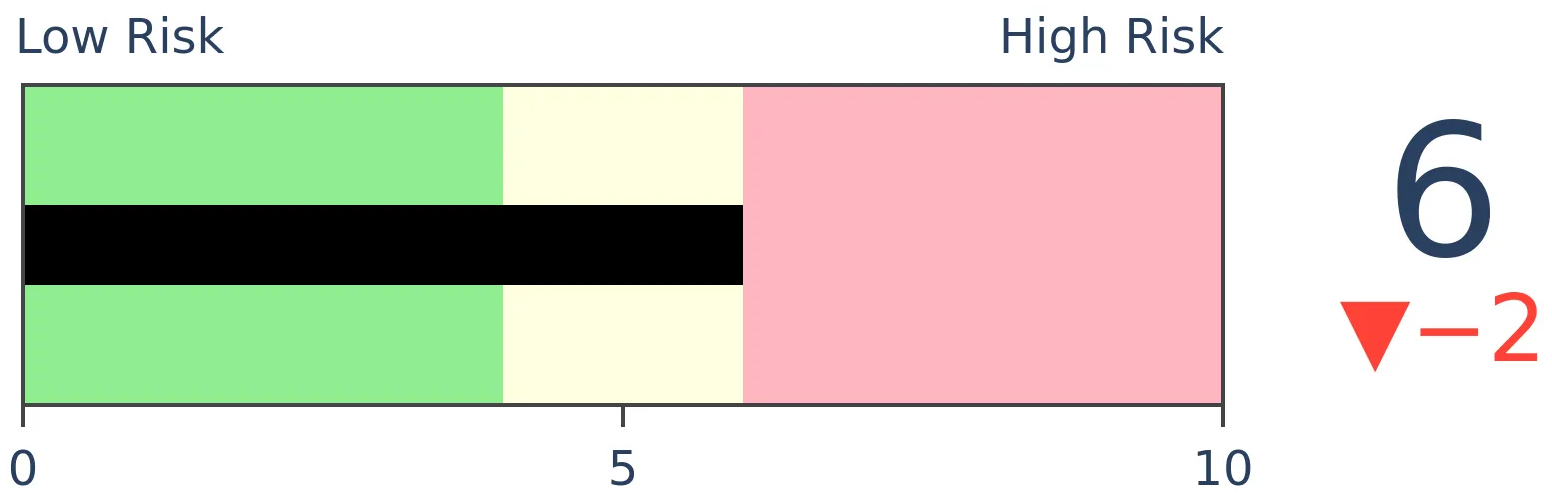
Crude Oil
|
|
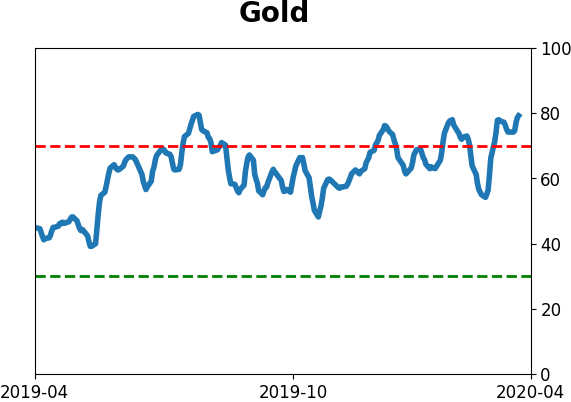
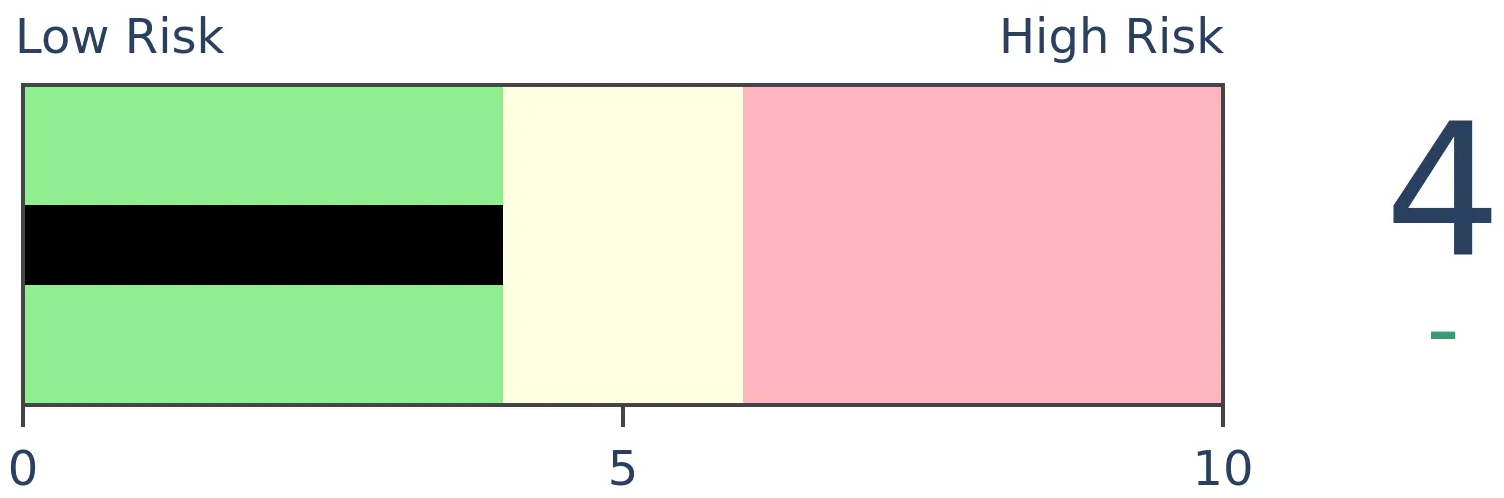
Gold
|
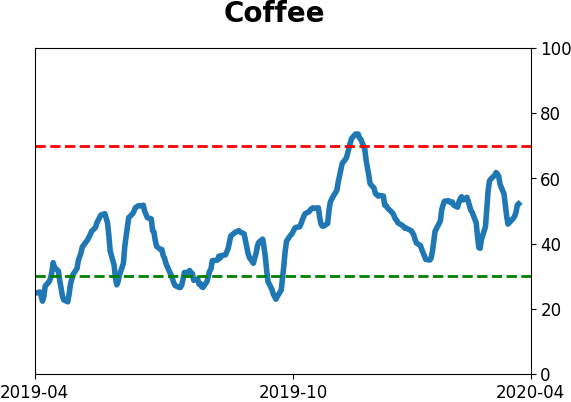
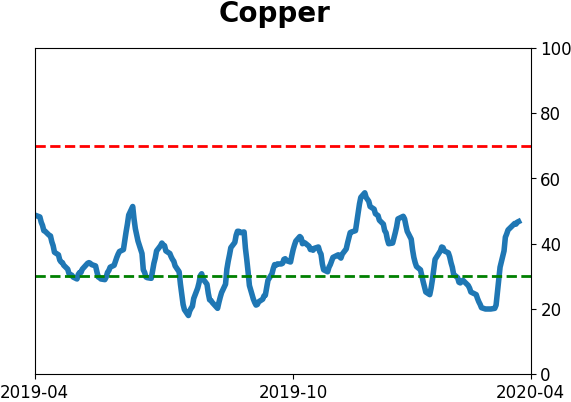
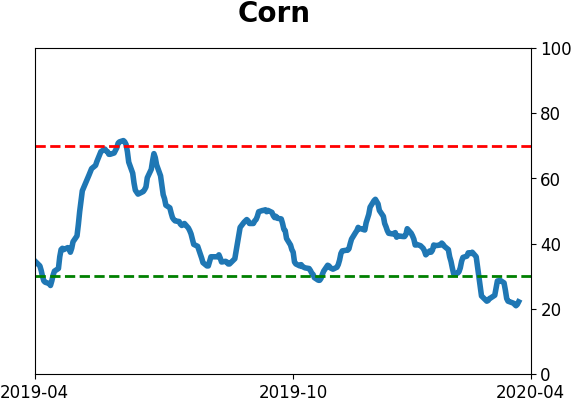
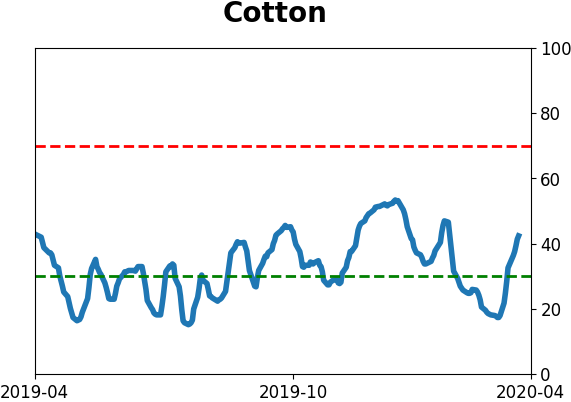
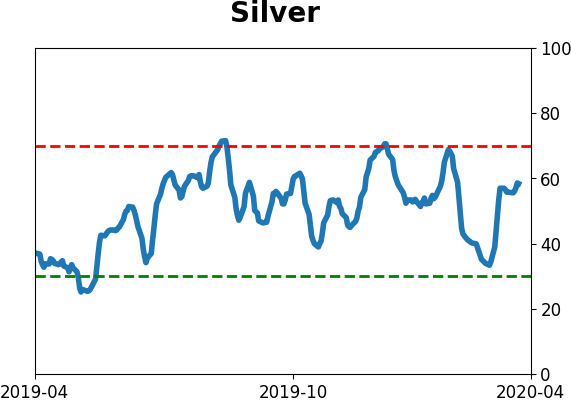
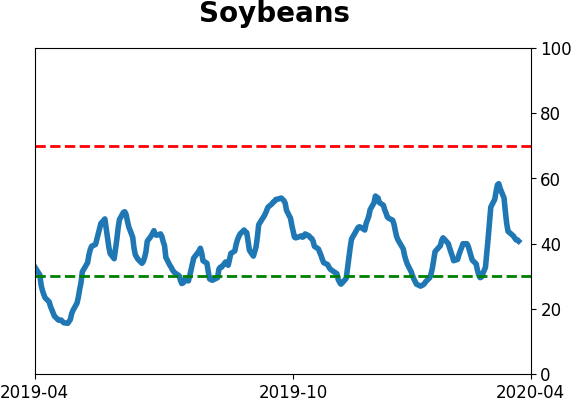
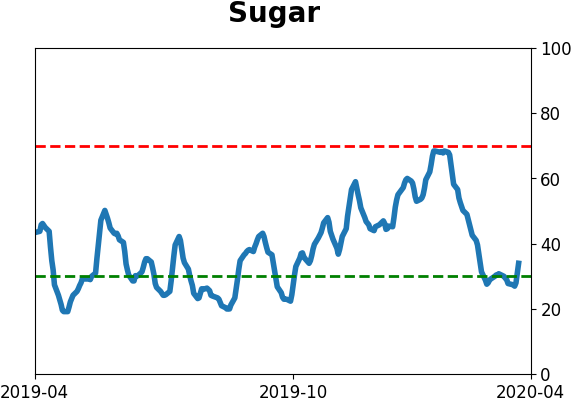
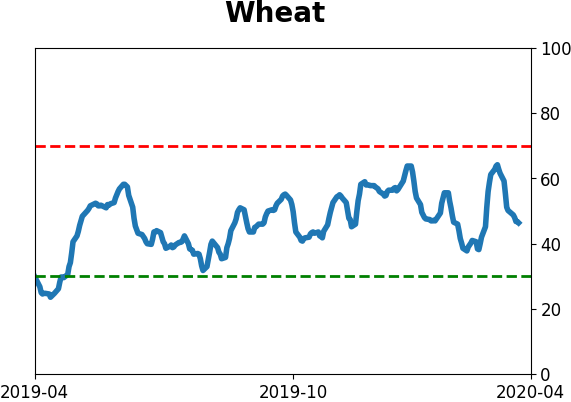
Agriculture

|
|
Research
BOTTOM LINE
Stocks have enjoyed a historic rally from a 52-week low. Even during failed rallies that end up leading to lower prices longer-term, the initial rally has usually led to a pullback then another rally attempt. Successful lows also see some shorter-term pullbacks, with a plateau over the next 1-3 months.
FORECAST / TIMEFRAME
None
|
As far as rallies from a low, the past few weeks have been epic. It's been well-documented that stocks have enjoyed one of the best-ever stretches over the past couple of weeks, pushing the S&P 500 nearly 30% off its 52-week low.
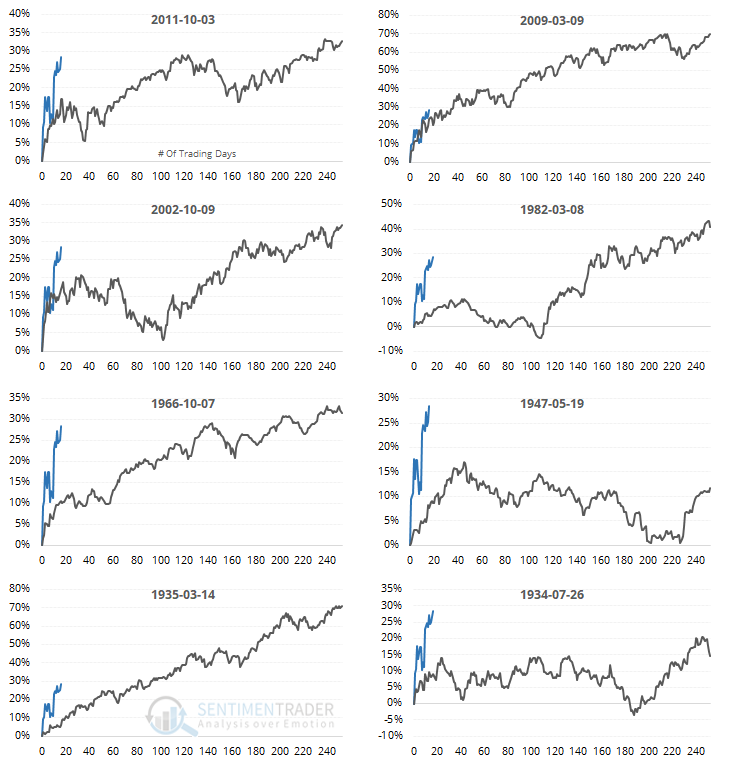
If we go back to 1928 and look at every time the S&P managed to rally for this long off of a low, we can get a sense for how it performed afterward, depending on whether the rally ended up being a success or failure.
The chart below shows every time it rallied for 18 sessions off a 52-week low, gaining at least 5%.
When the rebounds ultimately succeeded, these initial kick-off rallies tended to hit the pause button right about now. Once we got about 20 days into the recovery, the S&P often plateaued, chopping around for weeks at least.
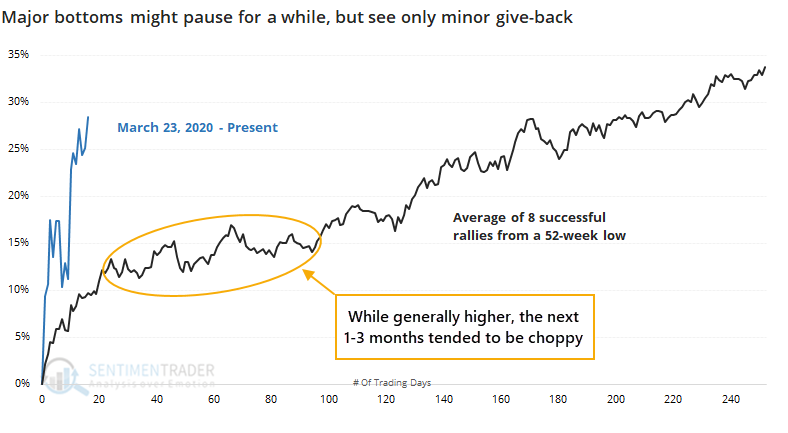
There was wide variability among the samples, but there were only two bottoms that took off like a rocket and just kept going, in 2009 and 1935. Otherwise, buyers paused for a while and digested those initial gains.
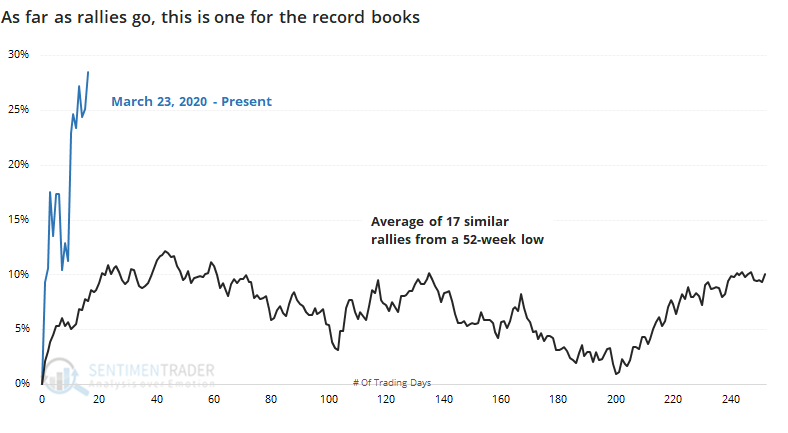
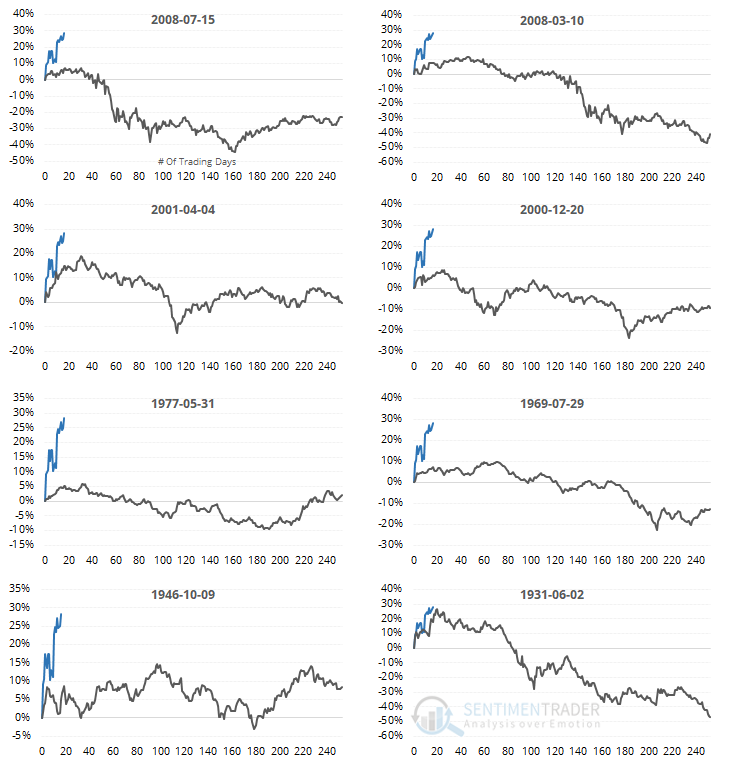
Now, let's look at the failures. These are times when the S&P also made a major push off a 52-week low but ended up seeing either a negative or only slightly positive return over the next year.
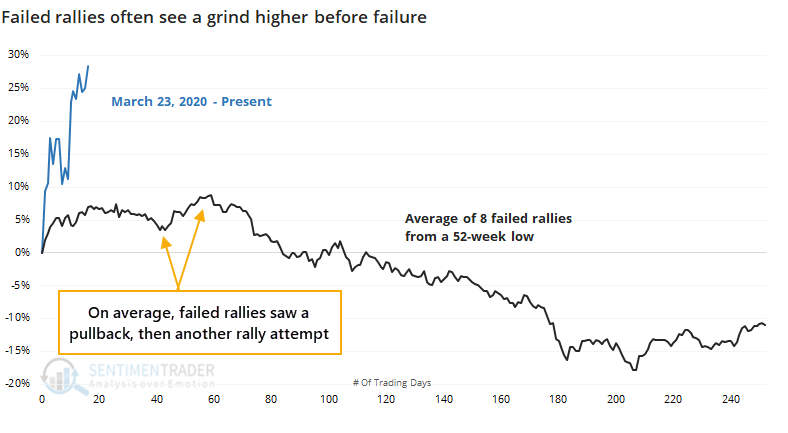
Even though these rallies ended up failing, it usually didn't happen right away. While the initial kick-off rally often paused right around now, there was another round of buying interest following the dip. This was the first real opportunity for buyers who didn't catch the falling knife, and missed out on the initial rebound.
It's interesting how rare it was to see the S&P roll over and head to new lows immediately, even during what ultimately proved to be failures.
Nothing is guaranteed, and we're in one of the most unique market environments in recorded history. If we can count on investor behavior repeating in a very general sense, then we should see buyers try to make another attempt following the first real pullback, even if we're due for a long-term slog and more protracted bear market.
BOTTOM LINE
The smallest of options traders bought a lot of speculative call options last week, among the most in 15 years. But they're still buying a lot of protective puts, too. Overall speculation has increased and is high for a downtrending market.
FORECAST / TIMEFRAME
None
|
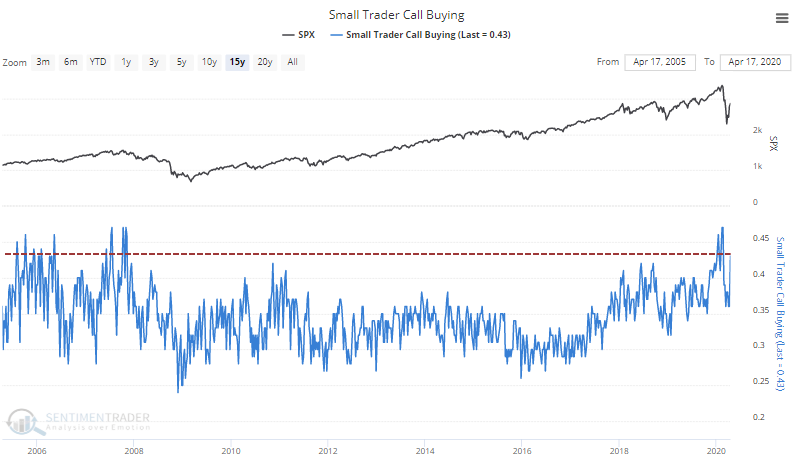
Last week, the smallest of options traders appeared to get a lot more optimistic than they've been in weeks. After paring down their speculative call buying in March, they ramped it back up again last week, spending more than 42% of their total volume on buying call options to open. That's among the most in years.
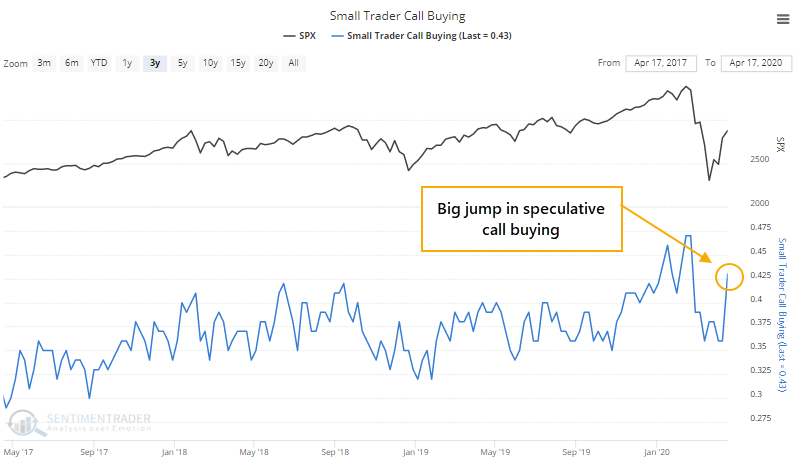
If we zoom out and look at the past 15 years, then we can see that it's still among the most aggressive weeks.
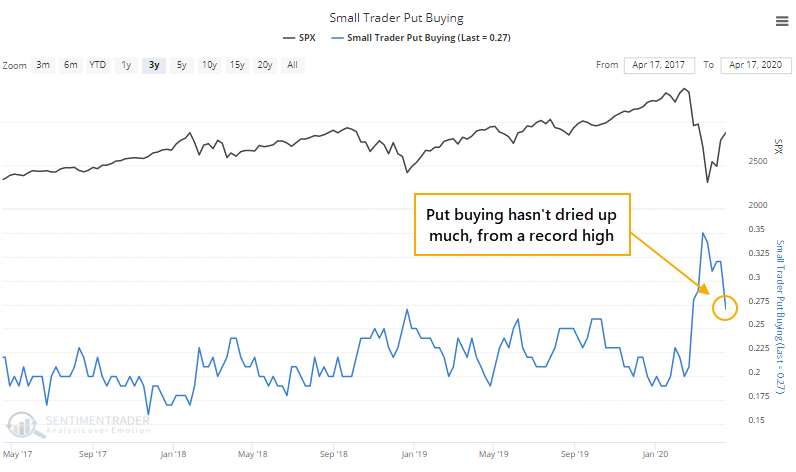
The odd thing is that they're buying a lot of protective put options, too. They spent more than 35% of their volume on buying puts near the bottom, a record amount, and have since pulled back on that strategy, but not as much as we might expect.
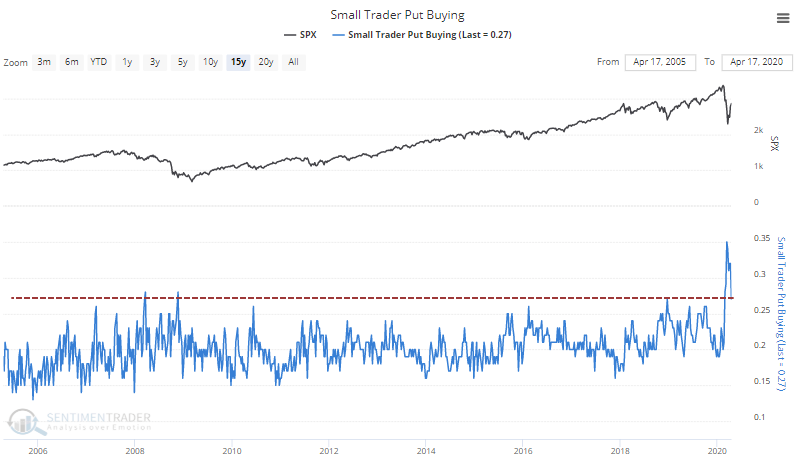
Zooming out over the past 15 years, we can see that the current pace of put buying is still above some of the biggest weeks ever.
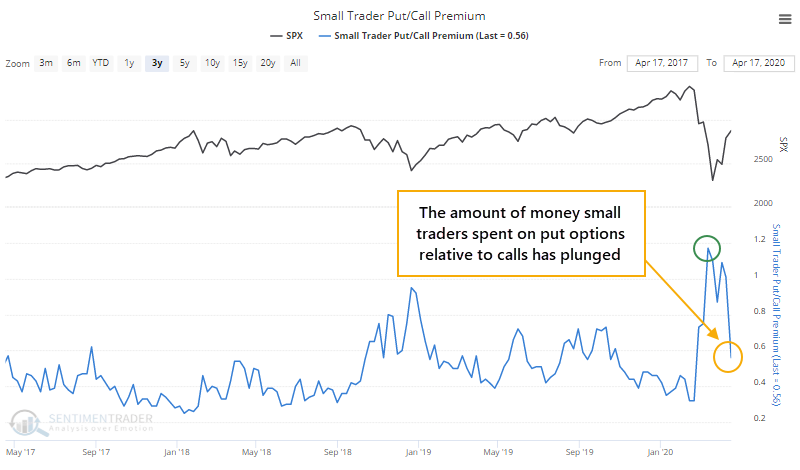
That sends a mixed message - small traders are buying a lot of calls and puts at the same time. That means they're spending less on selling options to open, which is a trend that's been in place for a decade.
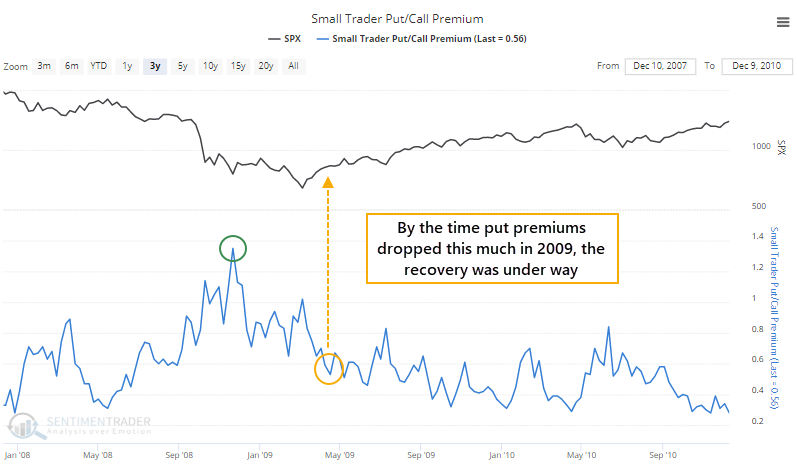
If we look at the amount of money these traders are spending on their put and call premiums, then we can see that it spiked as they panicked in March, and has since receded to a neutral level.
By the time we saw something similar in 2008, the real recovery was underway.
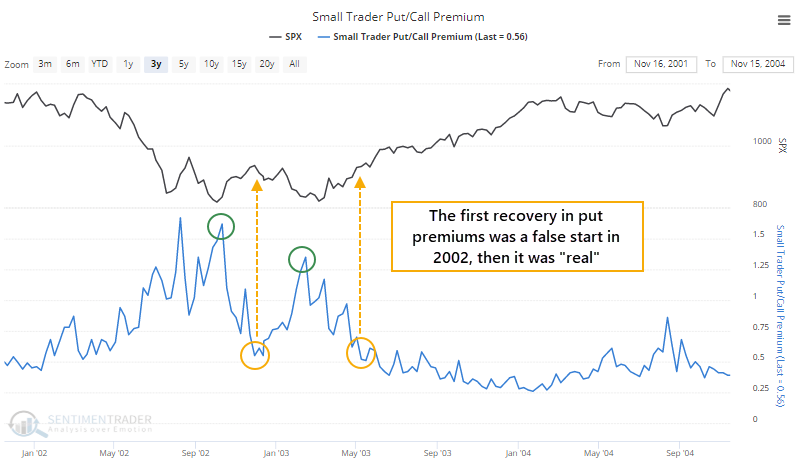
In 2002, these traders jumped the gun in the fall of 2002, assuming the worst was behind them. It was, but they still scrambled for puts again when the S&P went back down to test the lows.
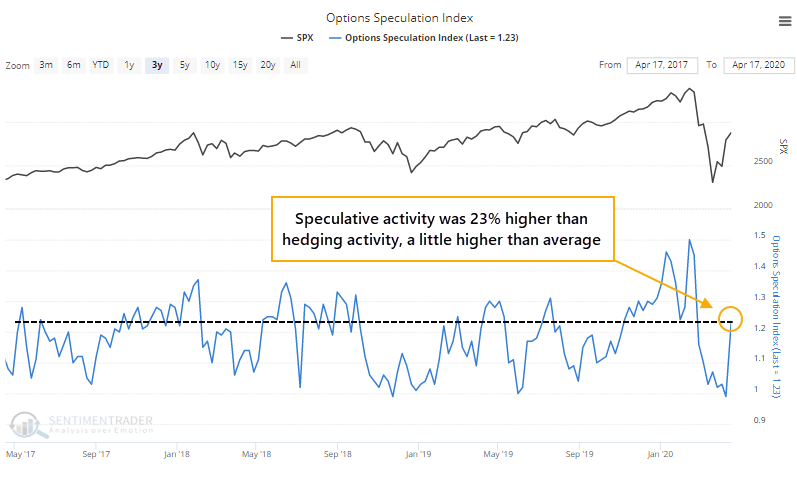
A more comprehensive look at options trader behavior, the Options Speculation Index, shows a jump in speculative activity, but not to the extremes seen over the past few years.
The Backtest Engine shows that when traders spent at least 20% more volume on bullish strategies than bearish ones, the S&P 500 typically rose in the weeks and months ahead, but returns weren't great, with a negative median up to three months later.
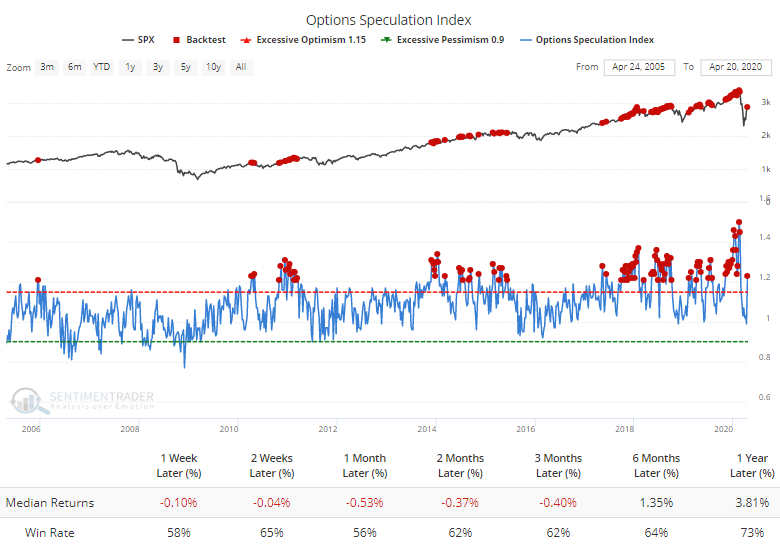
It's rare to see this much speculation during a downtrending market, though. If we test for lesser extremes, 10% more volume in bullish than bearish strategies, while the S&P is below its 50-week moving average, then returns over the next 2-4 weeks were poor.
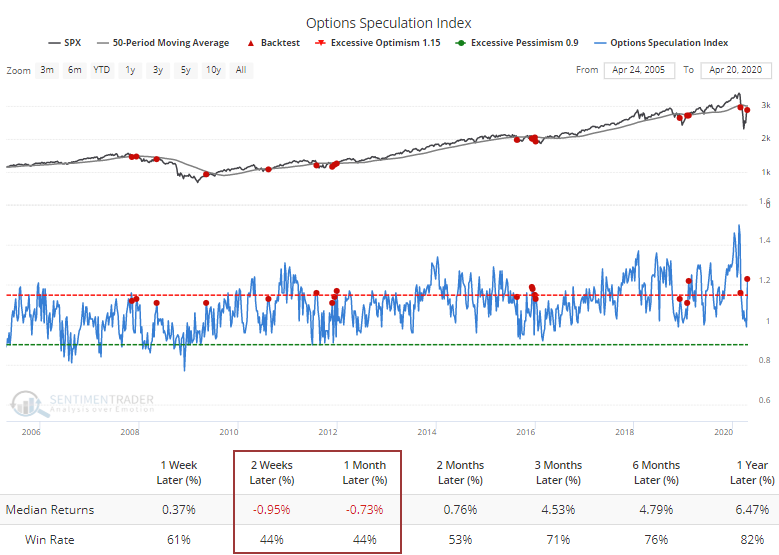
The overall suggestion from this behavior of options traders is that the jump in speculative activity is a modest, shorter-term worry. They're still buying a lot of protective puts, but that rise in speculative call buying is a definite worry, especially during a downtrending market. The panic in March might be (should be) enough to equate to a major bottom, but that doesn't mean there can't be weeks or even months of digestion.
Active Studies
| Time Frame | Bullish | Bearish | | Short-Term | 0 | 3 | | Medium-Term | 11 | 0 | | Long-Term | 32 | 3 |
|
Indicators at Extremes
Portfolio
| Position | Weight % | Added / Reduced | Date | | Stocks | 60.2 | Reduced 13% | 2020-04-20 | | Bonds | 0.0 | Reduced 6.7% | 2020-02-28 | | Commodities | 5.2 | Added 2.4%
| 2020-02-28 | | Precious Metals | 0.0 | Reduced 3.6% | 2020-02-28 | | Special Situations | 0.0 | Reduced 31.9% | 2020-03-17 | | Cash | 34.6 | | |
|
Updates (Changes made today are underlined)
In the first months of the year, we saw manic trading activity. From big jumps in specific stocks to historic highs in retail trading activity to record highs in household confidence to almost unbelievable confidence among options traders. All of that came amid a market where the average stock couldn't keep up with their indexes. There were signs of waning momentum in stocks underlying the major averages, which started triggering technical warning signs in late January. The kinds of extremes we saw in December and January typically take months to wear away, but the type of selling in March went a long way toward getting there. When we place the kind of moves we saw into March 23 into the context of coming off an all-time high, there has been a high probability of a multi-month rebound. After stocks bottomed on the 23rd, they enjoyed a historic buying thrust and retraced a larger amount of the decline than "just a bear market rally" tends to. While other signs are mixed that panic is subsiding, those thrusts are the most encouraging sign we've seen in years. Shorter-term, there have been some warning signs popping up and our studies have stopped showing as positively skewed returns. I decided to reduce my exposure a bit after the gap down and partial closing of that gap on Monday, and would likely reduce substantially more should we drop below last week's lows.
RETURN YTD: -9.9% 2019: 12.6%, 2018: 0.6%, 2017: 3.8%, 2016: 17.1%, 2015: 9.2%, 2014: 14.5%, 2013: 2.2%, 2012: 10.8%, 2011: 16.5%, 2010: 15.3%, 2009: 23.9%, 2008: 16.2%, 2007: 7.8%
|
|
Phase Table
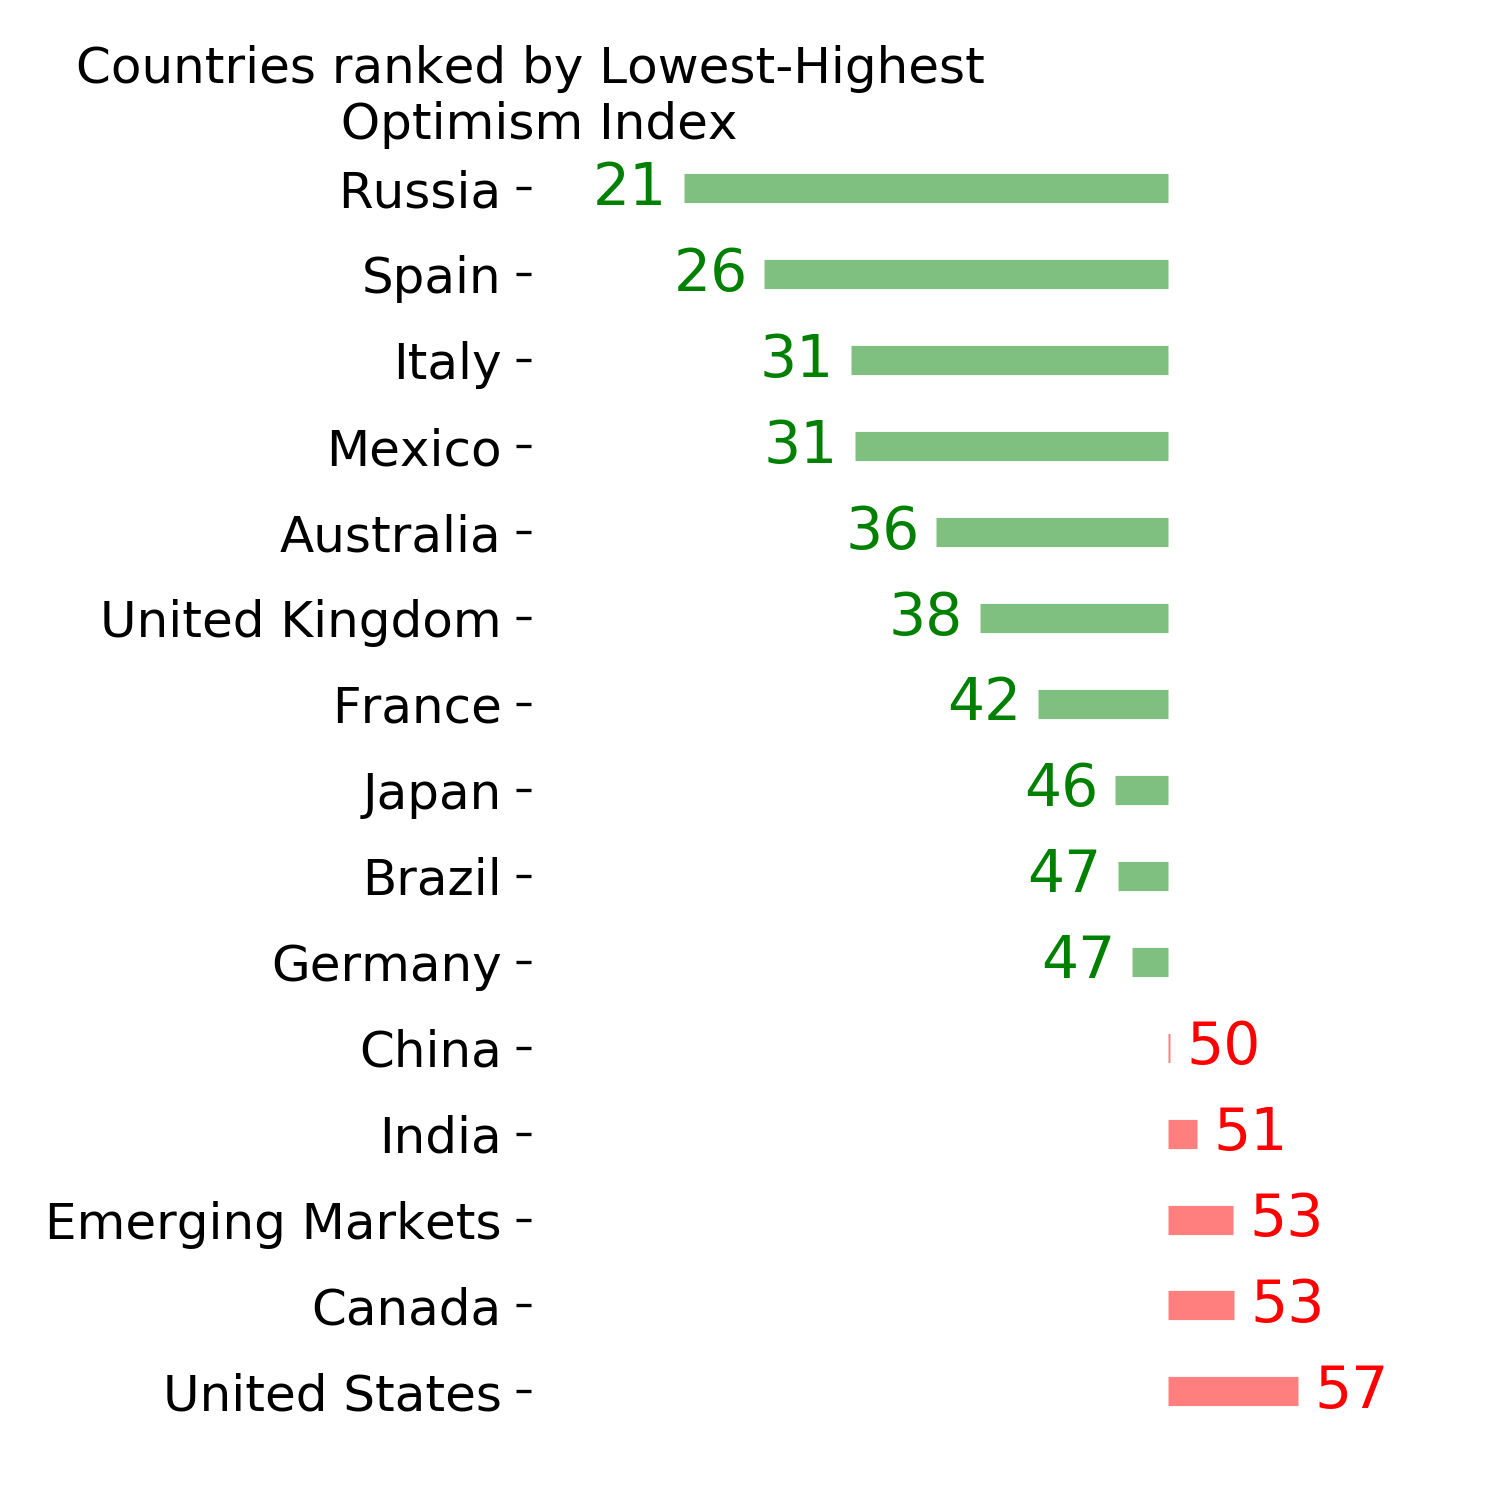
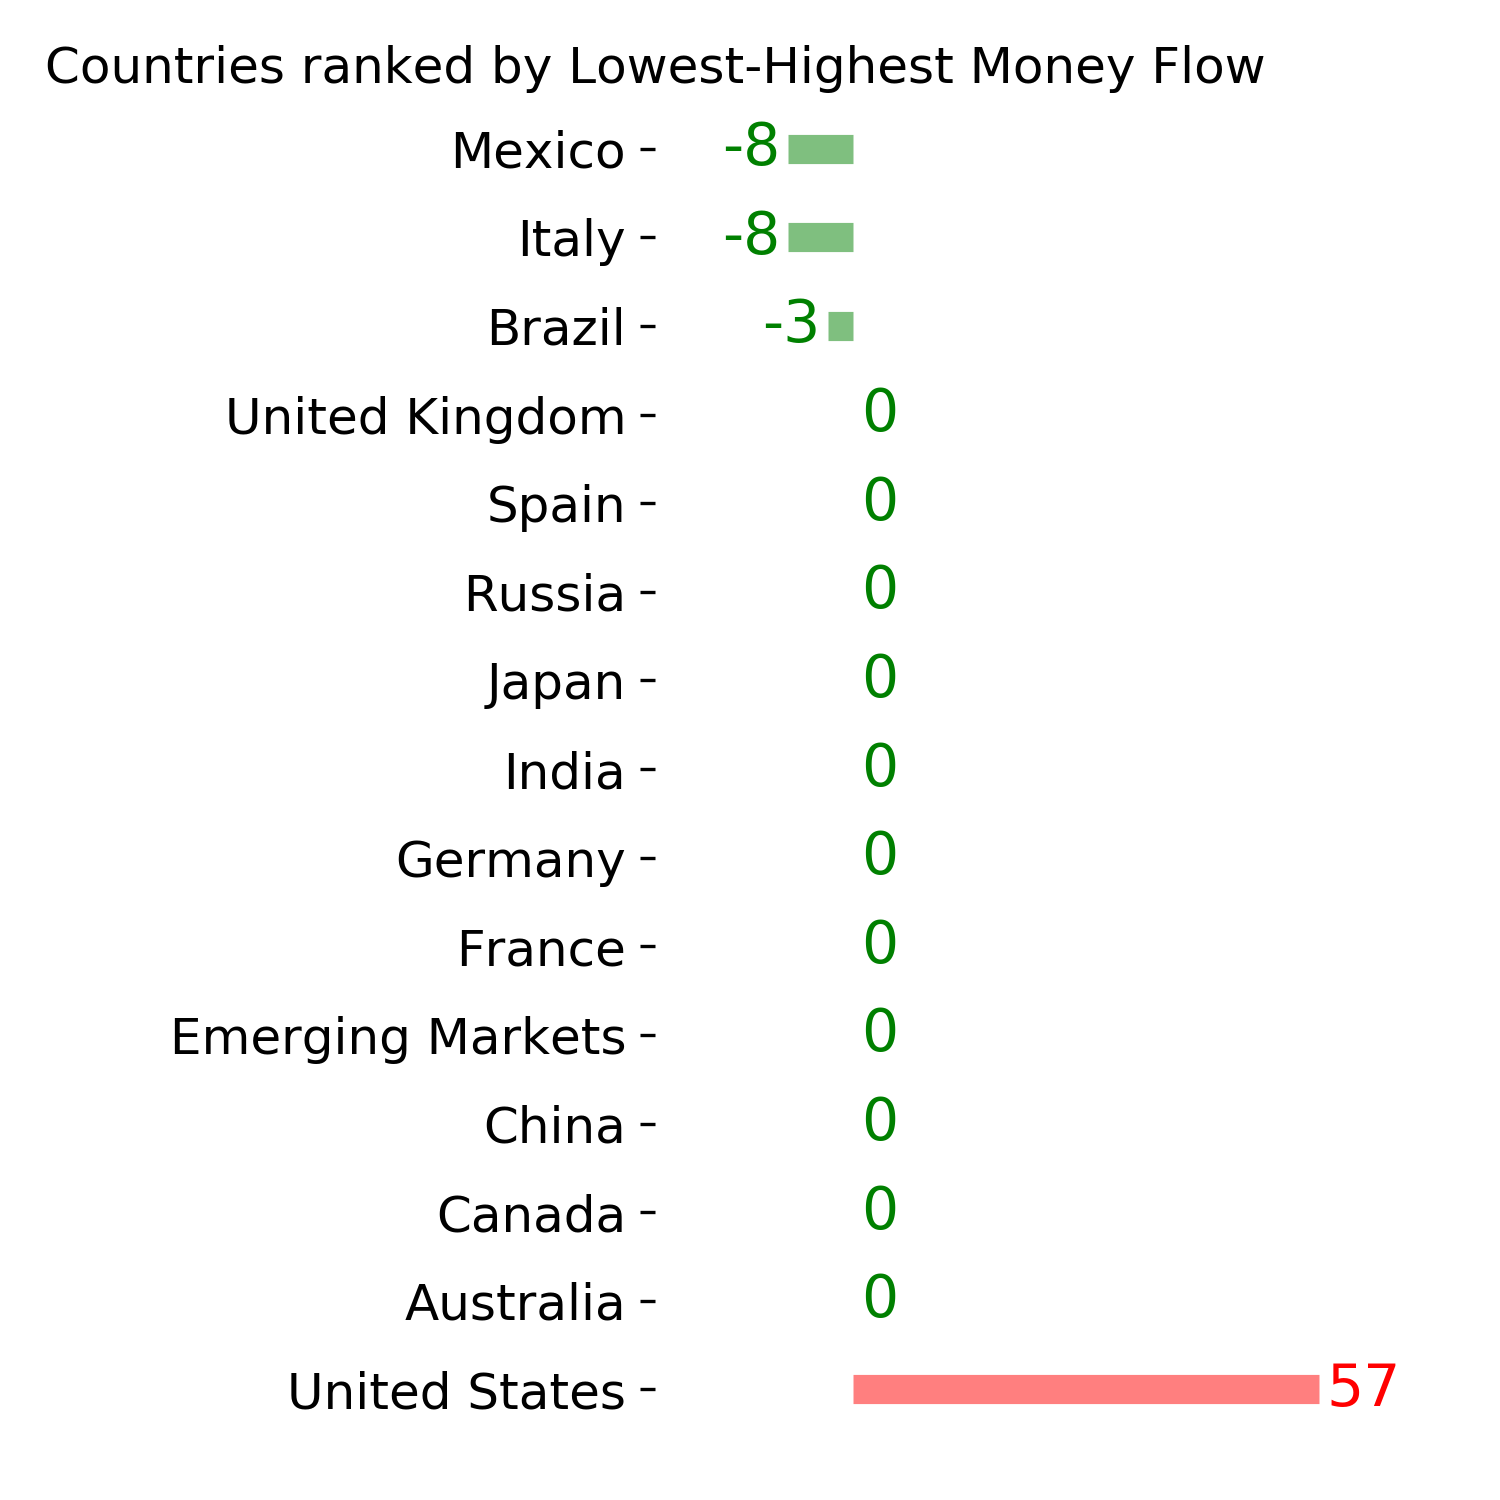
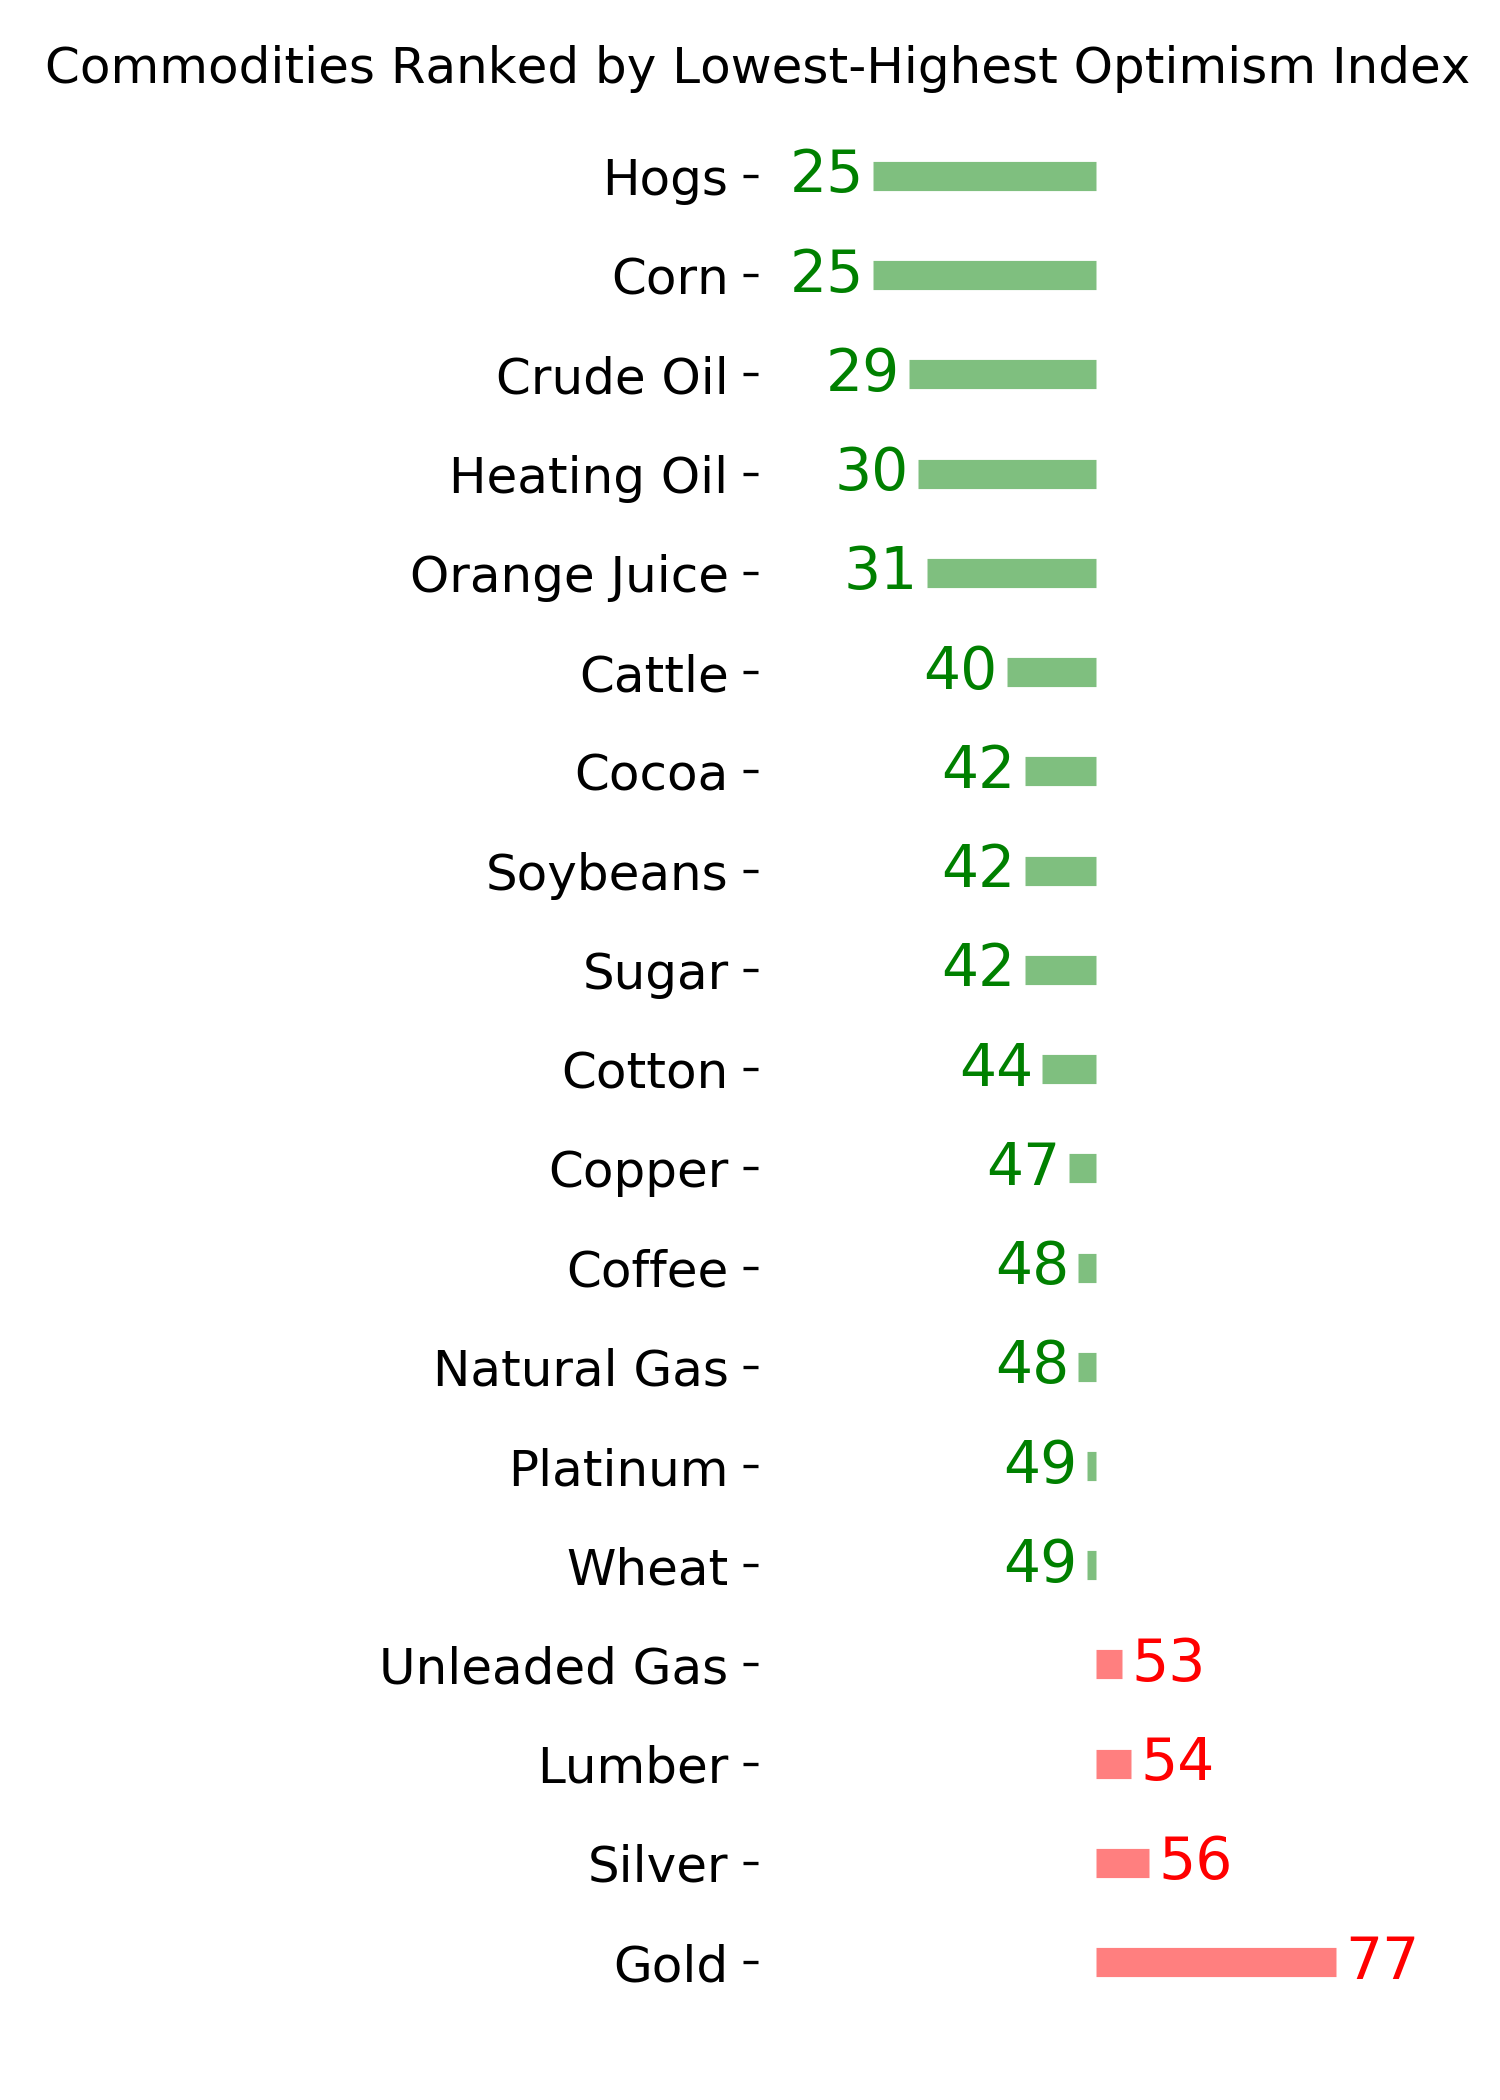
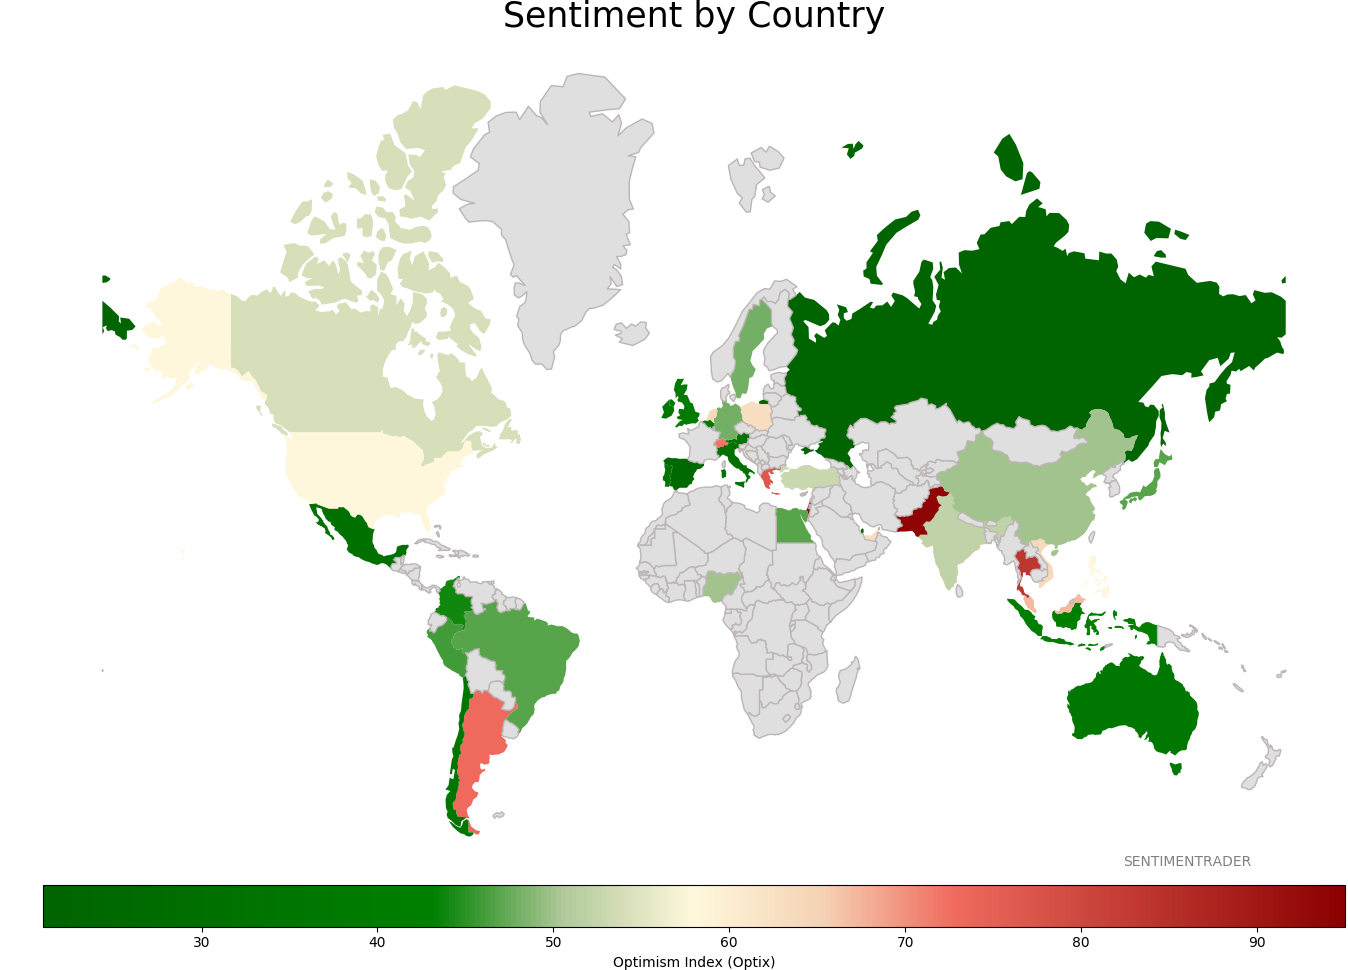
Ranks
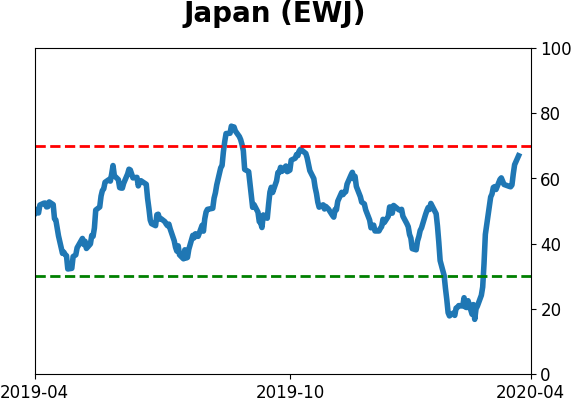
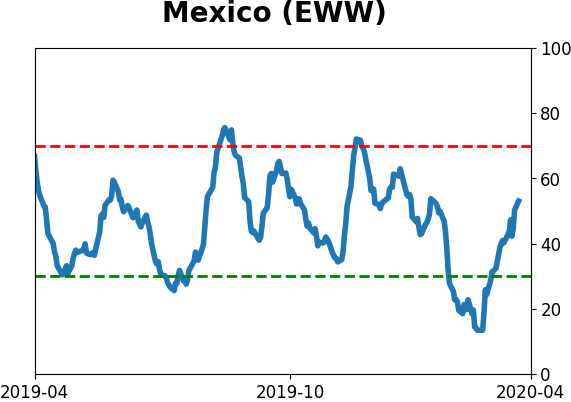
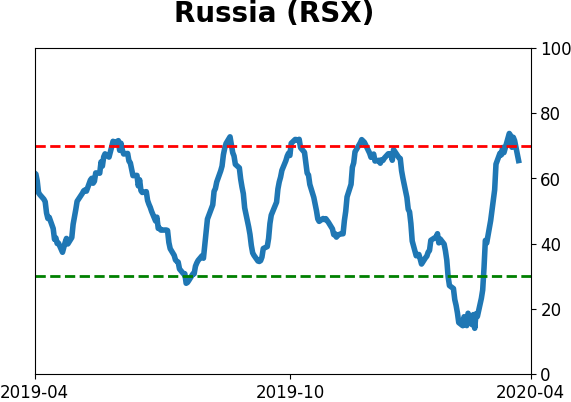
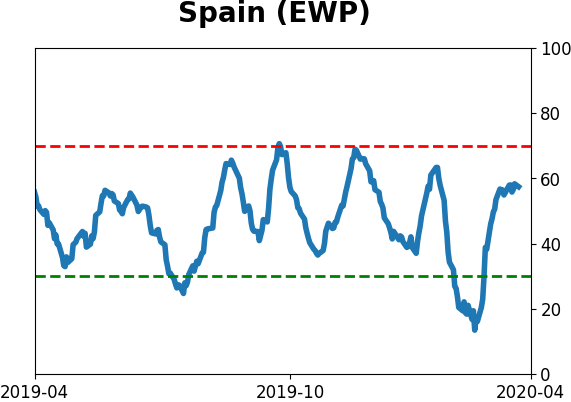
Sentiment Around The World
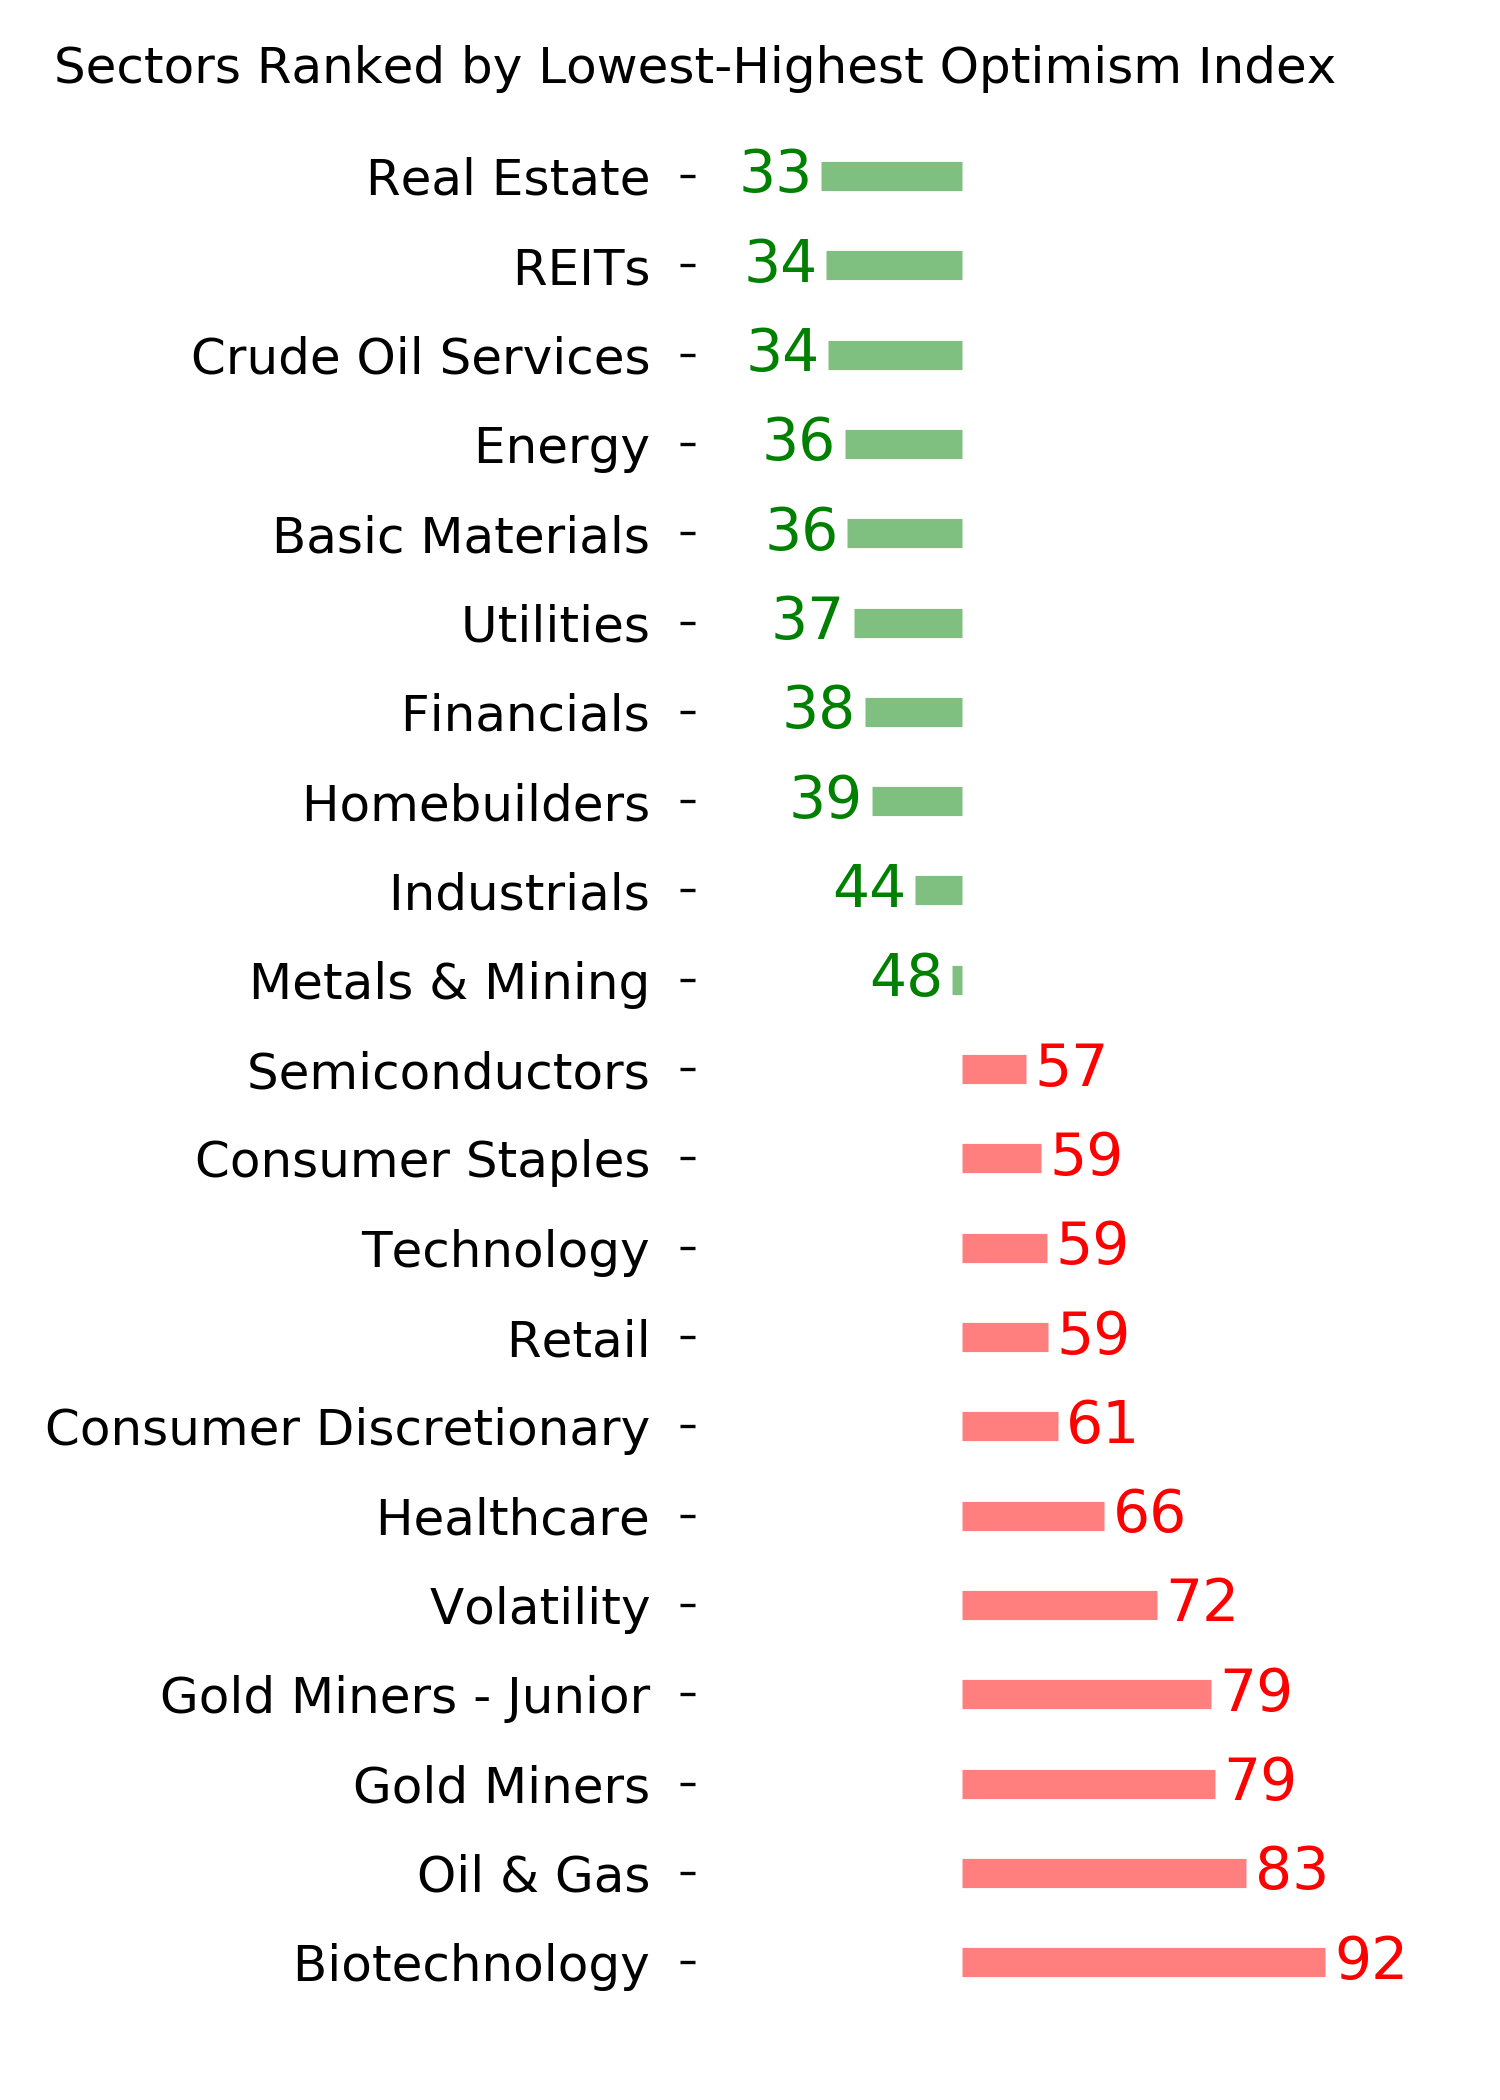
Optimism Index Thumbnails
|
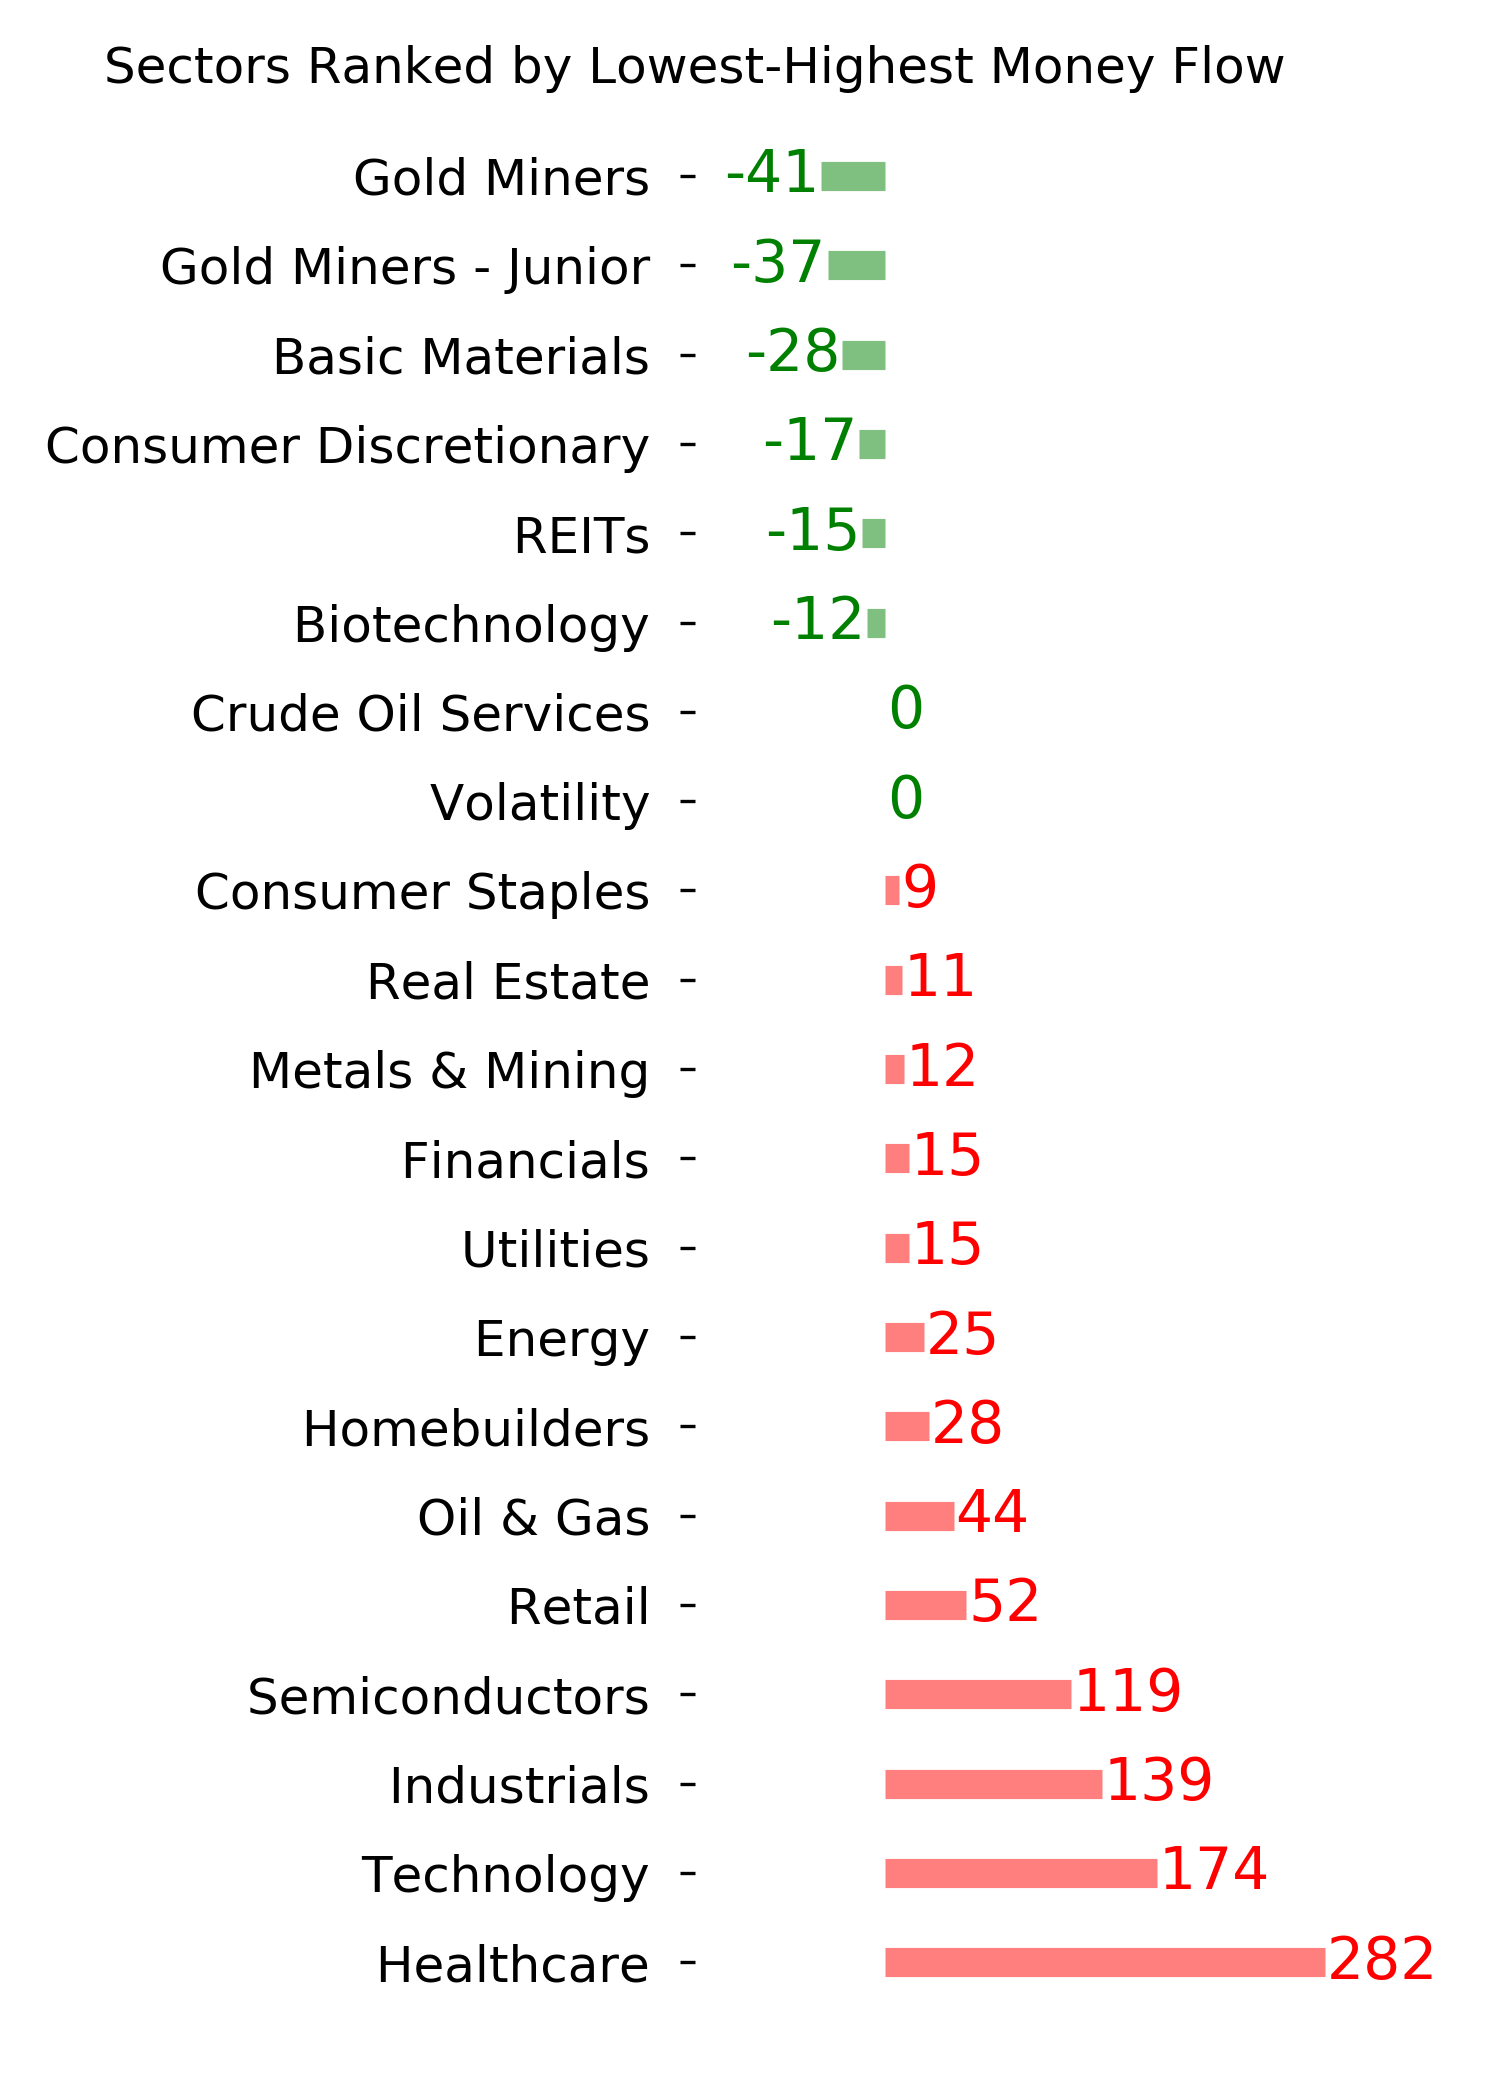
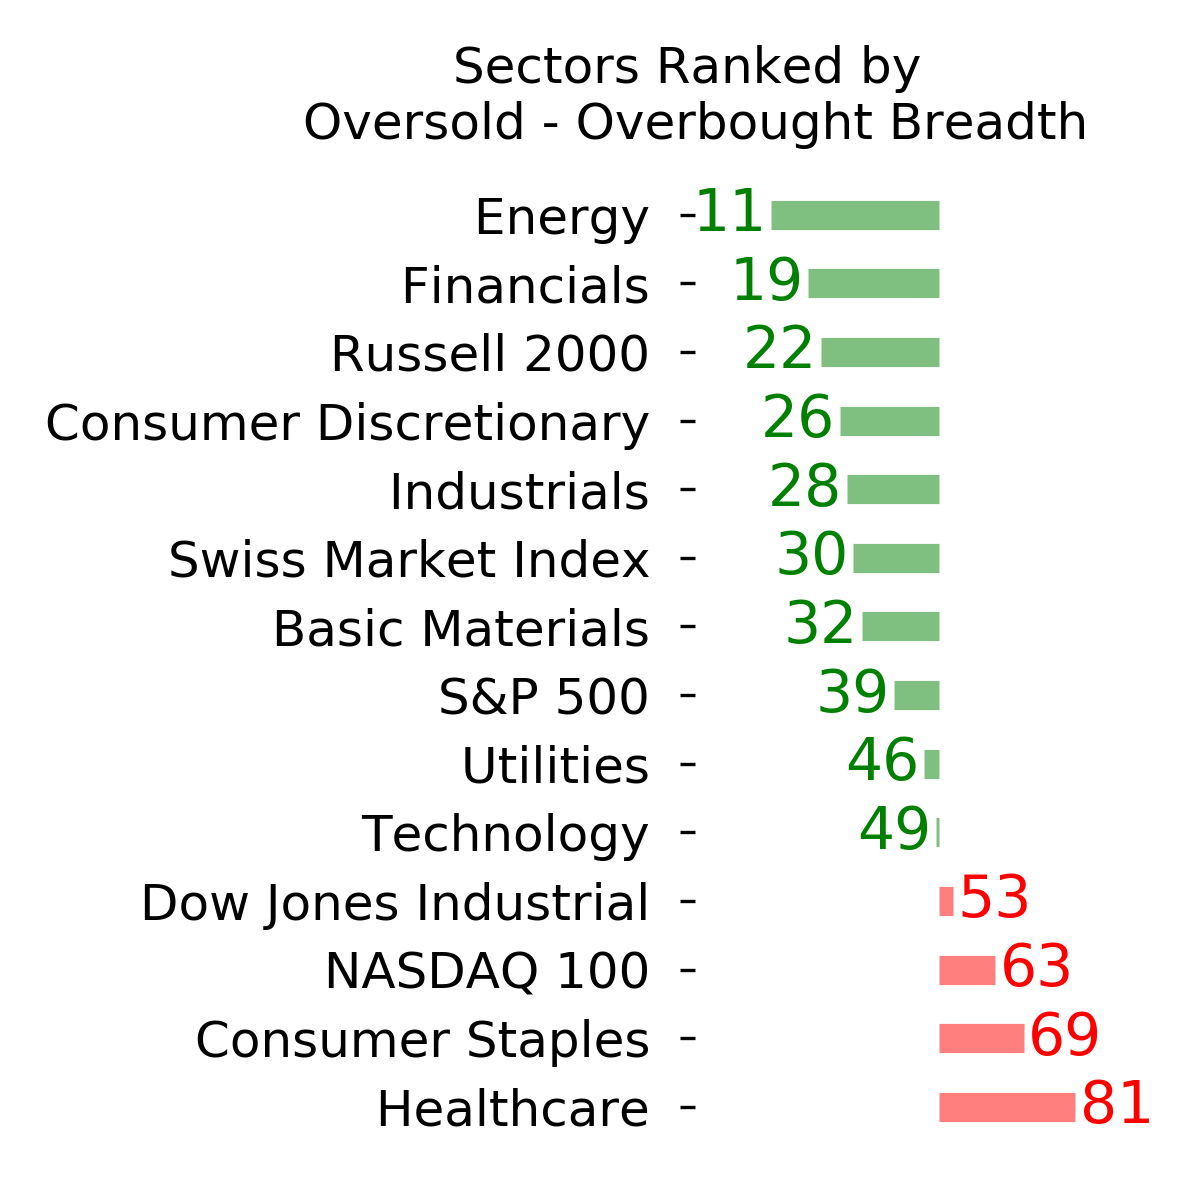
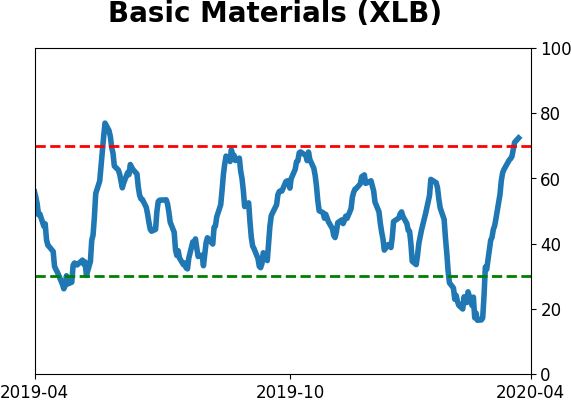
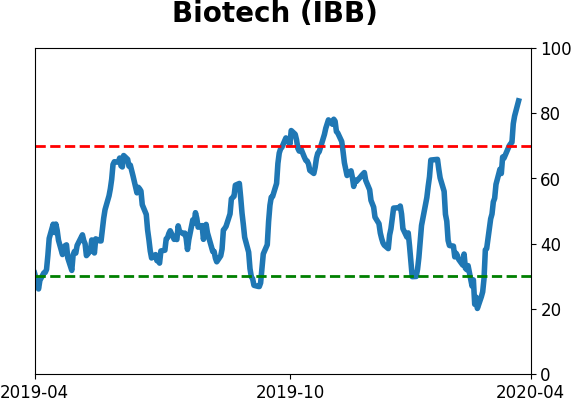
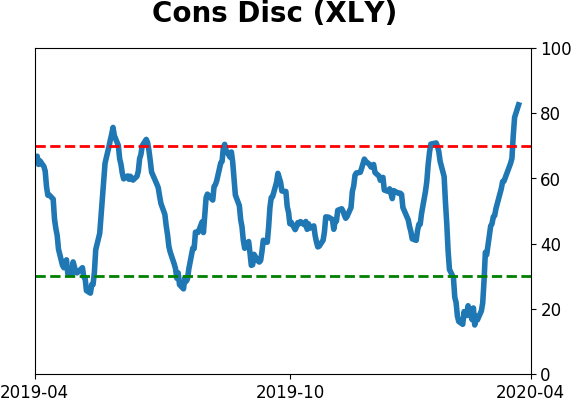
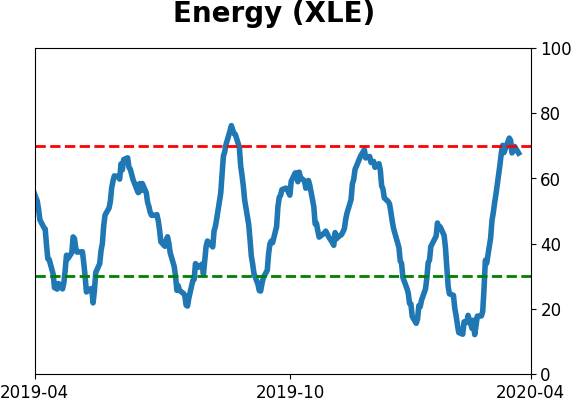
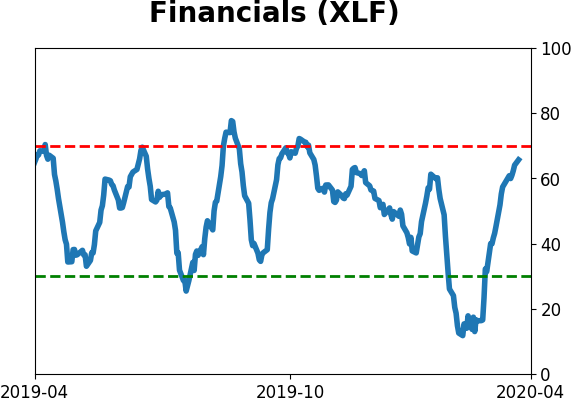
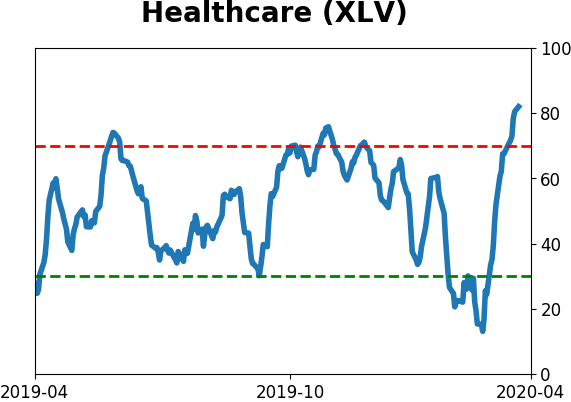
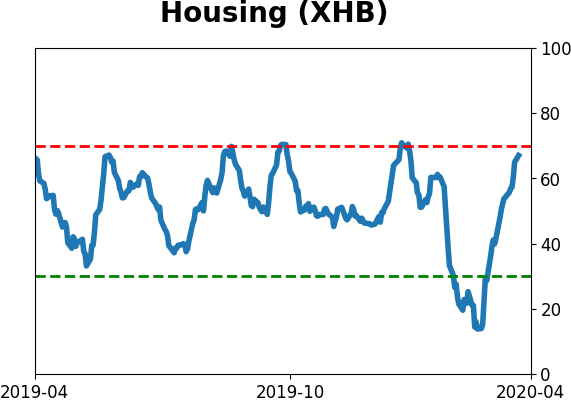
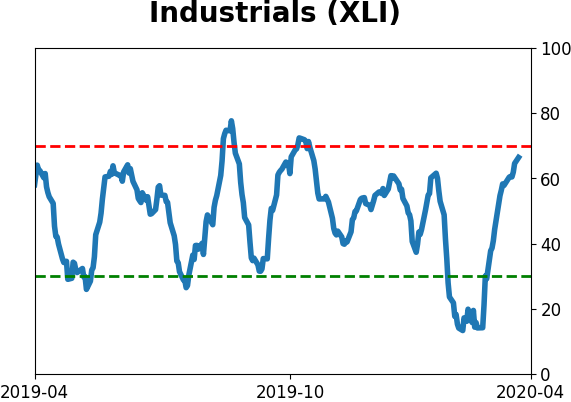
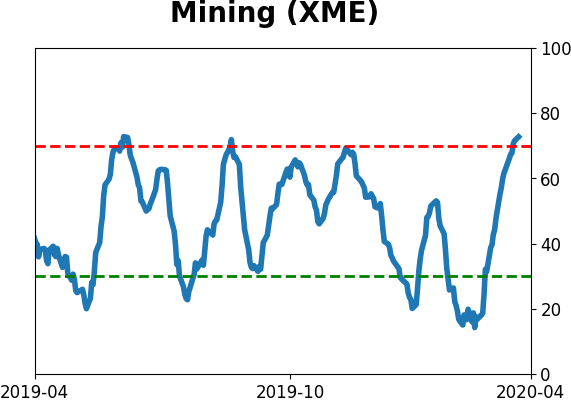
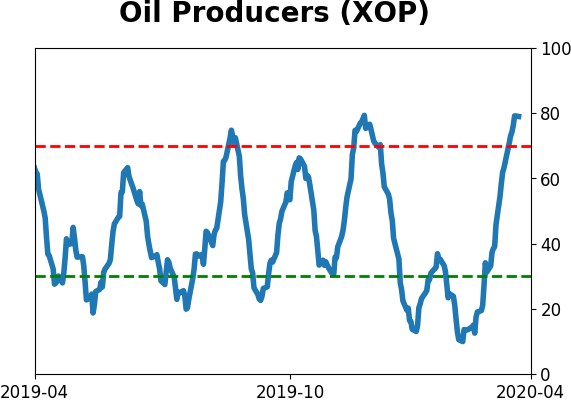
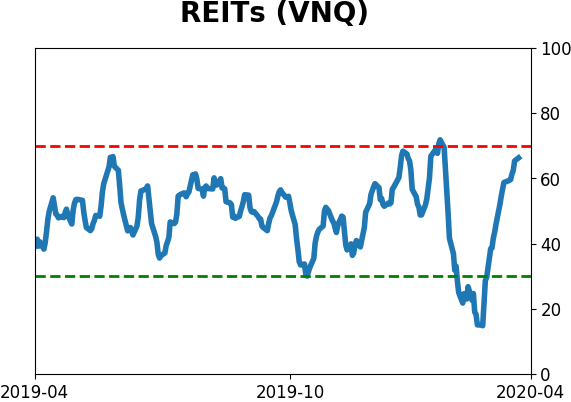
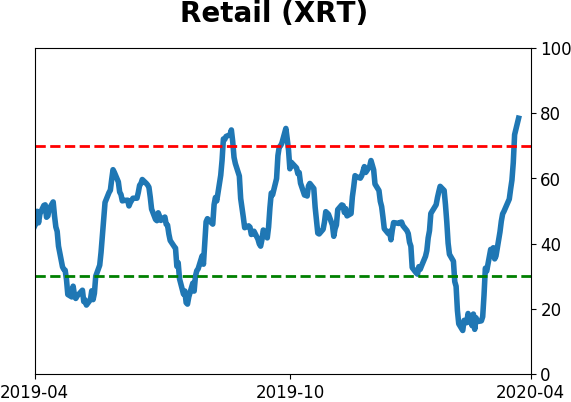
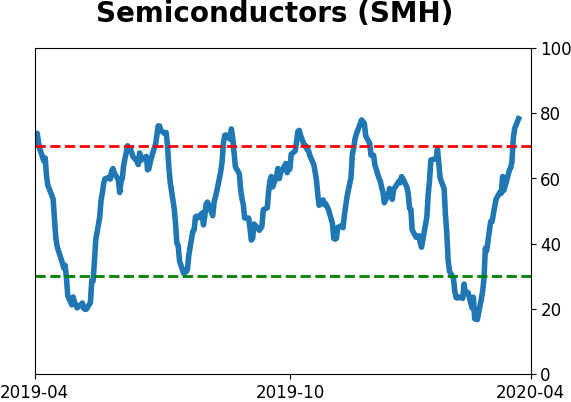
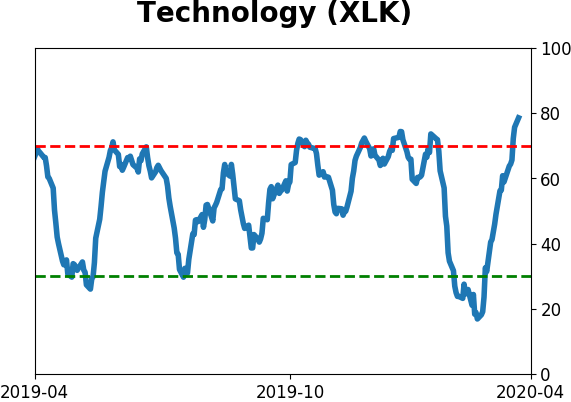
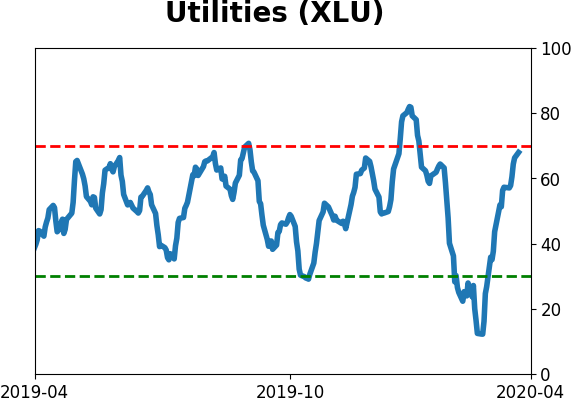
Sector ETF's - 10-Day Moving Average
|
|
|
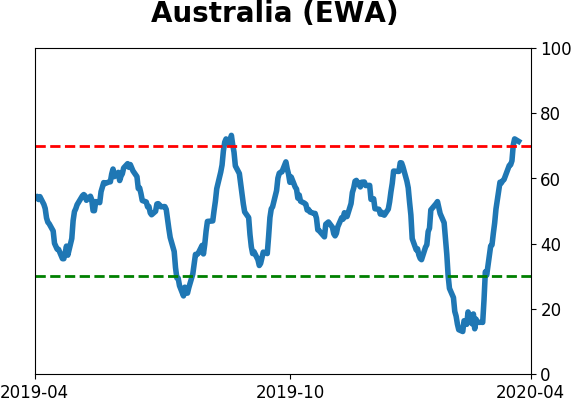
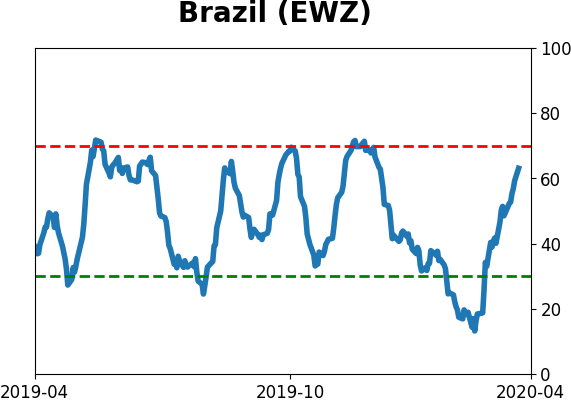
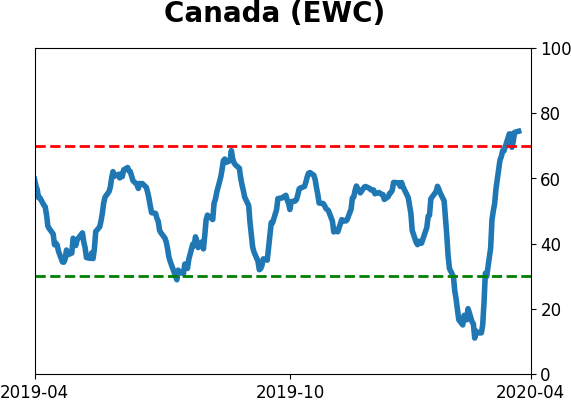
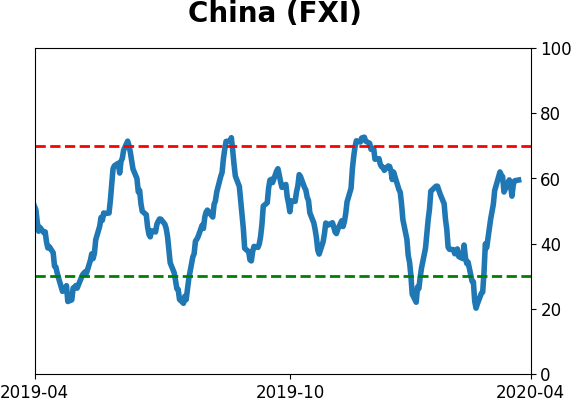
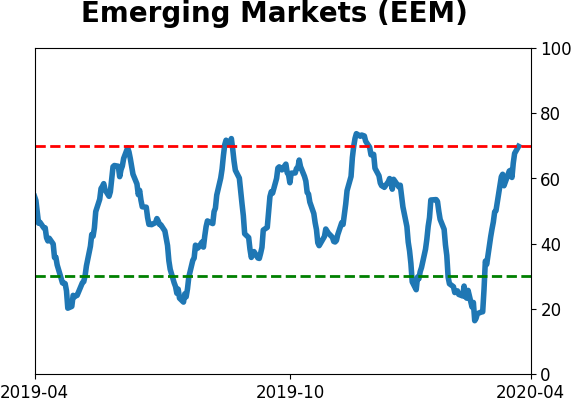
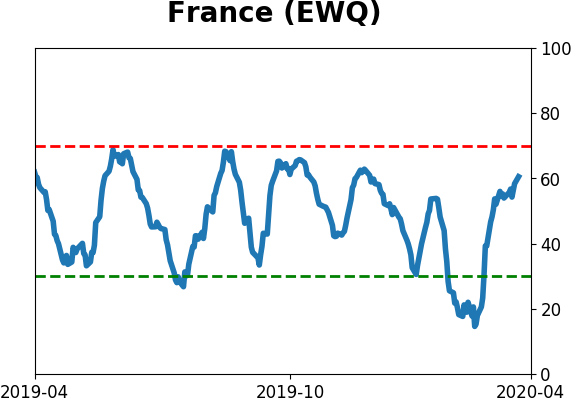
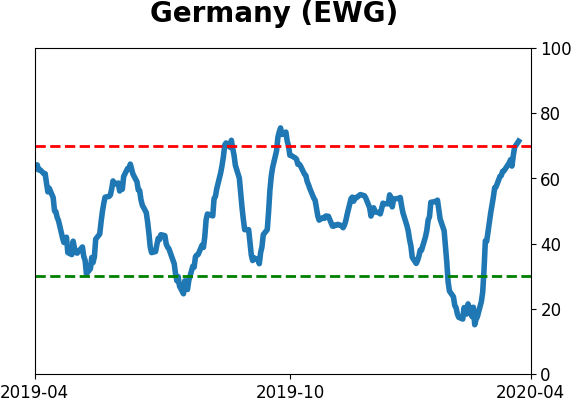
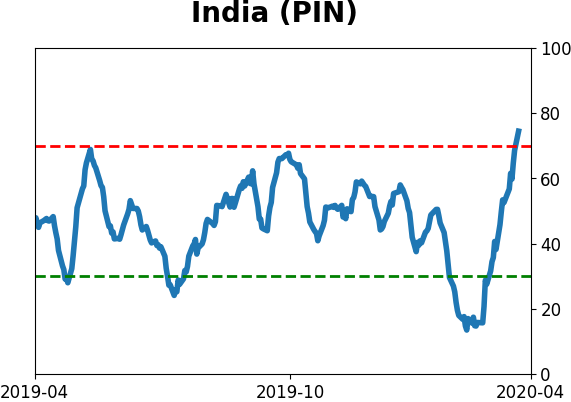
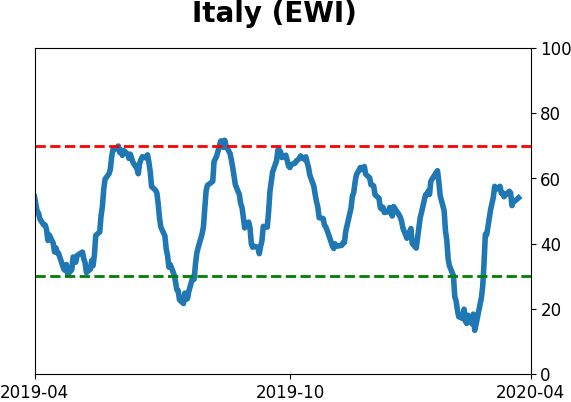
Country ETF's - 10-Day Moving Average
|
|
|
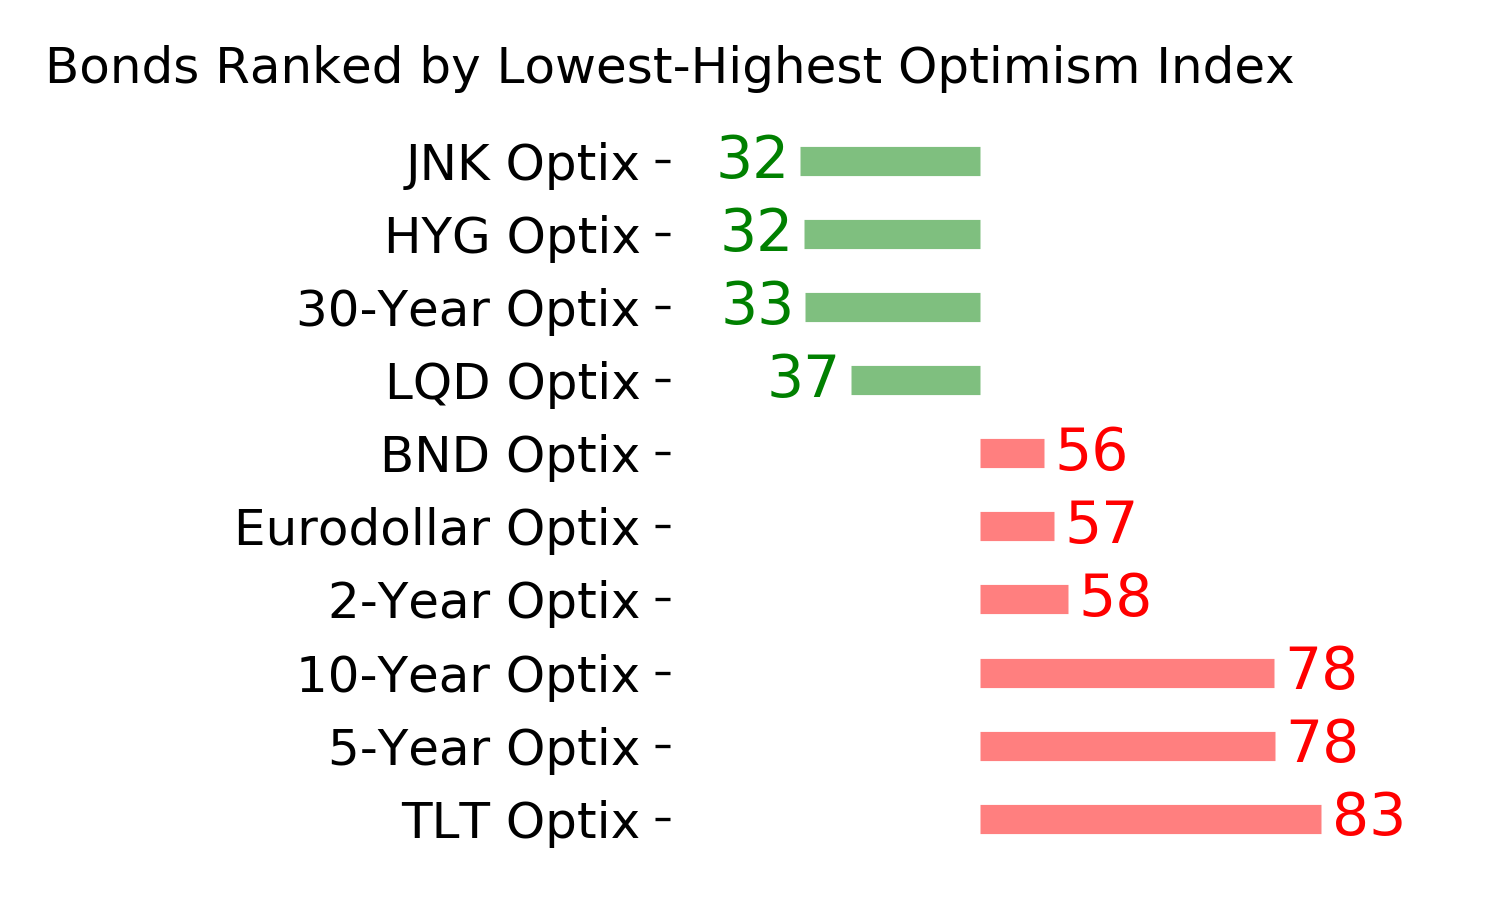
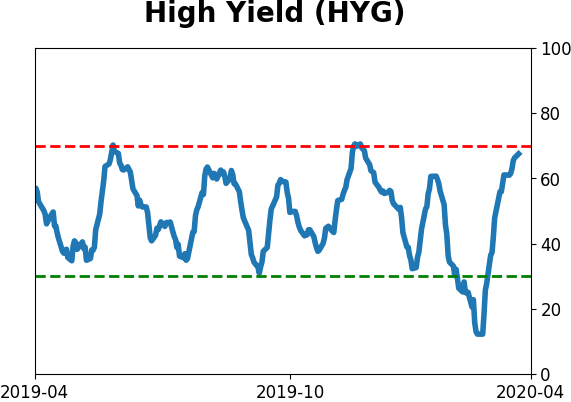
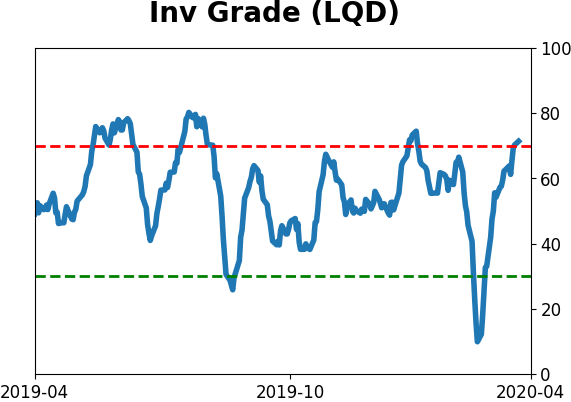
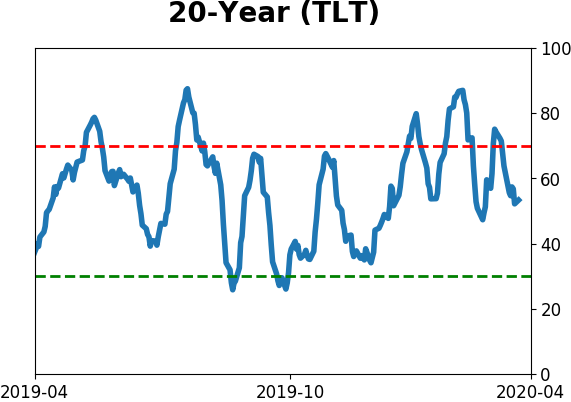
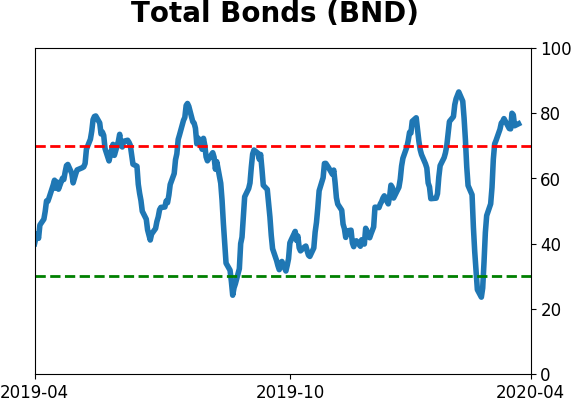
Bond ETF's - 10-Day Moving Average
|
|
|
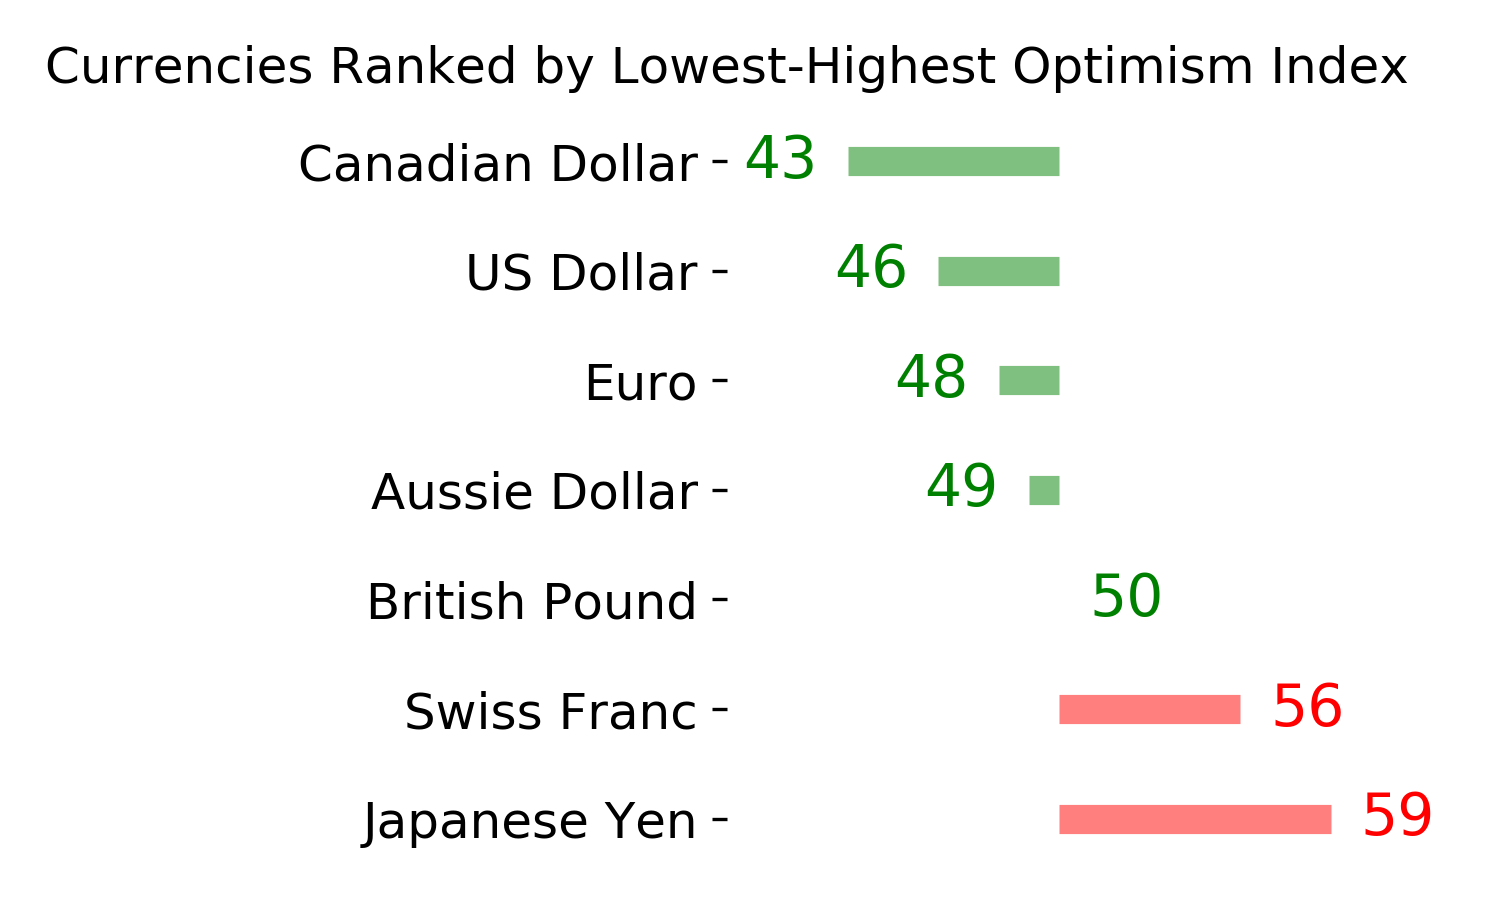
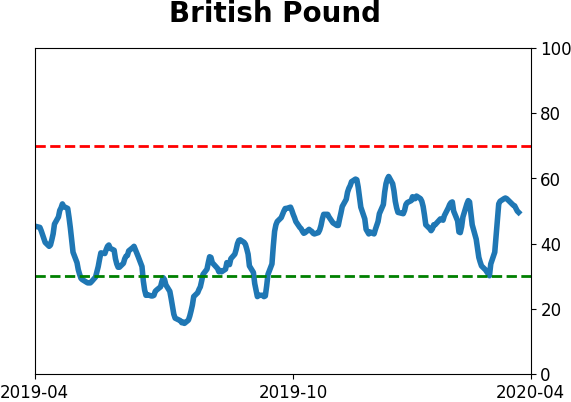
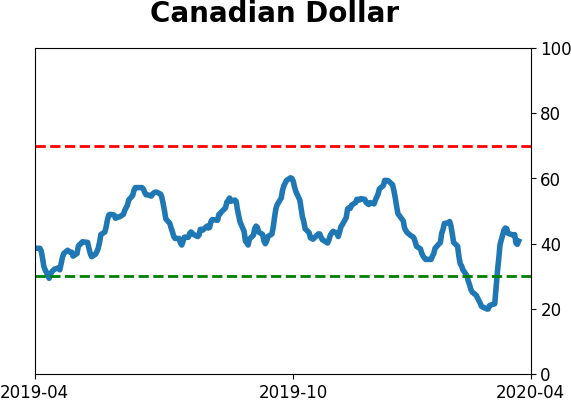
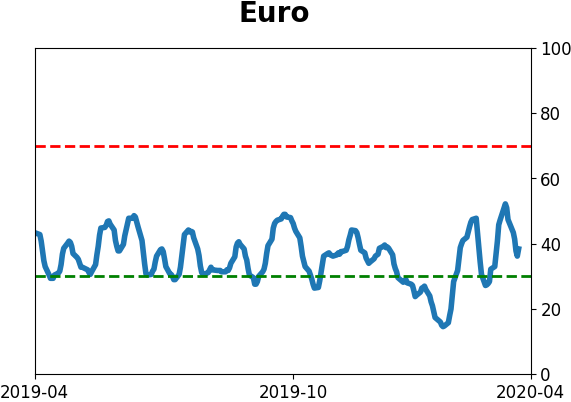
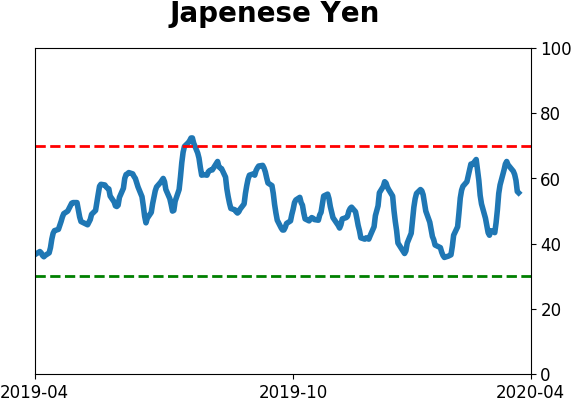
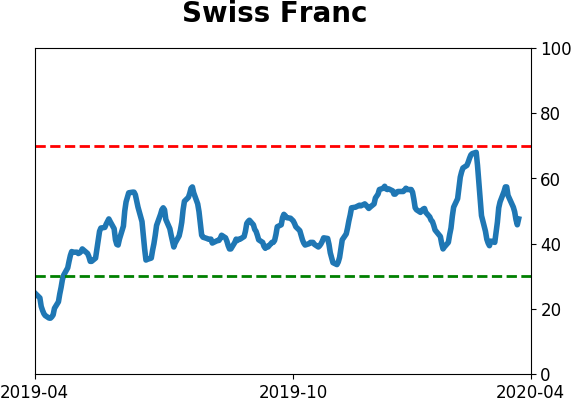
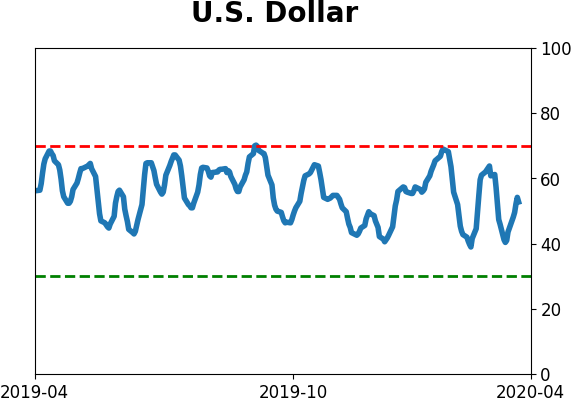
Currency ETF's - 5-Day Moving Average
|
|
|
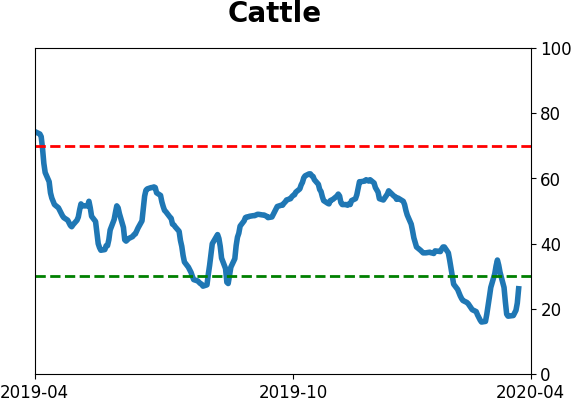
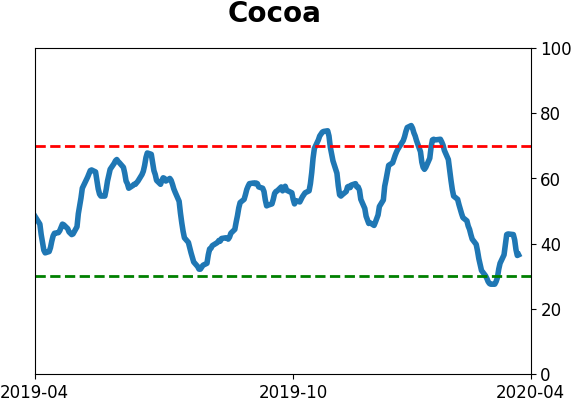
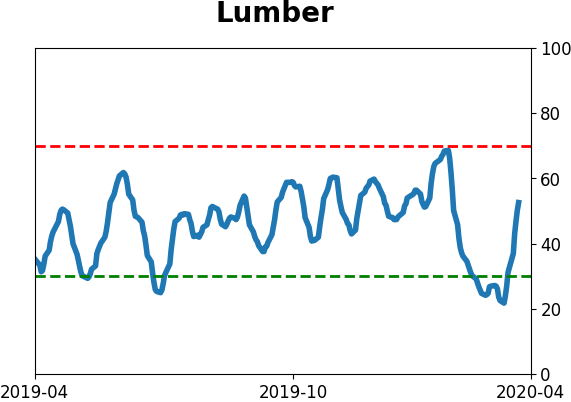
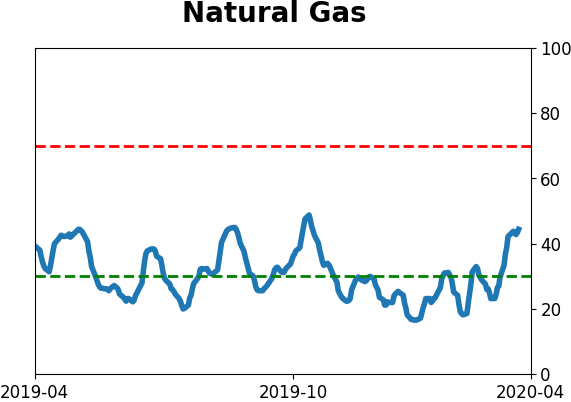
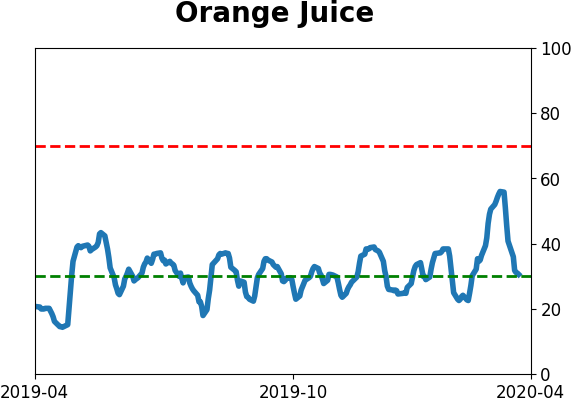
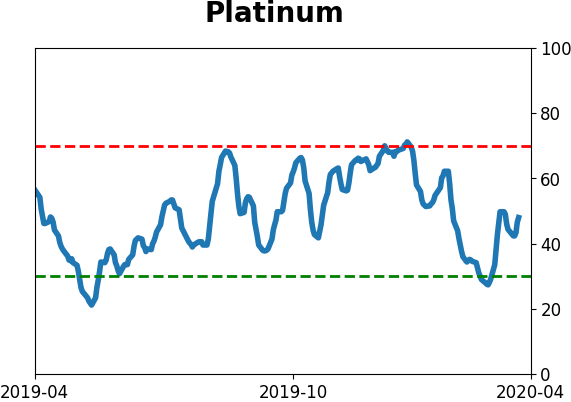
Commodity ETF's - 5-Day Moving Average
|
|