Headlines
|
|
Investors go all in as insiders fold:
Thanks to a remarkable run in stocks, more indicators have registered extremes, with a near-record growth in margin debt, record assets in leveraged ETFs, and heavy speculative options activity, while insiders appear to be selling.
Bottom Line:
See the Outlook & Allocations page for more details on these summaries STOCKS: Weak sell
The extreme speculation registered in January and February is starting to get wrung out. Internal dynamics have mostly held up, so a return to neutral sentiment conditions would improve the forward risk/reward profile substantially. We're still a ways off from that. BONDS: Weak buy
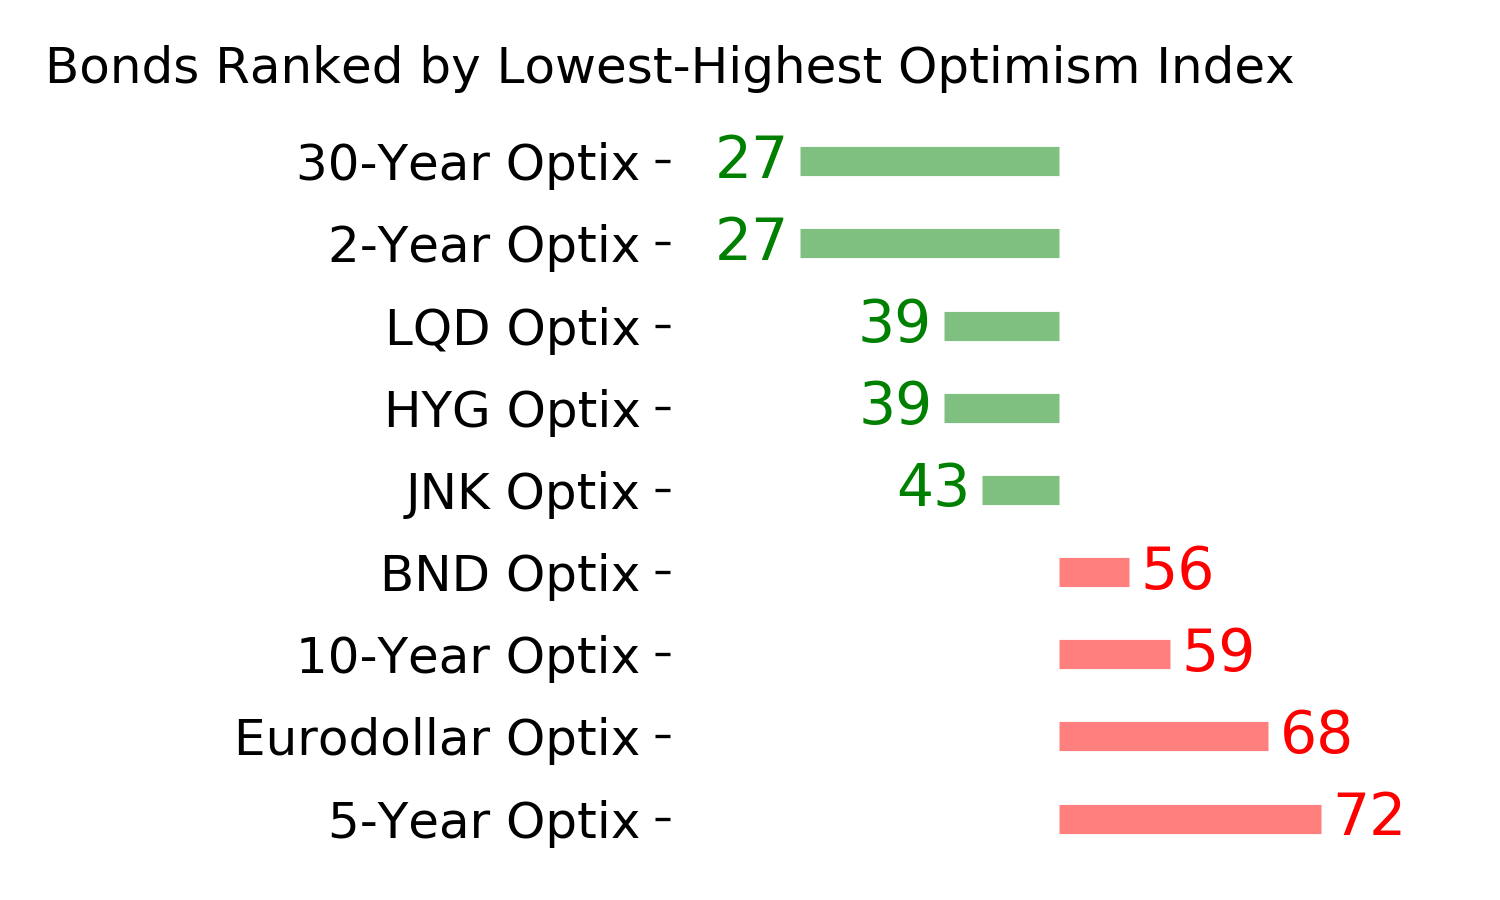
Various parts of the market have been hit in recent weeks, with mild oversold conditions. The Bond Optimism Index is now about as low as it gets during healthy bond market environments. Fixed income isn't responding well, so that needs to be monitored in case it's transitioning to a longer-term negative market environment. GOLD: Weak buy
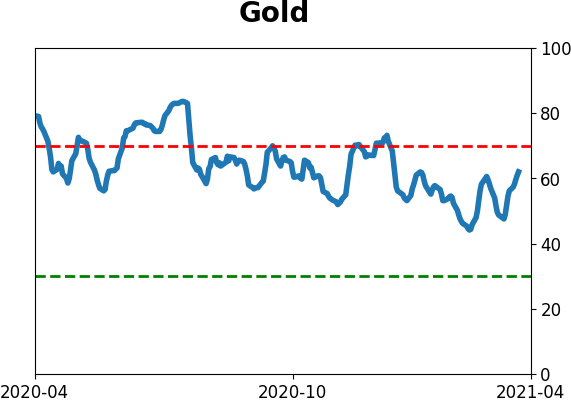
A dollar trying to rebound from a severe short position has weighed on gold and miners. The types of signals they've given in recent weeks, within the context of their recent surge, have usually resulted in higher prices over a medium- to long-term time frame. Like bonds, gold and miners aren't responding very well, and this needs to be monitored.
|
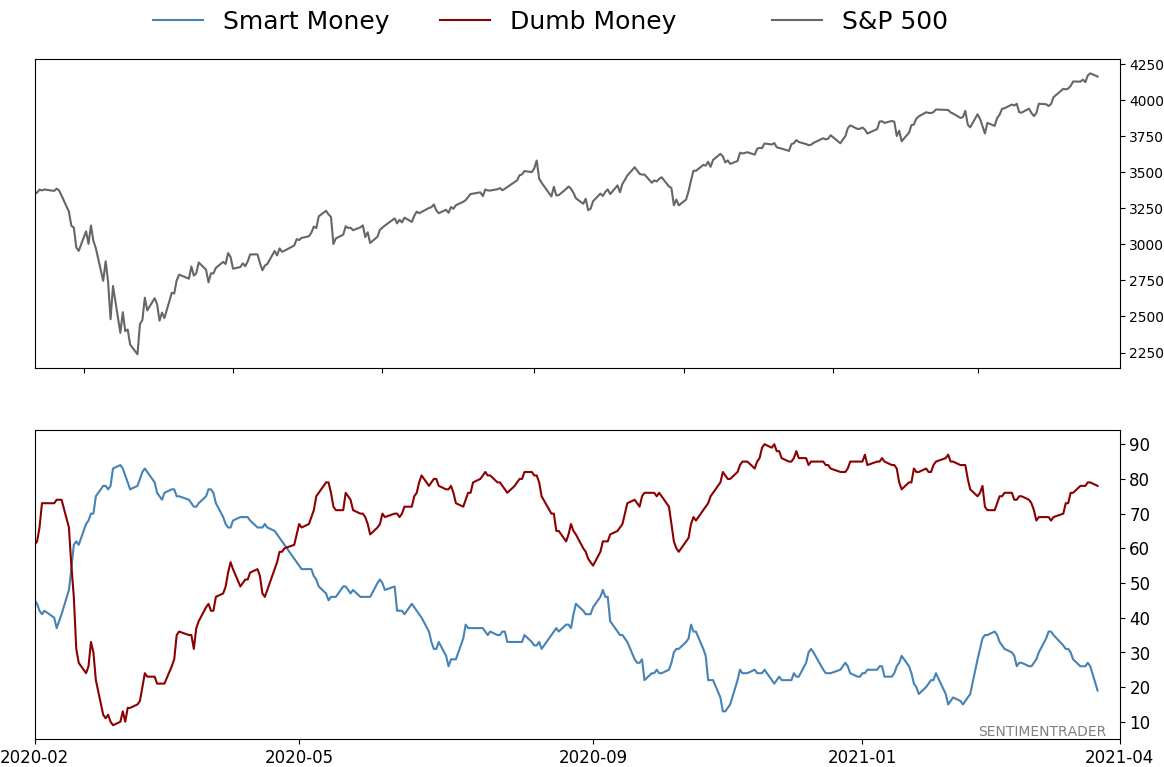
Smart / Dumb Money Confidence
|
Smart Money Confidence: 19%
Dumb Money Confidence: 78%
|
|
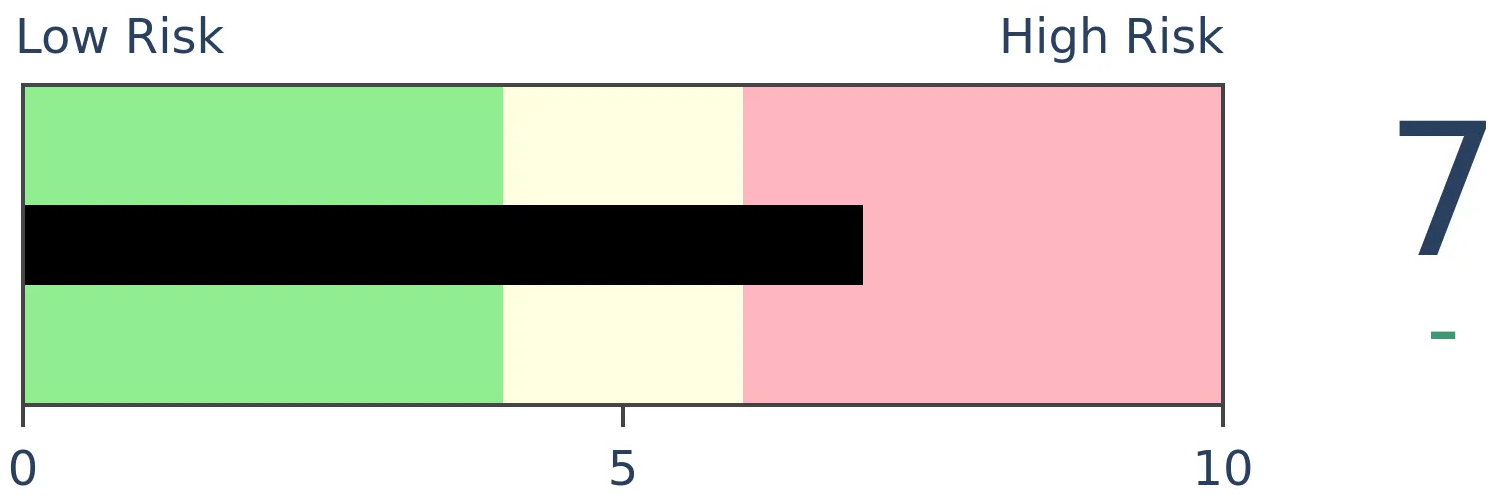
Risk Levels
Stocks Short-Term
|
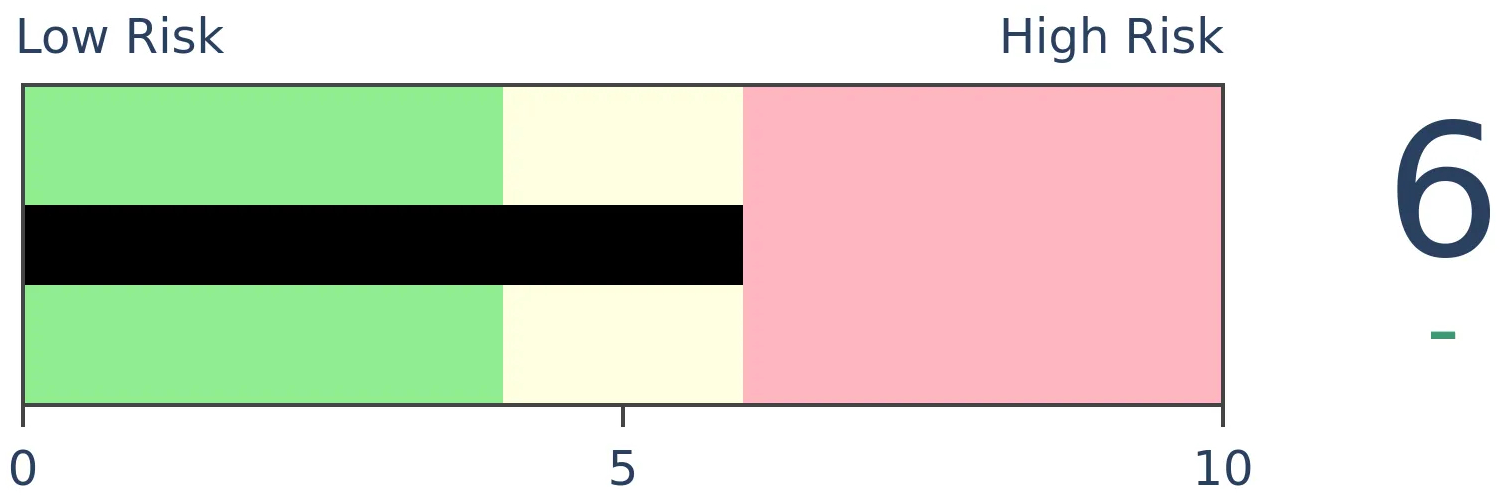
Stocks Medium-Term
|
|
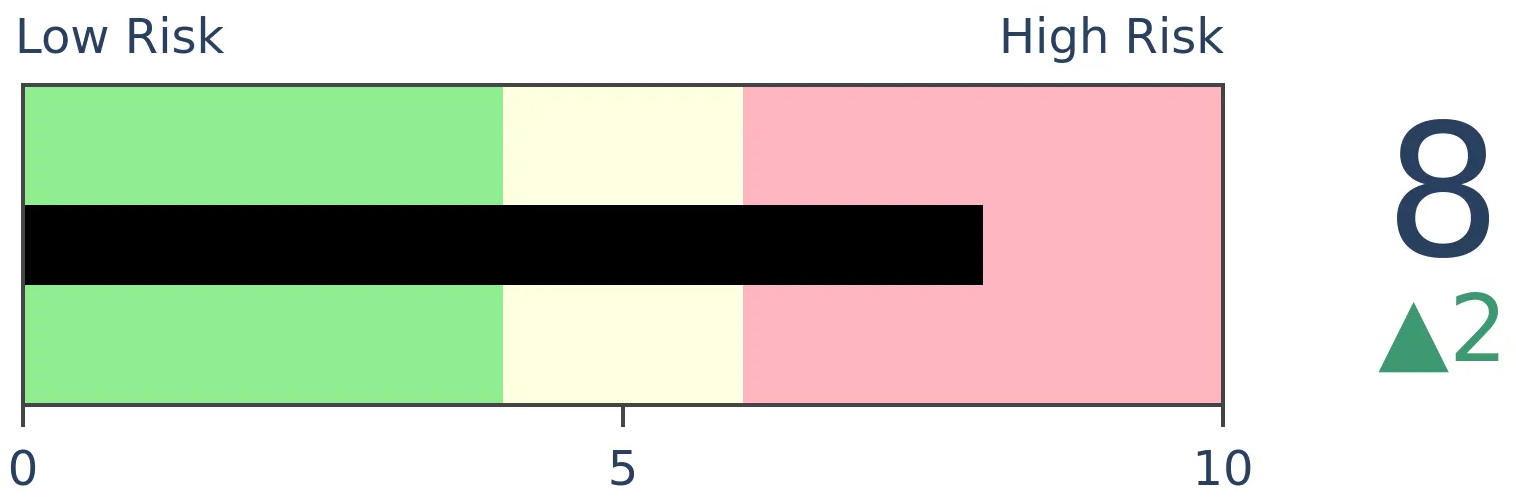
Bonds
|
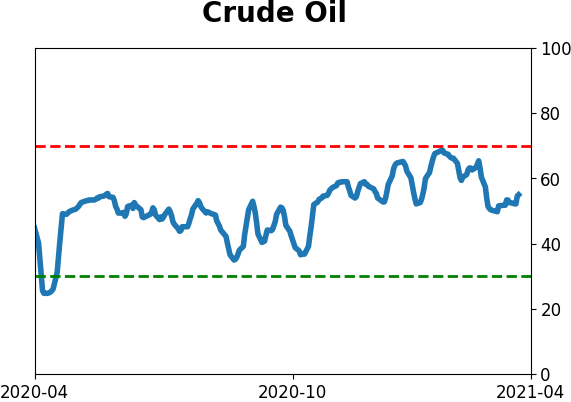
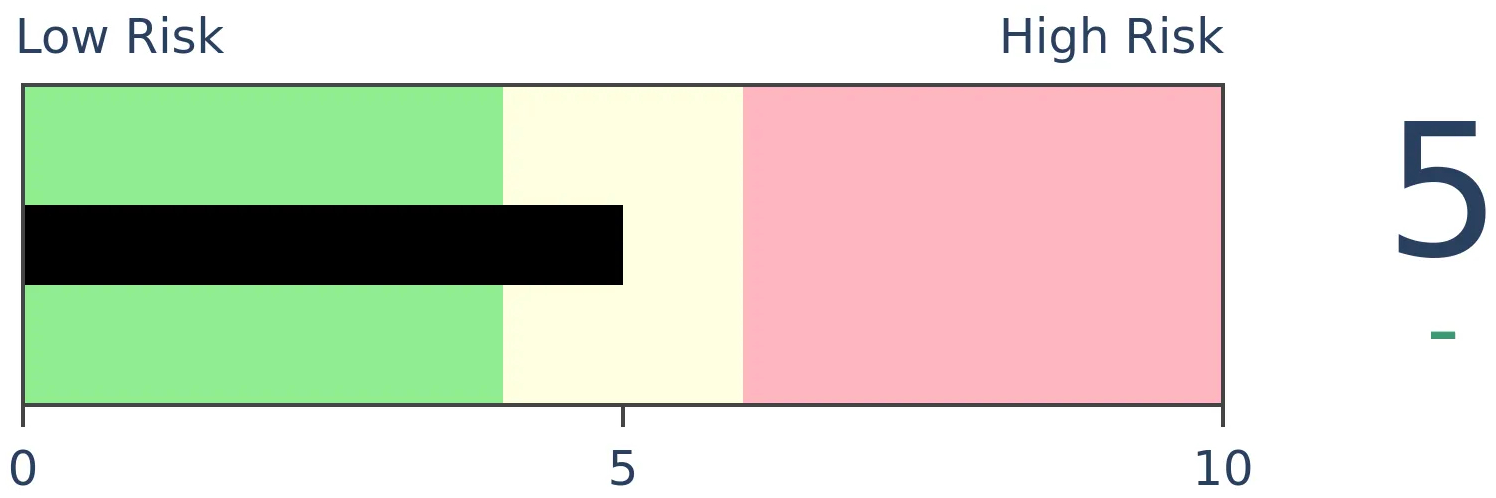
Crude Oil
|
|
Gold
|
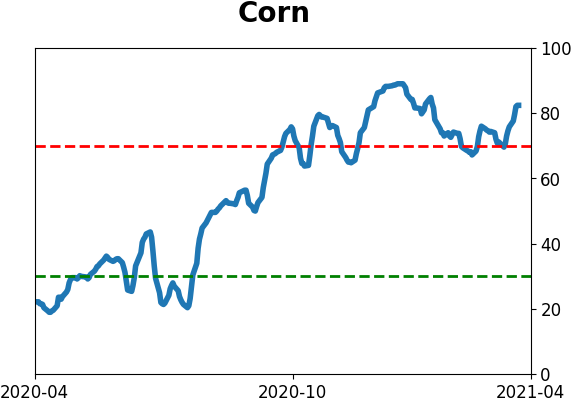
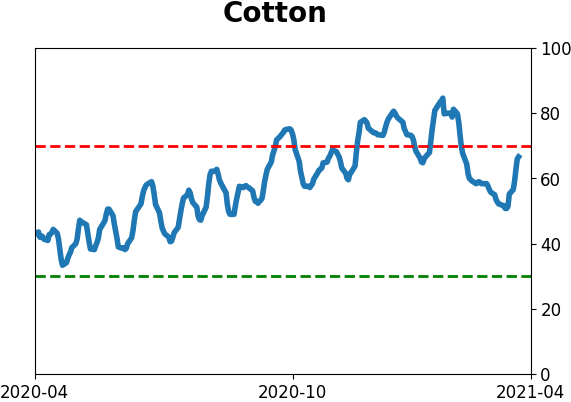
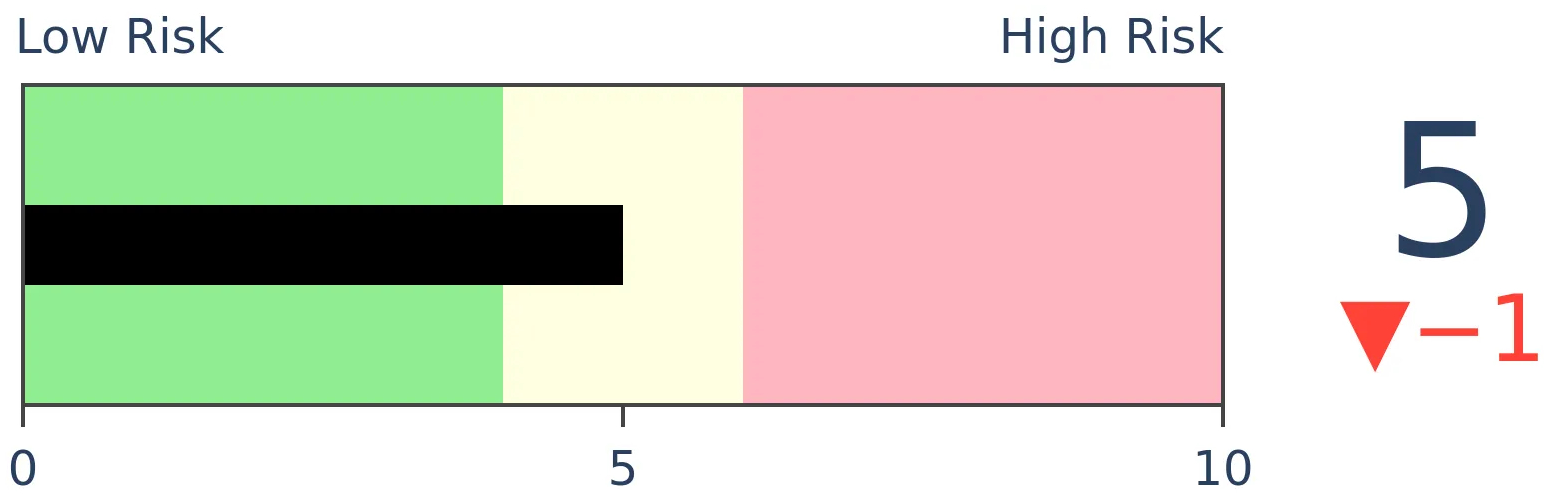
Agriculture

|
|
Research
BOTTOM LINE
Thanks to a remarkable run in stocks, more indicators have registered extremes, with a near-record growth in margin debt, record assets in leveraged ETFs, and heavy speculative options activity, while insiders appear to be selling.
FORECAST / TIMEFRAME
None
|
It hardly seems effective to outline yet more extremes in sentiment. We've noted them repeatedly since January and yet here we are at new highs.
Momentum has been everything, with massive thrusts across industries and even global indexes. And we're still not seeing any major risk warnings due to persistent internal weakness.
So at the risk of tilting at even more windmills, I'd like to at least touch on a few extremes because it's either something we've noted before or because it's just remarkable.
A month ago, we estimated that margin debt would rise enough in March to push its year-over-year change to 73%. It didn't quite pan out that way, as the growth ended up being "only" 72%.
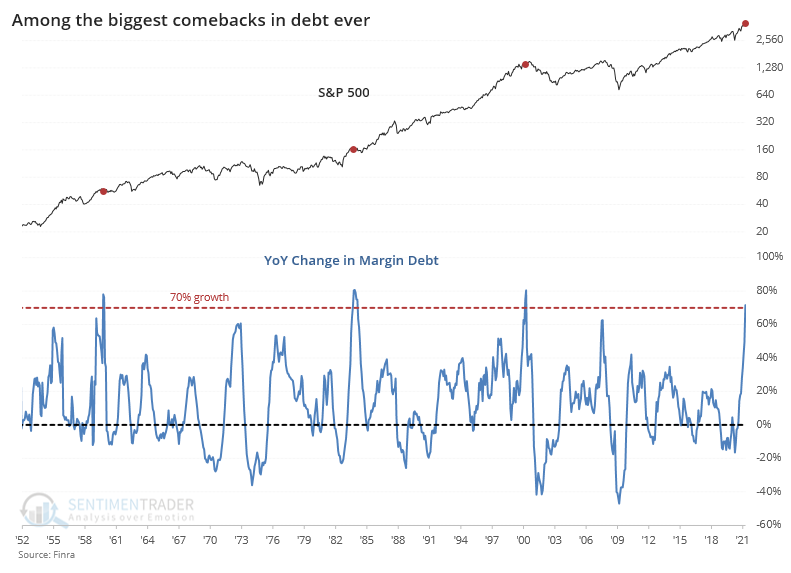
This is the 2nd-highest rate of growth in 35 years, though as noted before, relative to the growth in the S&P 500, it's been hovering around 20%, which isn't as extreme as 2000 or 2007.
All of this optimism has pushed the Risk Appetite Index to one of its highest levels in several years over a 5-day period. This indicator measures market behavior like credit spreads, equity and foreign exchange volatility, gold prices, and sector relative performance (such as between defensive sectors like utilities and economically sensitive sectors like financials).
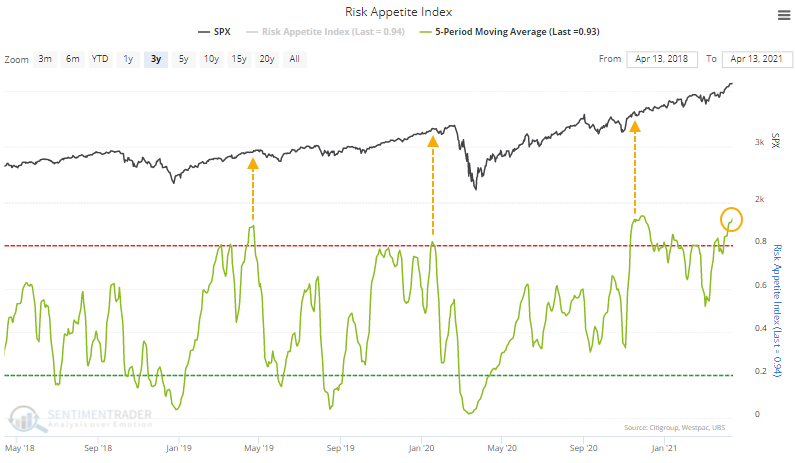
The last time the Risk Appetite Index reached this high of a level, it didn't precede anything nefarious for the S&P, similar to what we saw in 2017. Those reactions tend to be the exceptions.
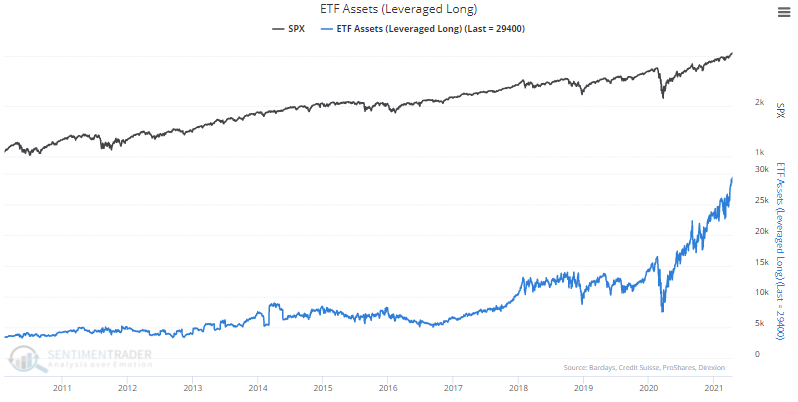
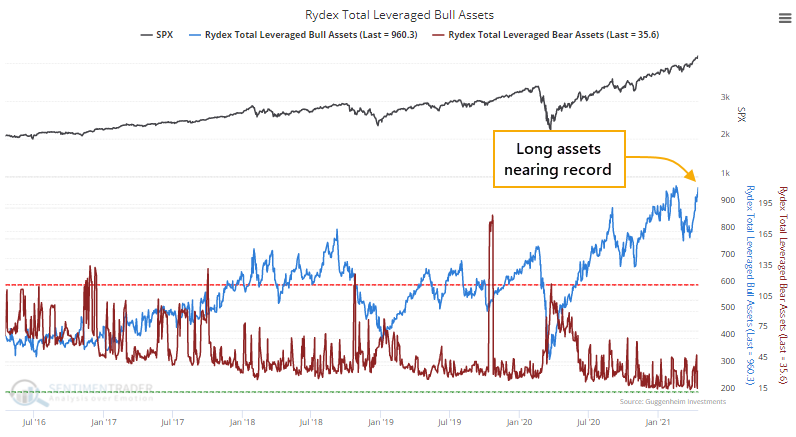
ETF traders are fully embracing this appetite for risk by pushing assets in leveraged long funds to record highs.
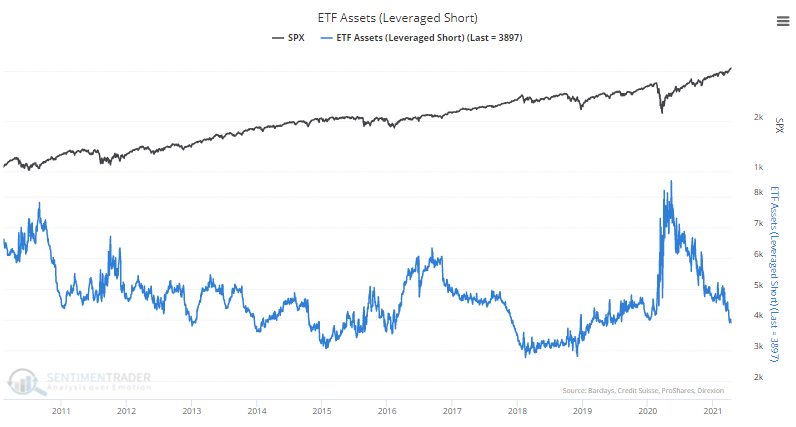
At the same time, they're abandoning leveraged inverse funds (this is a combination of fleeing assets and eroding values).
The same behavior can be seen among market timers using the Rydex family of mutual funds, with leveraged long index fund assets approaching a record high and leveraged inverse assets getting perilously close to zero.
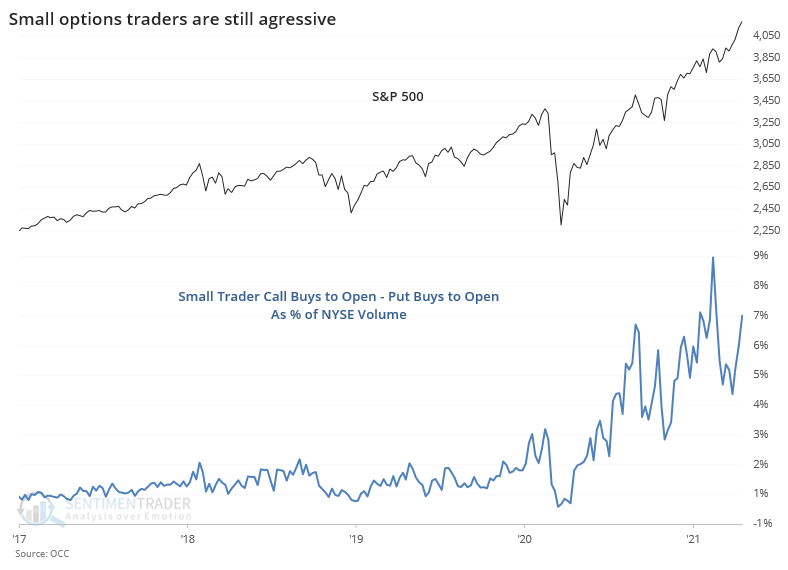
The smallest of options traders, those trading 10 contracts or fewer, have rebounded as a relative influence. The number of speculative call options bought to open, minus protective put options bought to open, is jumping again. This remains 2 to 3 times any other extreme in 20 years, prior to the last year. It's also higher than the euphoric spike from late August 2020 but is still below the highest point from early February of this year.
At the same time that investors are feeling so euphoric, corporate insiders appear to be selling. A weekly ratio of insider sales to buys as computed by Thomson Reuters skyrocketed to an astounding 143-to-1, the highest in the weekly readings as reported by Barron's in at least 16 years.
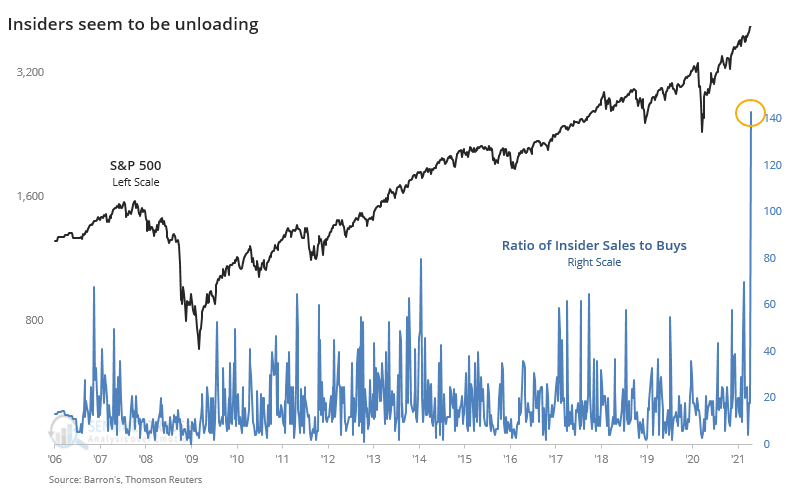
Maybe the latest week's reading is being skewed by particularly small volumes thanks to the quiet periods surrounding Q1 earnings announcements. It's so extreme that it almost seems like a data error, though other data seems to confirm low interest among insiders, even if not as extreme.
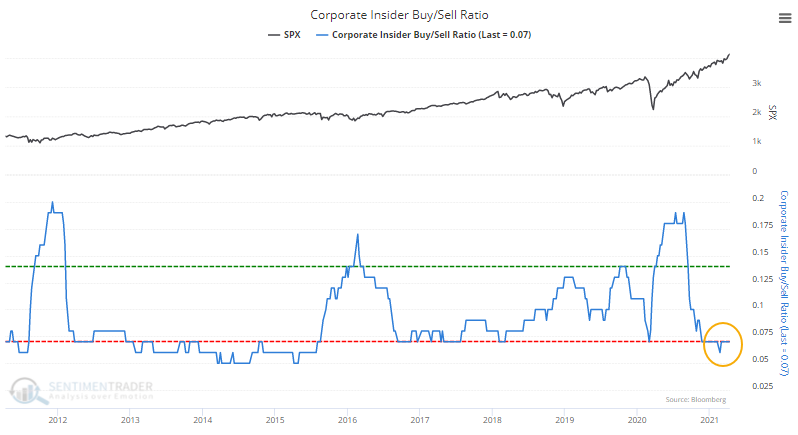
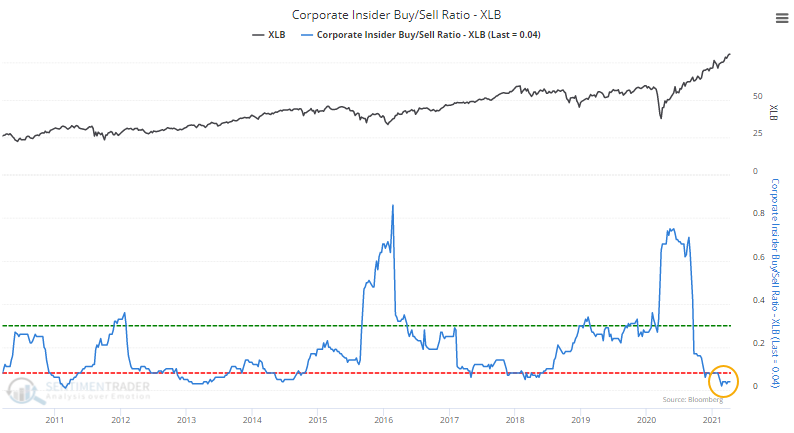
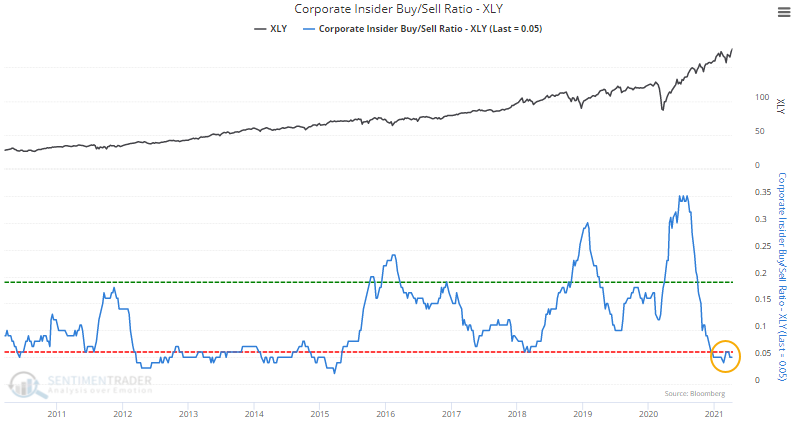
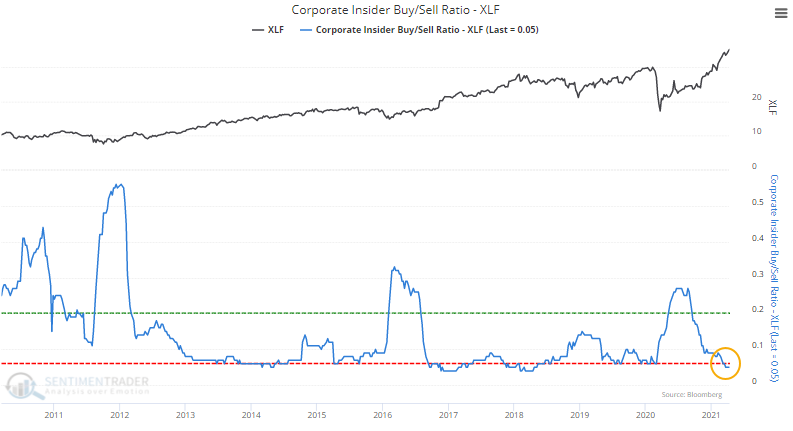
The Corporate Insider Buy/Sell Ratio remains near a decade low. While spikes in insider buying vs. selling is a much more consistent buy signal for stocks than a drop is as a sell signal, it would be better to see this at least in neutral territory.
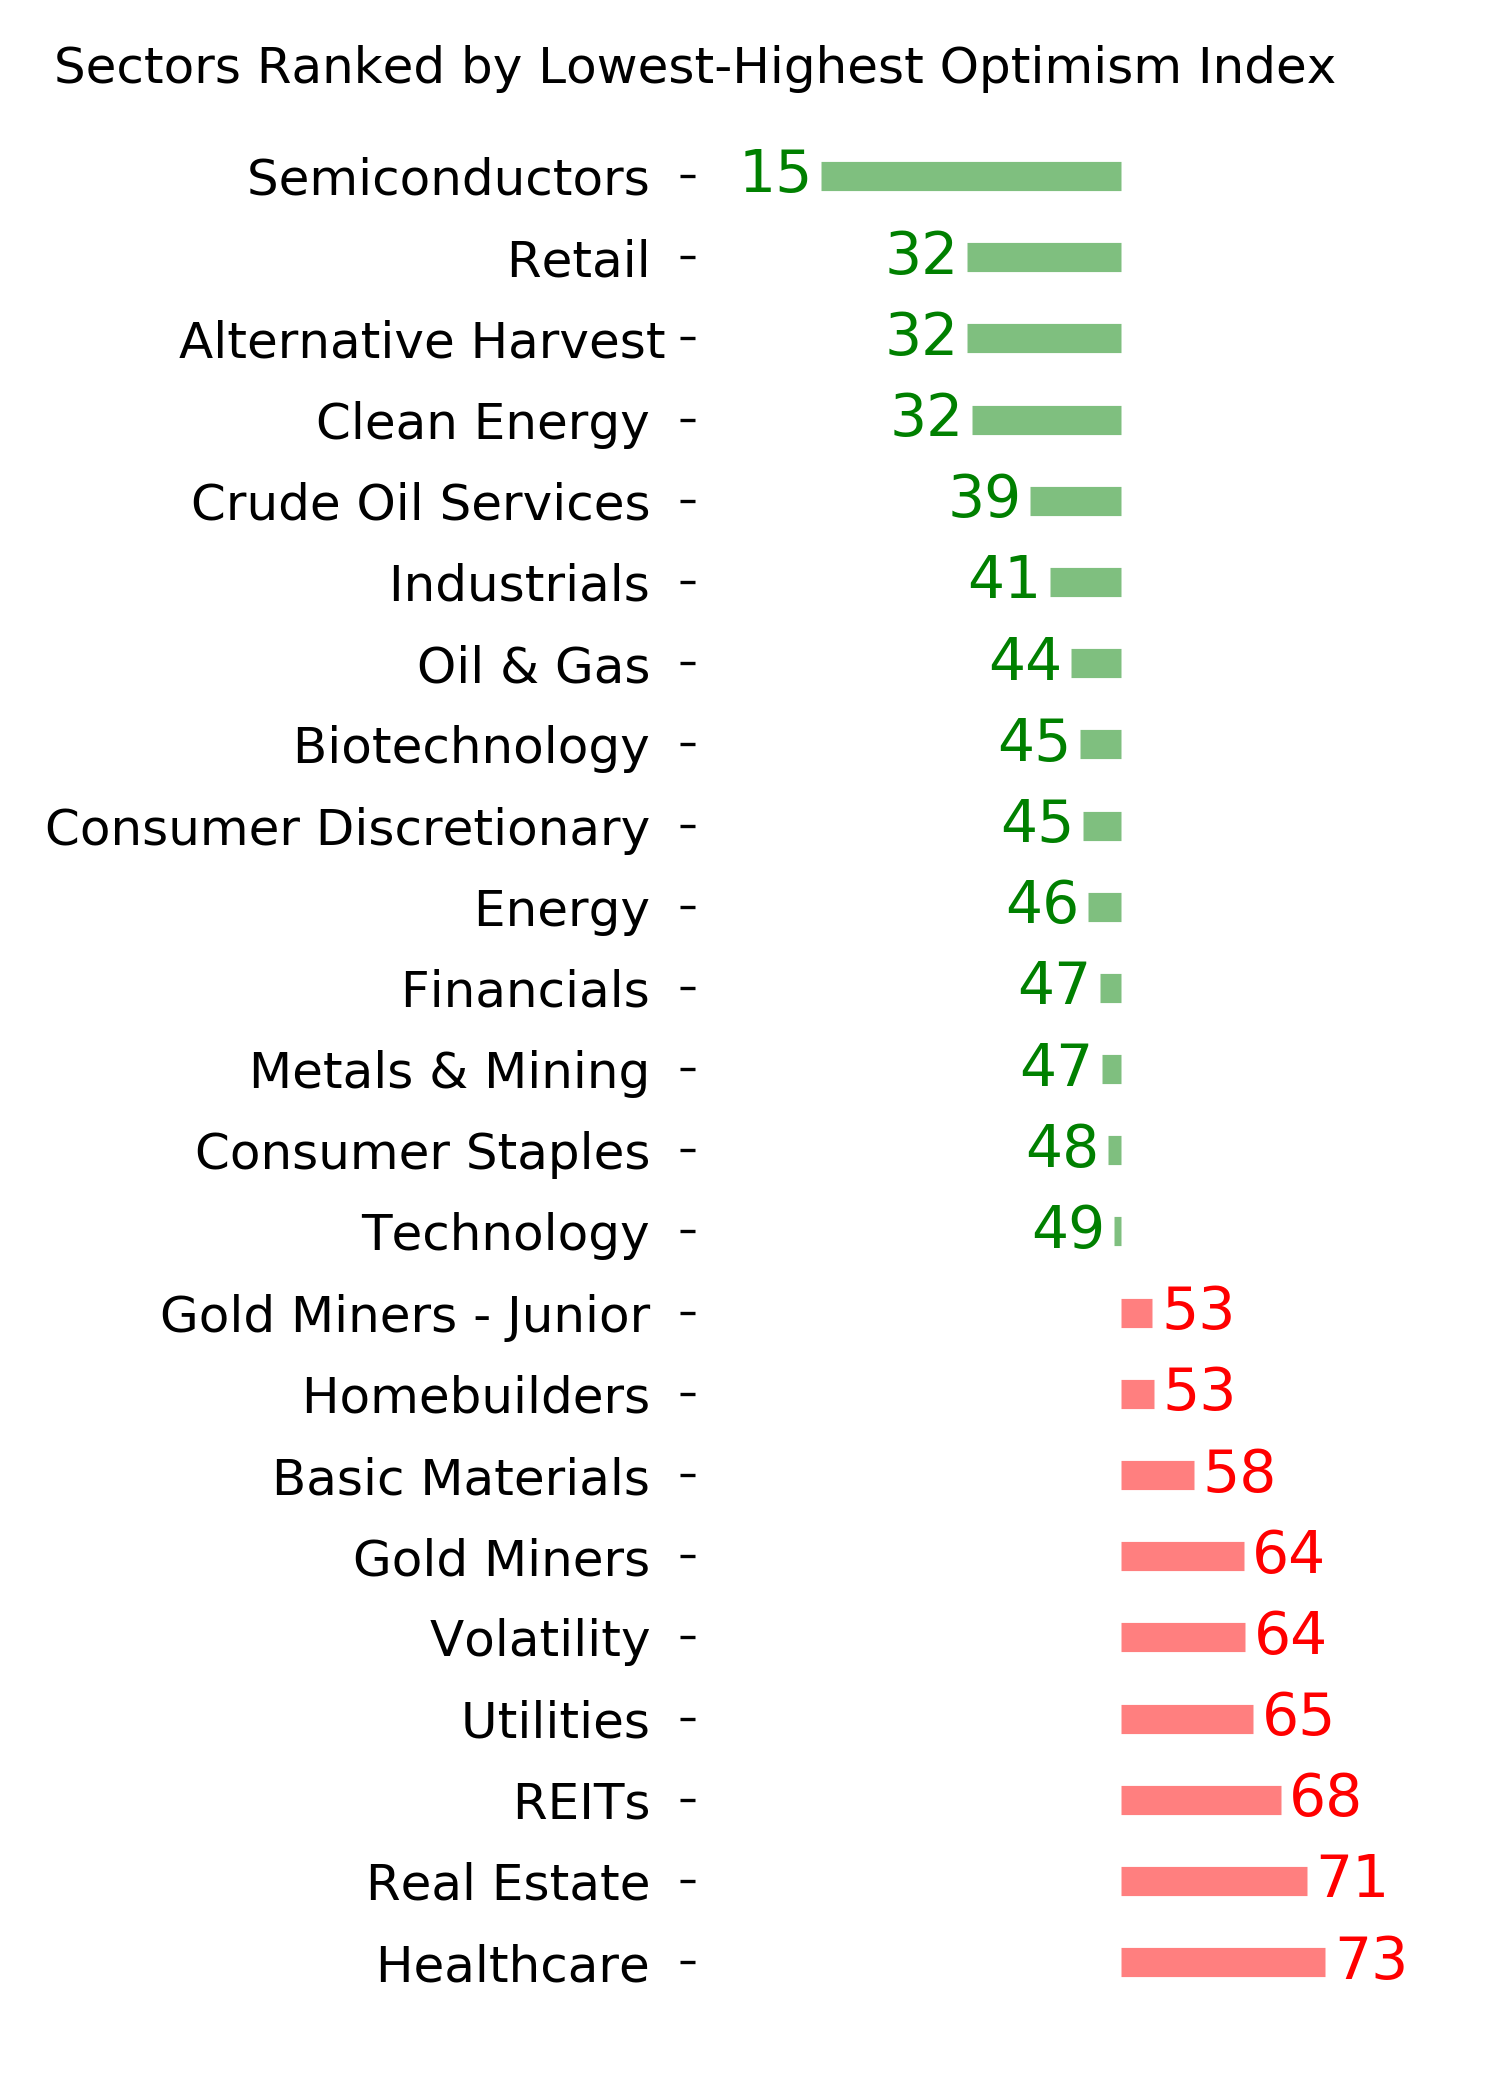
Among sectors, insiders have shown the least interest in adding to positions in Materials, Discretionary, and Financials.
We continue to see a type of tension that hasn't really happened before. Many of the measures related to thrusts, momentum, and breadth, are the types that only trigger during the initial phase of a multi-year bear market recovery. But most of the sentiment-related measures have generated signals that typically only trigger near the ends of multi-year bull markets.
A typical market response to lesser conflicts has been choppy conditions in major indexes, with further gains eventually given back. That's been the outlook for a while and seems like it's continuing.
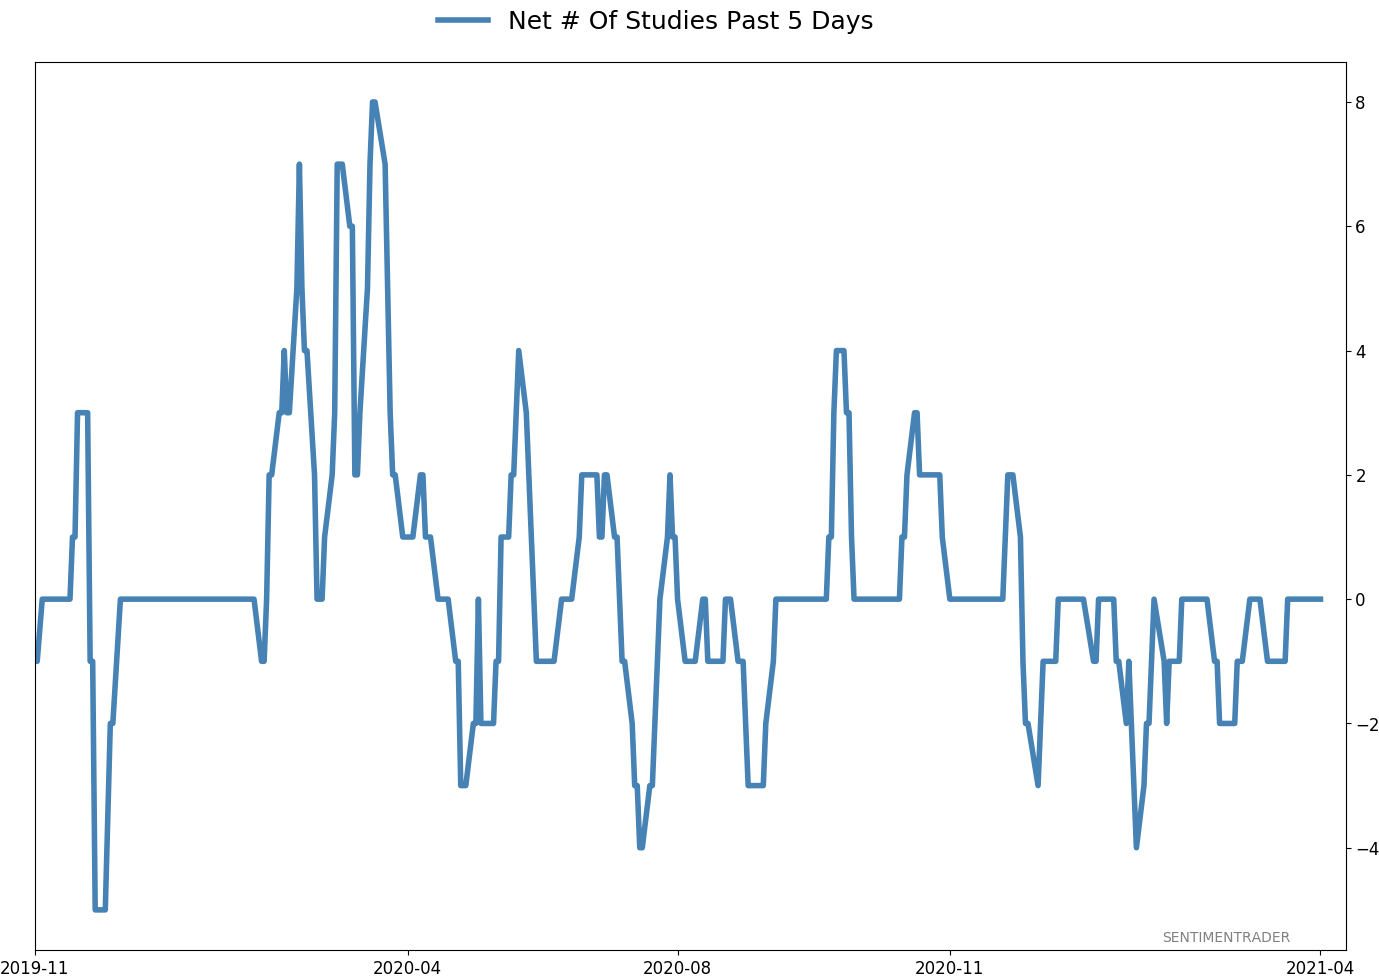
Active Studies
| Time Frame | Bullish | Bearish | | Short-Term | 0 | 0 | | Medium-Term | 0 | 10 | | Long-Term | 11 | 4 |
|
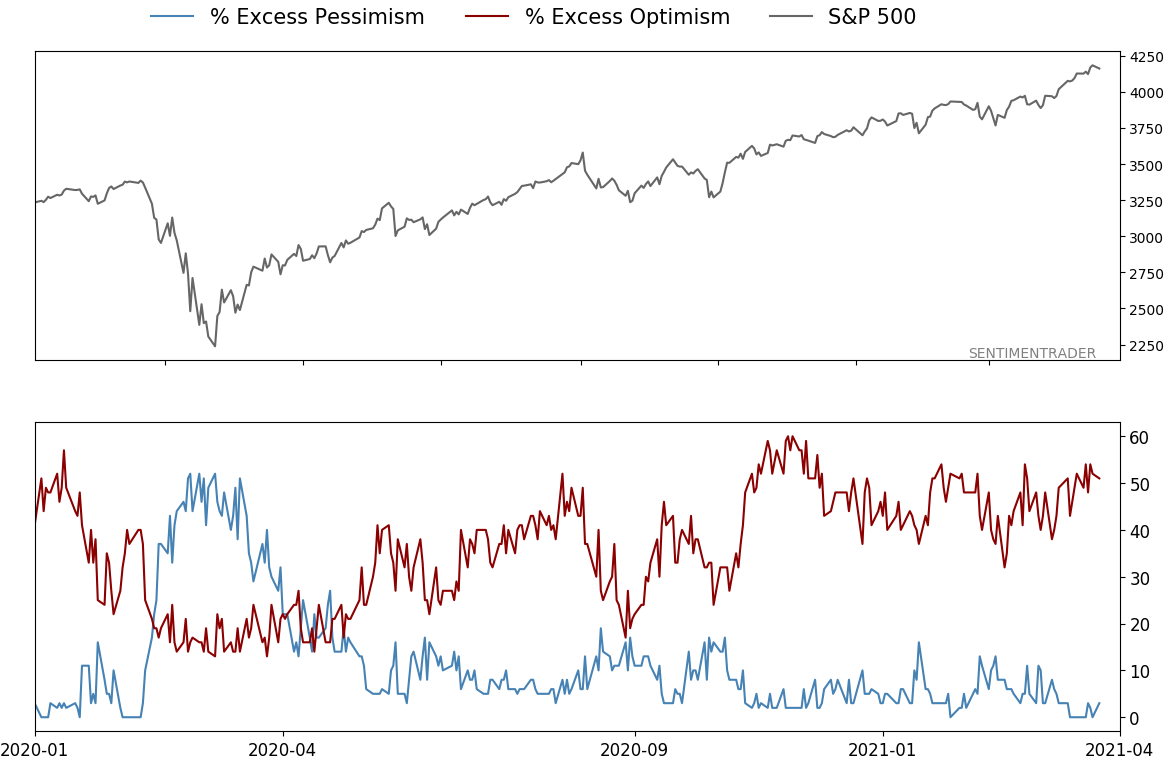
Indicators at Extremes
|
% Showing Pessimism: 3%
Bullish for Stocks
|
|
Portfolio
| Position | Description | Weight % | Added / Reduced | Date | | Stocks | RSP | 4.9 | Reduced 4% | 2021-02-09 | | Bonds | 30.0% BND, 8.8% SCHP | 38.8 | Added 15.1% | 2021-02-18 | | Commodities | GCC | 2.3 | Reduced 2.1%
| 2020-09-04 | | Precious Metals | GDX | 9.0 | Added 0.1% | 2021-02-18 | | Special Situations | 7.3% XLE, 4.8% PSCE | 12.1 | Reduced 5.6% | 2021-02-18 | | Cash | | 32.8 | | |
|
Updates (Changes made today are underlined)
With a market that has seen the kinds of broad participation and big breath thrusts like we did in the fall, it's hard to become too negative. Those kinds of conditions have consistently preceded higher returns over the next 6-12 months. It's the interim that's more of an issue. Even conditions like that haven't prevented some shorter-term pullbacks. And when we combine an environment where speculation is rampant and recent days have seen an increase in cracks under the surface of the indexes, it's enough to become more defensive over a short- to medium-term time frame. We still don't have much confirmation from the price action in the indexes, so those who are more conservative would likely wait before increasing cash levels. I've decreased risk exposure a bit more, mainly in terms of energy stocks and the ANGL fund, while adding more to the broader bond market. RETURN YTD: 7.1% 2020: 8.1%, 2019: 12.6%, 2018: 0.6%, 2017: 3.8%, 2016: 17.1%, 2015: 9.2%, 2014: 14.5%, 2013: 2.2%, 2012: 10.8%, 2011: 16.5%, 2010: 15.3%, 2009: 23.9%, 2008: 16.2%, 2007: 7.8%
|
|
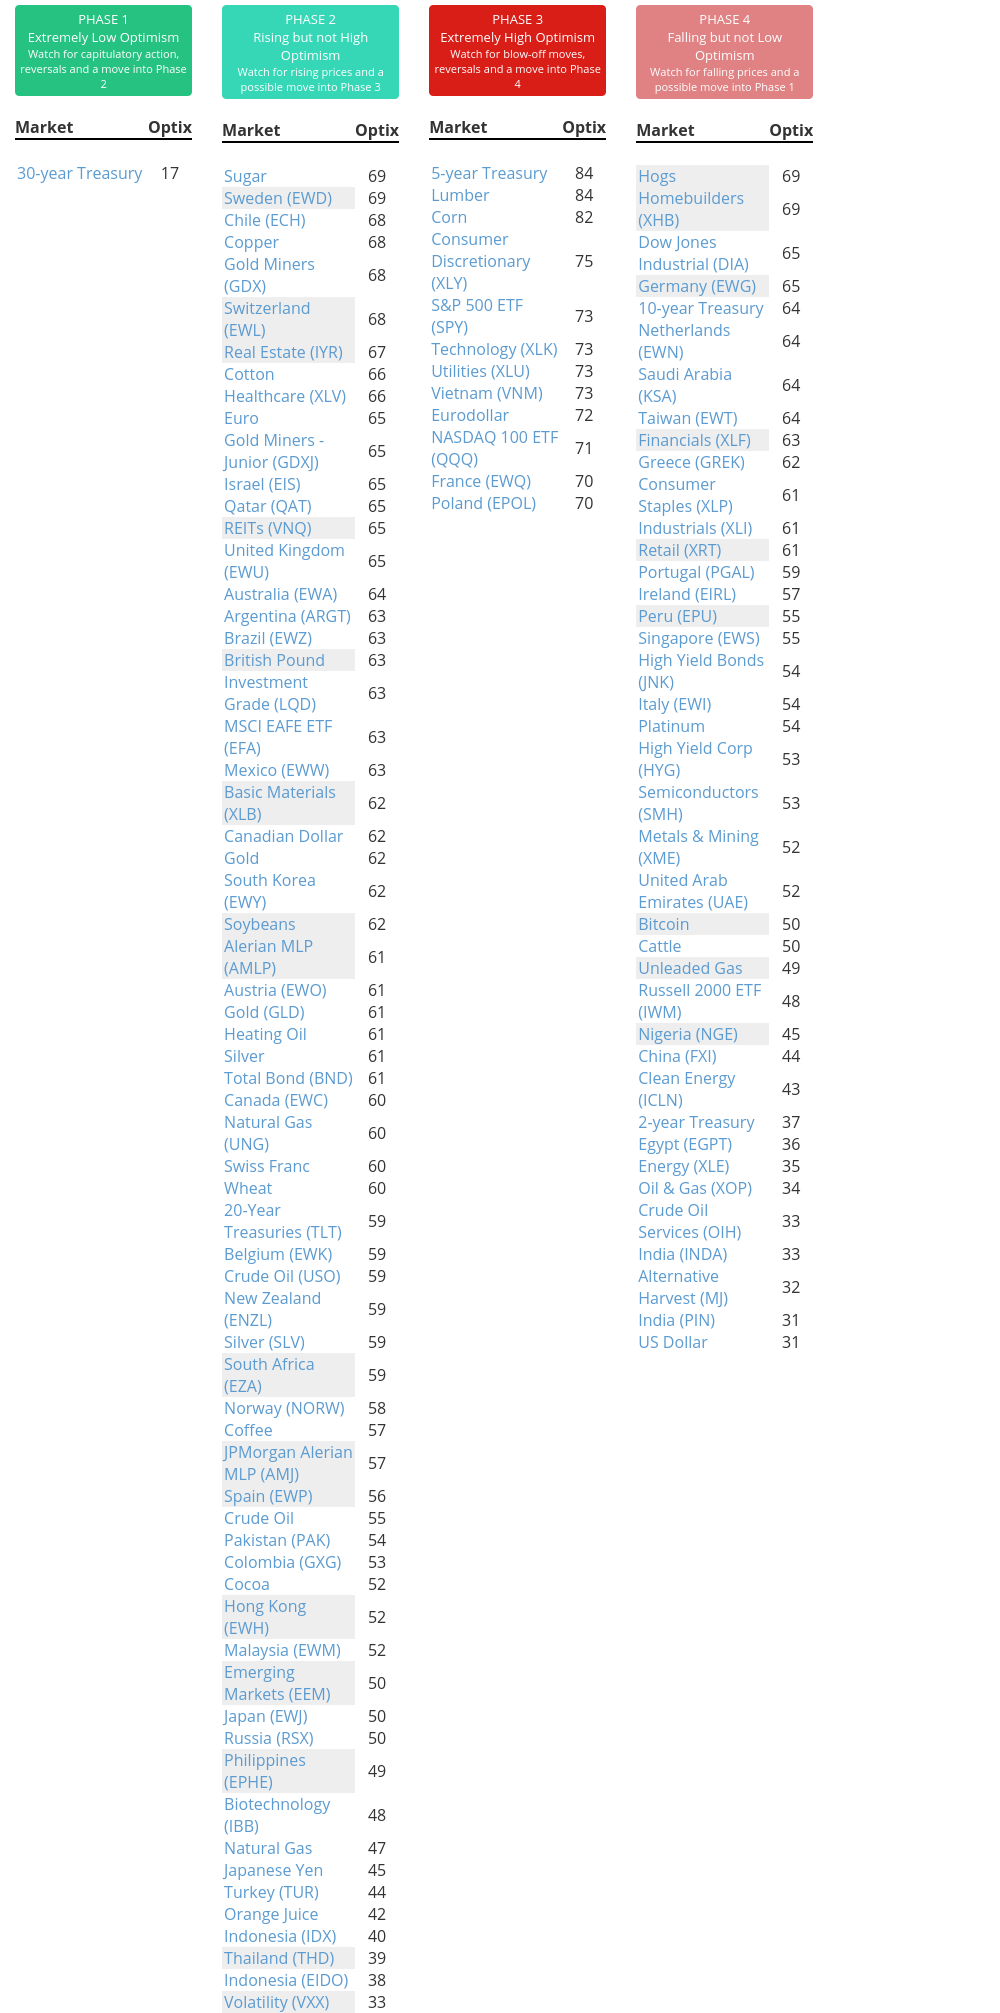
Phase Table
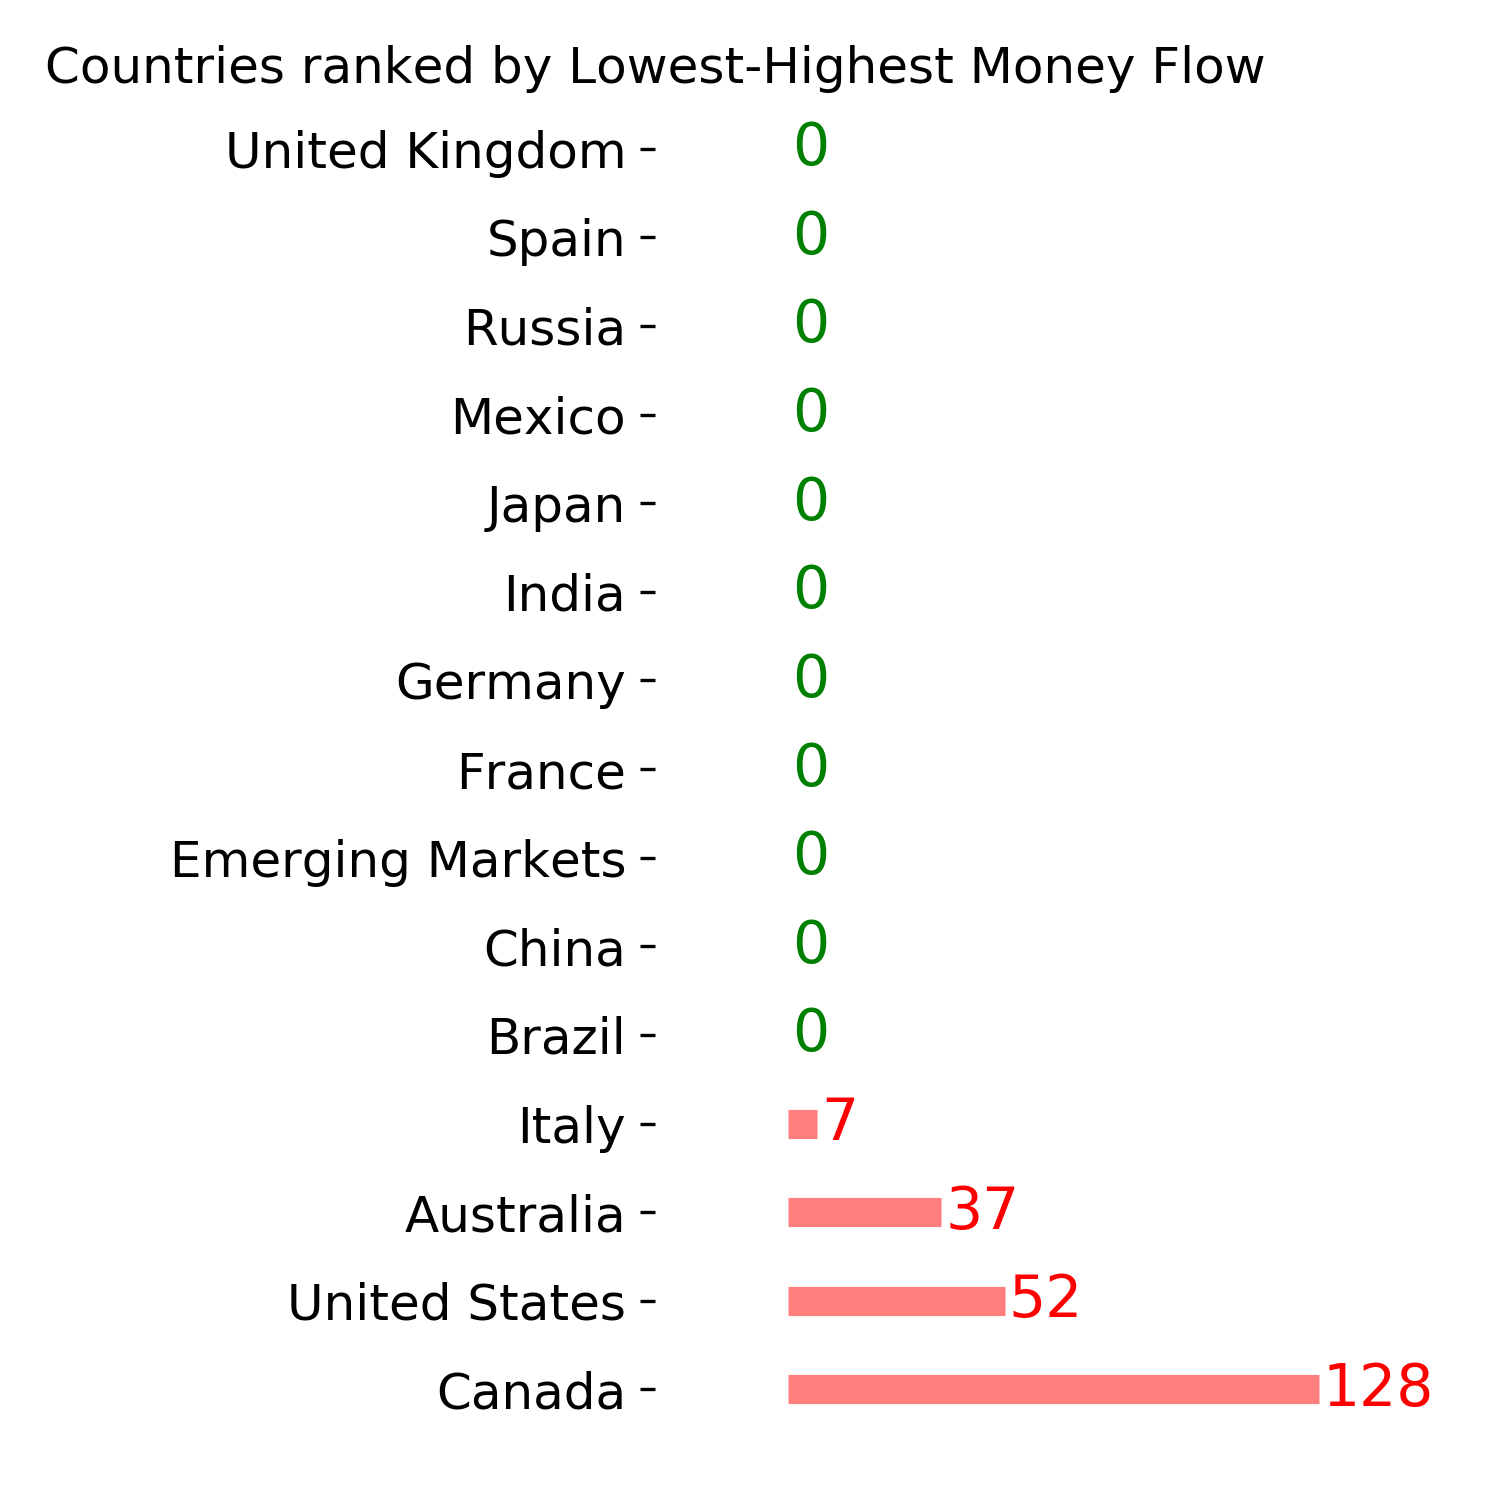
Ranks
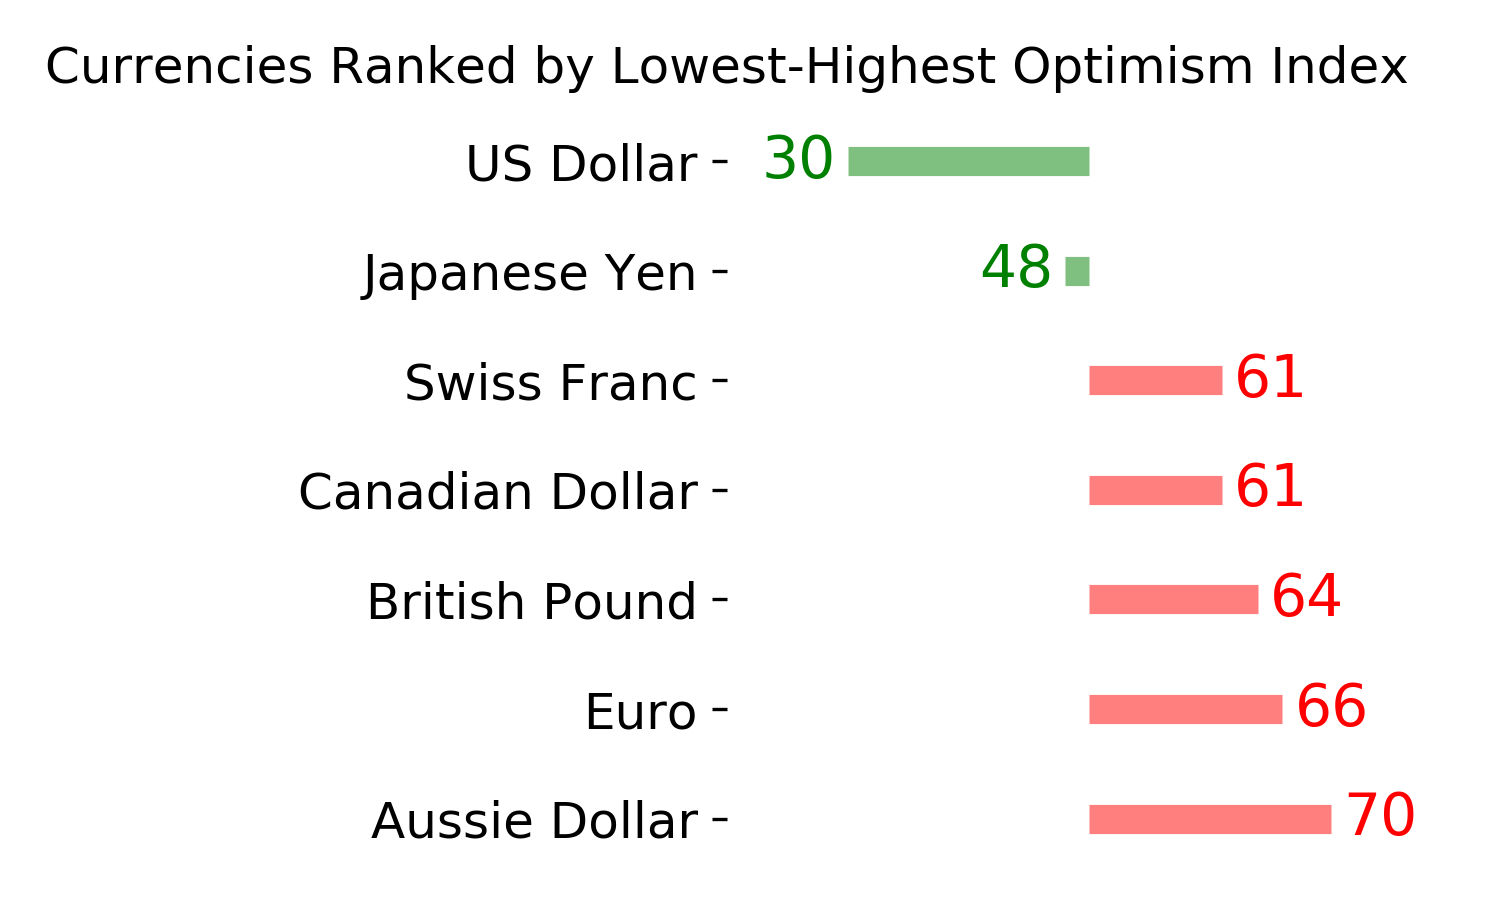
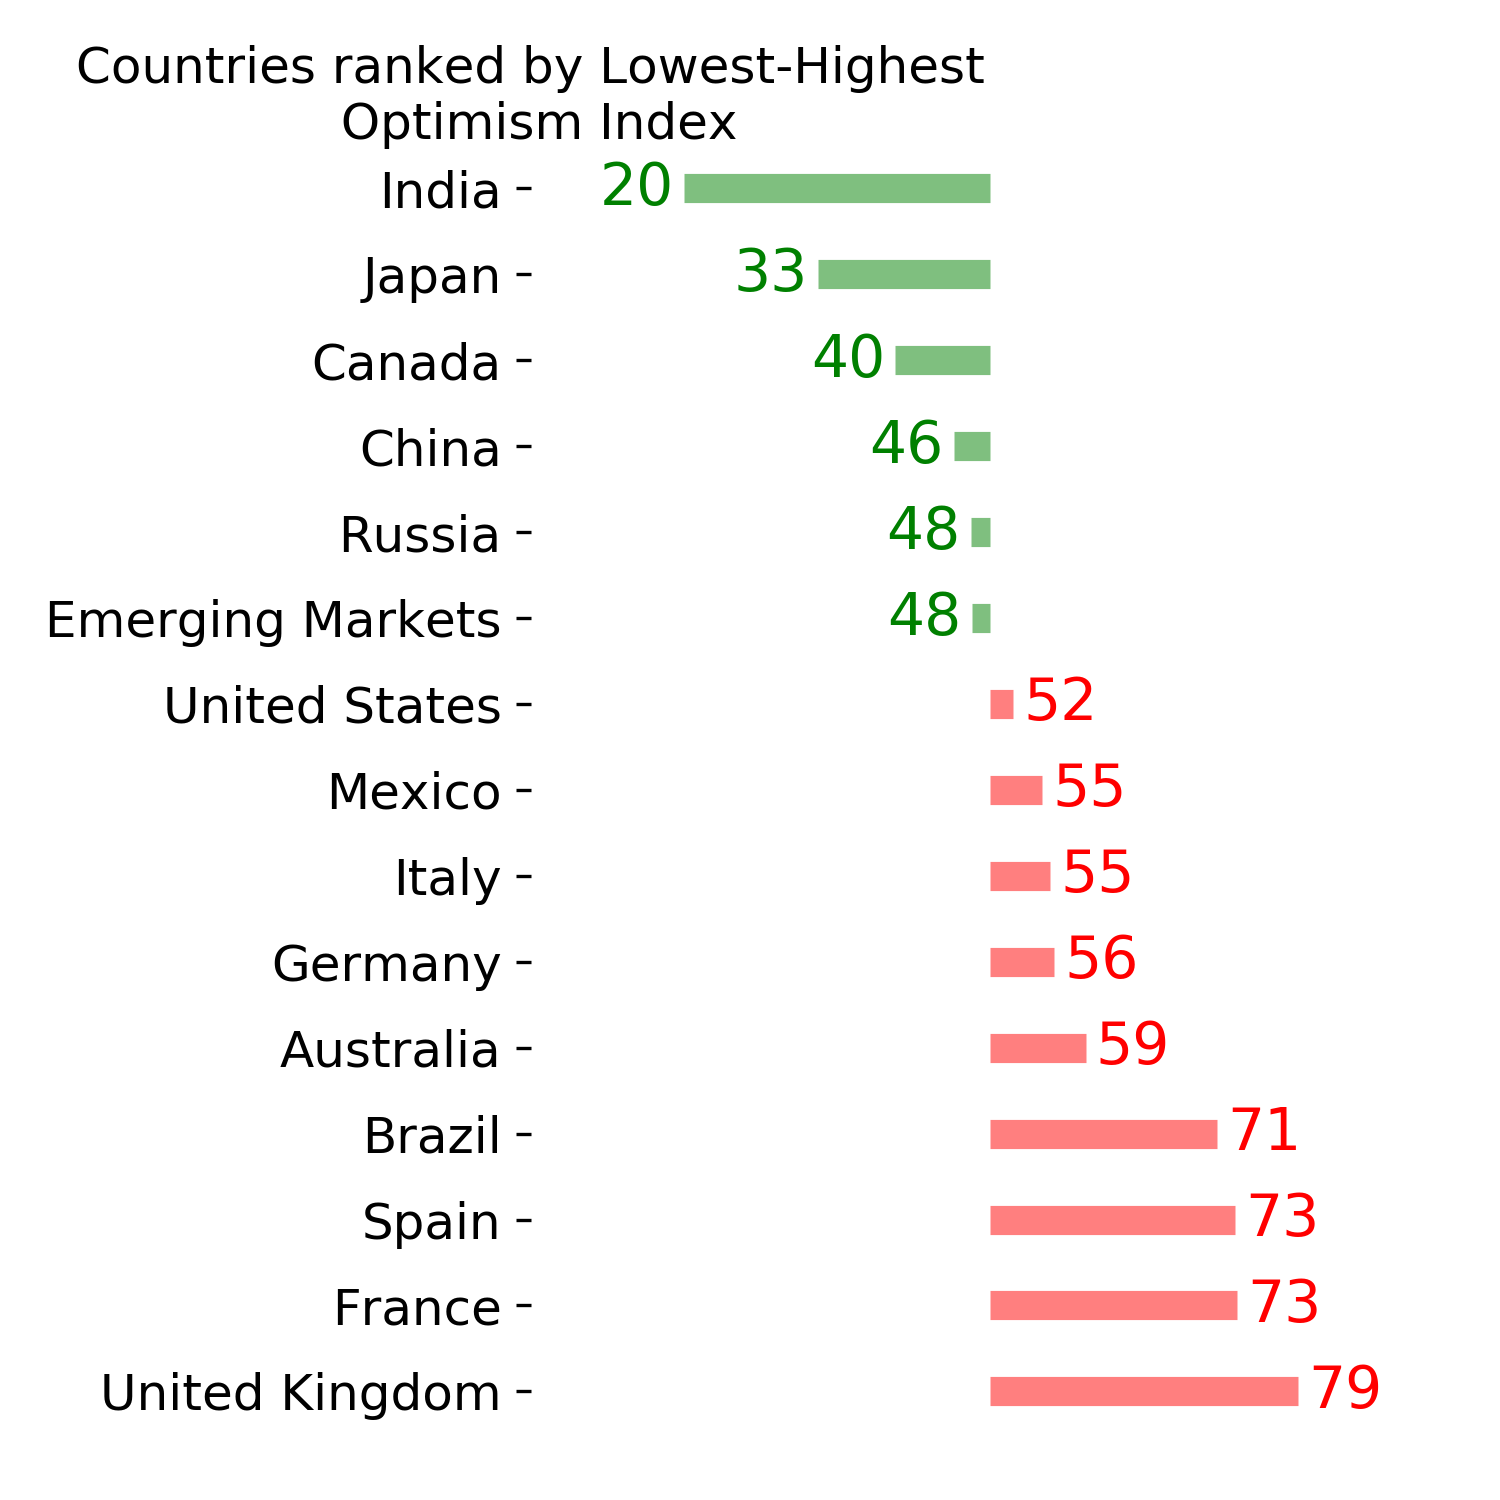
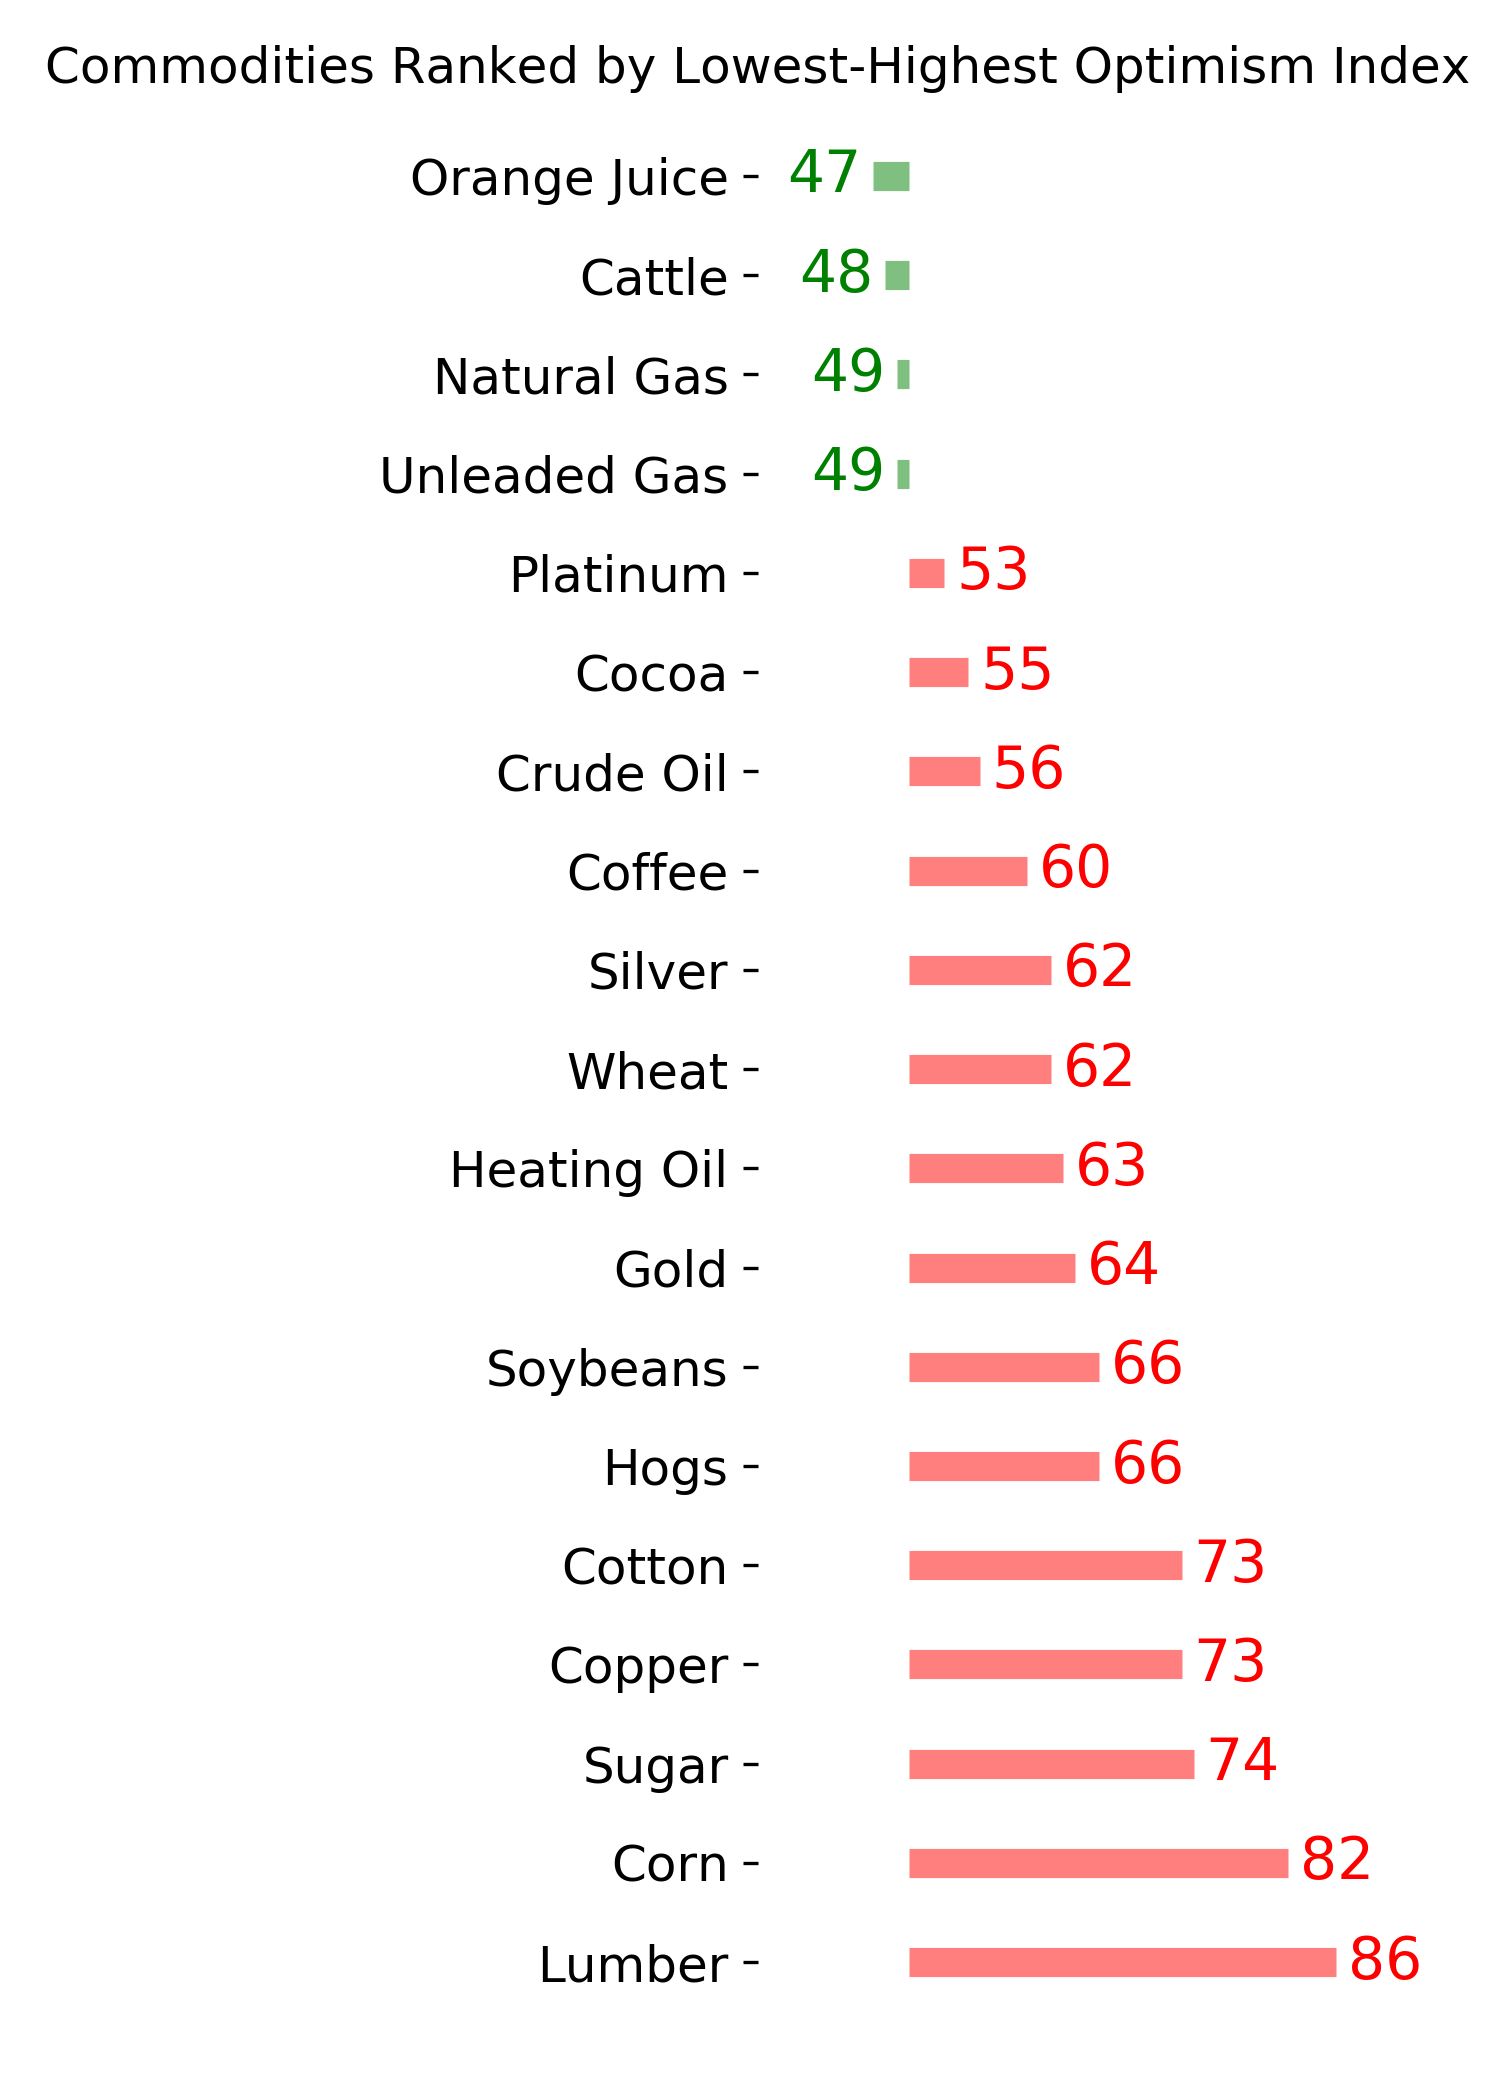
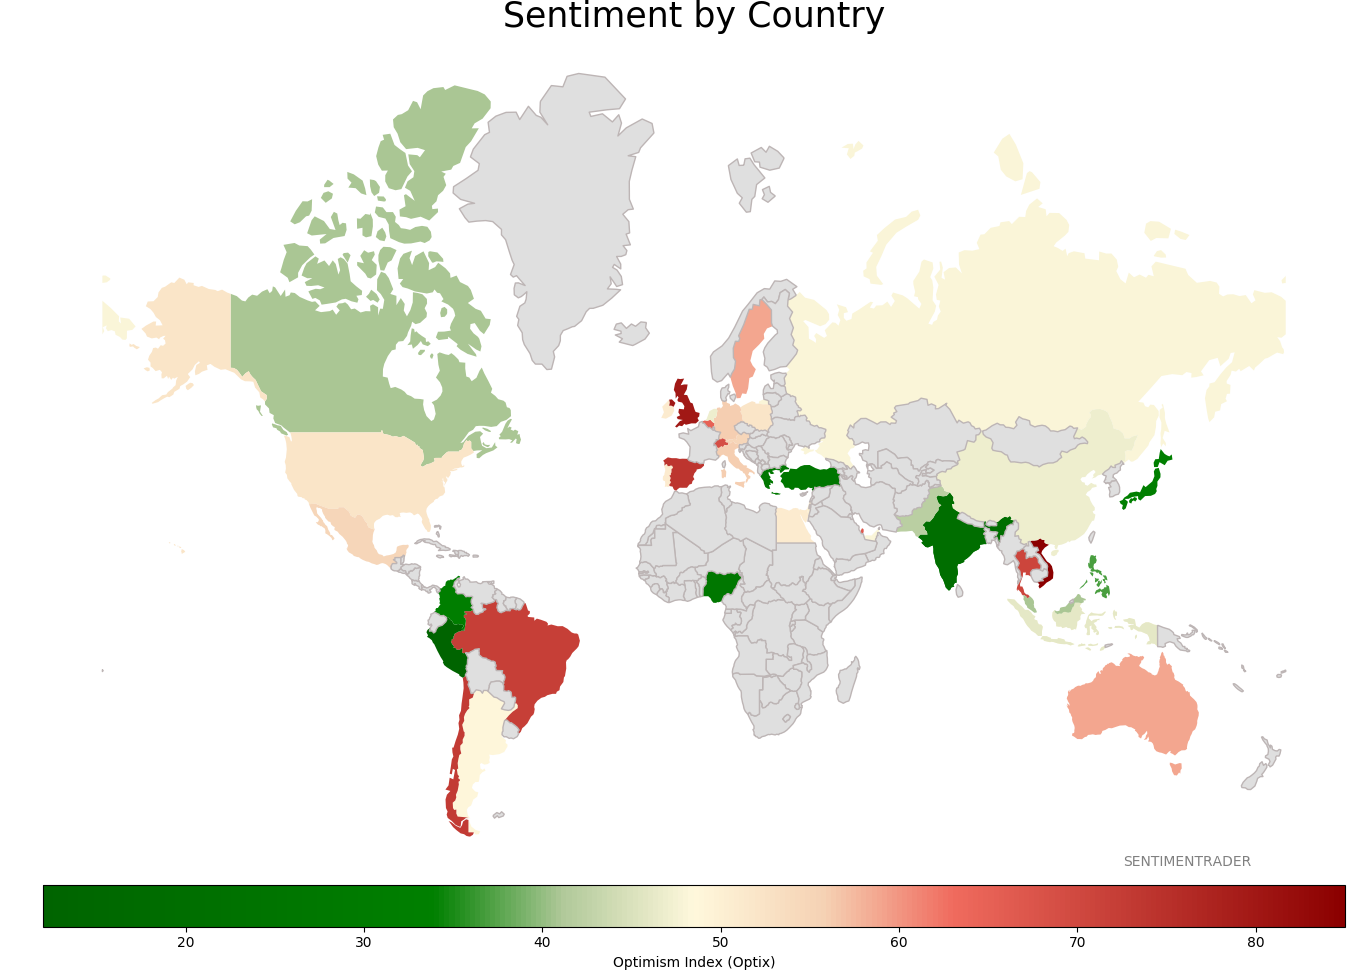
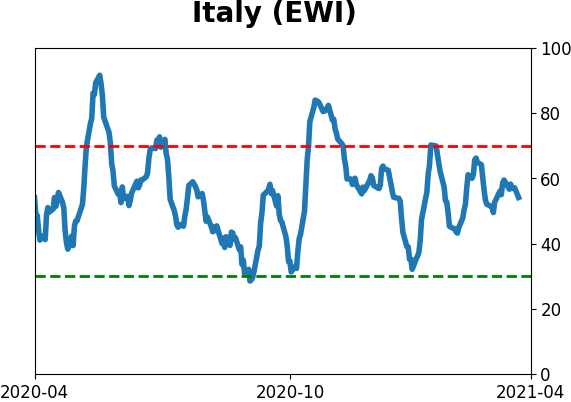
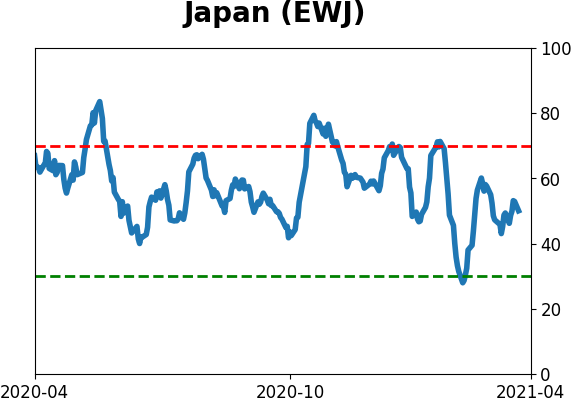
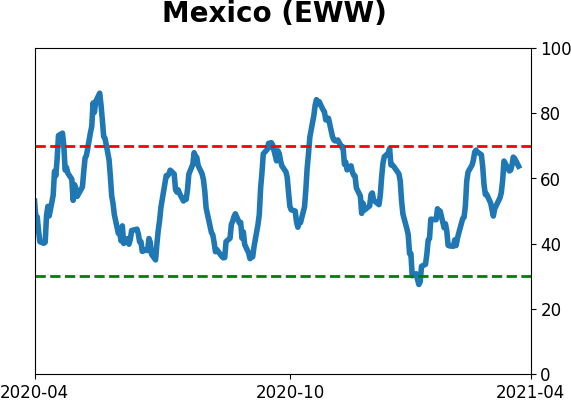
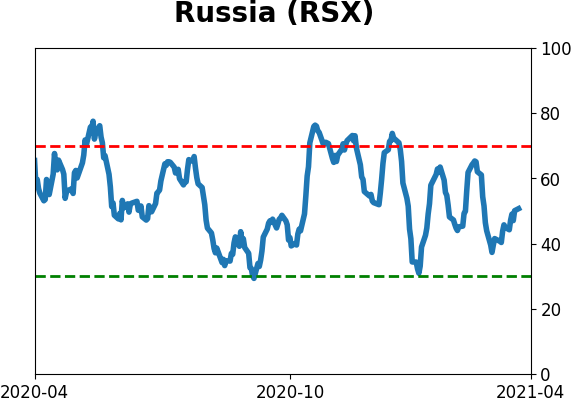
Sentiment Around The World
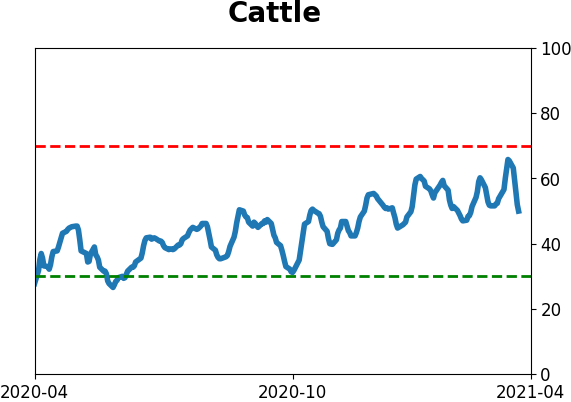
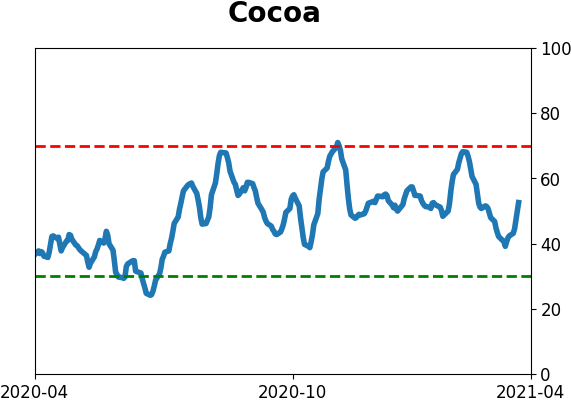
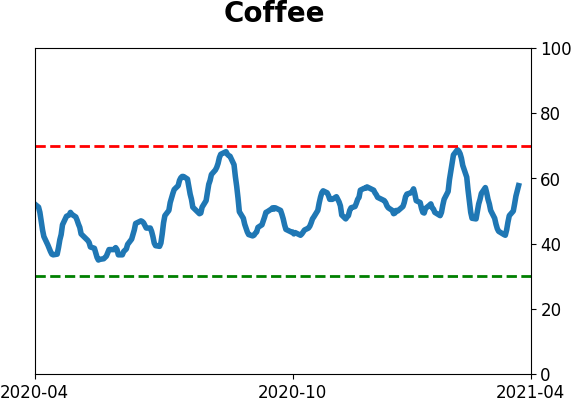
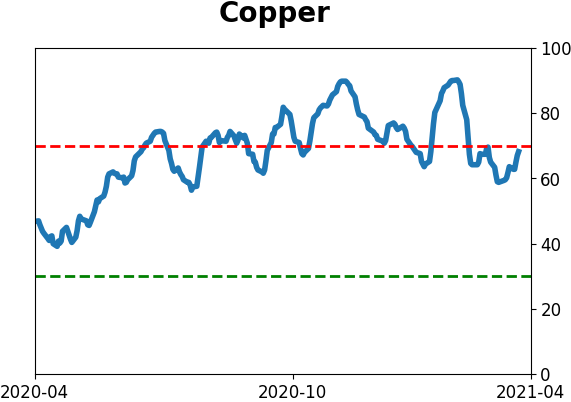
Optimism Index Thumbnails
|
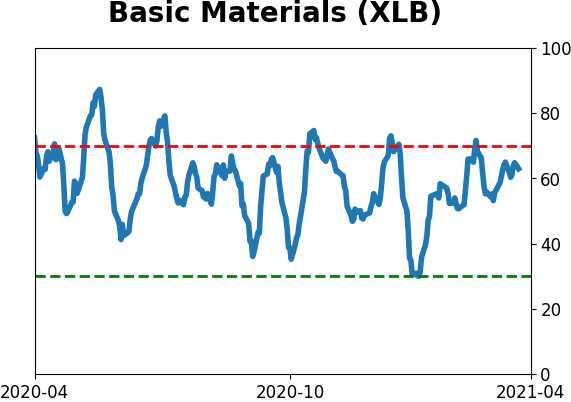
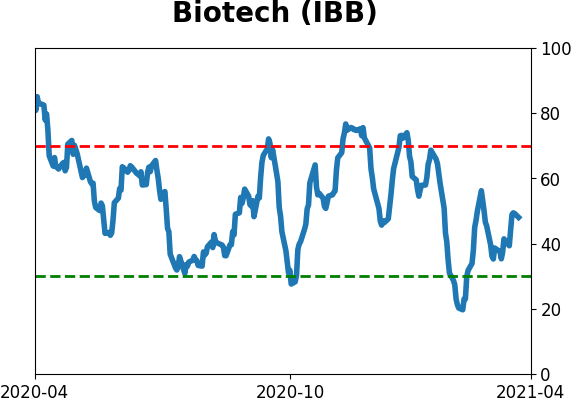
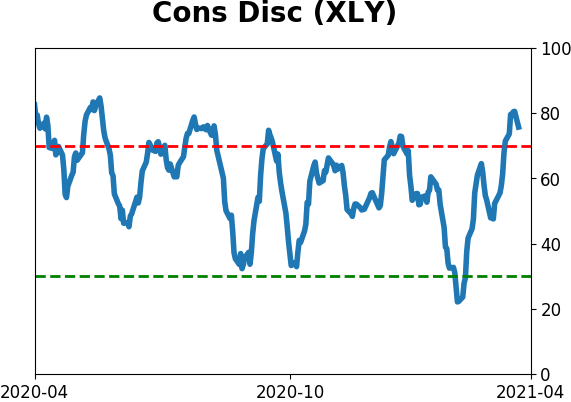
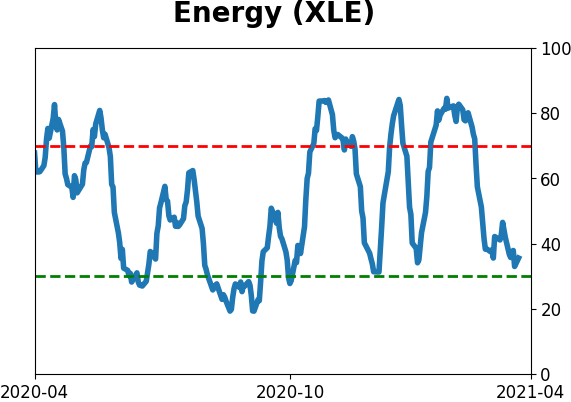
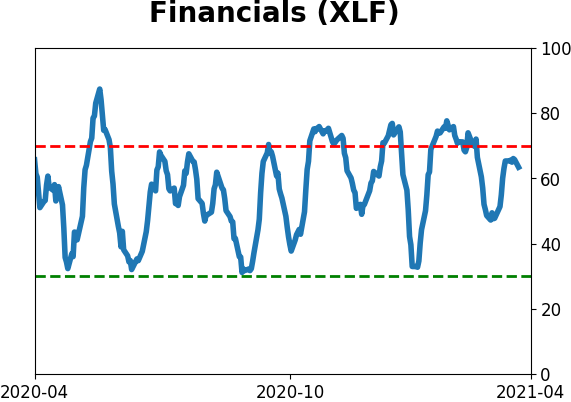
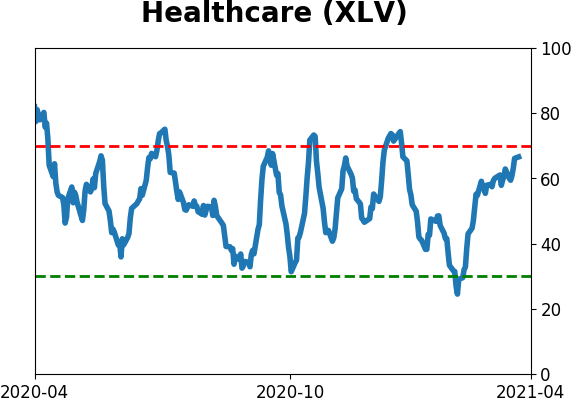
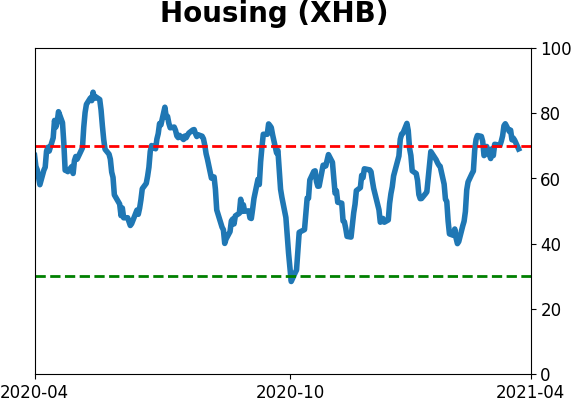
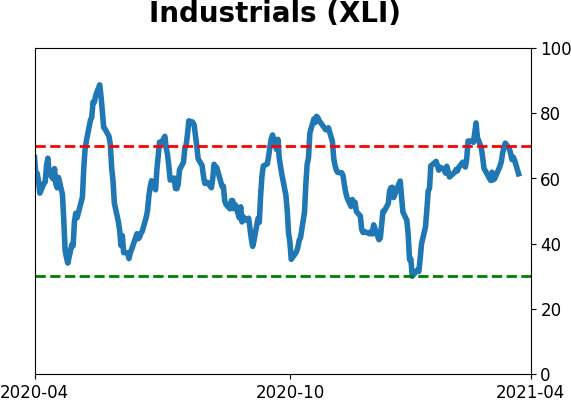
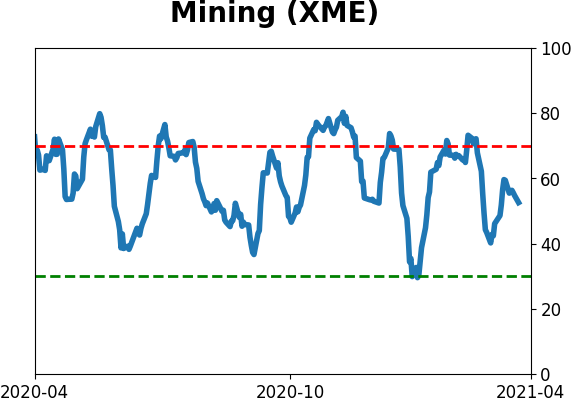
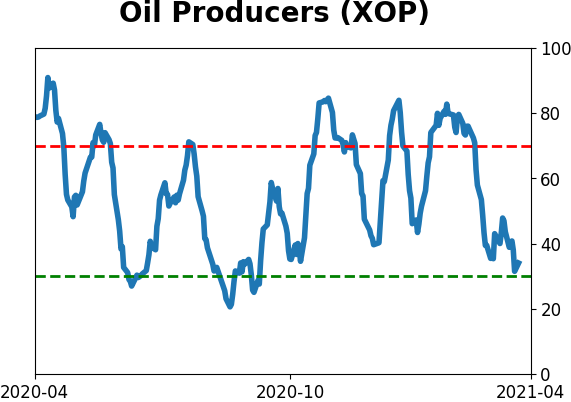
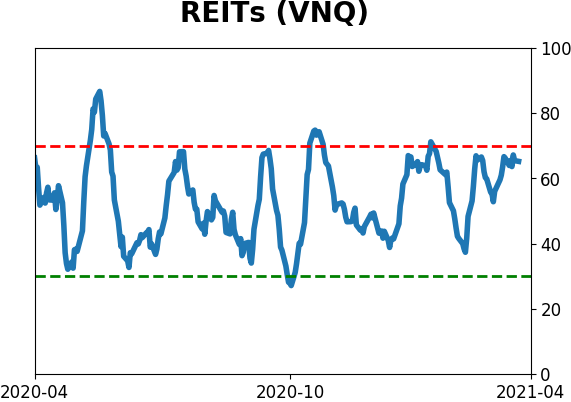
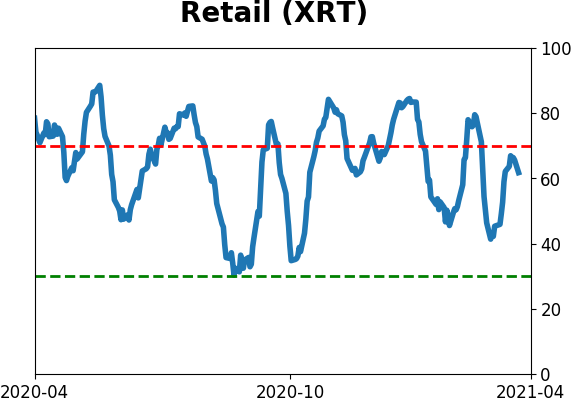
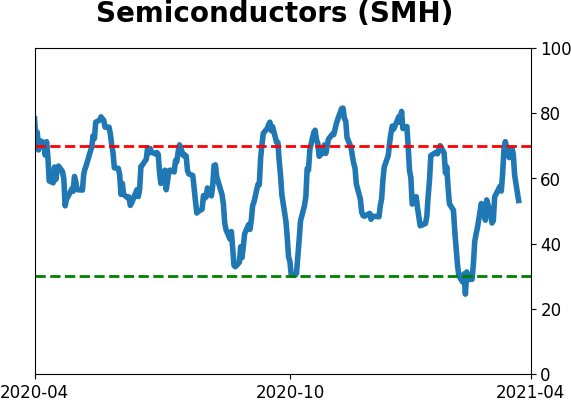
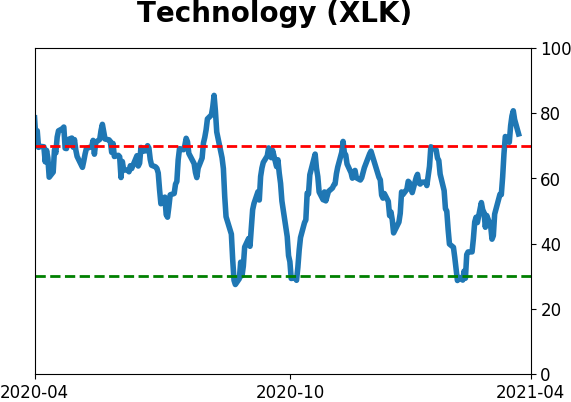
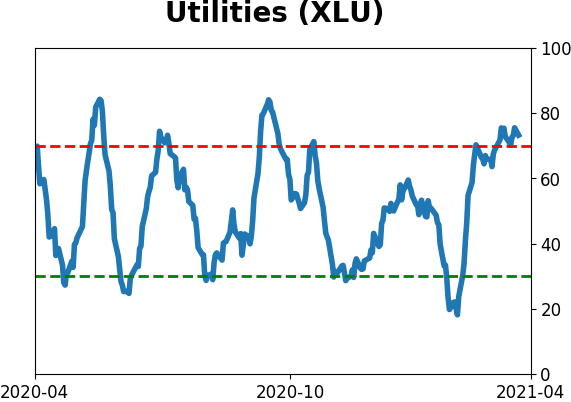
Sector ETF's - 10-Day Moving Average
|
|
|
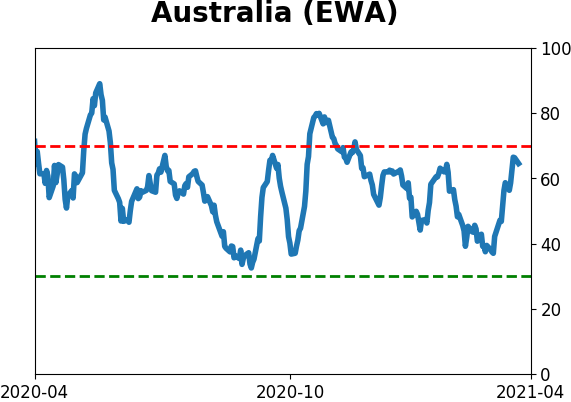
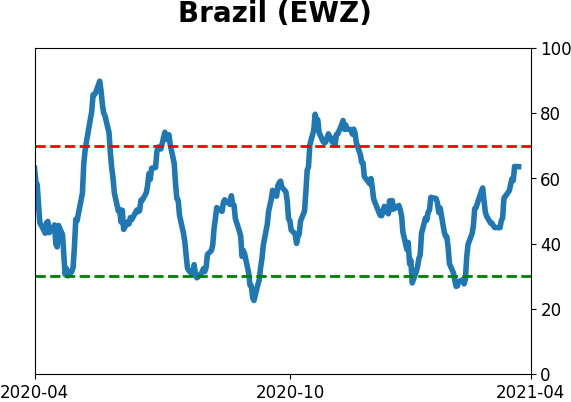
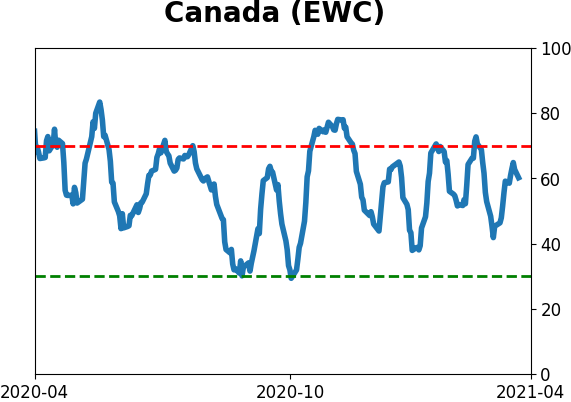
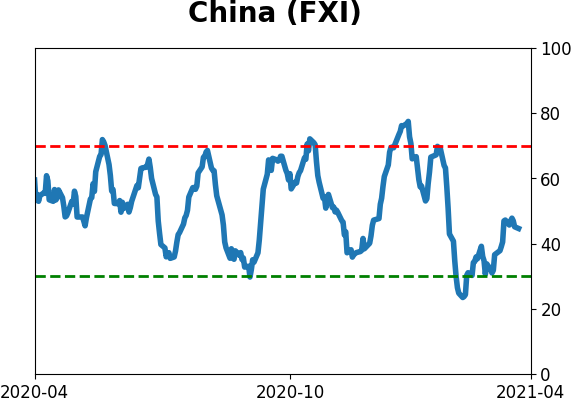
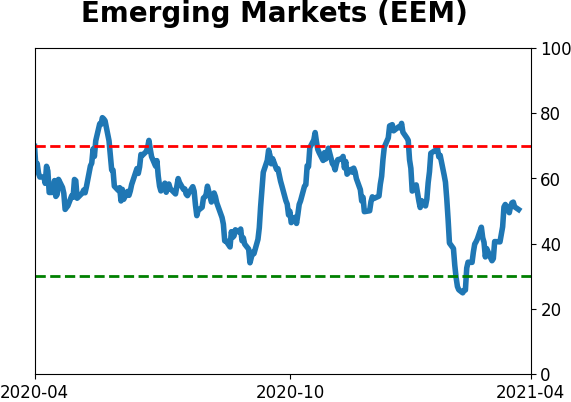
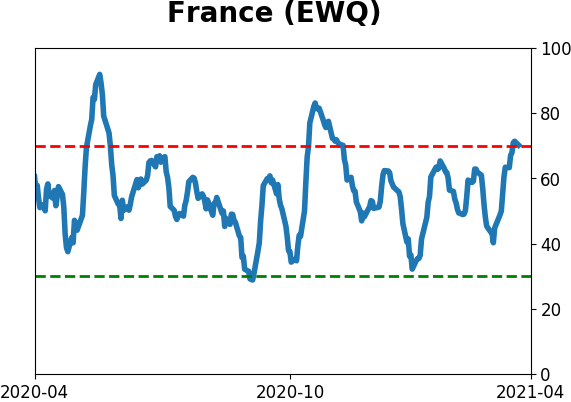
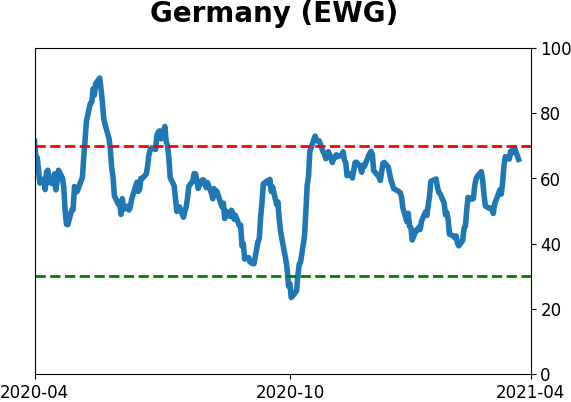
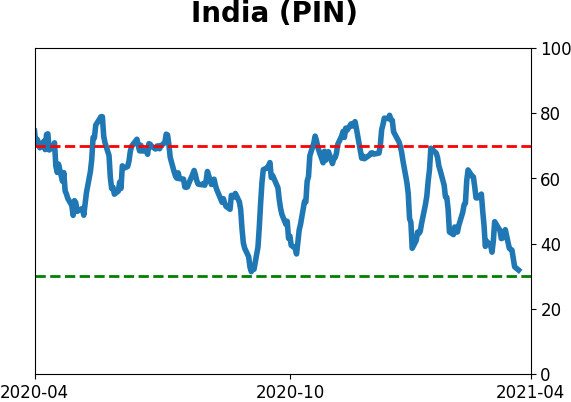
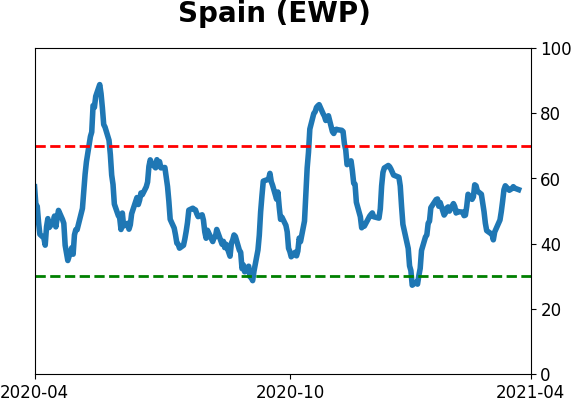
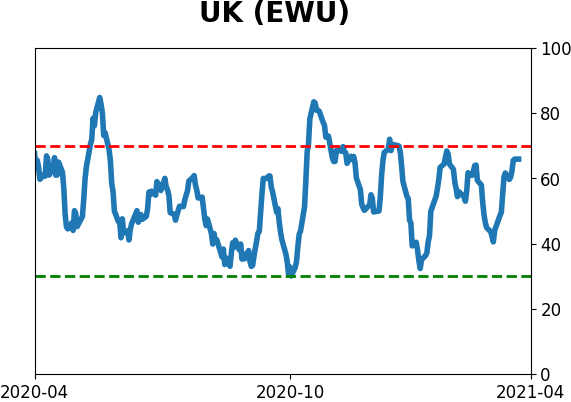
Country ETF's - 10-Day Moving Average
|
|
|
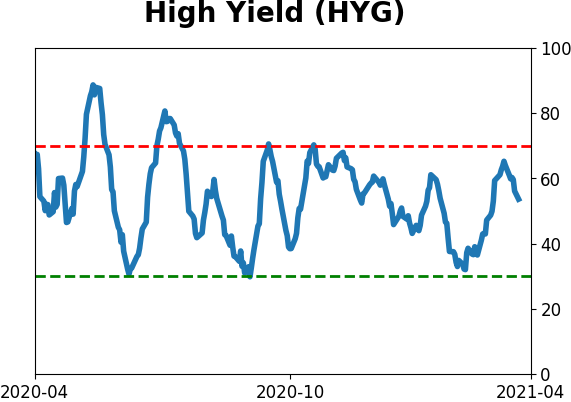
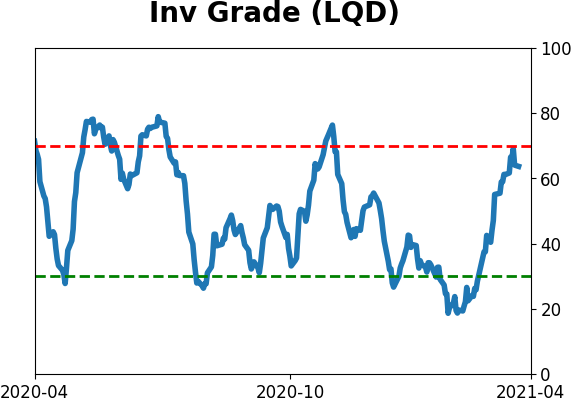
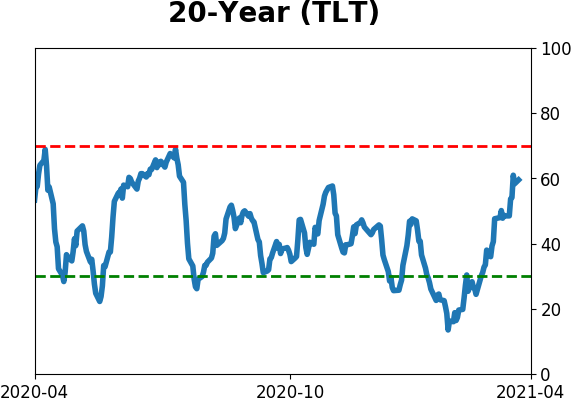
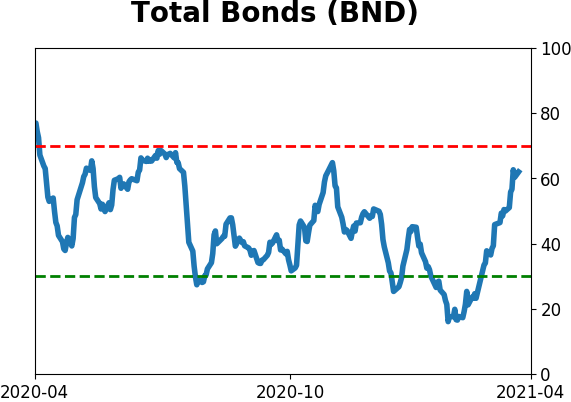
Bond ETF's - 10-Day Moving Average
|
|
|
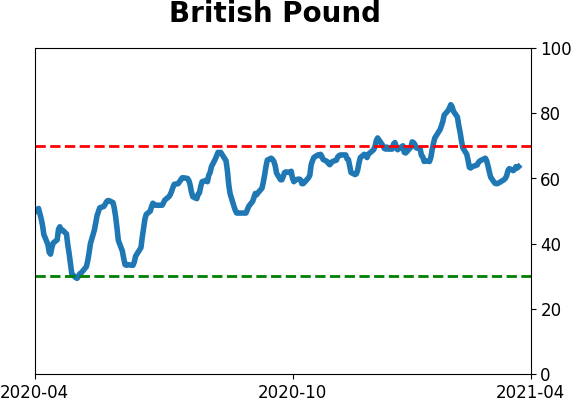
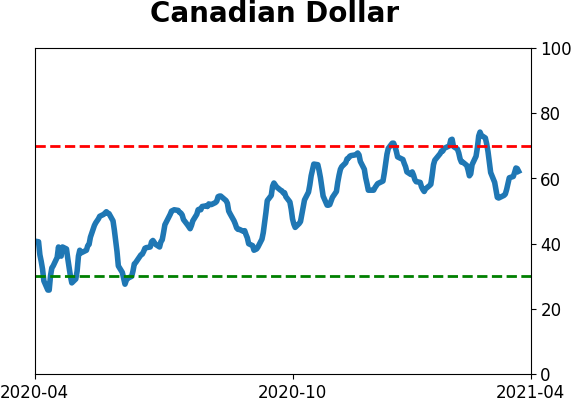
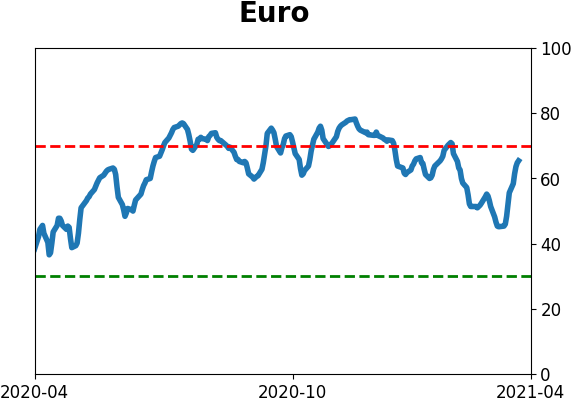
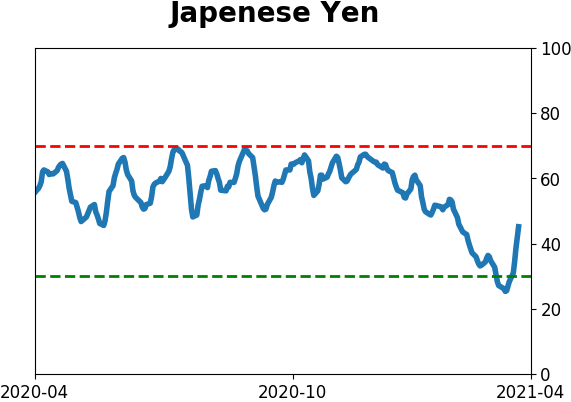
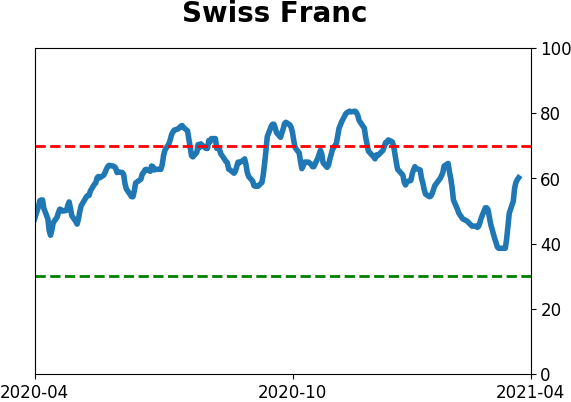
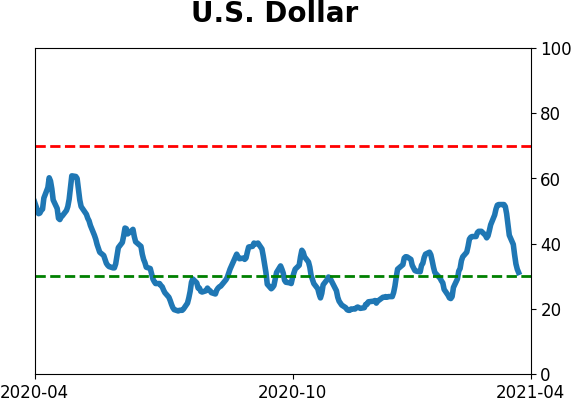
Currency ETF's - 5-Day Moving Average
|
|
|
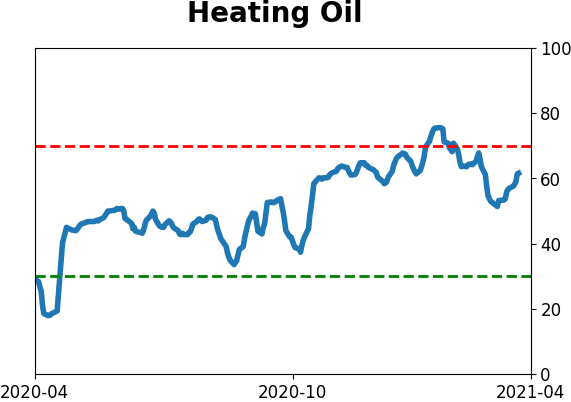
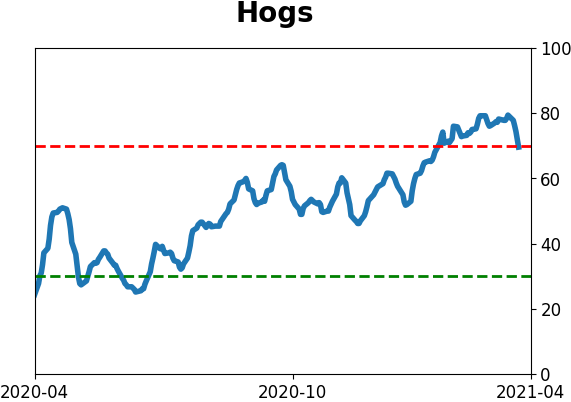
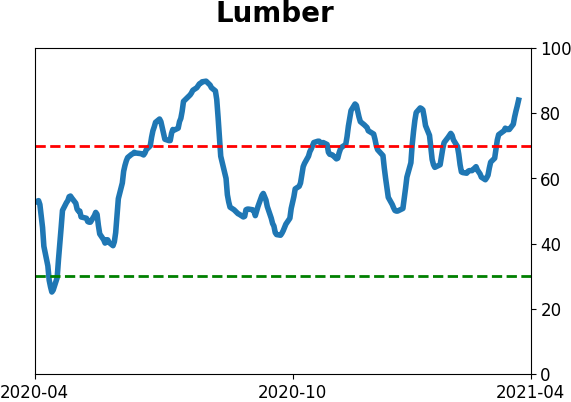
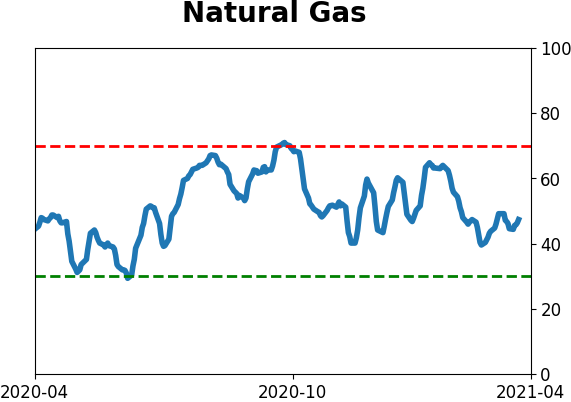
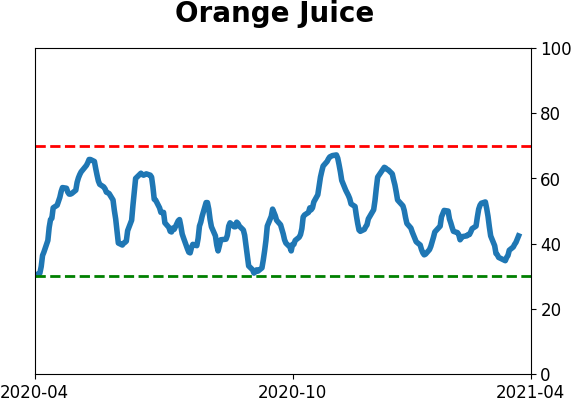
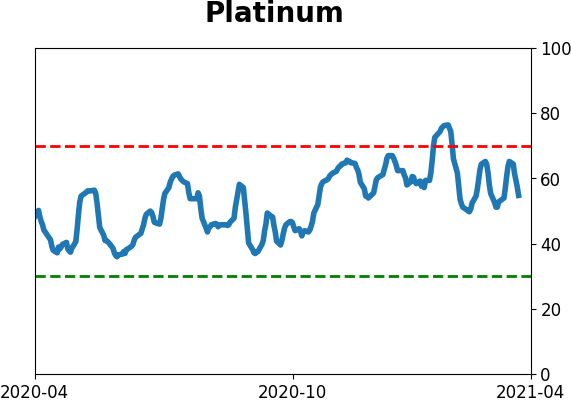
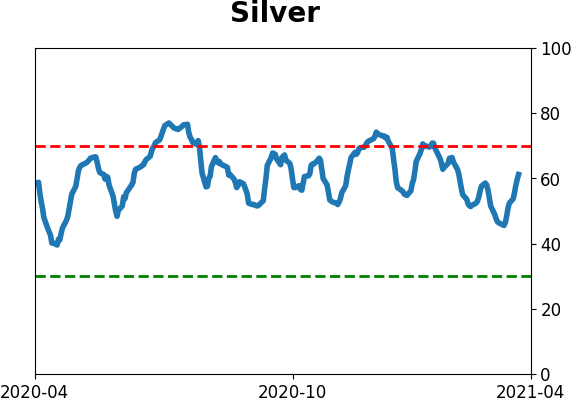
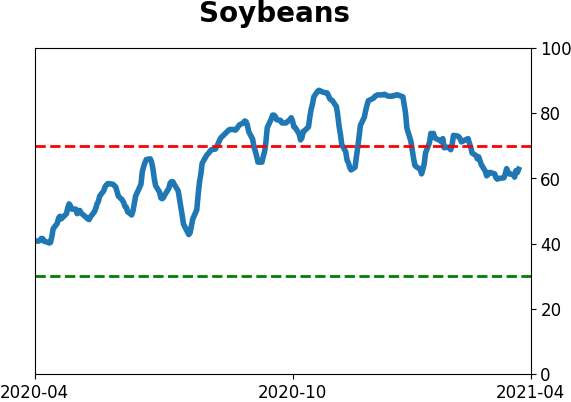
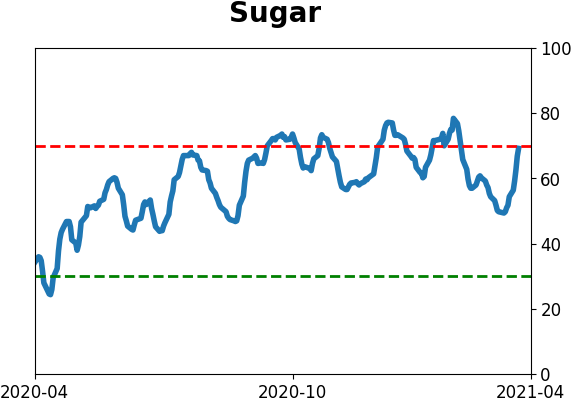
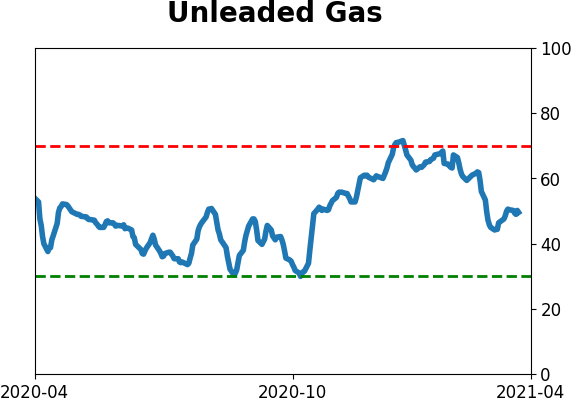
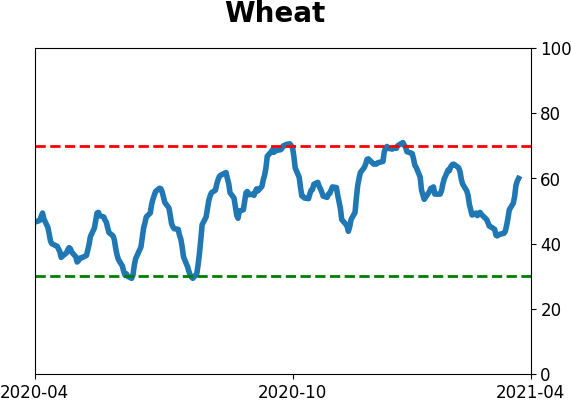
Commodity ETF's - 5-Day Moving Average
|
|