Headlines
|
|
Financial conditions have made a strong recovery:
The Bloomberg Financial Conditions index showed that things were as good as they can get in February, then plunged in March. In recent weeks, it shows that conditions have eased considerably, raising the possibility that the worst is over.
Volume flowing into declining stocks:
Despite a decent rally in the major equity indexes on Thursday, there was a big skew toward volume flowing into declining securities. Part of that can be excused by a single stock, but it bears watching in the days ahead.
Shaking it off: Energy stocks soared on Friday even as crude oil plunged. Normally there is a high positive correlation between their daily changes. There have been 6 times in 30 years when energy stocks jumped and oil dropped hard, and over the next week, energy stocks added to their gains 5 times, with the sole loser being small. The dates were 2008-09-16, 2008-10-16, 2008-12-02, 2020-03-26, and 2020-04-06. Relaxing the parameters to get a larger sample size, the bias still mostly held true, but was not as consistent.
More "smart money" buying: As of Tuesday, hedgers in the major equity index futures were holding $42.7 billion worth of contracts. That's an all-time high. Over the past decade, large net long positions by this group have led to dramatically positive returns. The biggest caveats are that prior to the financial crisis, this data was not as effective, and it's difficult to make the case that we're in the same type of market environment as the last decade. Still, it's a continuation of a positive data point.
|
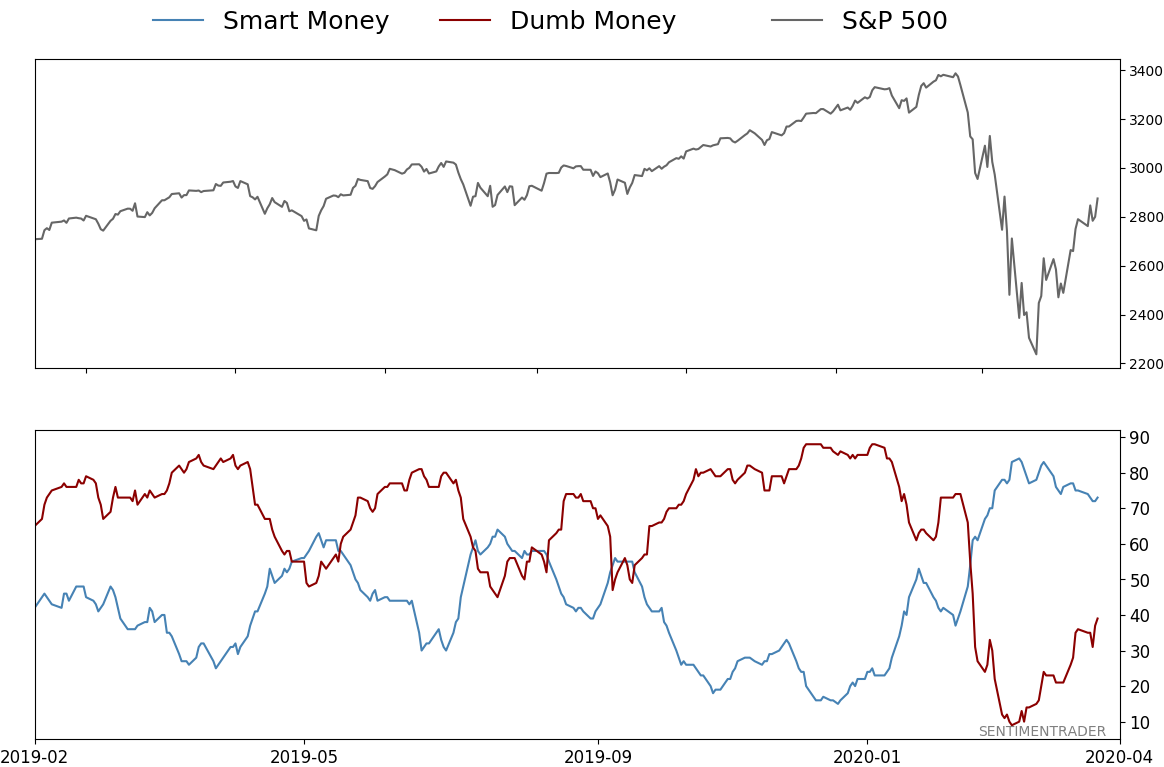
Smart / Dumb Money Confidence
|
Smart Money Confidence: 73%
Dumb Money Confidence: 39%
|
|
Risk Levels
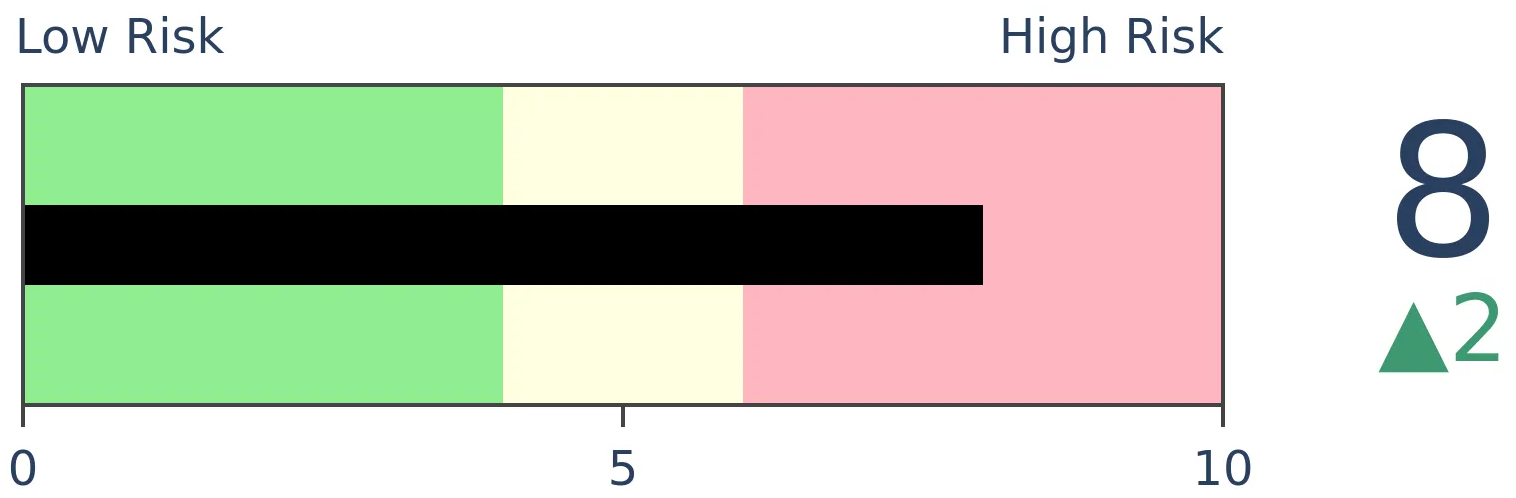
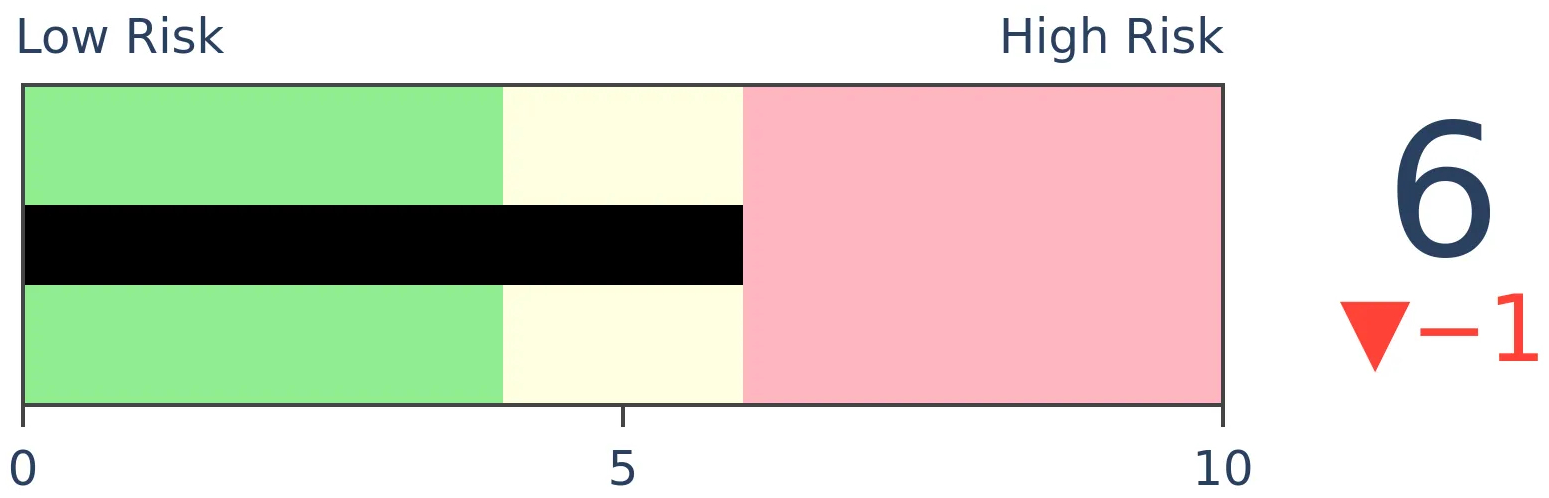
Stocks Short-Term
|
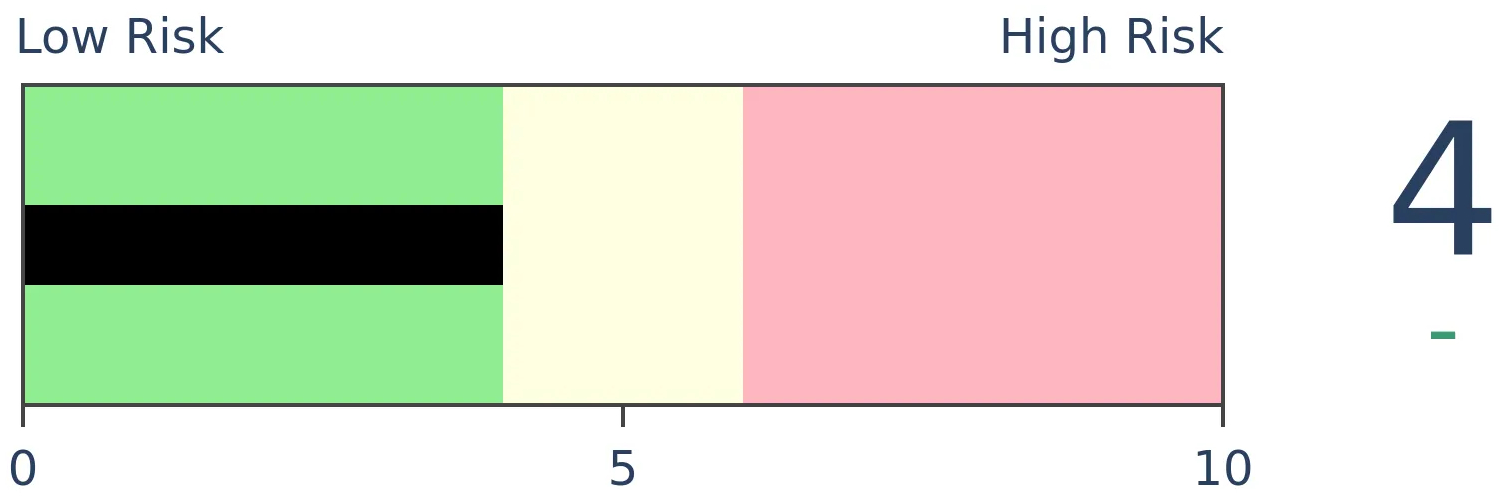
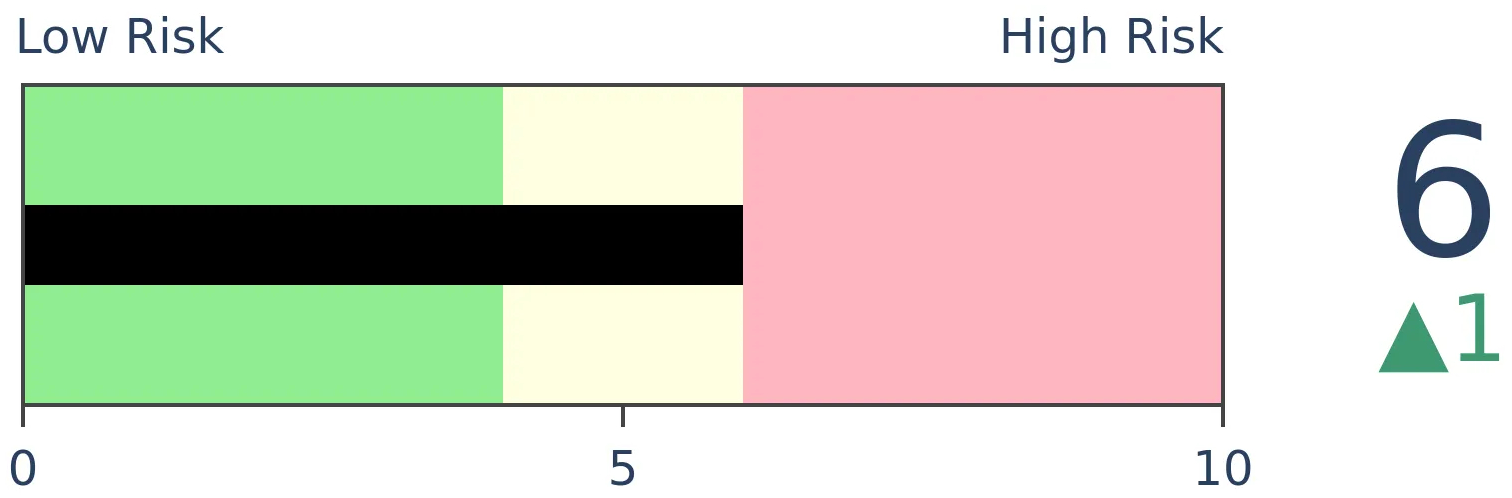
Stocks Medium-Term
|
|
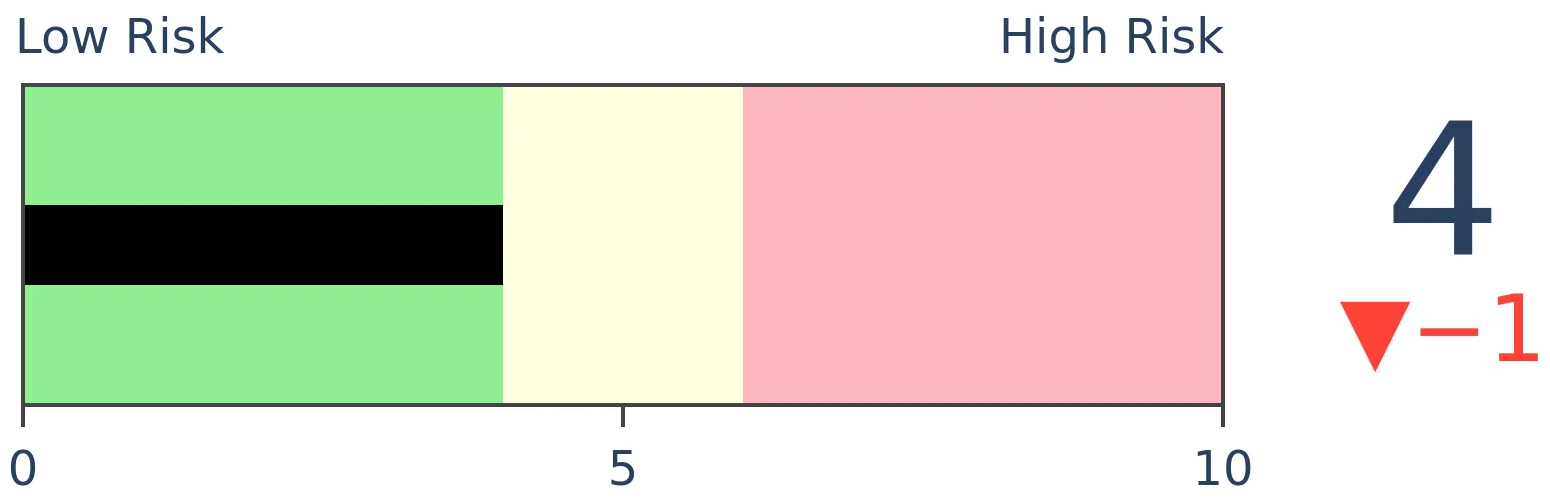
Bonds
|
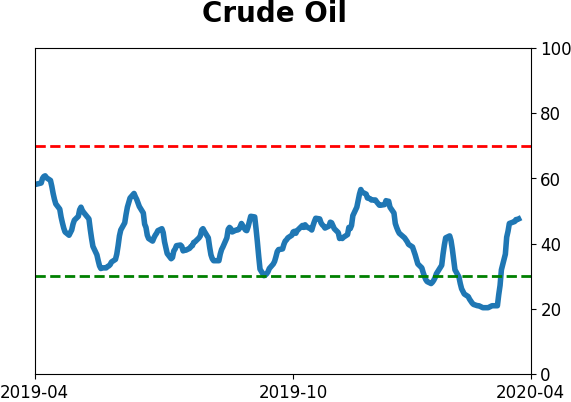
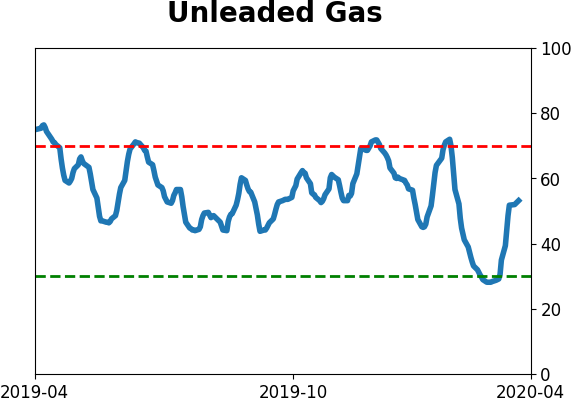
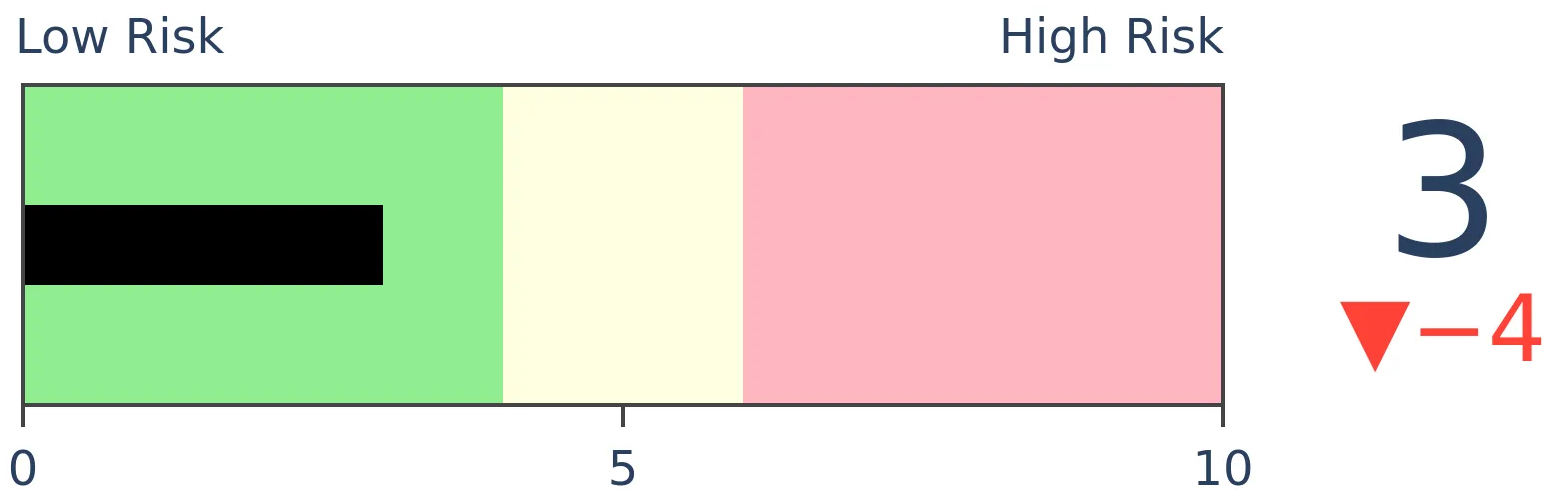
Crude Oil
|
|
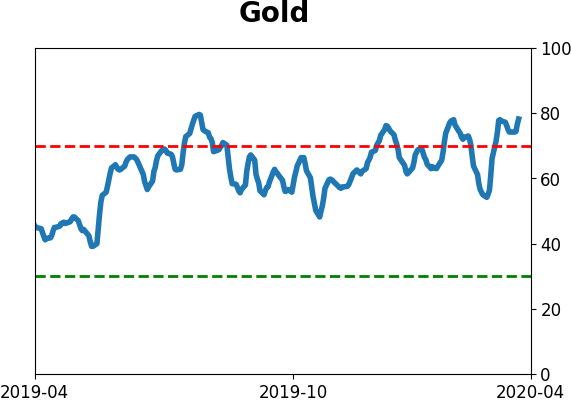
Gold
|
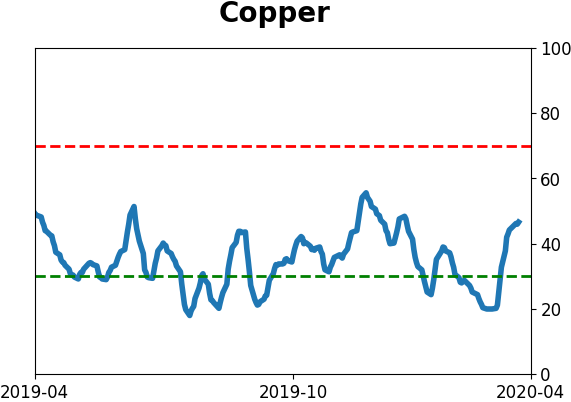
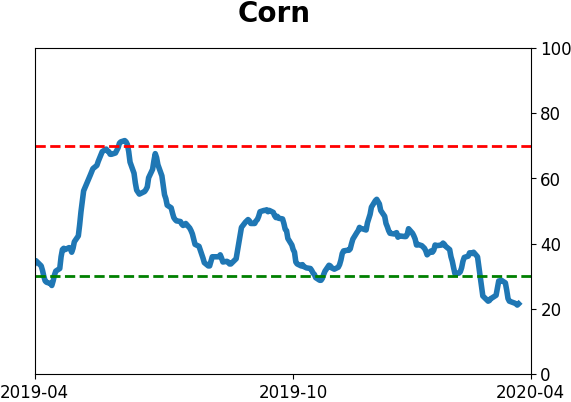
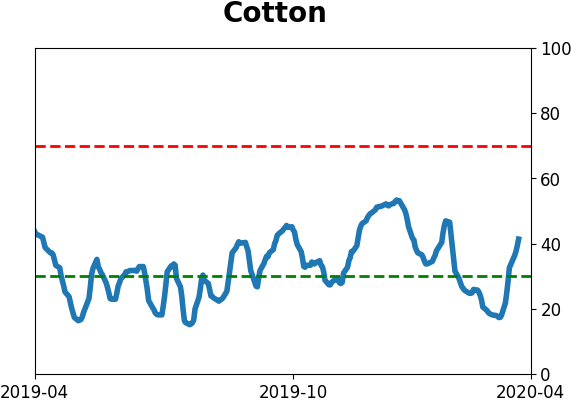
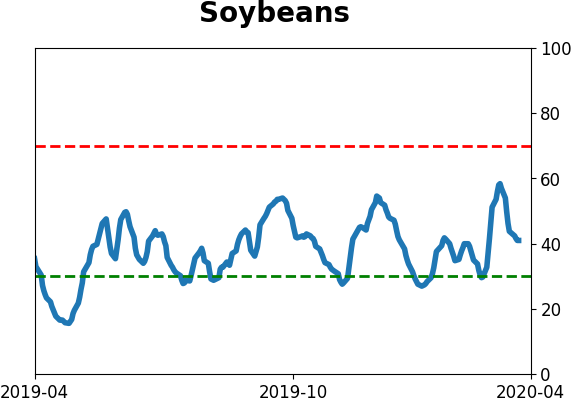
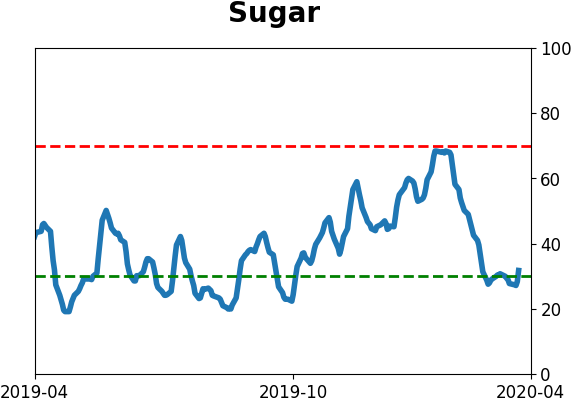
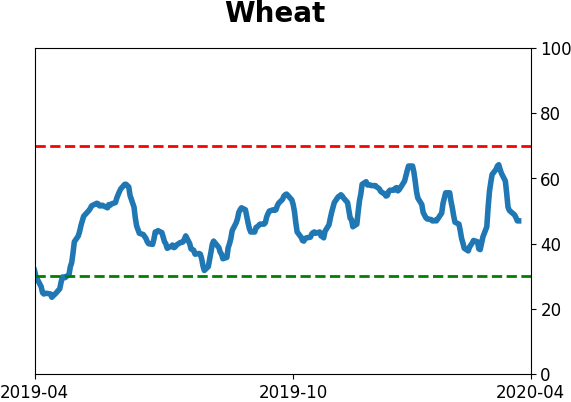
Agriculture
|
|
Research
BOTTOM LINE
The Bloomberg Financial Conditions index showed that things were as good as they can get in February, then plunged in March. In recent weeks, it shows that conditions have eased considerably, raising the possibility that the worst is over.
FORECAST / TIMEFRAME
None
|
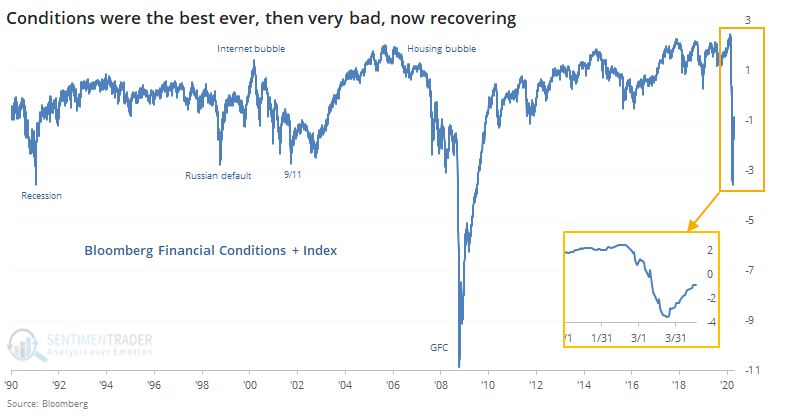
In mid-February, financial conditions were as good as it gets. The best in 30 years, at least.
March changed that in a hurry. Conditions when from the best-ever to one of the worst-ever in a matter of weeks. The Bloomberg Financial Conditions + index (BFC+) went from +2 to -2 in only three weeks, a record drop.
Per Bloomberg:
The Bloomberg Financial Conditions index tracks the overall level of financial stress in the U.S. money, bond, and equity markets to help assess the availability and cost of credit. A positive value indicates accommodative financial conditions, while a negative value indicates tighter financial conditions relative to pre-crisis norms. Bloomberg also calculates a Financial Conditions + index which includes all the elements of the BFCI index as well as indicators of asset-price bubbles, which also have an effect on financial conditions. These include tech-share prices, the housing market, and deviations from equilibrium yield levels.”
The rally off the March low has eased those conditions, however, and the index has reversed much of the decline.
Below, we can see what happened the other times when the BFC+ recovered two points from a six-month low.
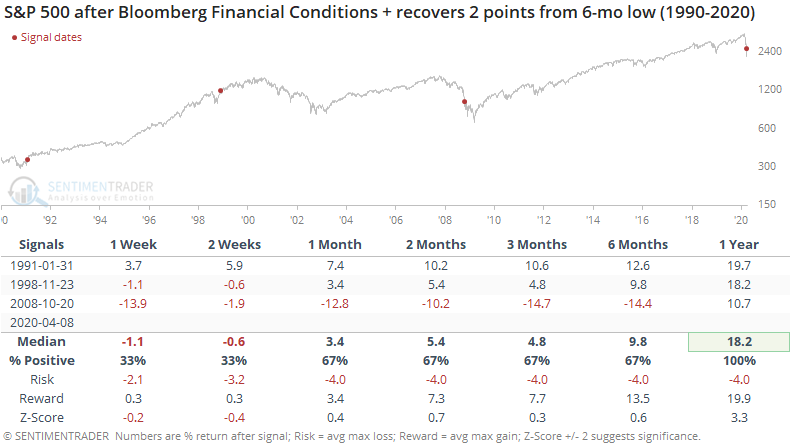
The first two were excellent signals that the recovery was in force and sustainable, with excellent gains and very little risk in the months ahead. Like so many other indicators have shown, the first post-panic moves in October-November 2008 were a head-fake and it preceded some painful months for those who bought into the initial recovery.
About the best determinant of which path the market was taking is price itself.
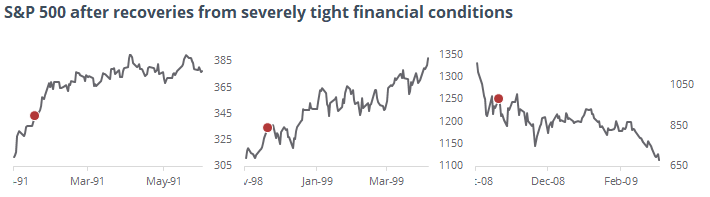
The first didn't see too much of a pullback, while the latter soon led to a lower low. Like with saw after other price and breadth surges, if March was truly an important turning point in the recovery, then we shouldn't see too much of this initial rally given back in the weeks ahead.
BOTTOM LINE
Despite a decent rally in the major equity indexes on Thursday, there was a big skew toward volume flowing into declining securities. Part of that can be excused by a single stock, but it bears watching in the days ahead.
FORECAST / TIMEFRAME
None
|
Yesterday, we noted that despite a decent gain in the major indexes, volume on the NYSE was heavily skewed toward securities that were declining.
A big part of that was due to General Electric, which dropped on Thursday with massive volume. So perhaps we can excuse a single day's reading, but making excuses for indicators is a slippery slope.
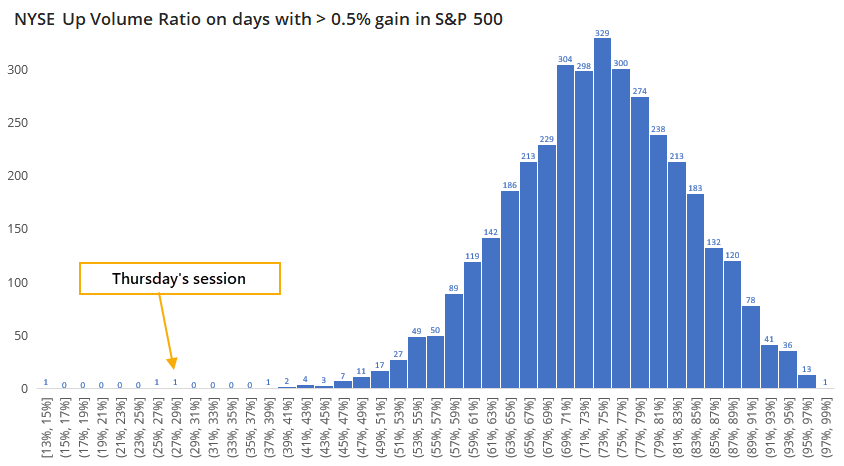
On a typical day when the S&P 500 rises 0.5% or more, the NYSE Up Volume Ratio averages 74%. Thursday's reading was only 29%, the 3rd-worst ever for that big of an up day in the S&P.
A histogram shows just how unusual this is, out of the 3,712 days that qualified since 1962.
A day with such bad volume flow has typically led to poor returns for the S&P.
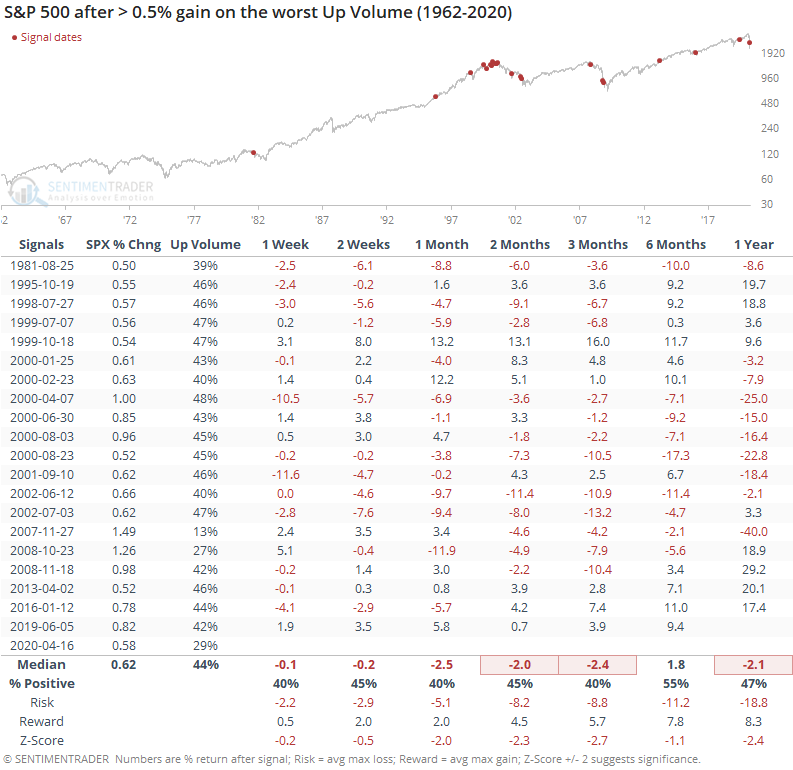
There were only a few dates in there that managed to see the index escape unscathed in the weeks ahead, including the last signal from June 2019.
We should hesitate before putting too much weight on a single day's reading, especially since we've already seen massively positive breadth thrusts over the past few weeks, including once again on Friday with a 90% up volume day. And without a single stock, this figure would have been significantly better. It's just a minor warning which will have more meaning if we continue to see relatively low volume flowing into advancing stocks in the days ahead.
Active Studies
| Time Frame | Bullish | Bearish | | Short-Term | 0 | 3 | | Medium-Term | 11 | 0 | | Long-Term | 32 | 3 |
|
Indicators at Extremes
Portfolio
| Position | Weight % | Added / Reduced | Date | | Stocks | 73.2 | Added 31.3% | 2020-03-17 | | Bonds | 0.0 | Reduced 6.7% | 2020-02-28 | | Commodities | 5.5 | Added 2.4%
| 2020-02-28 | | Precious Metals | 0.0 | Reduced 3.6% | 2020-02-28 | | Special Situations | 0.0 | Reduced 31.9% | 2020-03-17 | | Cash | 21.3 | | |
|
Updates (Changes made today are underlined)
In the first months of the year, we saw manic trading activity. From big jumps in specific stocks to historic highs in retail trading activity to record highs in household confidence to almost unbelievable confidence among options traders. All of that has come amid a market where the average stock can’t keep up with their indexes. There were signs of waning momentum in stocks underlying the major averages, which started triggering technical warning signs in late January. The kinds of extremes we saw in December and January typically take months to wear away, but the type of selling in March went a long way toward getting there. When we place the kind of moves we saw into March 23 into the context of coming off an all-time high, there has been a high probability of a multi-month rebound. After stocks bottomed on the 23rd, they enjoyed a historic buying thrust and retraced a larger amount of the decline than "just a bear market rally" tends to. While other signs are mixed that panic is subsiding, those thrusts are the most encouraging sign we've seen in years. Shorter-term, there have been some warning signs popping up and our studies have stopped showing as positively skewed returns. If we drop below the lows of the past week, I'll likely reduce exposure.
RETURN YTD: -8.8% 2019: 12.6%, 2018: 0.6%, 2017: 3.8%, 2016: 17.1%, 2015: 9.2%, 2014: 14.5%, 2013: 2.2%, 2012: 10.8%, 2011: 16.5%, 2010: 15.3%, 2009: 23.9%, 2008: 16.2%, 2007: 7.8%
|
|
Phase Table
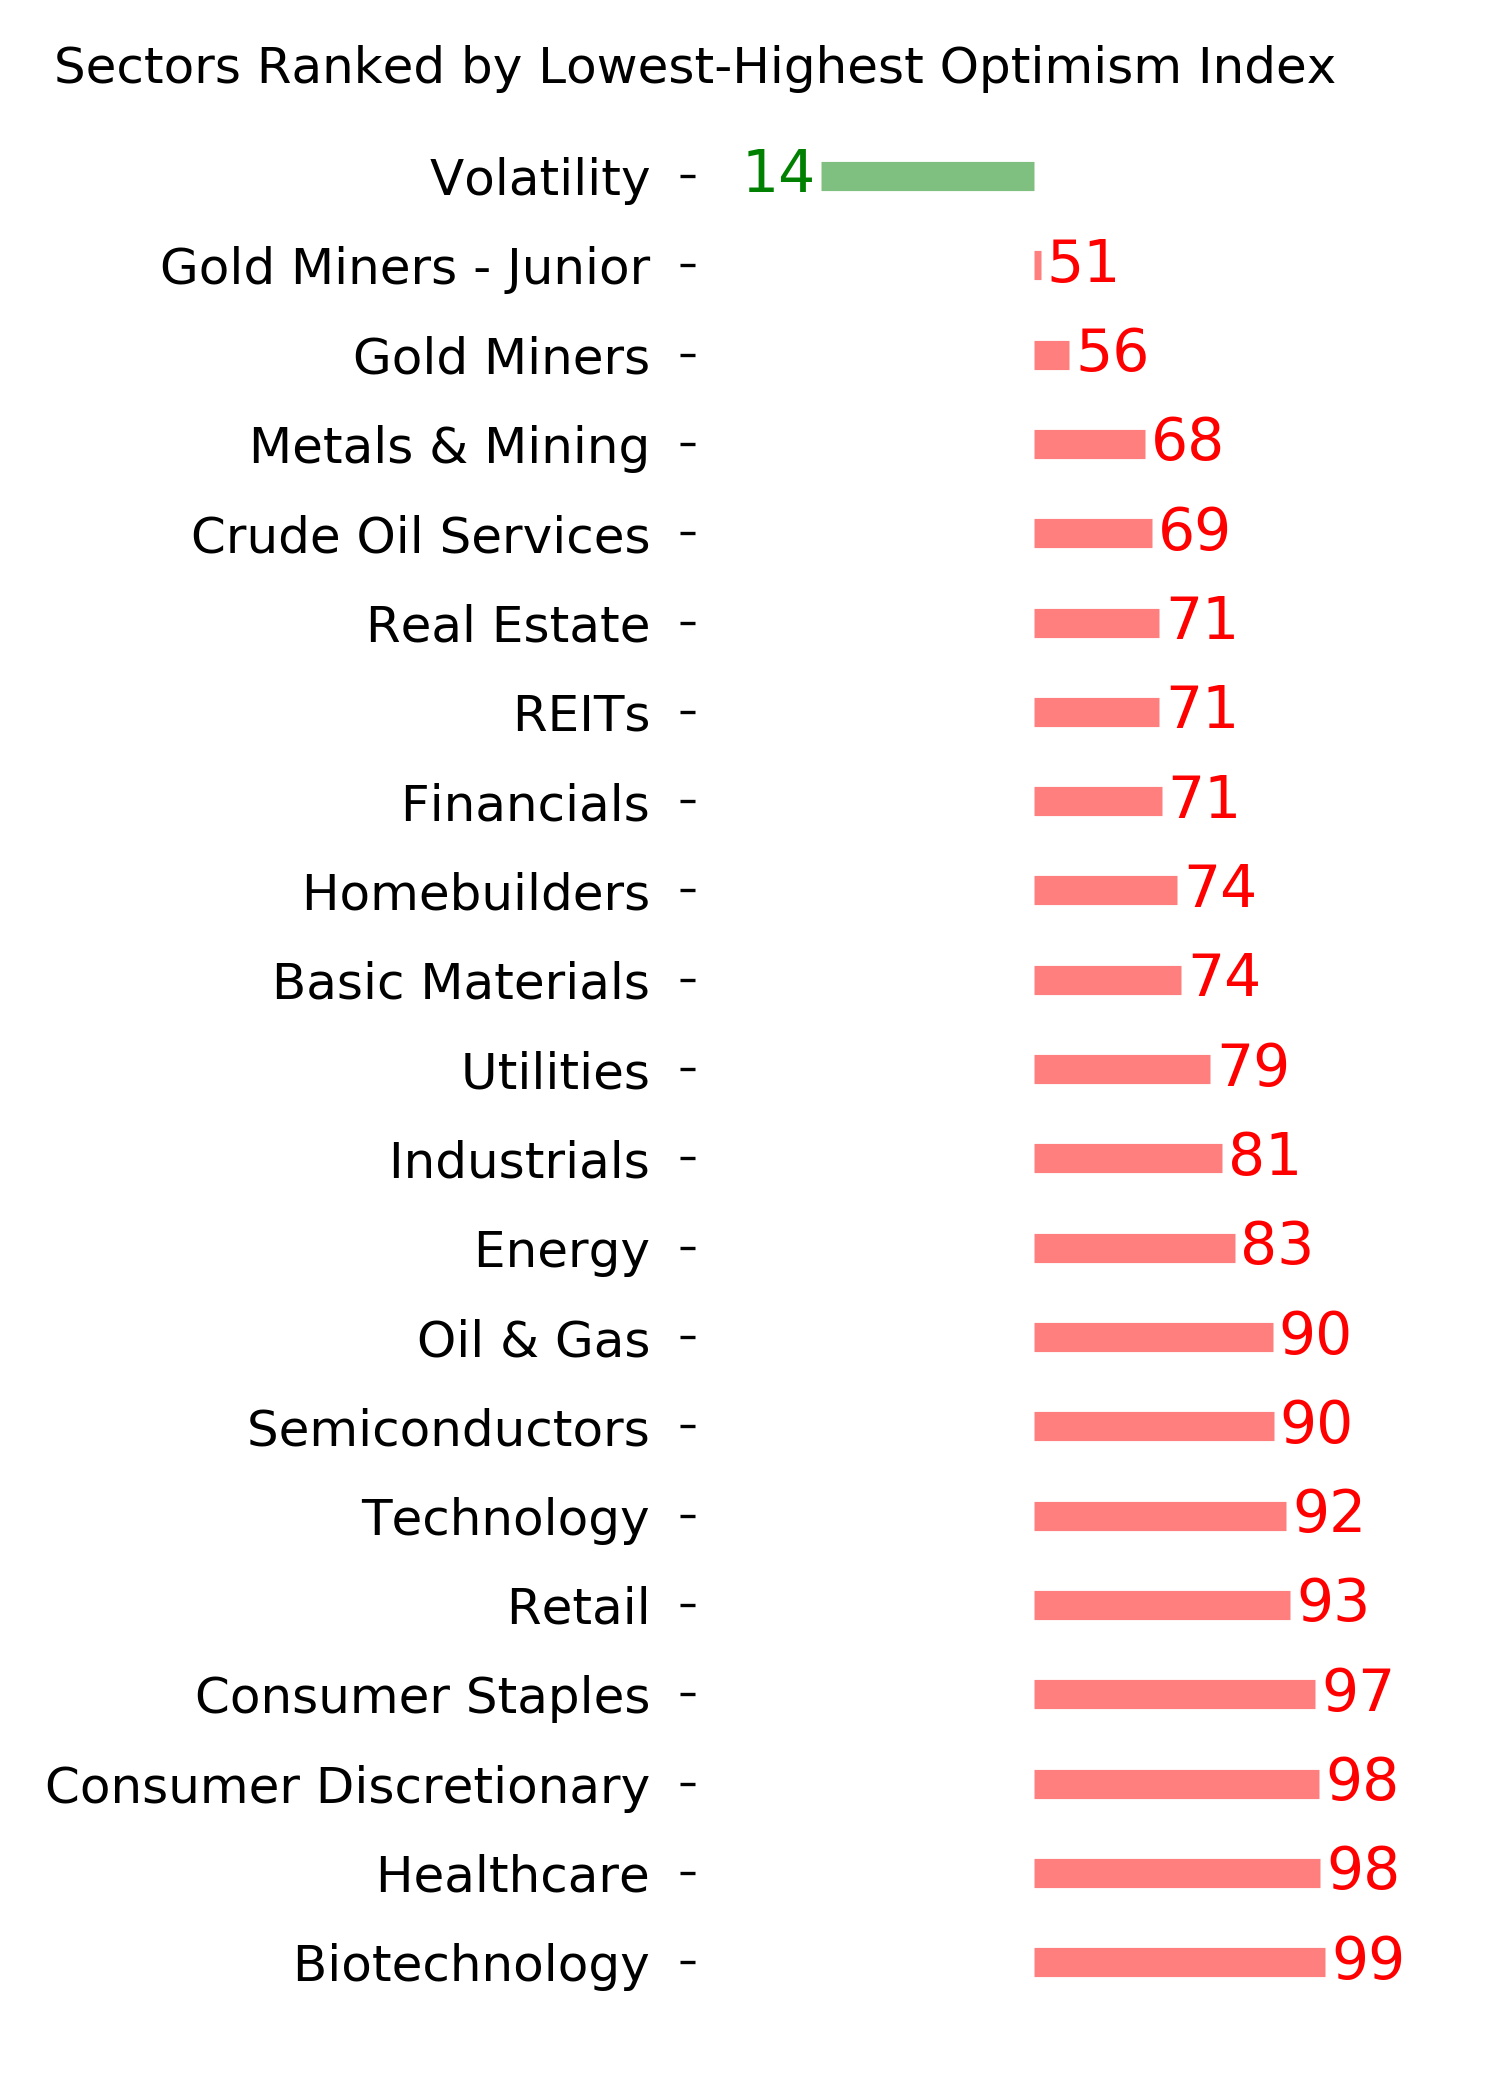
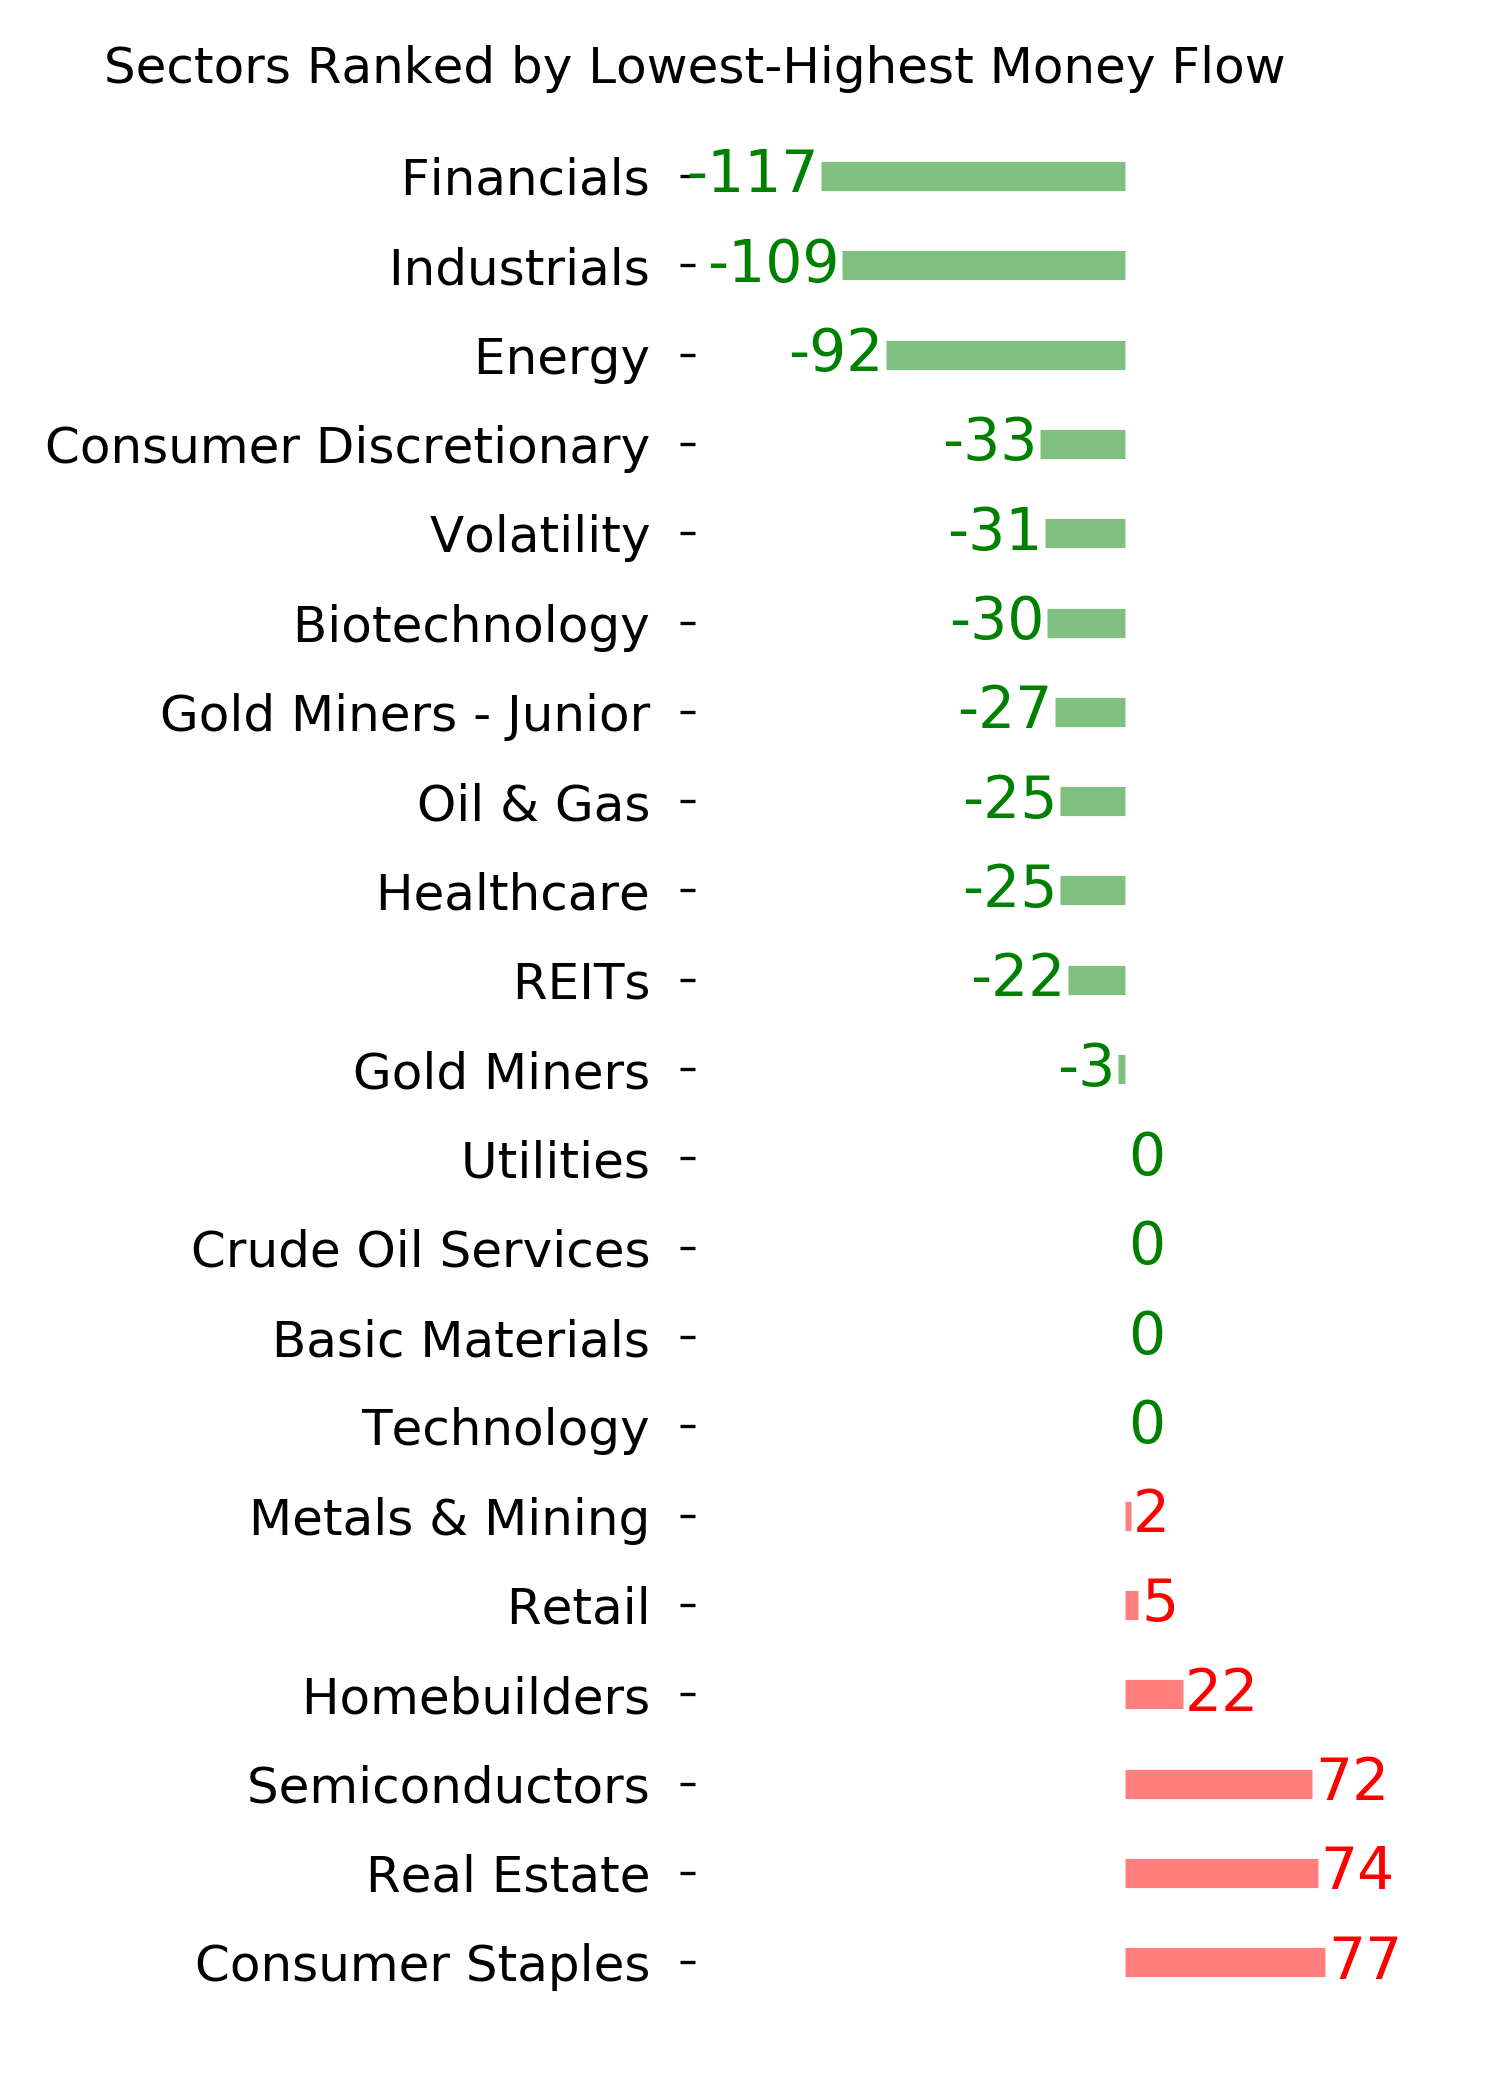
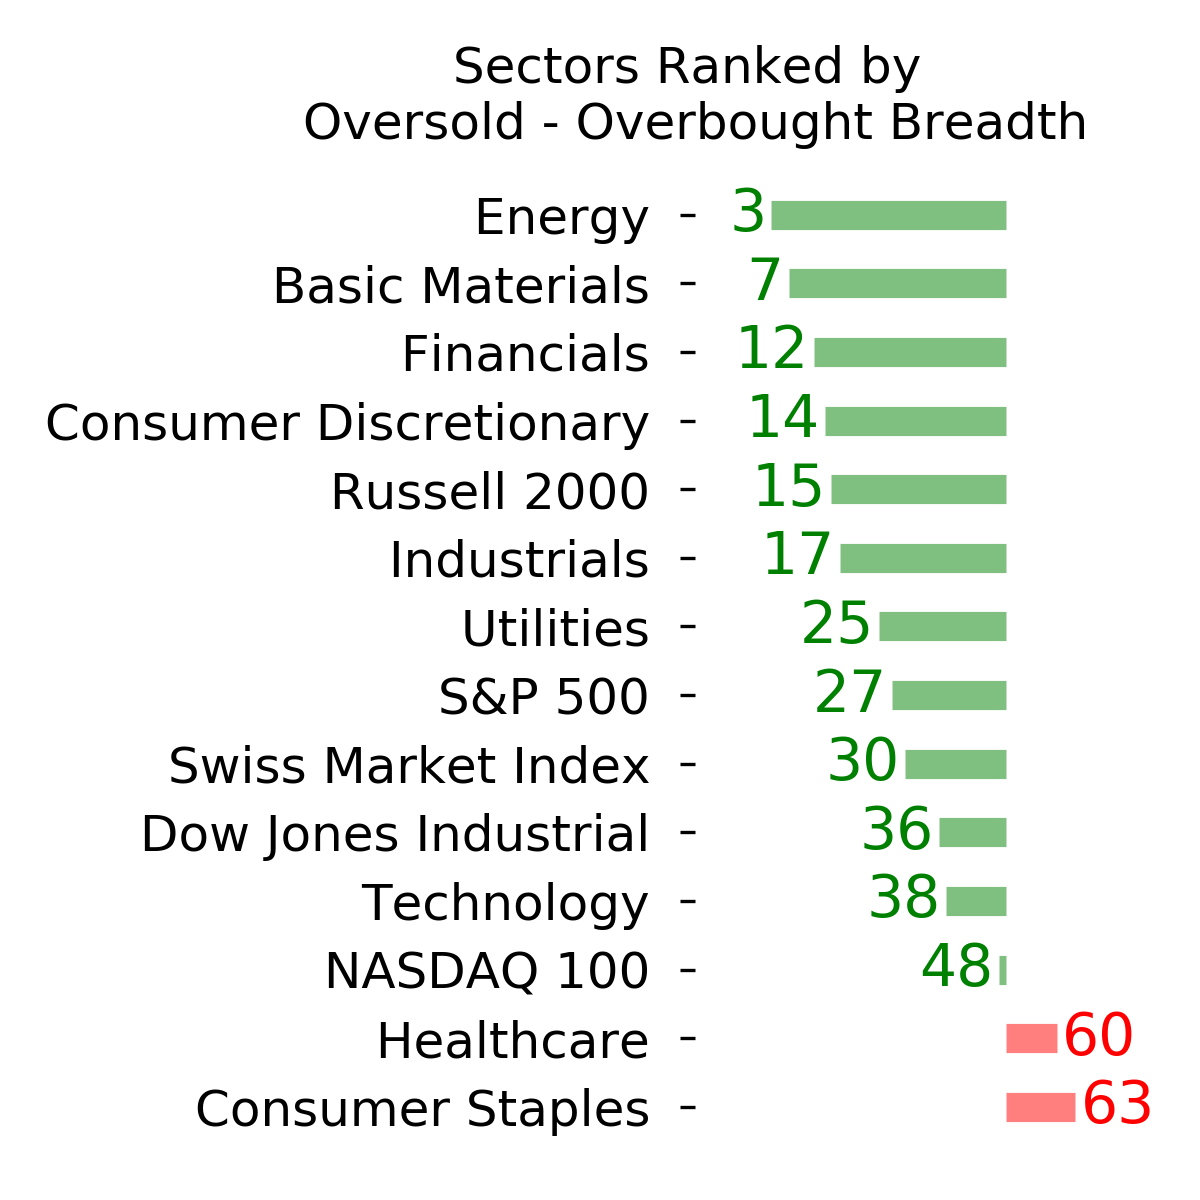
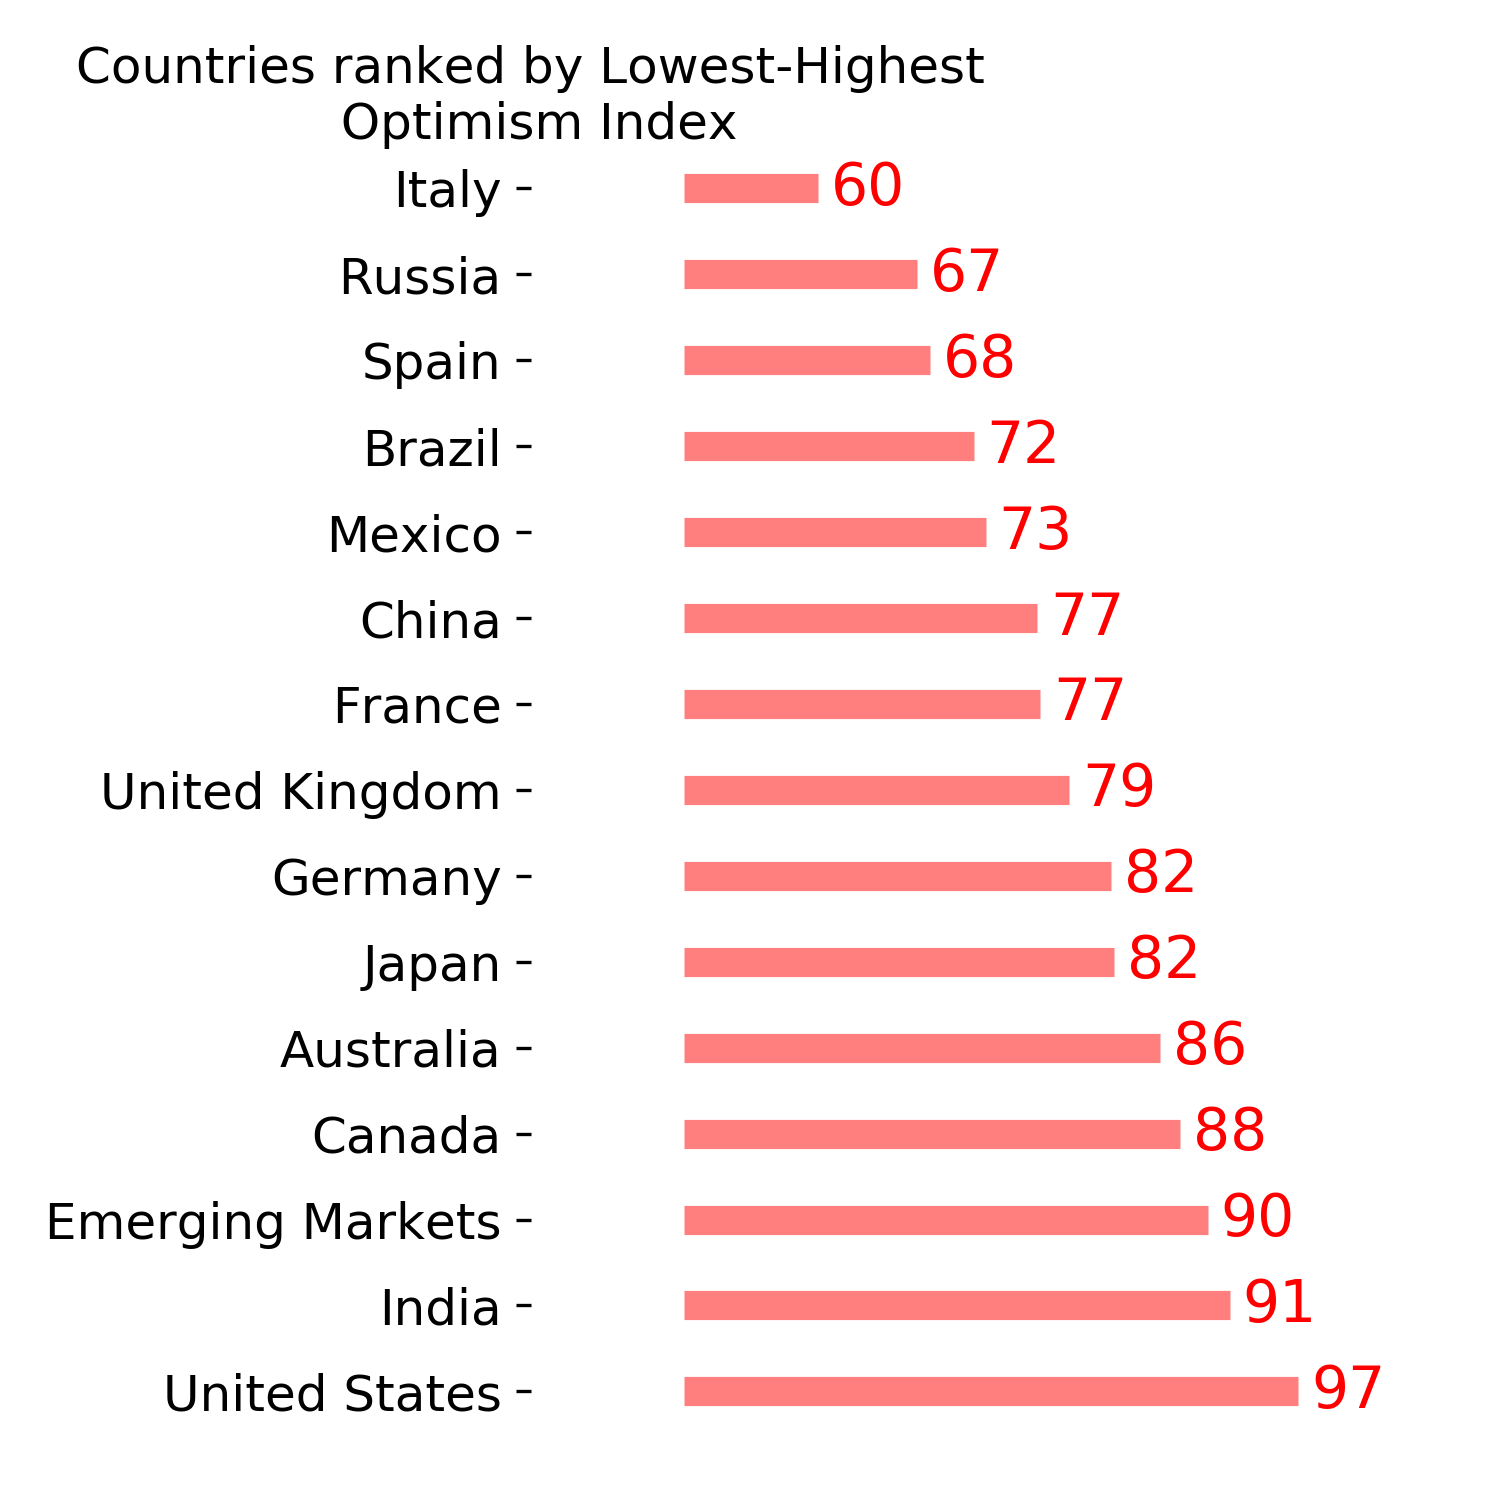
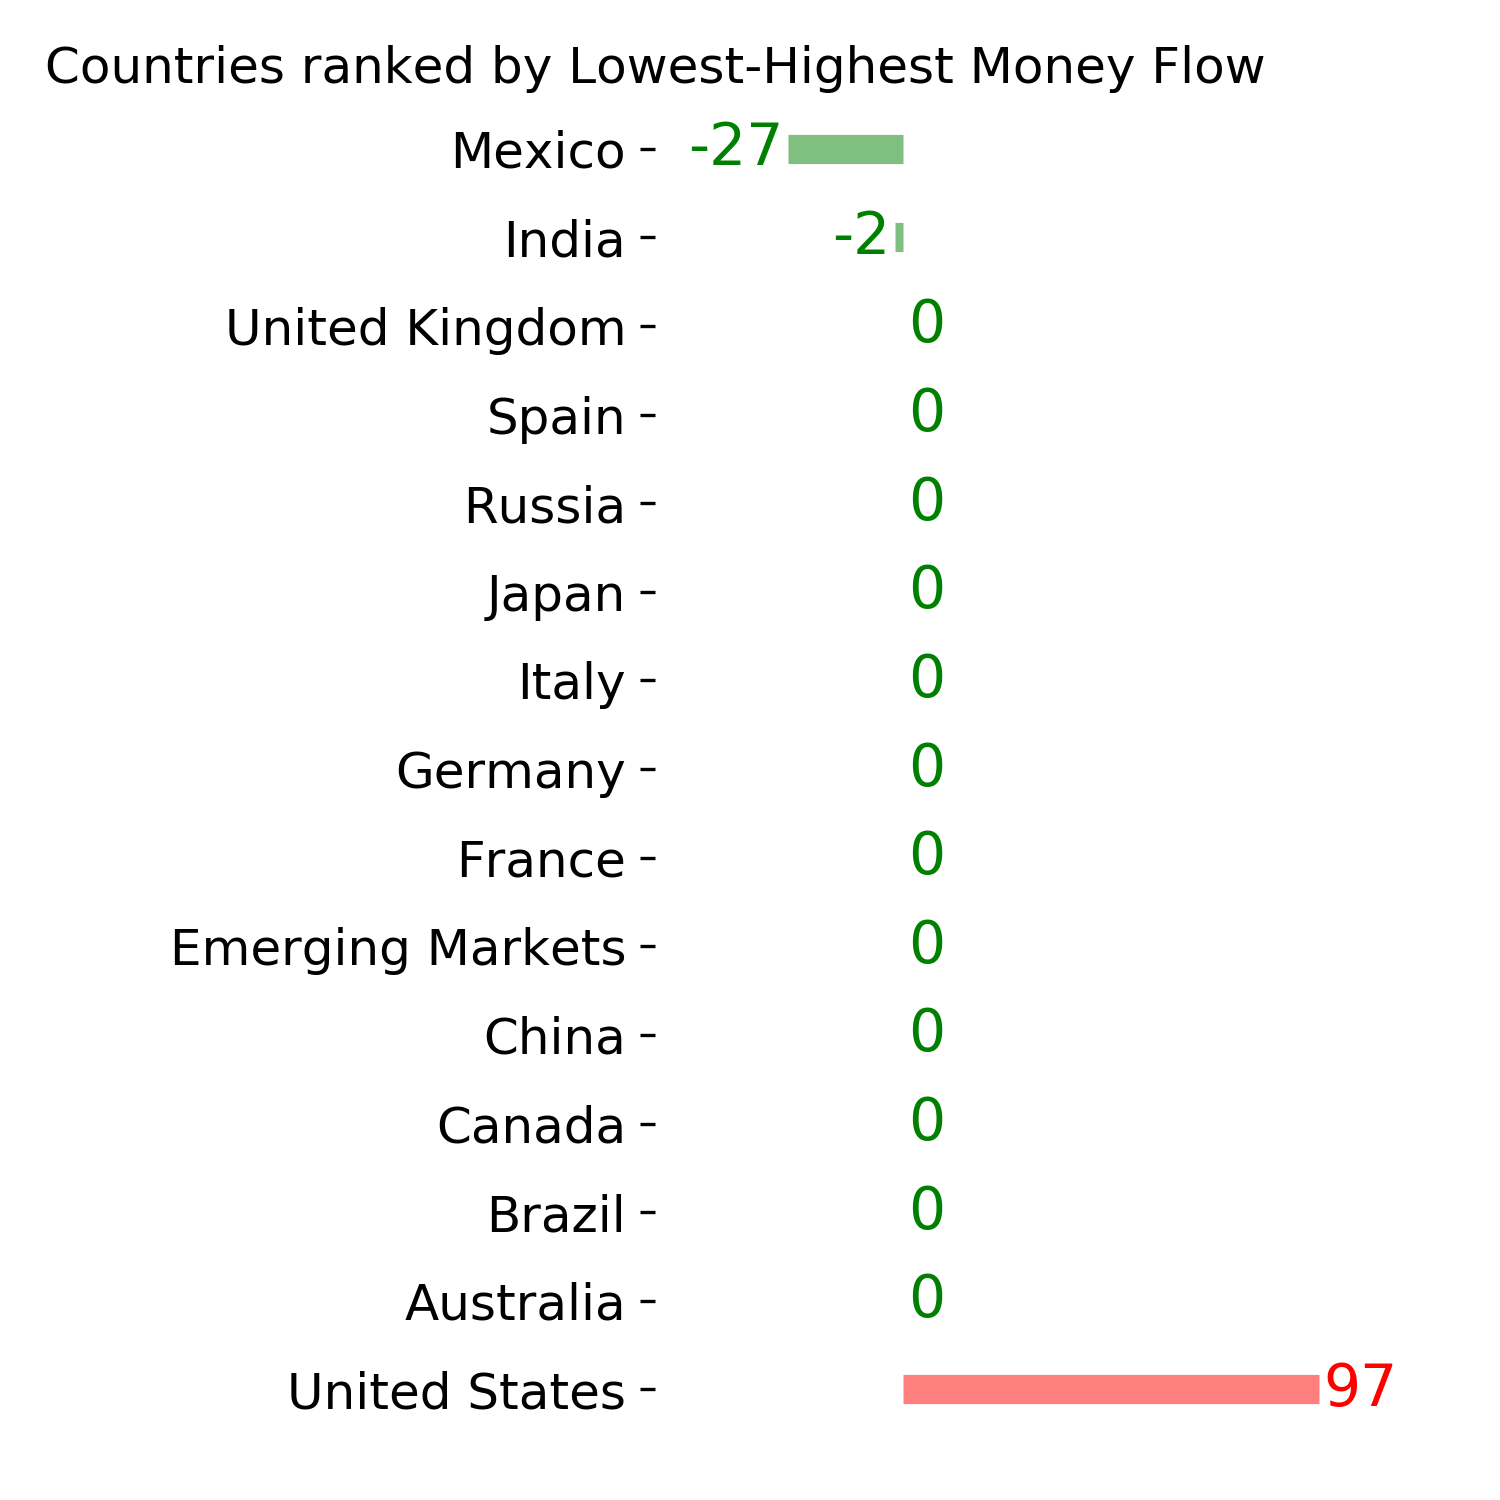
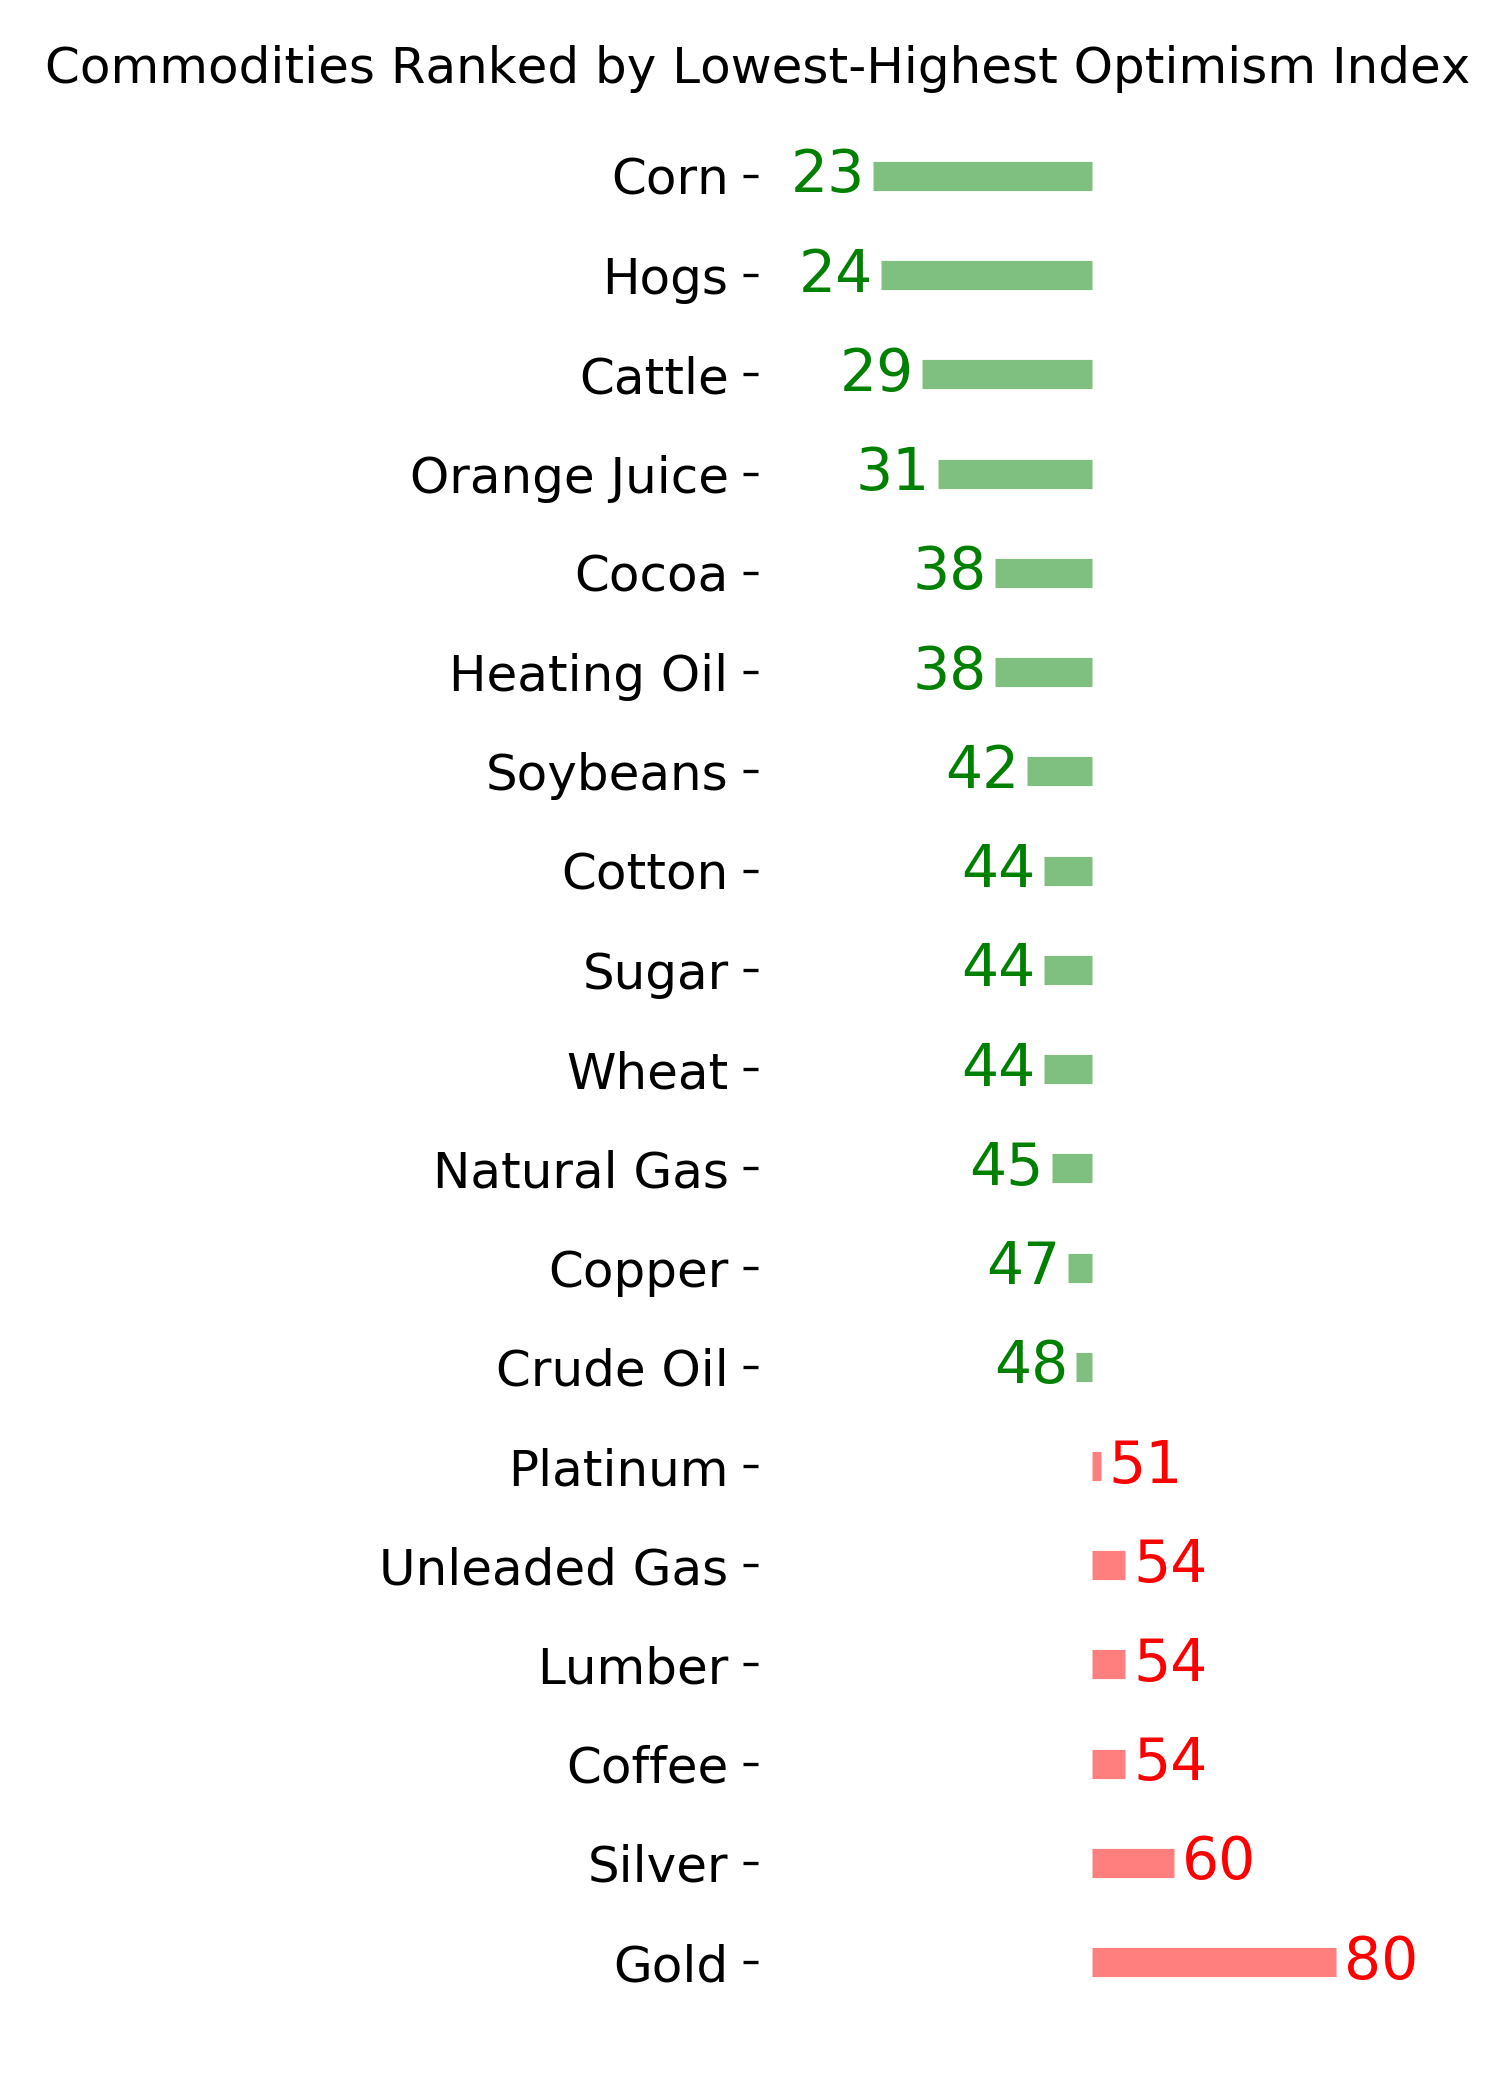
Ranks
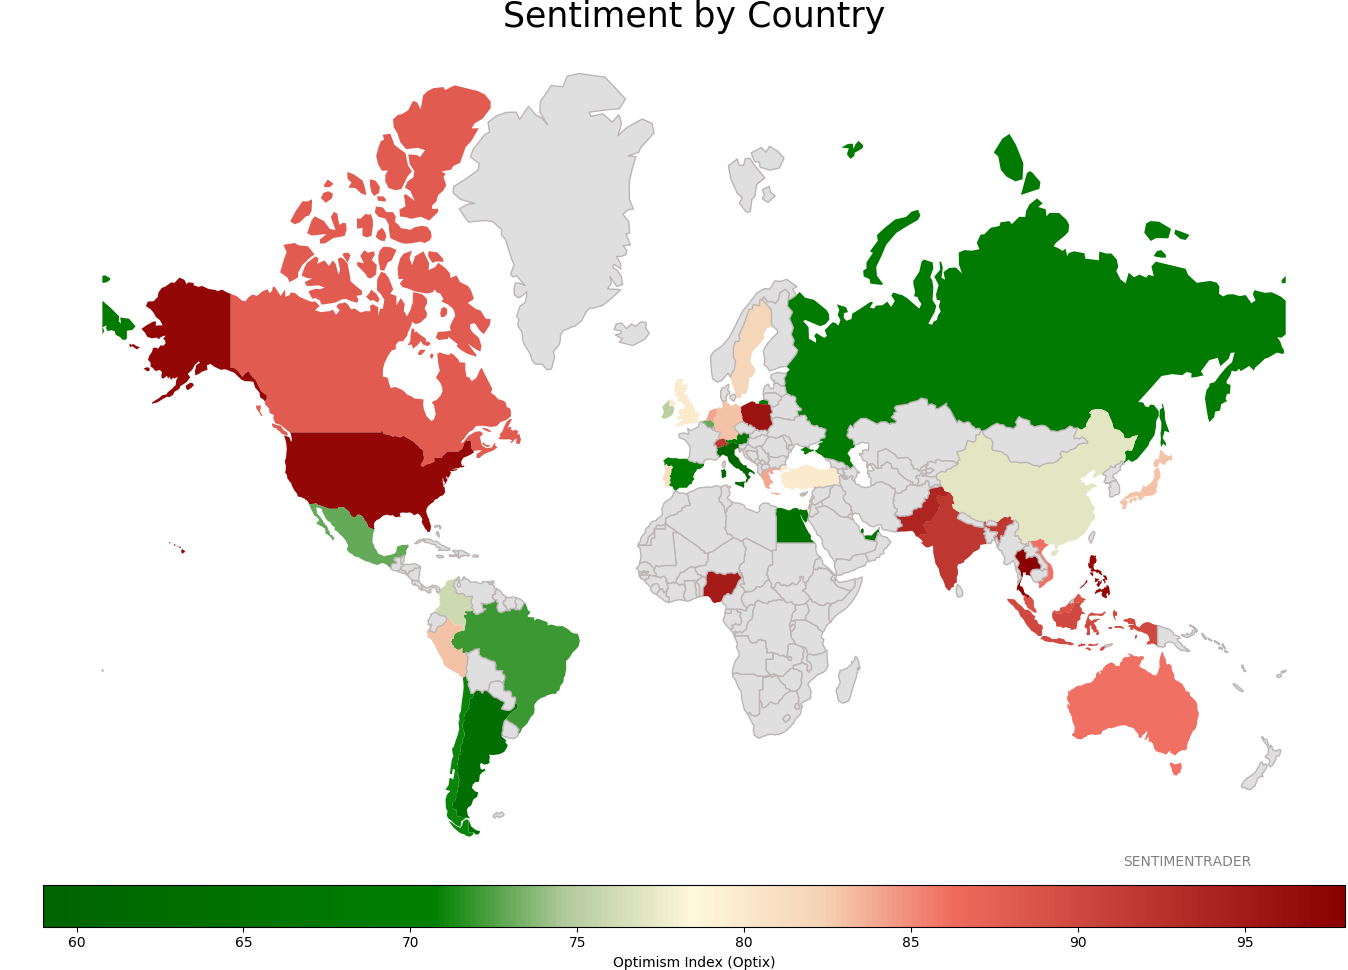
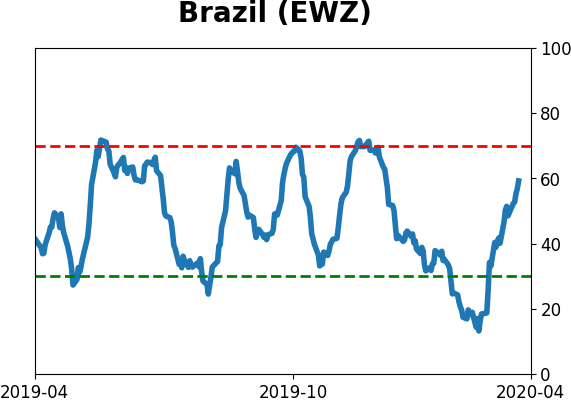
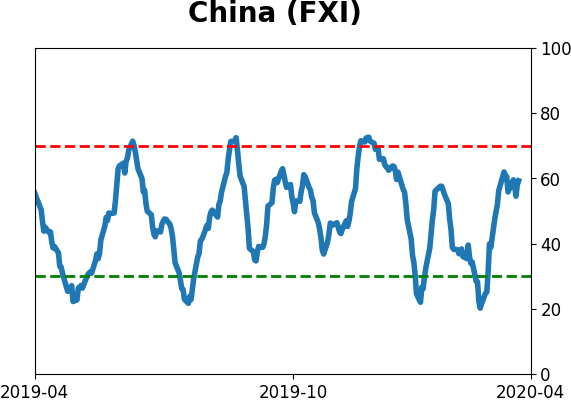
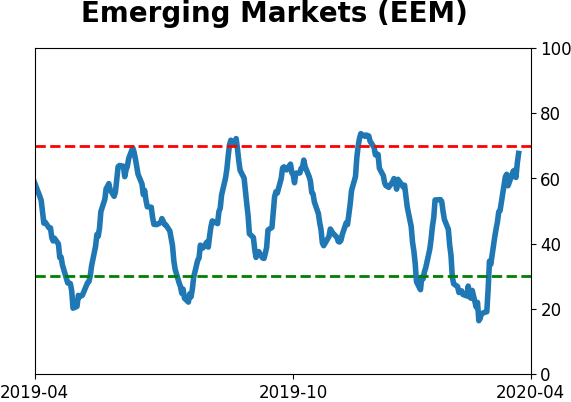
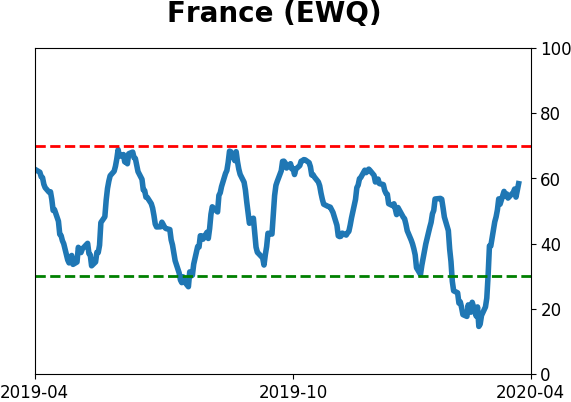
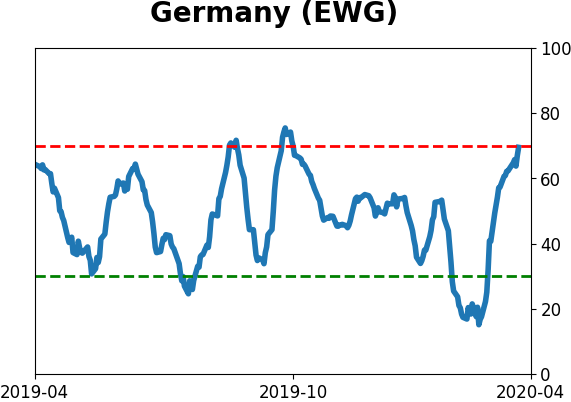
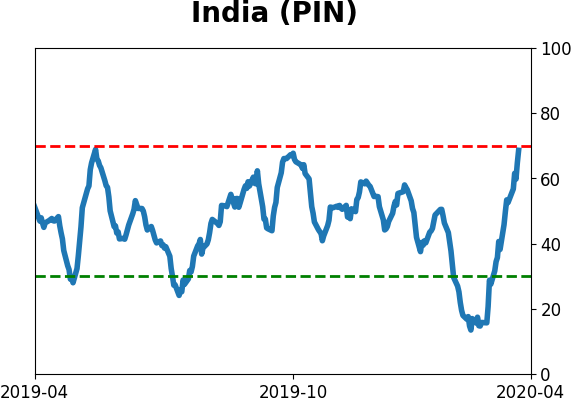
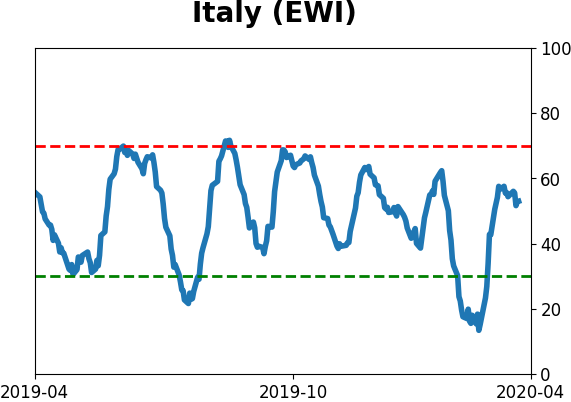
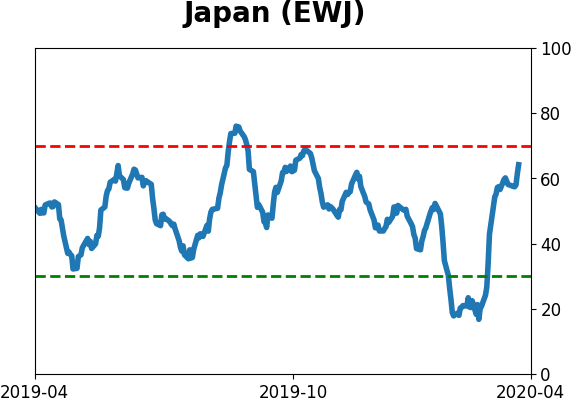
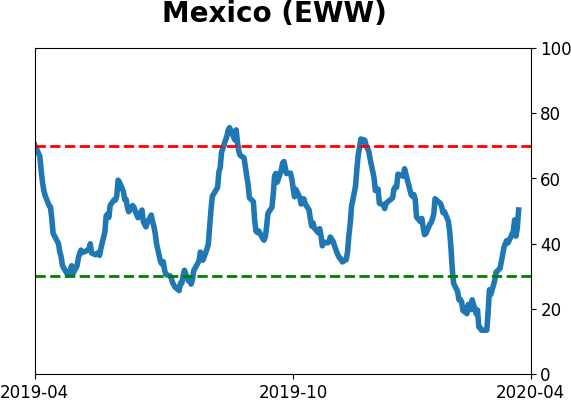
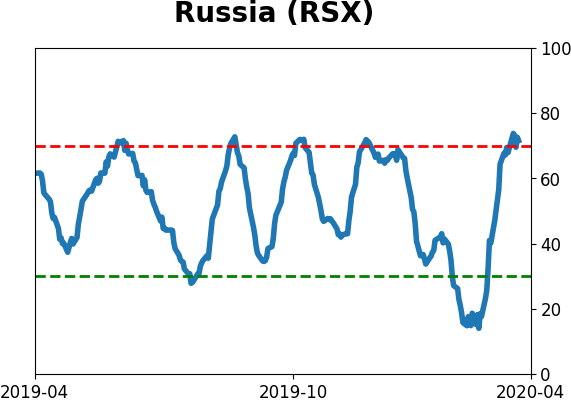
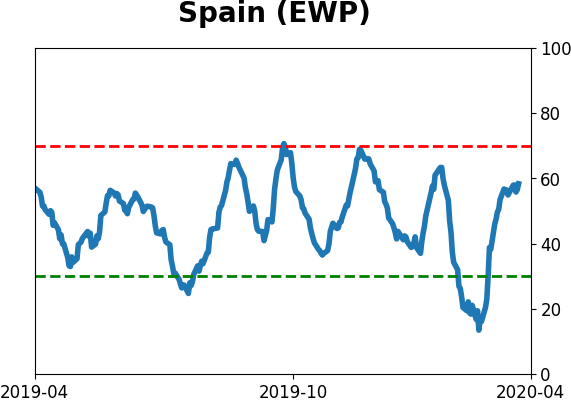
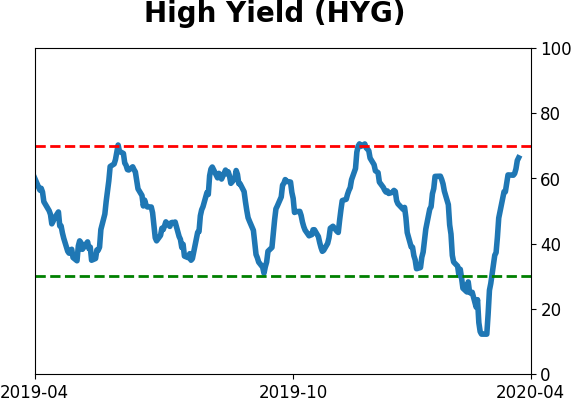
Sentiment Around The World
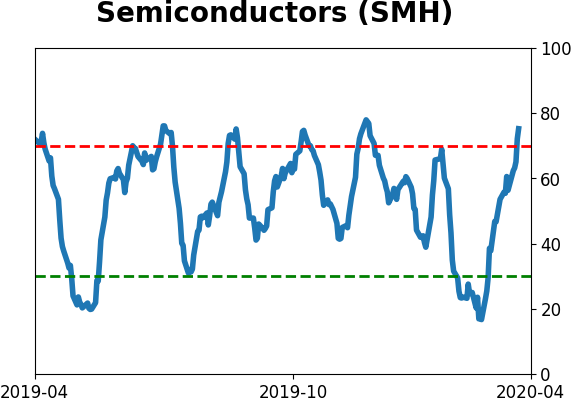
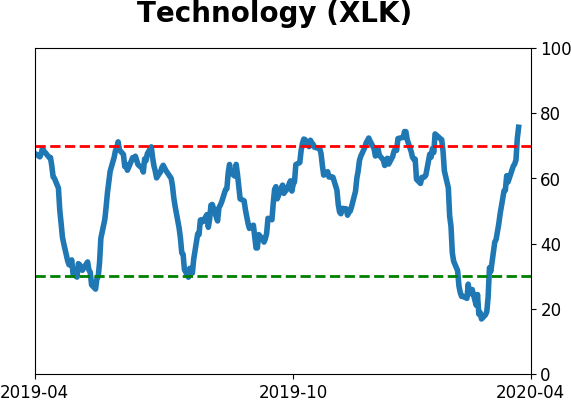
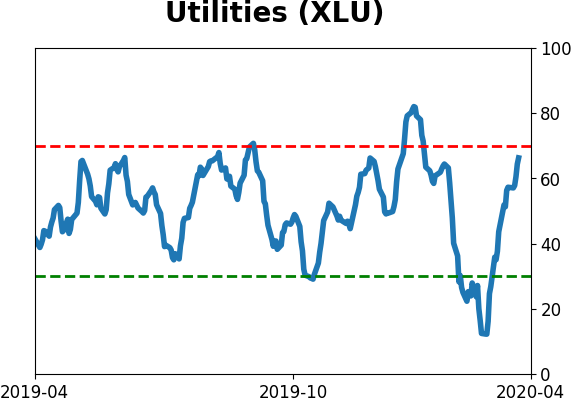
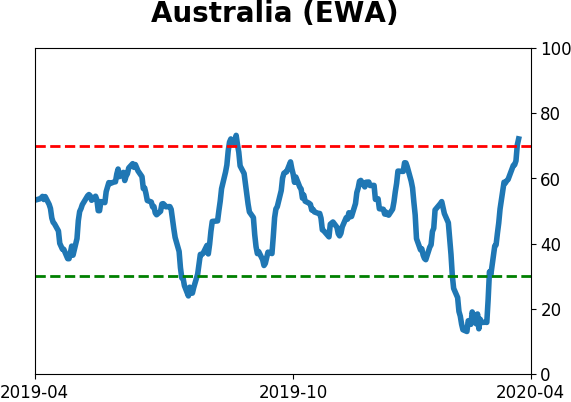
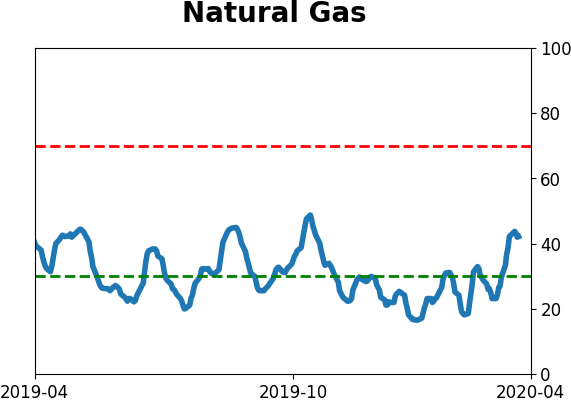
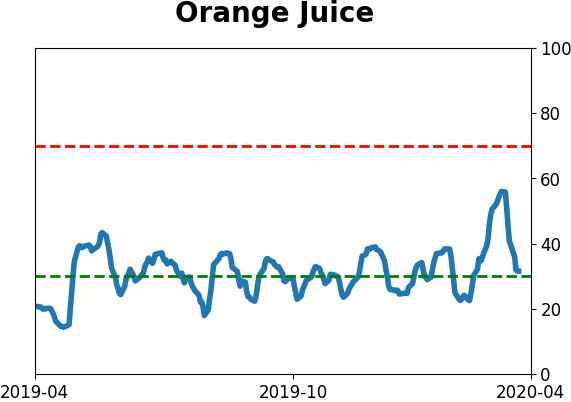
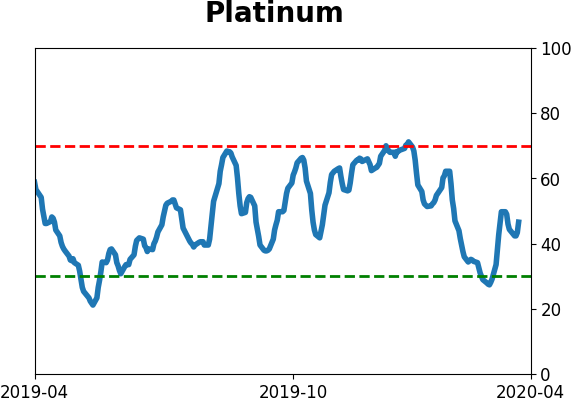
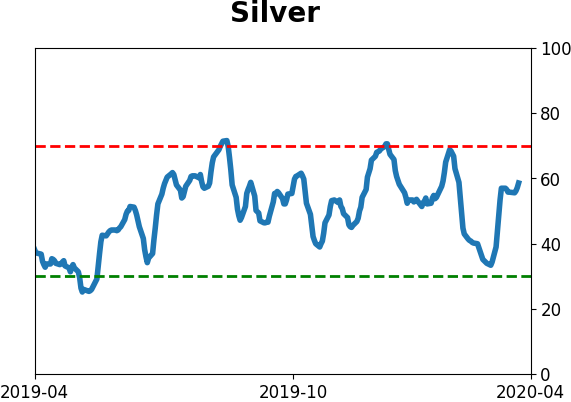
Optimism Index Thumbnails
|
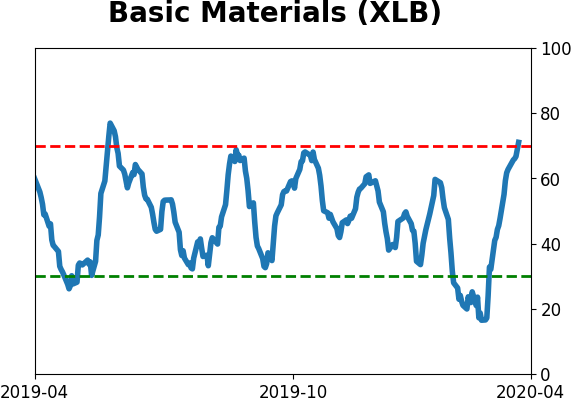
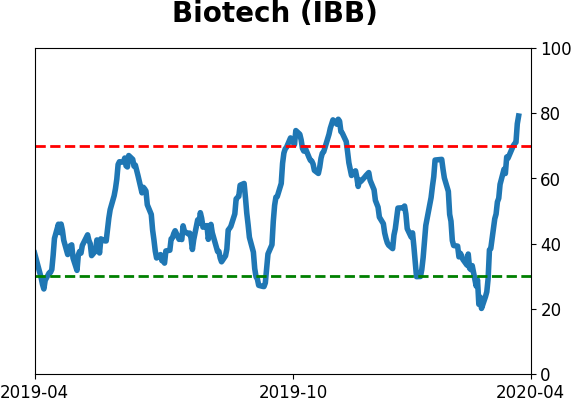
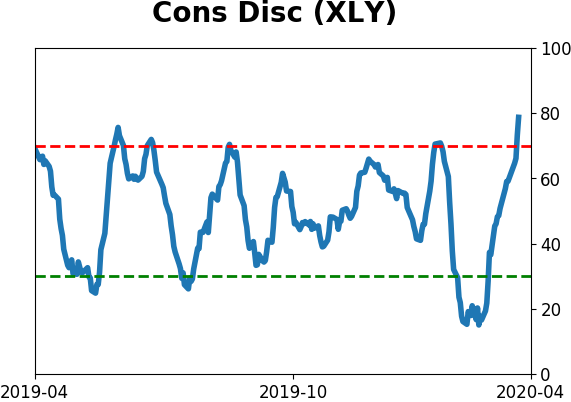
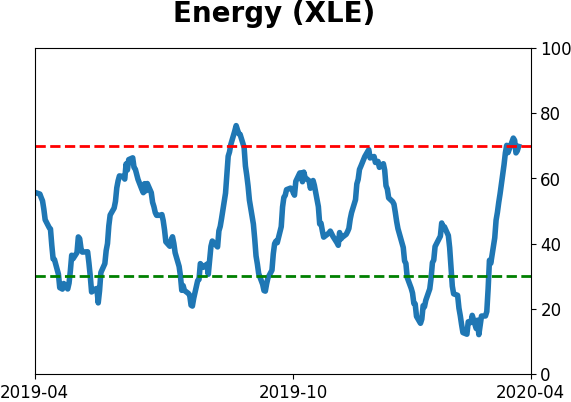
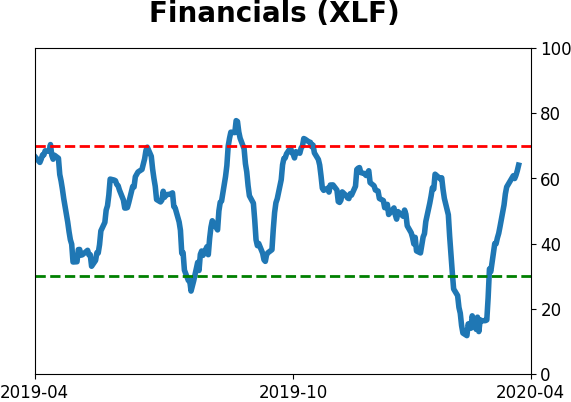
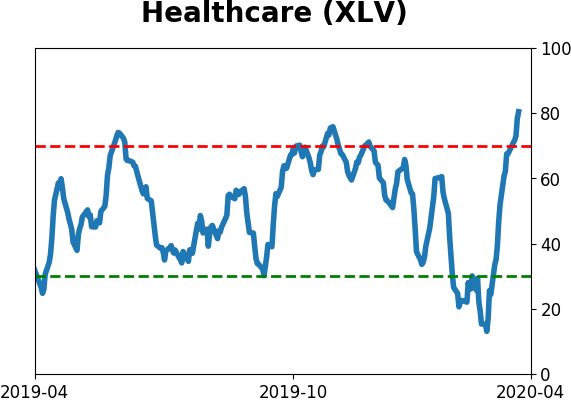
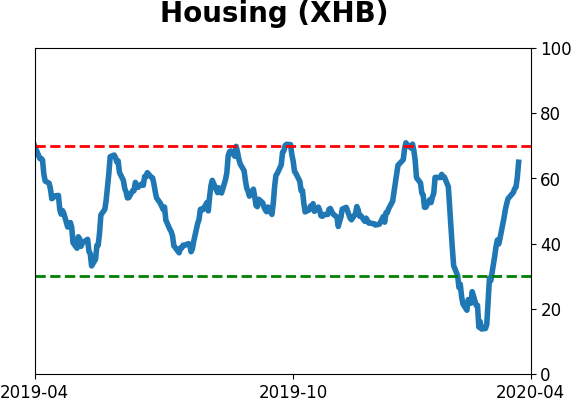
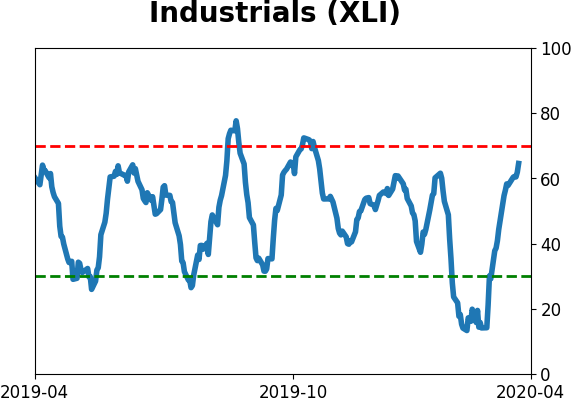
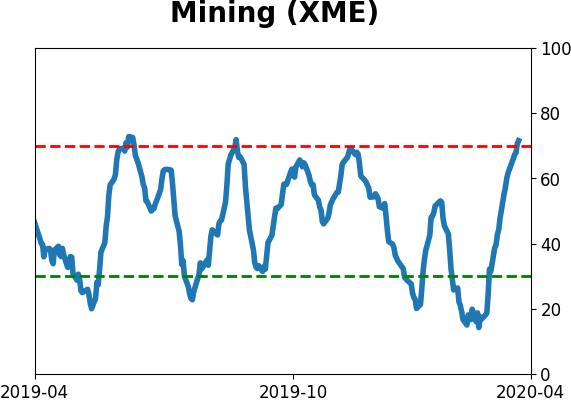
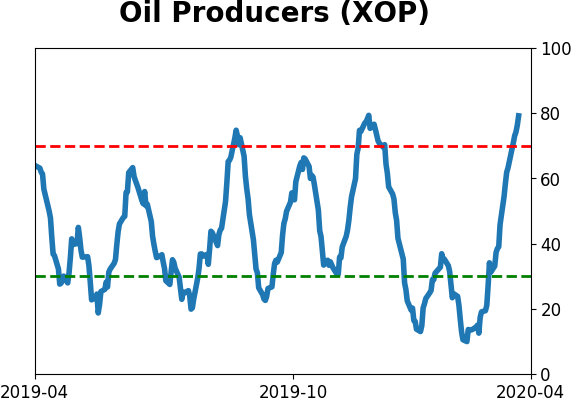
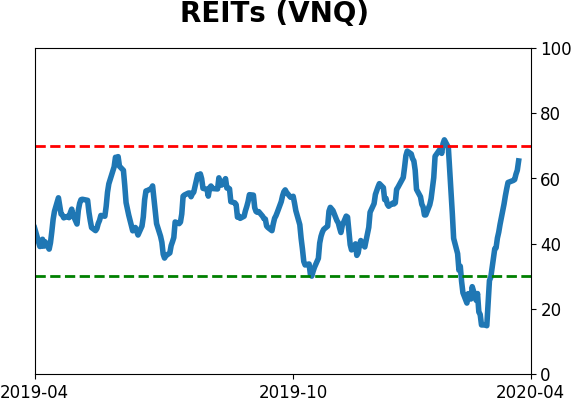
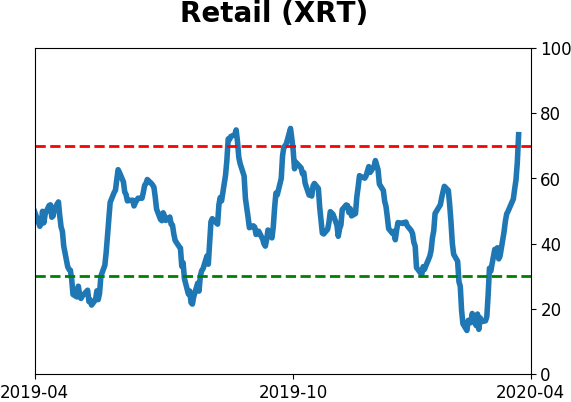
Sector ETF's - 10-Day Moving Average
|
|
|
Country ETF's - 10-Day Moving Average
|
|
|
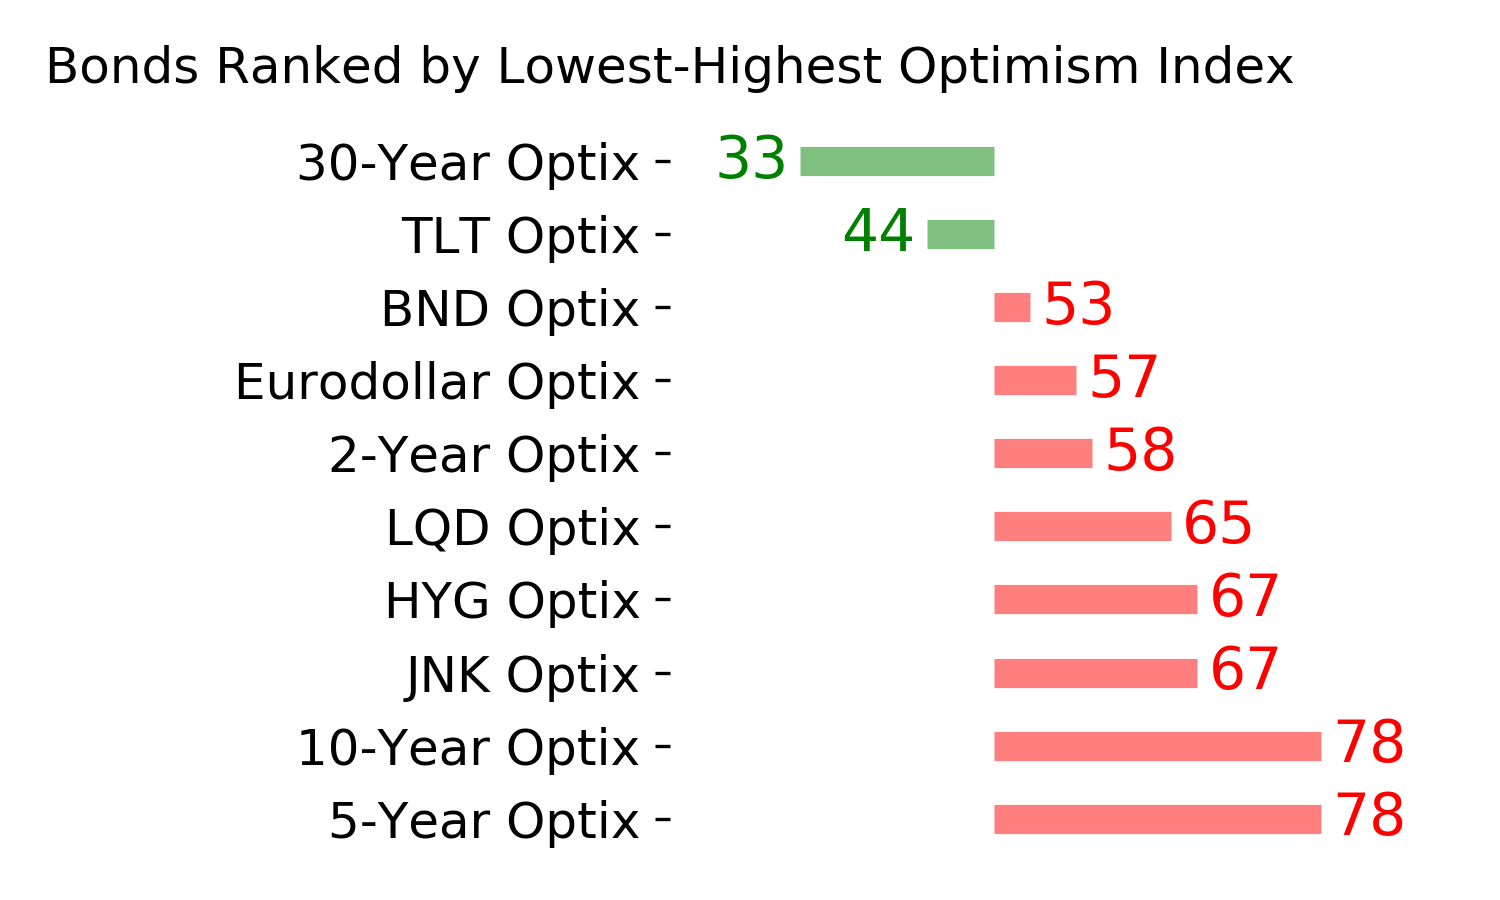
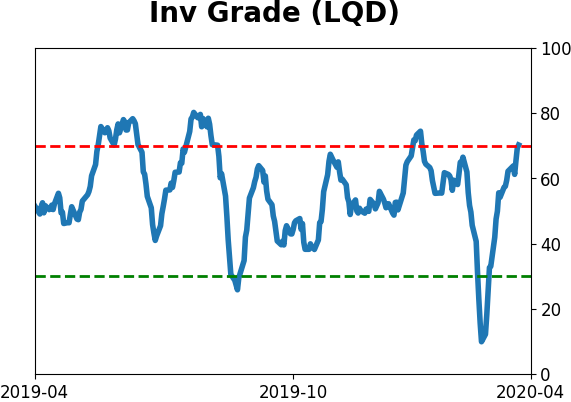
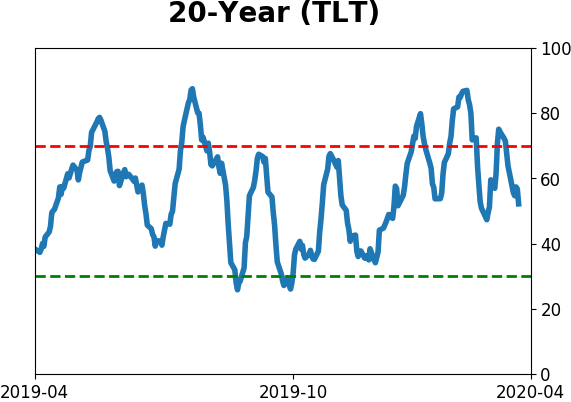
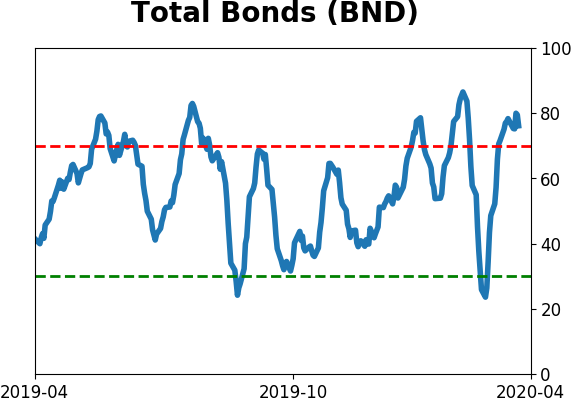
Bond ETF's - 10-Day Moving Average
|
|
|
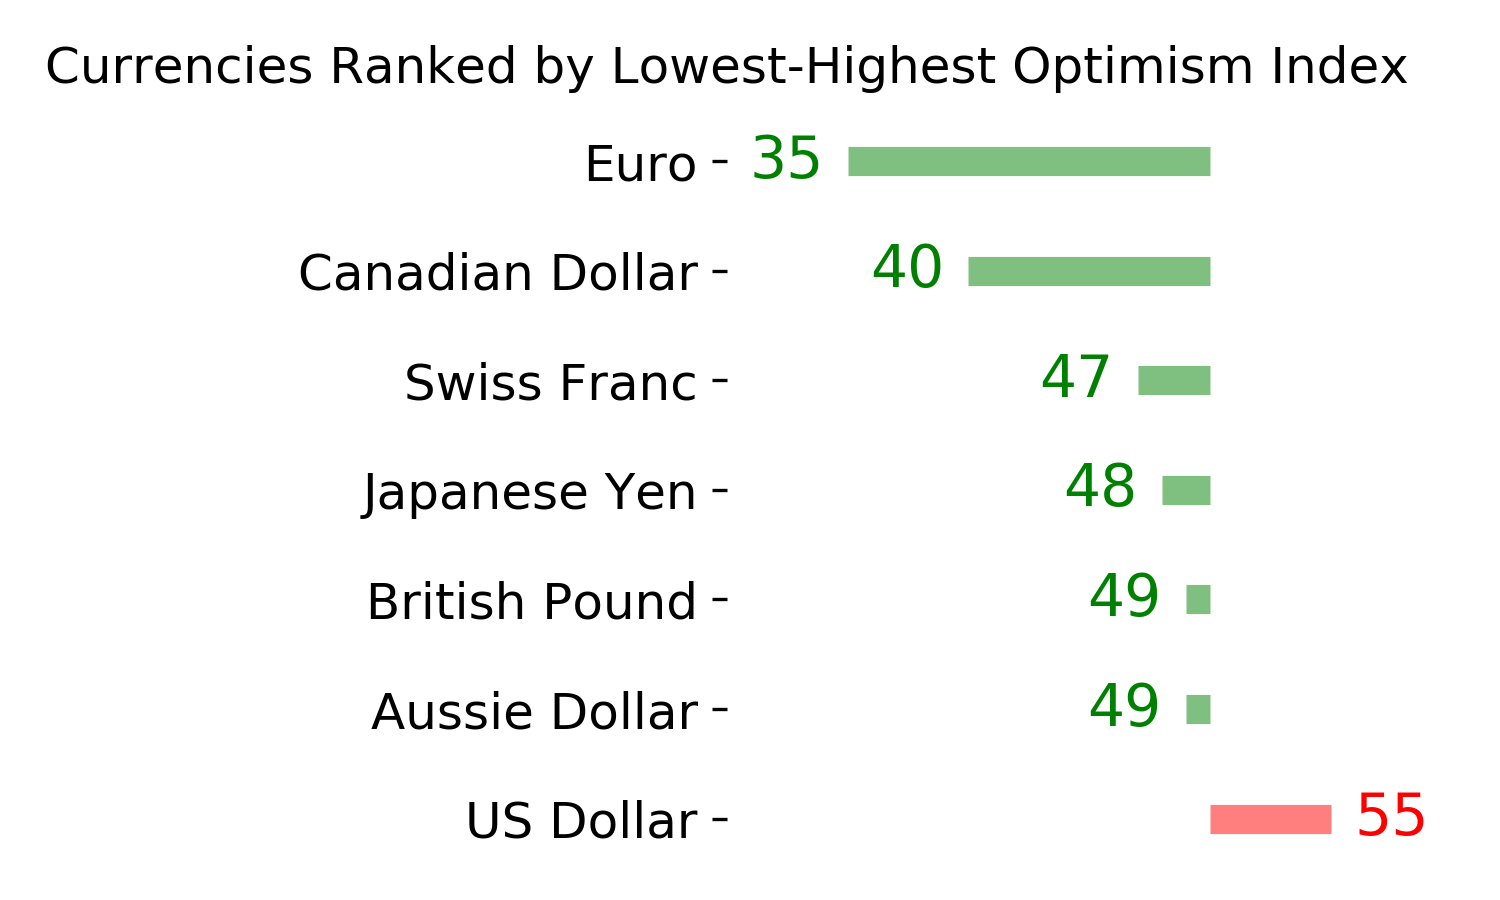
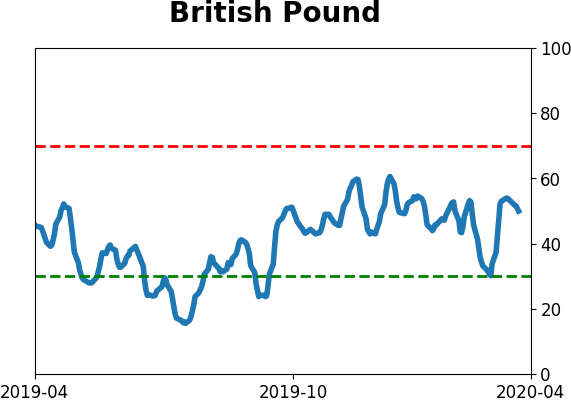
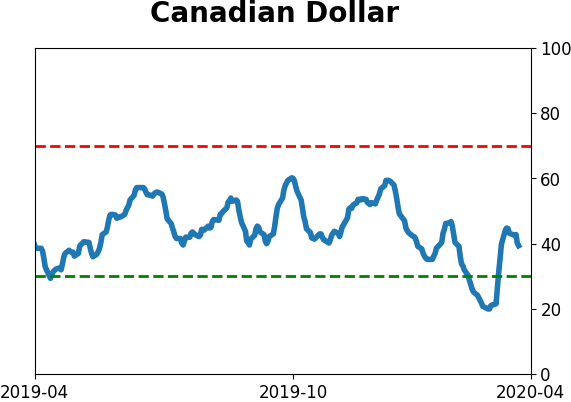
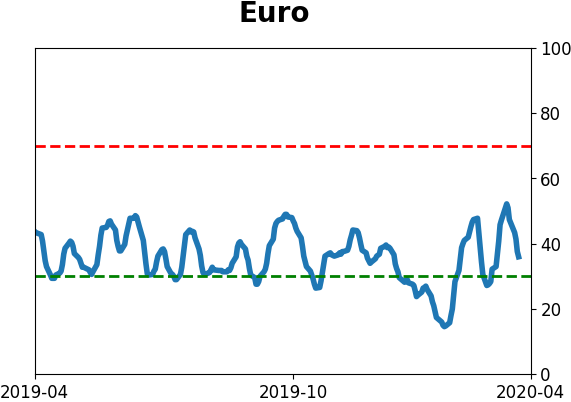
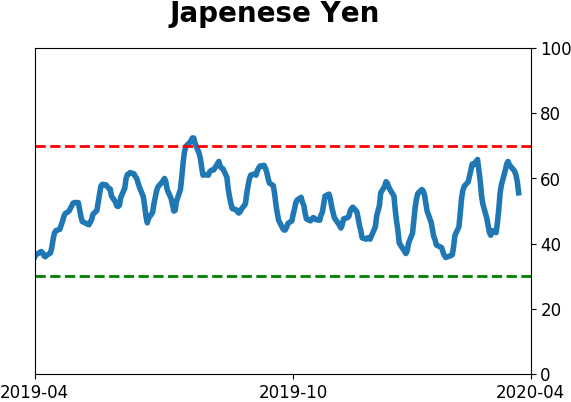
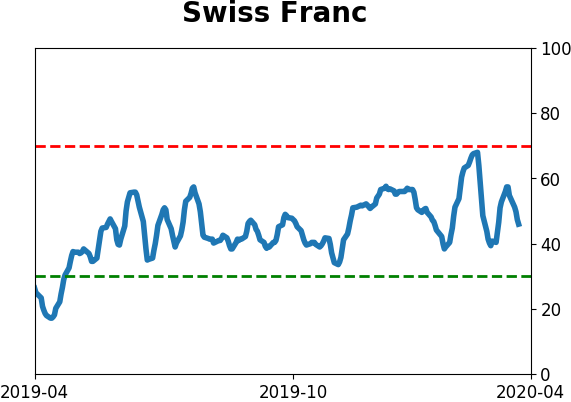
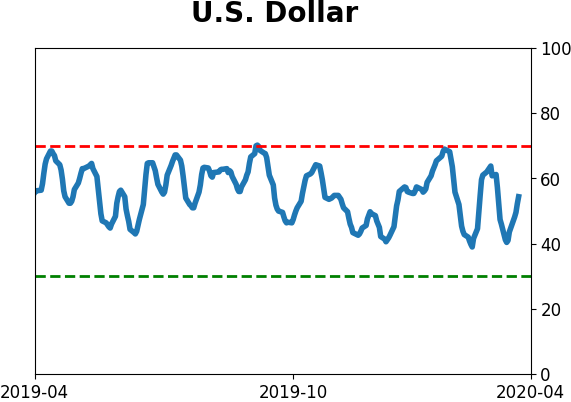
Currency ETF's - 5-Day Moving Average
|
|
|
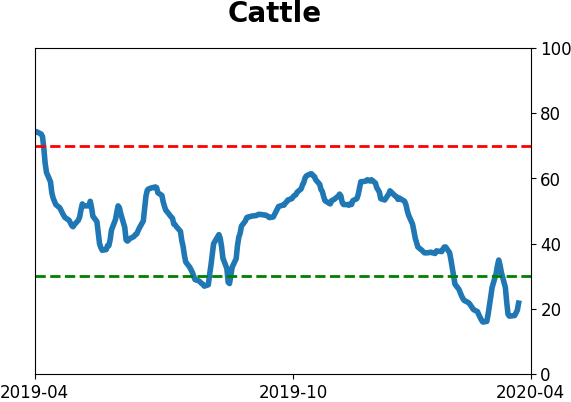
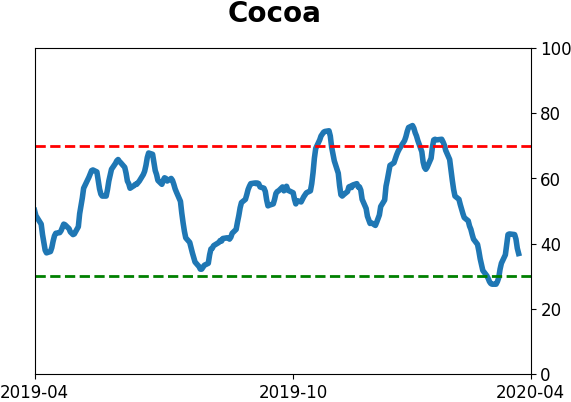
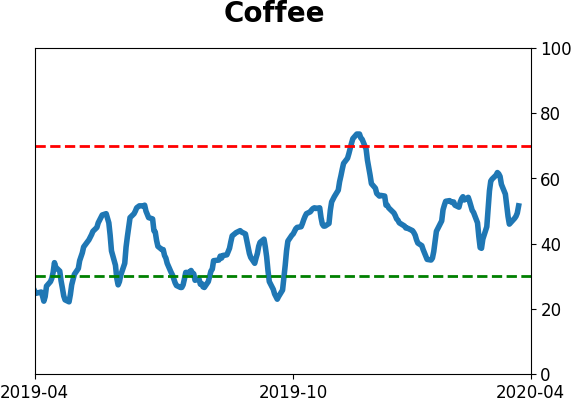
Commodity ETF's - 5-Day Moving Average
|
|