Headlines
|
|
An unequal rally:
Over the past month, stocks and indexes have rallied strongly. The version of the S&P 500 that weights stocks equally, though, has underperformed the version that weights them based on market capitalization. The ratio between them just hit a new low.
Mom-and-pop stay on the sidelines:
Individual investors in the AAII survey have shown a lot of restraint despite the surge in stocks over the past month. For the first time ever, a 10% rally in stocks was not enough to get a majority of investors optimistic.
Low flow: Thanks in part to huge volume in General Electric, the S&P 500 closed up more than 0.5%, yet more than 70% of NYSE volume flowed into declining securities. The only dates since 1962 when the S&P was up that much with an Up Volume Ratio below 30% were 2007-11-27 and 2008-10-23 when banks were getting hammered. There were 31 days when the S&P was up at least 0.5% and Up Volume was less than 50%, and there was some weakness going forward, with gains over the next month only 43% of the time.
|
Smart / Dumb Money Confidence
|
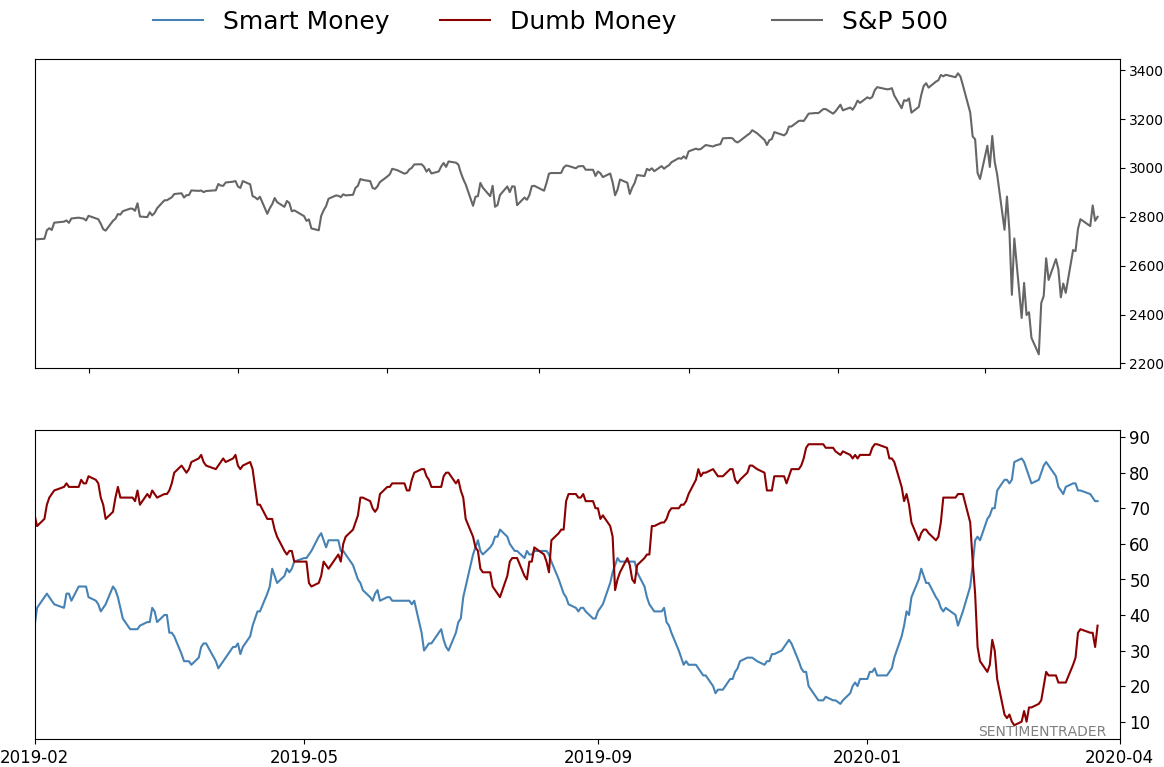
Smart Money Confidence: 72%
Dumb Money Confidence: 37%
|
|
Risk Levels
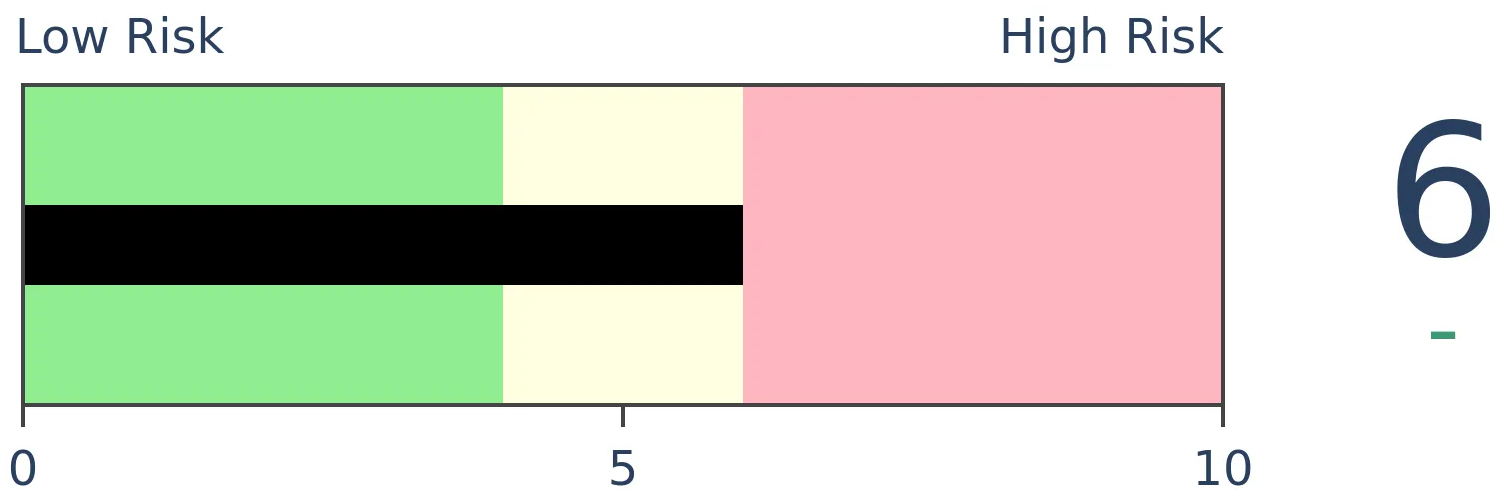
Stocks Short-Term
|
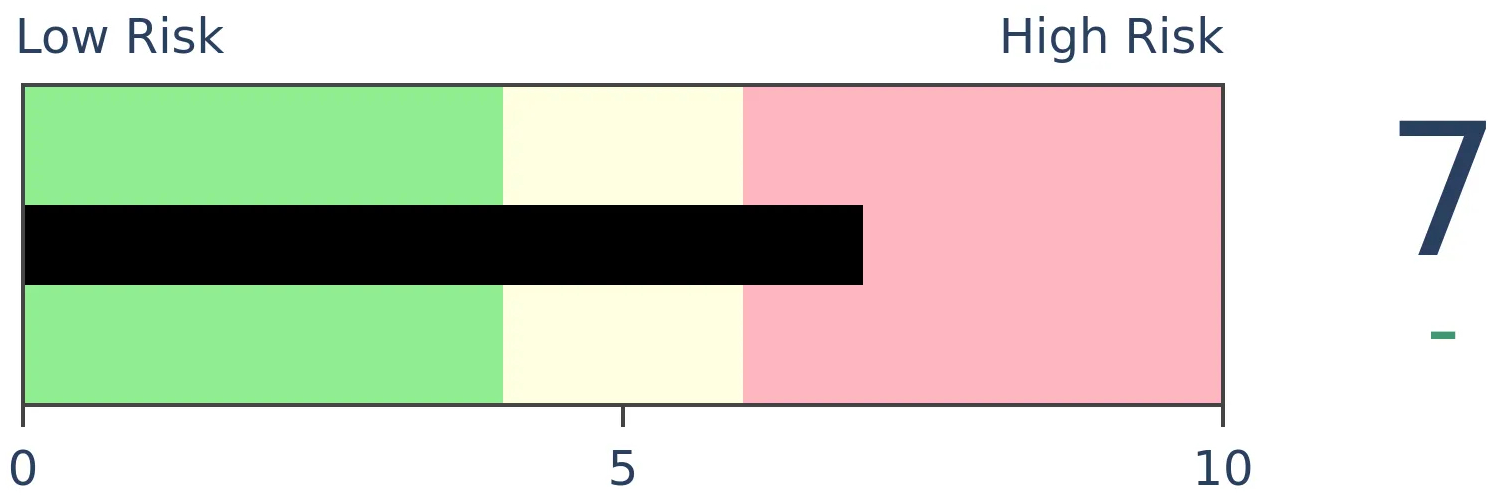
Stocks Medium-Term
|
|
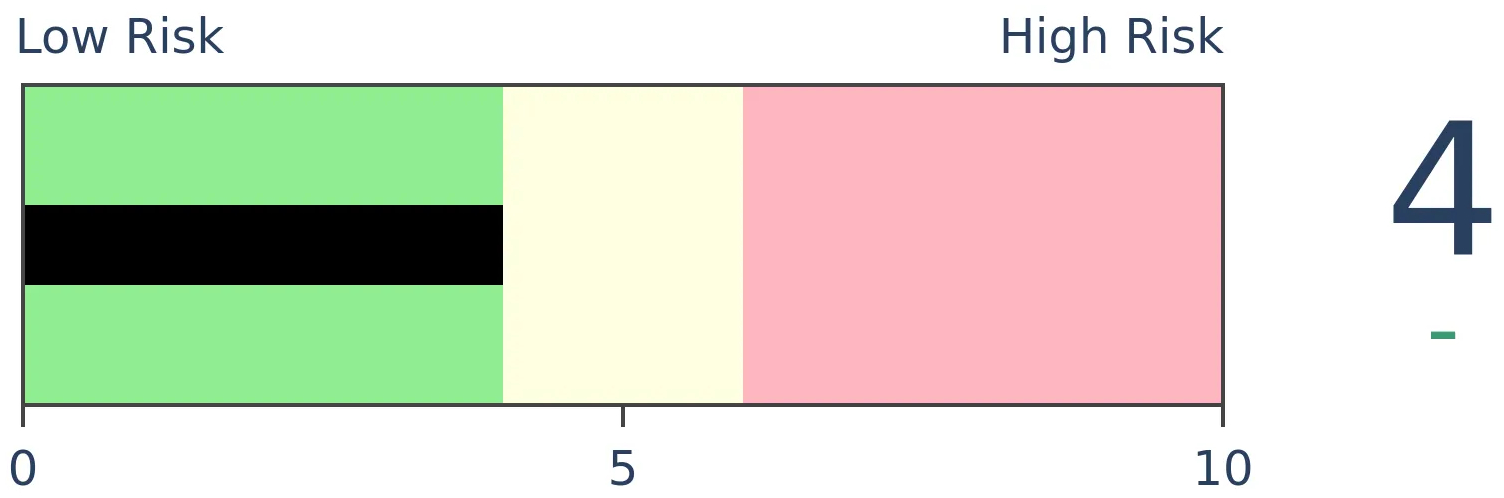
Bonds

|
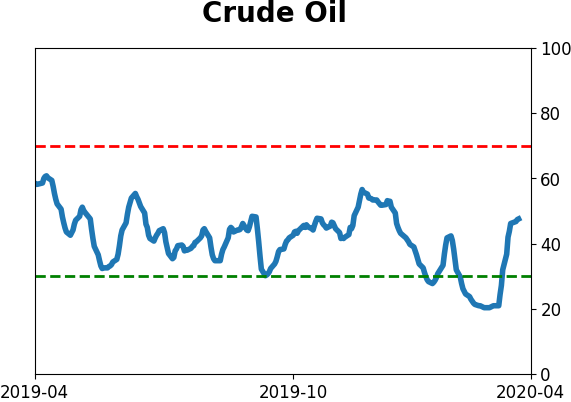
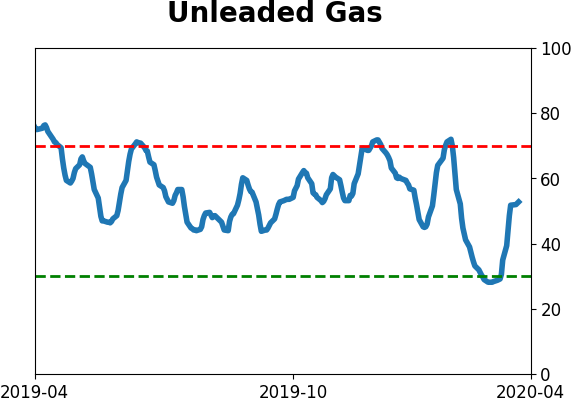
Crude Oil
|
|
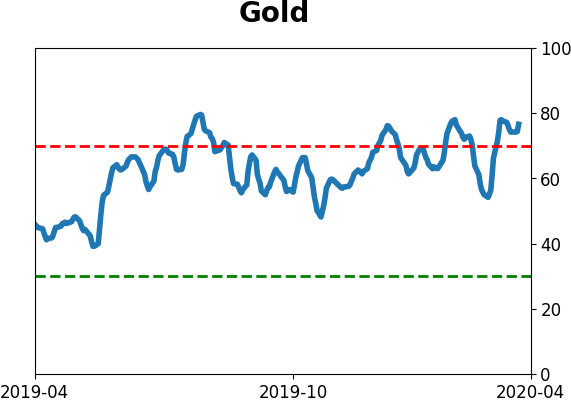
Gold

|
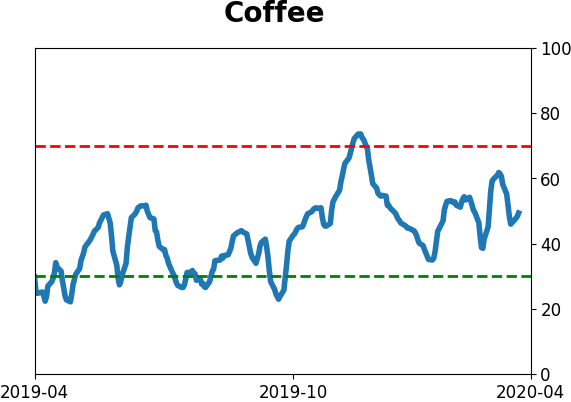
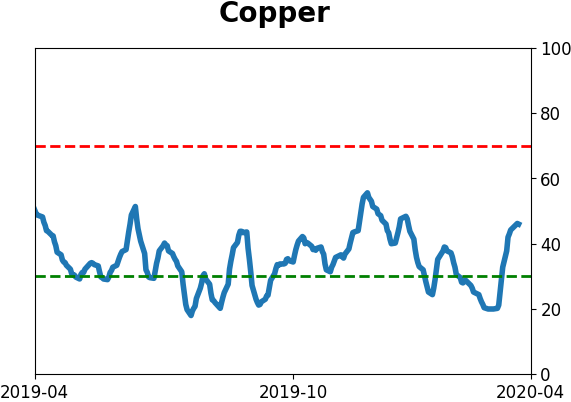
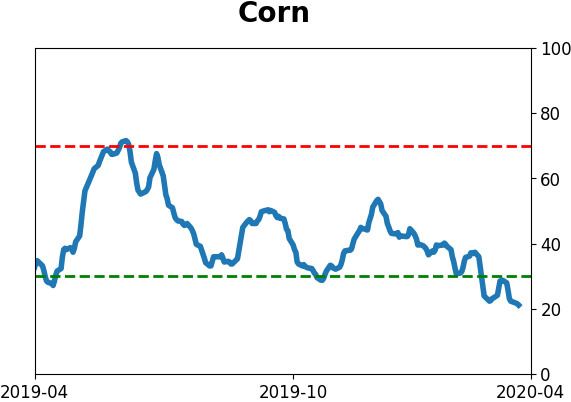
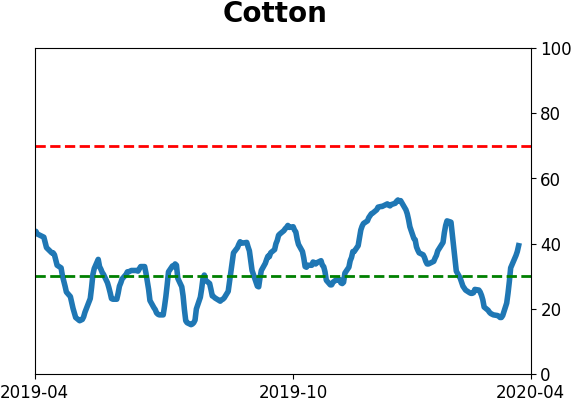
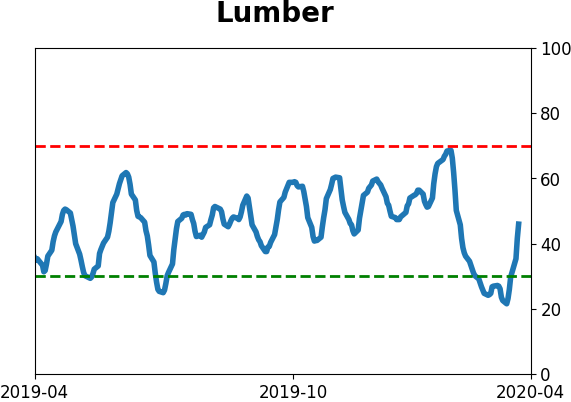
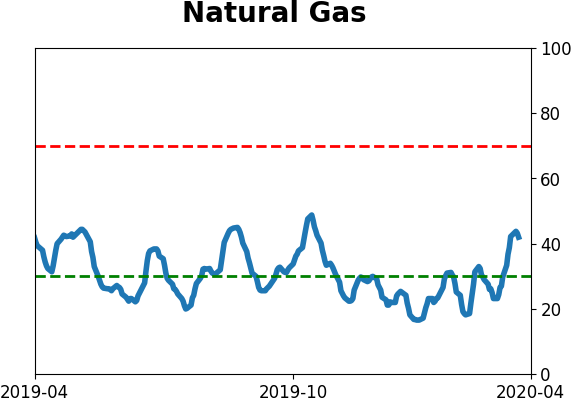
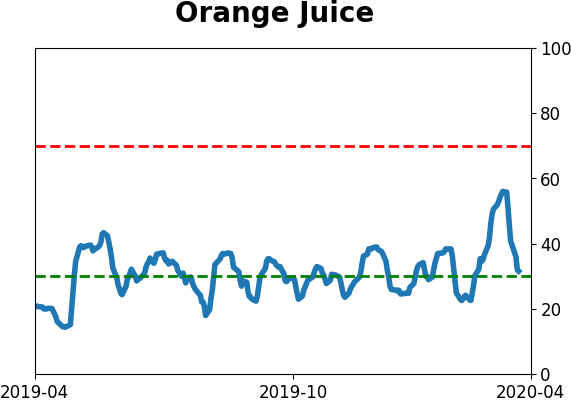
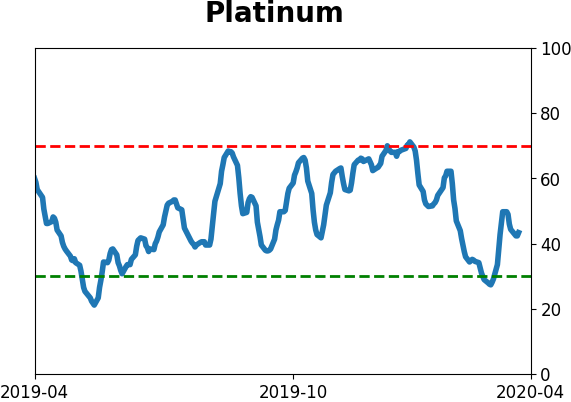
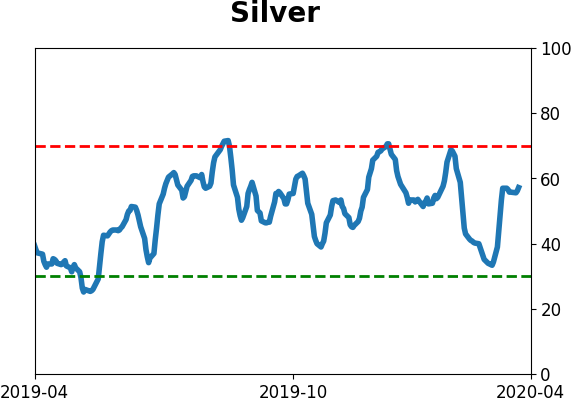
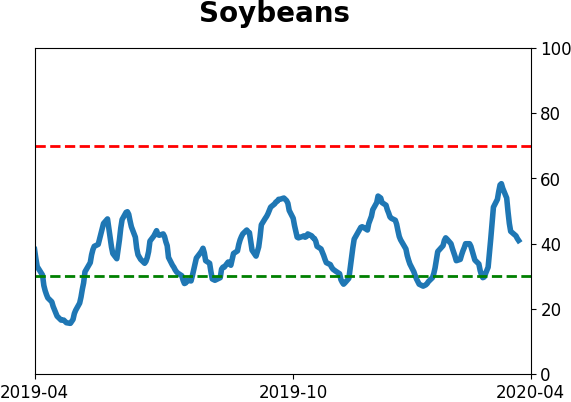
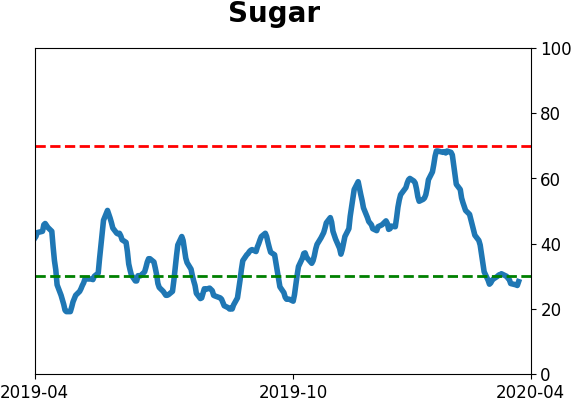
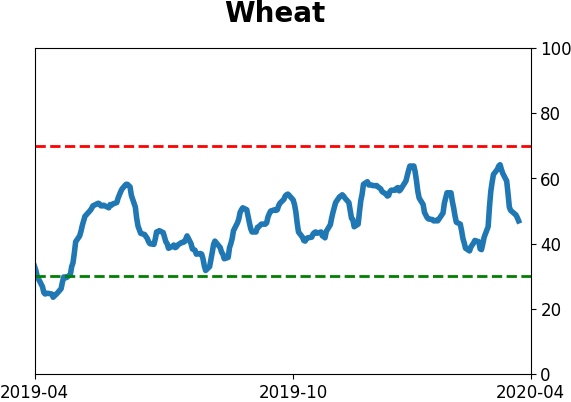
Agriculture
|
|
Research
BOTTOM LINE
Over the past month, stocks and indexes have rallied strongly. The version of the S&P 500 that weights stocks equally, though, has underperformed the version that weights them based on market capitalization. The ratio between them just hit a new low.
FORECAST / TIMEFRAME
None
|
The rally off the March lows has been impressive, historic even. There's quite a bit to like about it, namely the retracement of the decline and multiple breadth thrusts.
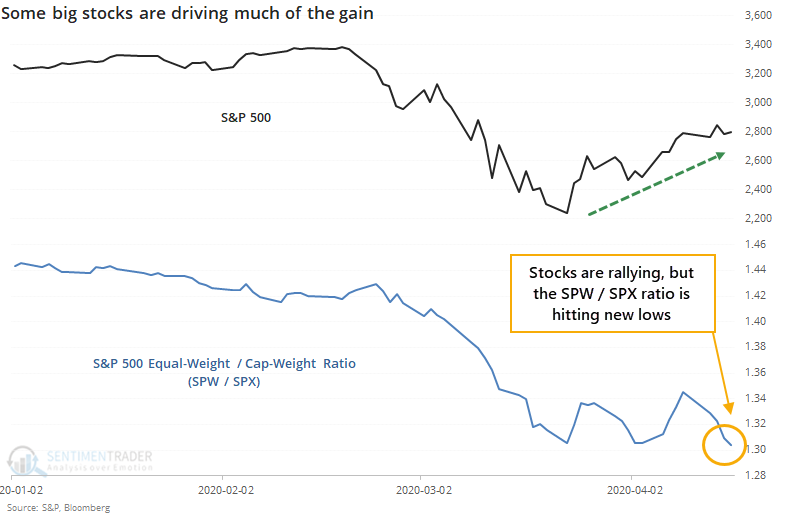
There's a lot not to like, too, which we don't usually see when enjoying a powerful move like this. Outside of the stock market, signs of a thaw have been hit-or-miss, and there's been a lot of odd activity. That can happen when relatively few stocks are driving the market.
That seems like an odd thing to say since there have been multiple days with 90% of more of securities advancing. But the biggest stocks have had a major impact on indexes like the S&P 500.
Multiple people have pointed out that even while the S&P 500 index that everyone watches hit its highest level in a month, the equal-weight version of the index hasn't quite kept up. The ratio between the two just hit a new low.
We looked at this in January. While there were some major reasons to be worried about stocks, this ratio was not one of them. About the only consistent thing it suggested was that the equal-weight version of the index should keep under-performing.
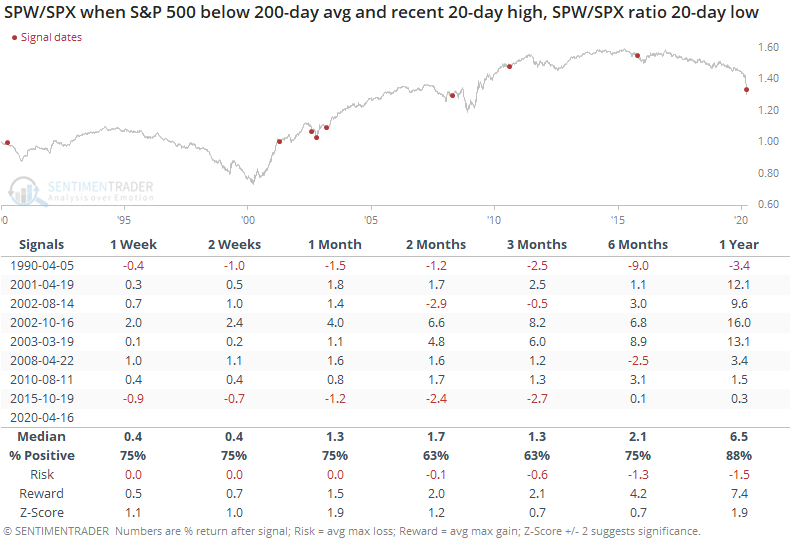
Below, we can see the times most similar to now, when the S&P 500 cap-weighted index was trading below its 200-day average but hit a 20-day high in the past three sessions, and the ratio between the equal-weight (SPW) and cap-weight (SPX) indexes hit a 20-day low.
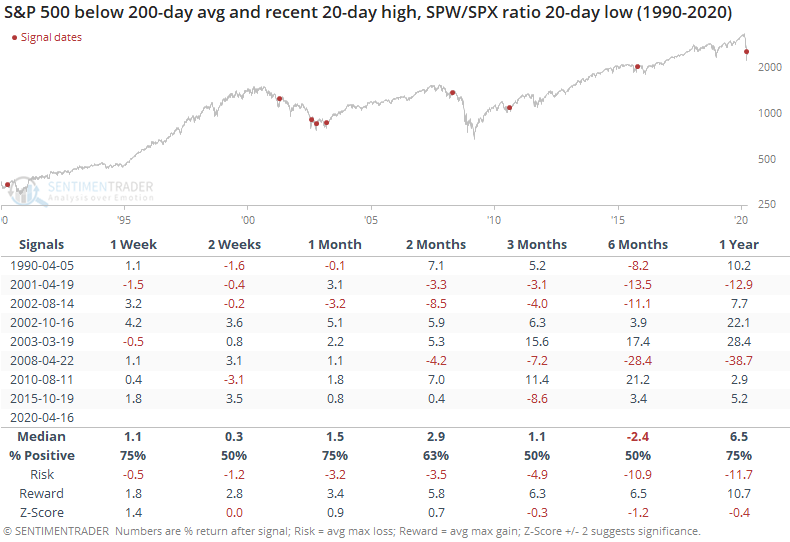
Not much to go on there, with mixed returns across time frames. Maybe a bit weak longer-term.
For the equal-weight index, it was about the same story.
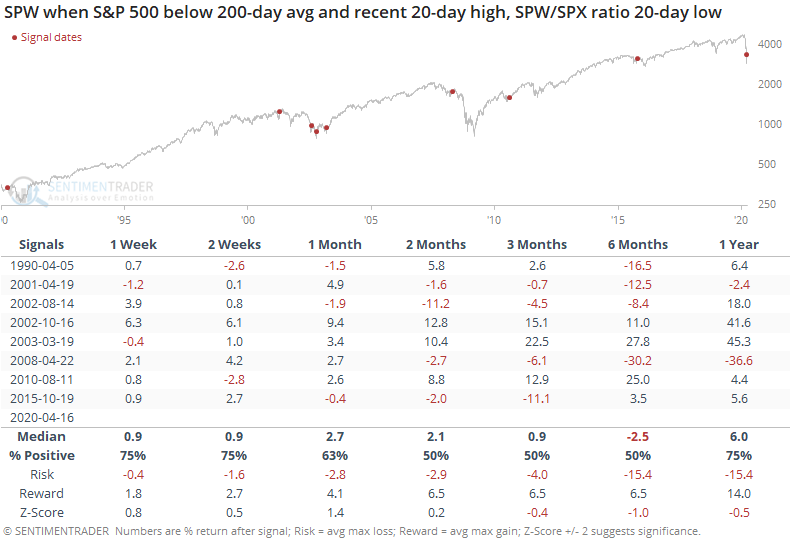
For the ratio, though, it was more positive. It was positive across most time frames, meaning the equal-weight index performed better than the capitalization-weight index.
Investors have been looking for this series to mean-revert for a long time. The equal-weight index has under-performed for about 5 years, nearing the previous record from the late 1990s.
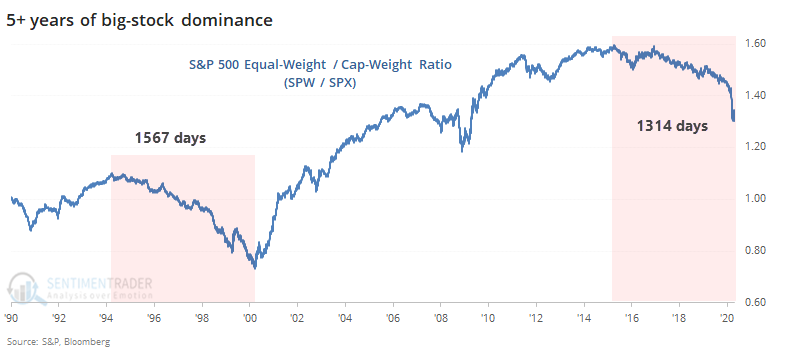
There isn't much of a catalyst for it to start now, though some of the "trillion-dollar stock club" fetishes from the start of this year are a compelling anecdotal sign. Usually, when we look at ratios like this, they tend to favor an extension of the trend, but that wasn't the case this time. Maybe that 5-year trend is finally nearing some exhaustion.
BOTTOM LINE
Individual investors in the AAII survey have shown a lot of restraint despite the surge in stocks over the past month. For the first time ever, a 10% rally in stocks was not enough to get a majority of investors optimistic.
FORECAST / TIMEFRAME
None
|
There is a chorus of opinion that stocks couldn't possibly have formed an important bottom in March because we never saw peak pessimism, whatever that means. Usually, as evidence, the proclamations include a chart of some random, isolated sentiment indicator.
No single indicator is perfect, and there is usually something that doesn't fit with the others. One of the measures that didn't really show much pessimism near the low in March was the survey of individual investors from AAII. It has a lot of weaknesses as the arbiter of "sentiment," but gets a lot of attention in the media as a reflection of mom-and-pop attitudes.
During March, the Bull Ratio (Bulls / (Bulls + Bears)) fell below 37%, enough to show some pessimism but not to the extremes seen at most prior lows. But here's the curious thing - despite a massive rally in stocks, folks are still pessimistic.
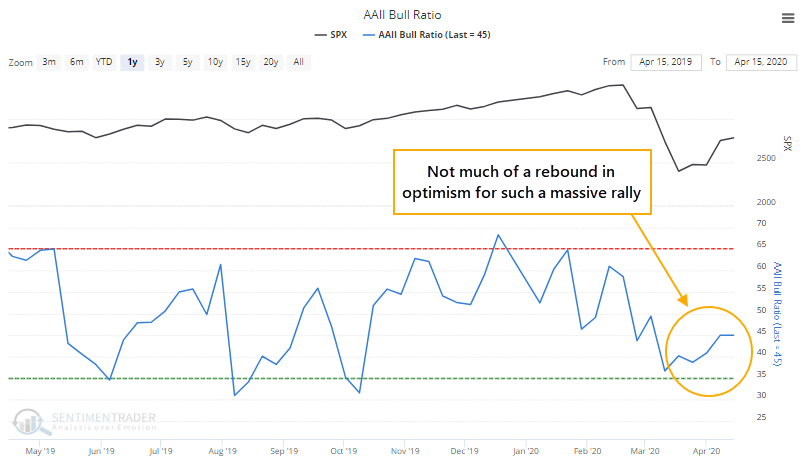
For the first time in the survey's history, dating to 1987, the S&P 500 rallied more than 10% over the past 4 weeks, and the Bull Ratio is still below 50%. Also for the first time, the S&P rallied more than 10% and the Bull Ratio increased by less than 5%. There is usually much more of a correlation between price gains over the past 4 weeks and the Bull Ratio.
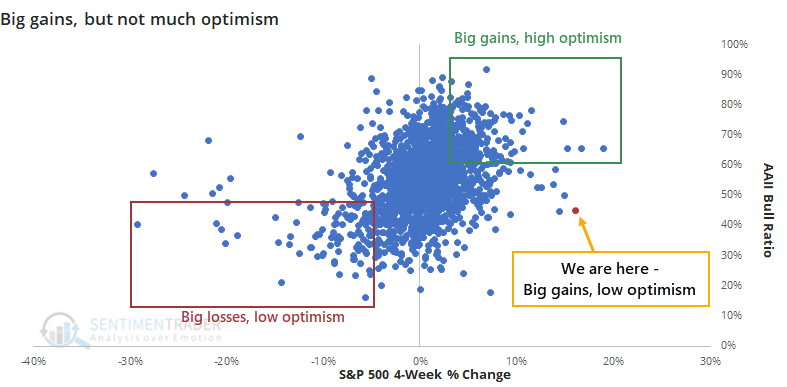
We should not automatically assume this is a good thing. A rising market needs rising optimism, as long as it doesn't get out of hand. So let's relax the parameters a bit and see if we get any precedents.
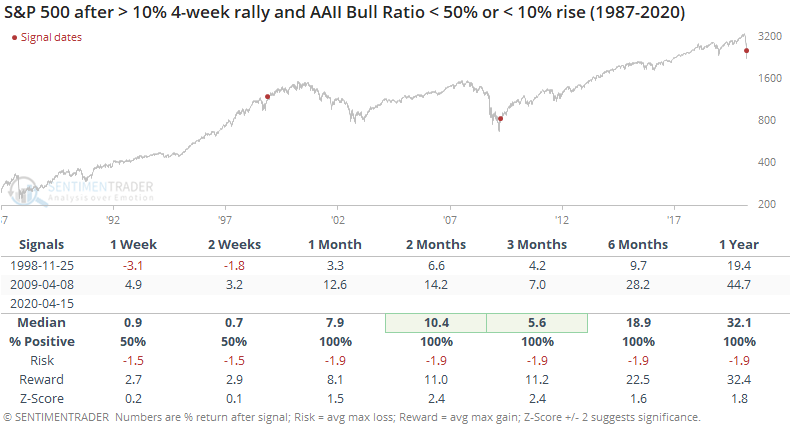
There were only two weeks when conditions were even remotely similar. In the four weeks leading up to late November 1998, stocks surged but the AAII survey showed only a modest rise in the Bull Ratio. And as stocks bottomed in 2009, the initial surge was greeted with a collective shrug of the shoulders by these investors, as the Bull Ratio stayed below 50%. Both led to large gains going forward.
If we really relax the parameters, we can look at 4-week rallies of at least 5% from a low, looking for times with the least amount of optimism from individual investors.
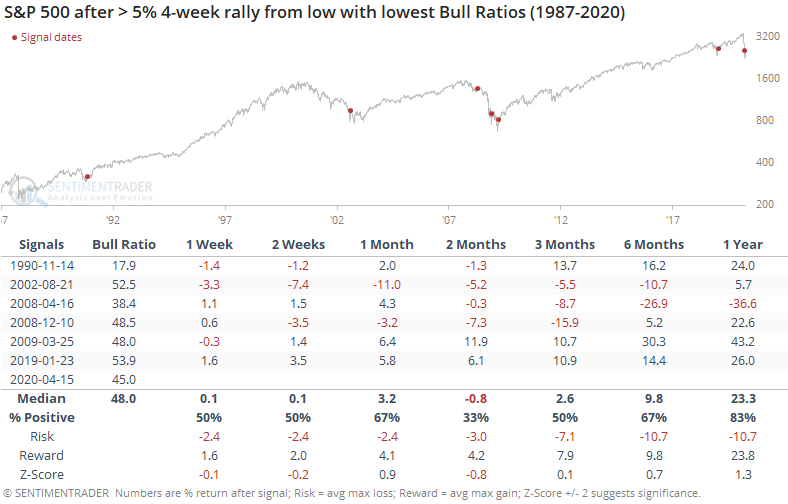
Those led to some choppy action over the next few months as stocks tried to find their footing, and it was a woeful signal early in 2008, but otherwise, they preceded mostly positive longer-term returns.
We can contrast this to those rallies that saw the biggest jumps in optimism from these folks.
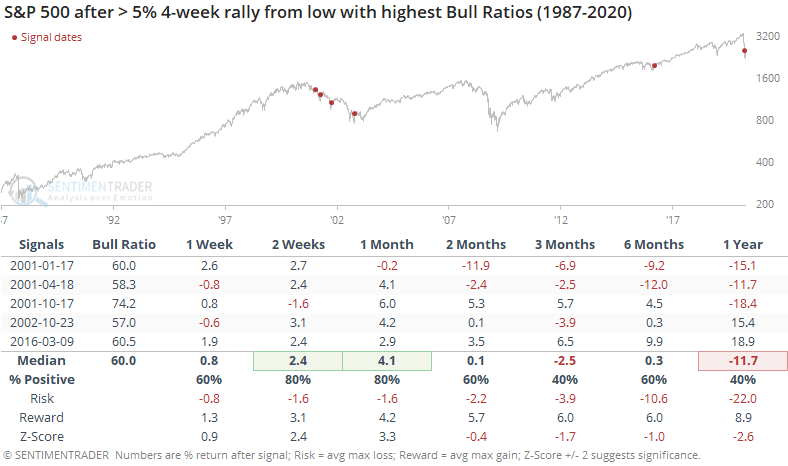
These showed better gains shorter-term, but worse longer-term returns as they mostly triggered during false starts following the pricking of the internet bubble.
Even after this jump from the lows, the 5-week average of the Bull Ratio is still below 42%. The Backtest Engine shows mostly positive returns following such subdued optimism.
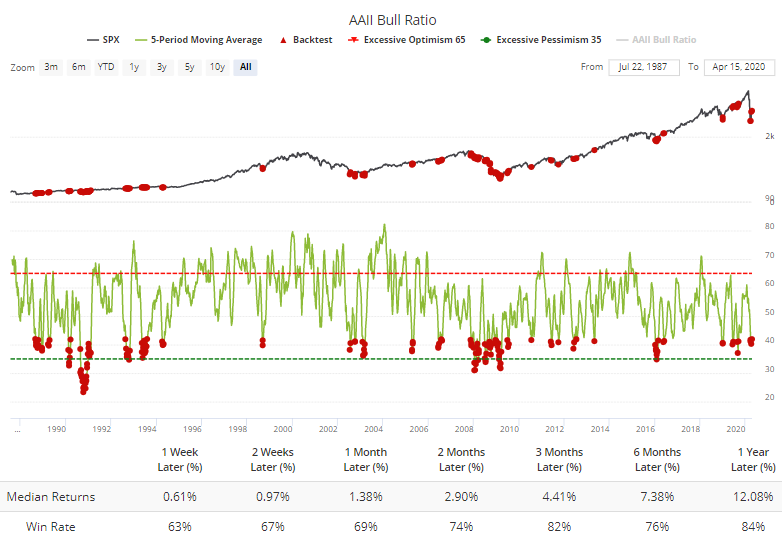
Over the next year, almost all of the losses were confined to the signals from the spring and summer of 2008. All of the other dates either showed gains or very small losses.
This survey never really reached a true extreme of pessimism, but it has been low enough, for long enough, that it has had a strong tendency to lead to medium- to long-term gains. The fact that individuals have not become much more bullish despite a huge rally isn't necessarily a positive, and shorter-term it's probably more of a negative than anything. But it's a sign that longer-term returns have a better probability of being positive.
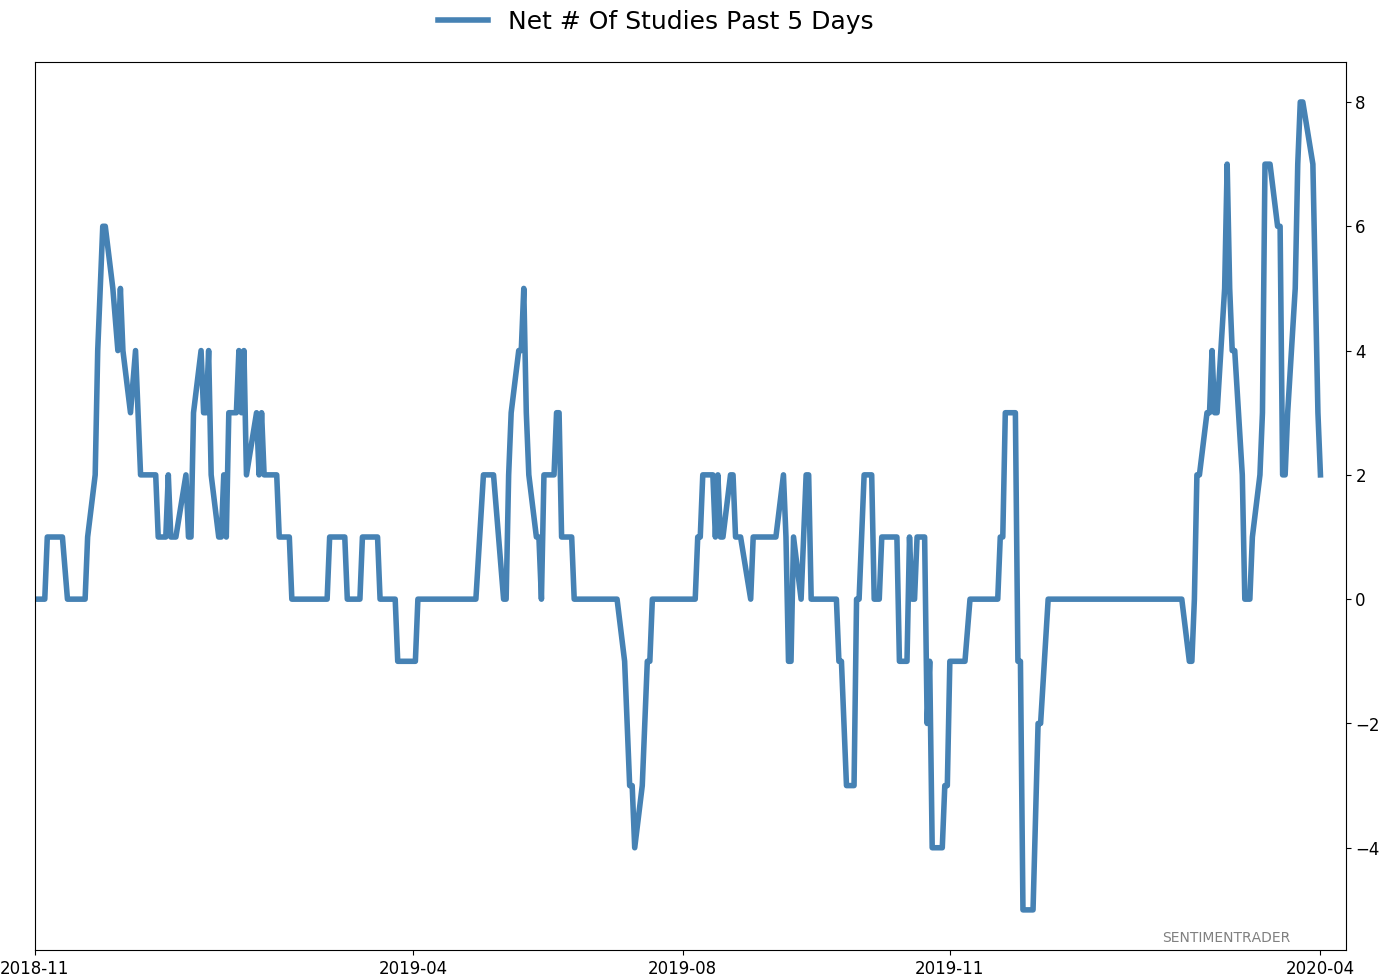
Active Studies
| Time Frame | Bullish | Bearish | | Short-Term | 0 | 2 | | Medium-Term | 11 | 0 | | Long-Term | 32 | 3 |
|
Indicators at Extremes
Portfolio
| Position | Weight % | Added / Reduced | Date | | Stocks | 73.2 | Added 31.3% | 2020-03-17 | | Bonds | 0.0 | Reduced 6.7% | 2020-02-28 | | Commodities | 5.5 | Added 2.4%
| 2020-02-28 | | Precious Metals | 0.0 | Reduced 3.6% | 2020-02-28 | | Special Situations | 0.0 | Reduced 31.9% | 2020-03-17 | | Cash | 21.3 | | |
|
Updates (Changes made today are underlined)
In the first months of the year, we saw manic trading activity. From big jumps in specific stocks to historic highs in retail trading activity to record highs in household confidence to almost unbelievable confidence among options traders. All of that has come amid a market where the average stock can’t keep up with their indexes. There were signs of waning momentum in stocks underlying the major averages, which started triggering technical warning signs in late January. The kinds of extremes we saw in December and January typically take months to wear away, but the type of selling in March went a long way toward getting there. When we place the kind of moves we saw into March 23 into the context of coming off an all-time high, there has been a high probability of a multi-month rebound. After stocks bottomed on the 23rd, they enjoyed a historic buying thrust and retraced a larger amount of the decline than "just a bear market rally" tends to. While other signs are mixed that panic is subsiding, those thrusts are the most encouraging sign we've seen in years. Shorter-term, there have been some warning signs popping up and our studies have stopped showing as positively skewed returns. If we drop below the lows of the past week, I'll likely reduce exposure.
RETURN YTD: -9.9% 2019: 12.6%, 2018: 0.6%, 2017: 3.8%, 2016: 17.1%, 2015: 9.2%, 2014: 14.5%, 2013: 2.2%, 2012: 10.8%, 2011: 16.5%, 2010: 15.3%, 2009: 23.9%, 2008: 16.2%, 2007: 7.8%
|
|
Phase Table
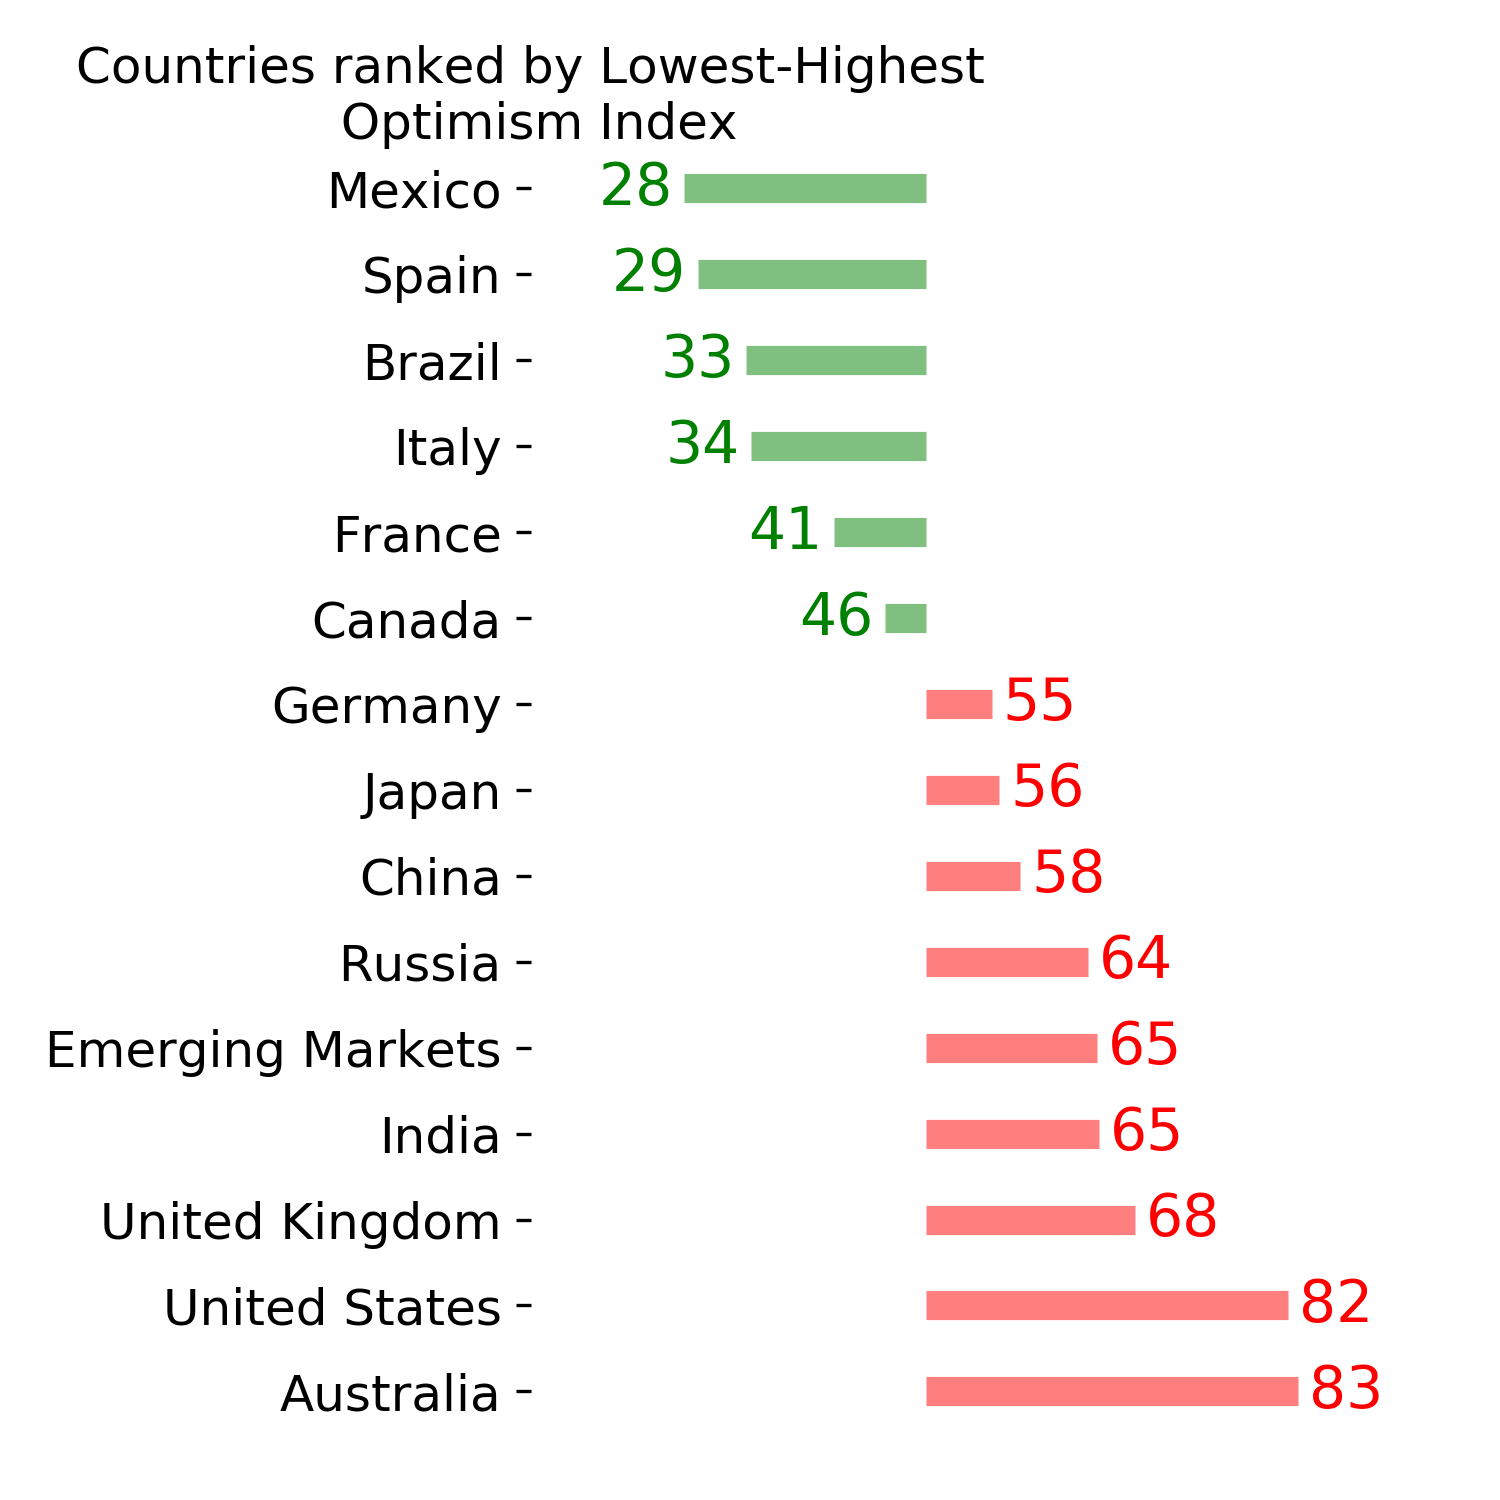
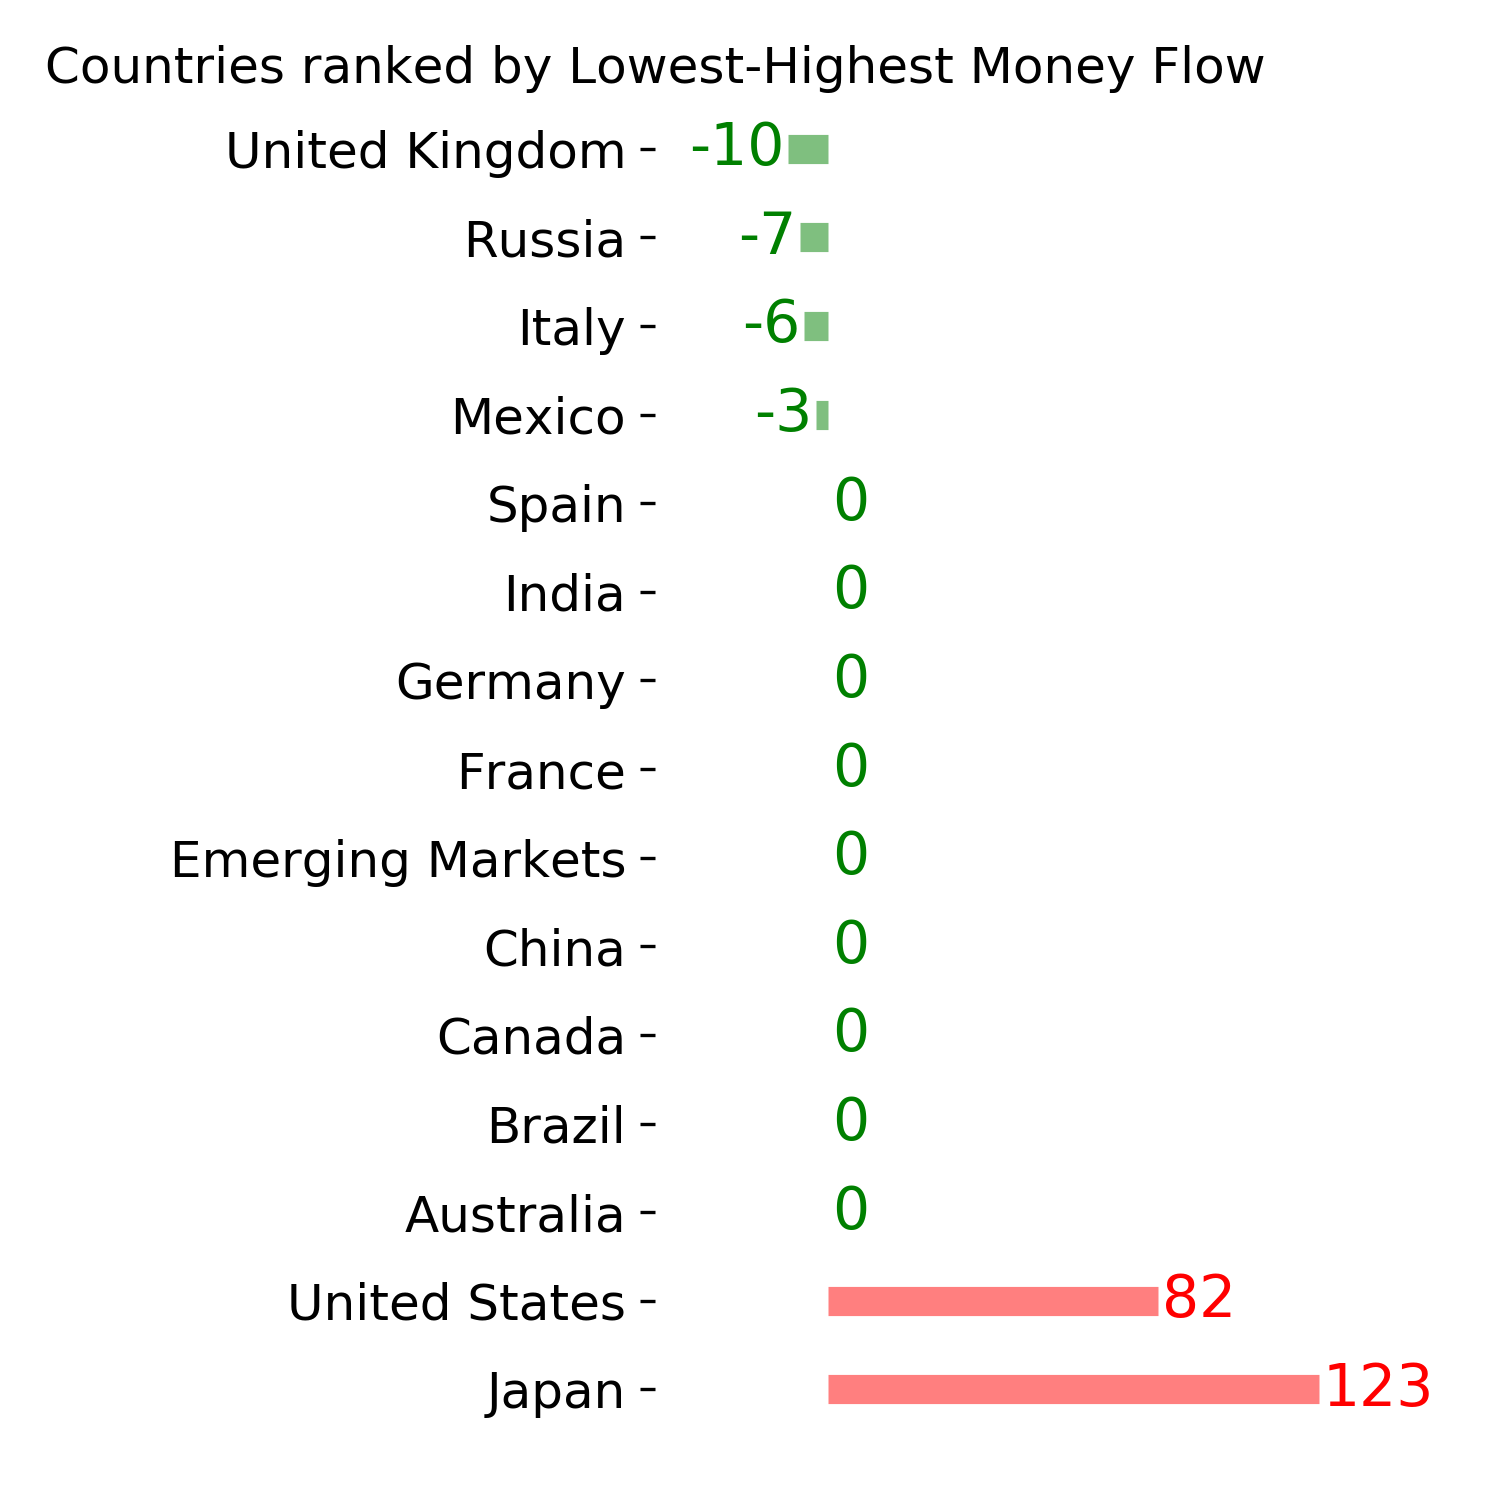
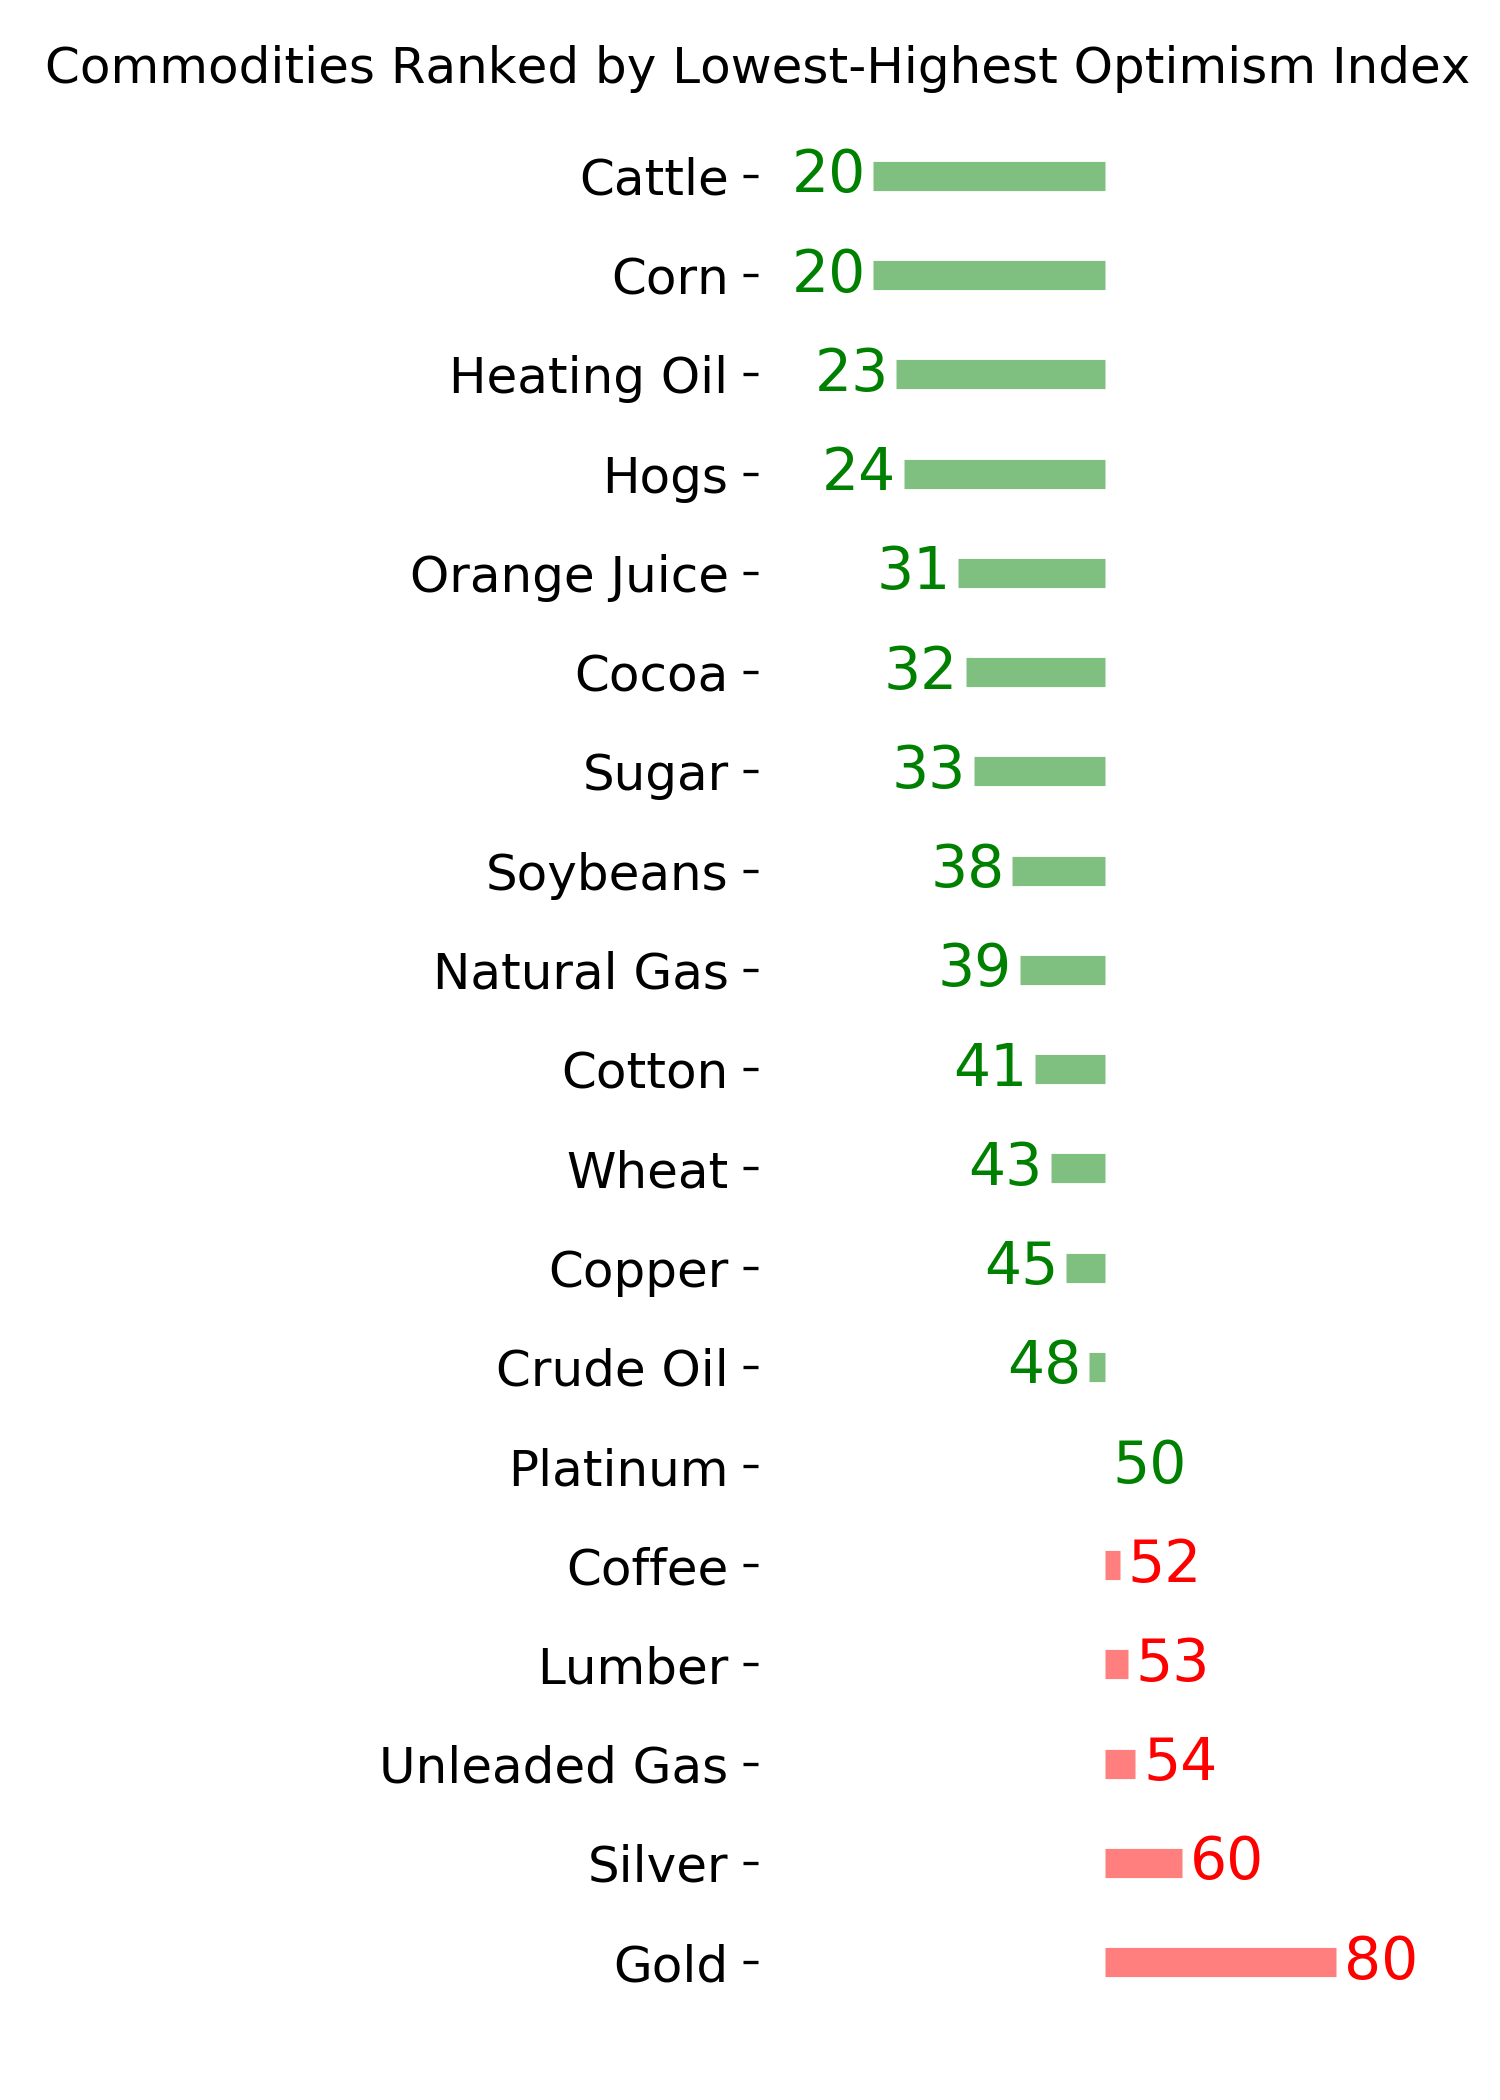
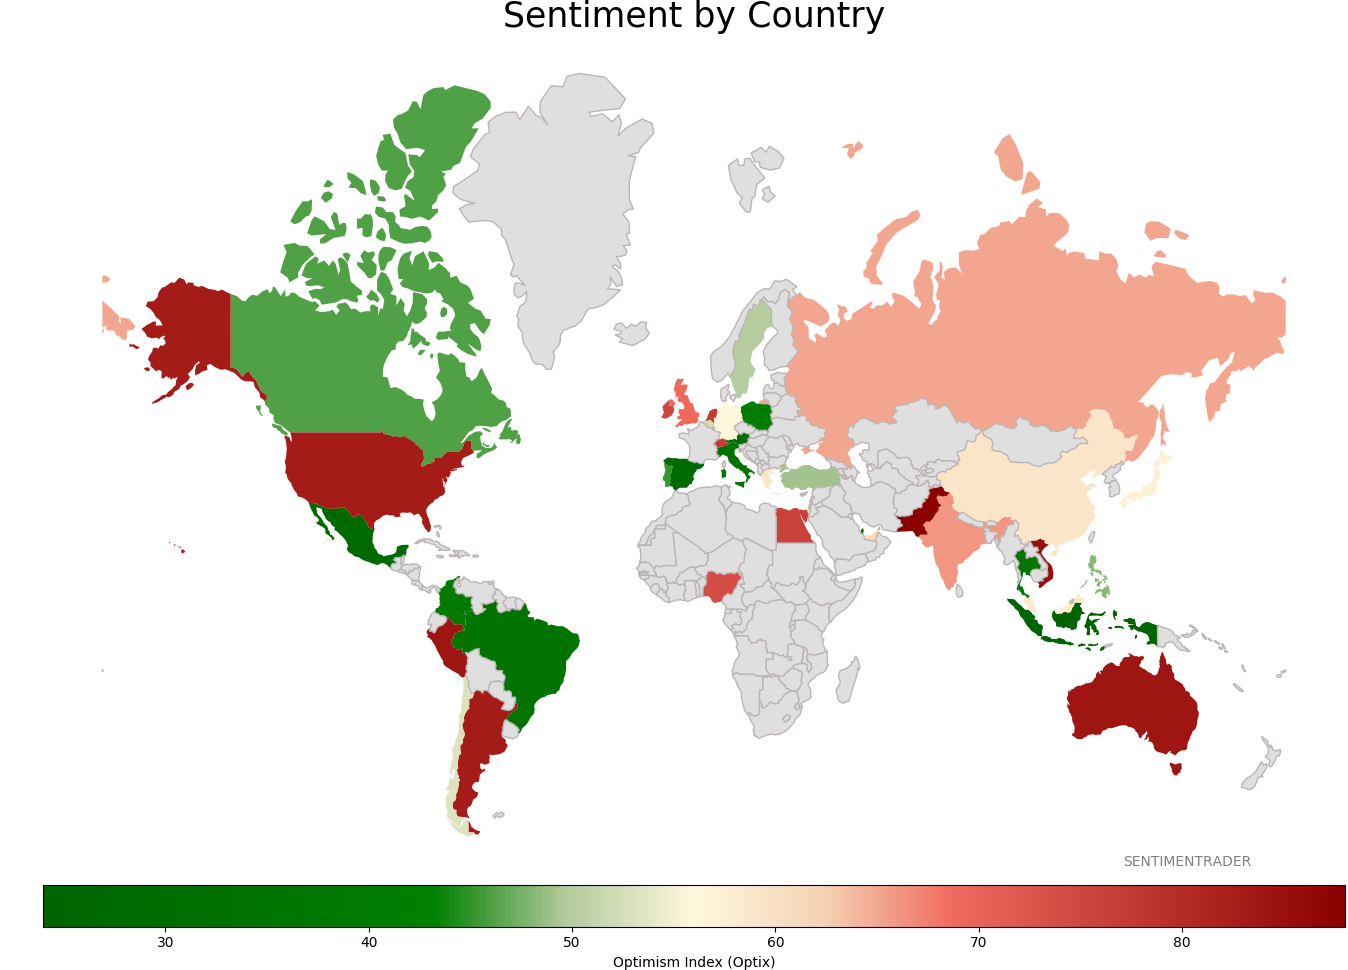
Ranks
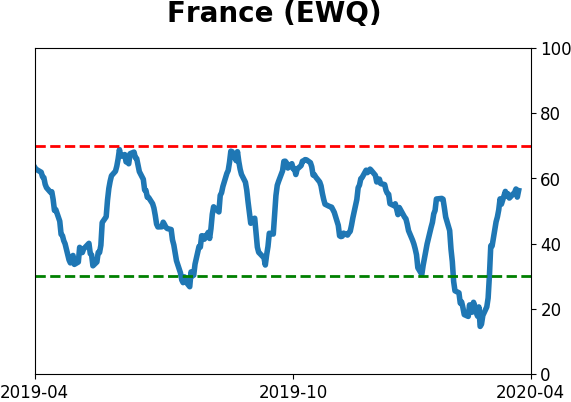
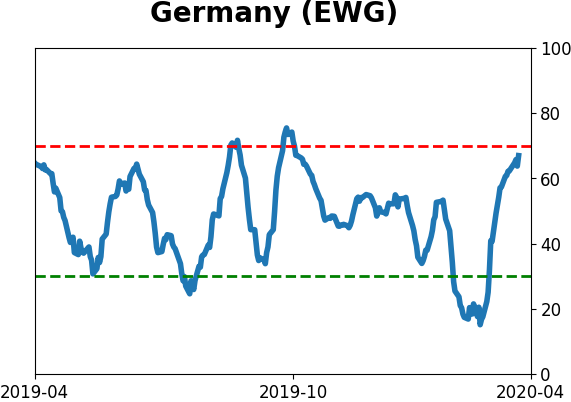
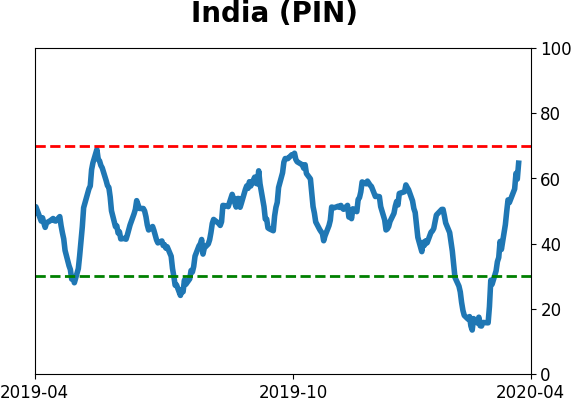
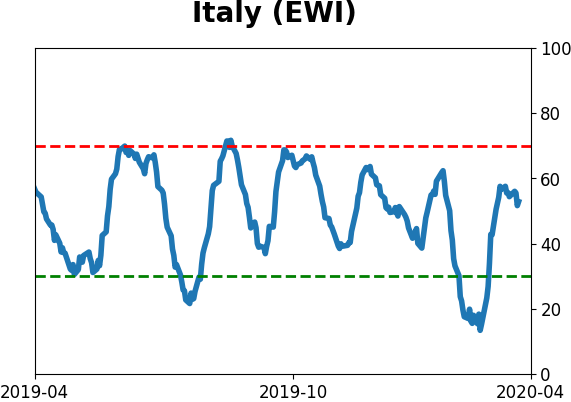
Sentiment Around The World
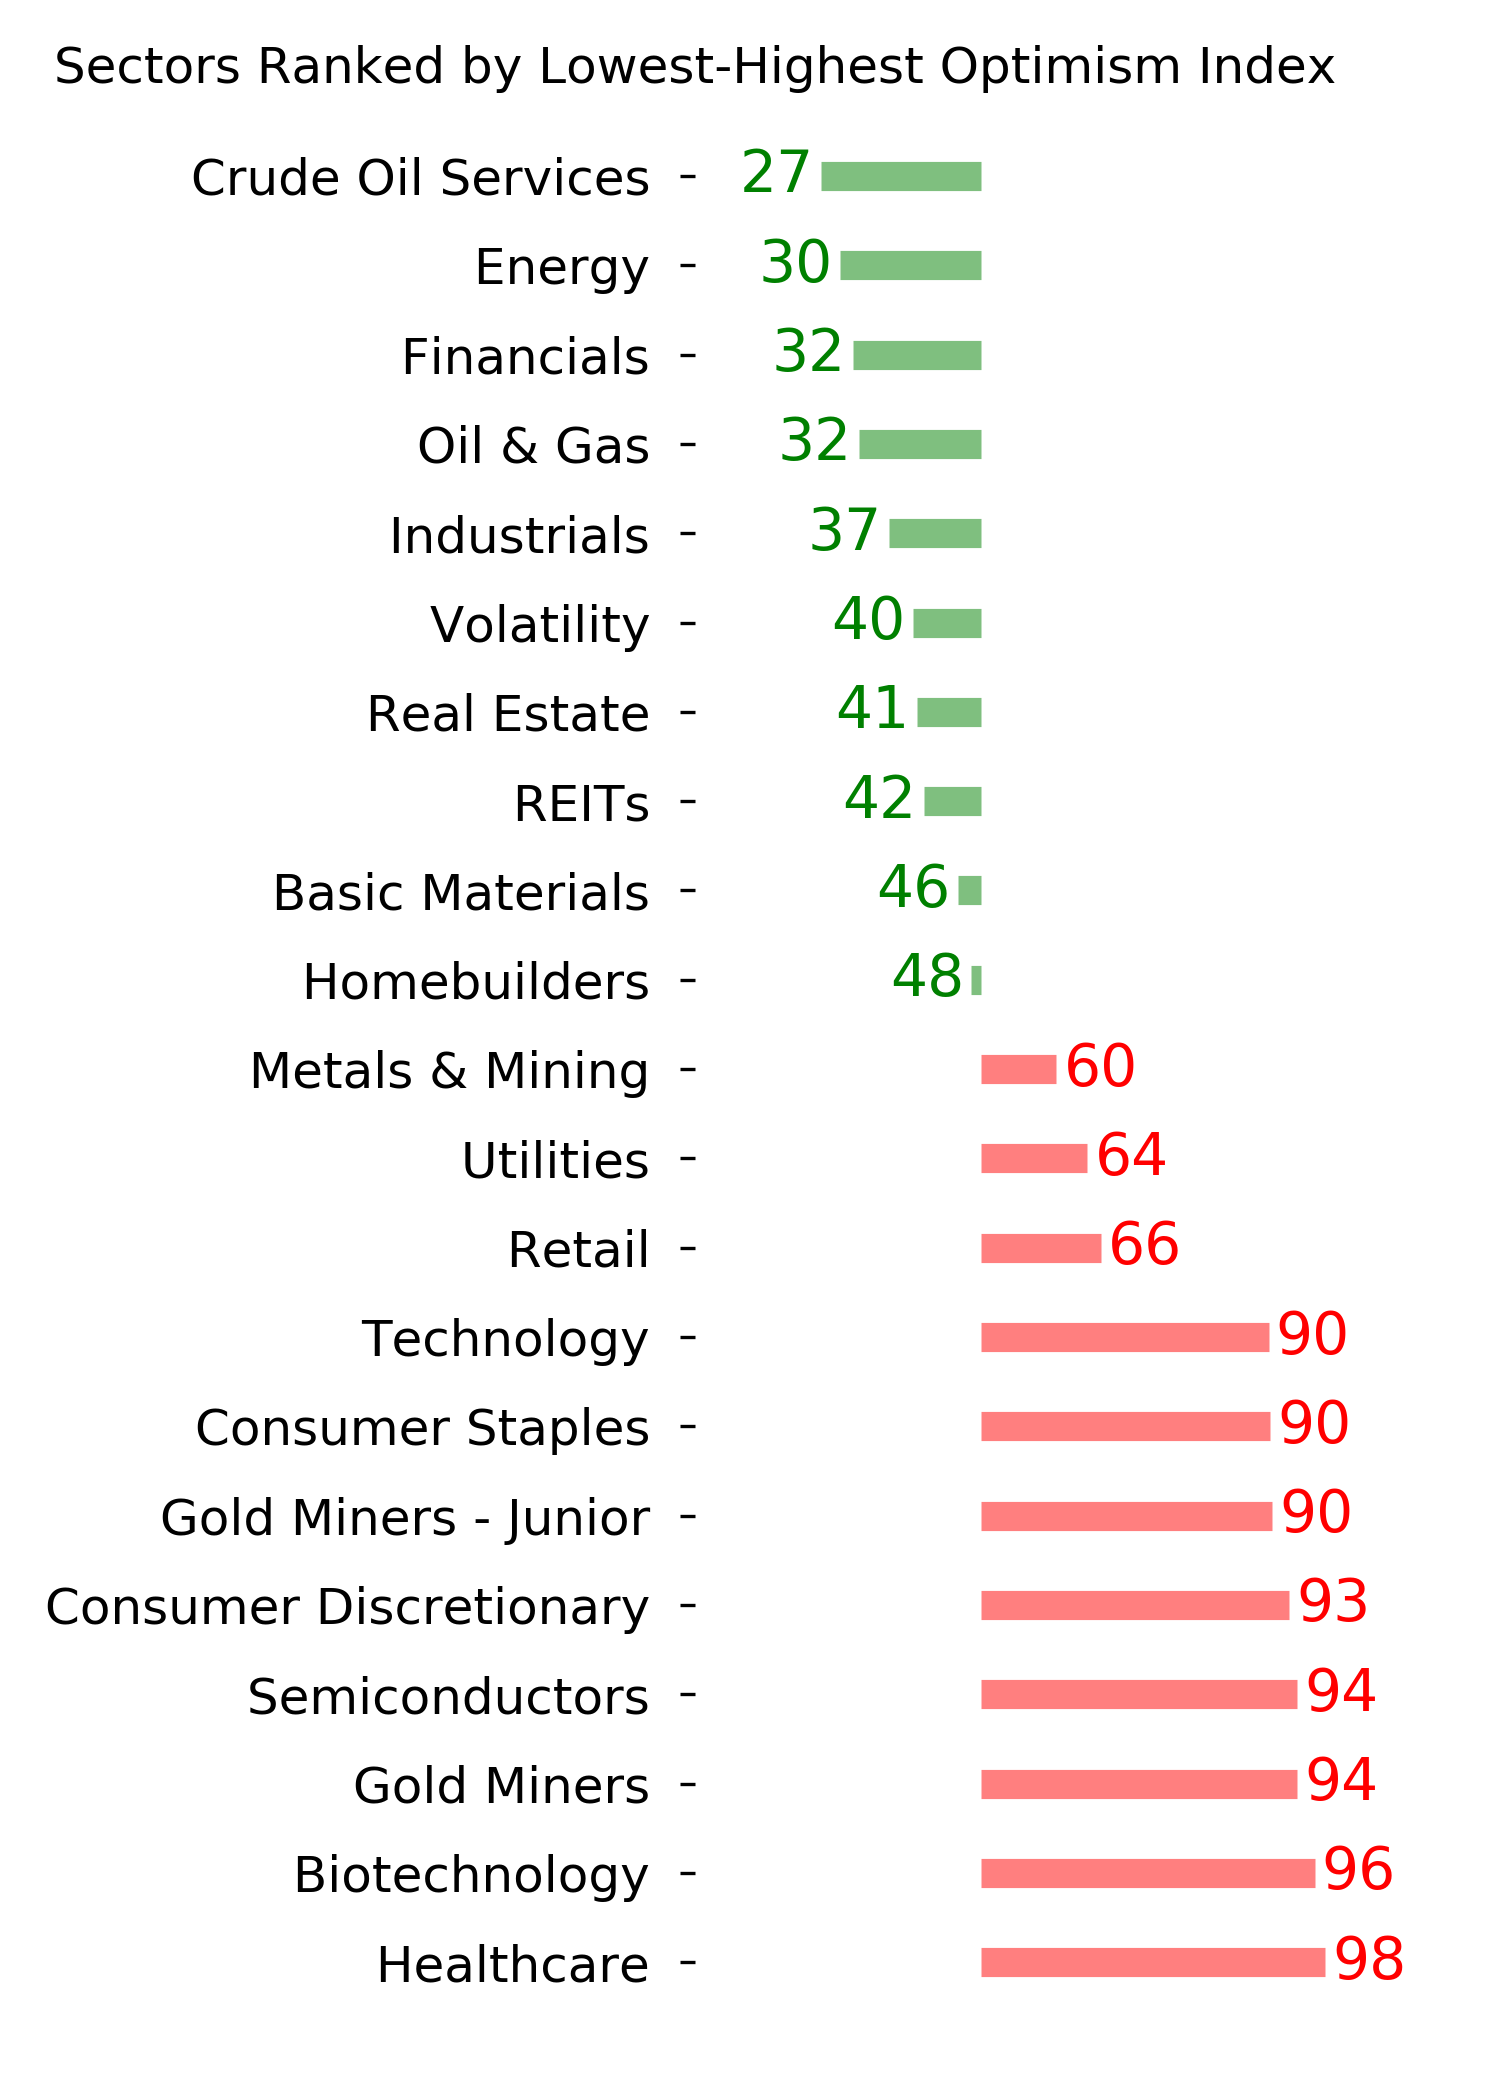
Optimism Index Thumbnails
|
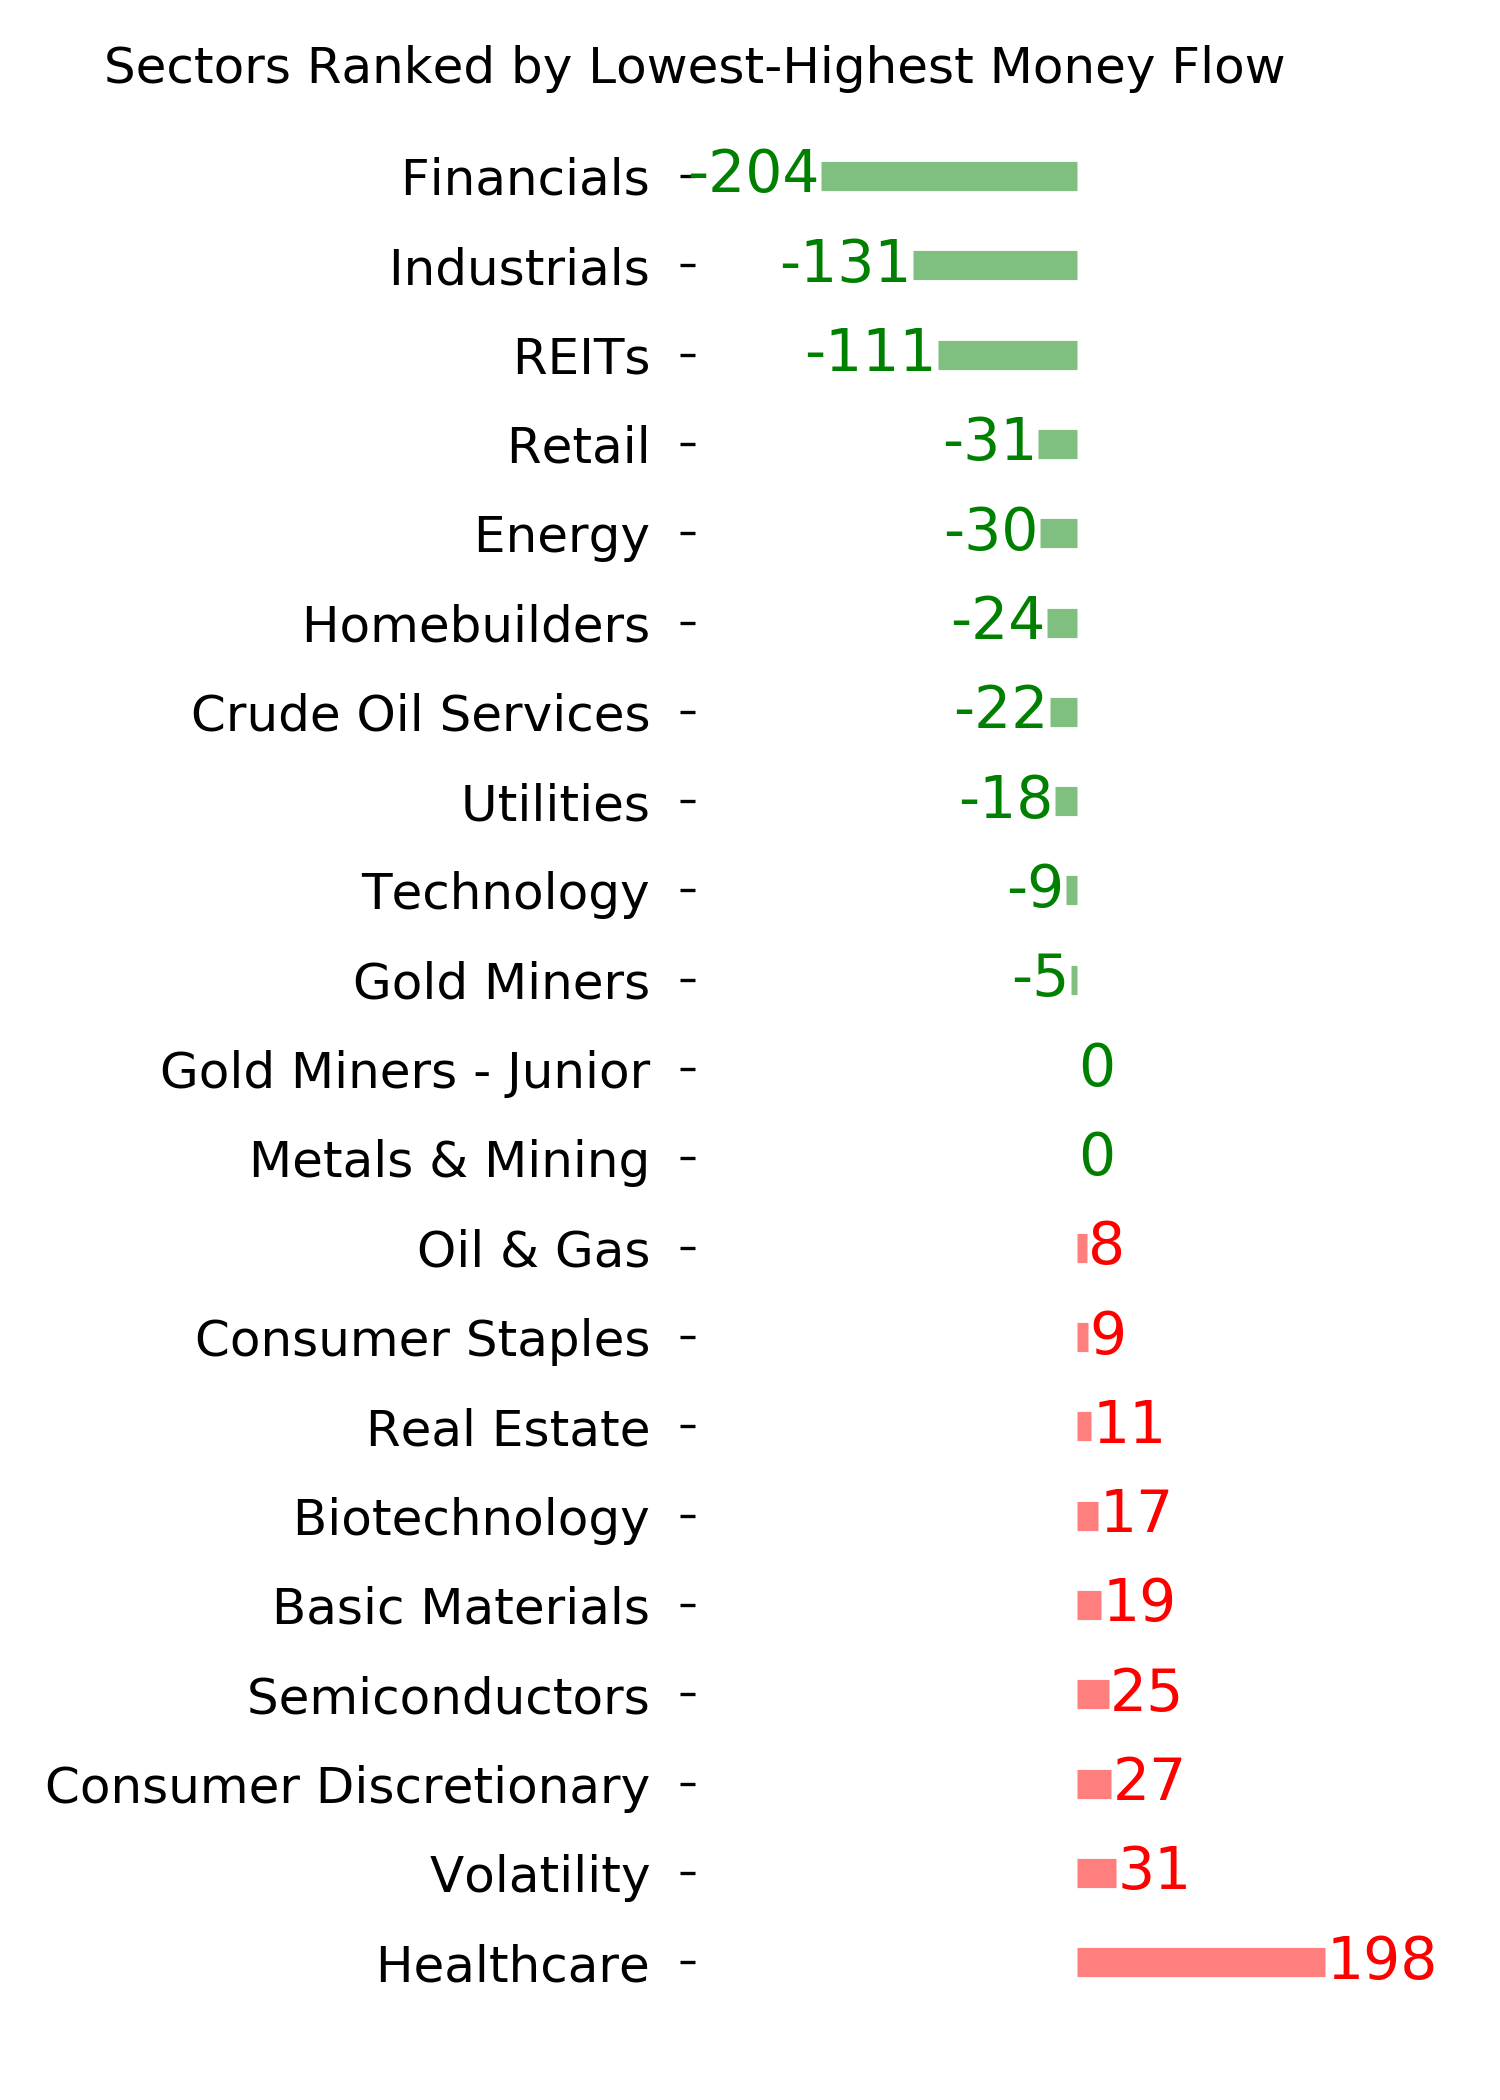
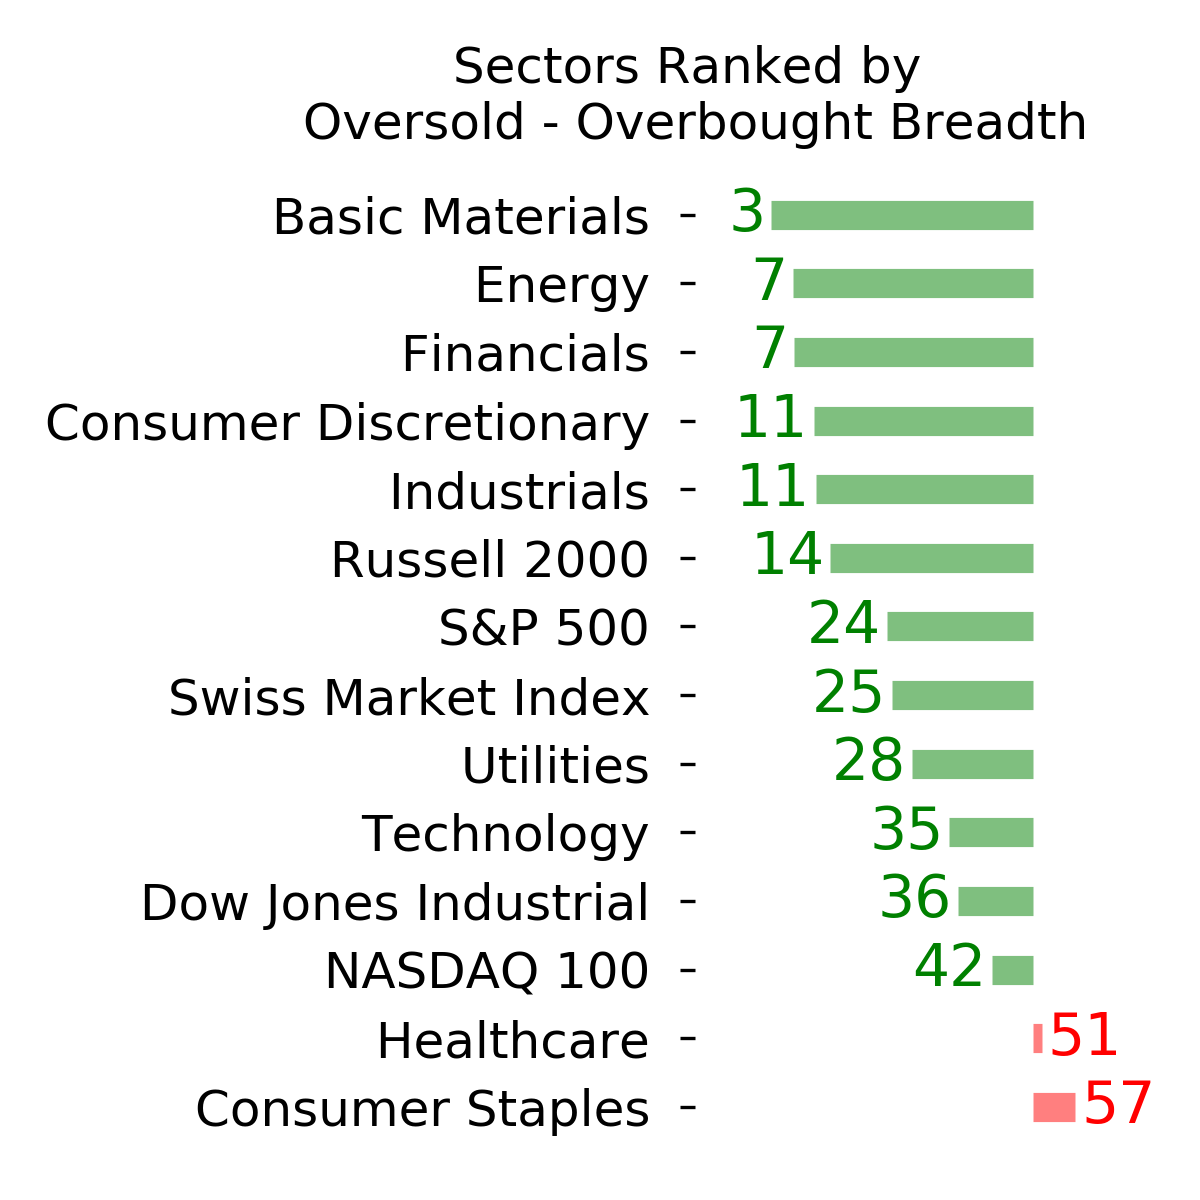
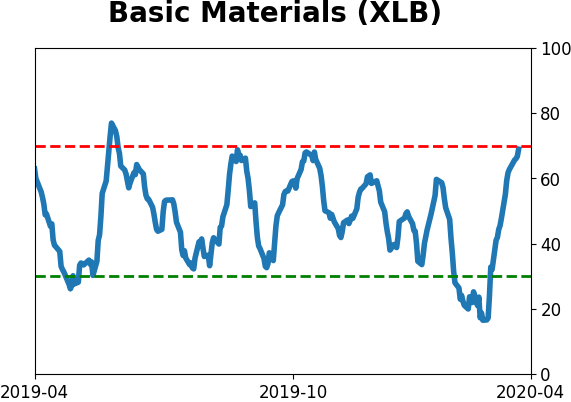
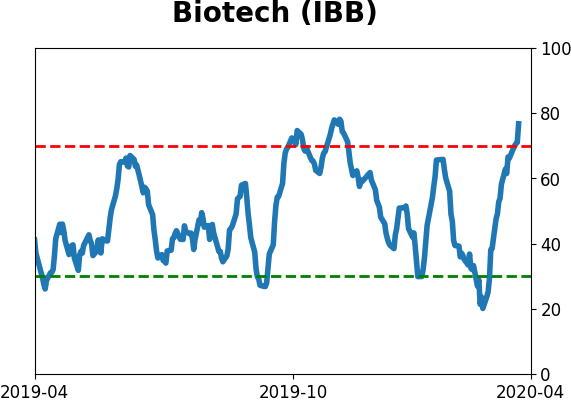
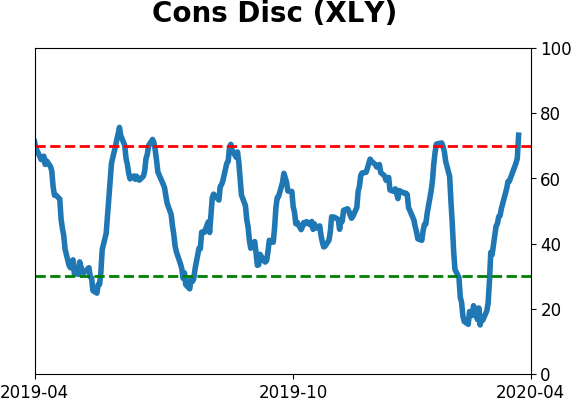
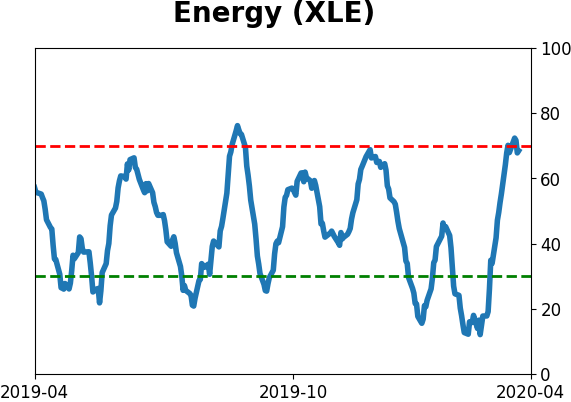
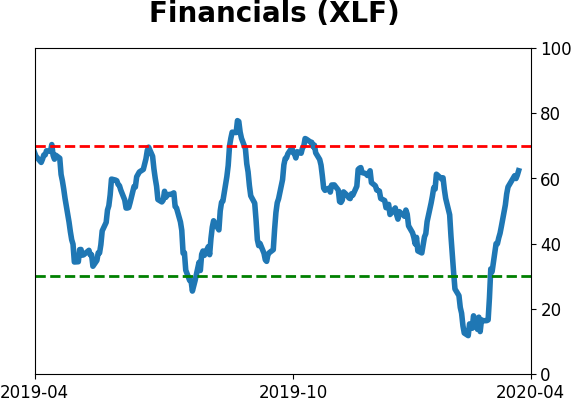
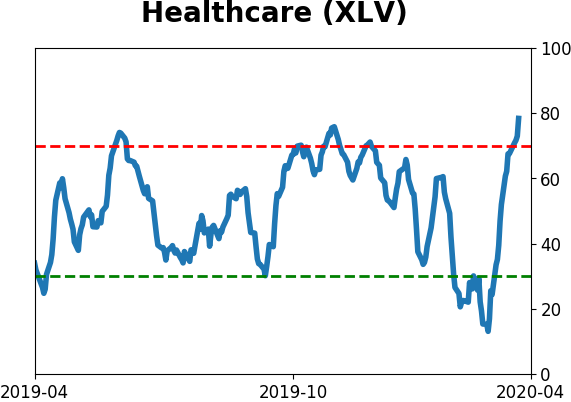
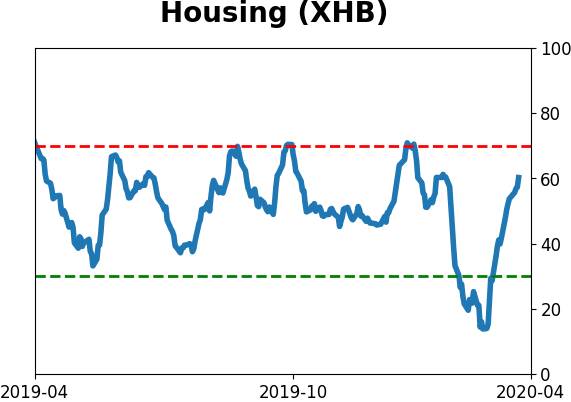
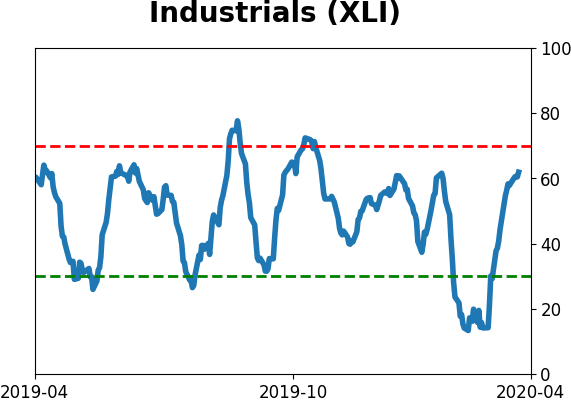
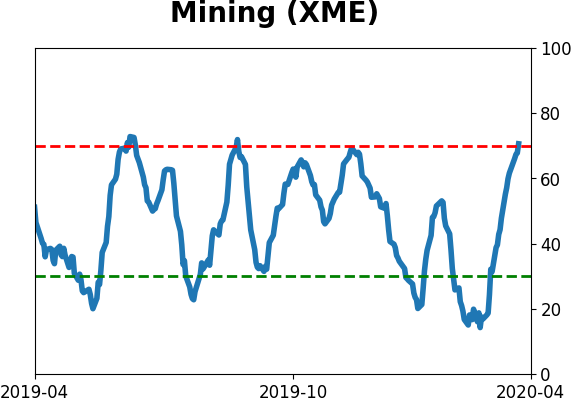
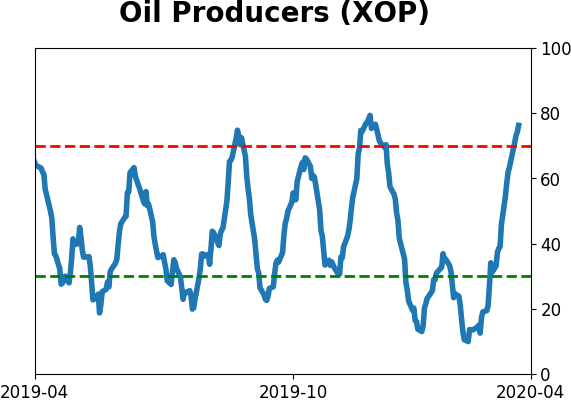
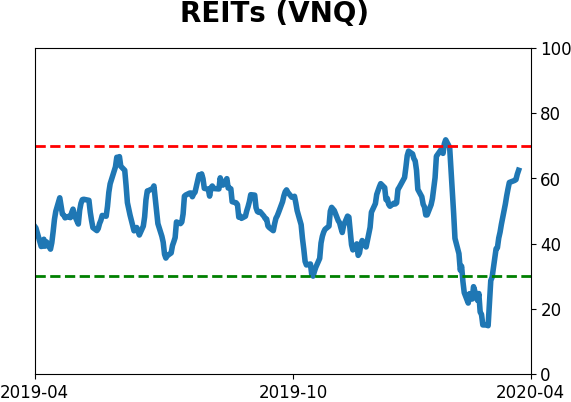
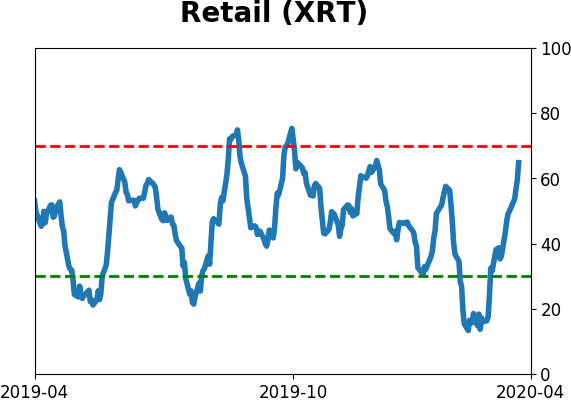
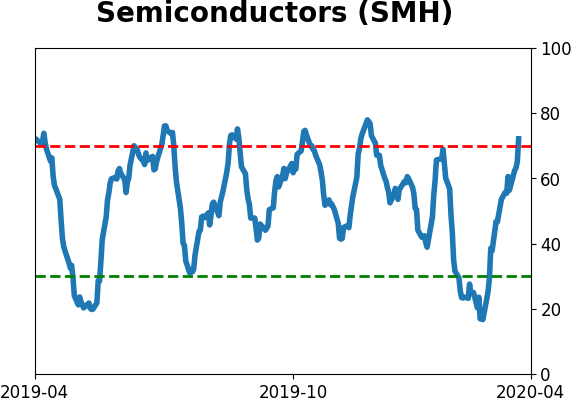
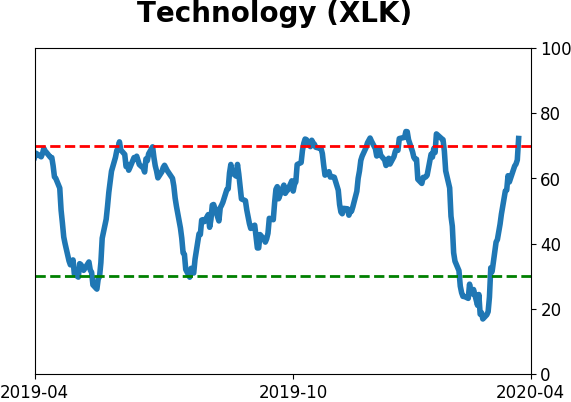
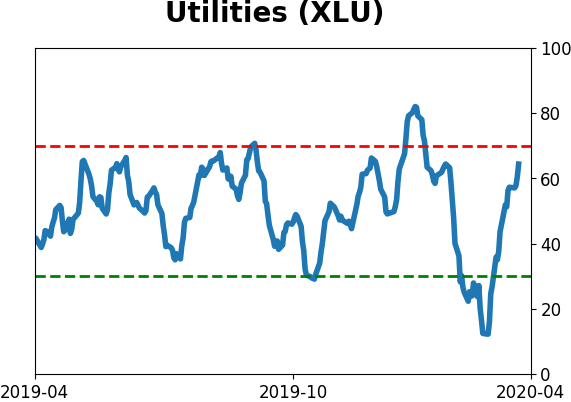
Sector ETF's - 10-Day Moving Average
|
|
|
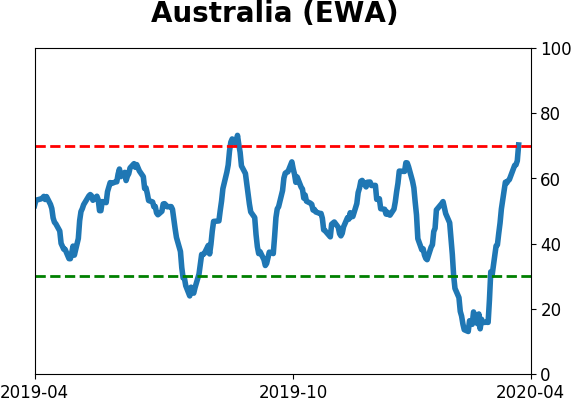
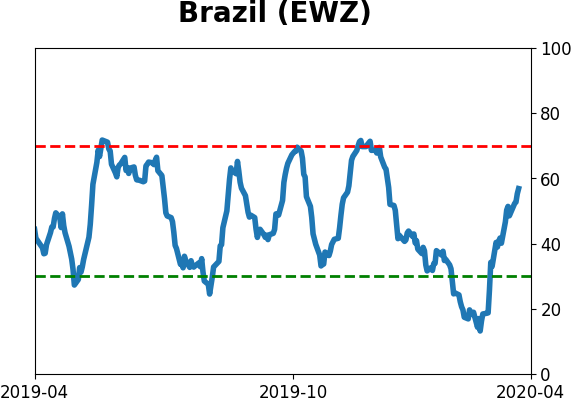
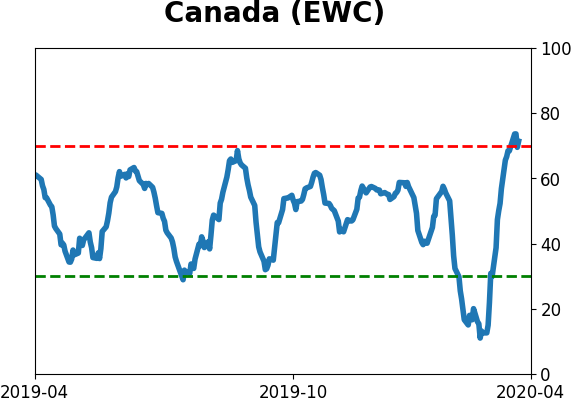
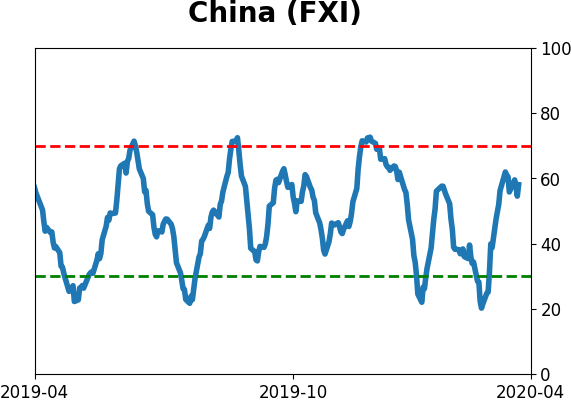
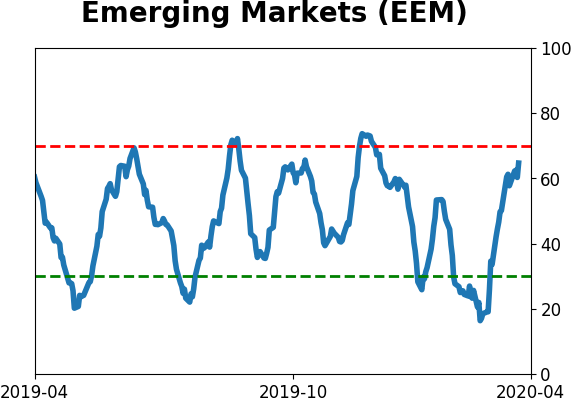
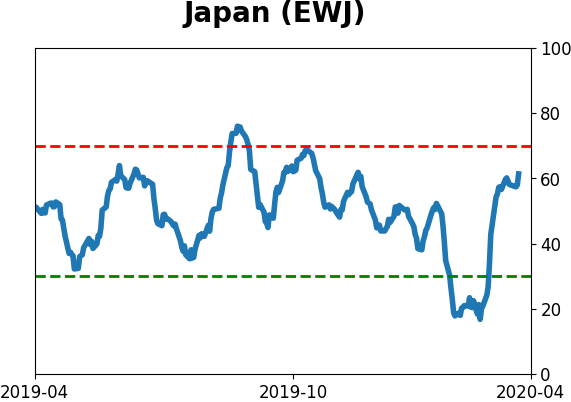
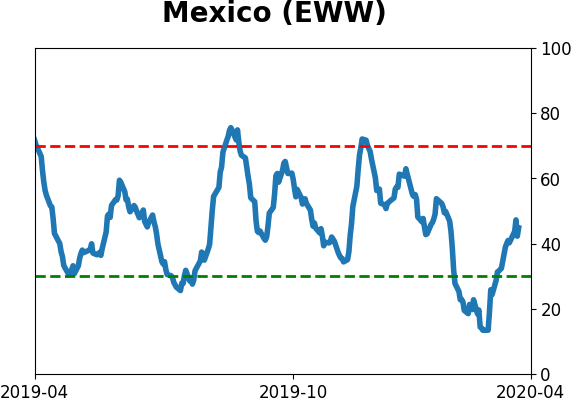
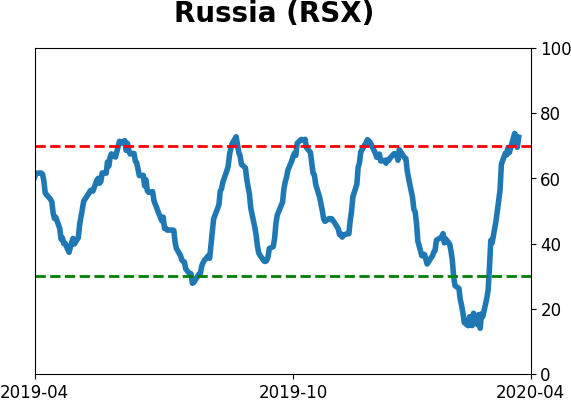
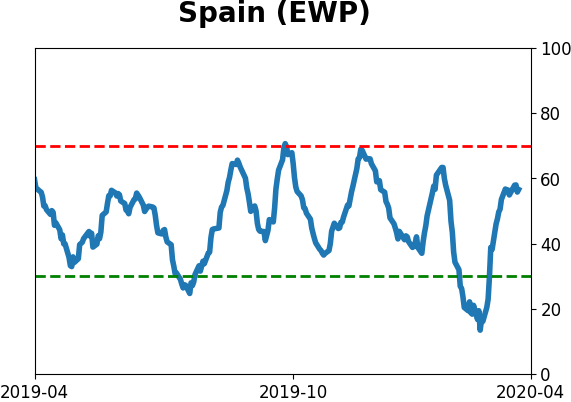
Country ETF's - 10-Day Moving Average
|
|
|
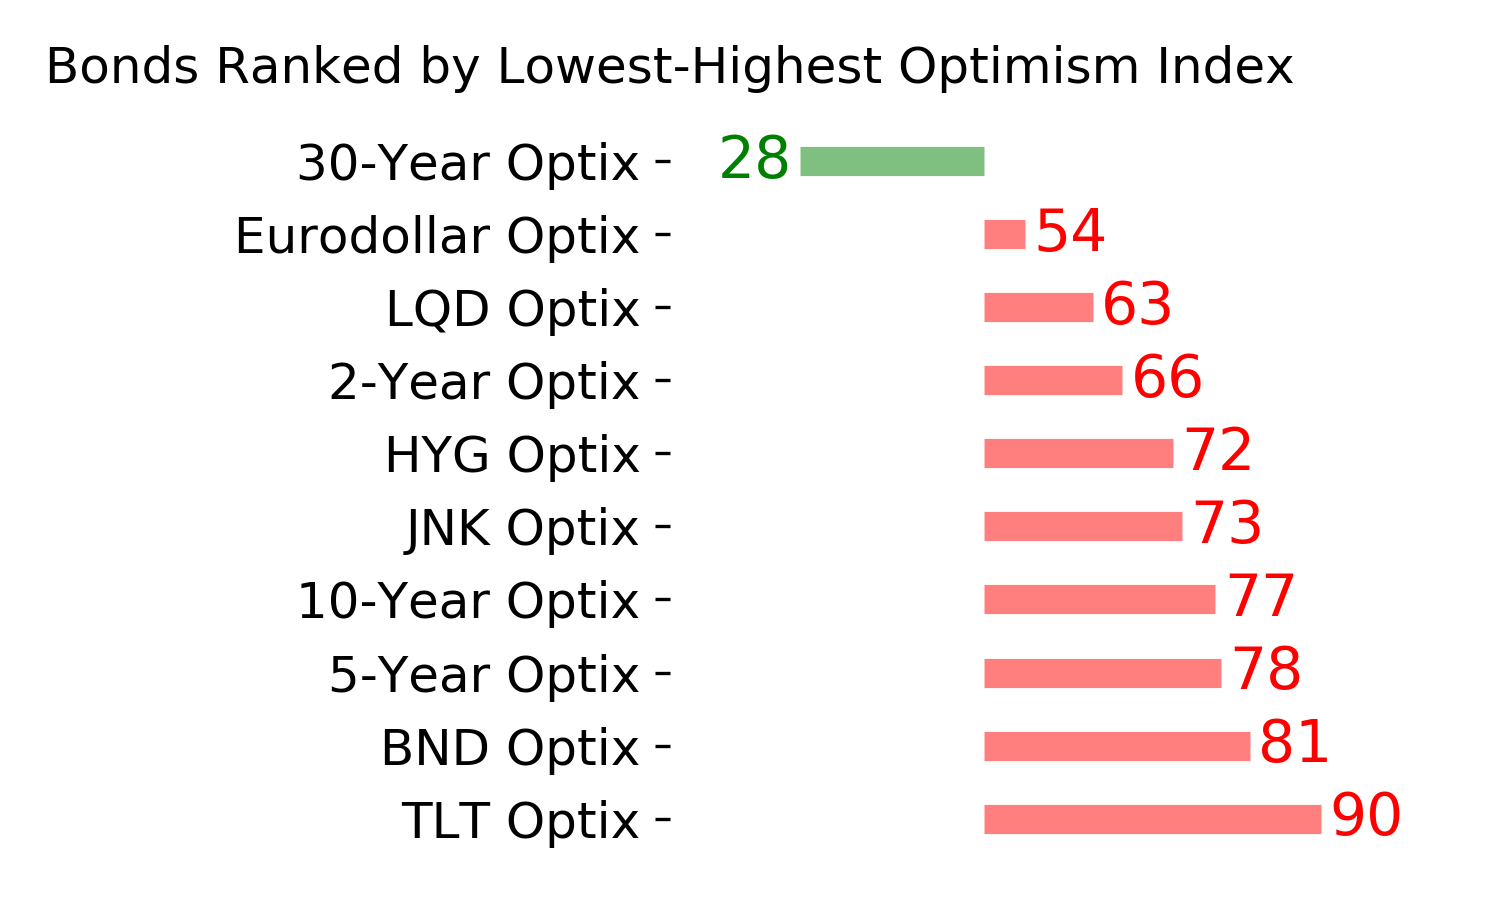
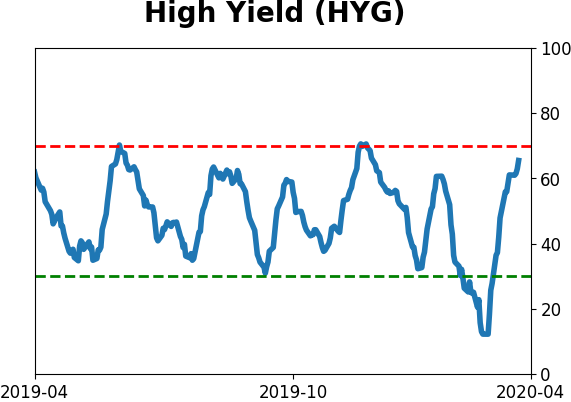
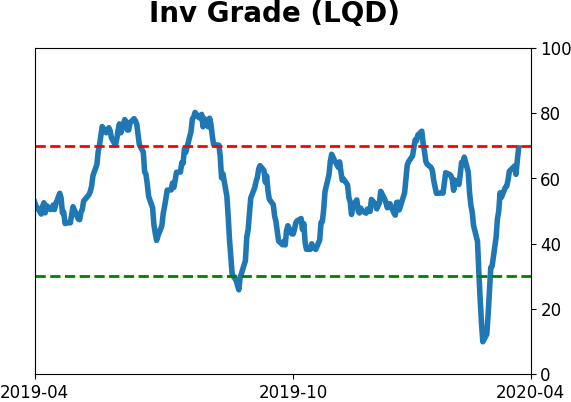
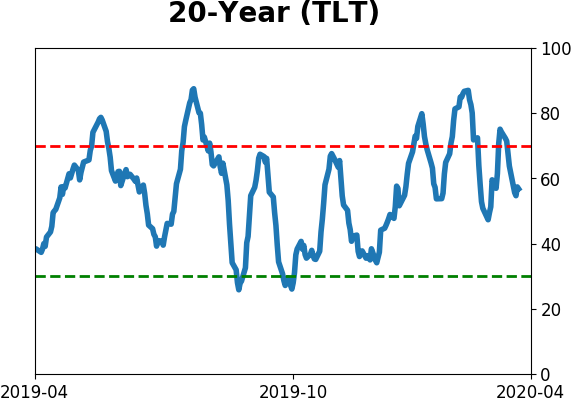
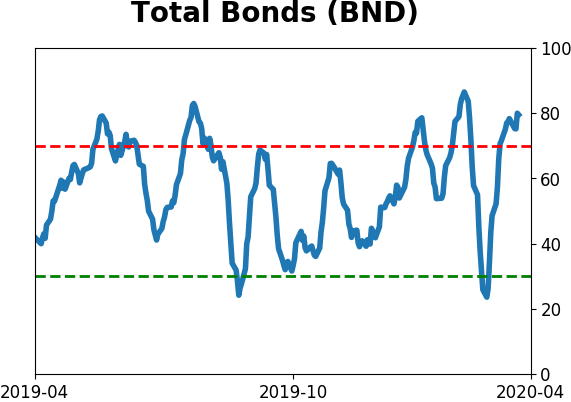
Bond ETF's - 10-Day Moving Average
|
|
|
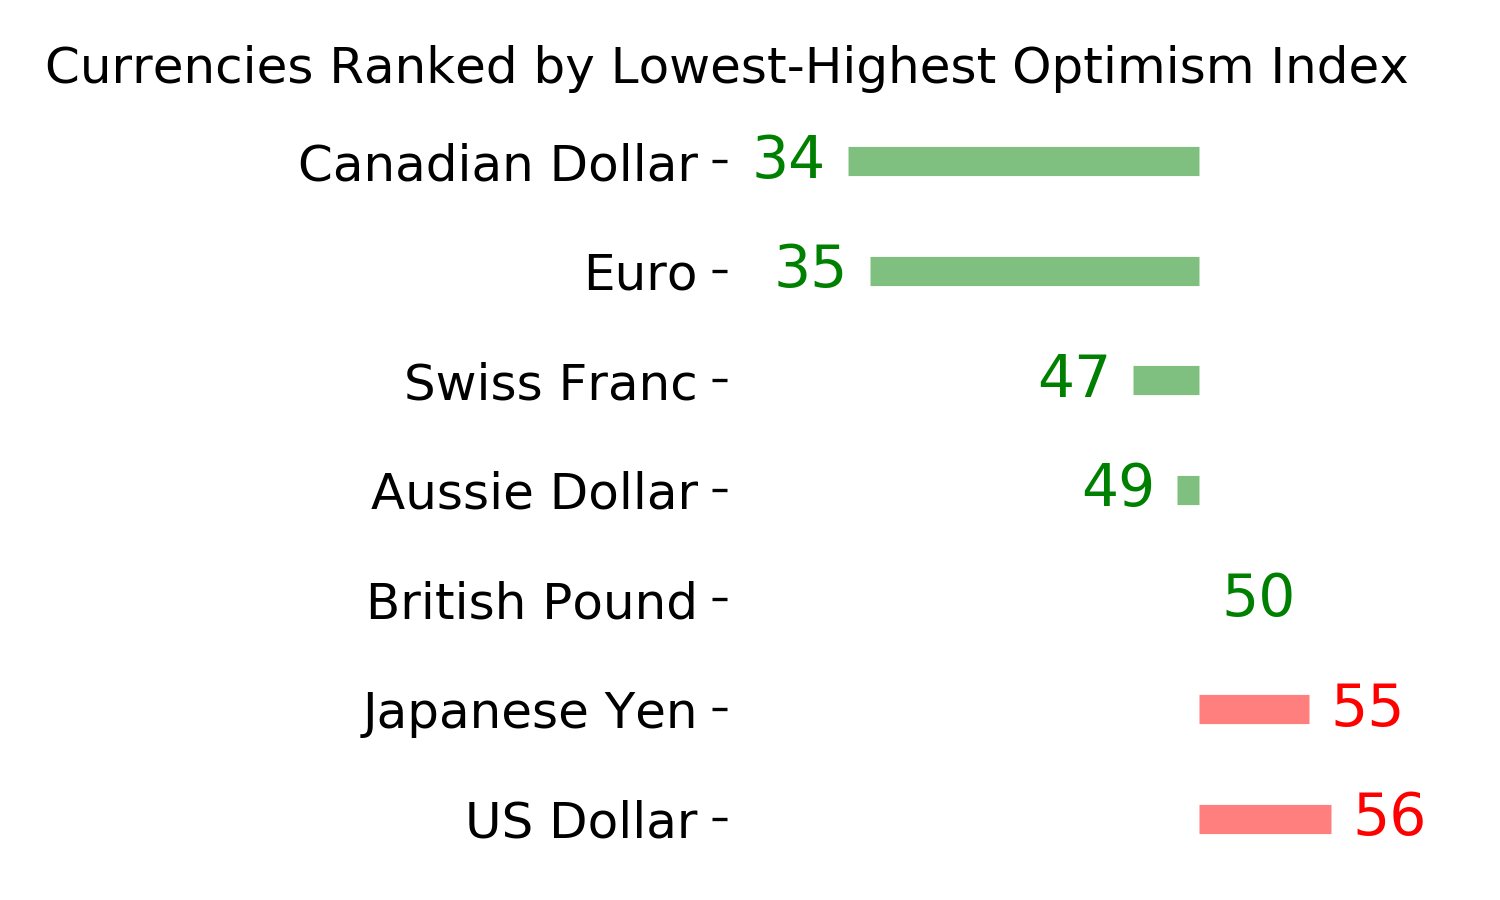
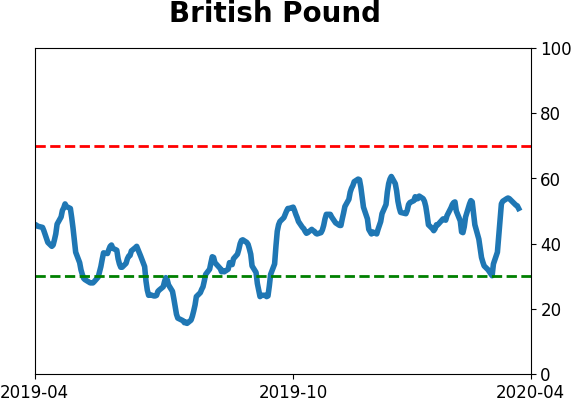
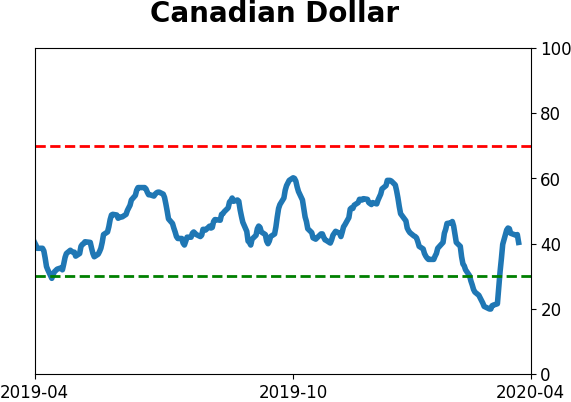
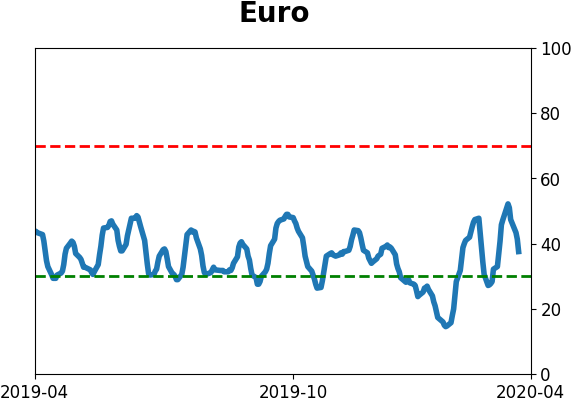
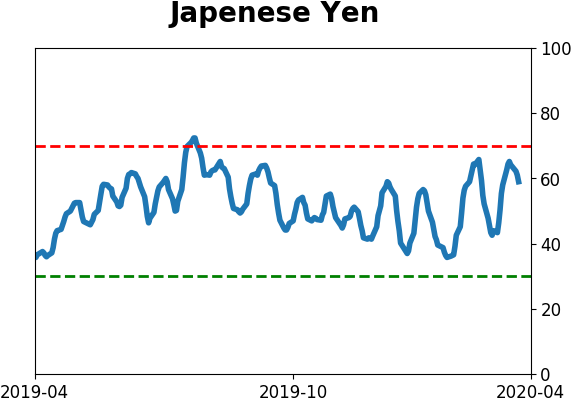
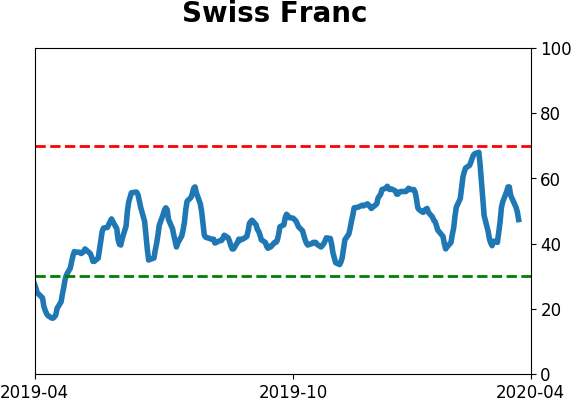
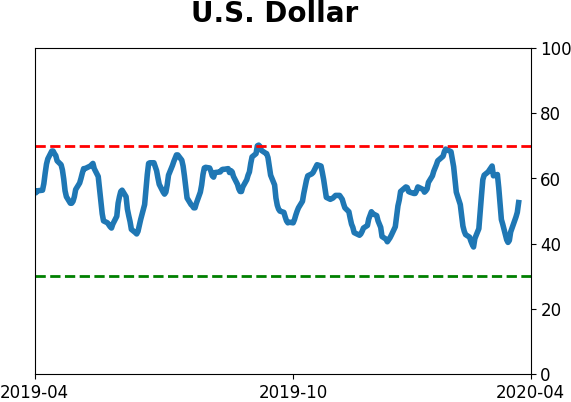
Currency ETF's - 5-Day Moving Average
|
|
|
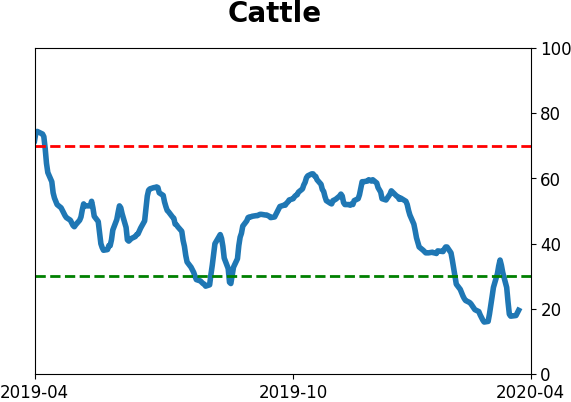
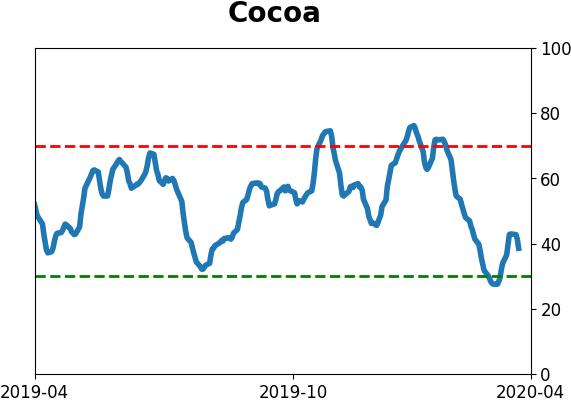
Commodity ETF's - 5-Day Moving Average
|
|