Headlines
|
|
Sentiment cycle is "discouraging":
If stocks follow a typical Sentiment Cycle, then we've passed the "panic" phase and should be in the midst of months of "discouragement." But we've already seen the signs that are more typically seen at the end of the cycle, not the beginning.
Stocks struggling as breadth recovers:
The High Low Ratios for the NYSE and Nasdaq have recovered to move above 50% for the first time in months, following extremely depressed readings. That has also caused the HiLo Logic Index to curl up, and recent thrusts are not due solely to "little mover" stocks.
Big island: Yesterday's low in the S&P 500 futures was more than 1% higher than the prior close. Today's high was more than 1% lower than yesterday's close. That left a big "island" on the chart, with the S&P at a 10-day high surrounded by gaps. It seems hard to believe, but the only time that's happened since 1982 was October 16, 2002. The textbooks tell us this should be a negative, but the S&P rallied hard after its only precedent. Looking at lesser extremes, the S&P still had a tendency to rally in the days and weeks ahead, so while it looks negative on a chart, at worst it has been "not negative" when it has triggered in the past. The S&P also rallied more than 2% yesterday then closed below yesterday's low today (h/t @andrewthrasher). That triggered several times in 2008, leading to large losses, but also in March 2003, March/October 2009, and January 2016 which led to large gains.
Big guys rush into cash faster than little guys: Institutions have been shoveling money into government money market funds, now totaling $2.7 trillion, per ICI. That's up 42% in just the past 8 weeks, the largest rush into the safest of funds since November 2008. Retail investors have just under $1 trillion in those funds, up only 26% in 8 weeks. So, institutions are rushing into money markets even faster than mom-and-pop. The only time in the past decade when institutions shoveled so much more money into these funds than retail investors did was October-November 2016. There wasn't any sign that this was "smart money" fleeing a sinking ship before it was already sunk.
|
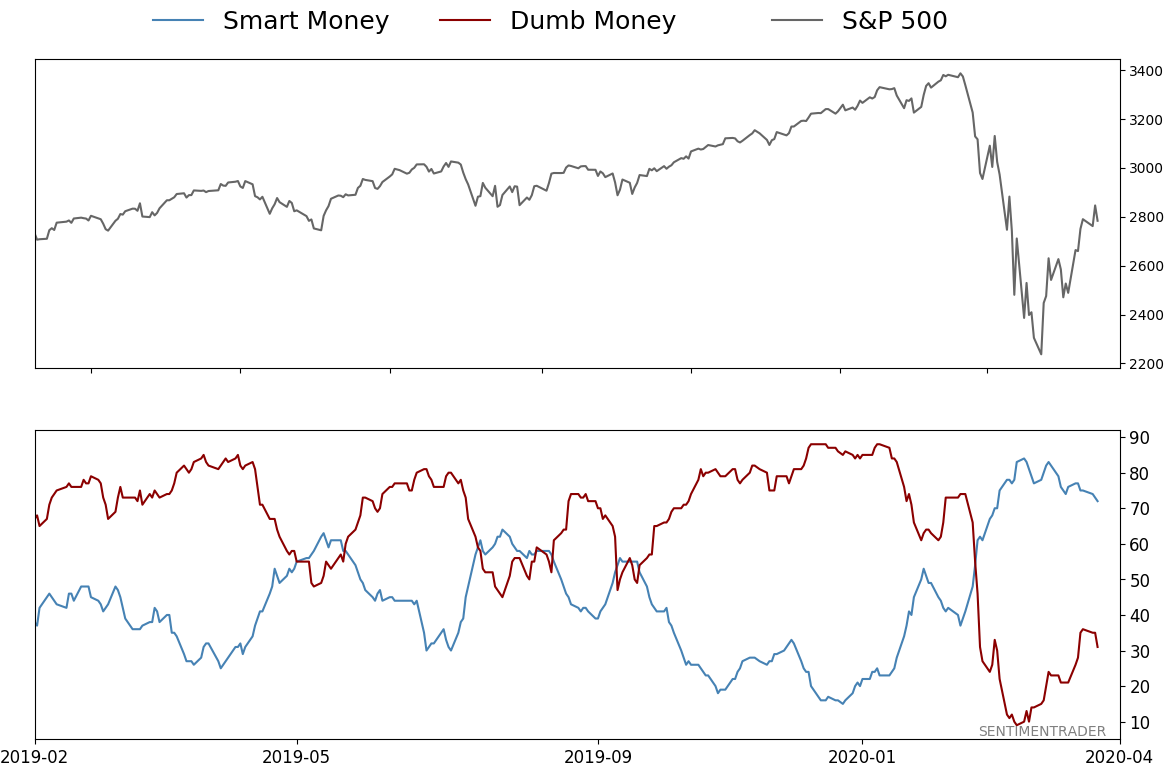
Smart / Dumb Money Confidence
|
Smart Money Confidence: 72%
Dumb Money Confidence: 31%
|
|
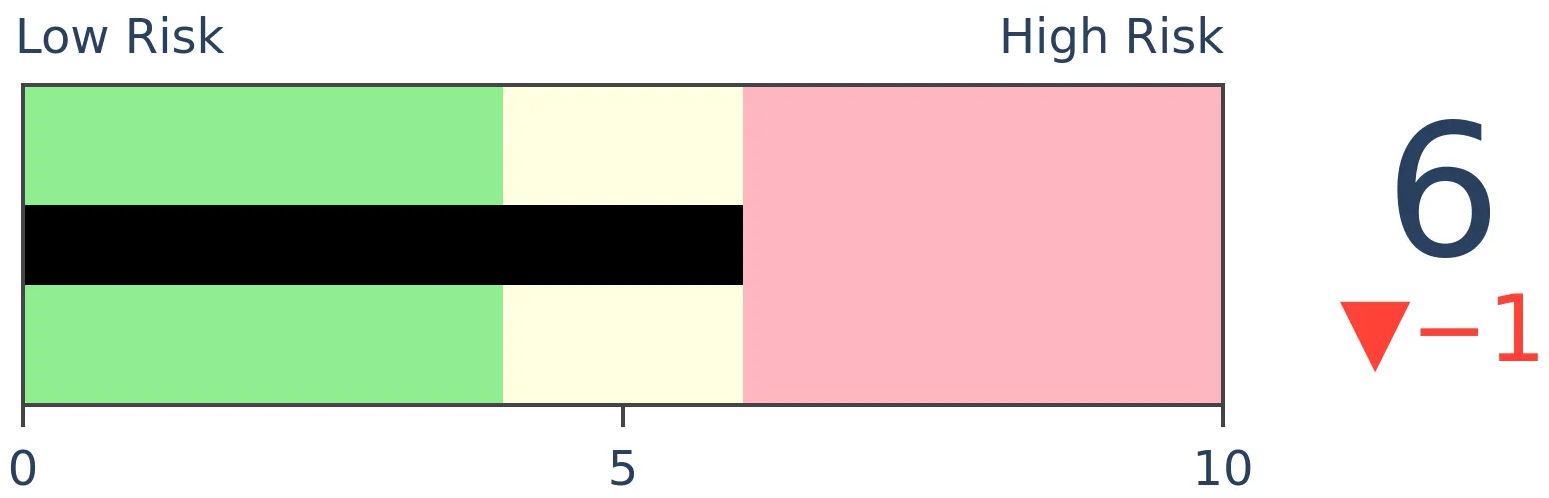
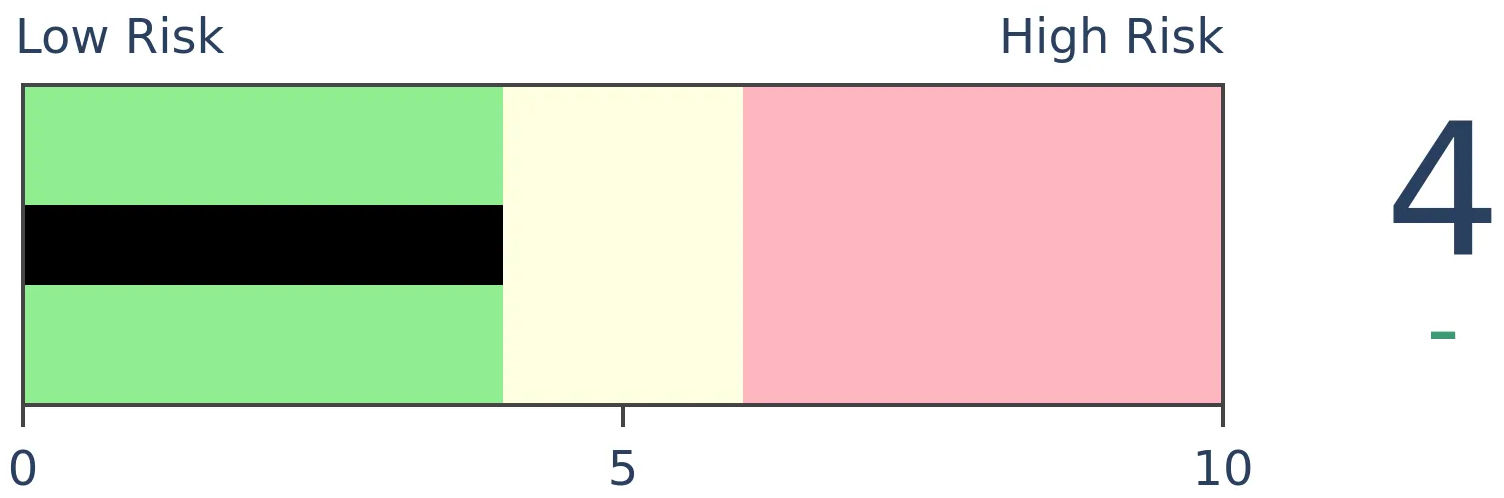
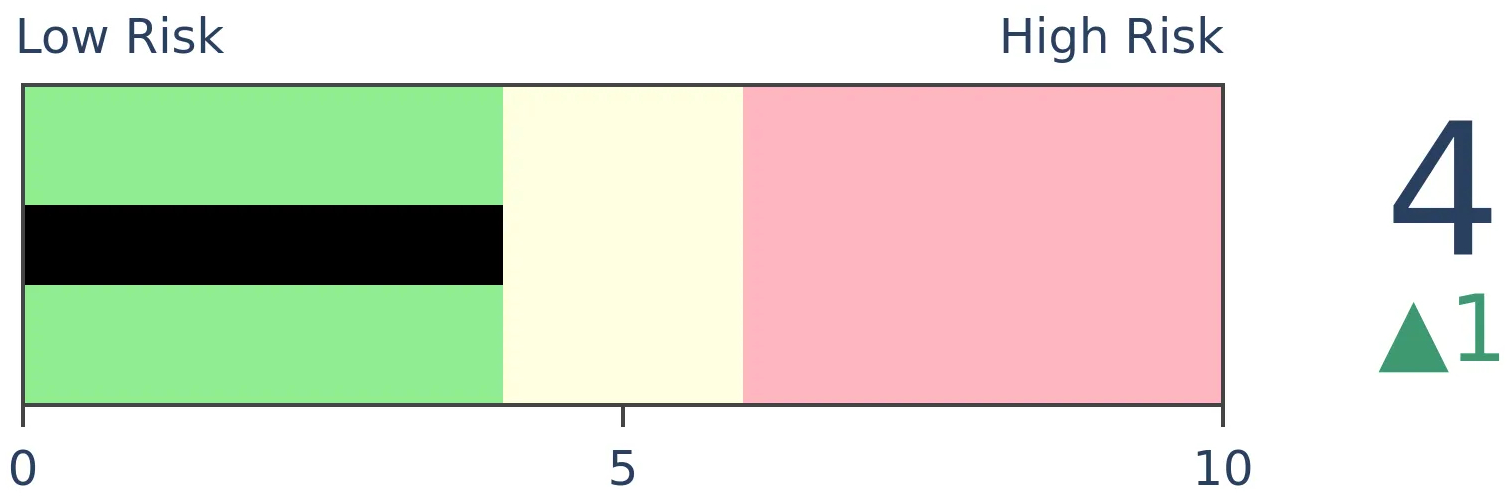
Risk Levels
Stocks Short-Term
|
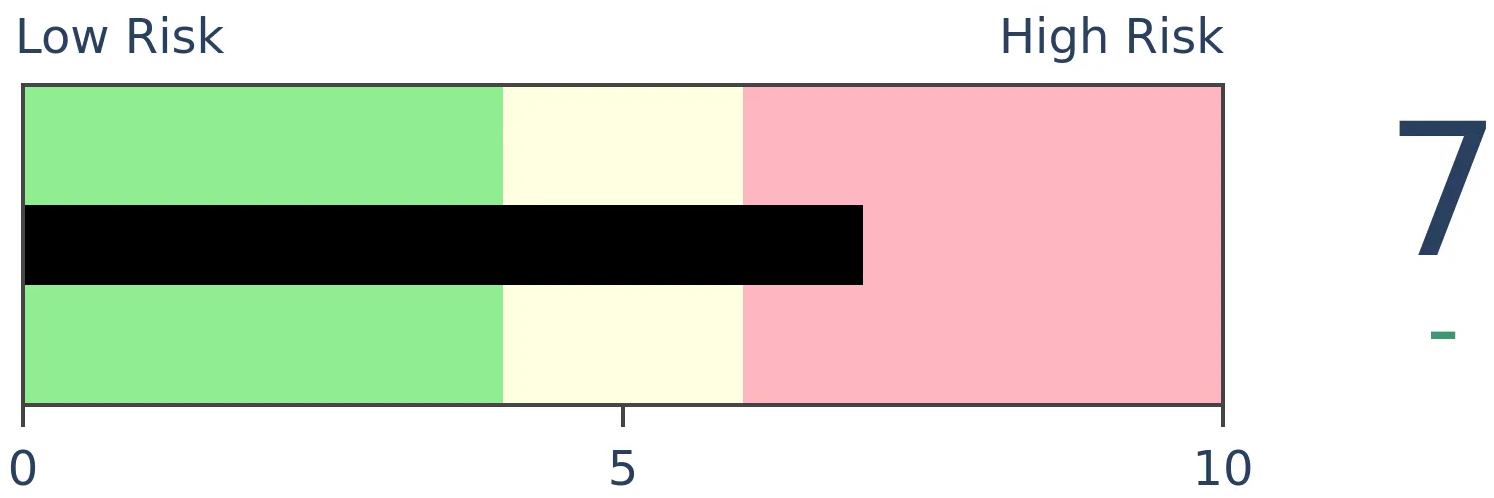
Stocks Medium-Term
|
|
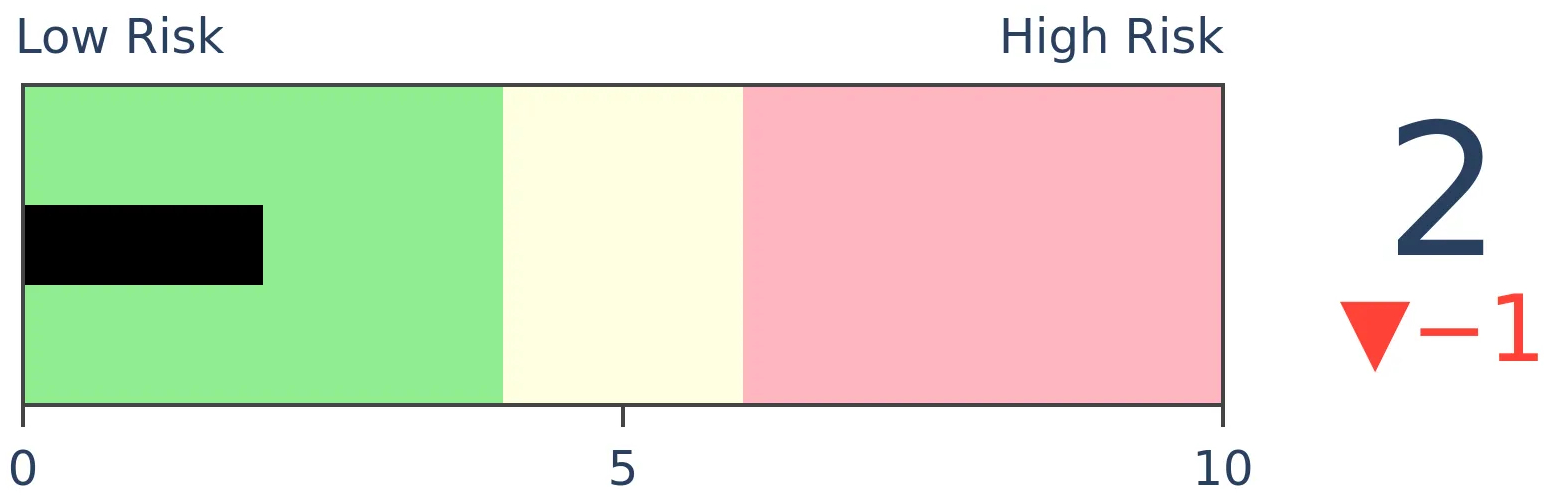
Bonds
|
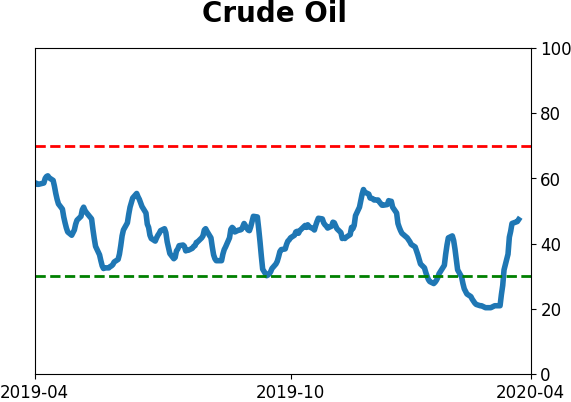
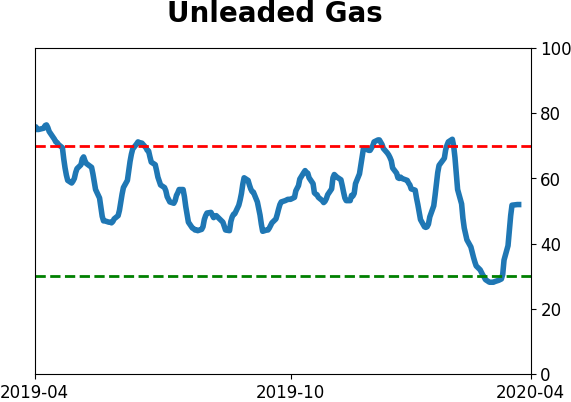
Crude Oil

|
|
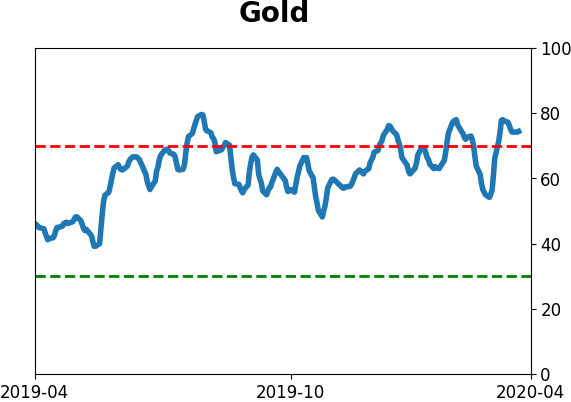
Gold
|
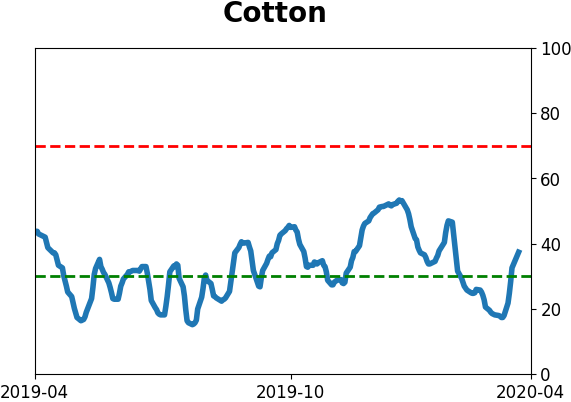
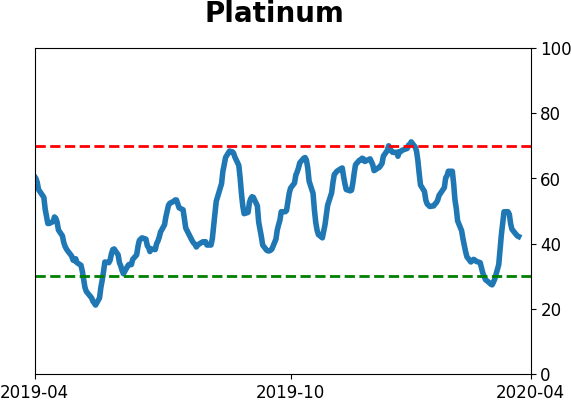
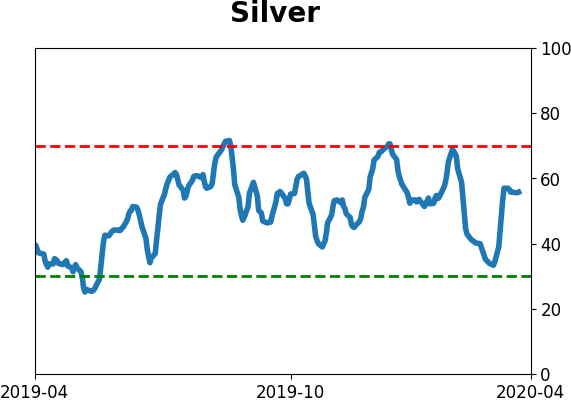
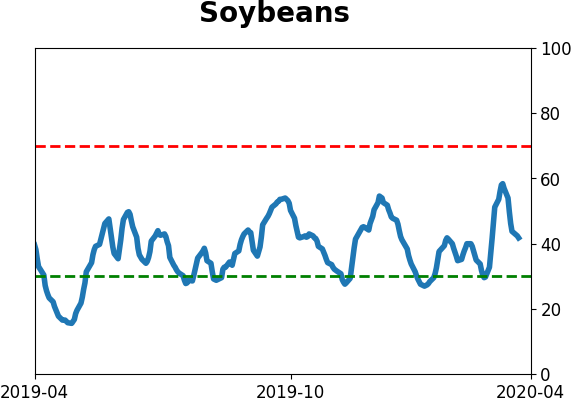
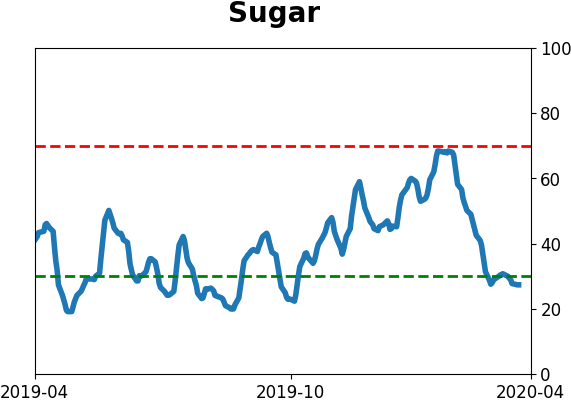
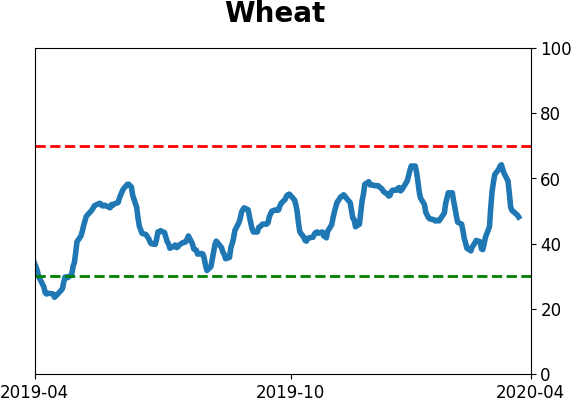
Agriculture
|
|
Research
BOTTOM LINE
If stocks follow a typical Sentiment Cycle, then we've passed the "panic" phase and should be in the midst of months of "discouragement." But we've already seen the signs that are more typically seen at the end of the cycle, not the beginning.
FORECAST / TIMEFRAME
None
|
As stocks plunged then recovered at the end of 2018 and start of 2019, we reviewed the typical Sentiment Cycle as popularized by Justin Mamis decades ago.
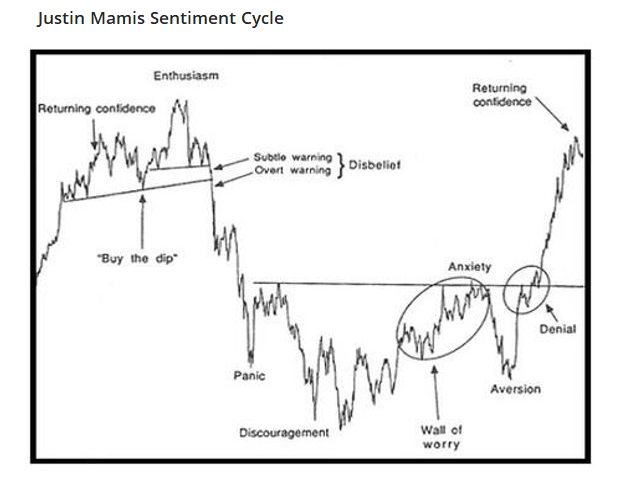
At the time, price action was playing out about in accordance with the typical cycle, but there were good reasons to believe we were further along than the price pattern alone would suggest:
When we used to post this chart daily, the things we noted to watch to watch for when coming out of the Discouragement phase were 1) Explosive price gains over 2-3 day periods, 2) Massive thrusts in market breadth, 3) "Just another bear market rally" articles, and 4) Minimal pullbacks after short-term overbought readings. We can check all 4 of those boxes now, suggesting we’re further along the timeline than price alone would suggest.
That was from early January 2019, and it turns out that we were much further along than price action alone would suggest. There was never any testing of the panic low during what was supposed to be the "discouragement" part of the cycle.
This is notable because we can check most of those boxes now.
1. Explosive price gains over 2-3 day periods? Yes.
2. Massive thrusts in market breadth? Most definitely - by some metrics, the best we've ever seen.
3. "Just another bear market rally" articles? Yes.
4. Minimal pullbacks after short-term overbought readings? Questionable - as Troy mentioned in a premium note, many of our short-term Optix readings for major ETFs are now at extremely high levels.
That last point is debatable, depending on the indicator used. One could make the argument that on very short-term time frames, stocks have already been overbought and yet stocks continued higher until Tuesday, but it's not conclusive. Major bottoms tend to see buyers roll right over any hints of overbought readings.
If we overlay the S&P 500's current path against the typical Sentiment Cycle again, then we get the following. Our current market has been so extreme in just about every regard that we've had to use a secondary scale.
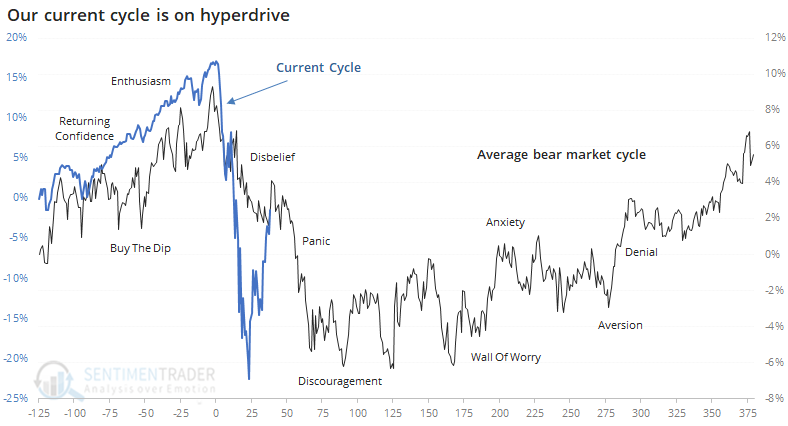
Everything about the past two months has been on a super compressed time frame. What usually takes months or even years to play out has happened in days or weeks, even the slowest-moving aspects of fiscal and monetary responses.
Based on a very general pattern, we should be in the post-panic, discouragement phase of the Cycle. While it doesn't necessarily mean a lower low than the initial panic, it does often mean months of volatile swings that make everyone doubt their outlook.
The biggest problem with this idea is the same as in January 2019. We've already seen the kind of thrusts and behavior that we see during the latter part of the Sentiment Cycle, not the beginning, so we'd place less weight on the idea of a typical cycle than normal. If anything, given behavior over the past two weeks, the current juncture is more like "anxiety" than "discouragement."
BOTTOM LINE
The High Low Ratios for the NYSE and Nasdaq have recovered to move above 50% for the first time in months, following extremely depressed readings. That has also caused the HiLo Logic Index to curl up, and recent thrusts are not due solely to "little mover" stocks.
FORECAST / TIMEFRAME
SPY -- Up, Long-Term
|
We've spent a lot of time going over extremes in breadth over the past month. They were the most compelling metrics on the way down, with the most lopsided selling pressure in history, and on the way up, with some of the best breadth thrusts in history.
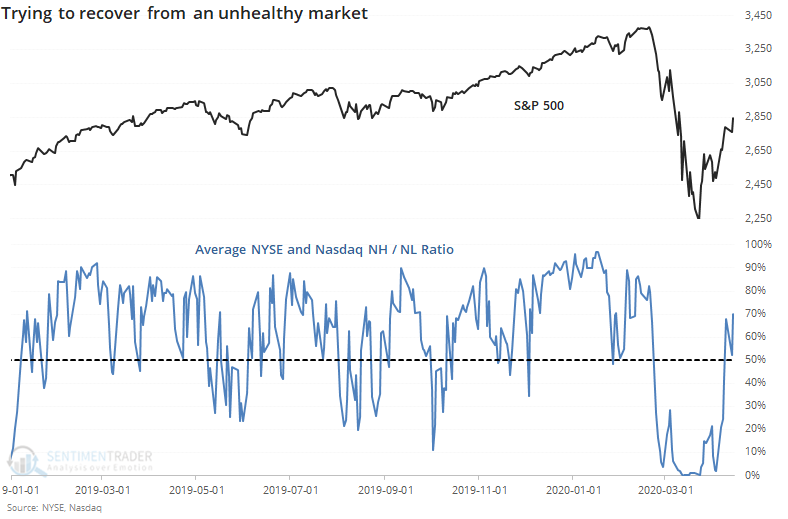
As Troy mentioned in a premium note, stocks on the Nasdaq have recovered enough so that the 52-week New High / New Low Ratio has recovered above 50%, after falling to 0% at some point in the past couple of months. Something similar occurred on the NYSE, with its ratio also recovering from an extremely low level.
The average of the two ratios has gone from less than 1% to more than 50% very quickly. Like most oscillating ratios like this, healthy markets typically hold above 50%, with only brief forays into oversold territory. Unhealthy markets see the inverse, and by the close on Wednesday this figure dropped back below 50%. Bulls should want to see this pop back above 50% in the coming days.
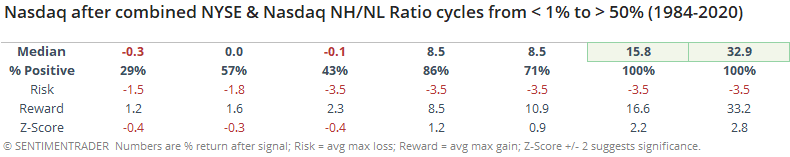
As Troy noted, when the Nasdaq ratio has cycled from essentially 0 to 50%, it's been a very good sign for the Nasdaq. When we look at a combined ratio, it's also been a good long-term sign, though with some heavy shorter-term volatility.
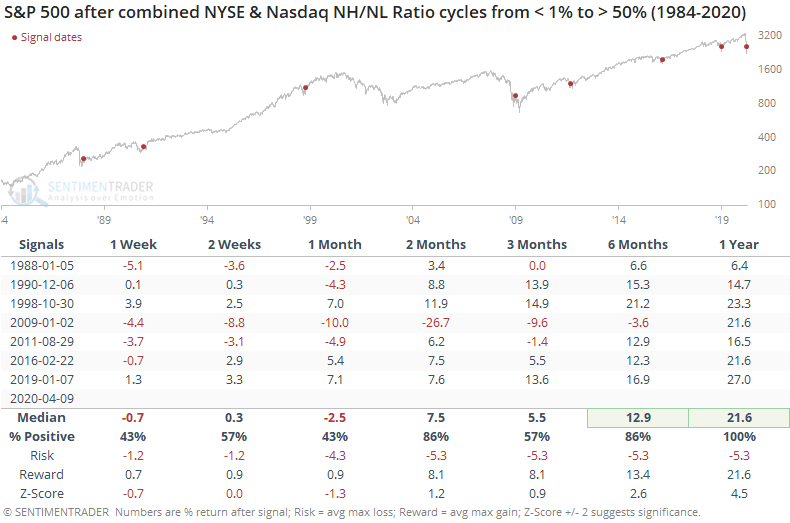
Returns for the Nasdaq were more impressive, with an average gain of over 32% during the next year.
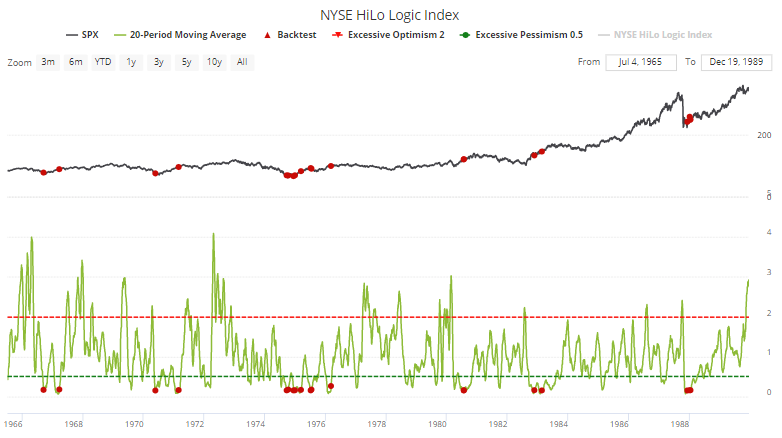
The extreme domination of stocks falling to 52-week lows in March caused the HiLo Logic Index to plunge to a near-record low. Now that highs are starting to outnumber lows, the 20-day average of the index is finally starting to curl higher. The Backtest Engine shows very good 6-12 month returns for the S&P 500 when this happened before.
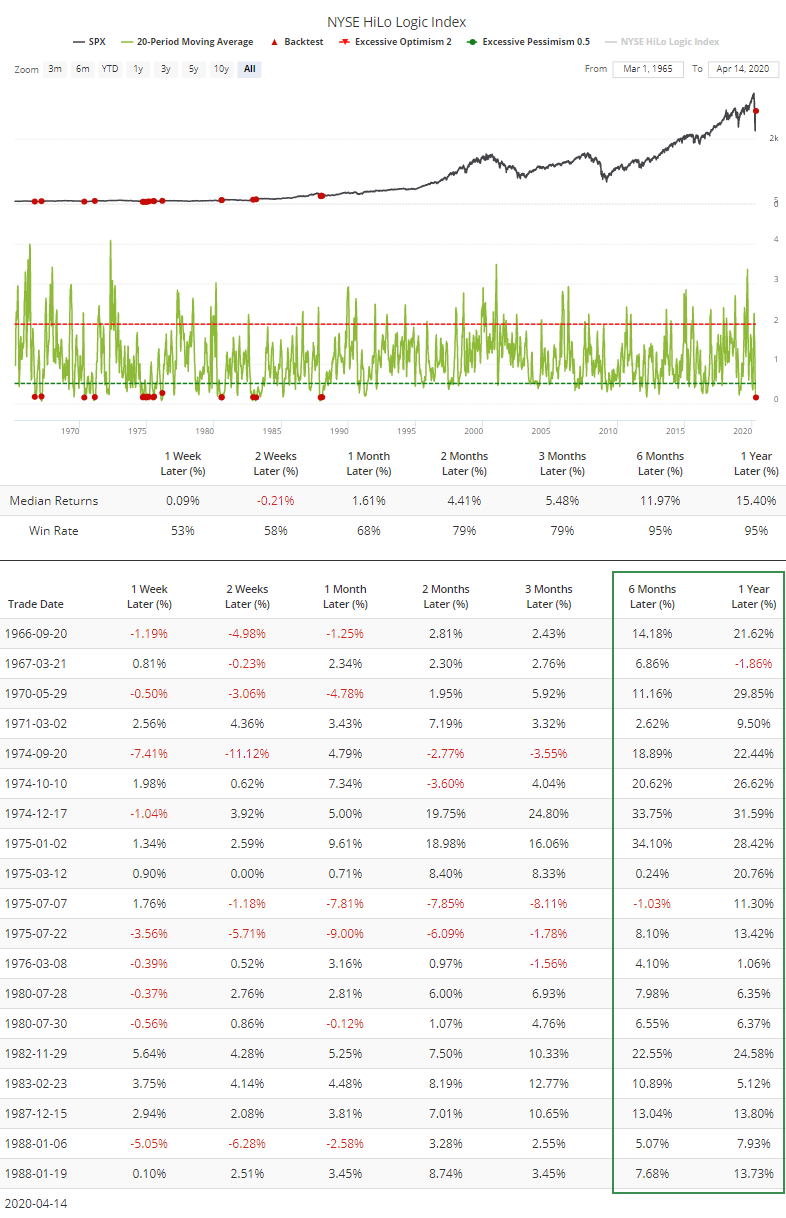
Most of those triggered in the 1970s and early '80s.
One of the knocks against the thrusts we've seen is that it could be due to computerized trading. There have been a lot of days with an overwhelming number of securities advancing, but perhaps a lot of those daily gainers are from stocks that only moved up a few cents.
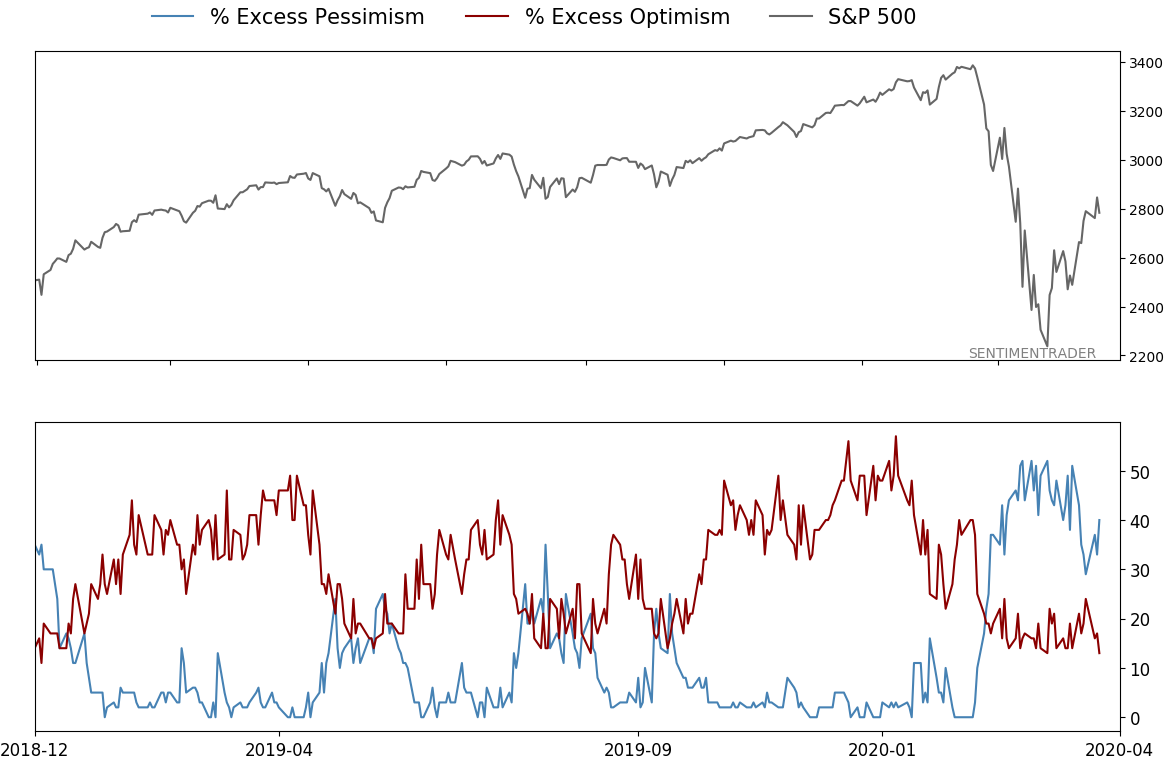
To check, the chart below shows the S&P 500's 10-day Up Issues Ratio in blue. This compares each day's advancing stocks to the total number of advancing and declining stocks, no matter how much they advanced or declined each day. The red line is the same ratio, but only includes stocks that rose or fell more than 0.5% each day, so it excludes any stock that showed a small gain or loss.
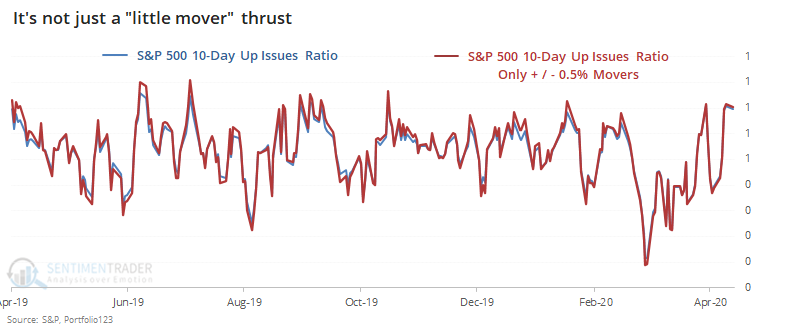
There is virtually no difference between the ratios, which suggests that the current thrust is not due to a bunch of stocks showing small gains.
As most stocks attempt to recover from the March devastation, we're seeing more and more metrics return to a neutral level. That has caused some issues during prolonged bear markets, and it's something to watch for here. During recoveries from some of the worst sell-offs in history, these initial recoveries often led to some short-term whipsaws, but not major retracements.
Active Studies
| Time Frame | Bullish | Bearish | | Short-Term | 0 | 2 | | Medium-Term | 11 | 0 | | Long-Term | 32 | 3 |
|
Indicators at Extremes
Portfolio
| Position | Weight % | Added / Reduced | Date | | Stocks | 73.2 | Added 31.3% | 2020-03-17 | | Bonds | 0.0 | Reduced 6.7% | 2020-02-28 | | Commodities | 5.5 | Added 2.4%
| 2020-02-28 | | Precious Metals | 0.0 | Reduced 3.6% | 2020-02-28 | | Special Situations | 0.0 | Reduced 31.9% | 2020-03-17 | | Cash | 21.3 | | |
|
Updates (Changes made today are underlined)
In the first months of the year, we saw manic trading activity. From big jumps in specific stocks to historic highs in retail trading activity to record highs in household confidence to almost unbelievable confidence among options traders. All of that has come amid a market where the average stock can’t keep up with their indexes. There were signs of waning momentum in stocks underlying the major averages, which started triggering technical warning signs in late January. The kinds of extremes we saw in December and January typically take months to wear away, but the type of selling we’ve seen over the past month has gone a long way toward getting there. When we place the kind of moves we saw into March 23 into the context of coming off an all-time high, there has been a high probability of a multi-month rebound. The volatility we’ve seen lately is extremely compelling from a medium-term point of view. Virtually everything we’ve looked at suggests a strong probability of gains over the next several months, even within the context of a potential bear market, and even from what had been higher prices. After stocks bottomed on the 23rd, they enjoyed a historic buying thrust. While other signs are mixed at best that panic is subsiding, that thrust is one of the most encouraging sign we've seen in years. There is often a test of a panic low in the weeks after an initial recovery, but that thrust we saw, combined with the larger-than-usual retracement, have me less convinced a test is necessary. For now, I see no overwhelming reason to add or reduce exposure.
RETURN YTD: -11.3% 2019: 12.6%, 2018: 0.6%, 2017: 3.8%, 2016: 17.1%, 2015: 9.2%, 2014: 14.5%, 2013: 2.2%, 2012: 10.8%, 2011: 16.5%, 2010: 15.3%, 2009: 23.9%, 2008: 16.2%, 2007: 7.8%
|
|
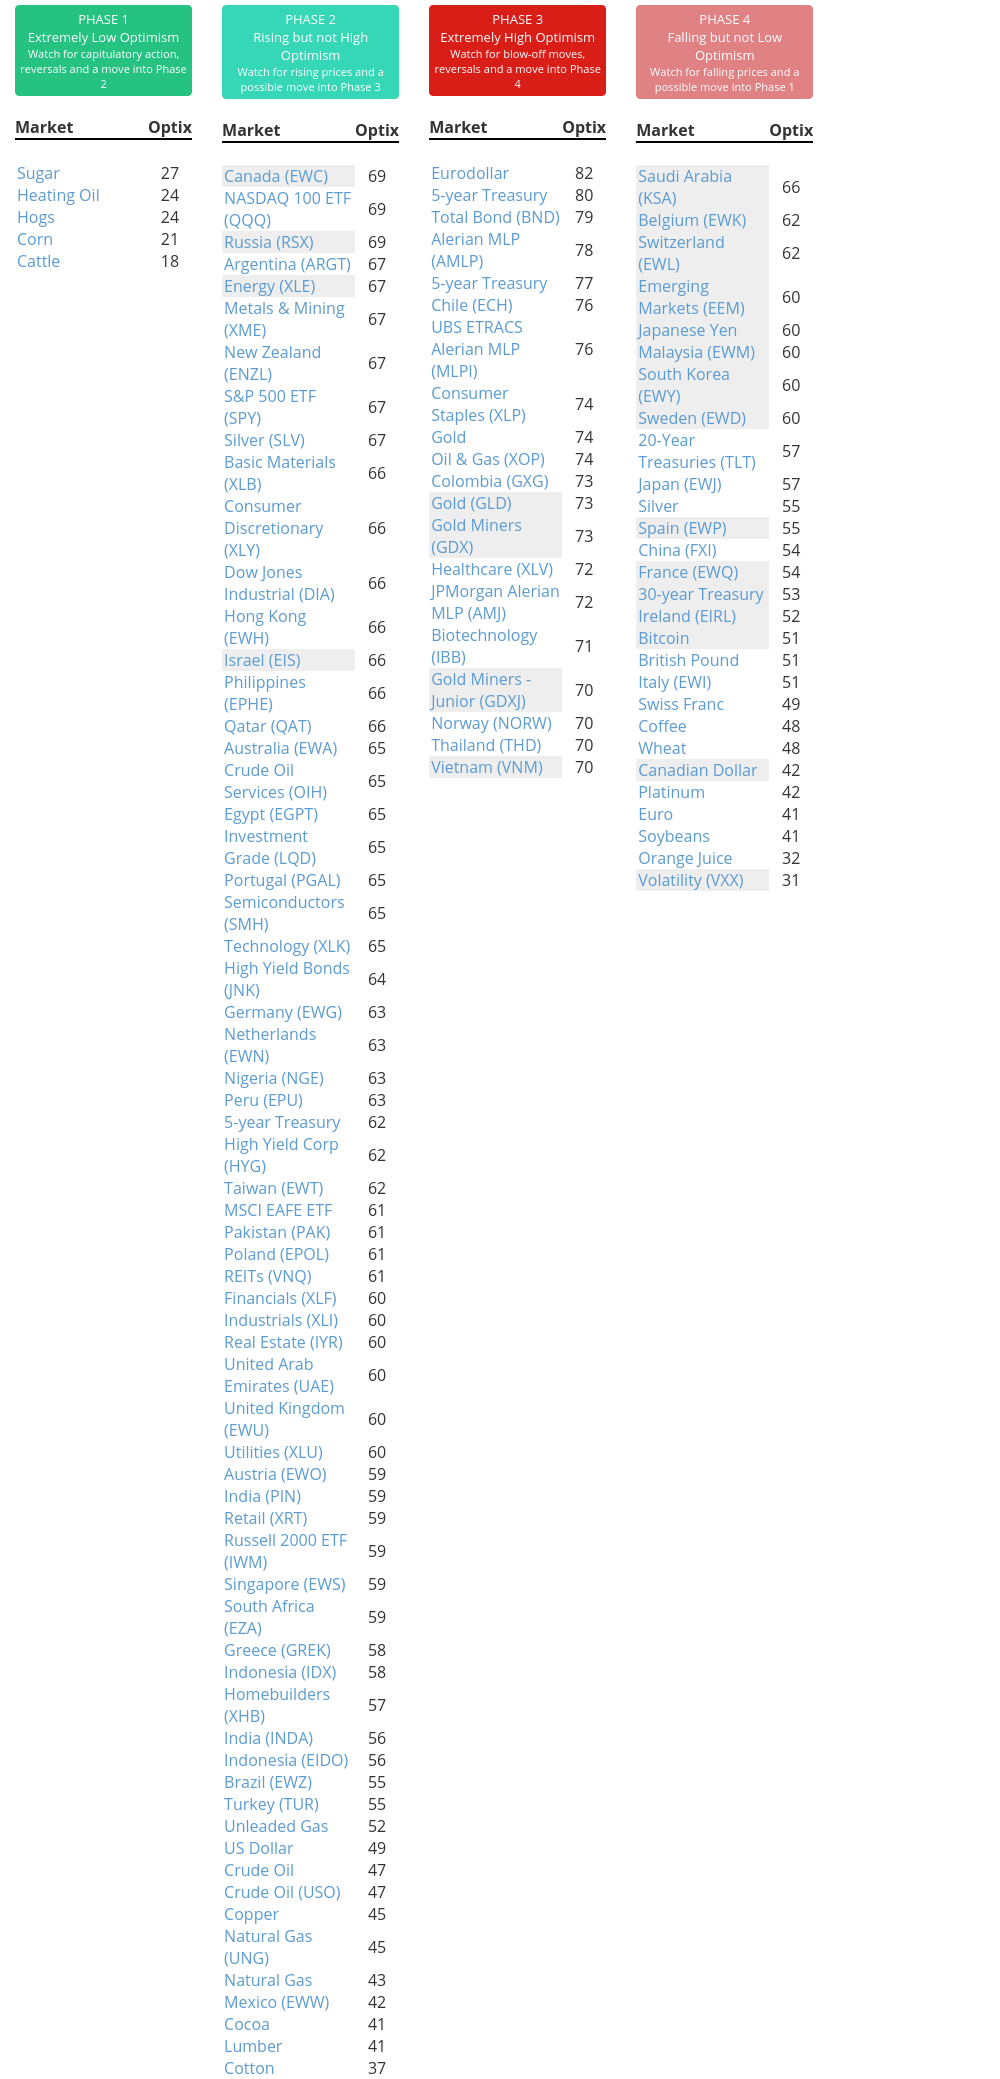
Phase Table
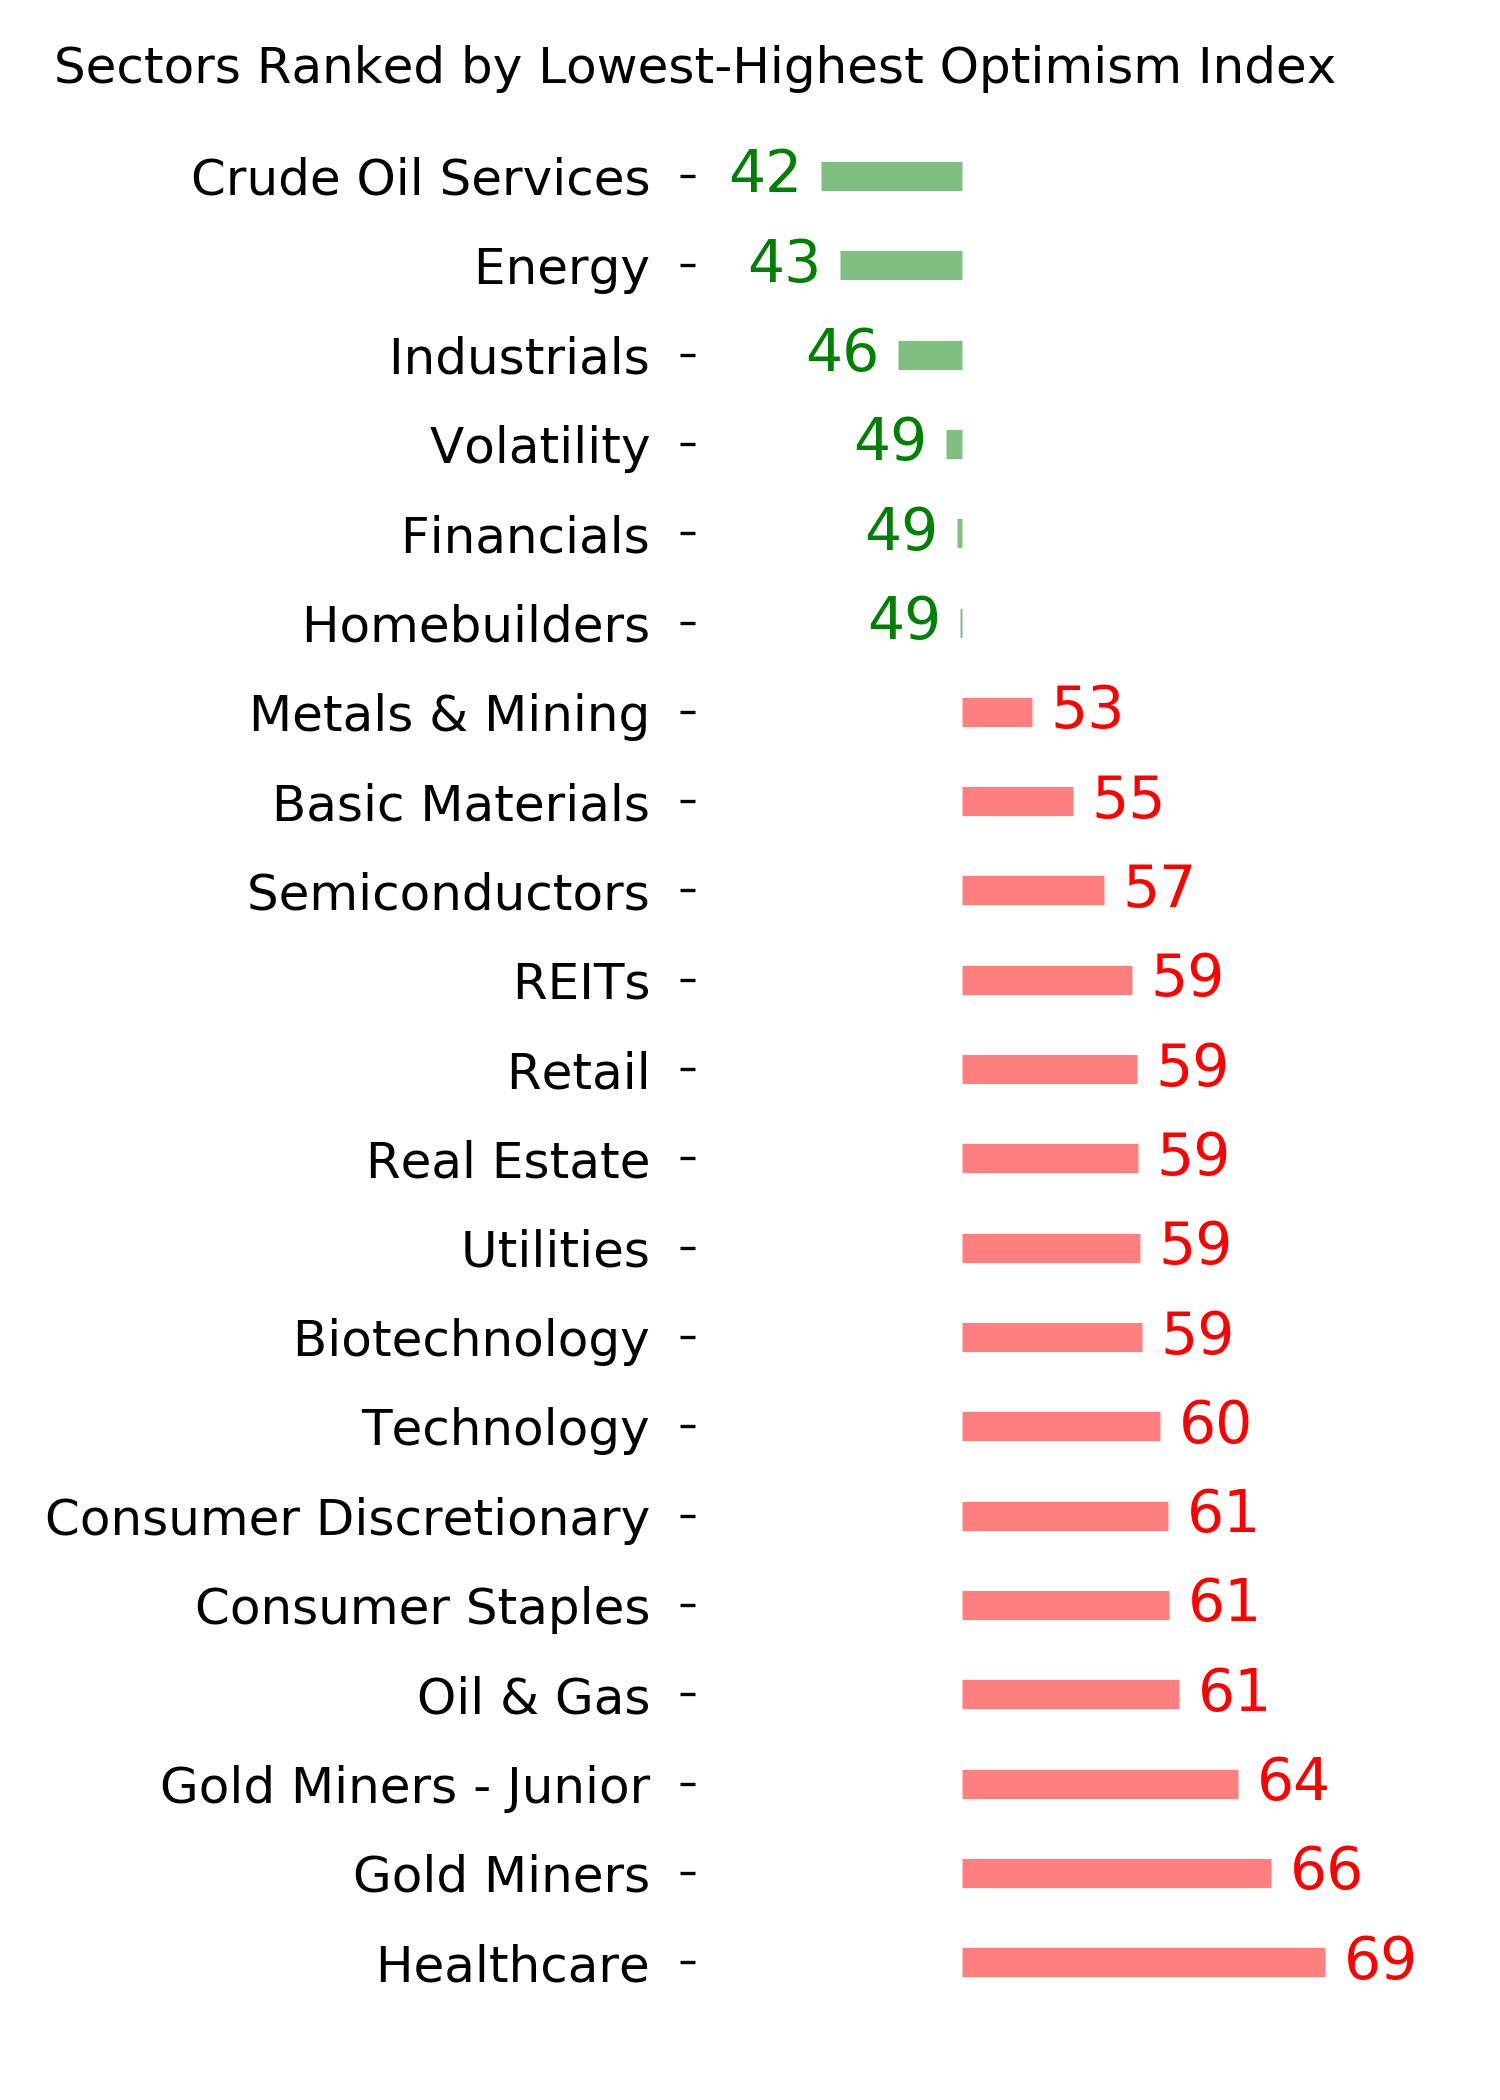
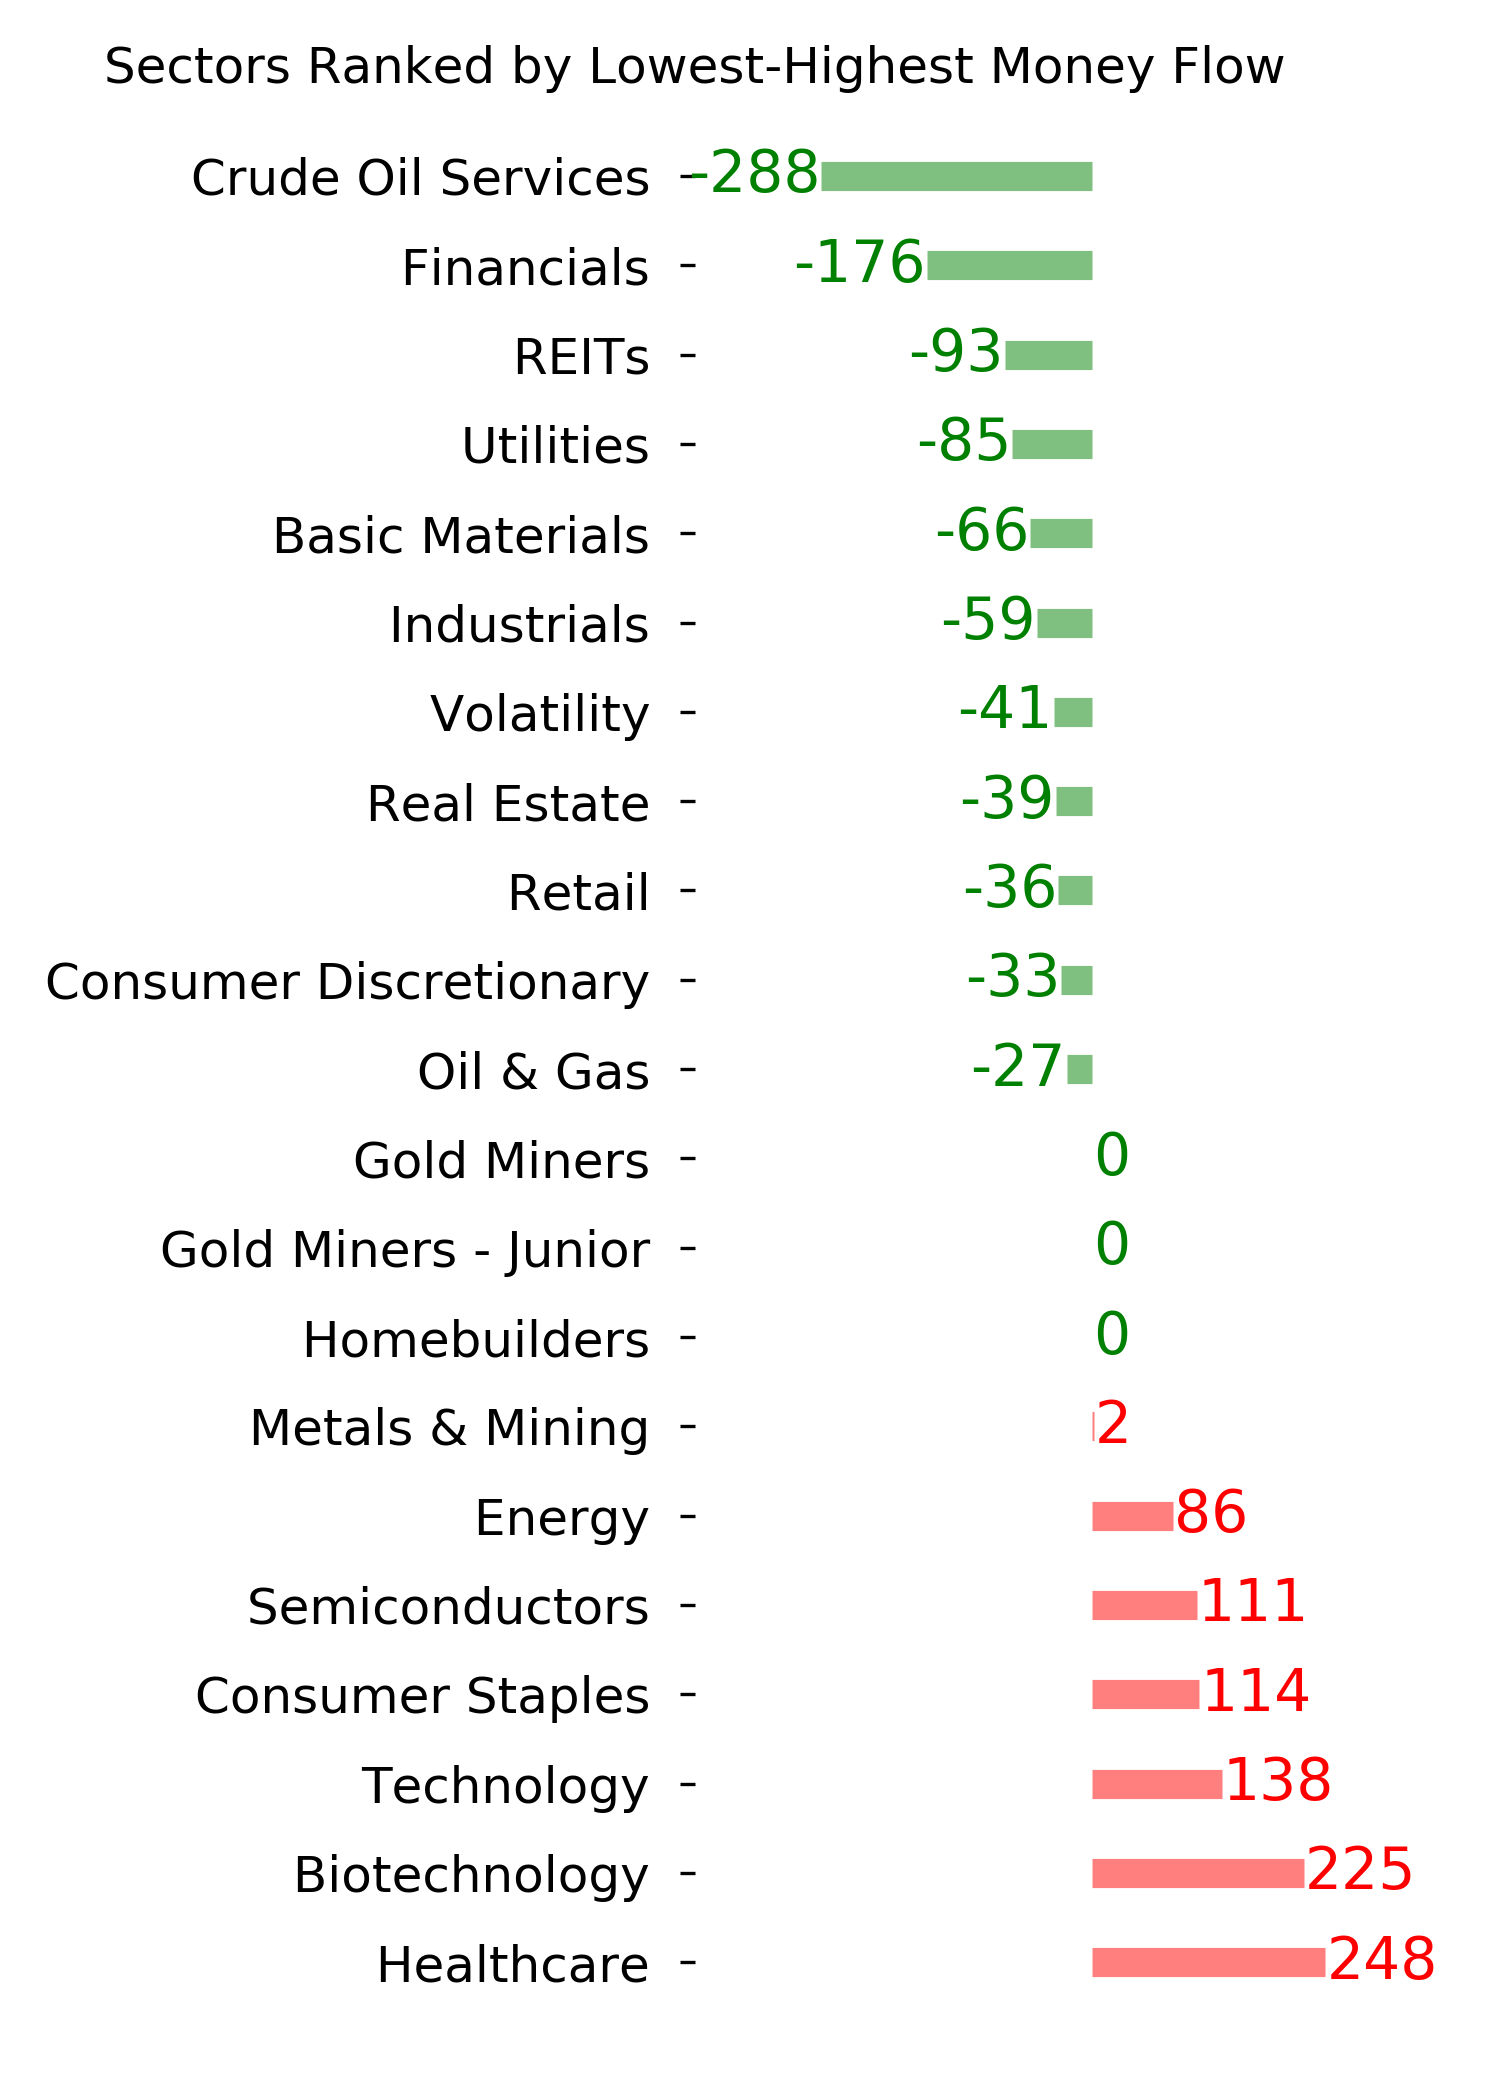
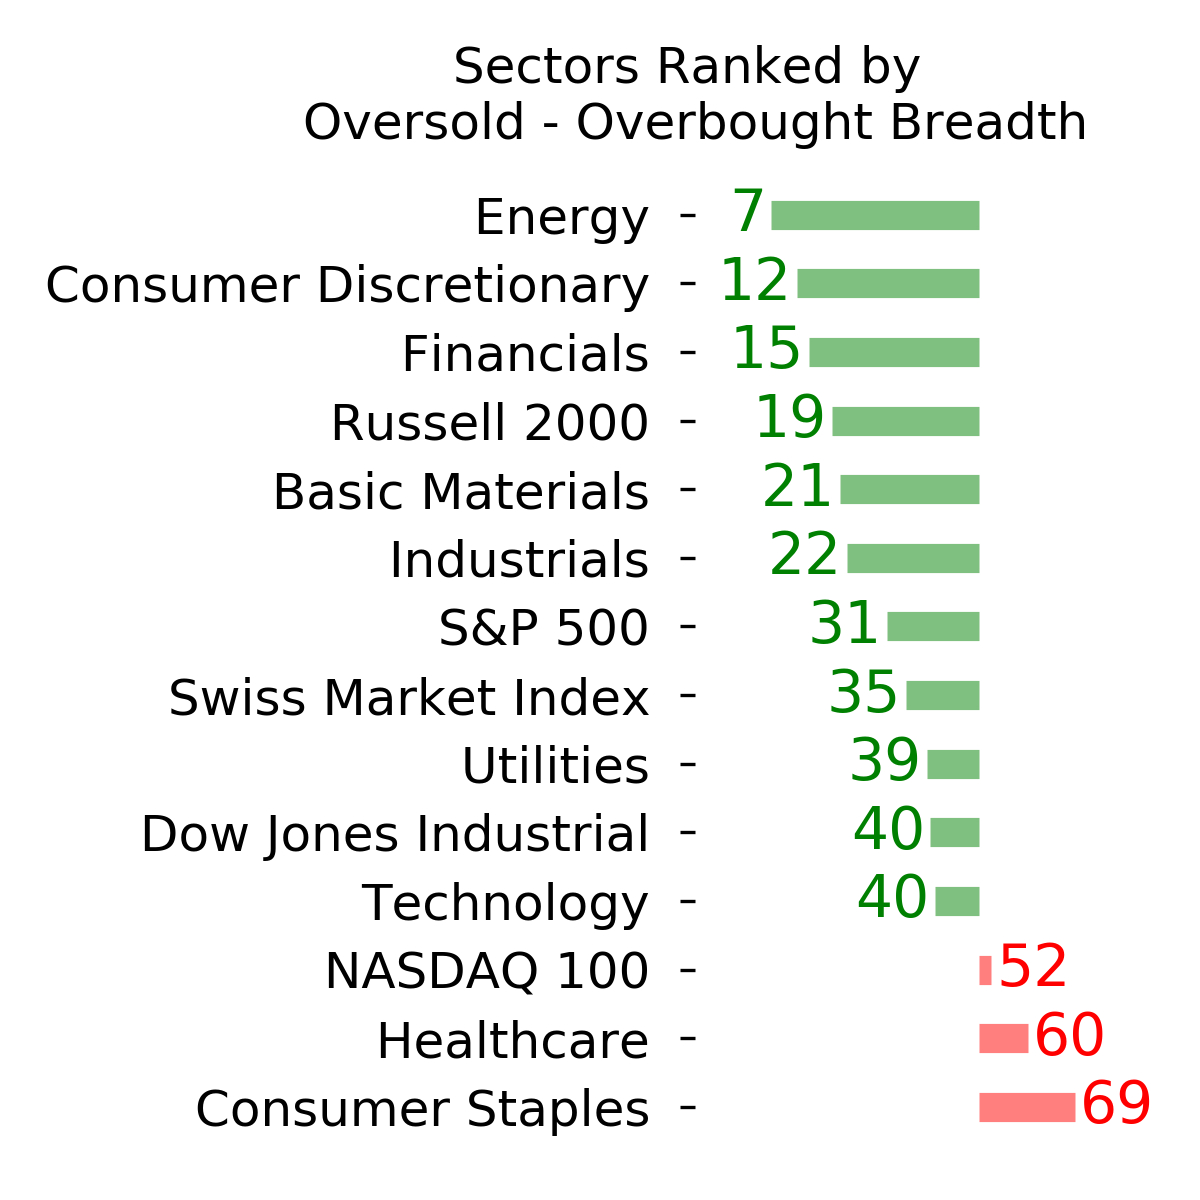
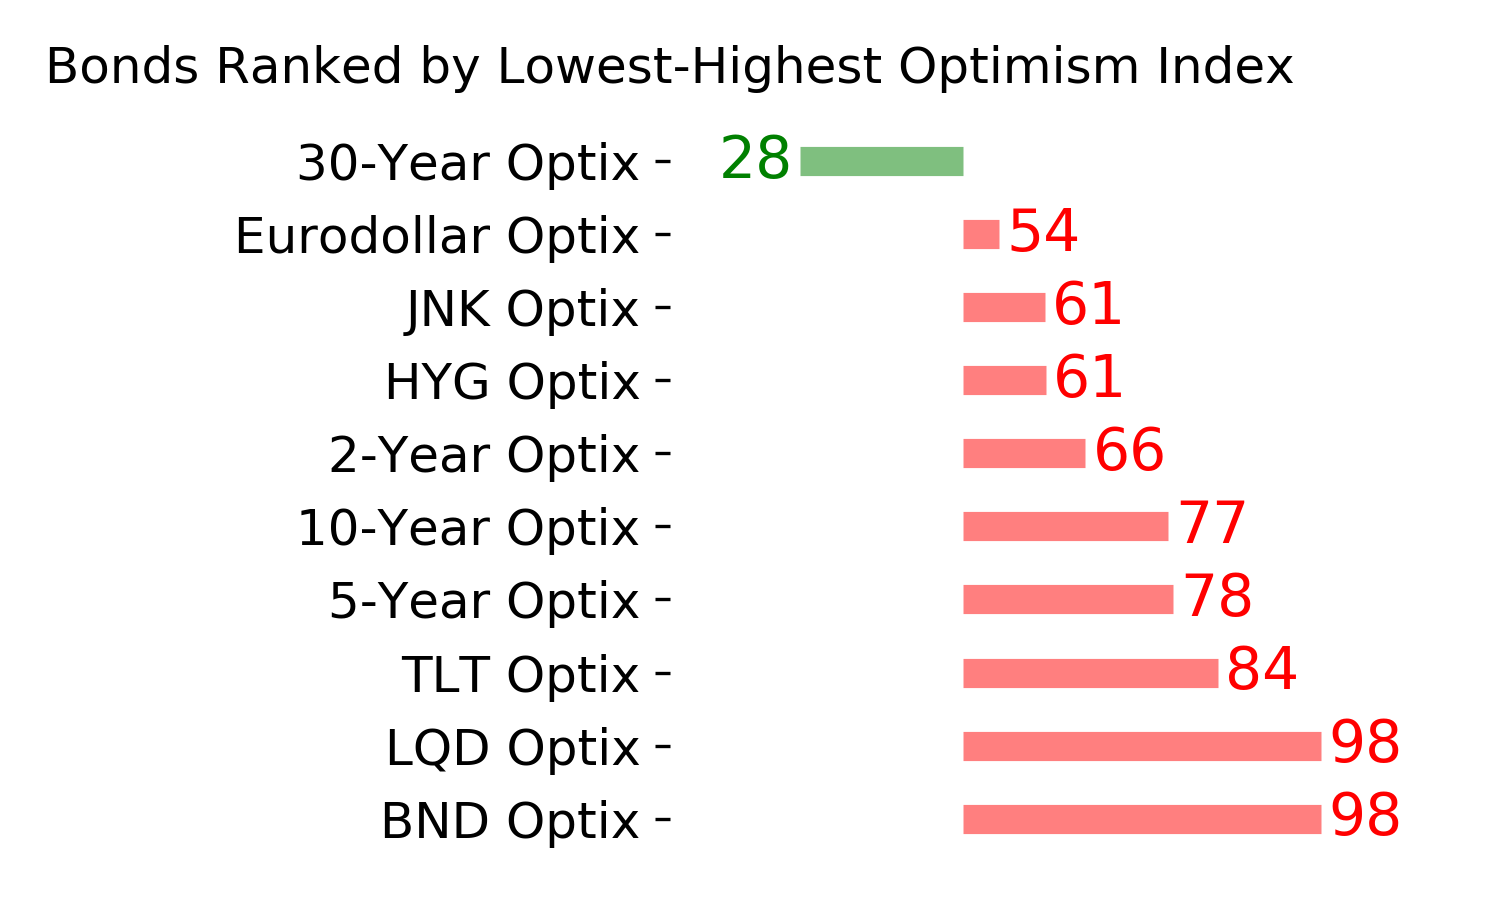
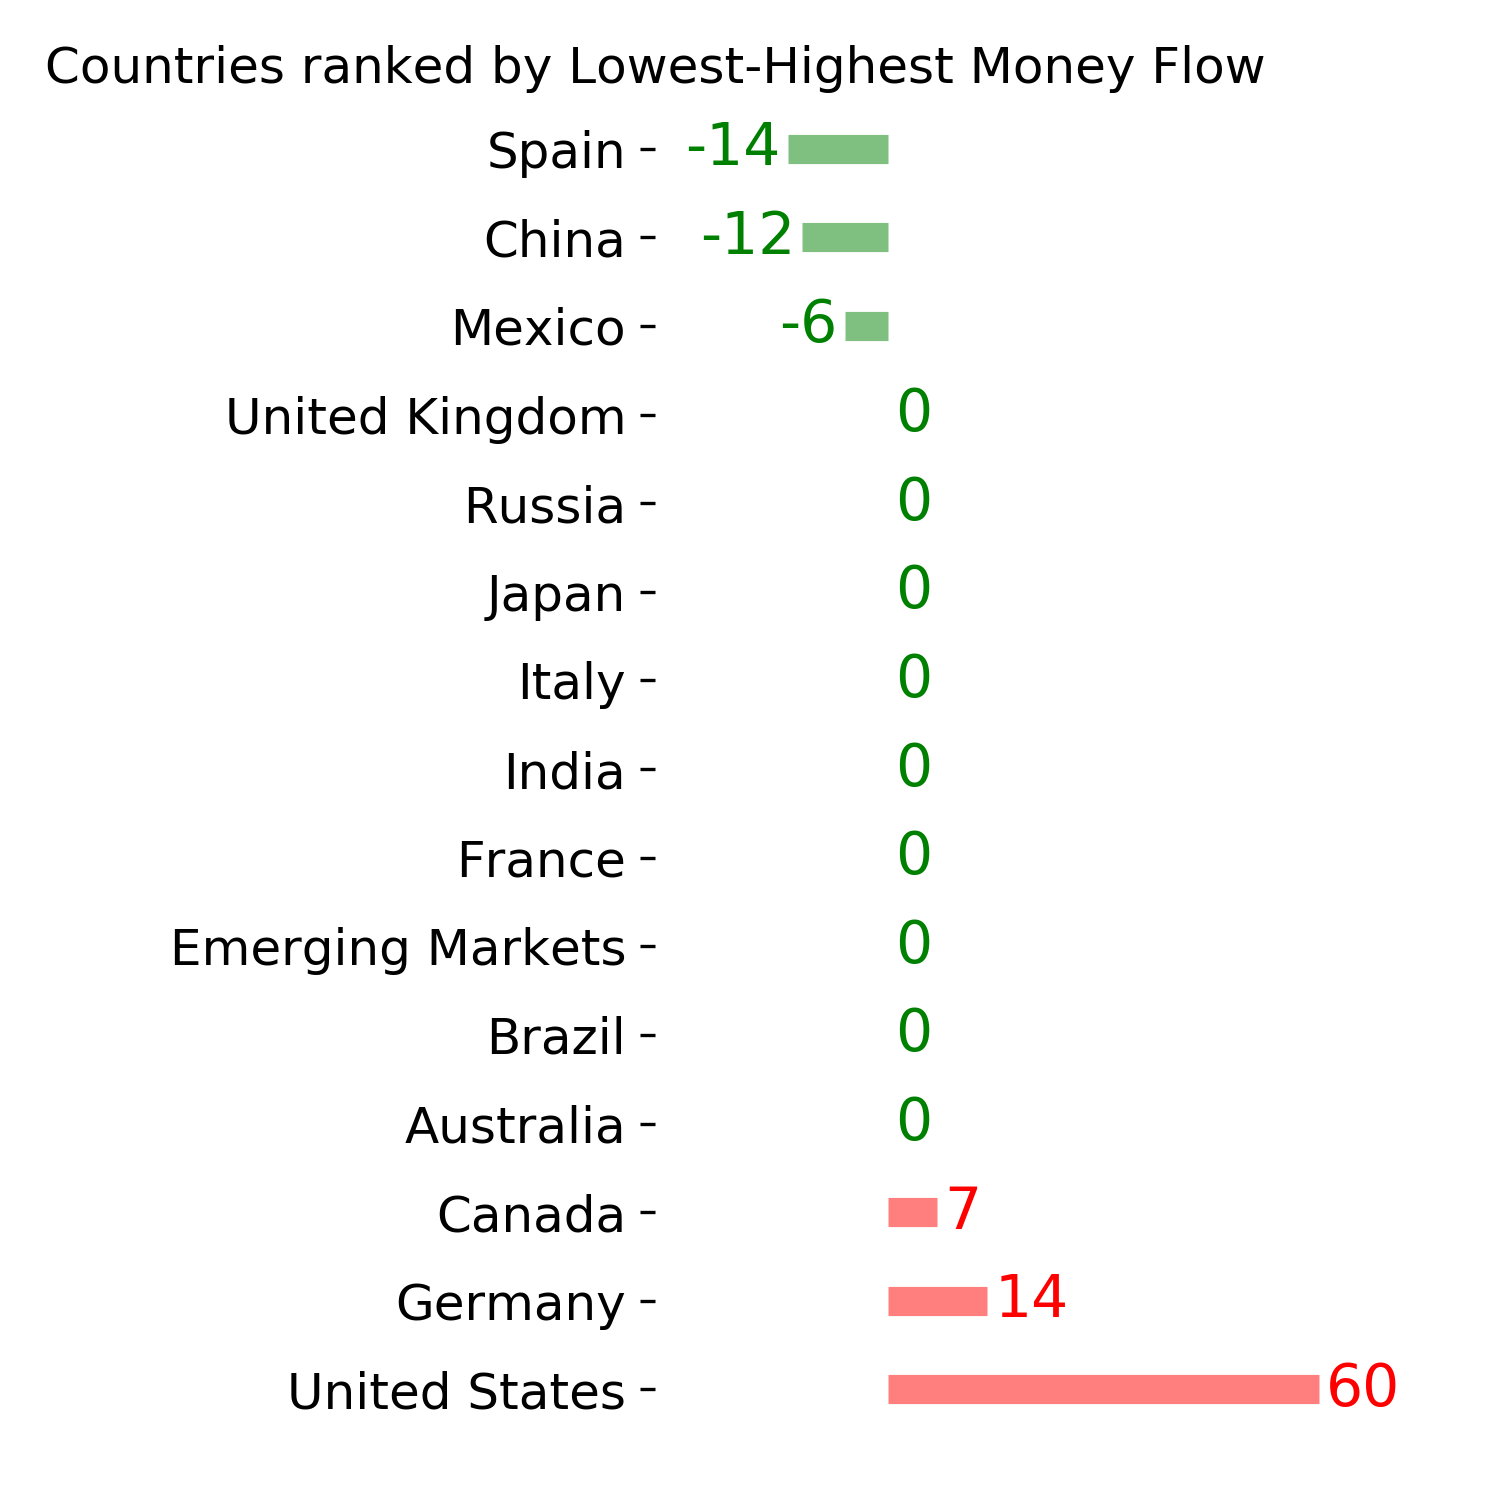
Ranks
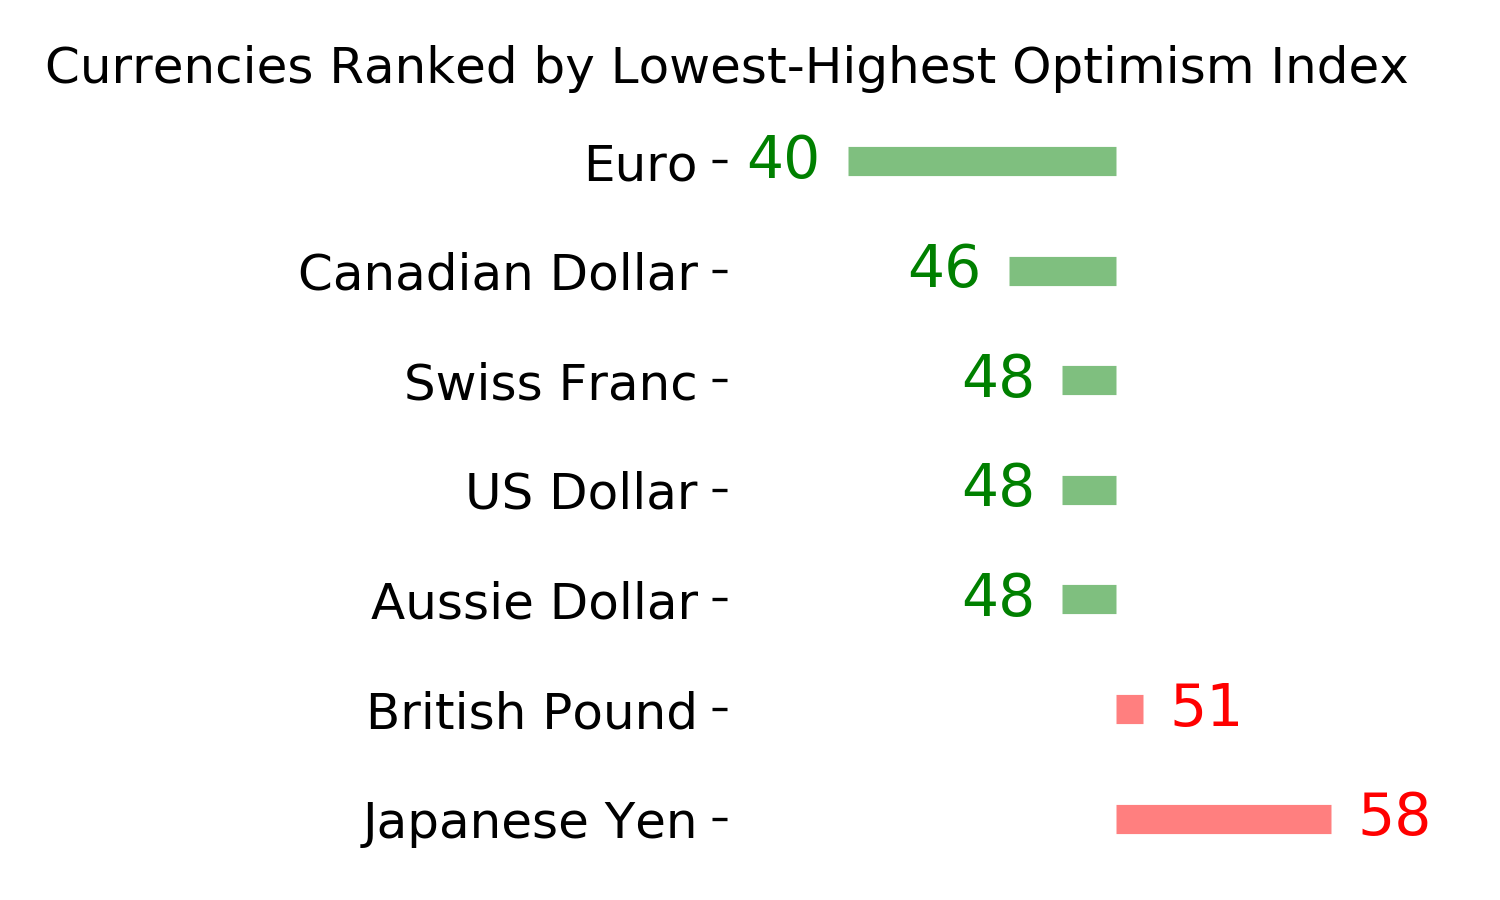
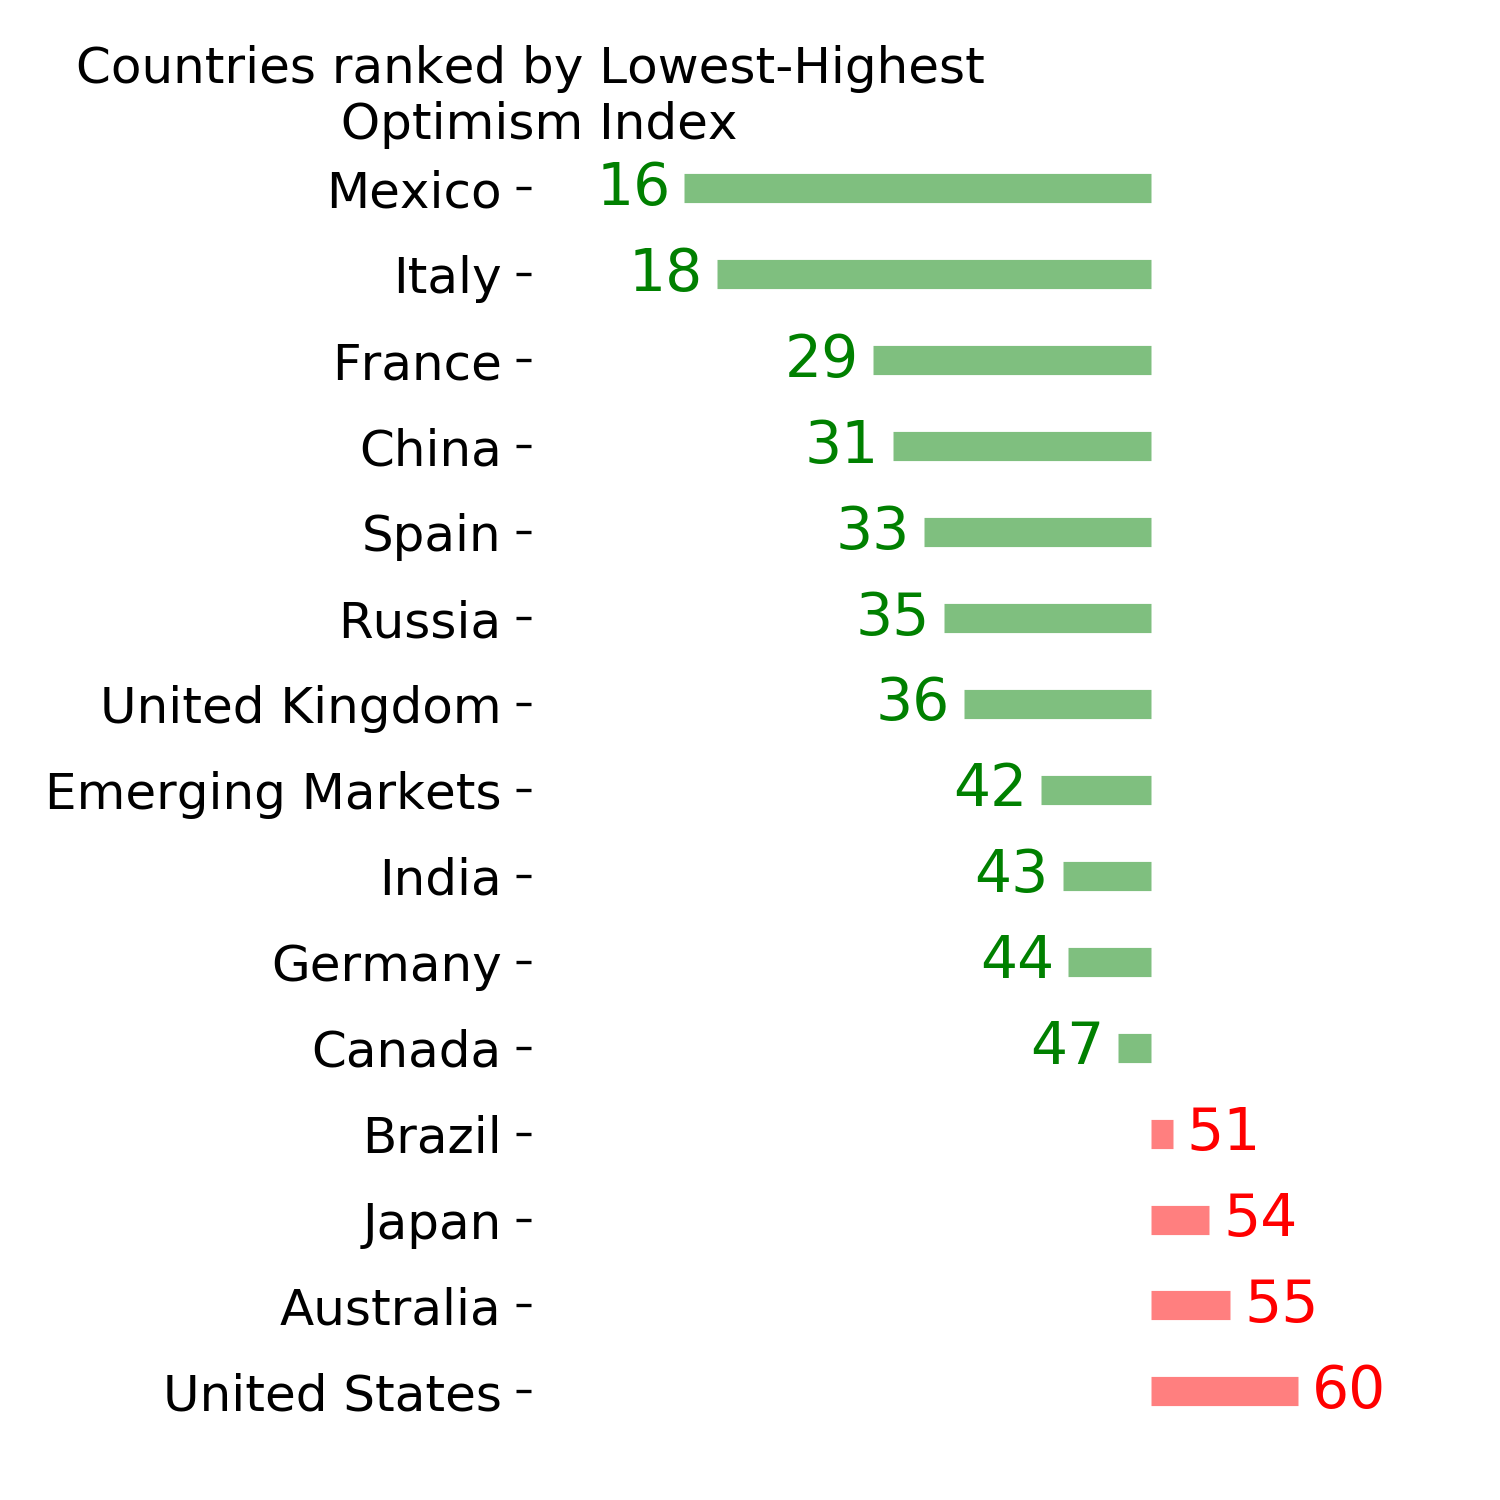
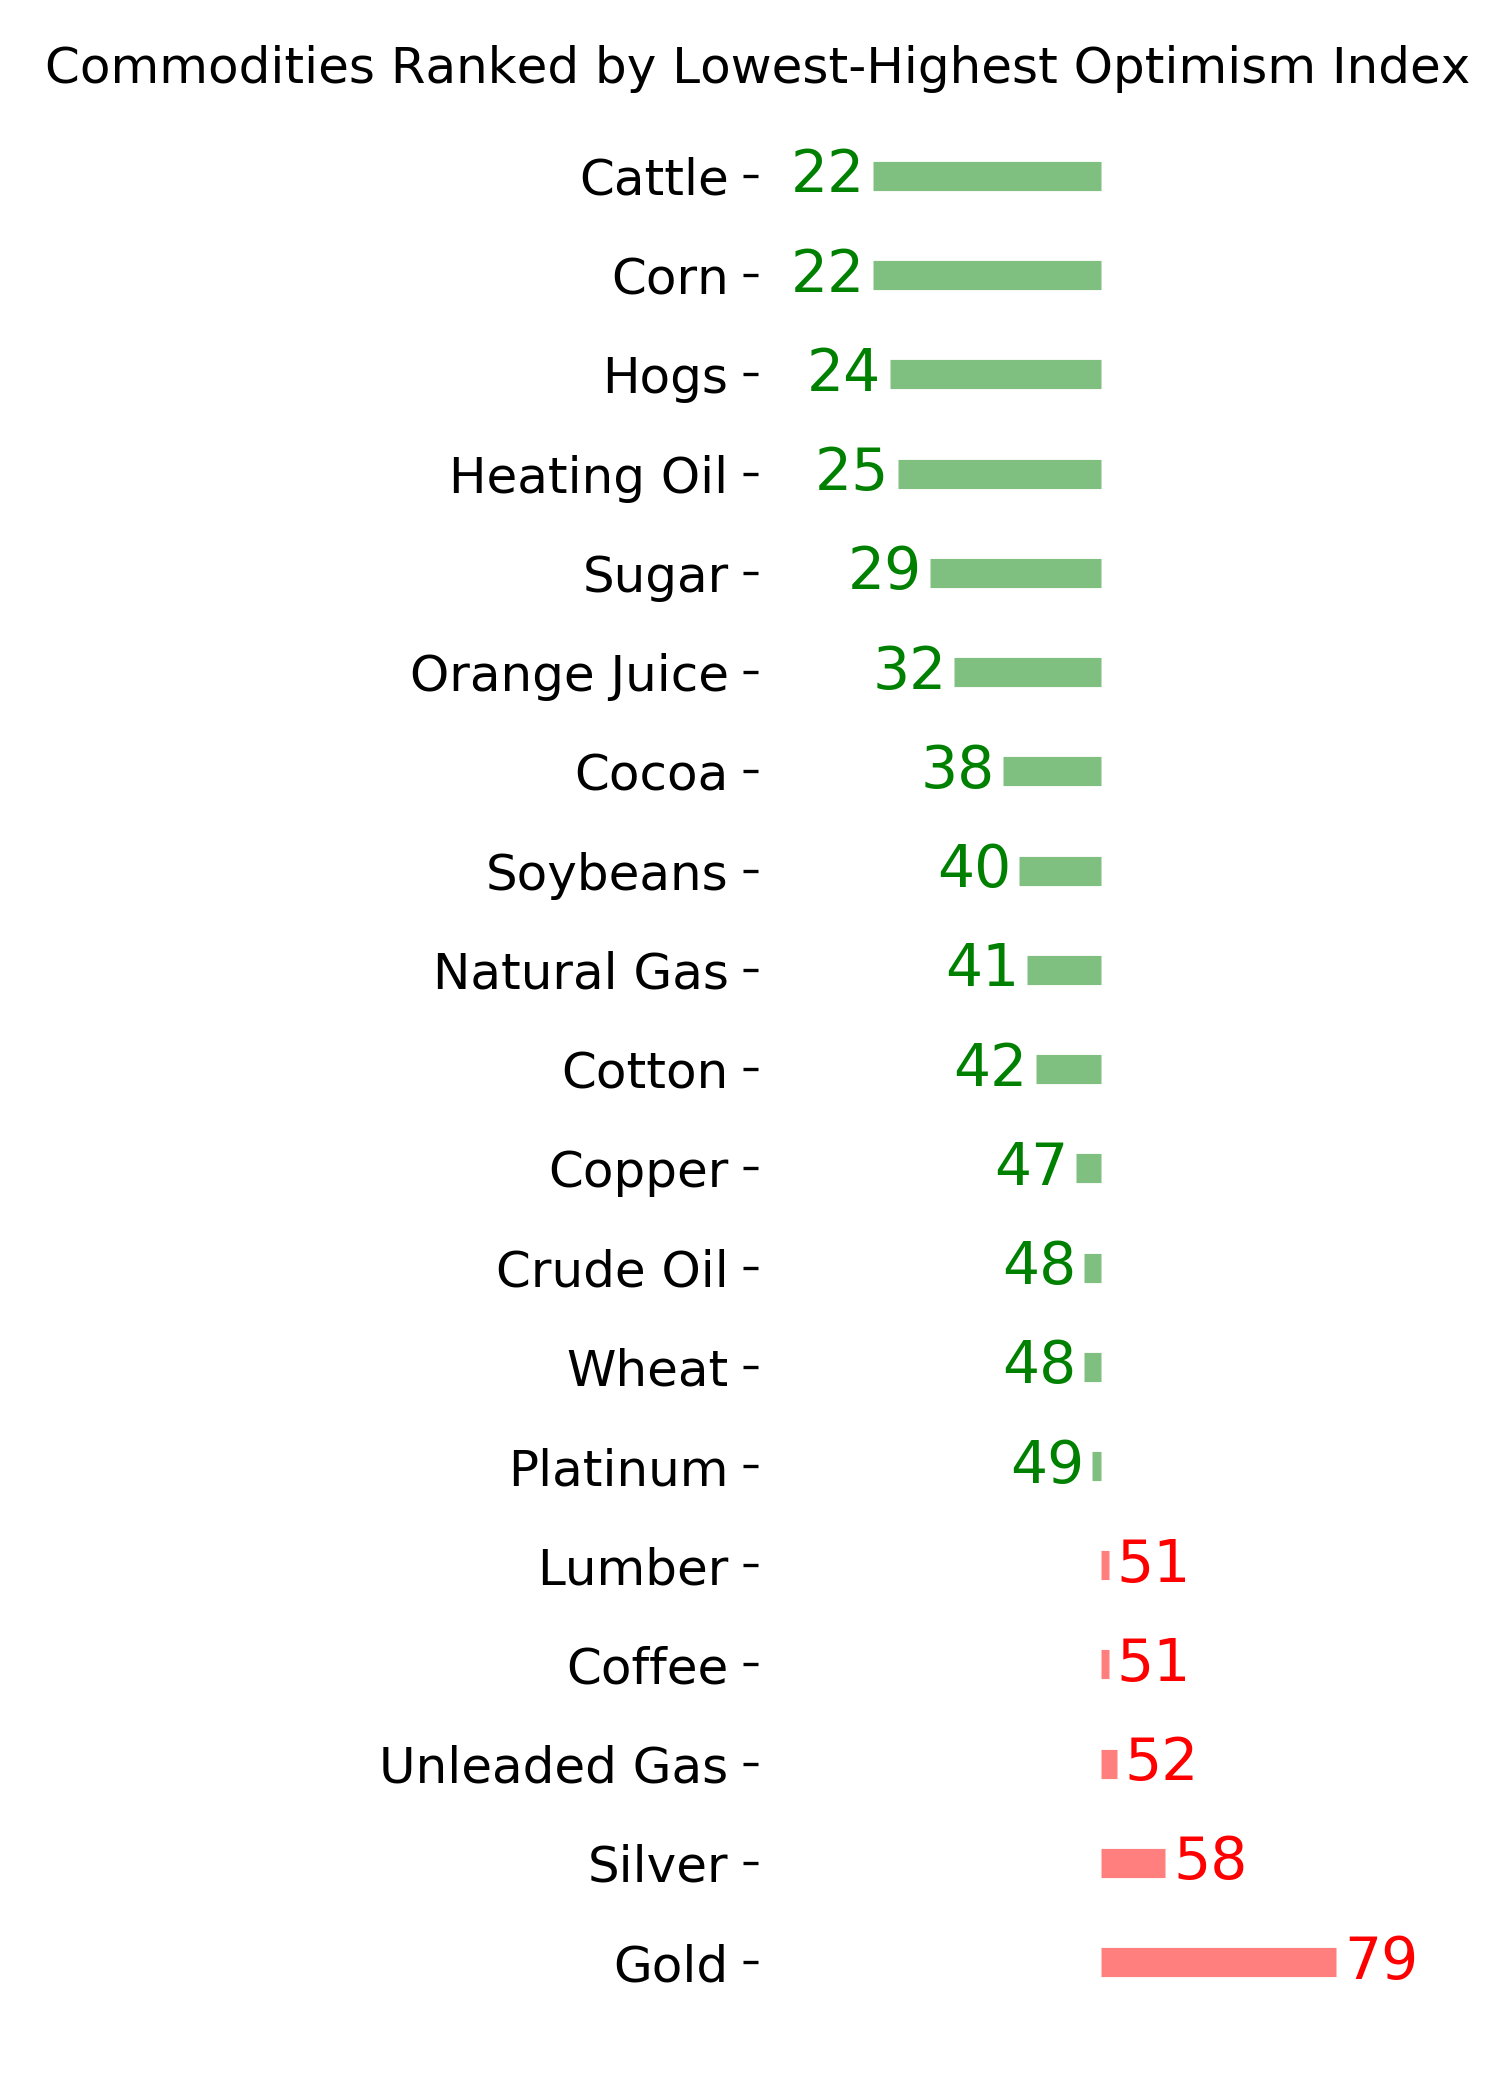
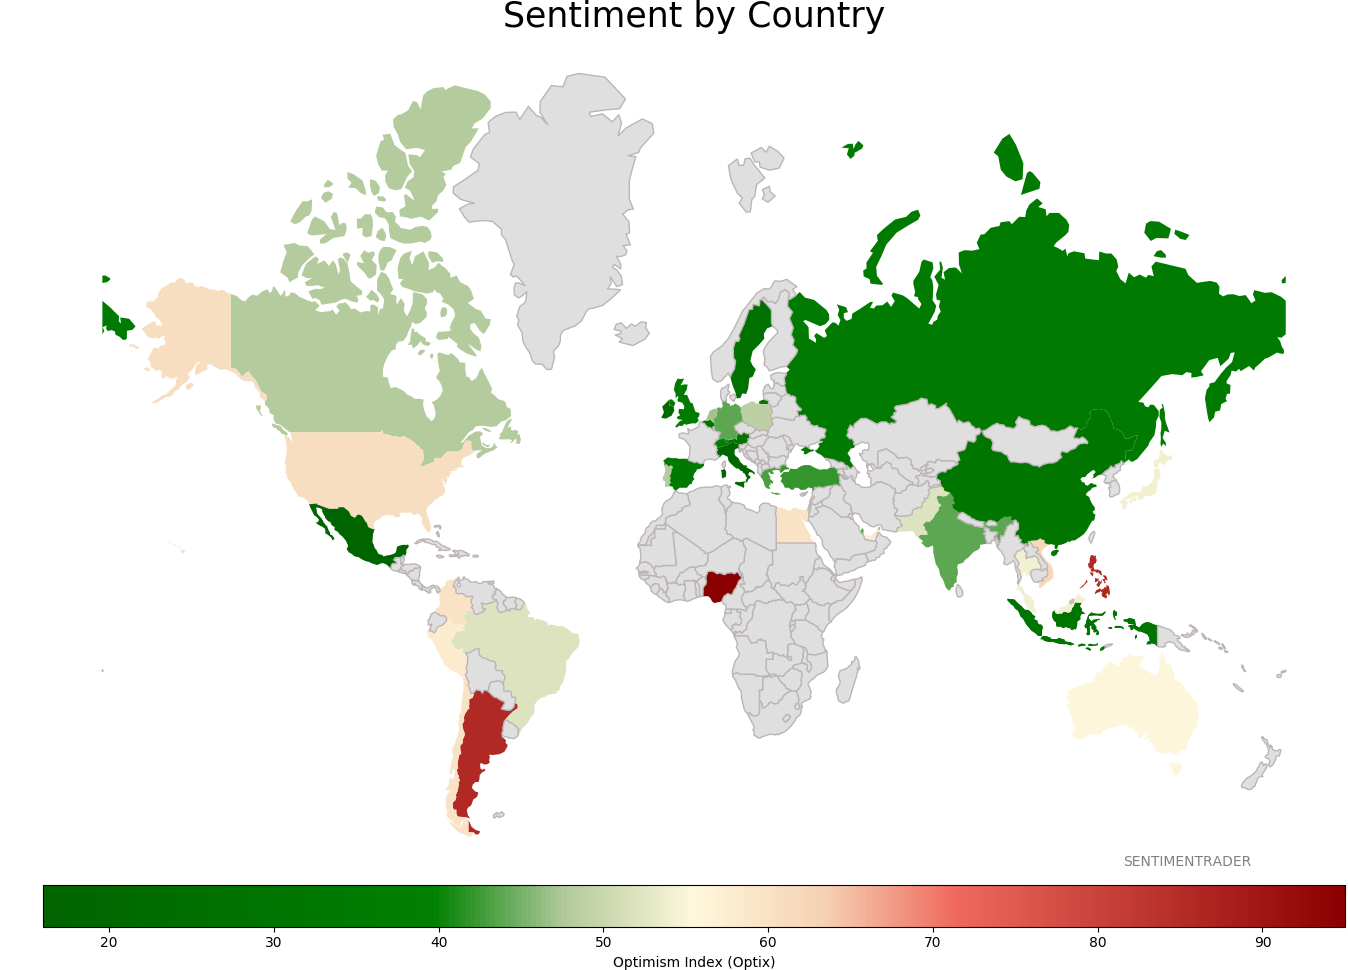
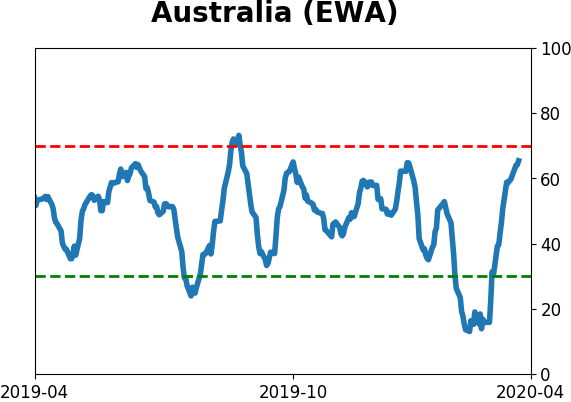
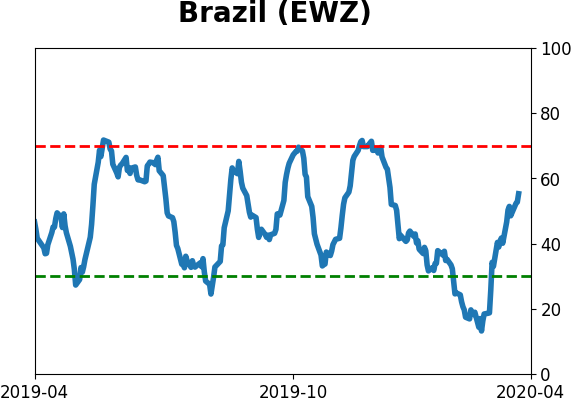
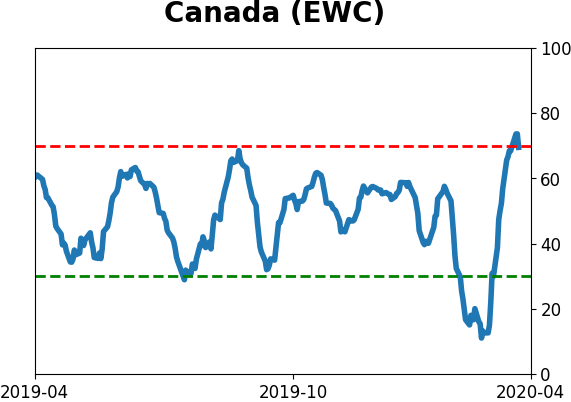
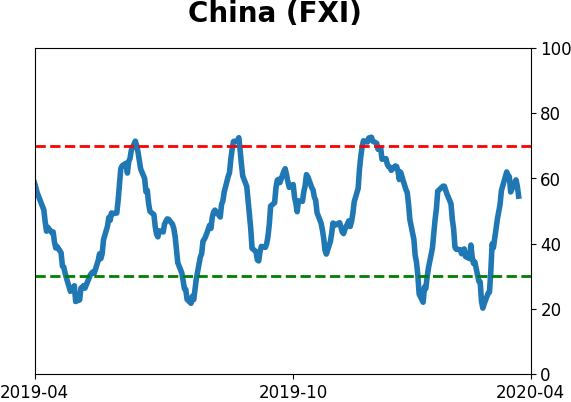
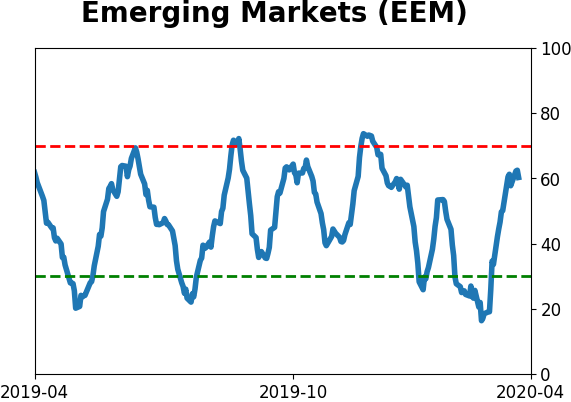
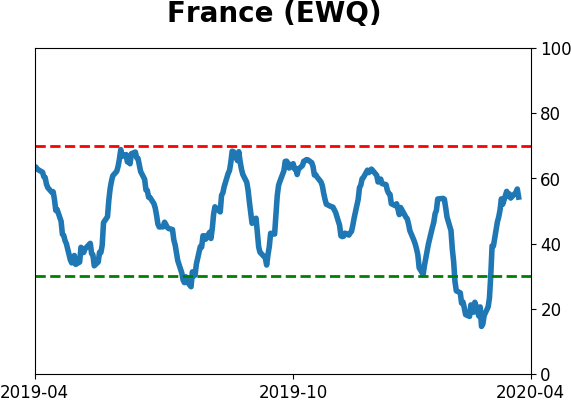
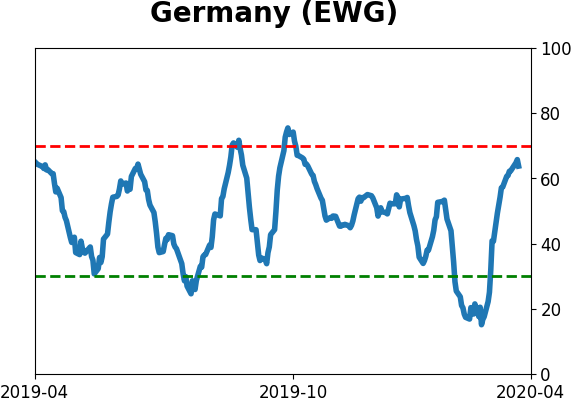
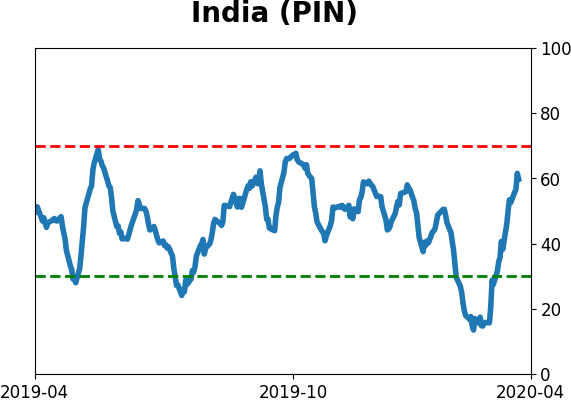
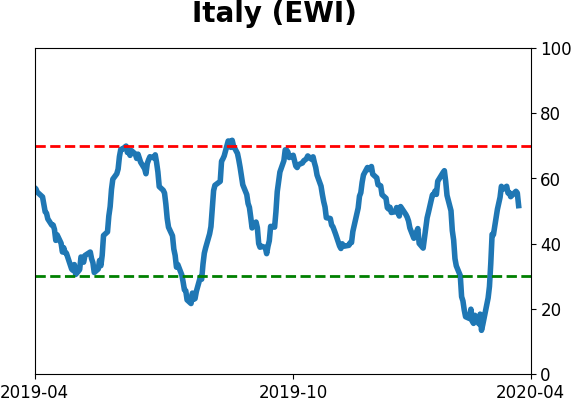
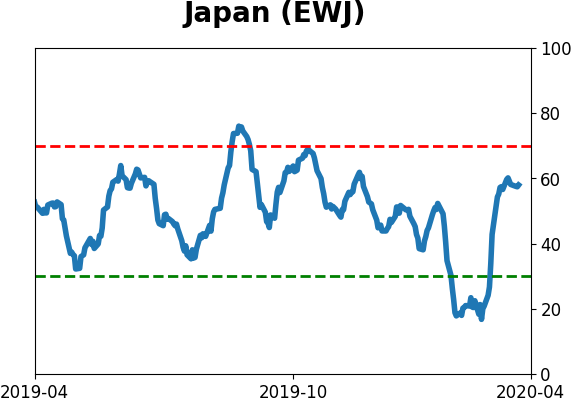
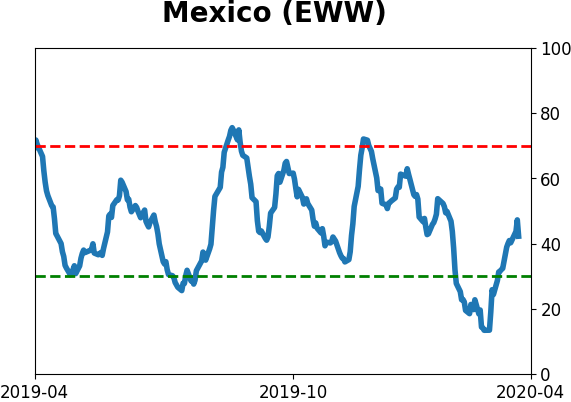
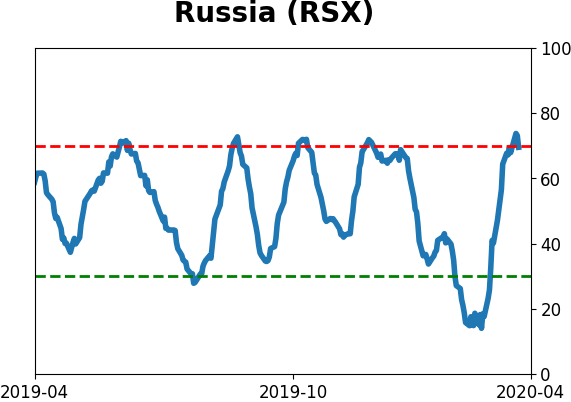
Sentiment Around The World
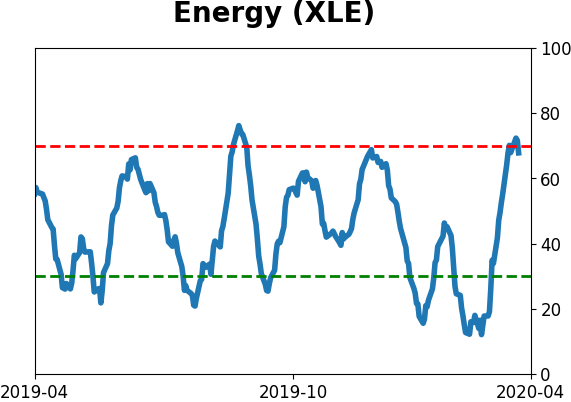
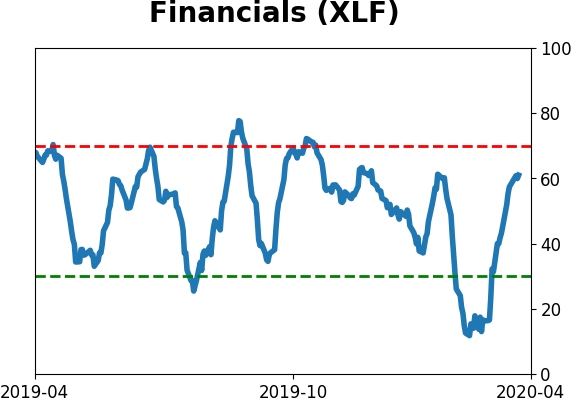
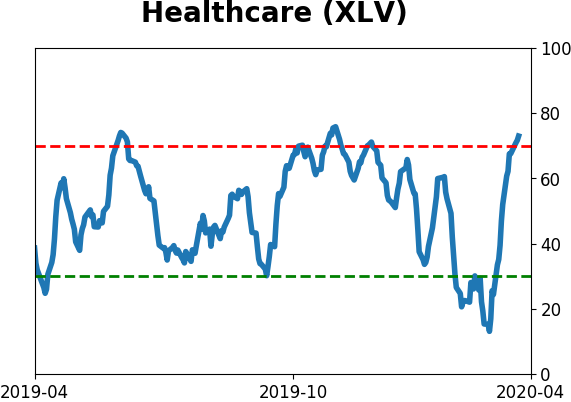
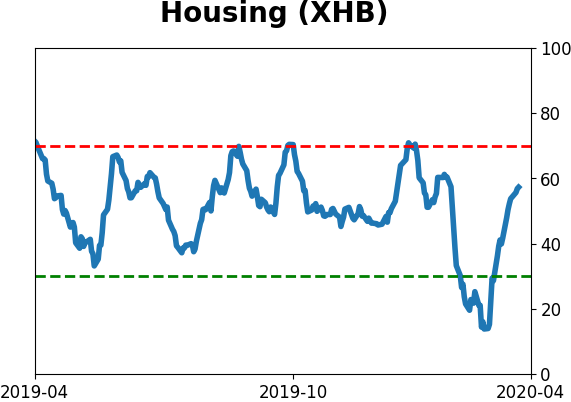
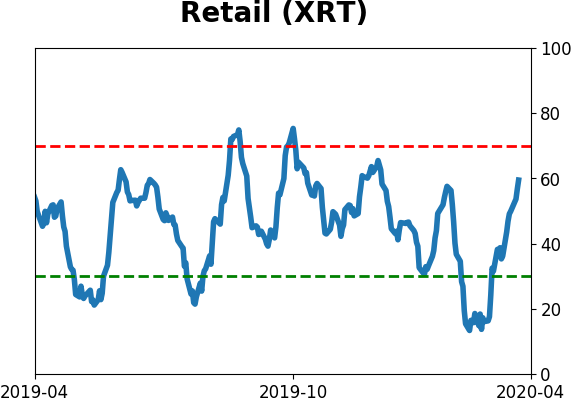
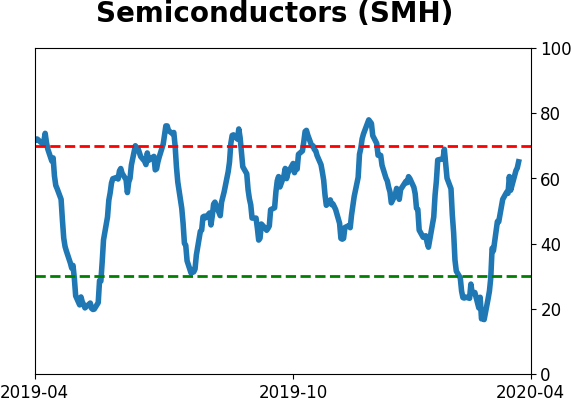
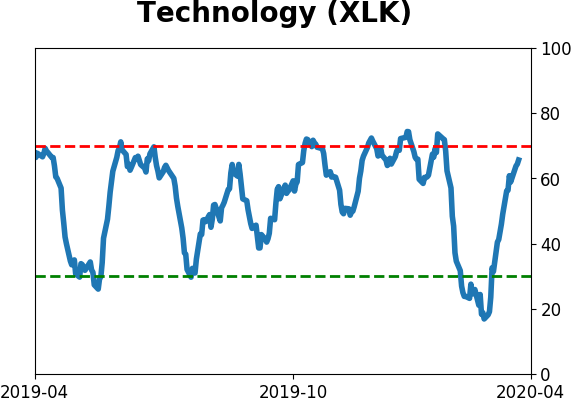
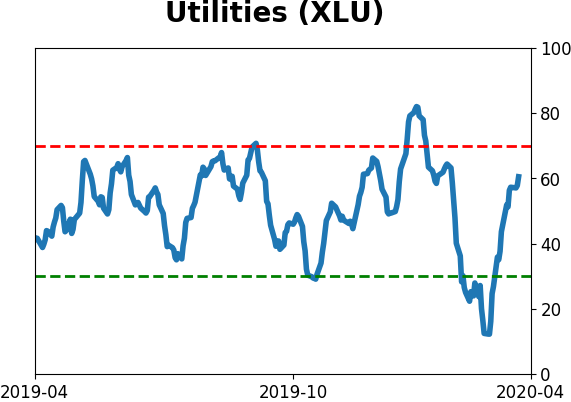
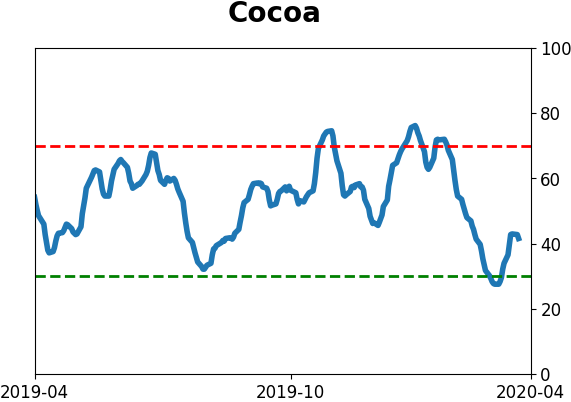
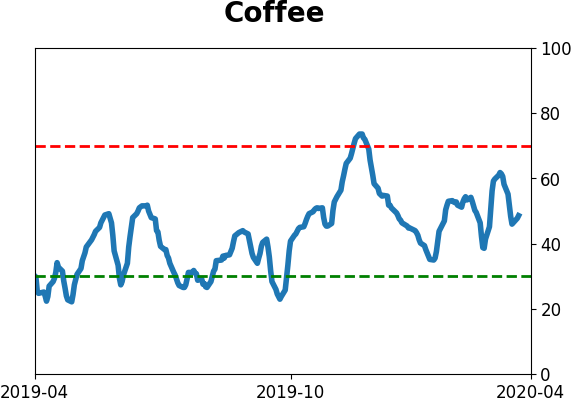
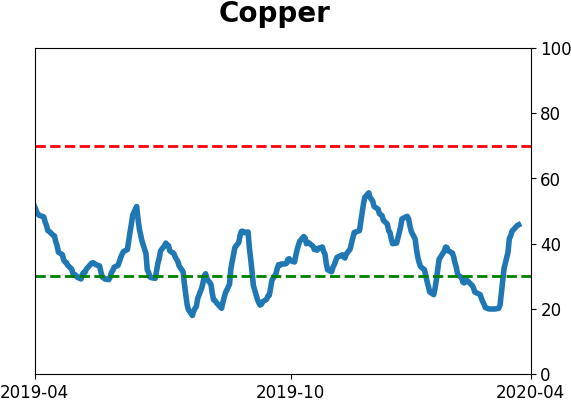
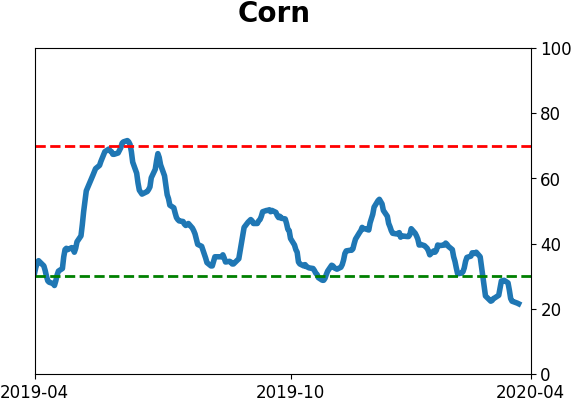
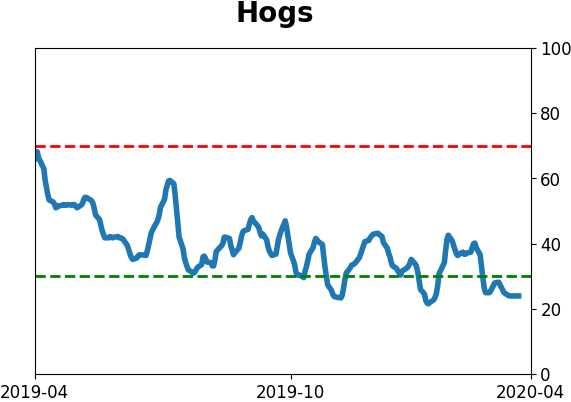
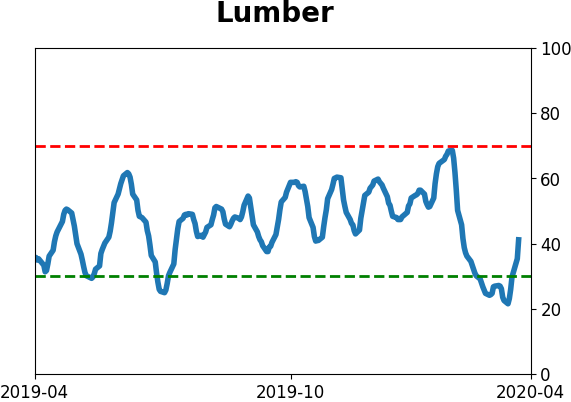
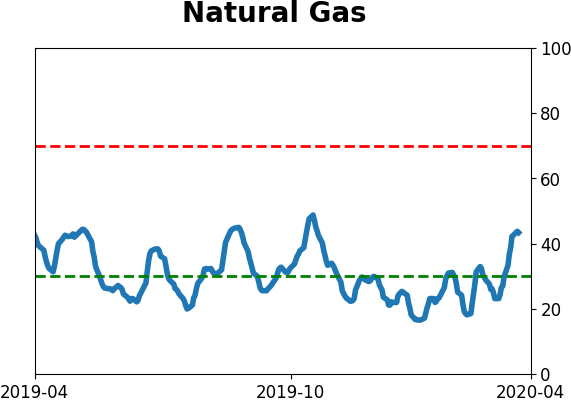
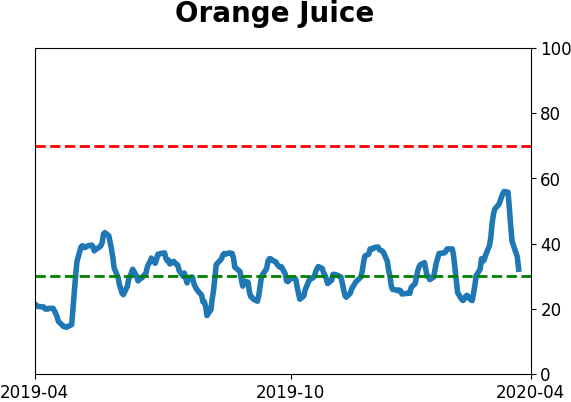
Optimism Index Thumbnails
|
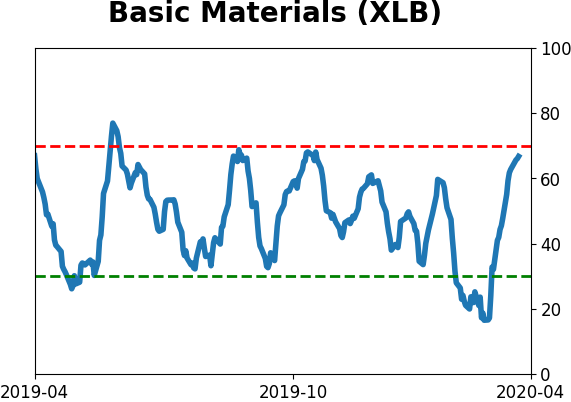
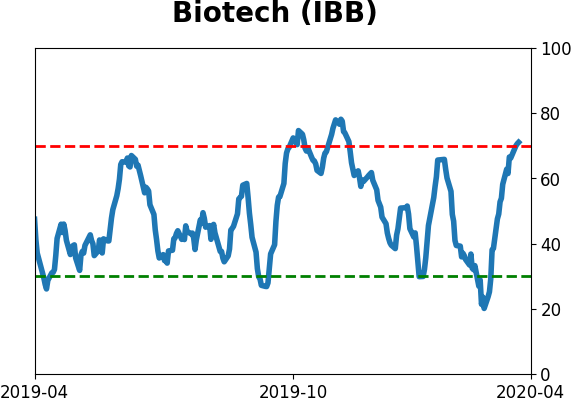
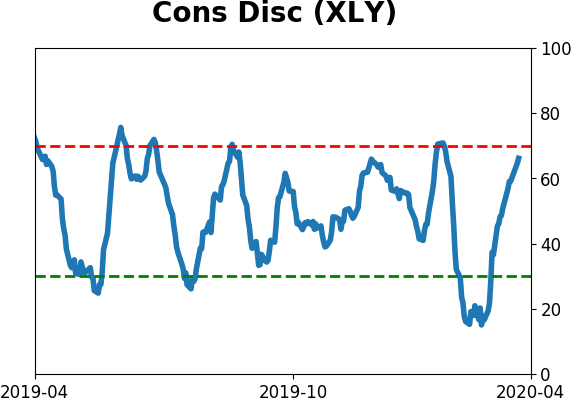
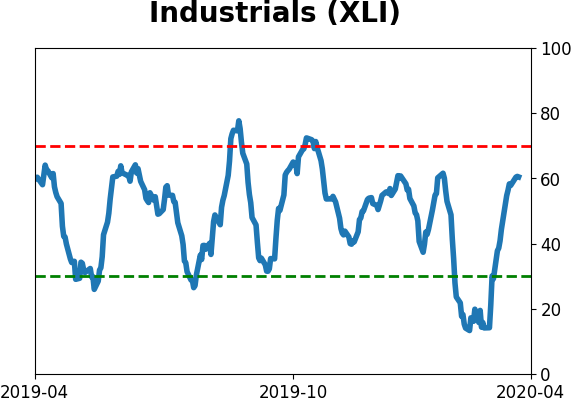
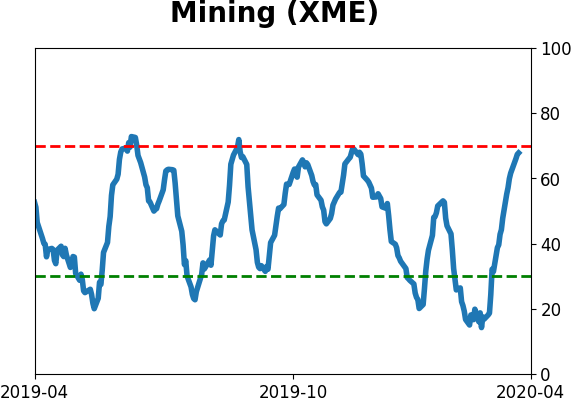
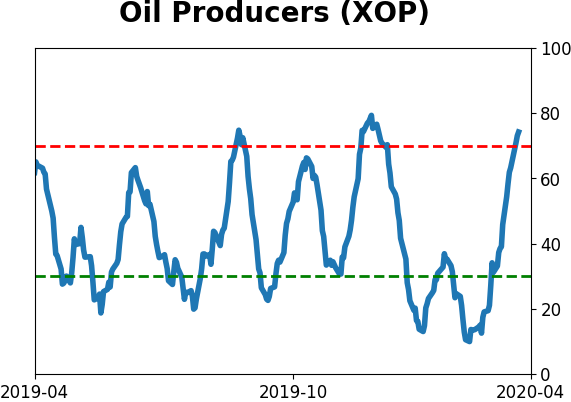
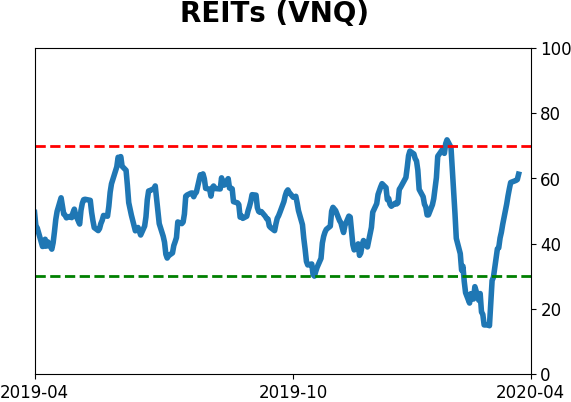
Sector ETF's - 10-Day Moving Average
|
|
|
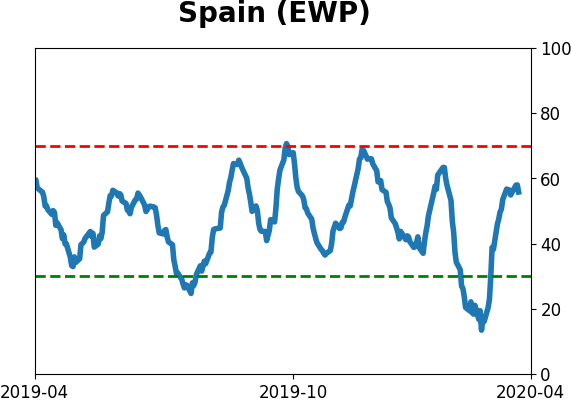
Country ETF's - 10-Day Moving Average
|
|
|
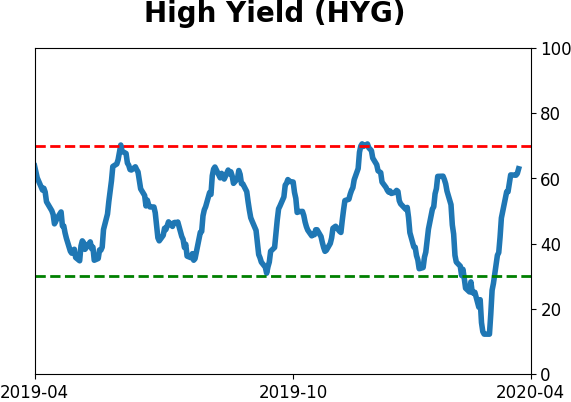
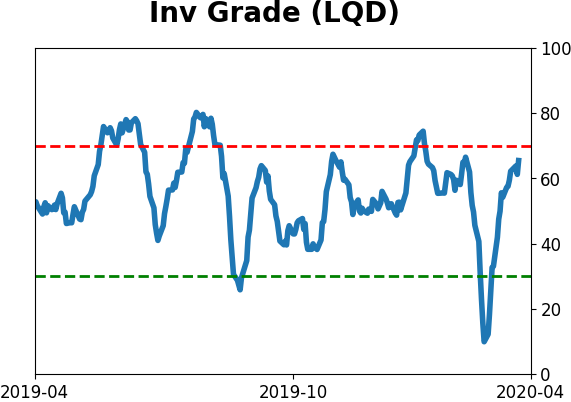
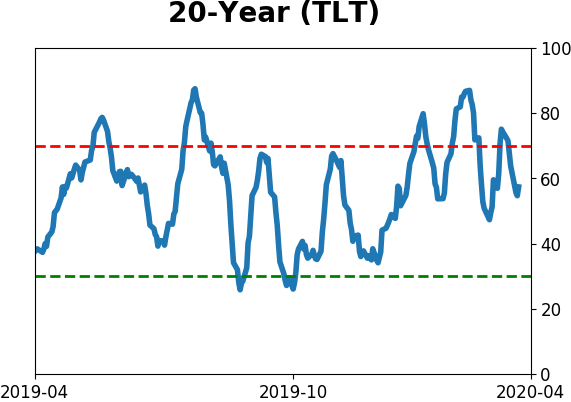
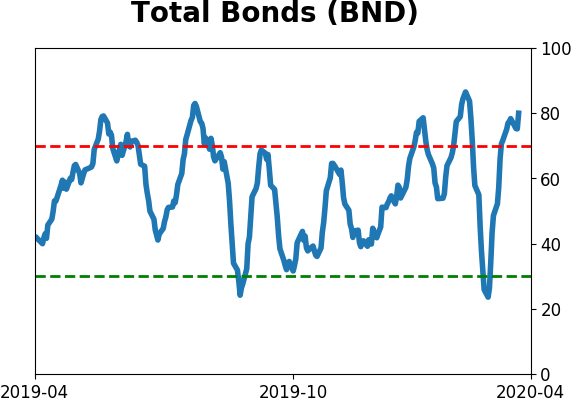
Bond ETF's - 10-Day Moving Average
|
|
|
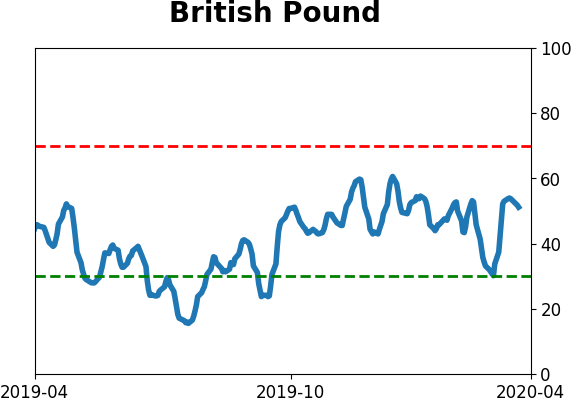
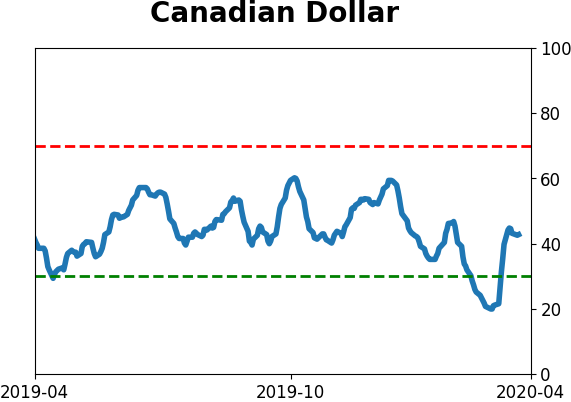
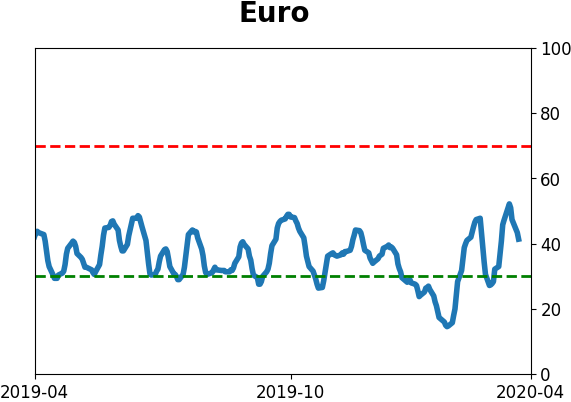
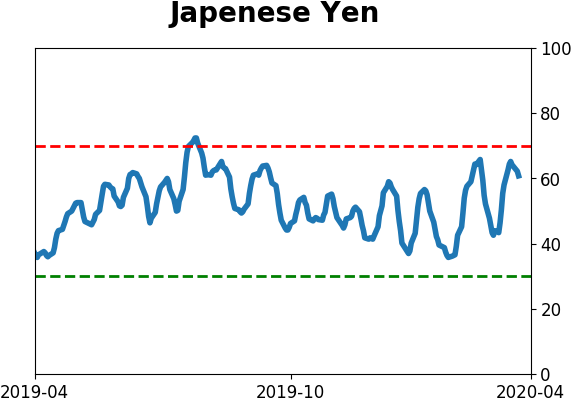
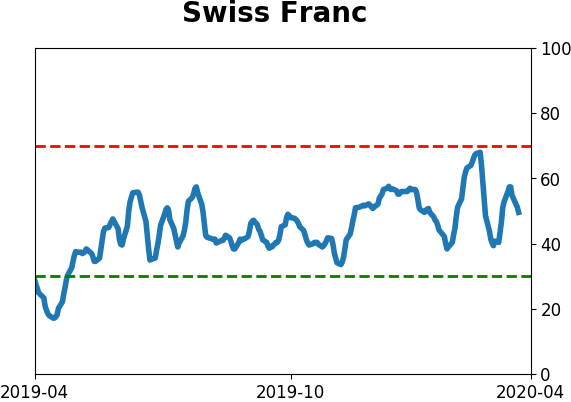
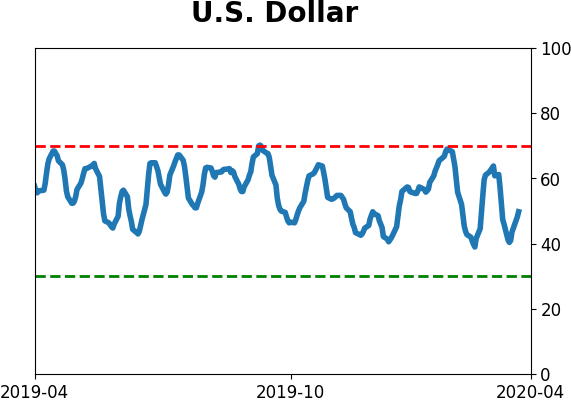
Currency ETF's - 5-Day Moving Average
|
|
|
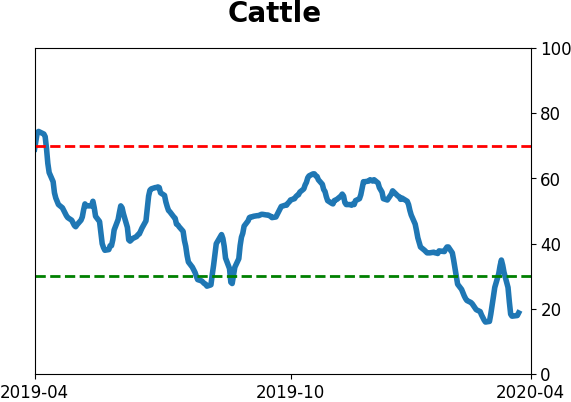
Commodity ETF's - 5-Day Moving Average
|
|