Headlines
|
|
In a broad global recovery, China stands out:
Trading activity in Chinese shares has dwindled as participation among stocks on the Shanghai has been poor. Behavior in breadth metrics is what we see during poor market environments. And sentiment toward Chinese large-cap stocks still isn't showing much pessimism.
First day with some pessimism: Thanks to an intraday reversal, today was the first day in over a week with even one of our core indicators showing pessimism. It's fairly rare to see a full week go by with no indicators showing pessimism. According to the Backtest Engine, out of the 84 days when this has been the case, the S&P showed a negative return sometime between 2-8 weeks later after 70 of them, or in 83% of the cases.
Bottom Line:
See the Outlook & Allocations page for more details on these summaries STOCKS: Weak sell
The extreme speculation registered in January and February is starting to get wrung out. Internal dynamics have mostly held up, so a return to neutral sentiment conditions would improve the forward risk/reward profile substantially. We're still a ways off from that. BONDS: Weak buy
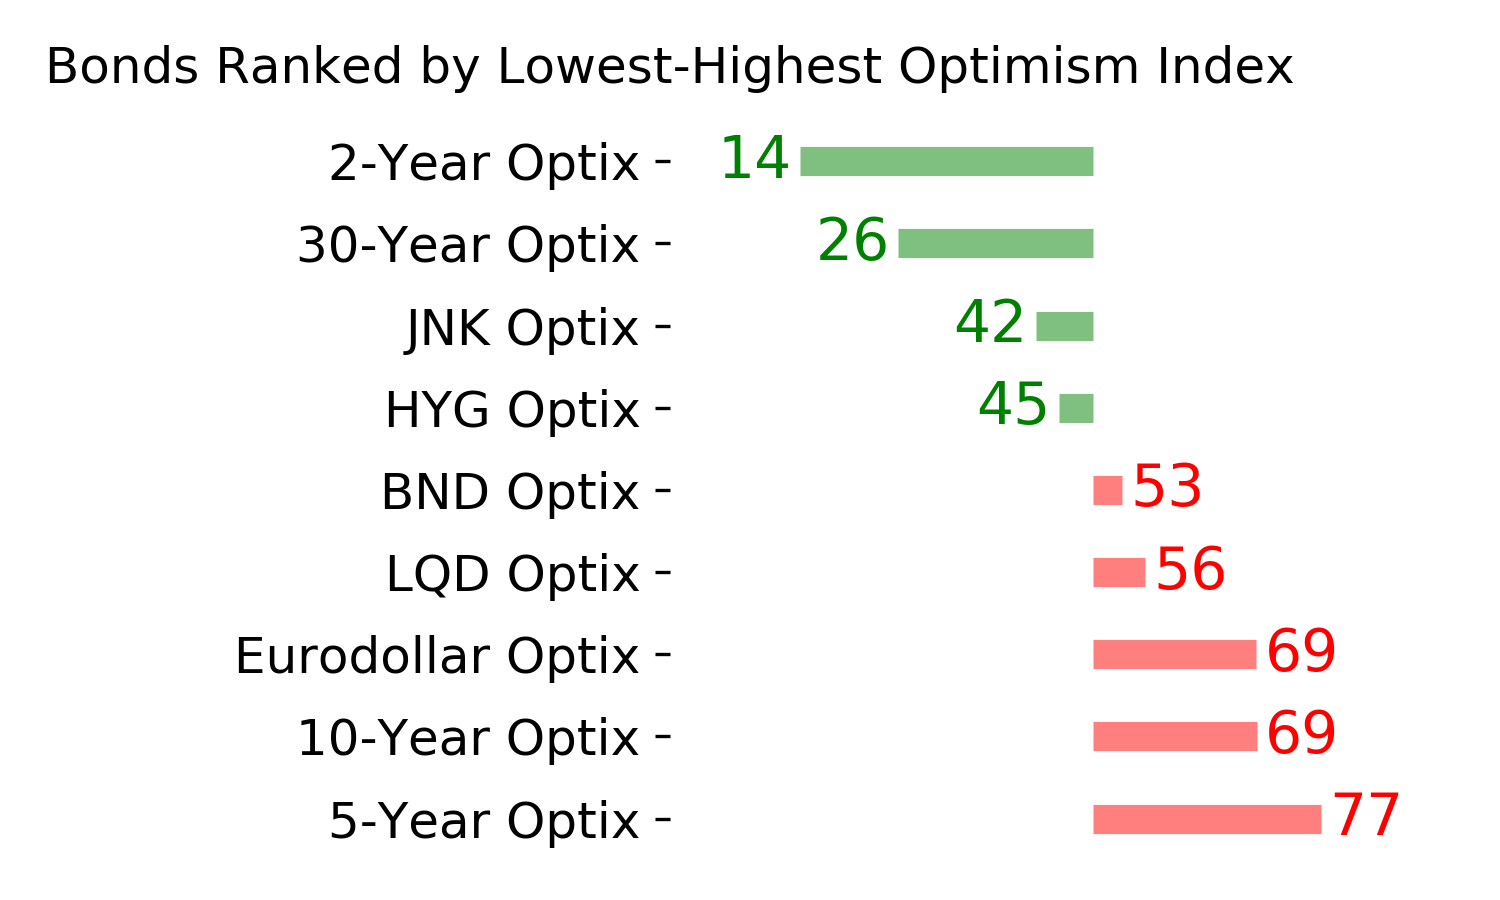
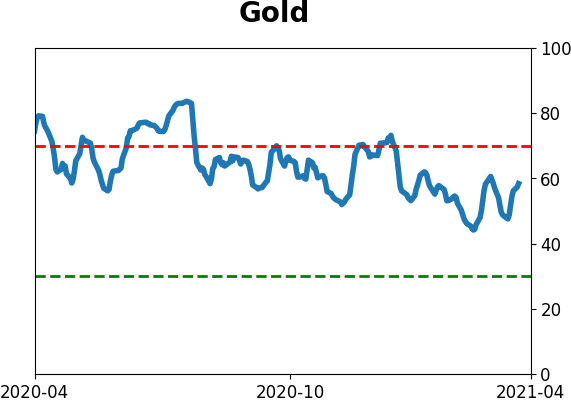
Various parts of the market have been hit in recent weeks, with mild oversold conditions. The Bond Optimism Index is now about as low as it gets during healthy bond market environments. Fixed income isn't responding well, so that needs to be monitored in case it's transitioning to a longer-term negative market environment. GOLD: Weak buy
A dollar trying to rebound from a severe short position has weighed on gold and miners. The types of signals they've given in recent weeks, within the context of their recent surge, have usually resulted in higher prices over a medium- to long-term time frame. Like bonds, gold and miners aren't responding very well, and this needs to be monitored.
|
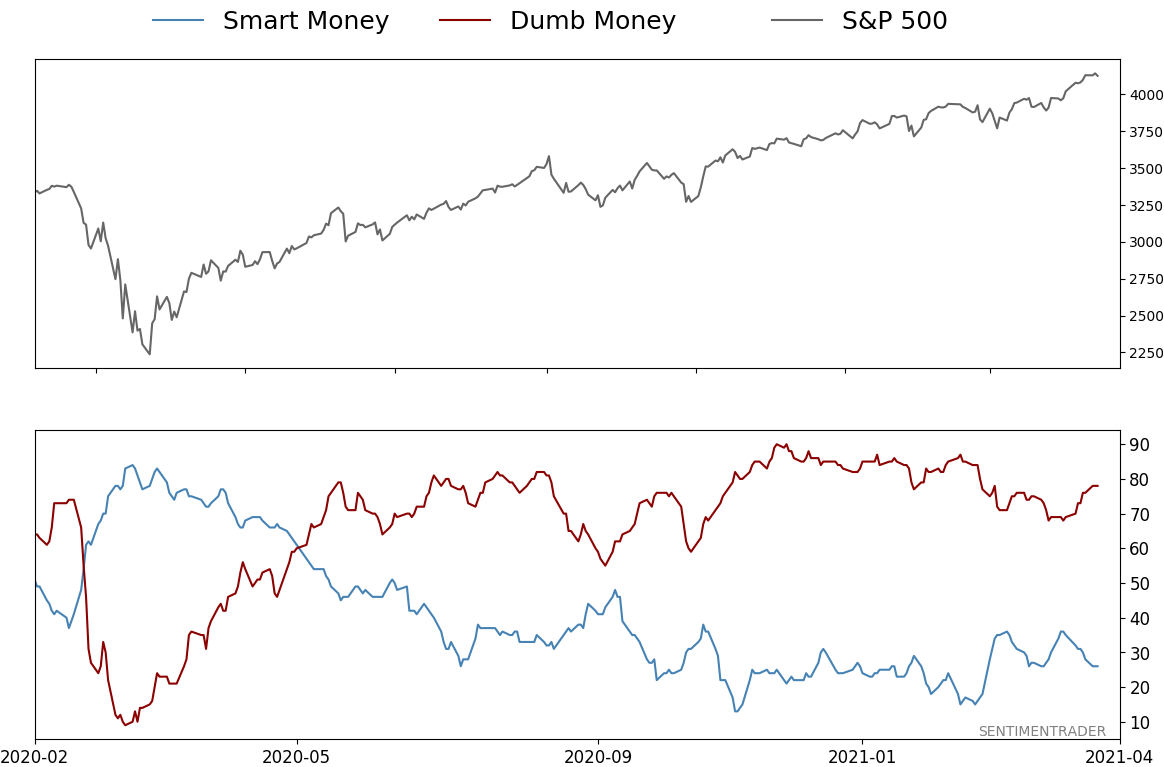
Smart / Dumb Money Confidence
|
Smart Money Confidence: 26%
Dumb Money Confidence: 78%
|
|
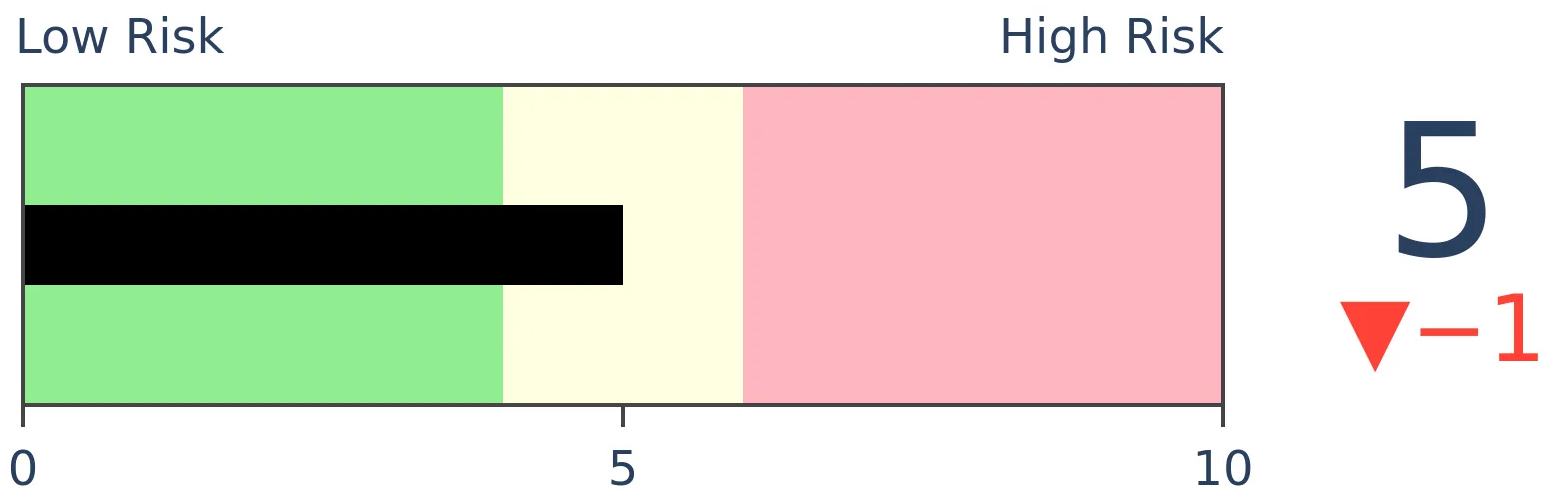
Risk Levels
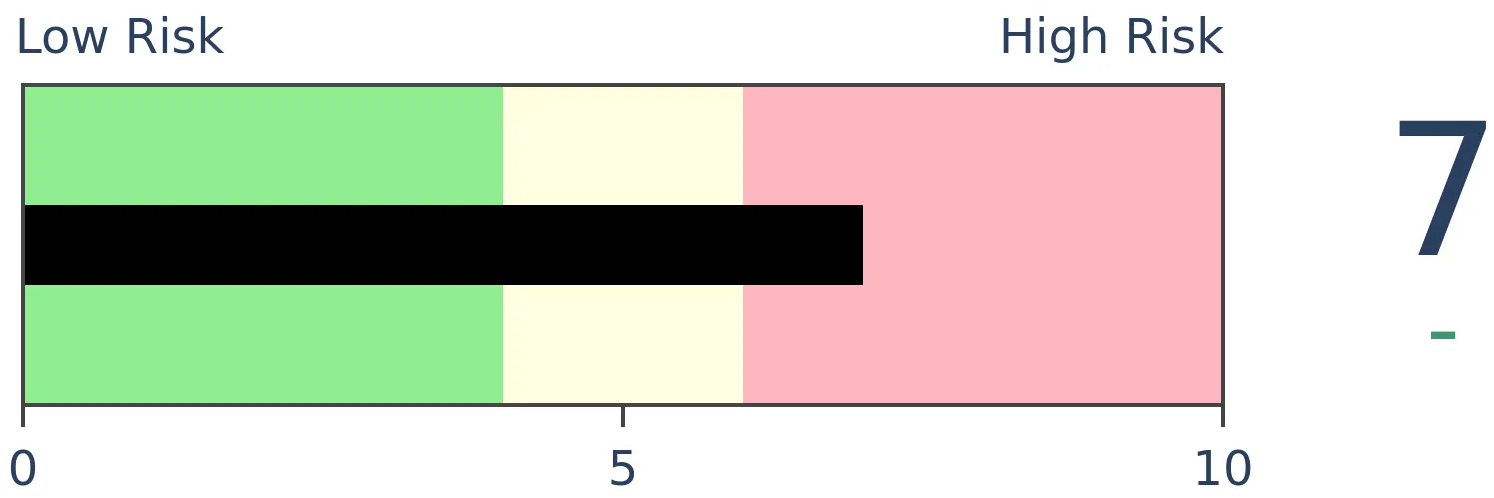
Stocks Short-Term
|
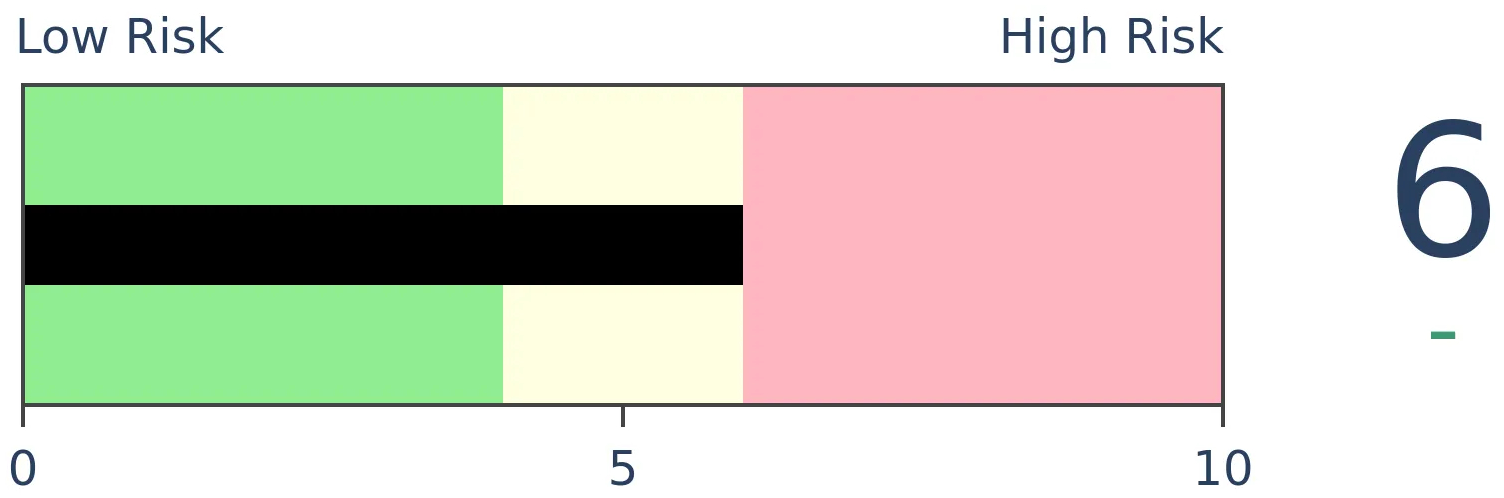
Stocks Medium-Term
|
|
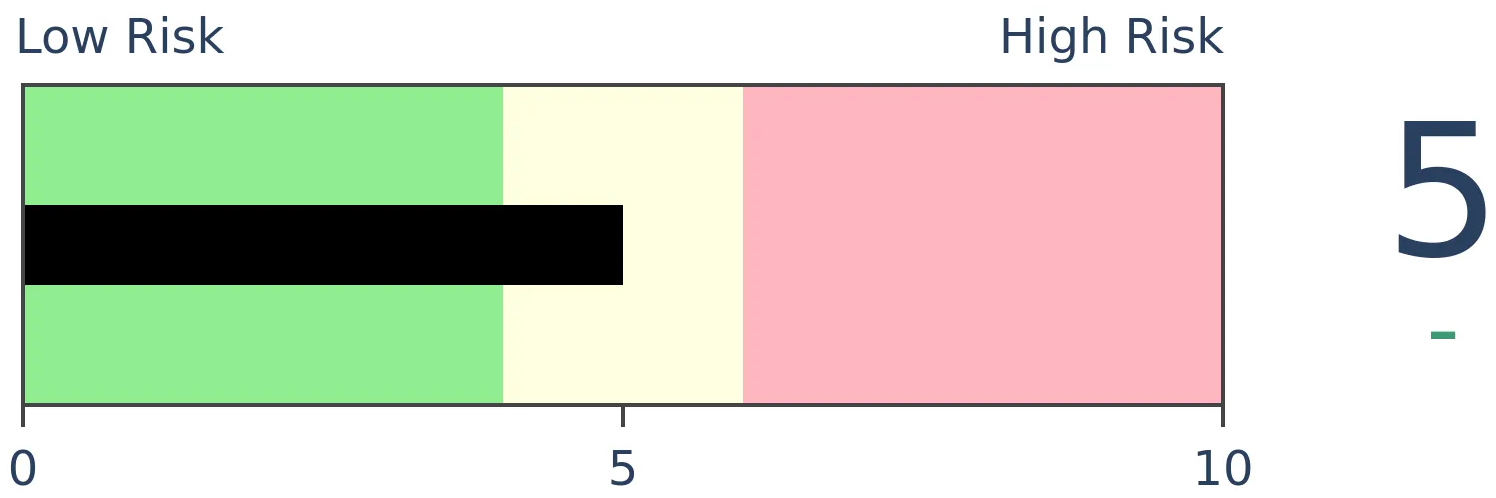
Bonds
|
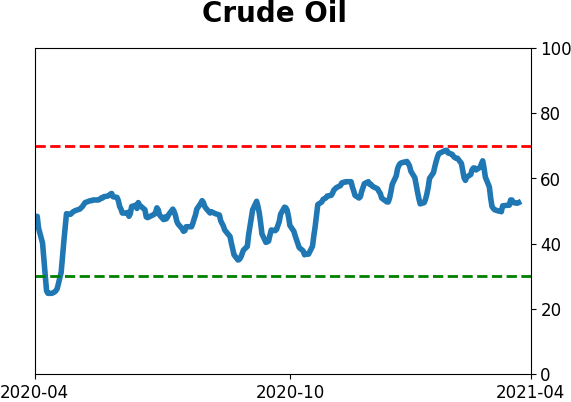
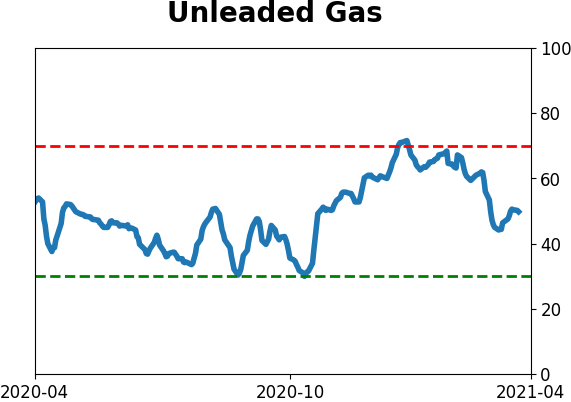
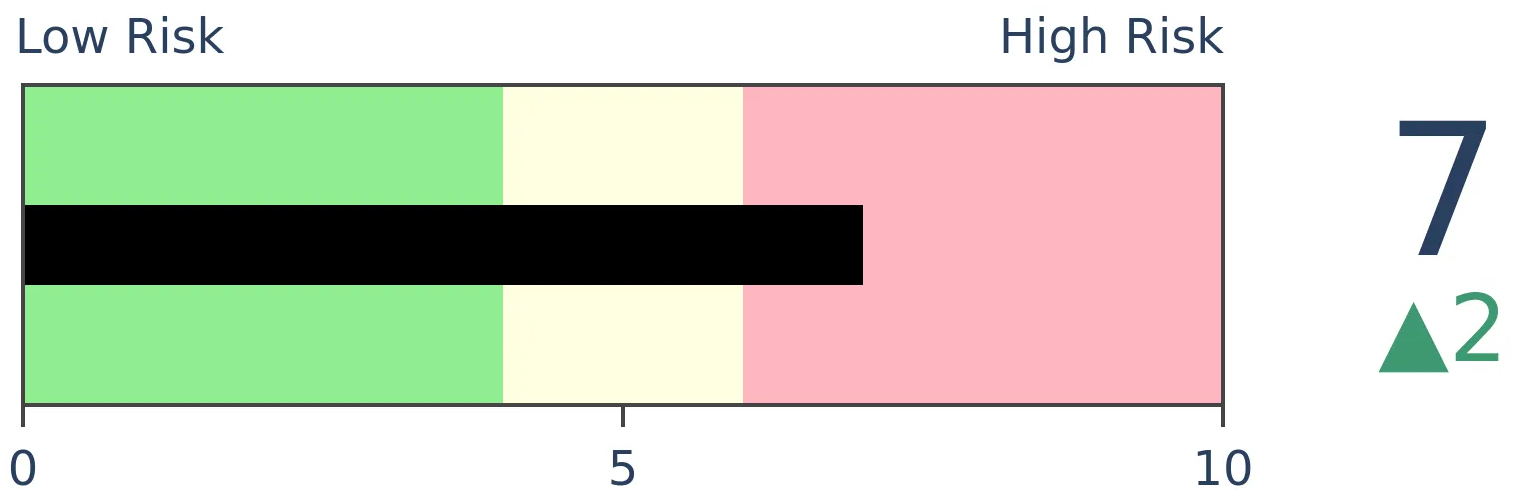
Crude Oil

|
|
Gold
|
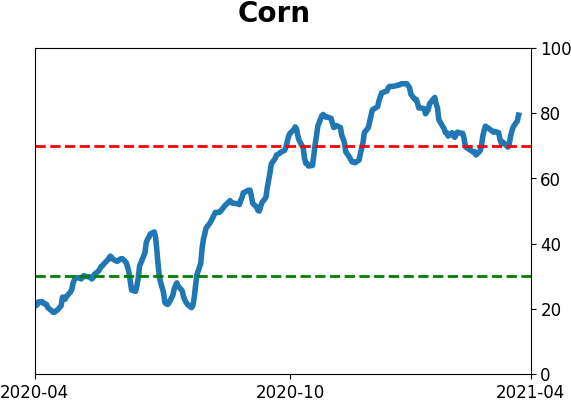
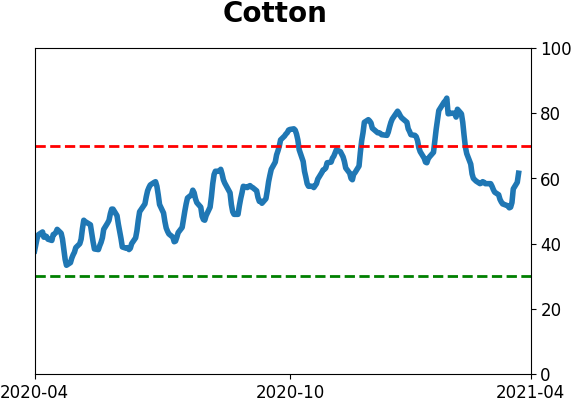
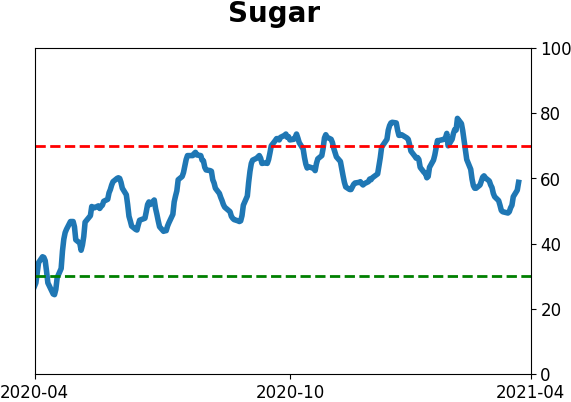
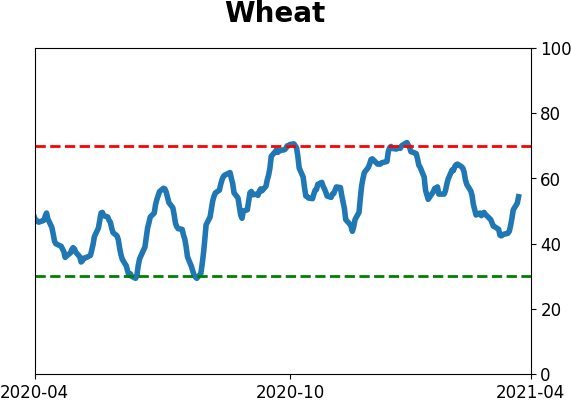
Agriculture
|
|
Research
BOTTOM LINE
Trading activity in Chinese shares has dwindled as participation among stocks on the Shanghai has been poor. Behavior in breadth metrics is what we see during poor market environments. And sentiment toward Chinese large-cap stocks still isn't showing much pessimism.
FORECAST / TIMEFRAME
None
|
Last week, we saw that there has been a remarkable thrust in breadth among global markets.
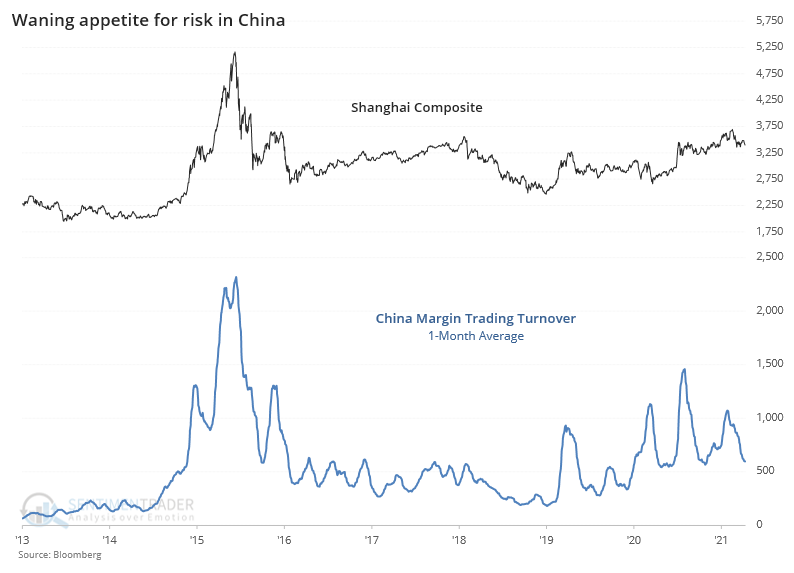
But not everyone is participating. Appetite for trading in China has wanted, as Bloomberg recently noted. The lack of enthusiasm is even more pronounced among those trading on margin. Turnover in margin accounts over the past month has sunk dramatically.
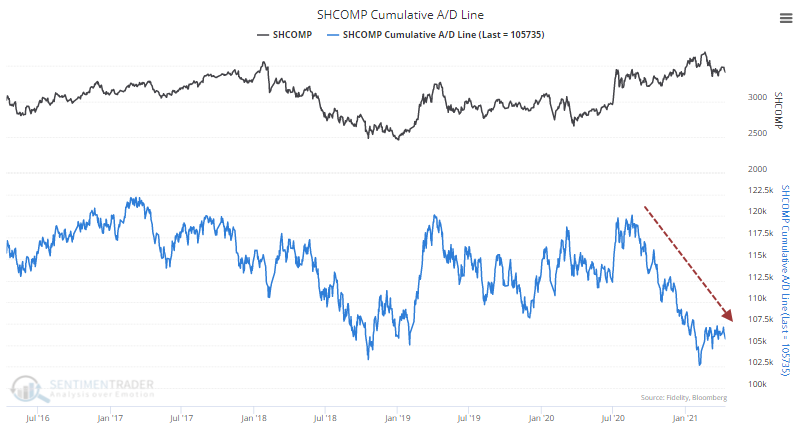
It's not hard to see why. The average stock in that market has been declining for months, even if some of the major Chinese indexes have held up despite that deterioration. The Cumulative Advance/Decline Line for the Shanghai Composite is challenging its 5-year low.
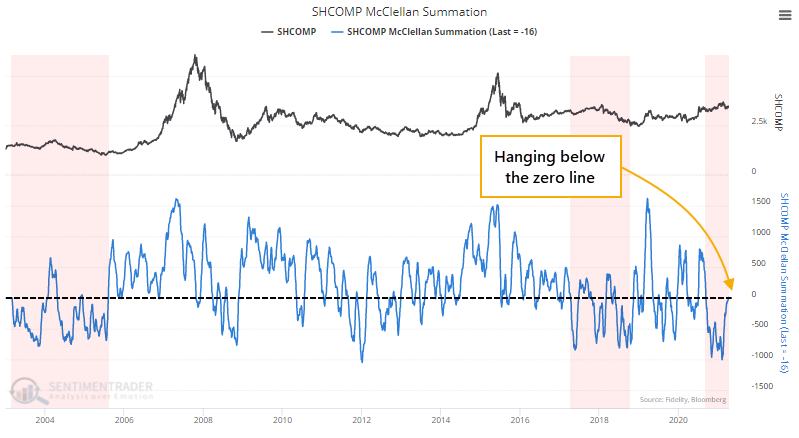
This activity has pushed the McClellan Summation Index for the Shanghai below zero...and kept it there. This is exactly the opposite of what we see in a healthy market environment.
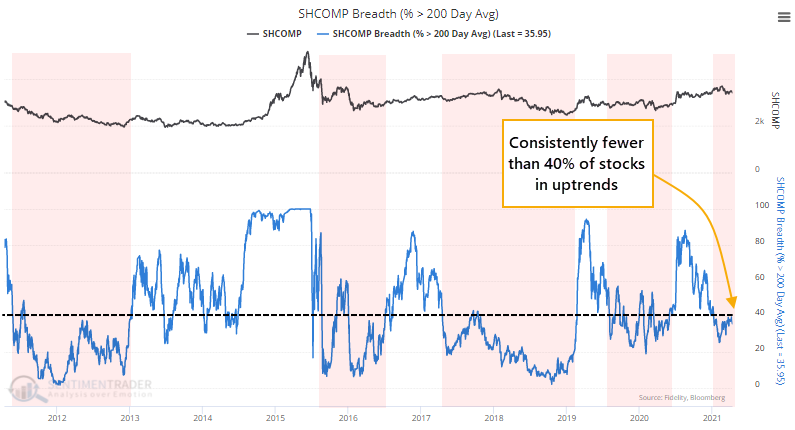
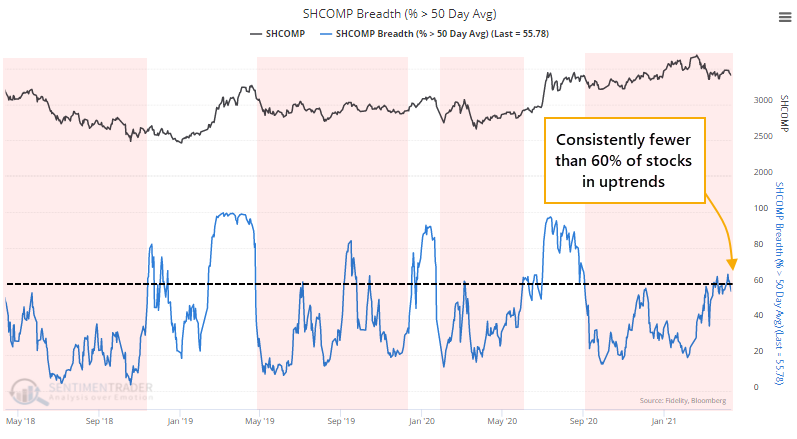
That's also evident in the percentage of those stocks holding above their 200-day moving averages. In a healthy market or sector, we typically see this figure hold above 60%, with forays below 40% bringing in interest among buyers. In an unhealthy market, this figure typically holds below 40%, with moves above 60% generating selling pressure.
We use the same general guidelines on a medium-term basis, with the percentage of stocks above their 50-day average. And that, too, shows unhealthy behavior, as fewer than 60% of stocks have been holding above their averages. That's not what we see during robust markets.
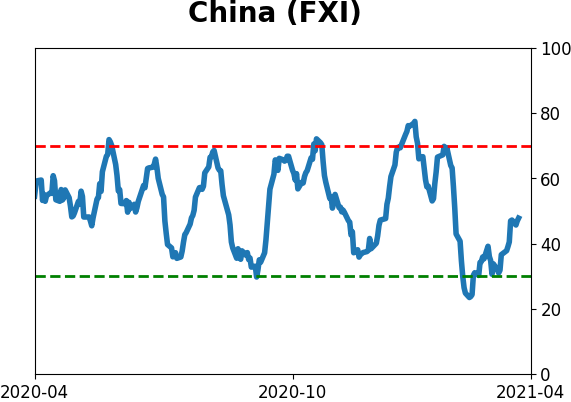
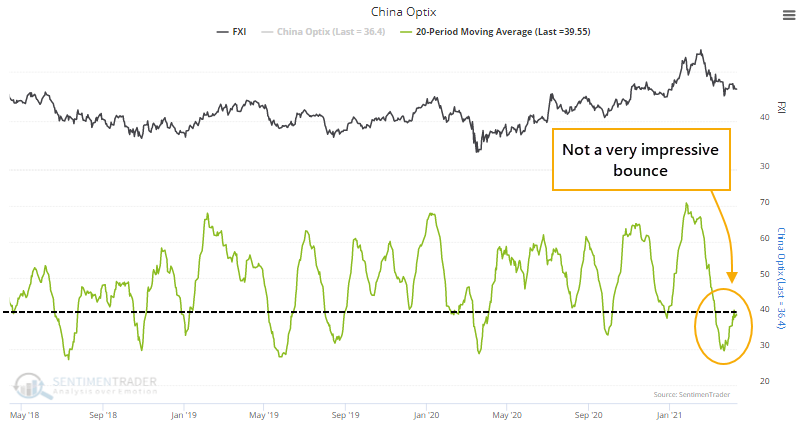
If we focus on larger-cap stocks in that market, represented by the FXI fund in the U.S., then it's a similar message. The Optimism Index plunged below 40 and has only grudgingly rebounded, with prices meandering.
In strong uptrends, when sentiment drops into pessimistic territory, there's usually more of a "spiky" rebound as buyers sense an opportunity.
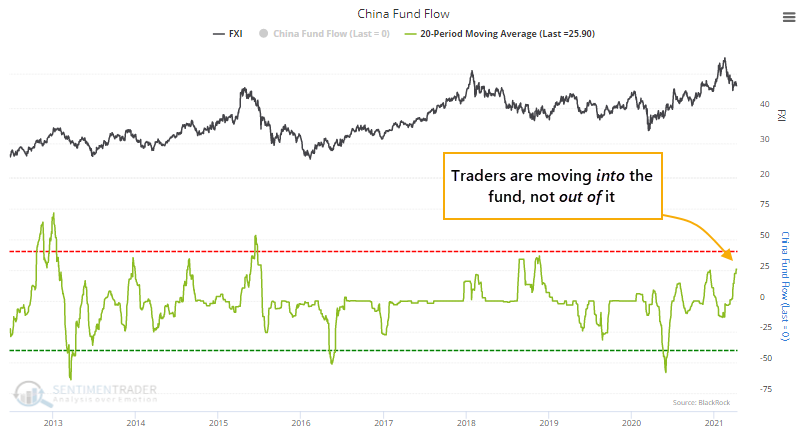
Other measures never really showed much pessimism anyway over the past month. Traders were still moving money into the fund, not out of it.
On social media, twitter users have tweeted twice as many bullish messages about the fund than bearish messages. This is calculated like a put/call ratio, so a low reading below 1.0 means that there are more bullish than bearish messages.
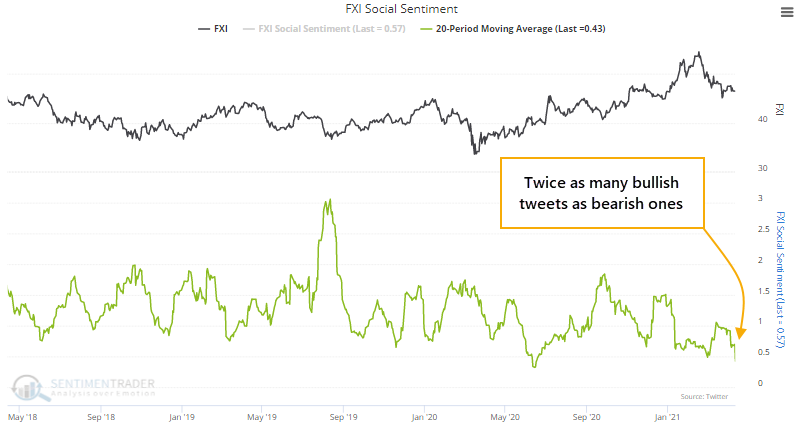
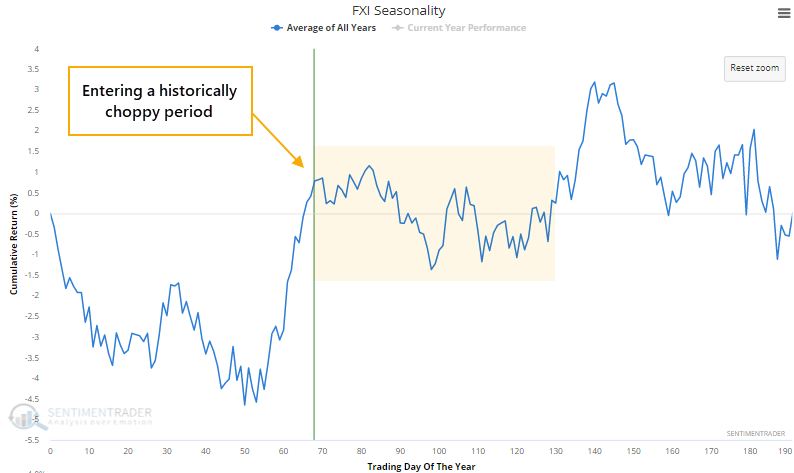
This is coming just as FXI is entering what has traditionally been a choppy seasonal window into the summer months.
None of this is especially damning evidence for buyers, but there isn't much here to suggest it's a great opportunity. Chinese stocks have been showing poor participation, and buyers have not been eager like they are in healthier market environments. Many stocks are lagging, and it's not like we're seeing overwhelming displays of pessimism that might hint at a contrarian opportunity.
This market needs to see much more of a give-up attitude among investors, or much better internal participation, before potential reward would seem to outweigh the risk.
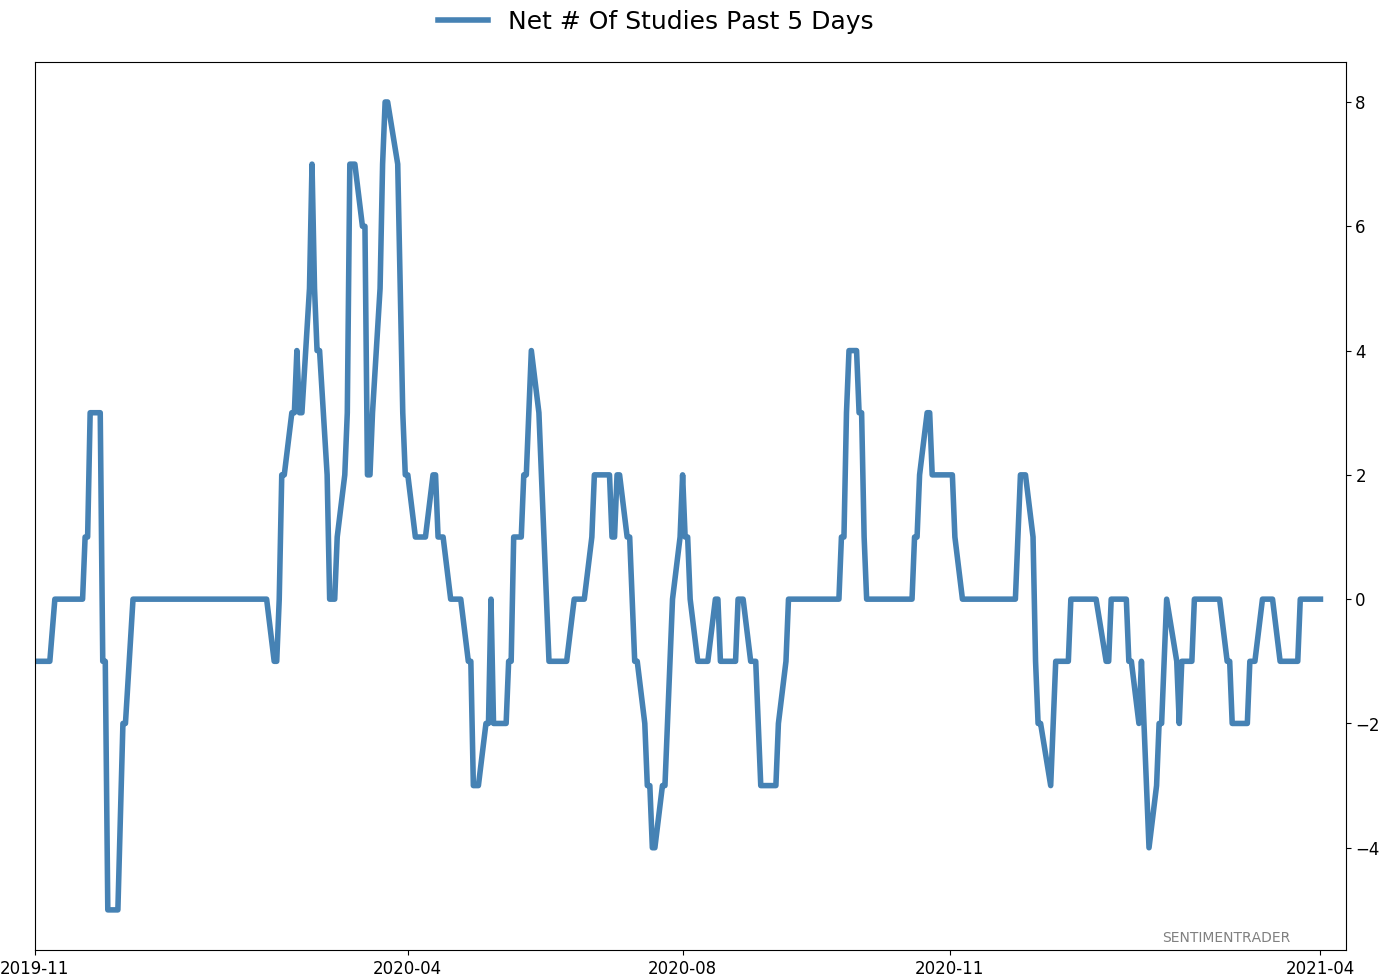
Active Studies
| Time Frame | Bullish | Bearish | | Short-Term | 0 | 0 | | Medium-Term | 0 | 10 | | Long-Term | 11 | 4 |
|
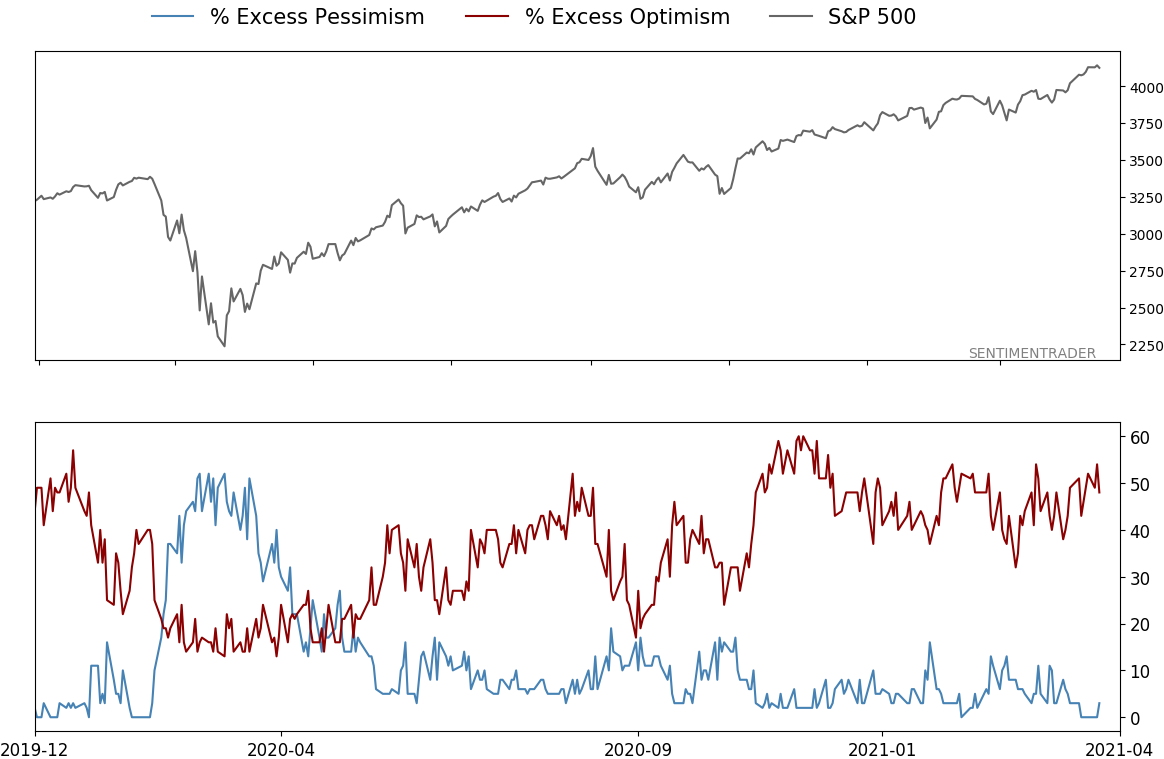
Indicators at Extremes
|
% Showing Pessimism: 3%
Bullish for Stocks
|
|
Portfolio
| Position | Description | Weight % | Added / Reduced | Date | | Stocks | RSP | 4.9 | Reduced 4% | 2021-02-09 | | Bonds | 30.0% BND, 8.8% SCHP | 38.8 | Added 15.1% | 2021-02-18 | | Commodities | GCC | 2.3 | Reduced 2.1%
| 2020-09-04 | | Precious Metals | GDX | 9.0 | Added 0.1% | 2021-02-18 | | Special Situations | 7.3% XLE, 4.8% PSCE | 12.1 | Reduced 5.6% | 2021-02-18 | | Cash | | 32.8 | | |
|
Updates (Changes made today are underlined)
With a market that has seen the kinds of broad participation and big breath thrusts like we did in the fall, it's hard to become too negative. Those kinds of conditions have consistently preceded higher returns over the next 6-12 months. It's the interim that's more of an issue. Even conditions like that haven't prevented some shorter-term pullbacks. And when we combine an environment where speculation is rampant and recent days have seen an increase in cracks under the surface of the indexes, it's enough to become more defensive over a short- to medium-term time frame. We still don't have much confirmation from the price action in the indexes, so those who are more conservative would likely wait before increasing cash levels. I've decreased risk exposure a bit more, mainly in terms of energy stocks and the ANGL fund, while adding more to the broader bond market. RETURN YTD: 7.0% 2020: 8.1%, 2019: 12.6%, 2018: 0.6%, 2017: 3.8%, 2016: 17.1%, 2015: 9.2%, 2014: 14.5%, 2013: 2.2%, 2012: 10.8%, 2011: 16.5%, 2010: 15.3%, 2009: 23.9%, 2008: 16.2%, 2007: 7.8%
|
|
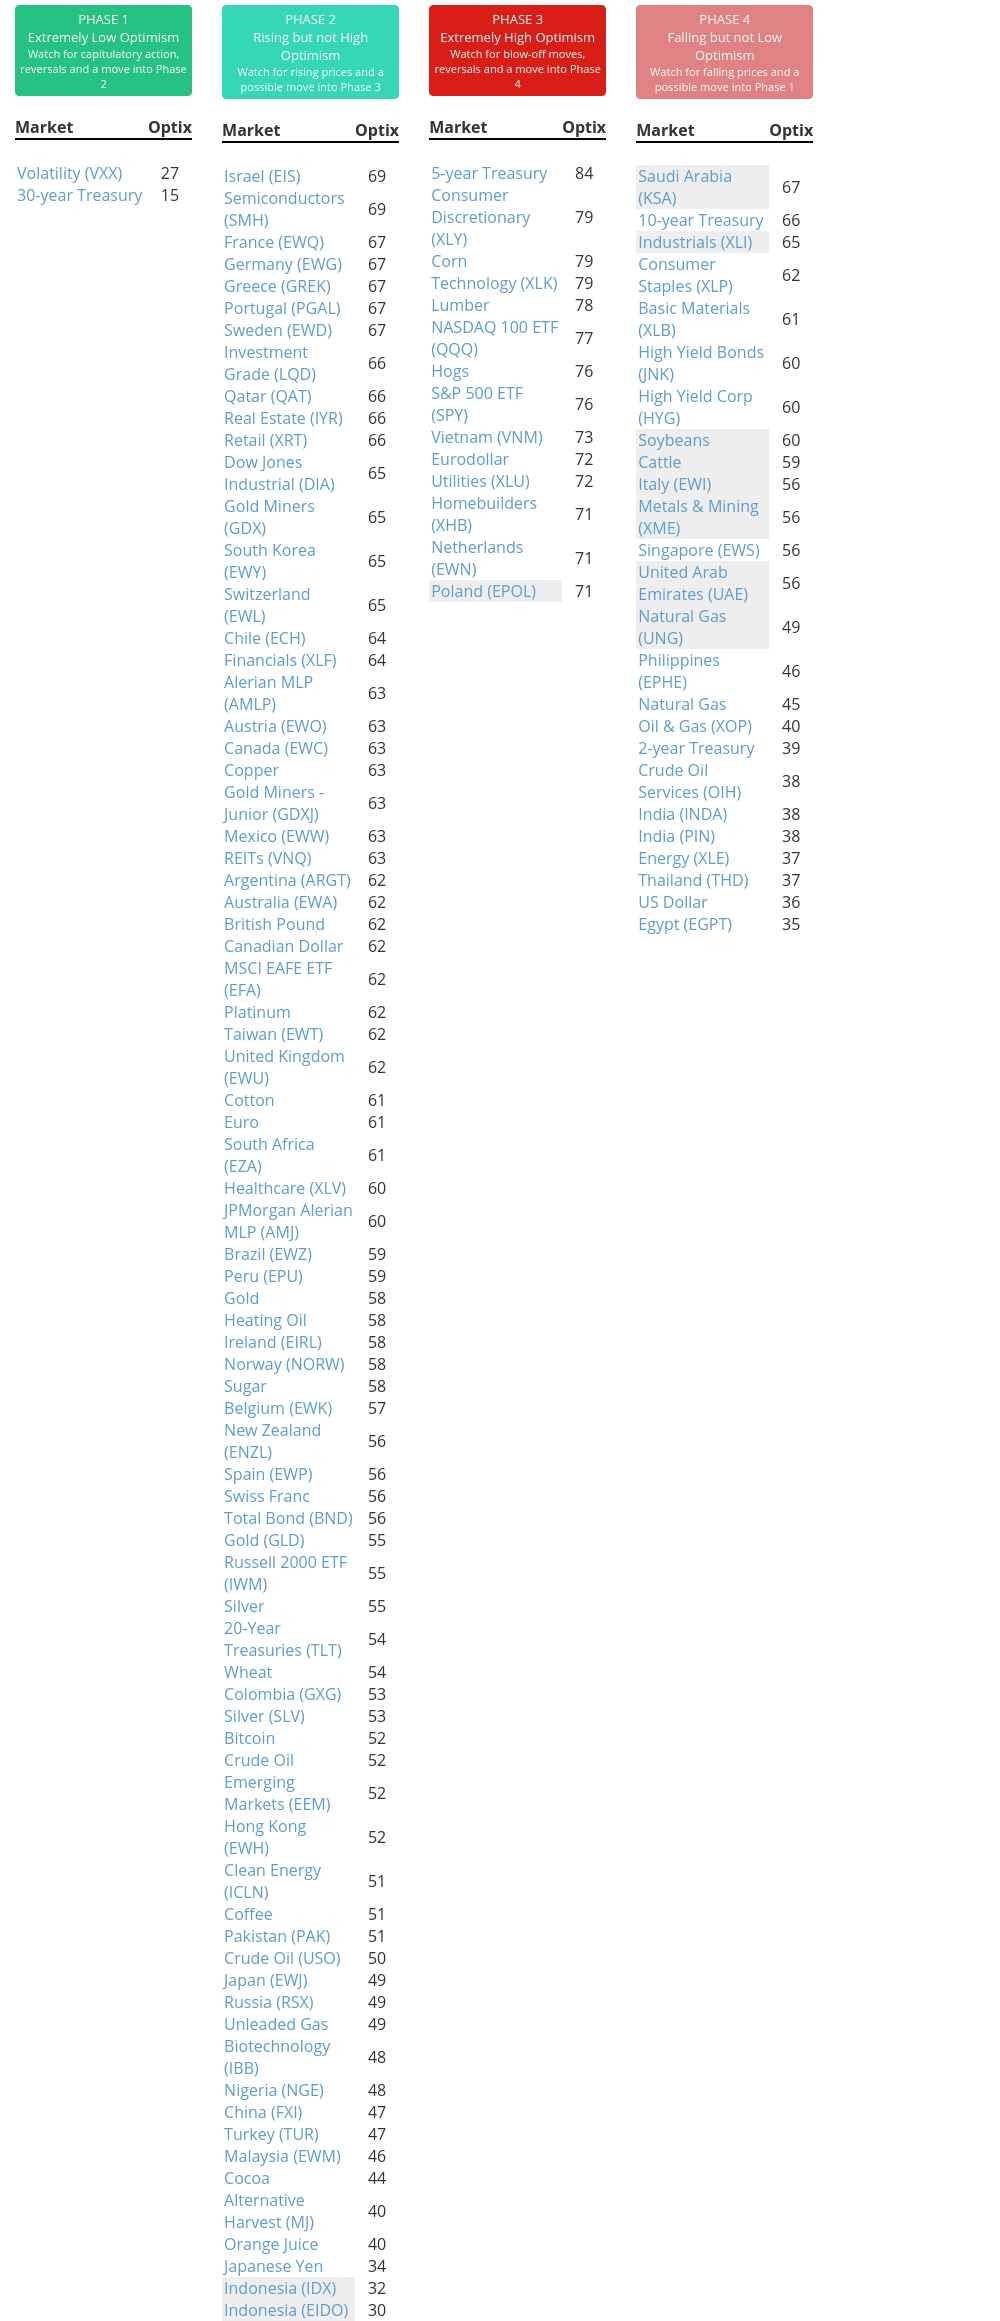
Phase Table
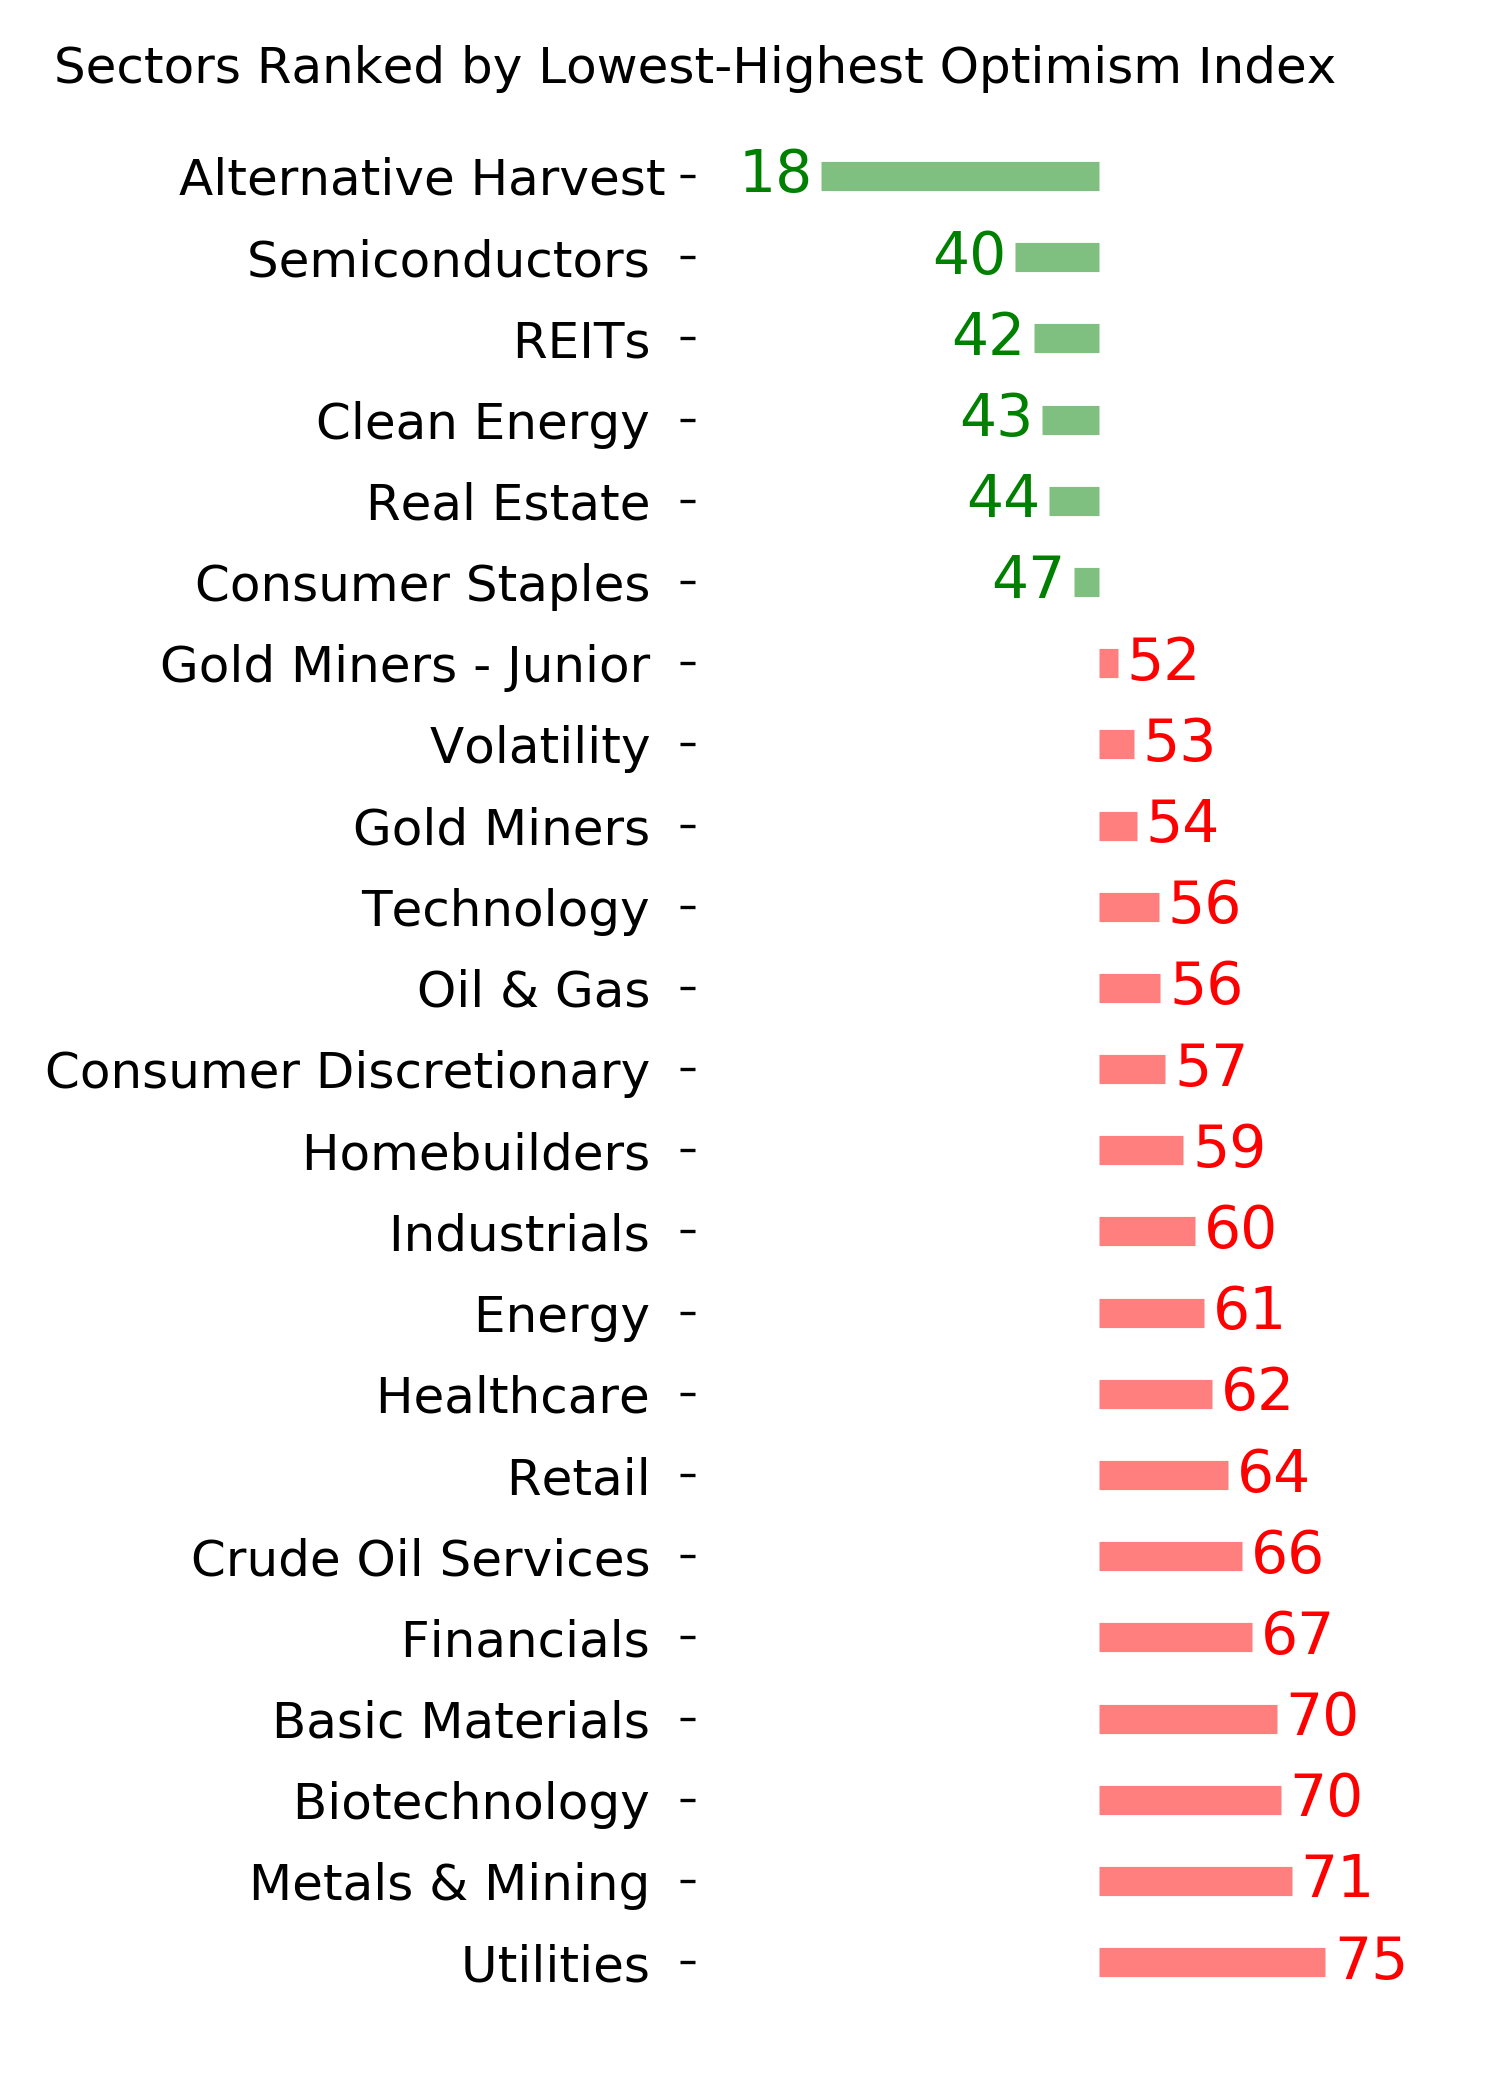
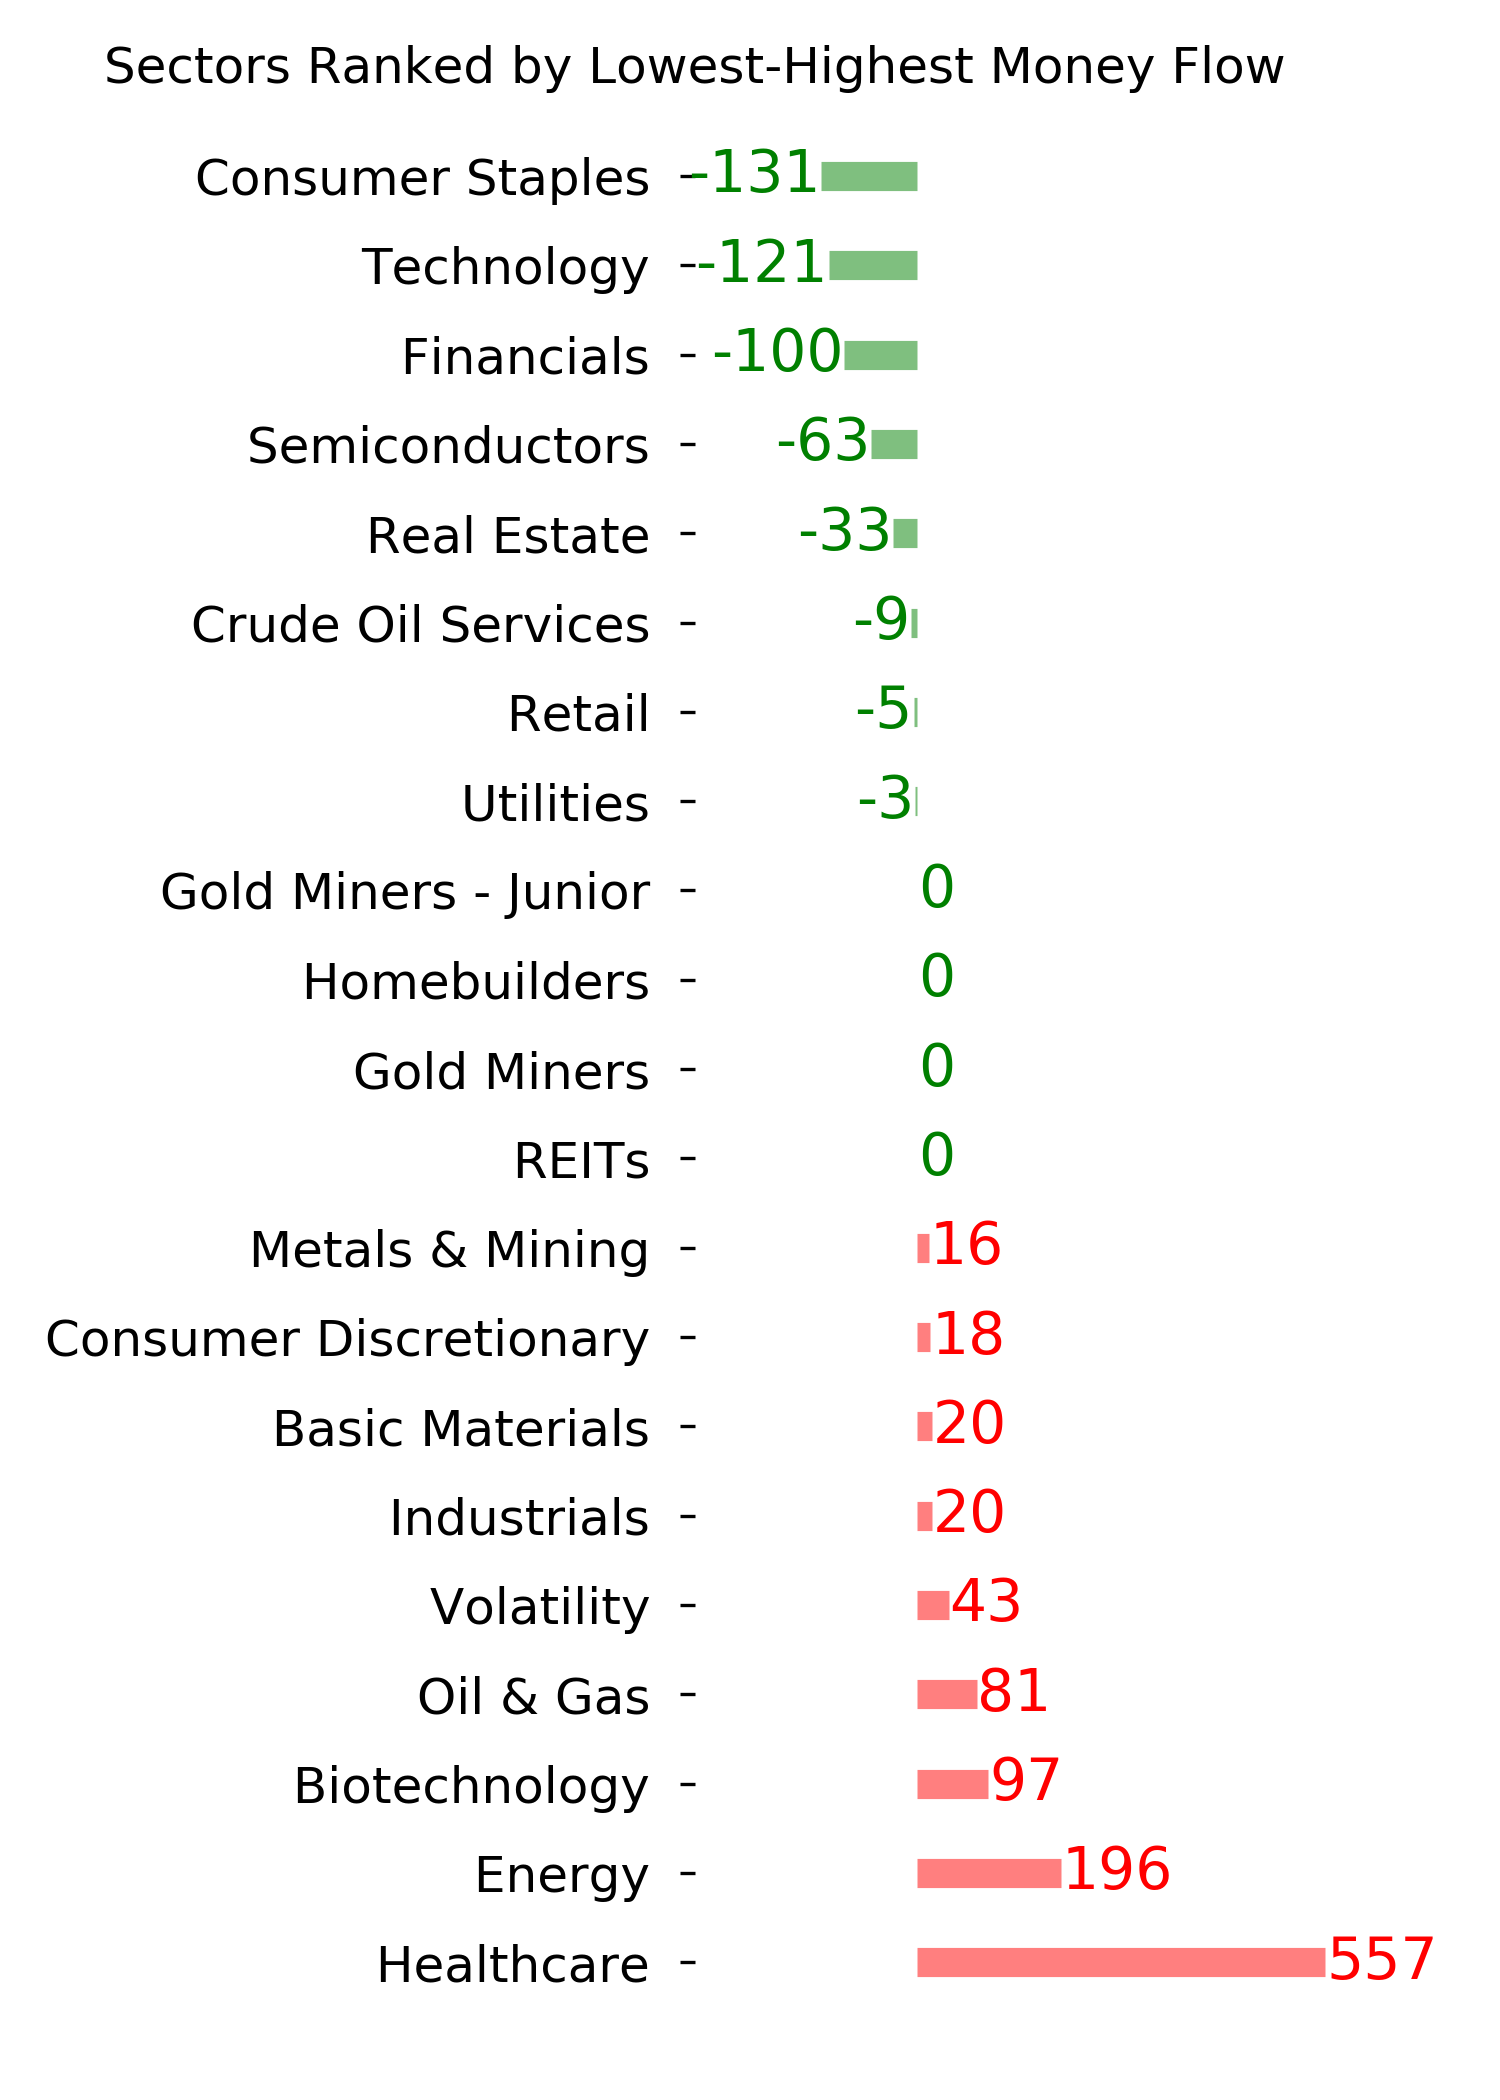
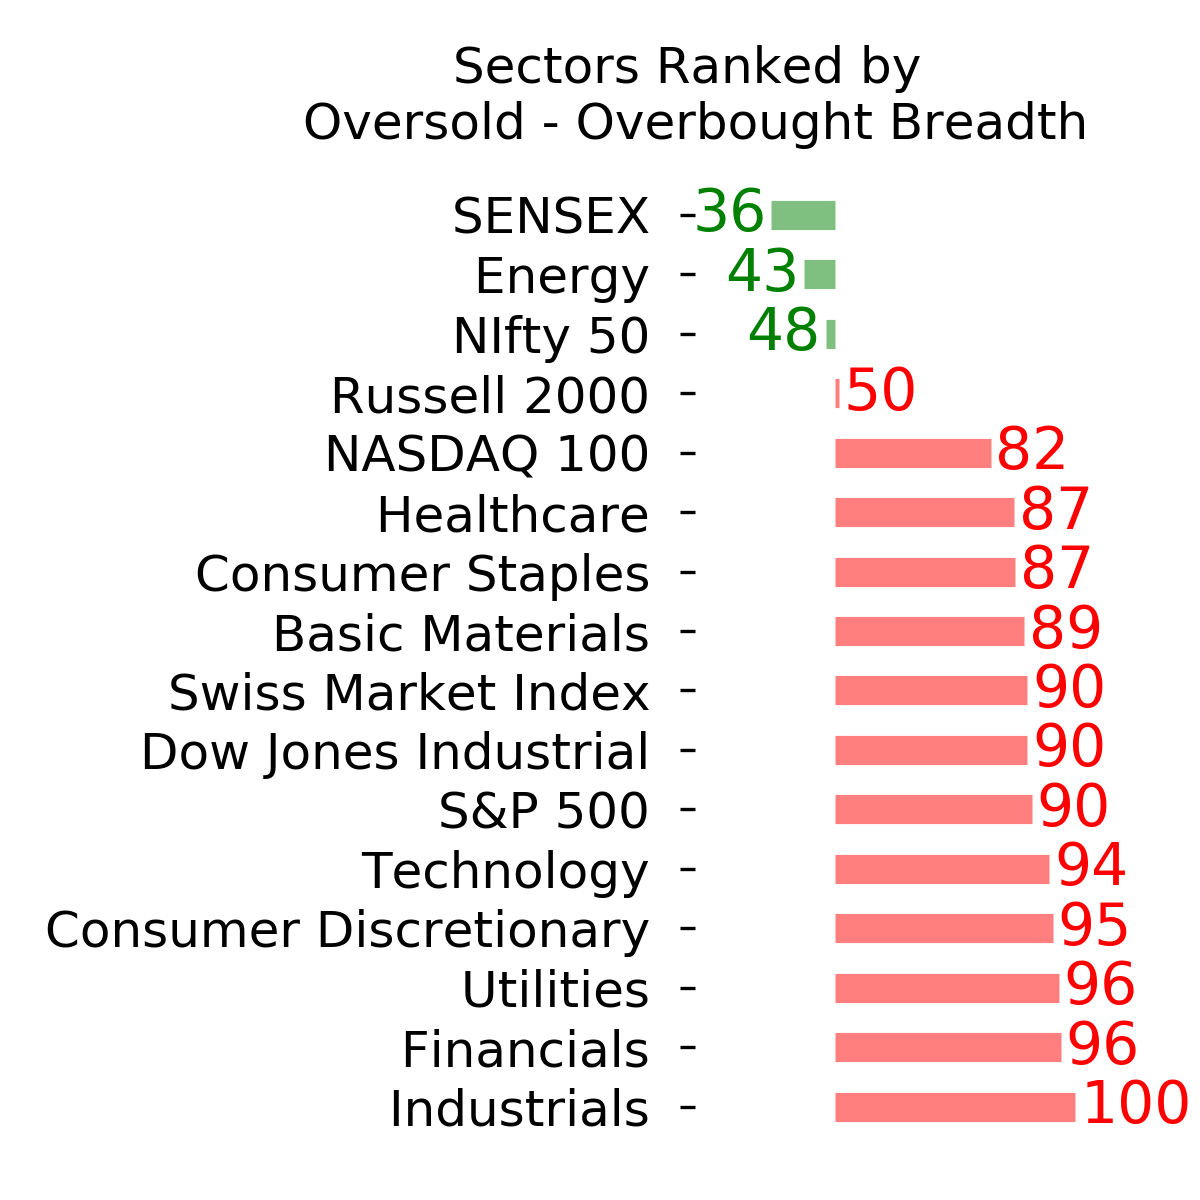
Ranks
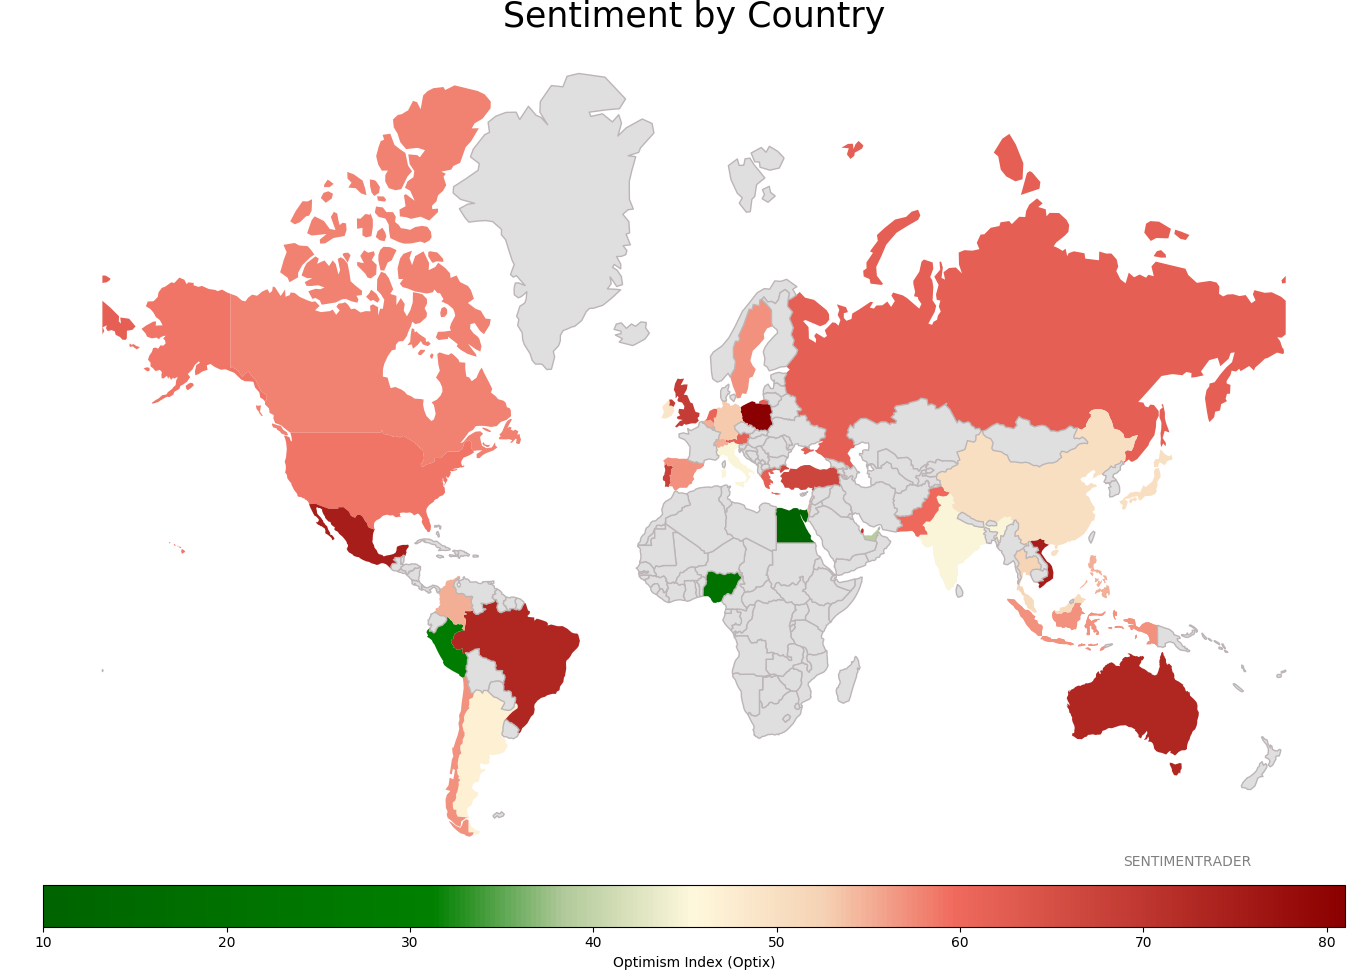
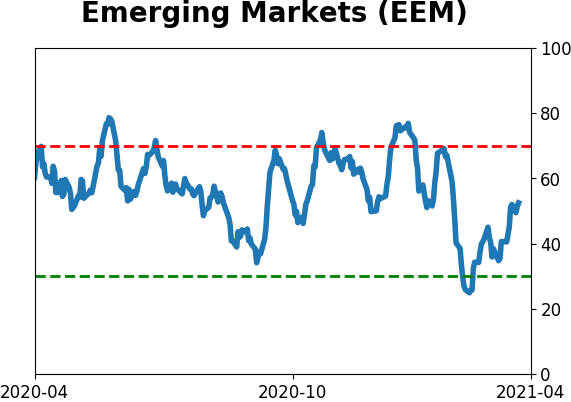
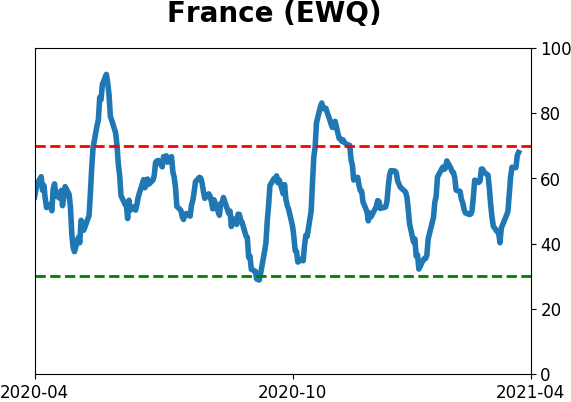
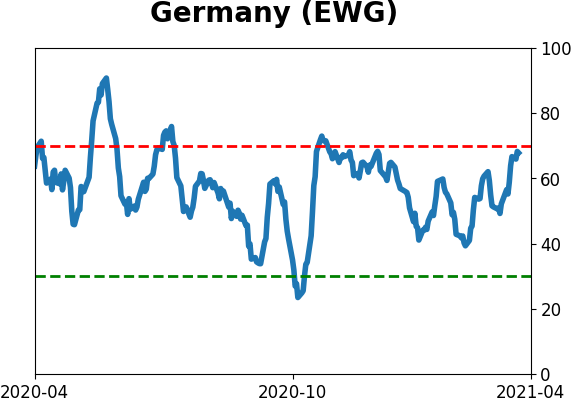
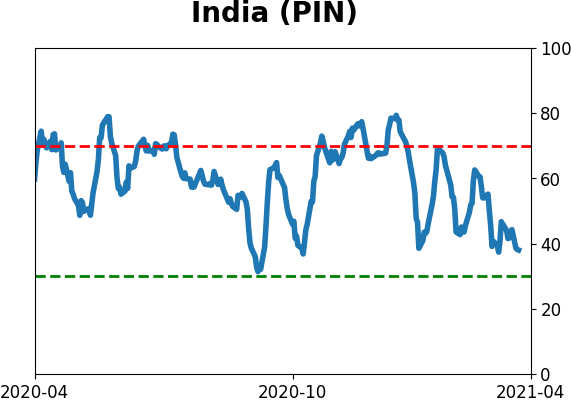
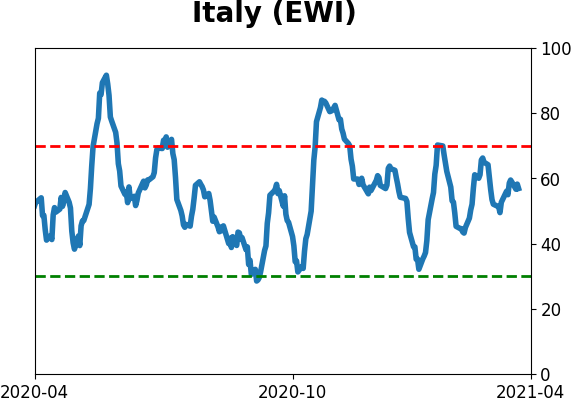
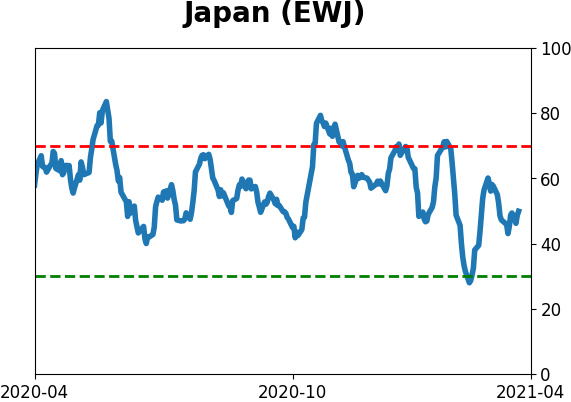
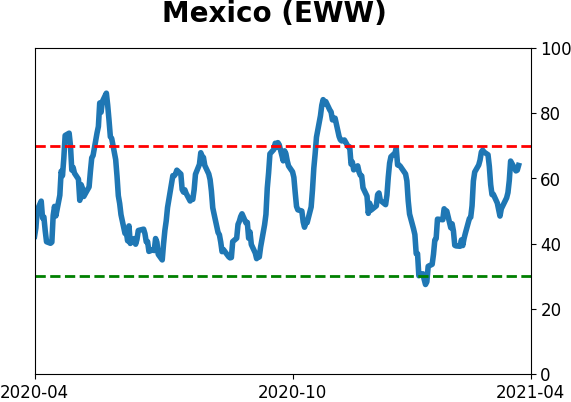
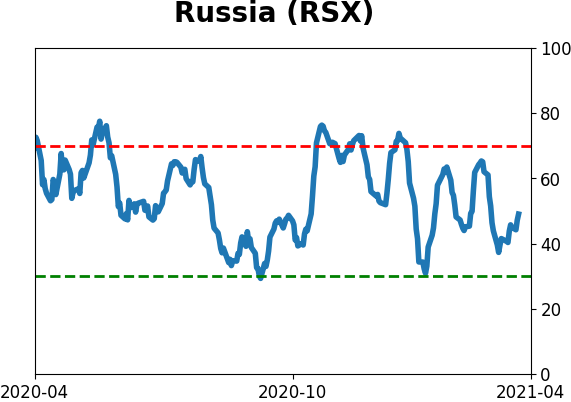
Sentiment Around The World
Optimism Index Thumbnails
|
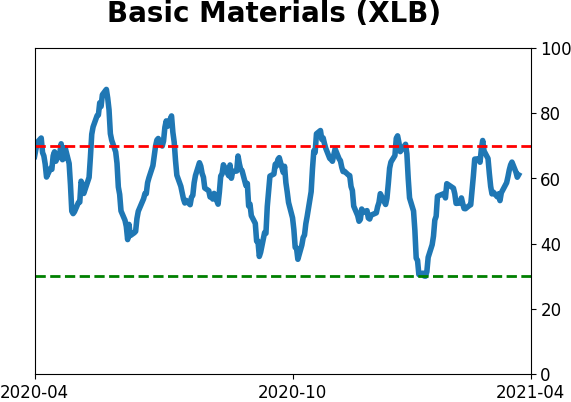
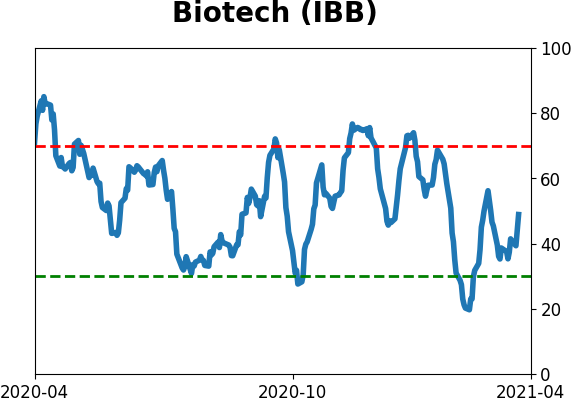
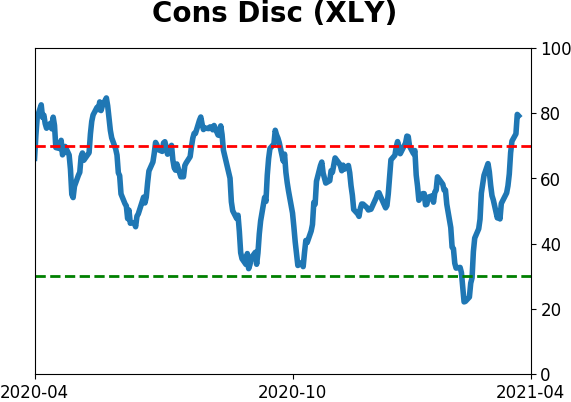
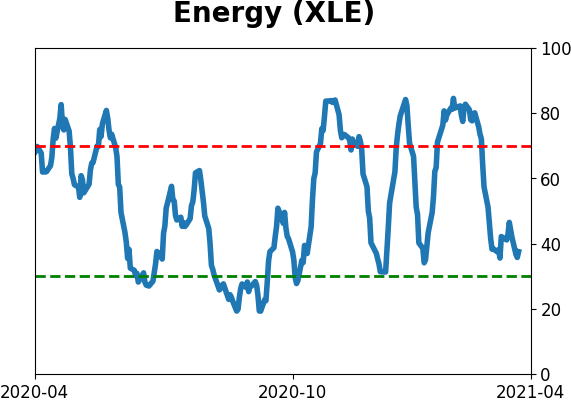
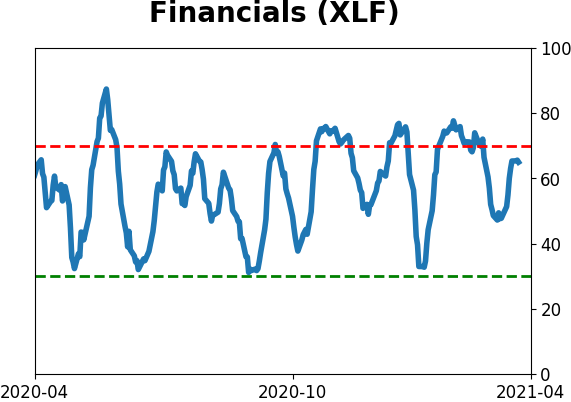
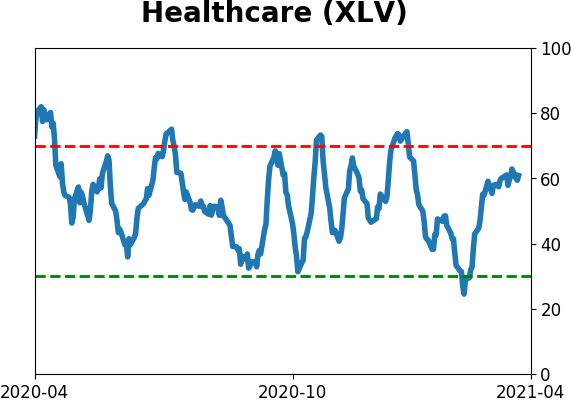
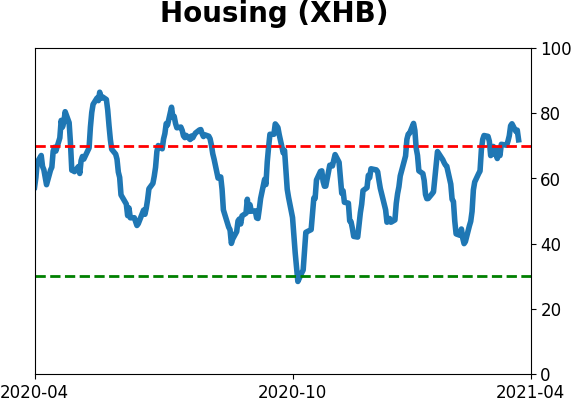
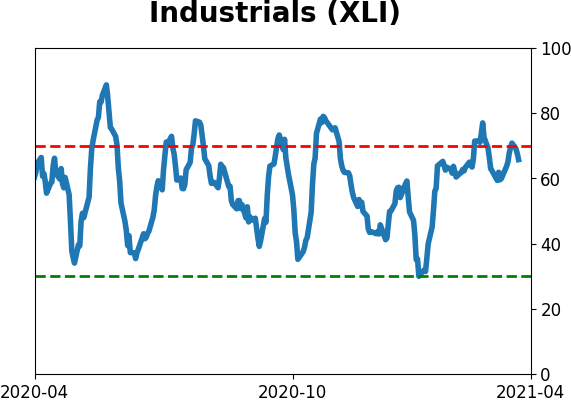
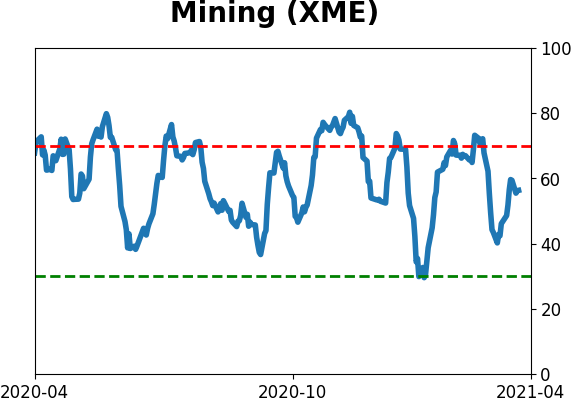
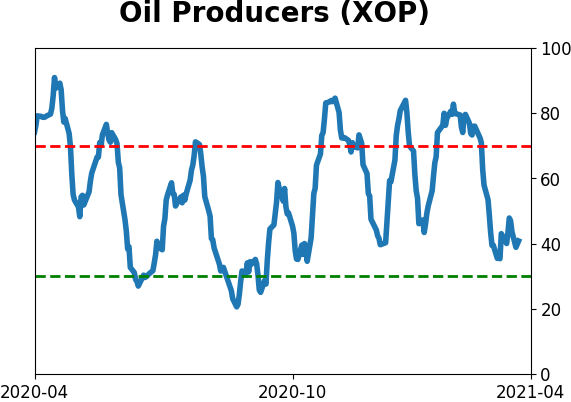
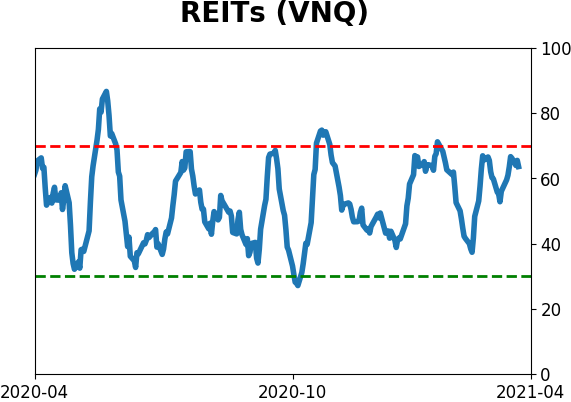
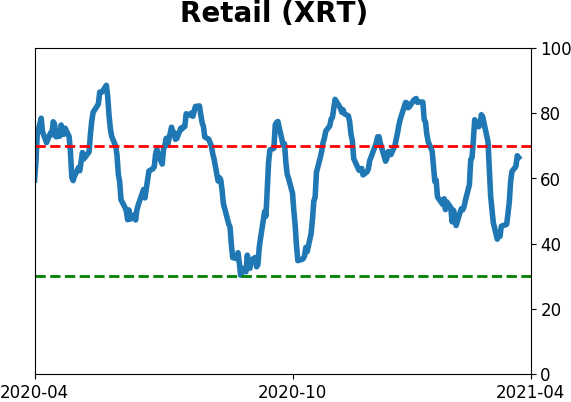
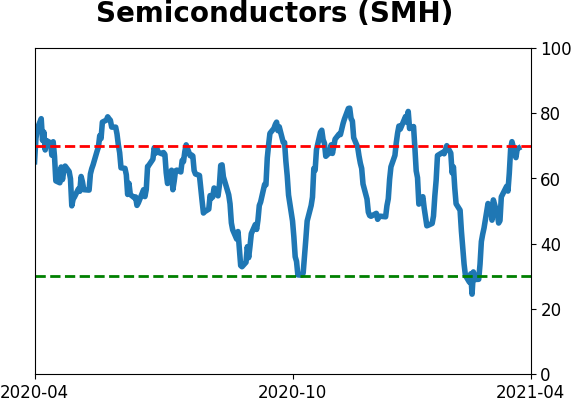
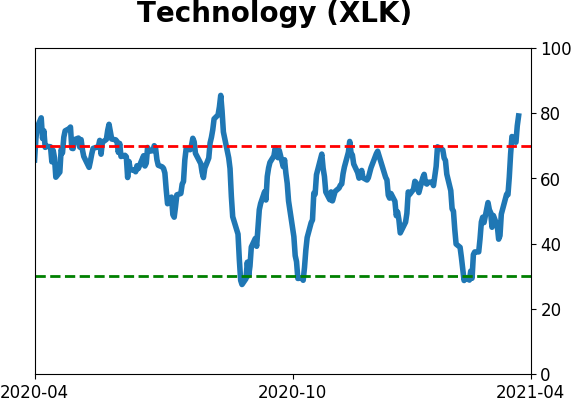
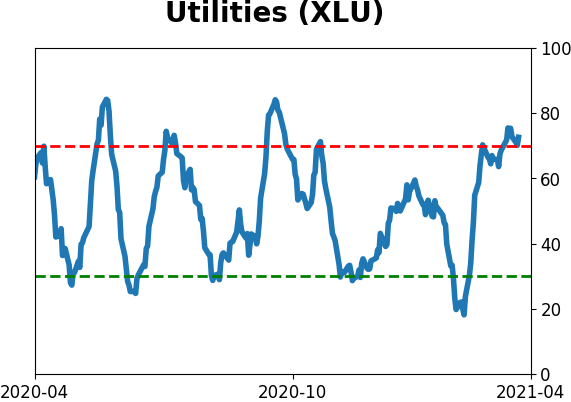
Sector ETF's - 10-Day Moving Average
|
|
|
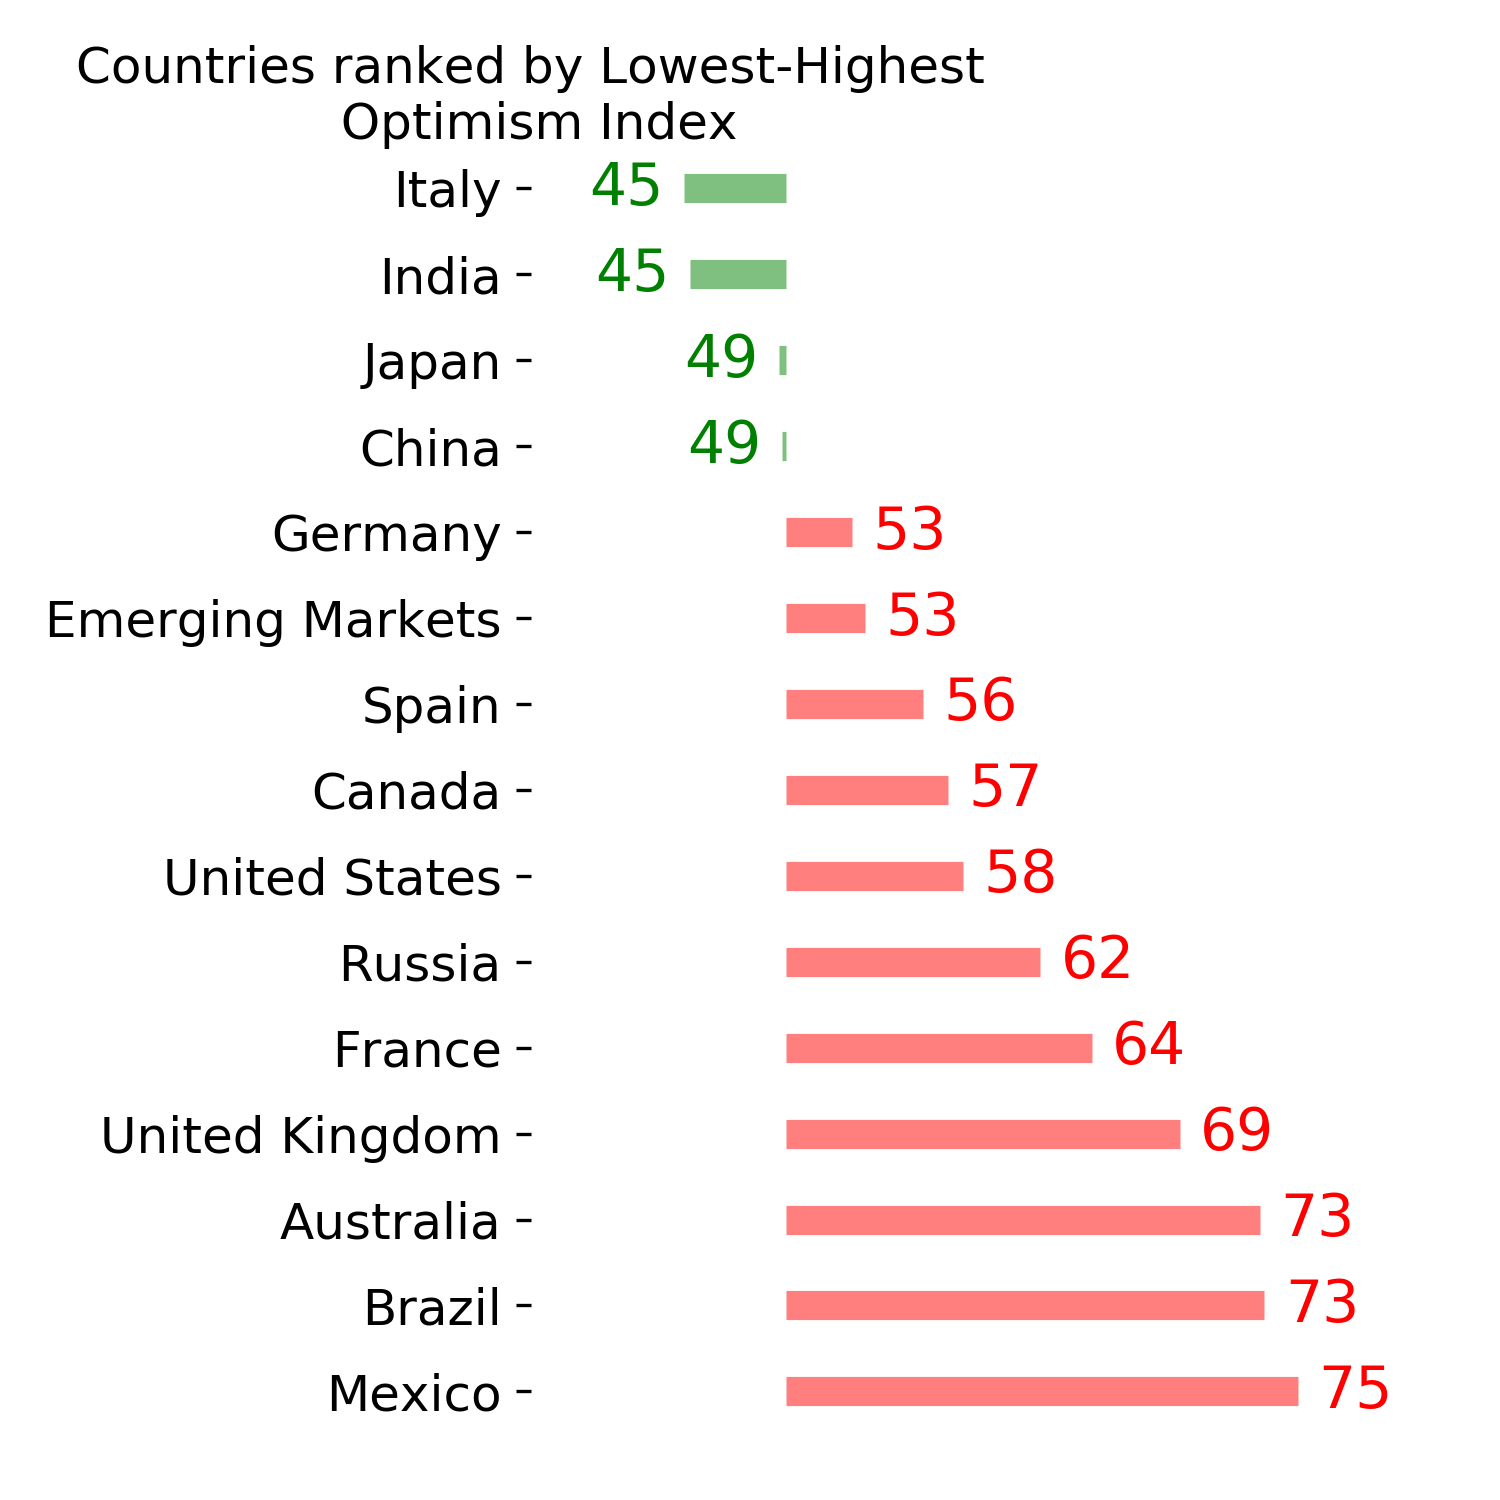
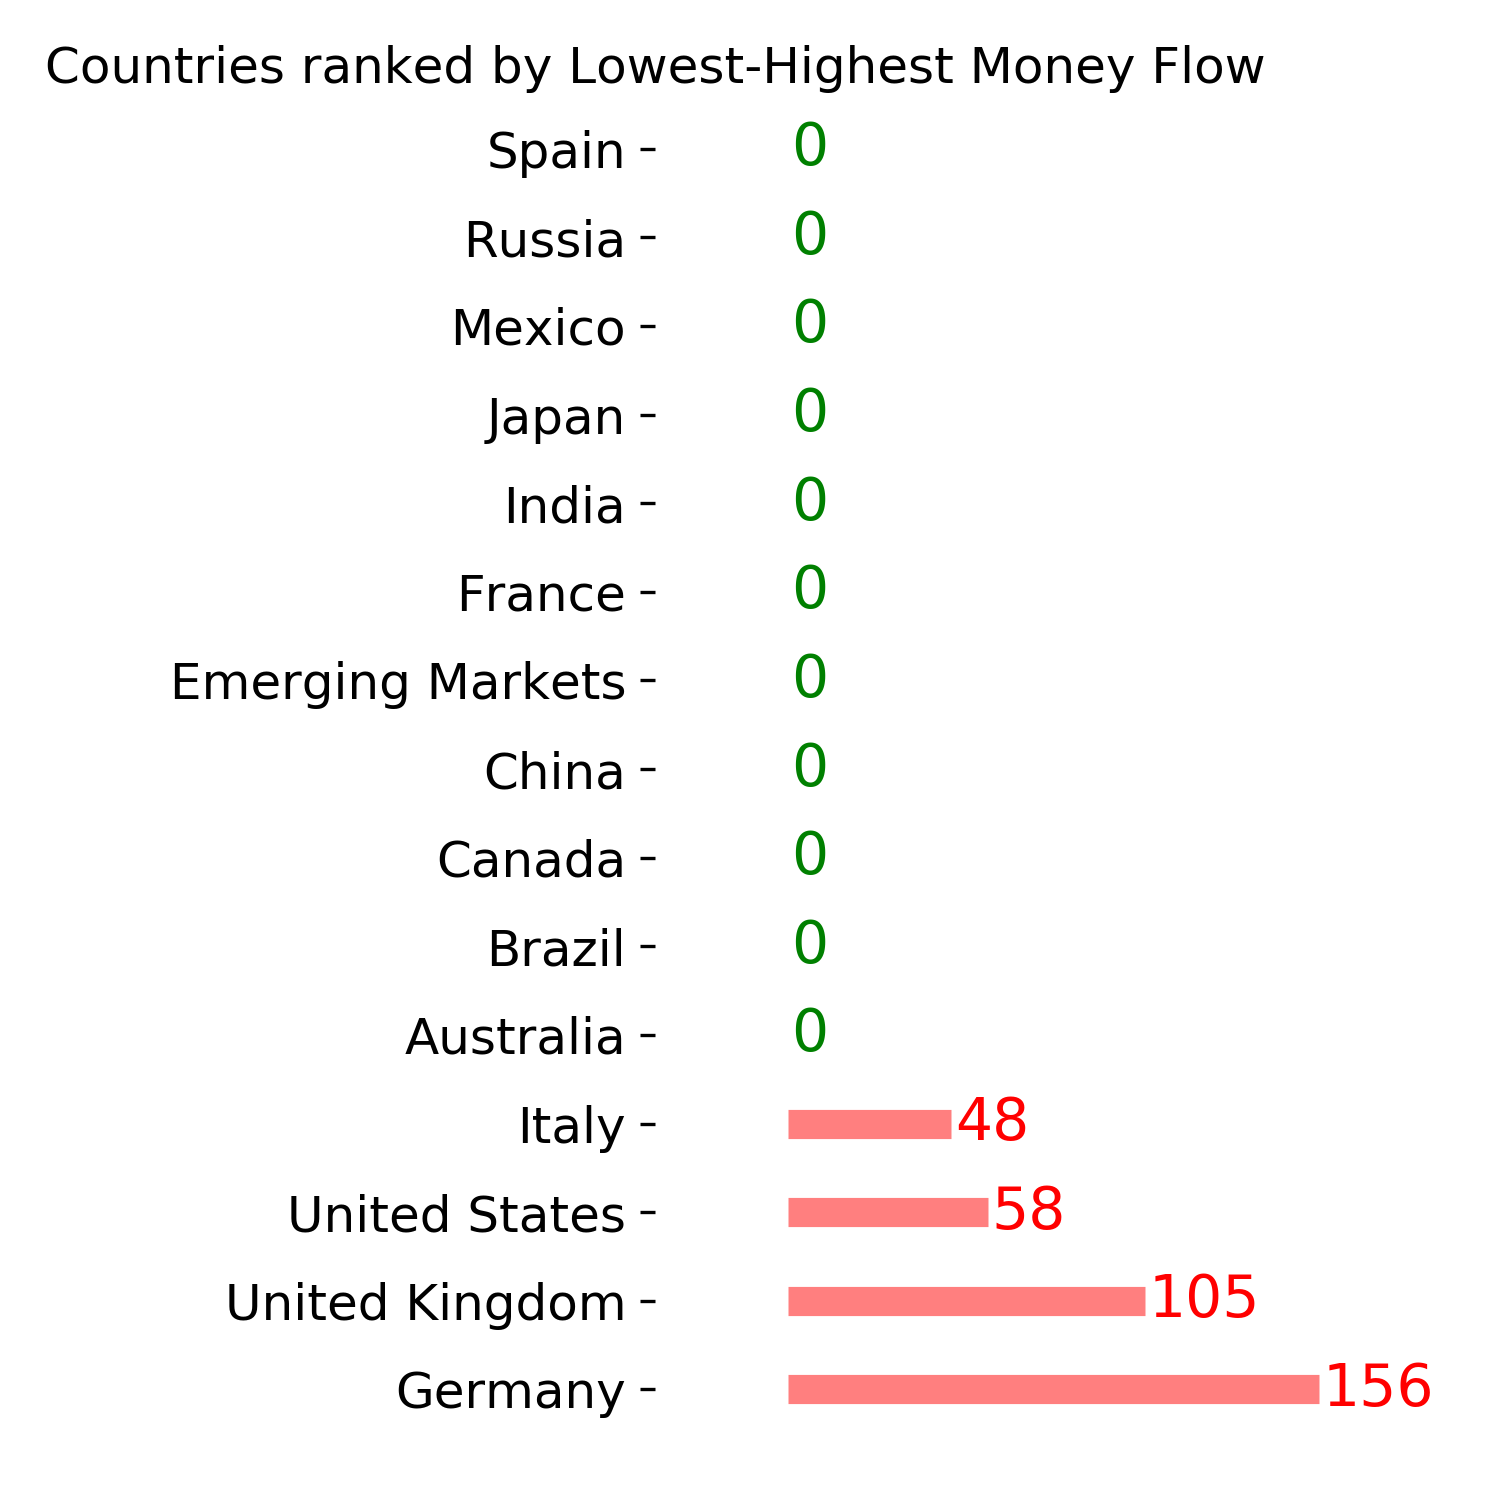
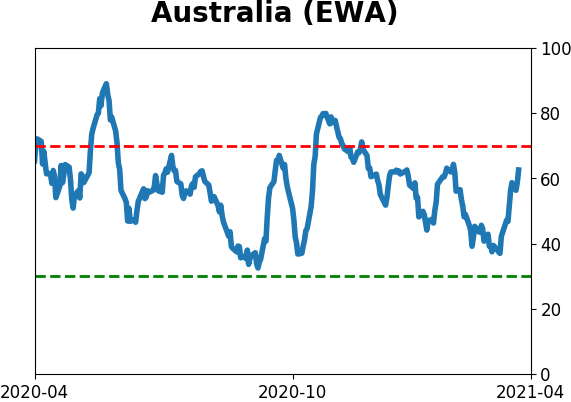
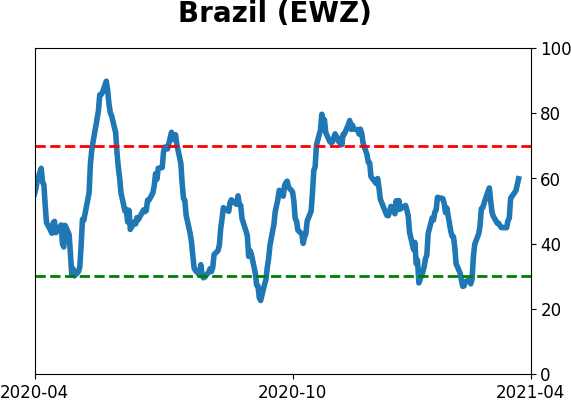
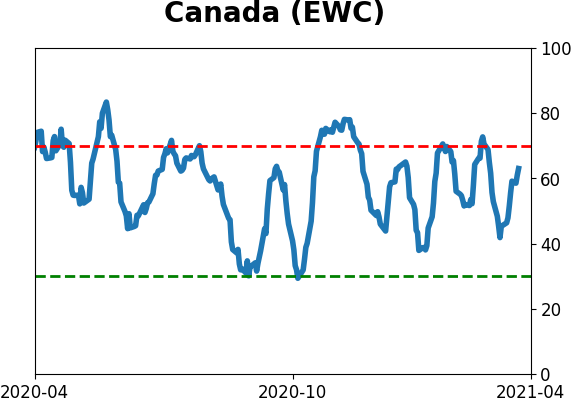
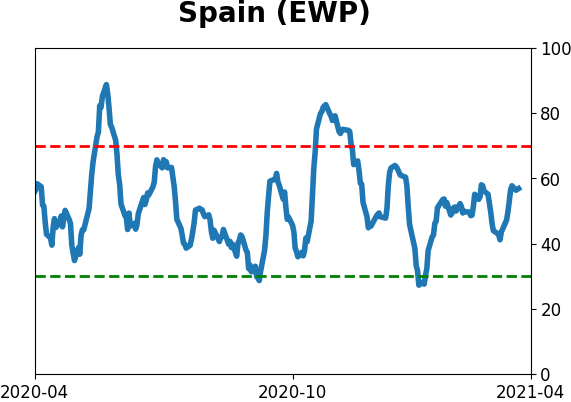
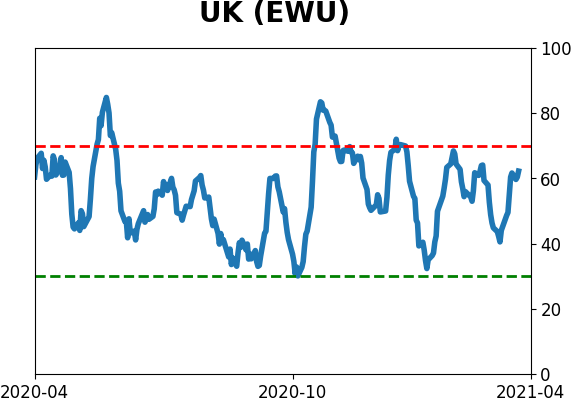
Country ETF's - 10-Day Moving Average
|
|
|
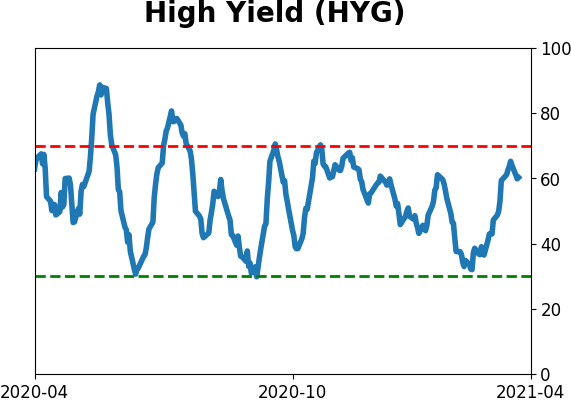
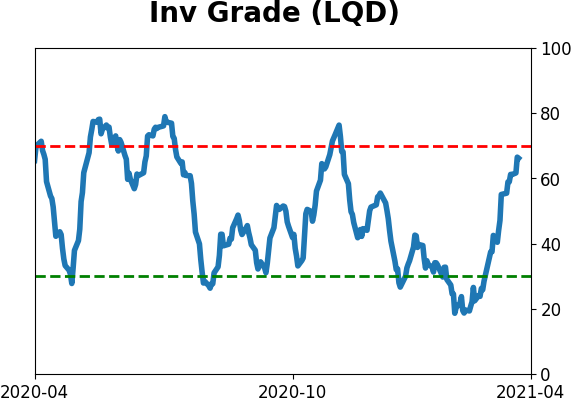
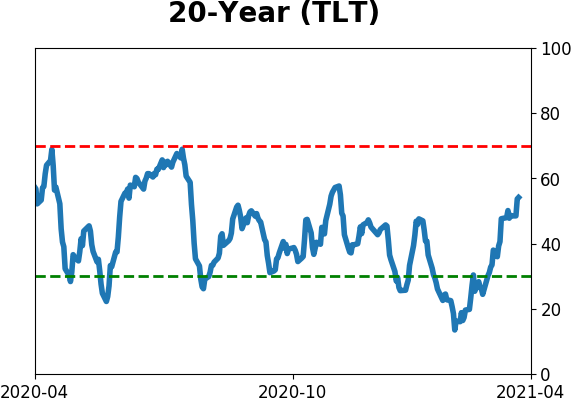
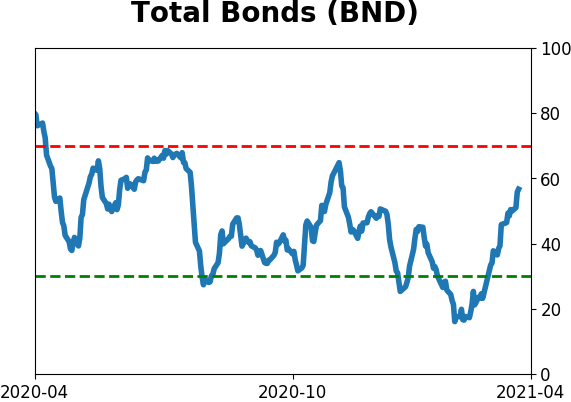
Bond ETF's - 10-Day Moving Average
|
|
|
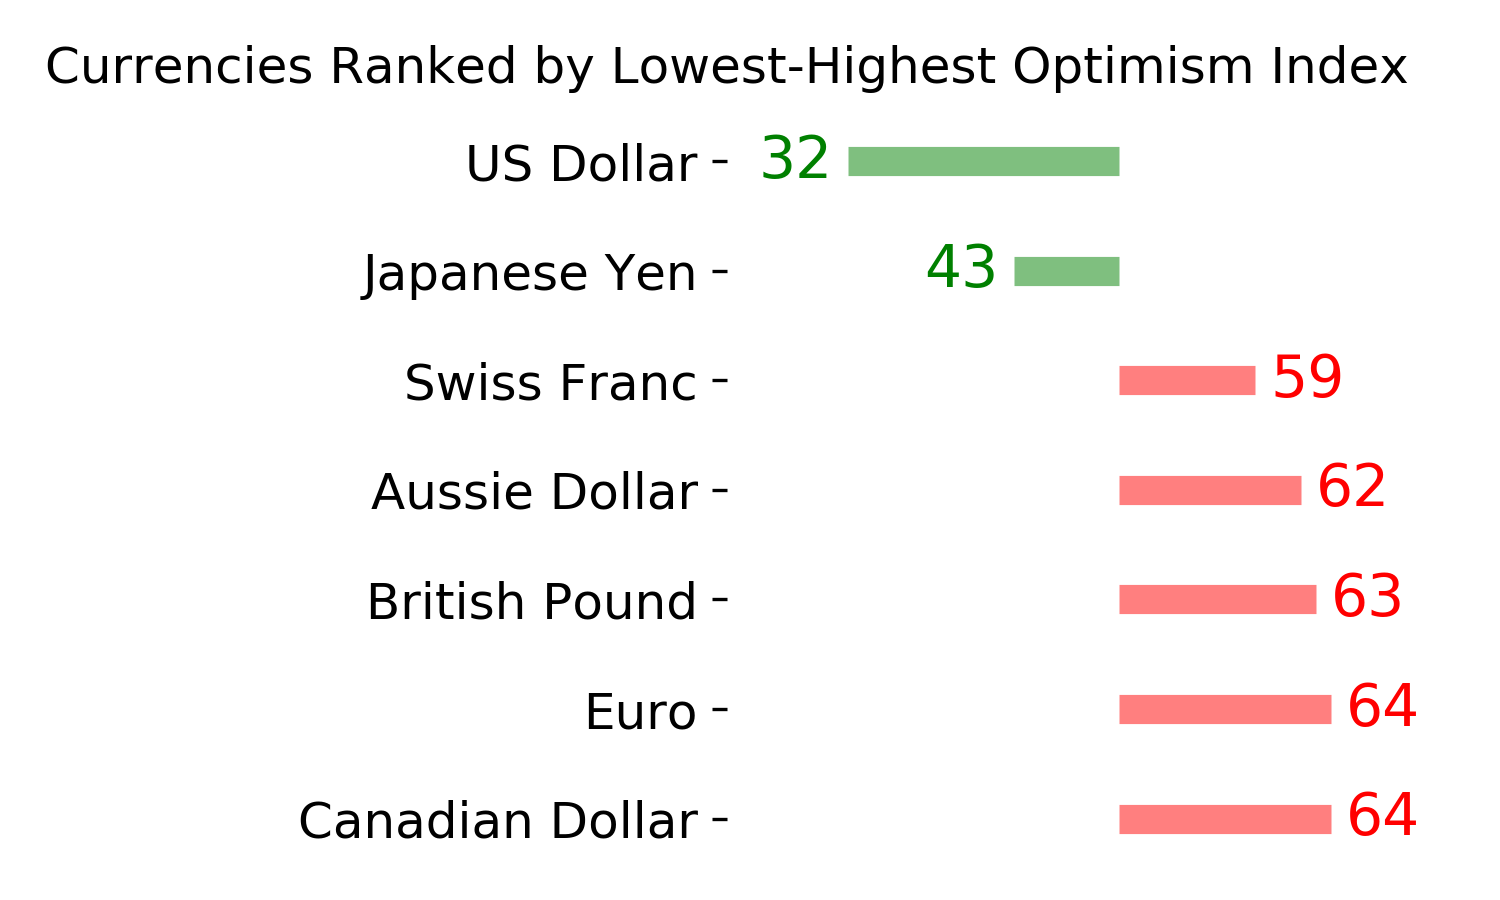
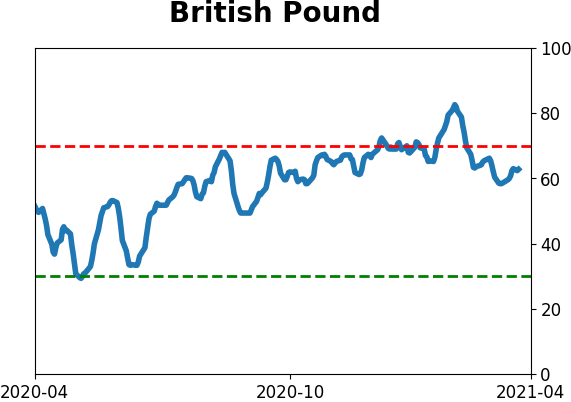
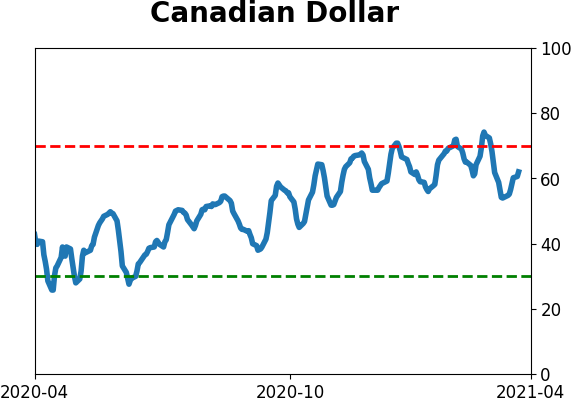
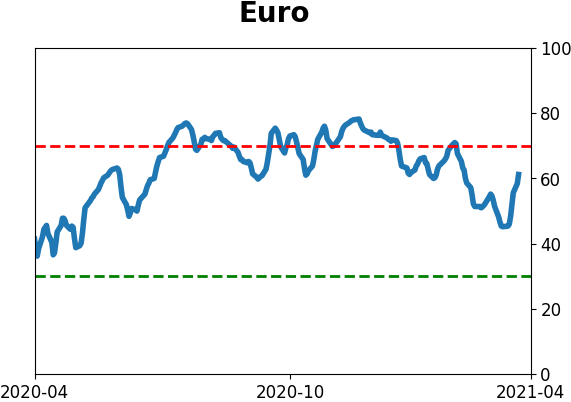
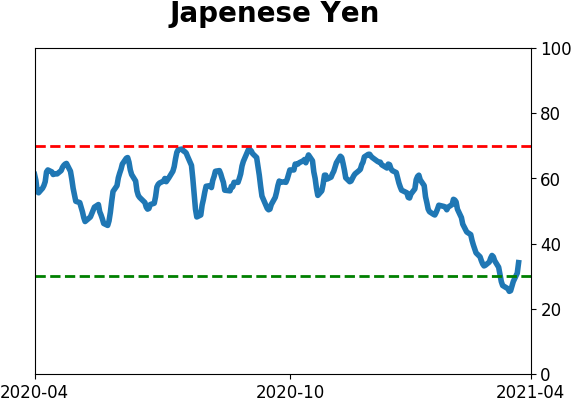
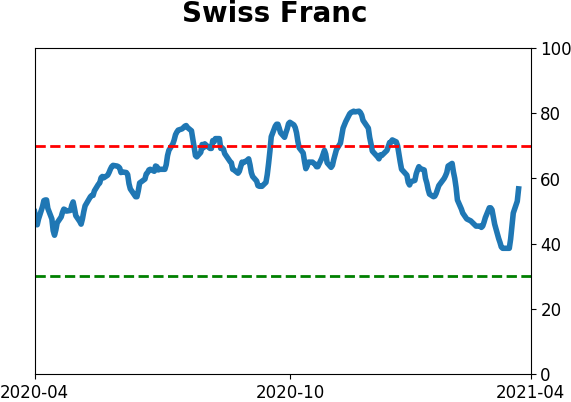
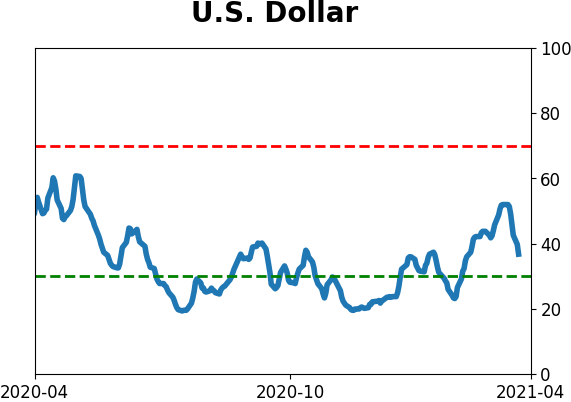
Currency ETF's - 5-Day Moving Average
|
|
|
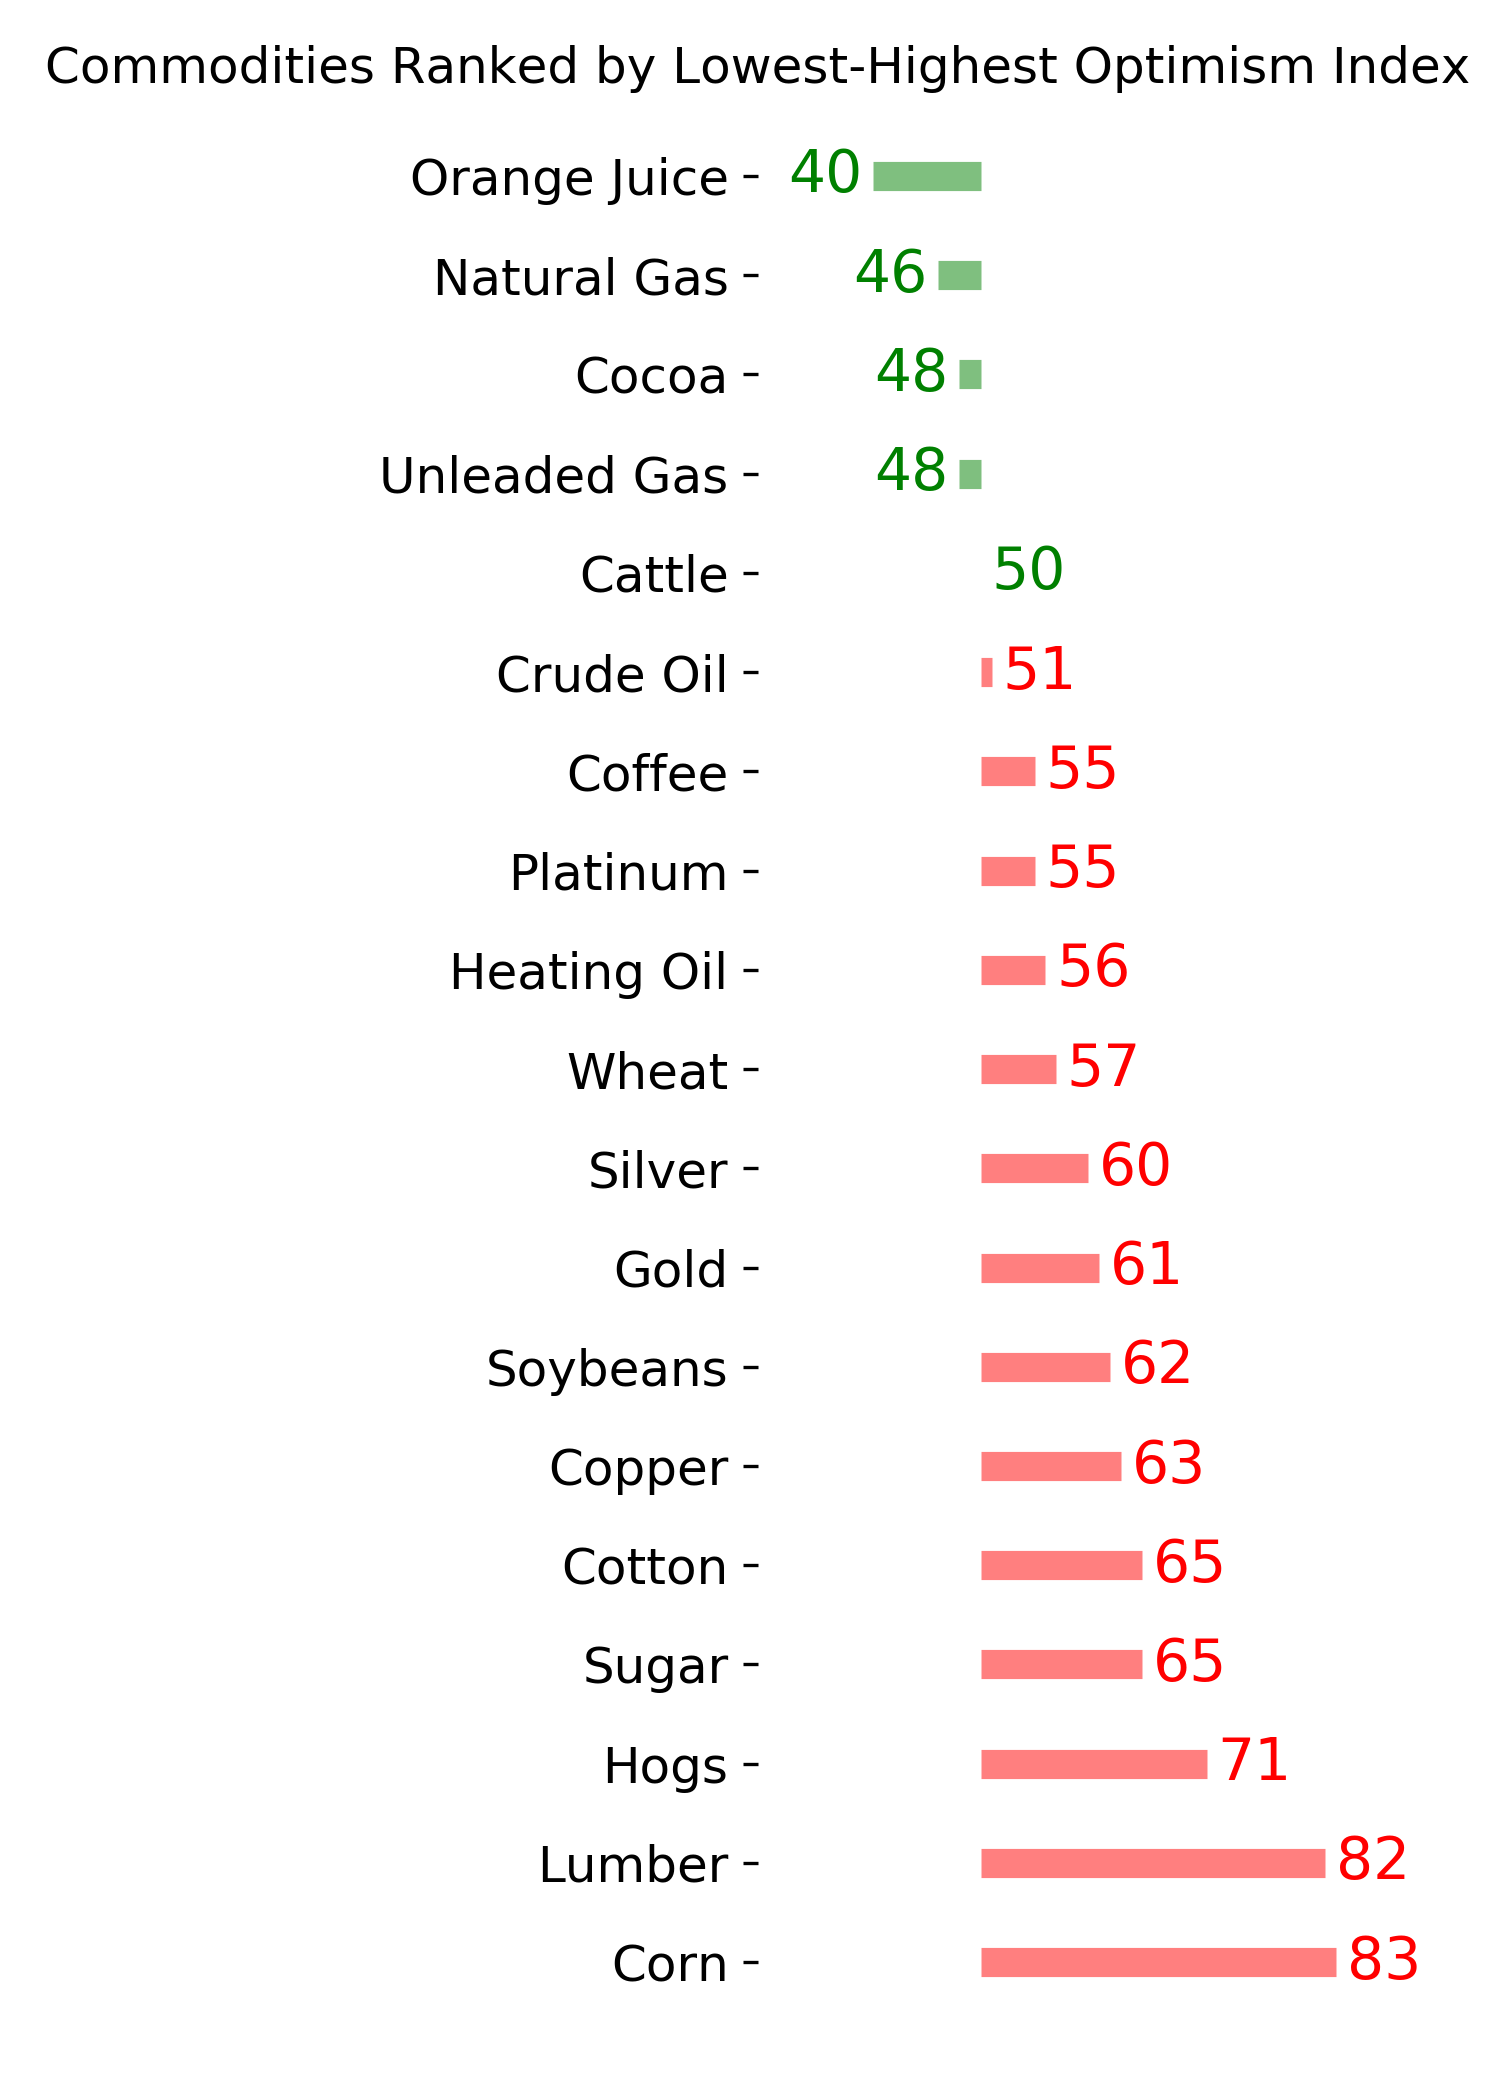
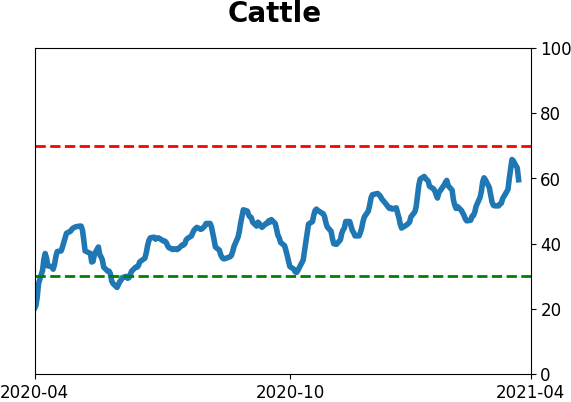
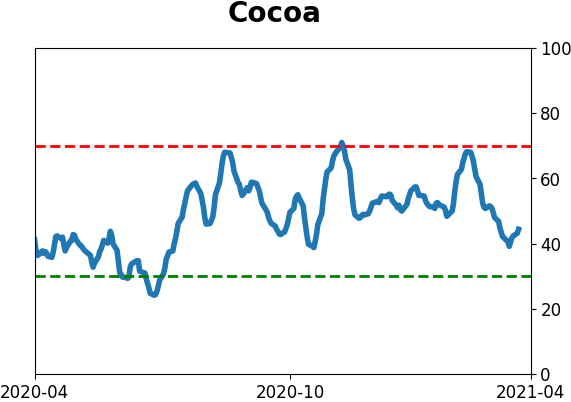
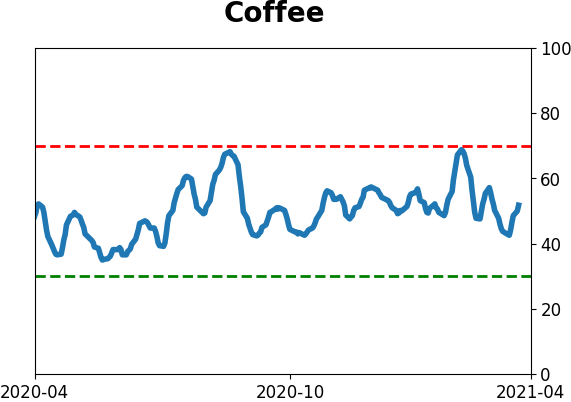
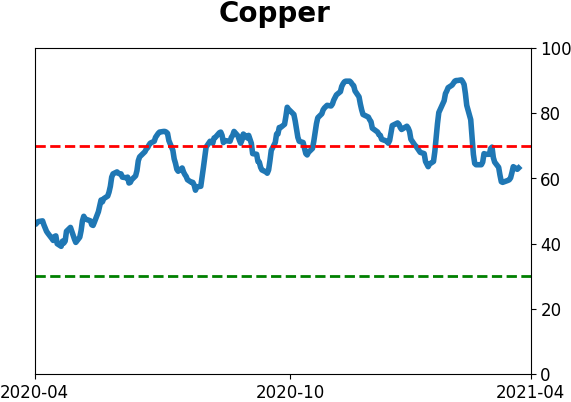
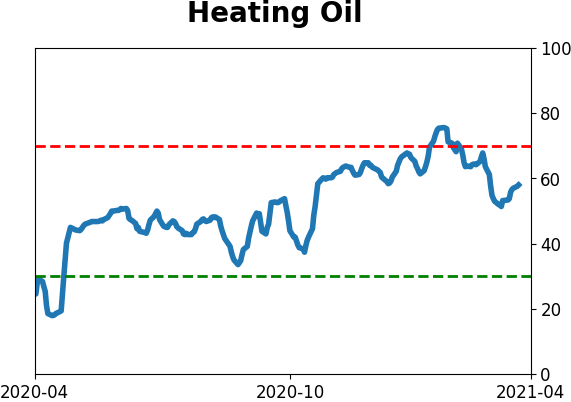
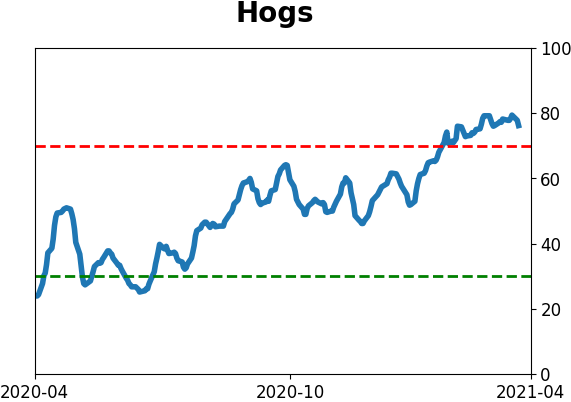
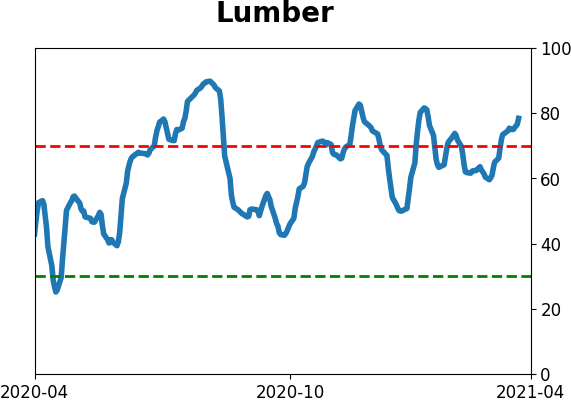
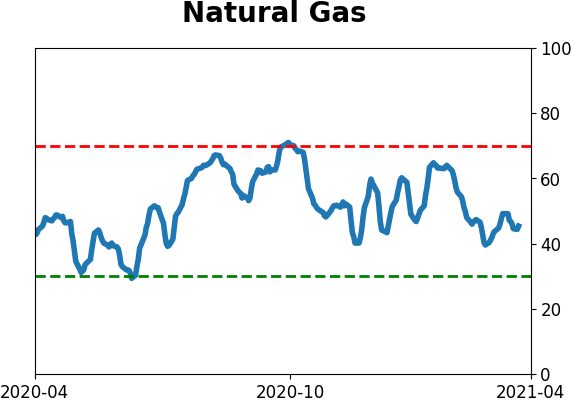
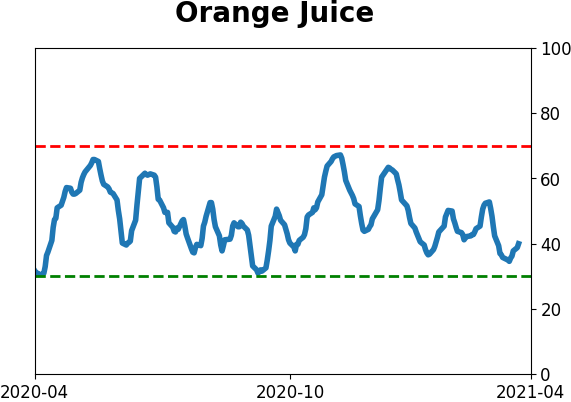
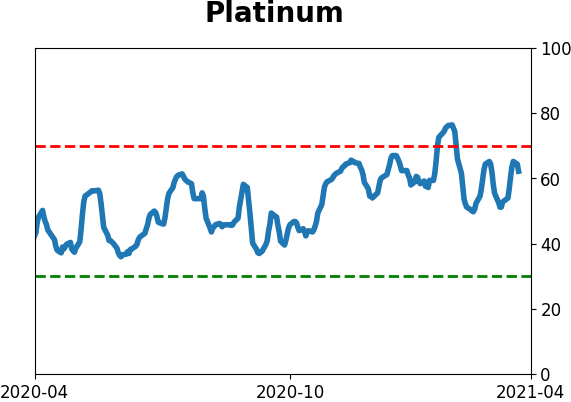
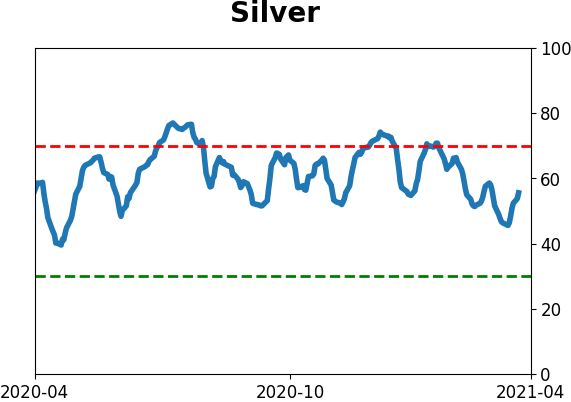
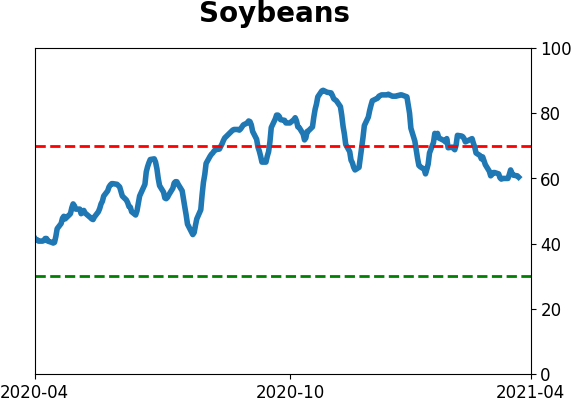
Commodity ETF's - 5-Day Moving Average
|
|