Headlines
|
|
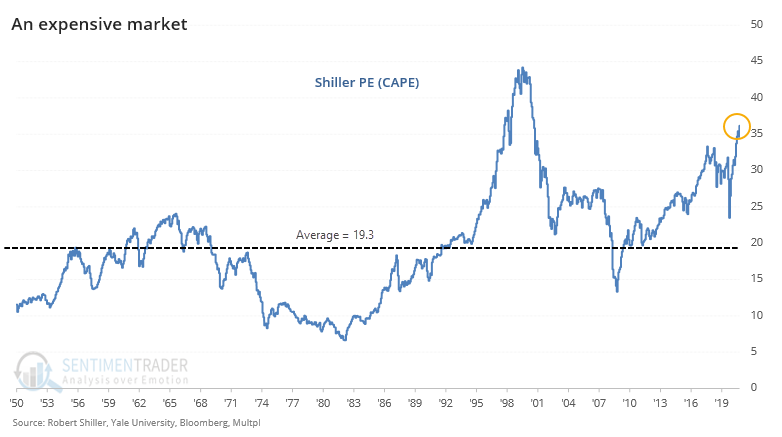
Wall Street is upgrading an already expensive earnings season:
We're entering Q1 earnings season with high valuations and high expectations. The Shiller PE ratio is among the highest in 70 years, and Wall Street analysts have been upgrading price targets and earnings estimates.
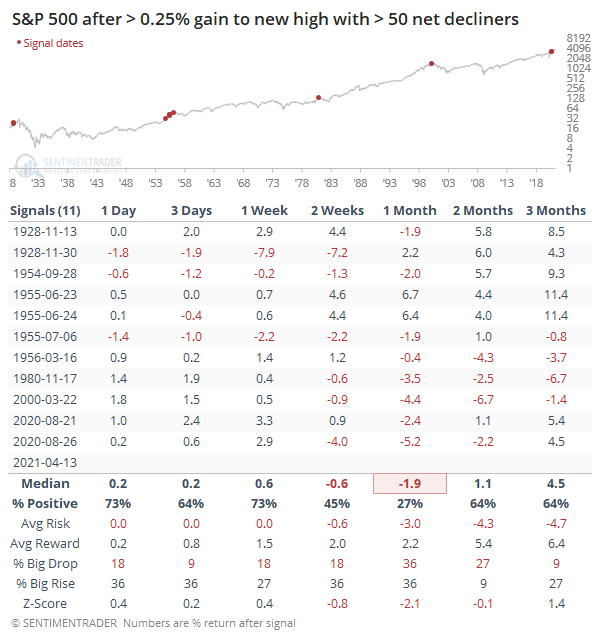
Big pushers: Thanks to stocks like Tesla, Apple, and Microsoft, the S&P 500 managed to rally more than 0.25% and close at a new high on Tuesday. And yet, there were only 225 advancing stocks in the index compared to 279 decliners. This is very rare, even going back nearly 100 years. Every time we've seen a daily oddity like this over the past 3 months, buyers came in almost immediately, so we'll see if this one is any different.
Bottom Line:
See the Outlook & Allocations page for more details on these summaries STOCKS: Weak sell
The extreme speculation registered in January and February is starting to get wrung out. Internal dynamics have mostly held up, so a return to neutral sentiment conditions would improve the forward risk/reward profile substantially. We're still a ways off from that. BONDS: Weak buy
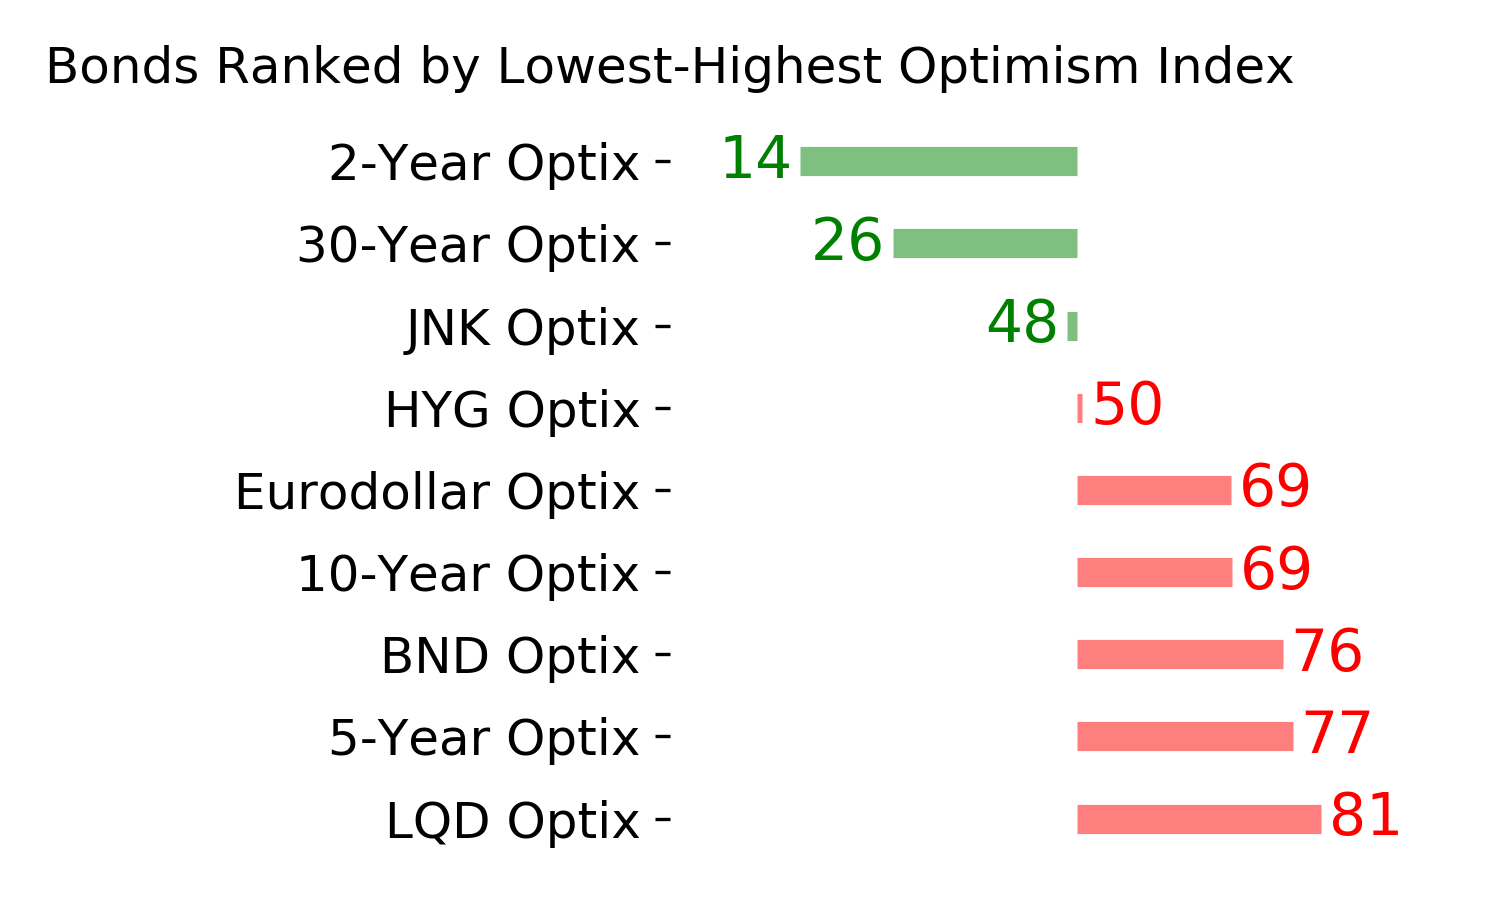
Various parts of the market have been hit in recent weeks, with mild oversold conditions. The Bond Optimism Index is now about as low as it gets during healthy bond market environments. Fixed income isn't responding well, so that needs to be monitored in case it's transitioning to a longer-term negative market environment. GOLD: Weak buy
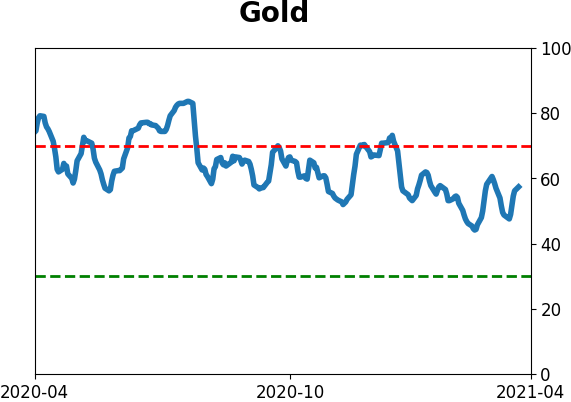
A dollar trying to rebound from a severe short position has weighed on gold and miners. The types of signals they've given in recent weeks, within the context of their recent surge, have usually resulted in higher prices over a medium- to long-term time frame. Like bonds, gold and miners aren't responding very well, and this needs to be monitored.
|
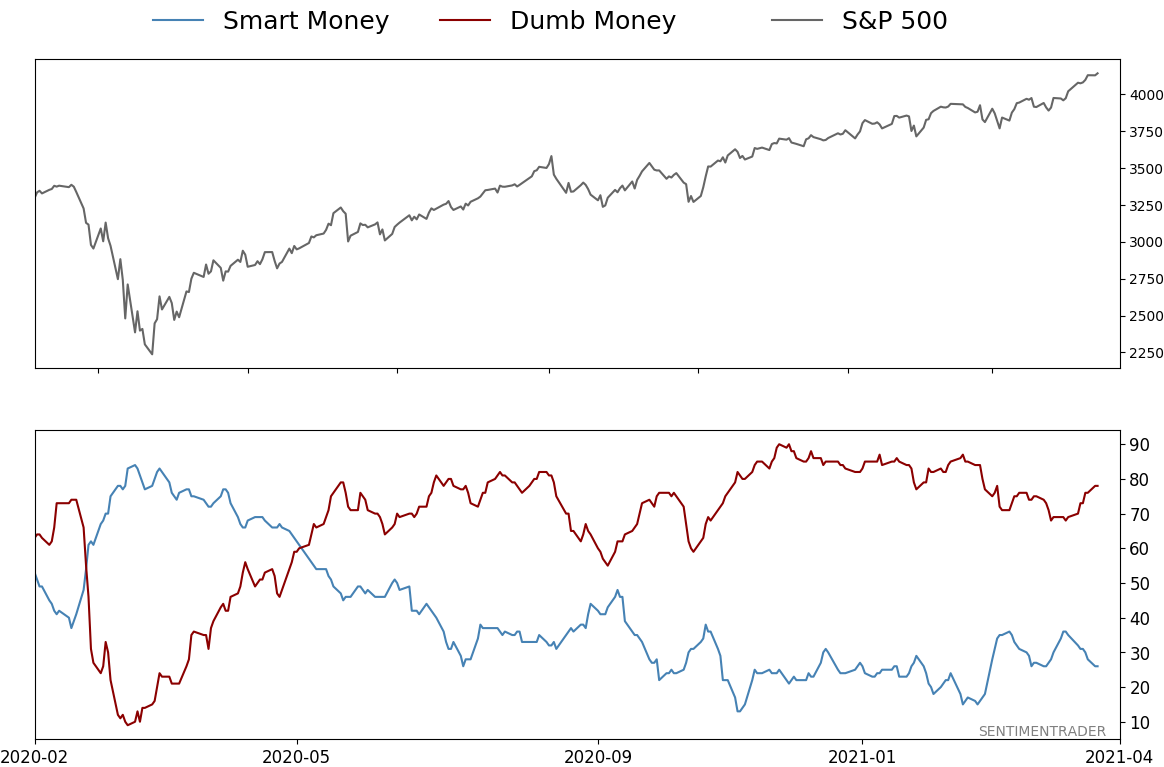
Smart / Dumb Money Confidence
|
Smart Money Confidence: 26%
Dumb Money Confidence: 78%
|
|
Risk Levels
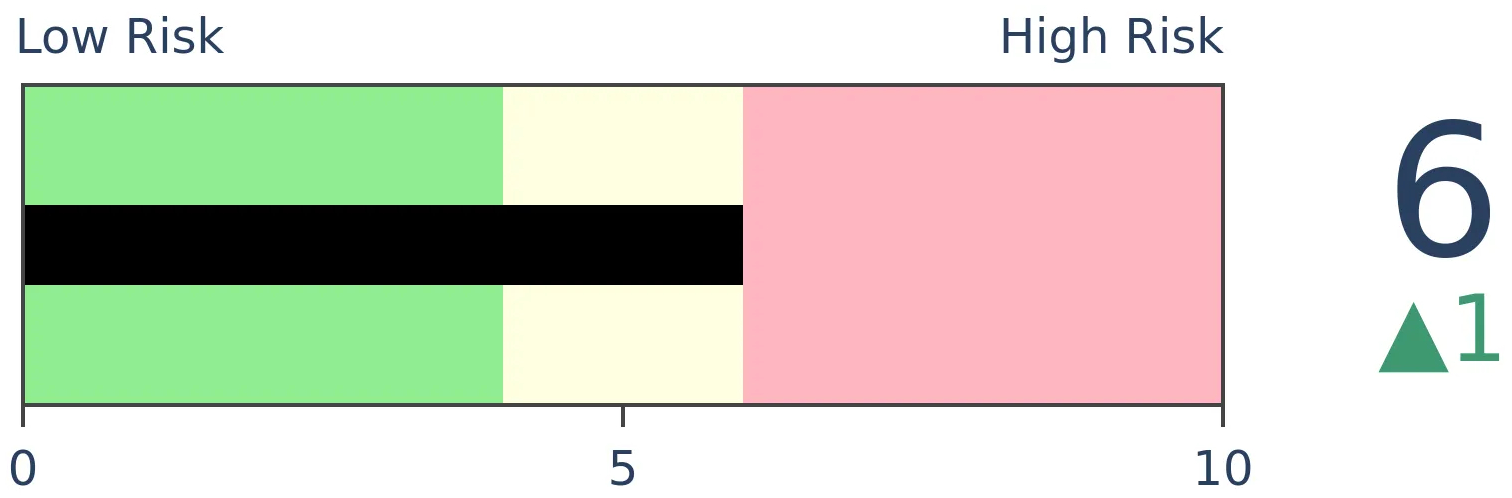
Stocks Short-Term

|
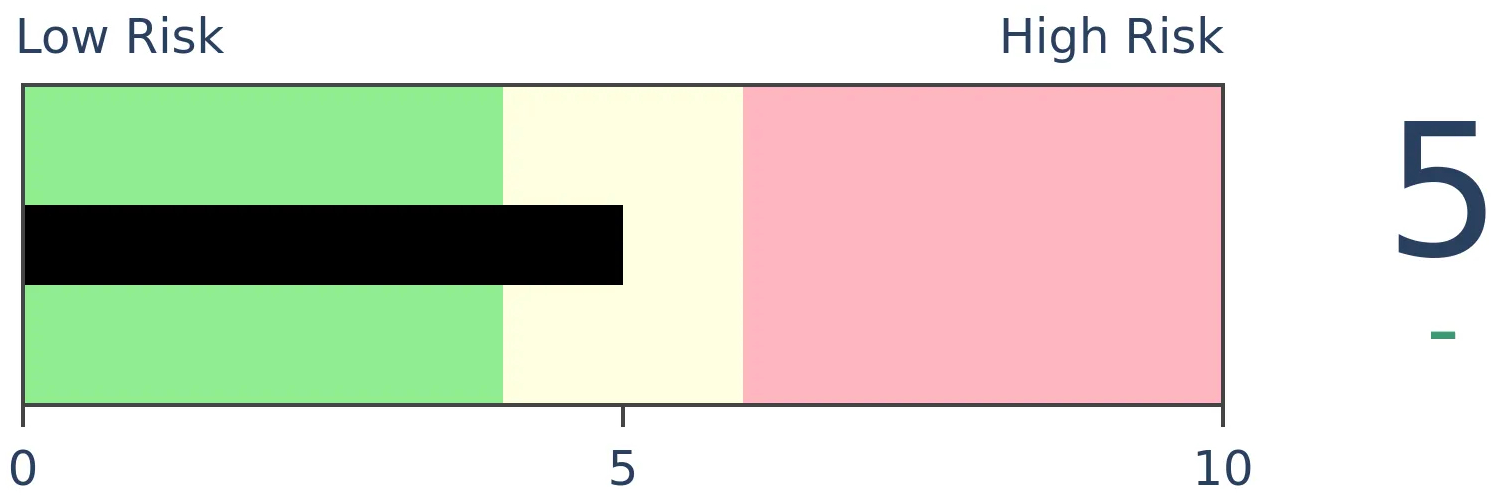
Stocks Medium-Term
|
|
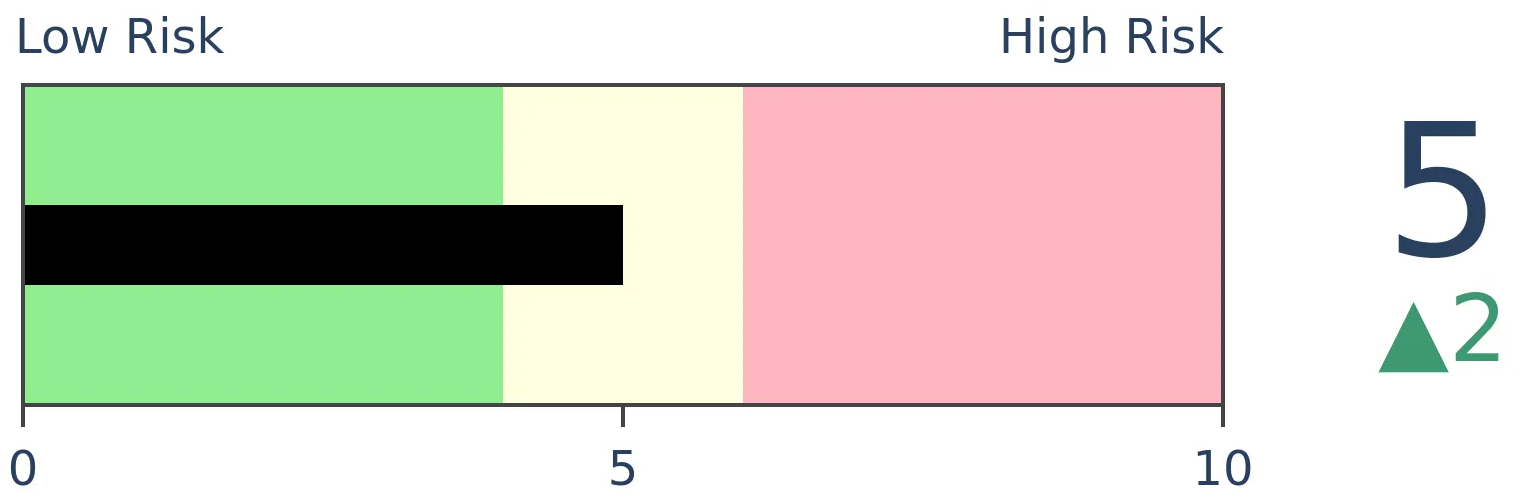
Bonds
|
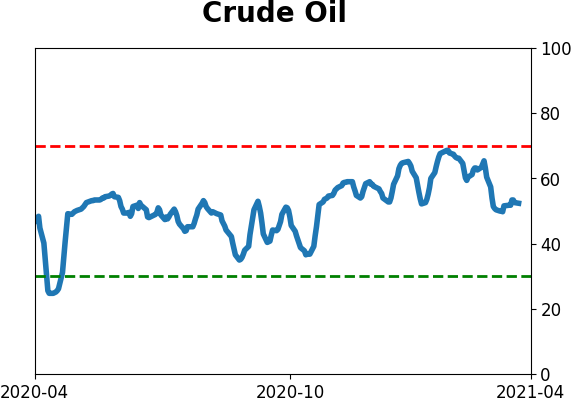
Crude Oil
|
|
Gold
|
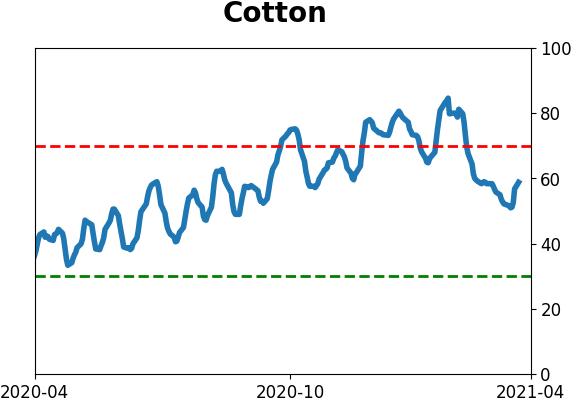
Agriculture

|
|
Research
BOTTOM LINE
We're entering Q1 earnings season with high valuations and high expectations. The Shiller PE ratio is among the highest in 70 years, and Wall Street analysts have been upgrading price targets and earnings estimates.
FORECAST / TIMEFRAME
None
|
As we head into Q1 earnings reporting season, expectations are high and stocks are expensive. Wall Street, and the investors that rely on their analysis, are gearing up for blockbuster performances.
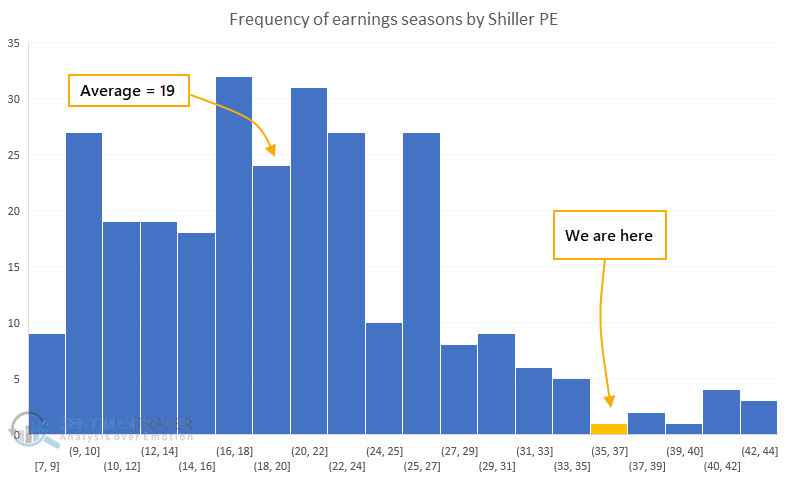
At the start of the last 282 earnings seasons, dating back to 1950, the average Shiller PE ratio for the S&P 500 was 19.3. This season, its valuation is nearly twice that, above 37.0.
There are slightly different ways to calculate this valuation measure, and it certainly has its detractors. Using a definition from Multpl, the measure is calculated by:
- Looking at the yearly earning of the S&P 500 for each of the past ten years
- Adjusting these earnings for inflation, using the CPI
- Averaging these values (ie: add them up and divide by ten)
- Taking the current price of the S&P 500 and divide by #3
The histogram below shows the distribution of valuation ratios on days when earnings season began for any quarter since 1950.
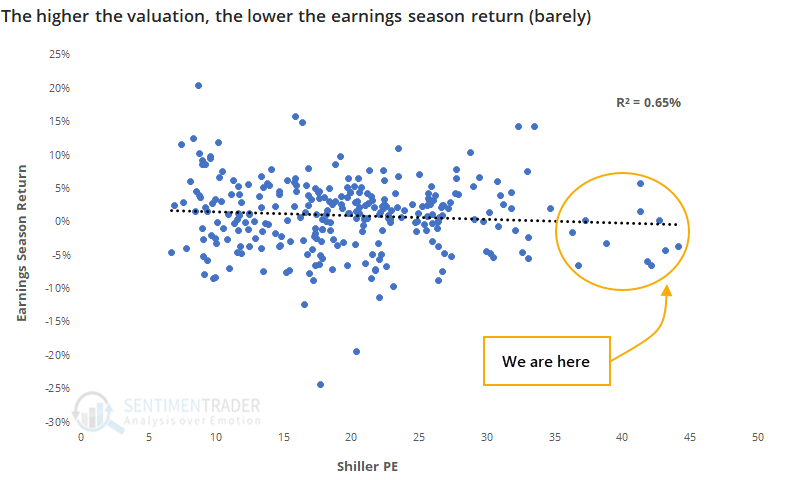
It's not a shocker that stocks are expensive, just as we head into the period that investors will be most focused on the denominator of that equation. But using valuation for short-term guidance like a single earnings season is iffy, and indeed there has been only a slight negative correlation.
The scatter plot below shows returns in the S&P 500 during every earnings season since 1950 versus the Shiller PE ratio on the first day of earnings season. Reporting season roughly begins about 5 days following the end of a quarter and lasts around 28 days. There is no official beginning or end.
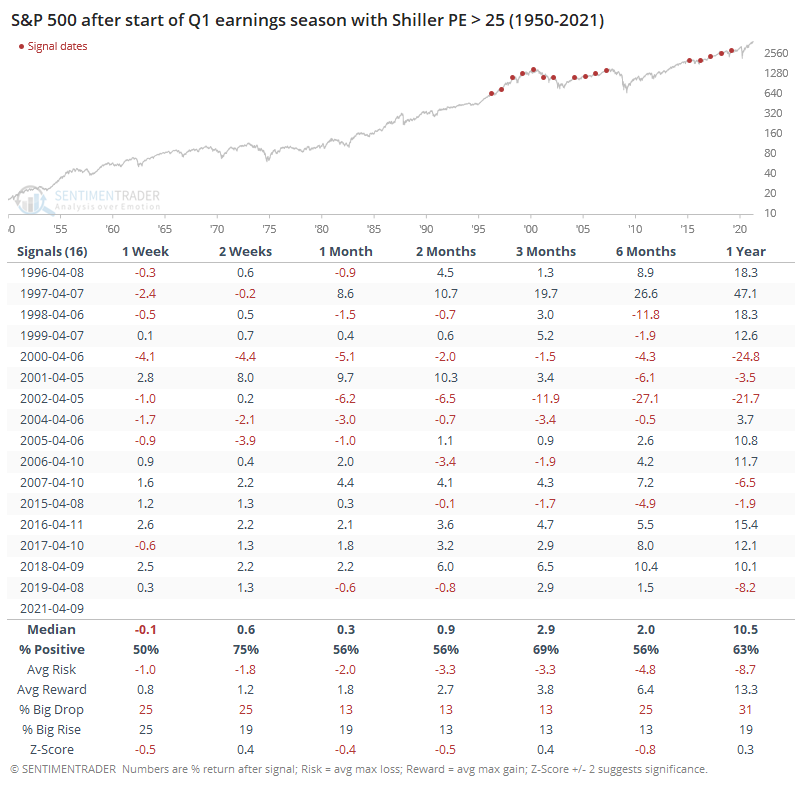
There have been 16 Q1 earnings seasons when the Shiller PE was 25 or higher, and the S&P gained during those earnings seasons 8 times, with a median return of 0.2% - not great, but still positive.
By contrast, there were 20 Q1 earnings seasons when the ratio was 15 or below. Those led to 16 positive returns, with a median of 2.7%, which is much better.
All of the most expensive Q1 earnings seasons have come in the past 25 years. Again, the table shows that forward returns weren't terrible, they just weren't great, with more risk than reward up to 2 months later.
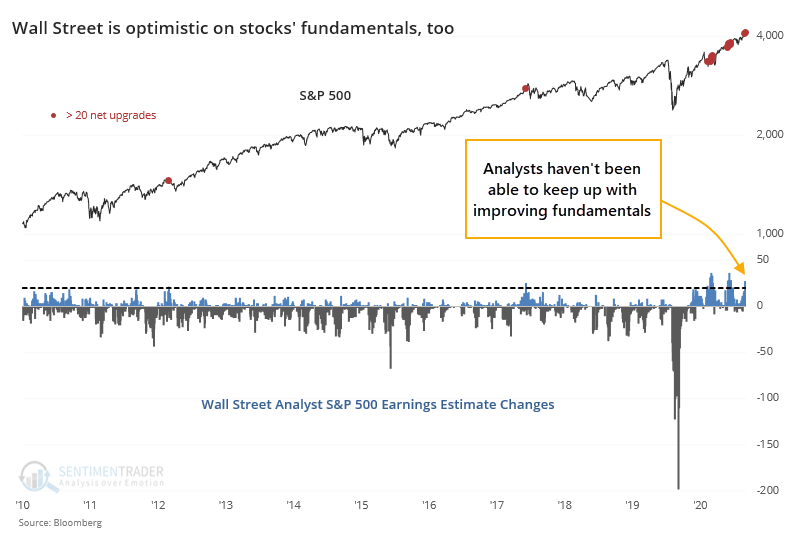
Wall Street has been warming up to the upcoming reports with a bevy of bottom-up upgrades. Analysts have consistently upgraded the net price targets on more than 100 stocks in the S&P 500 in recent days.
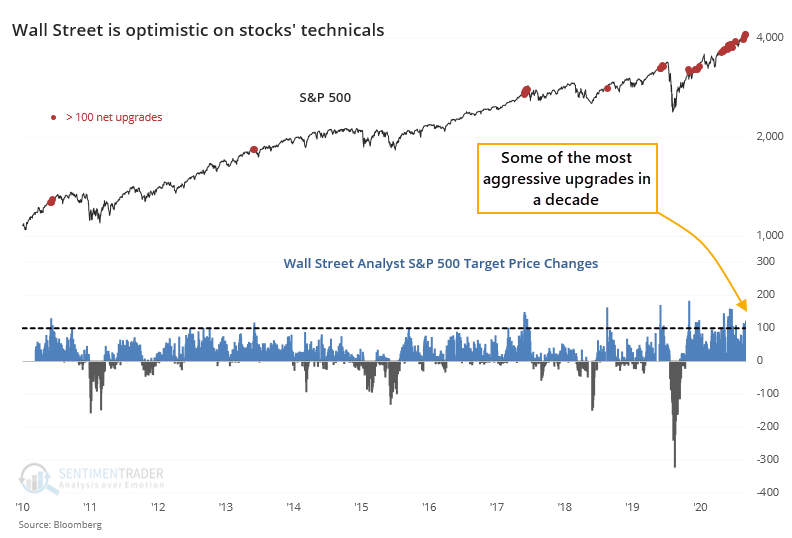
They're typically a lot more careful with fundamental upgrades, but there, too, they haven't been able to keep up.
So, we're entering the coming month of earnings reports with extremely high valuations already, and anticipation that those values will get even more stretched as companies report their results. The only real comparison to this is Q3 of 2017, when stocks were highly valued (but not as high as they are currently) and Wall Street was extremely optimistic (but not as optimistic as it is now). Stocks continued higher during Q4 then gave back all those gains and then some.
This is just more evidence of the tension we're facing right now; a mostly pristine market environment with almost no internal risk signals triggering, versus stretched sentiment and lopsided positioning. It would be rare to see an immediate, large, and protracted decline from these conditions, just as it would be rare to see a large, sustained advance.
Active Studies
| Time Frame | Bullish | Bearish | | Short-Term | 0 | 0 | | Medium-Term | 0 | 10 | | Long-Term | 11 | 4 |
|
Indicators at Extremes
|
% Showing Pessimism: 0%
Bullish for Stocks
|
|
Portfolio
| Position | Description | Weight % | Added / Reduced | Date | | Stocks | RSP | 4.9 | Reduced 4% | 2021-02-09 | | Bonds | 30.0% BND, 8.8% SCHP | 38.8 | Added 15.1% | 2021-02-18 | | Commodities | GCC | 2.3 | Reduced 2.1%
| 2020-09-04 | | Precious Metals | GDX | 9.0 | Added 0.1% | 2021-02-18 | | Special Situations | 7.3% XLE, 4.8% PSCE | 12.1 | Reduced 5.6% | 2021-02-18 | | Cash | | 32.8 | | |
|
Updates (Changes made today are underlined)
With a market that has seen the kinds of broad participation and big breath thrusts like we did in the fall, it's hard to become too negative. Those kinds of conditions have consistently preceded higher returns over the next 6-12 months. It's the interim that's more of an issue. Even conditions like that haven't prevented some shorter-term pullbacks. And when we combine an environment where speculation is rampant and recent days have seen an increase in cracks under the surface of the indexes, it's enough to become more defensive over a short- to medium-term time frame. We still don't have much confirmation from the price action in the indexes, so those who are more conservative would likely wait before increasing cash levels. I've decreased risk exposure a bit more, mainly in terms of energy stocks and the ANGL fund, while adding more to the broader bond market. RETURN YTD: 6.4% 2020: 8.1%, 2019: 12.6%, 2018: 0.6%, 2017: 3.8%, 2016: 17.1%, 2015: 9.2%, 2014: 14.5%, 2013: 2.2%, 2012: 10.8%, 2011: 16.5%, 2010: 15.3%, 2009: 23.9%, 2008: 16.2%, 2007: 7.8%
|
|
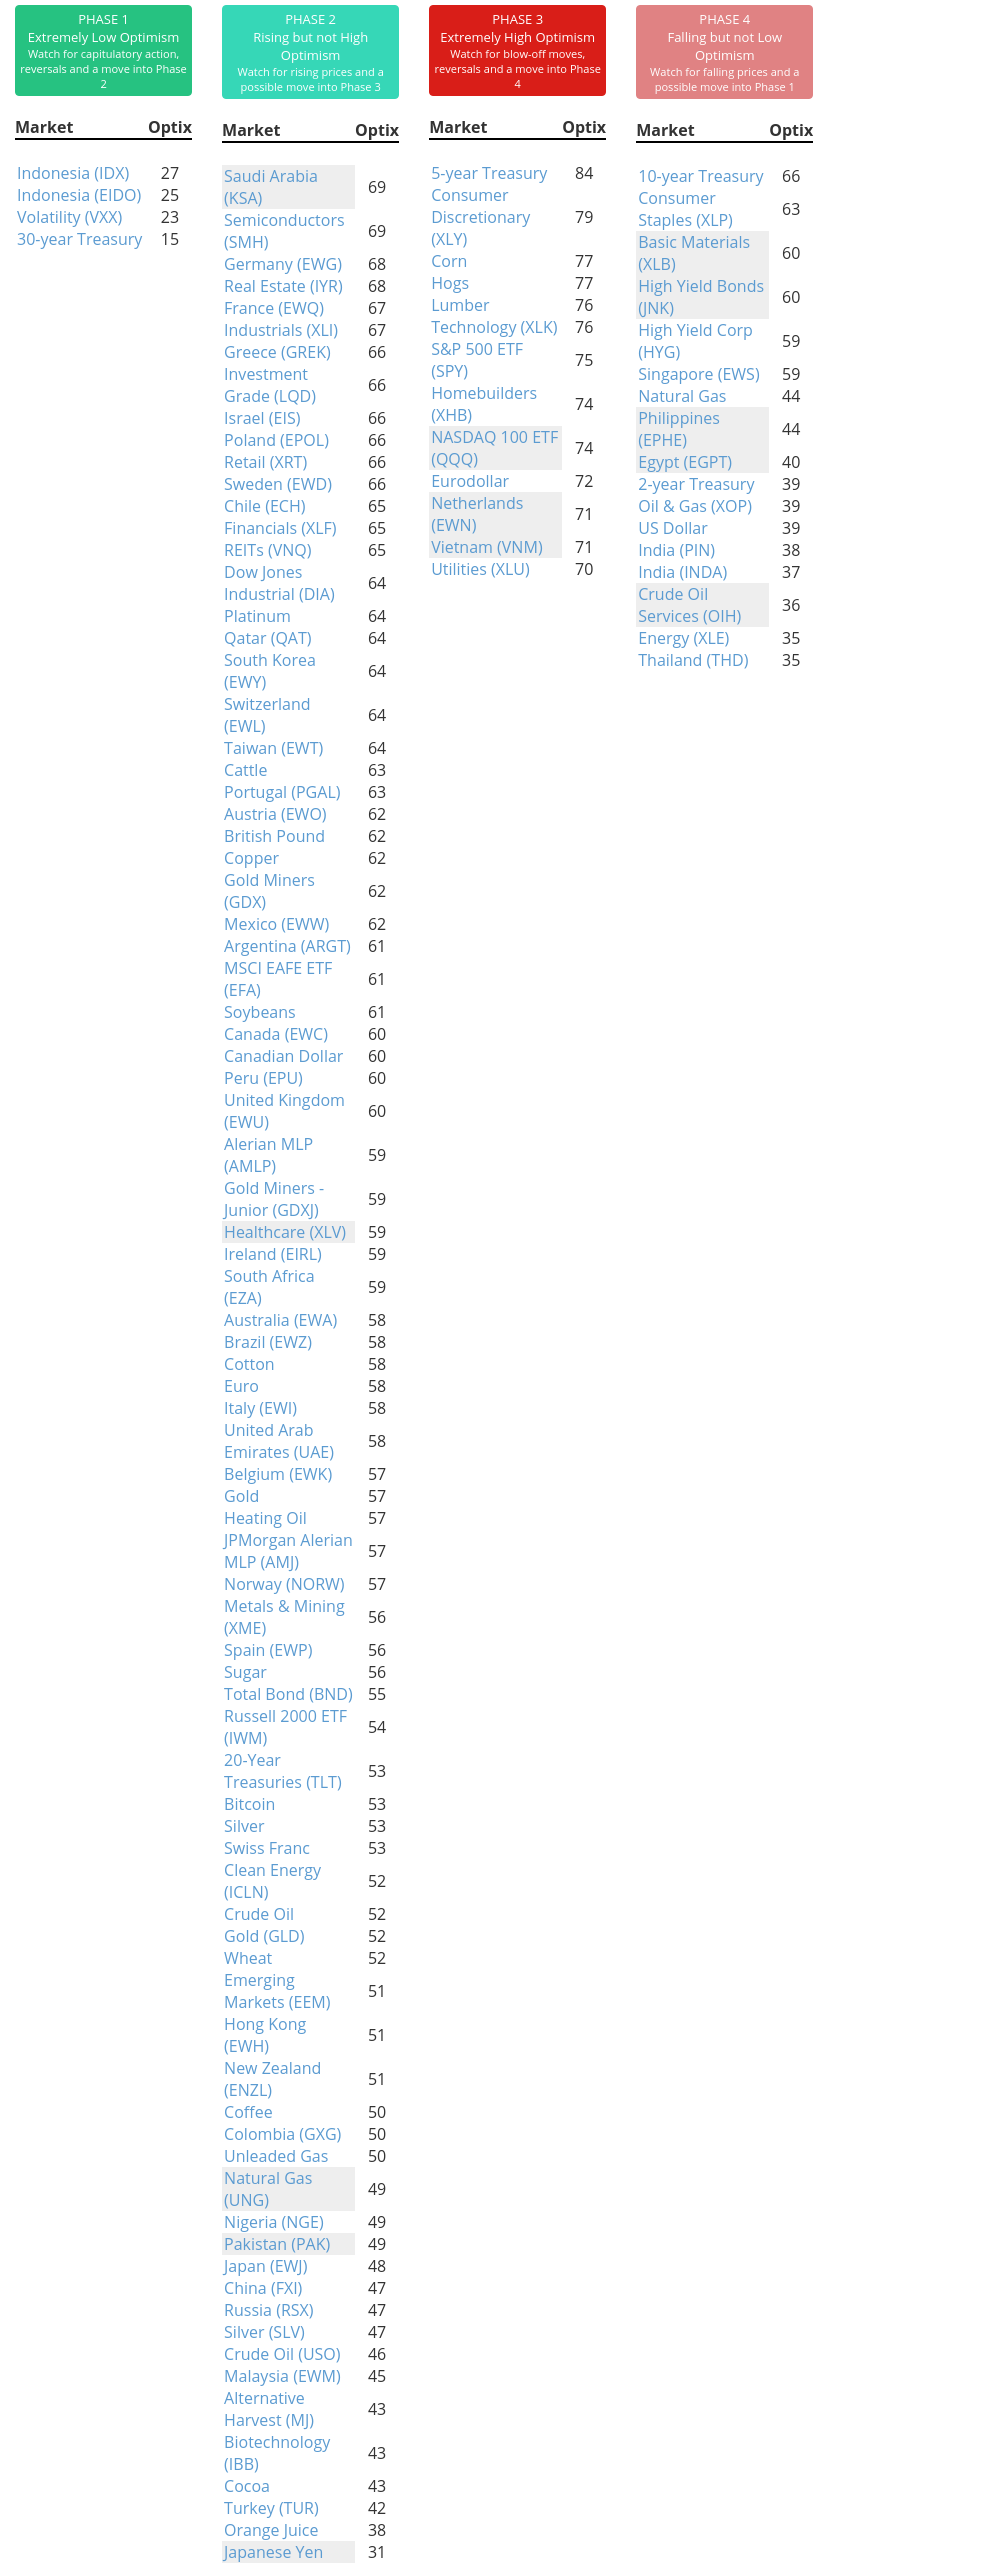
Phase Table
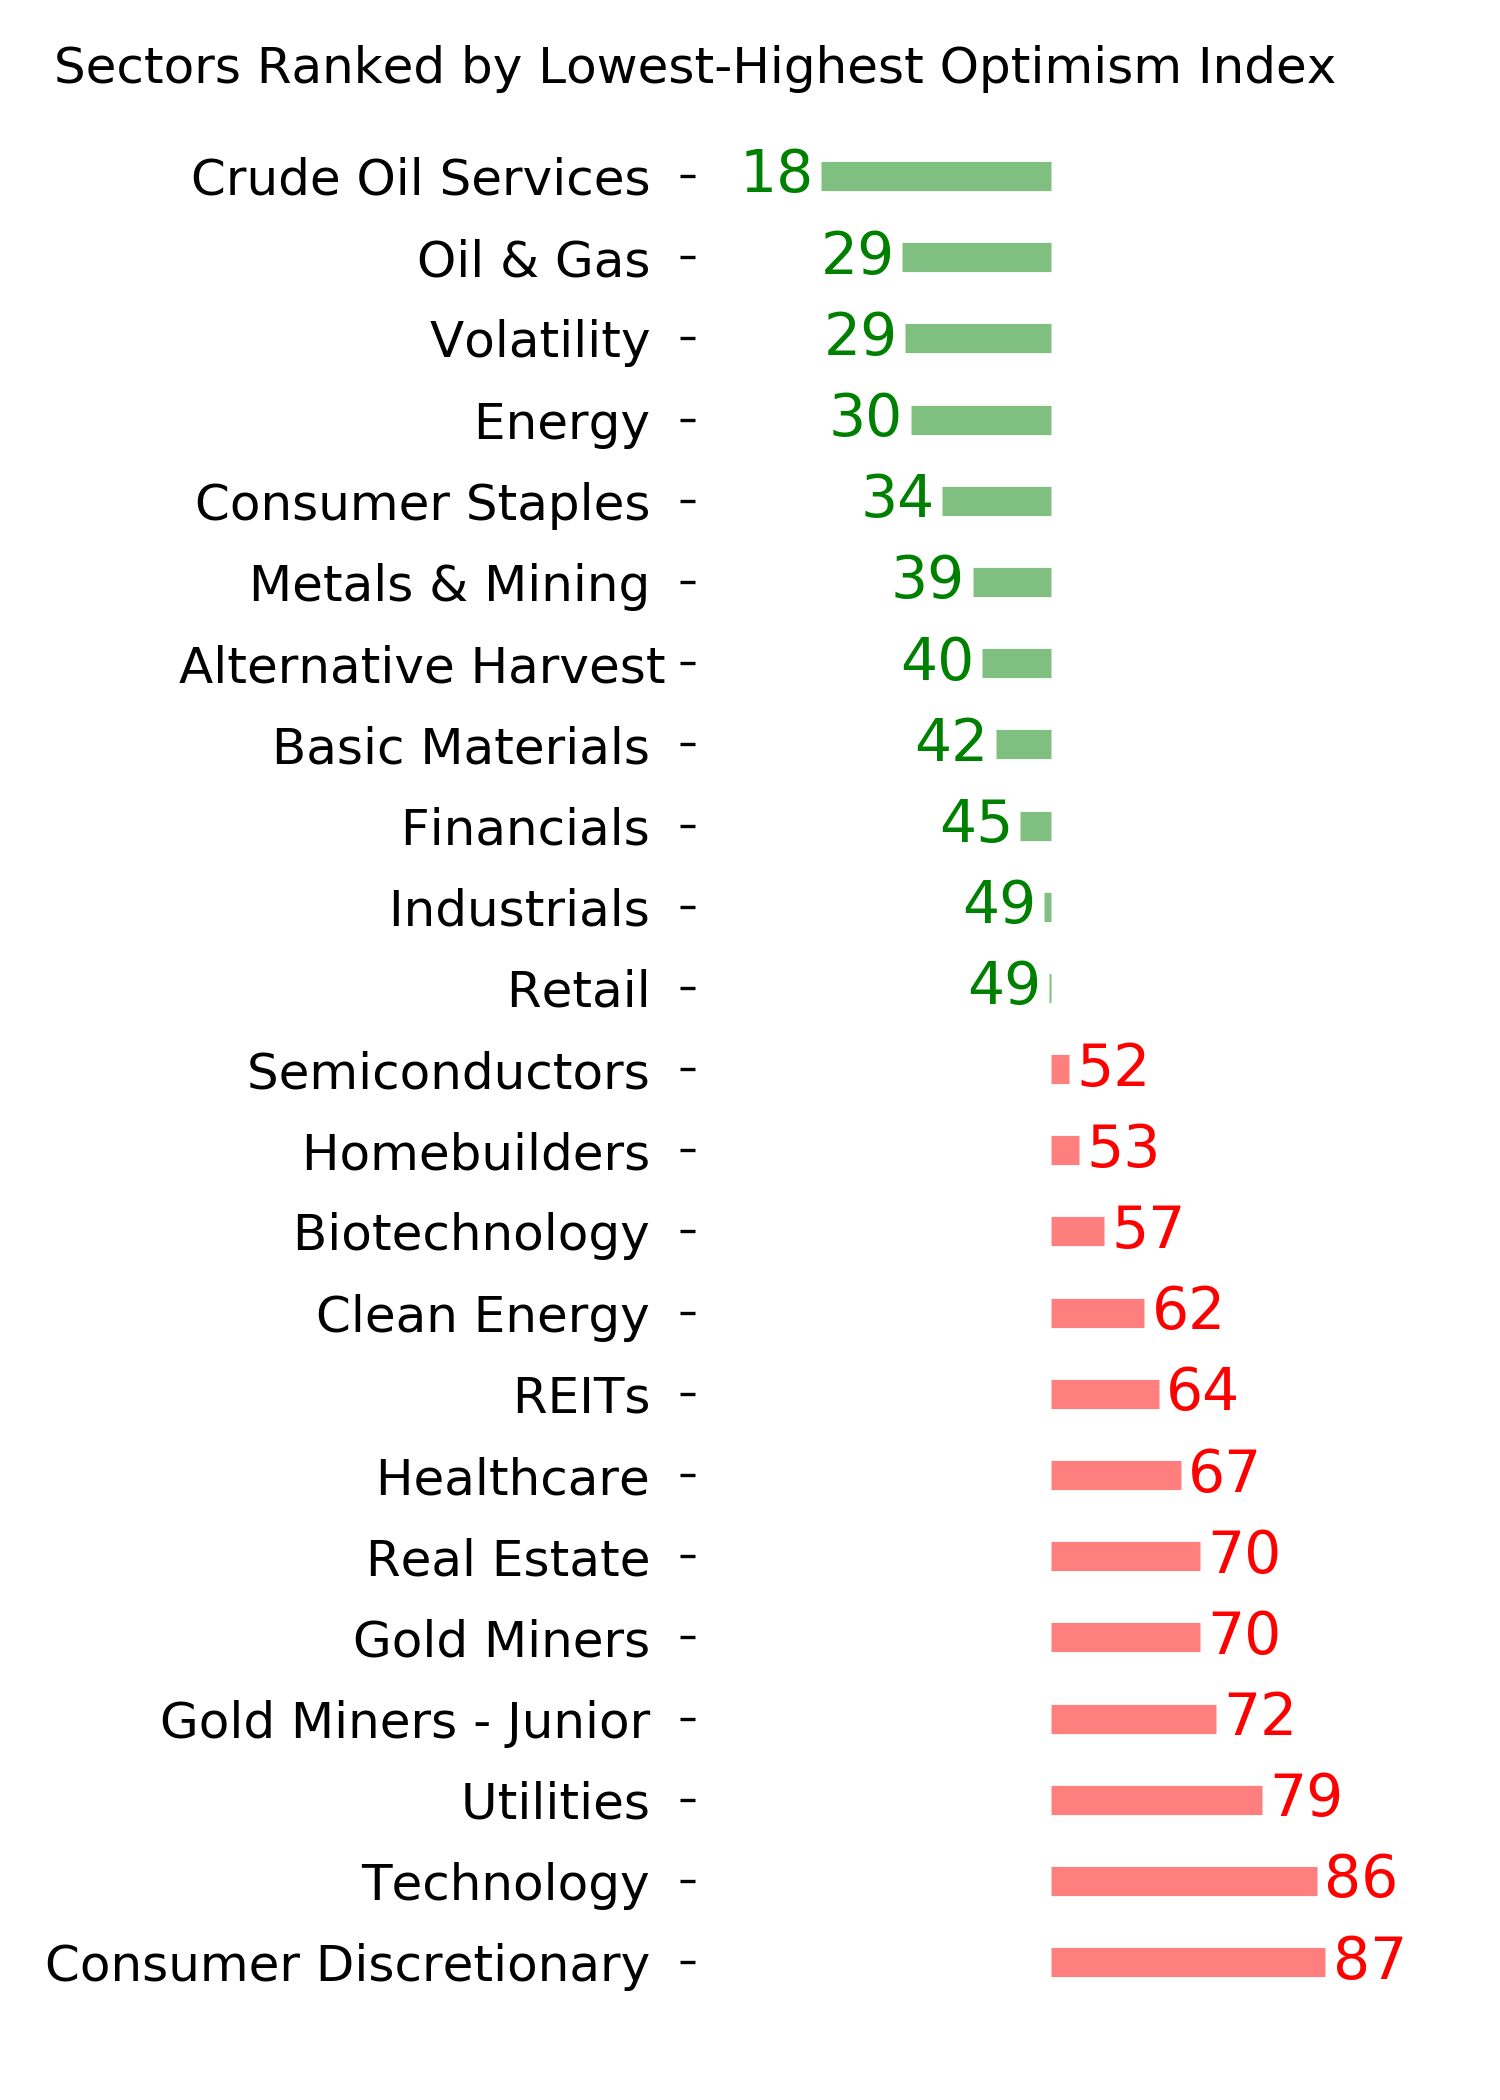
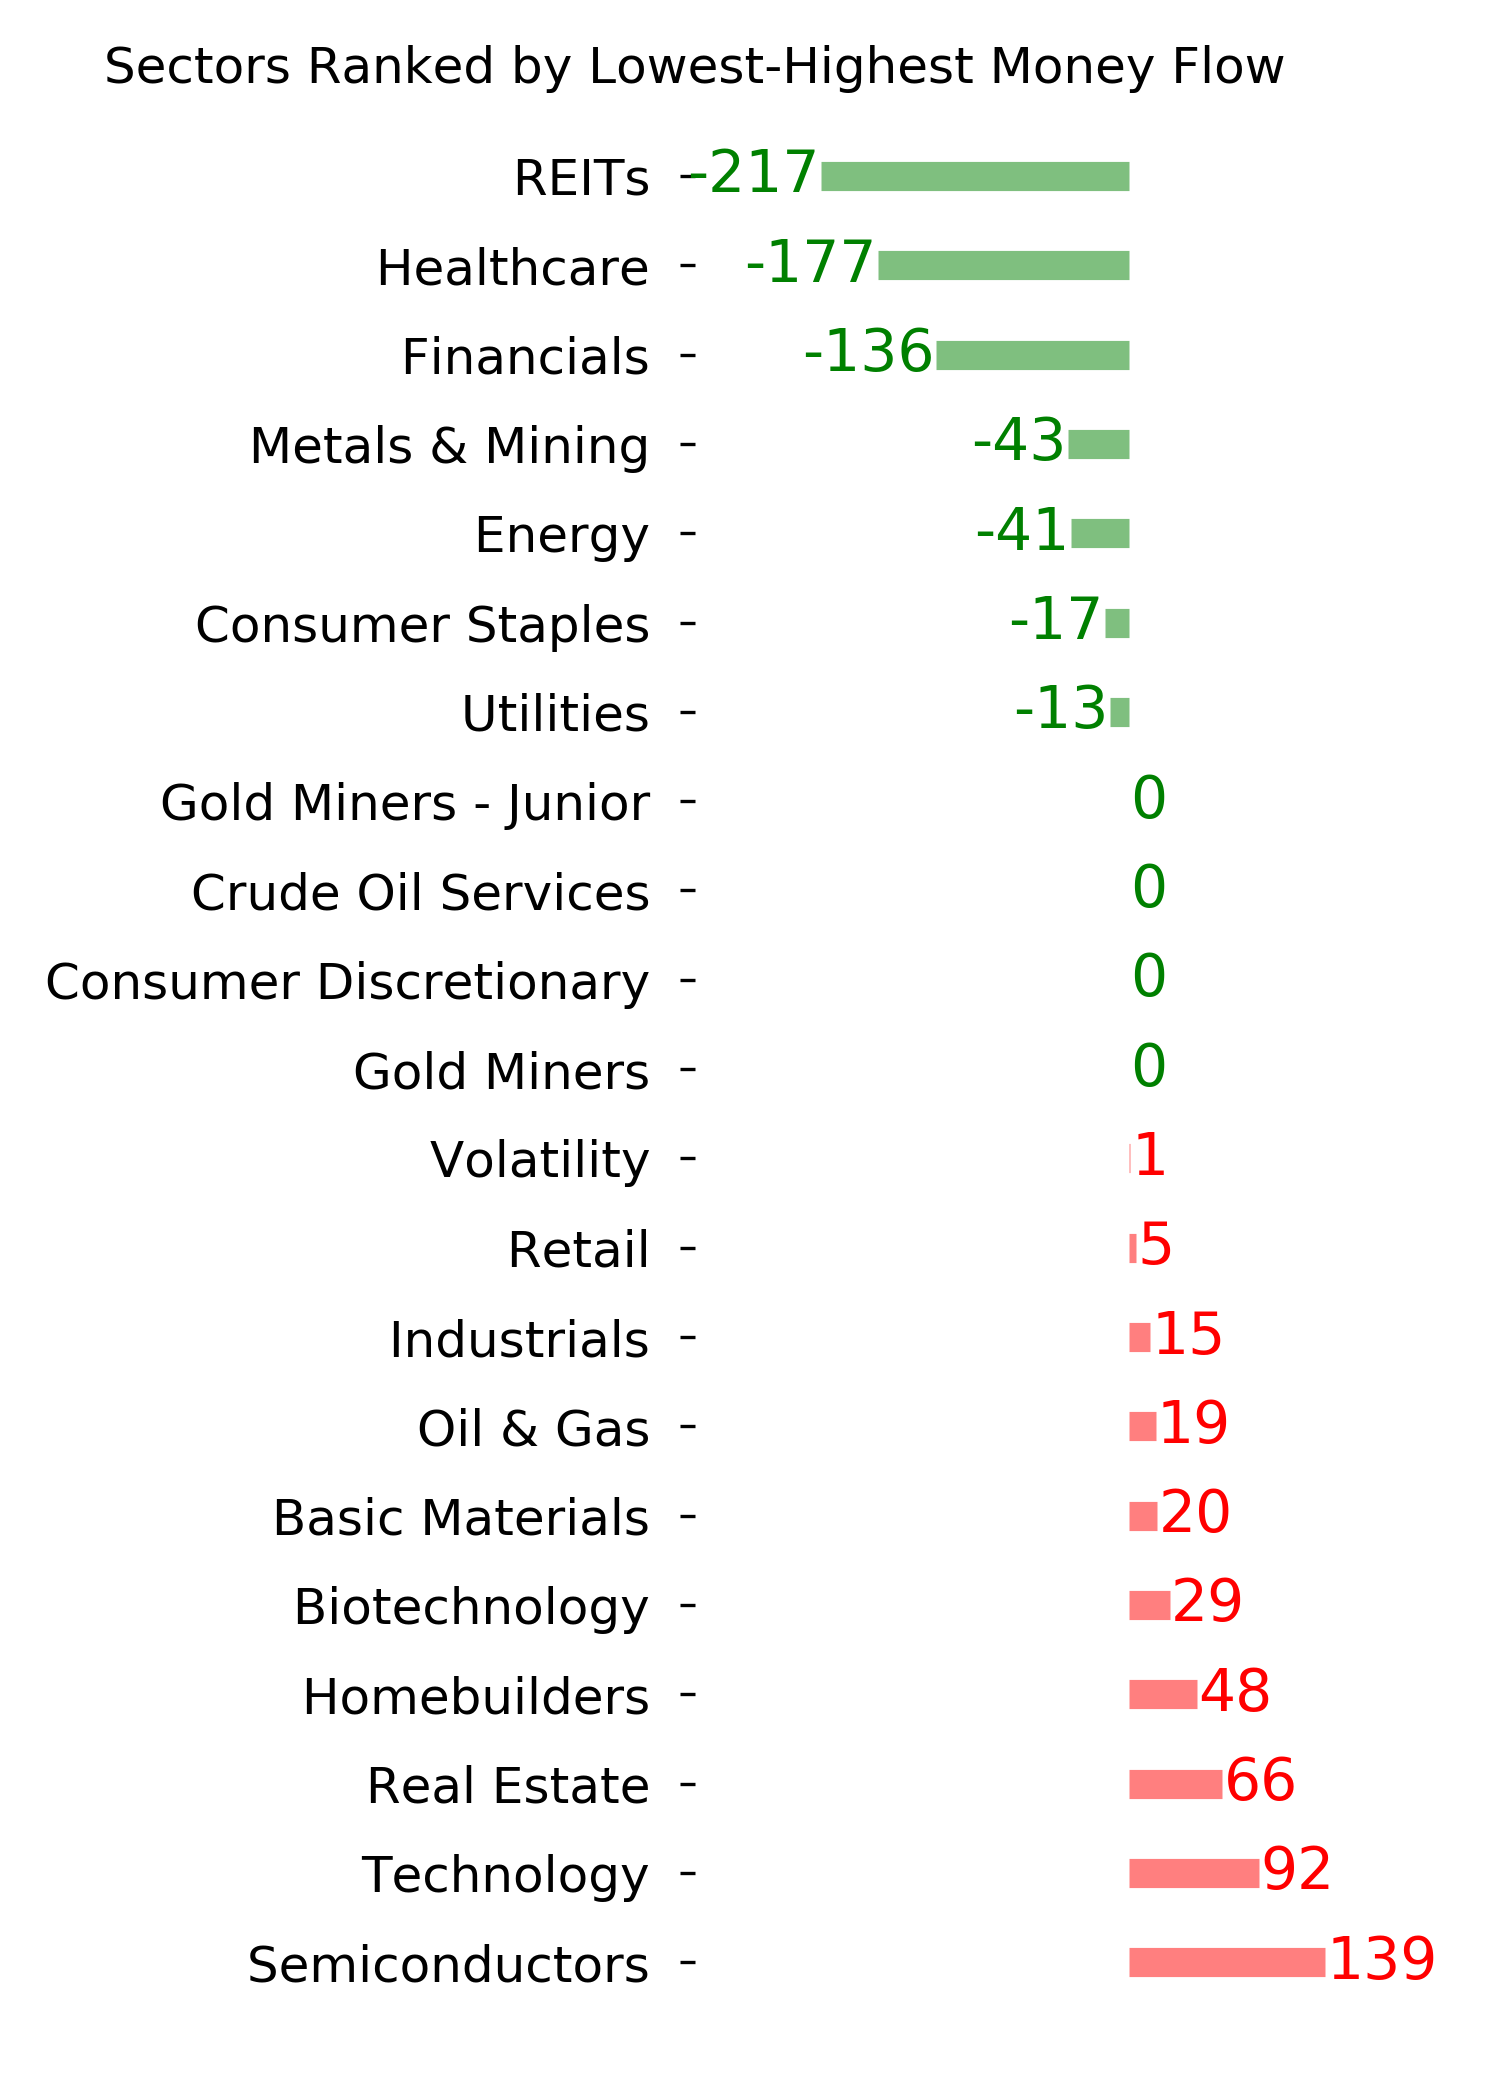
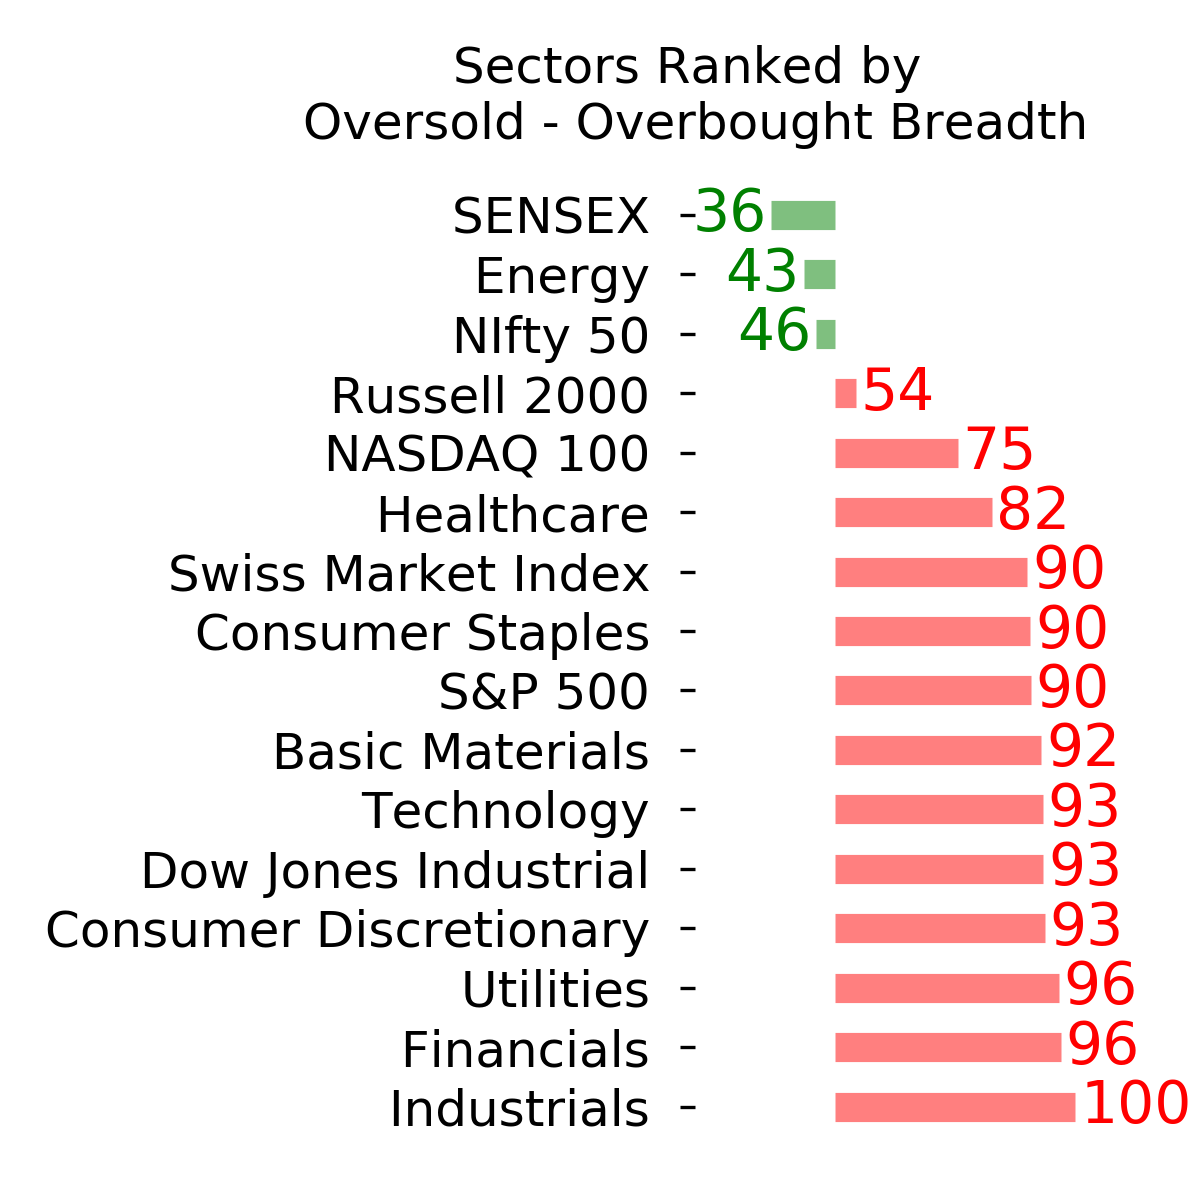
Ranks
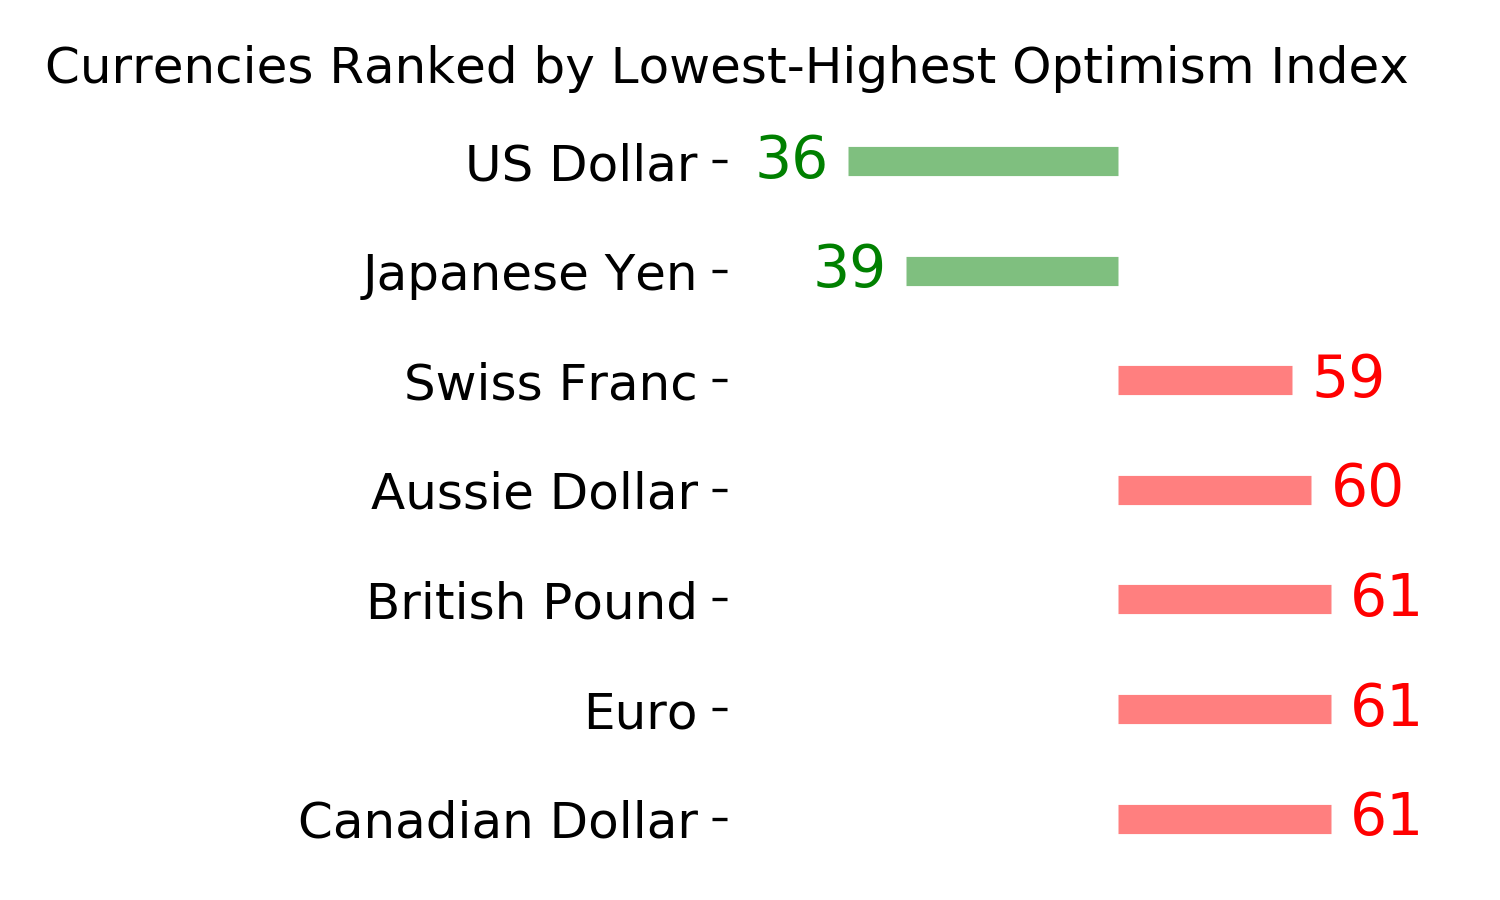
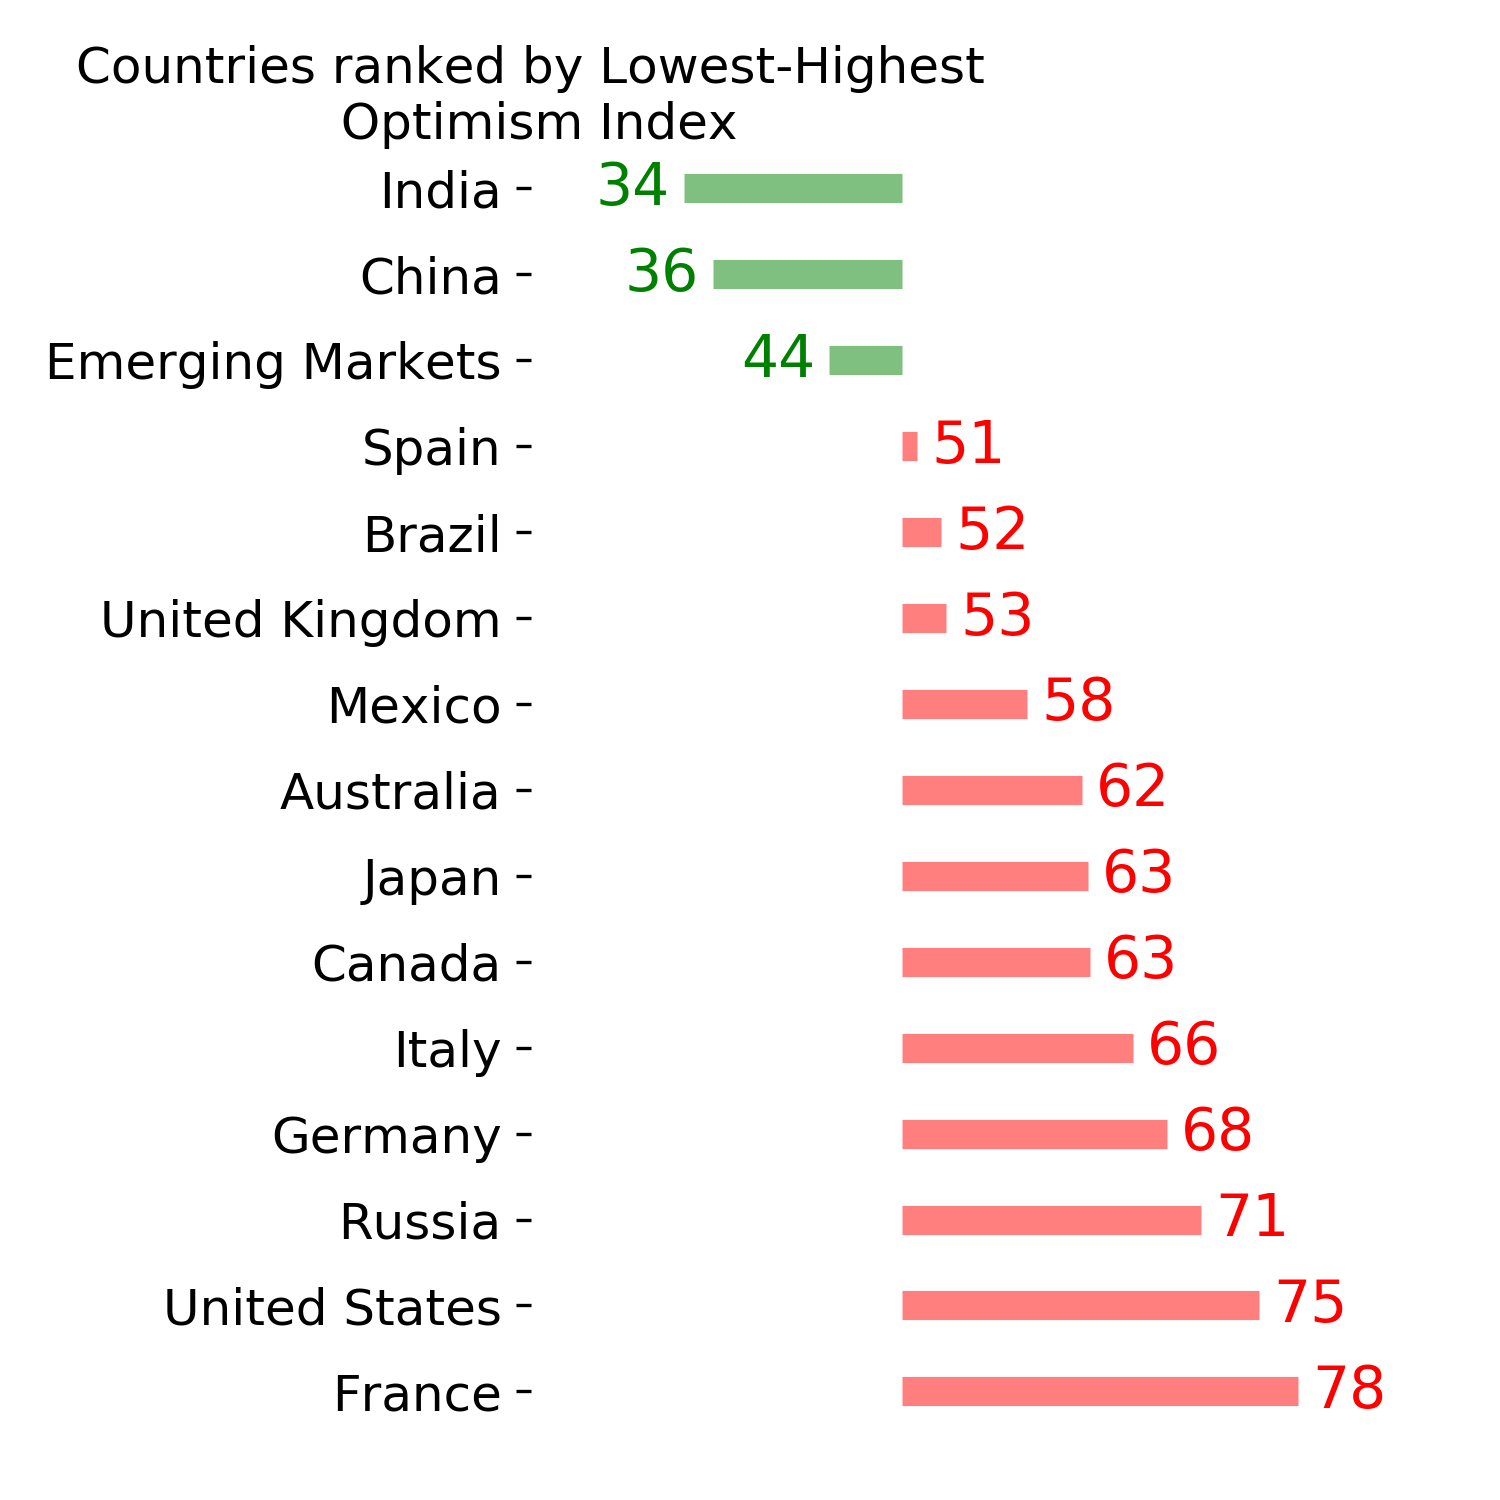
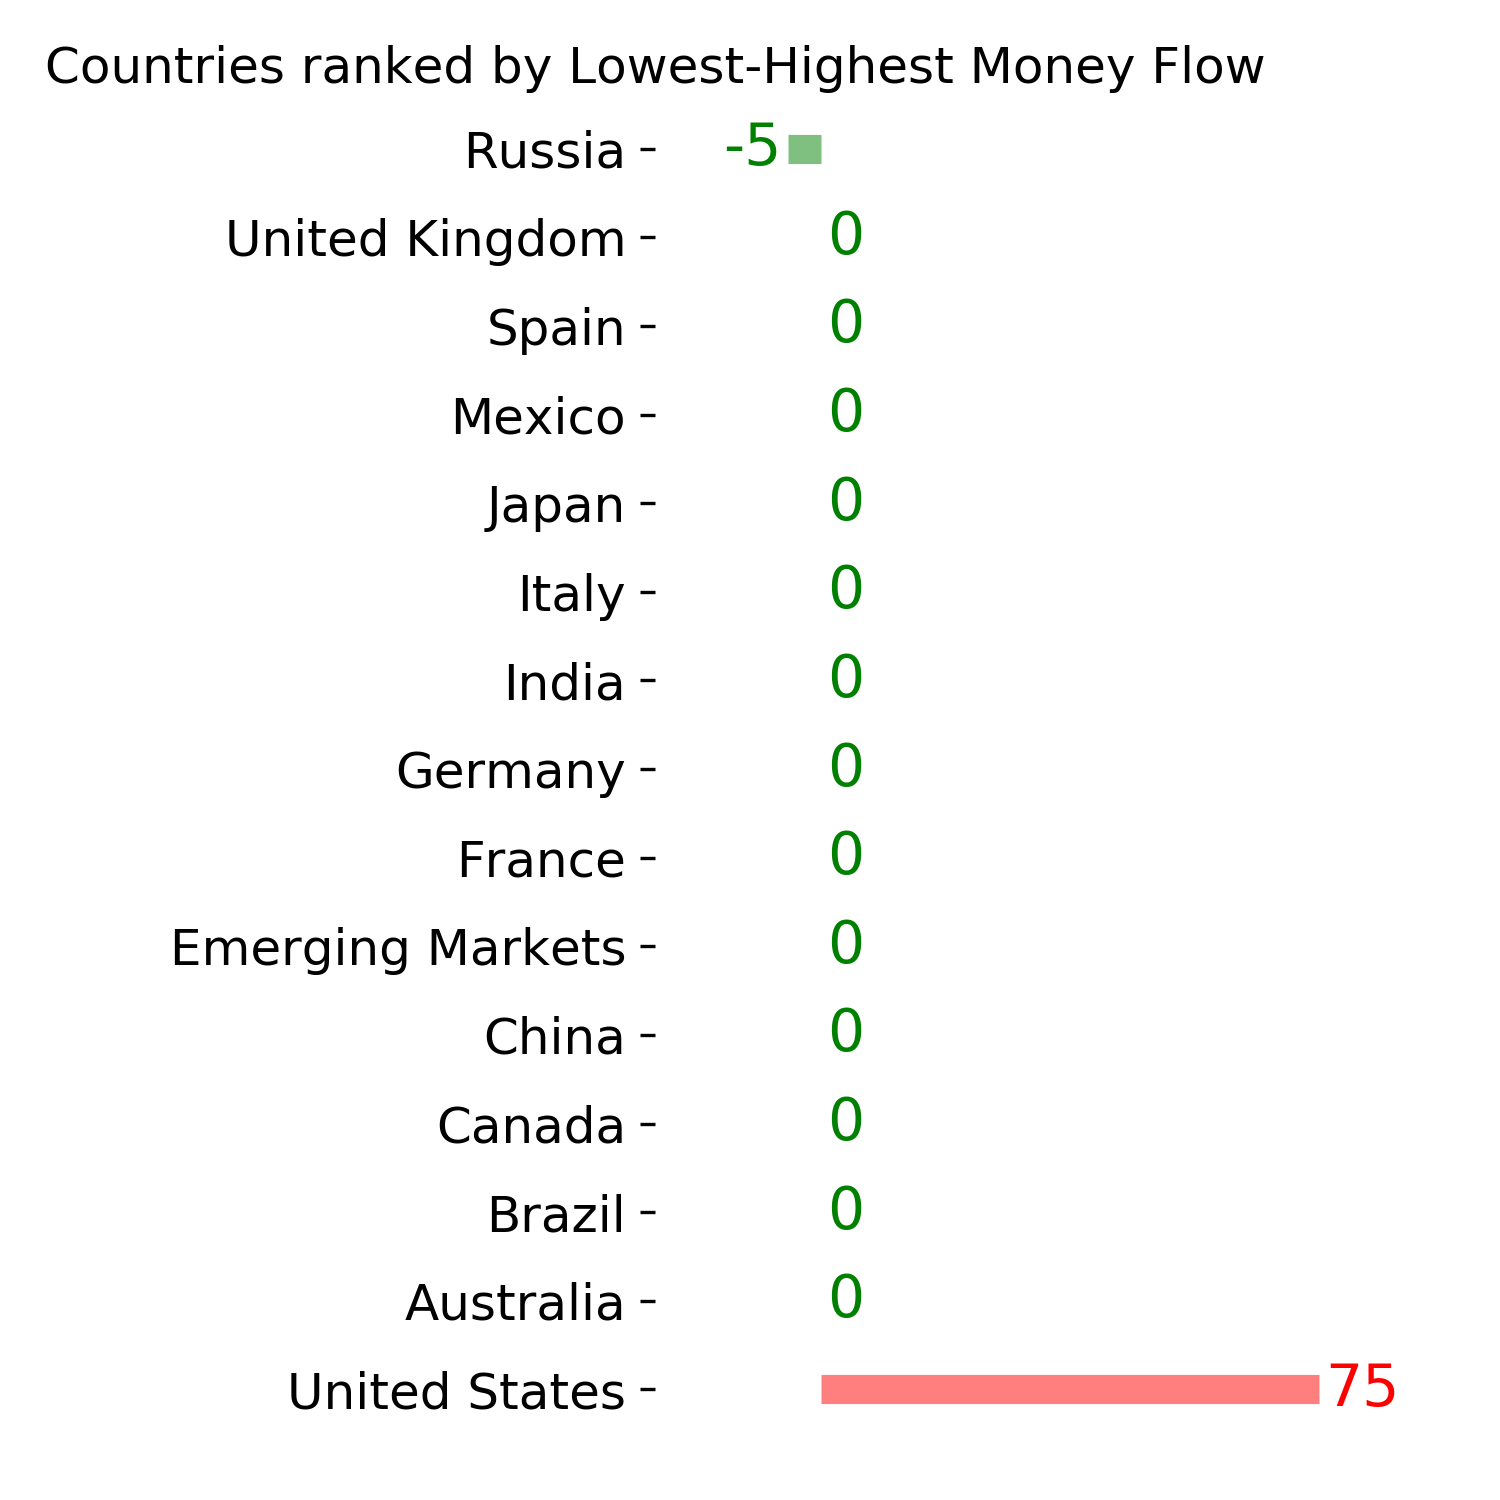
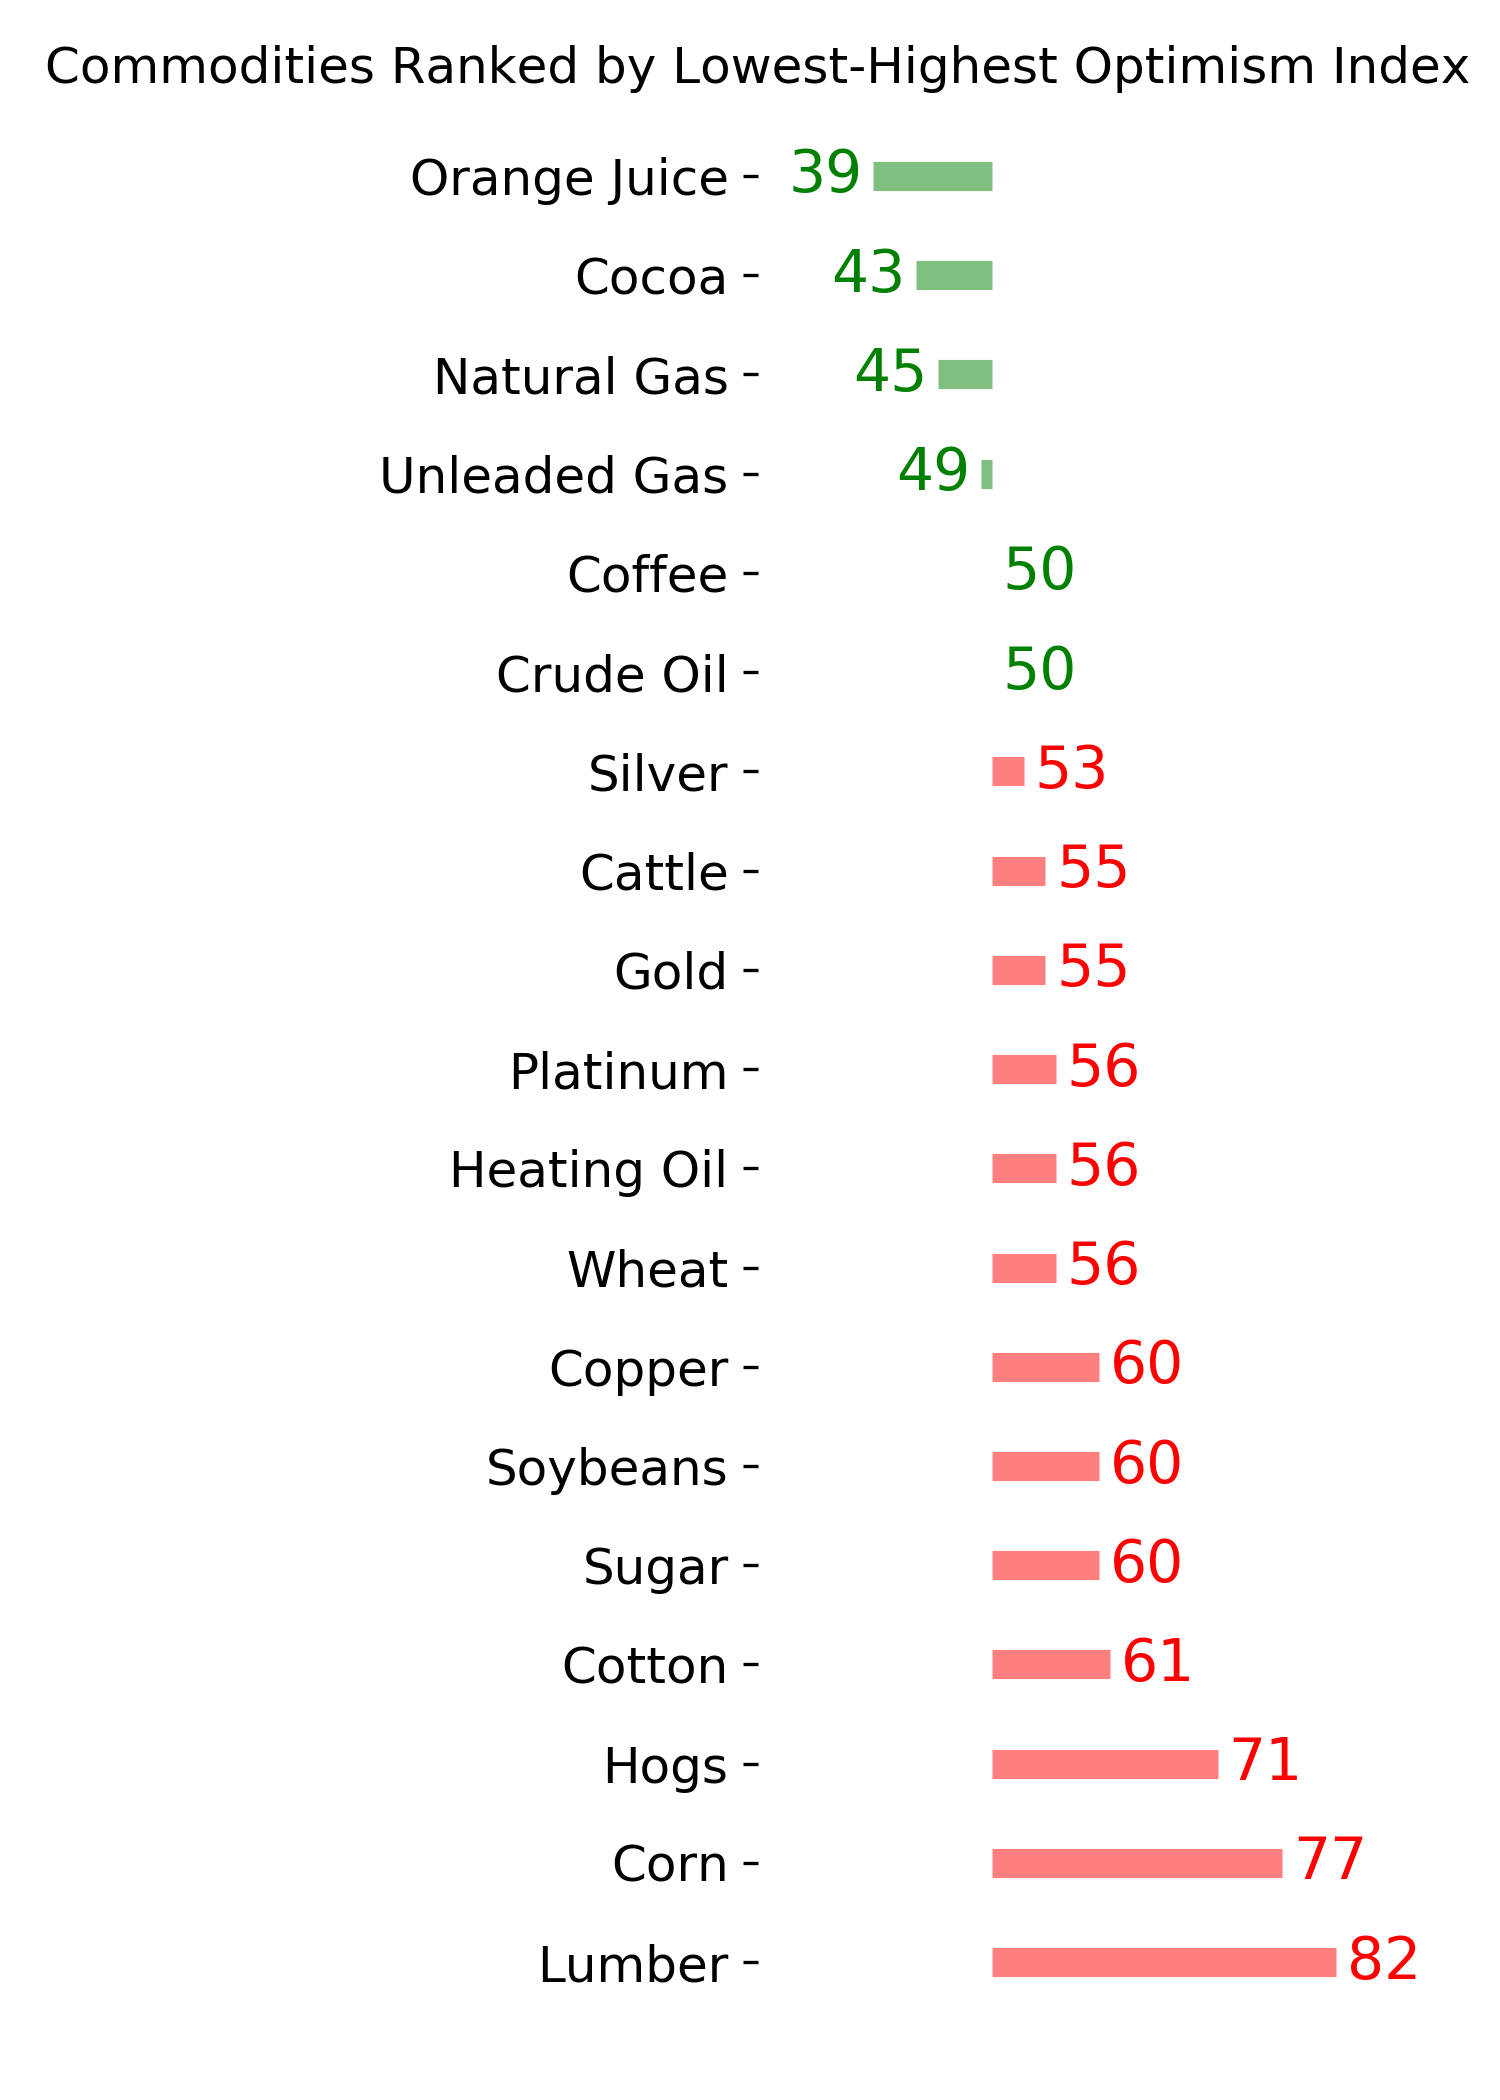
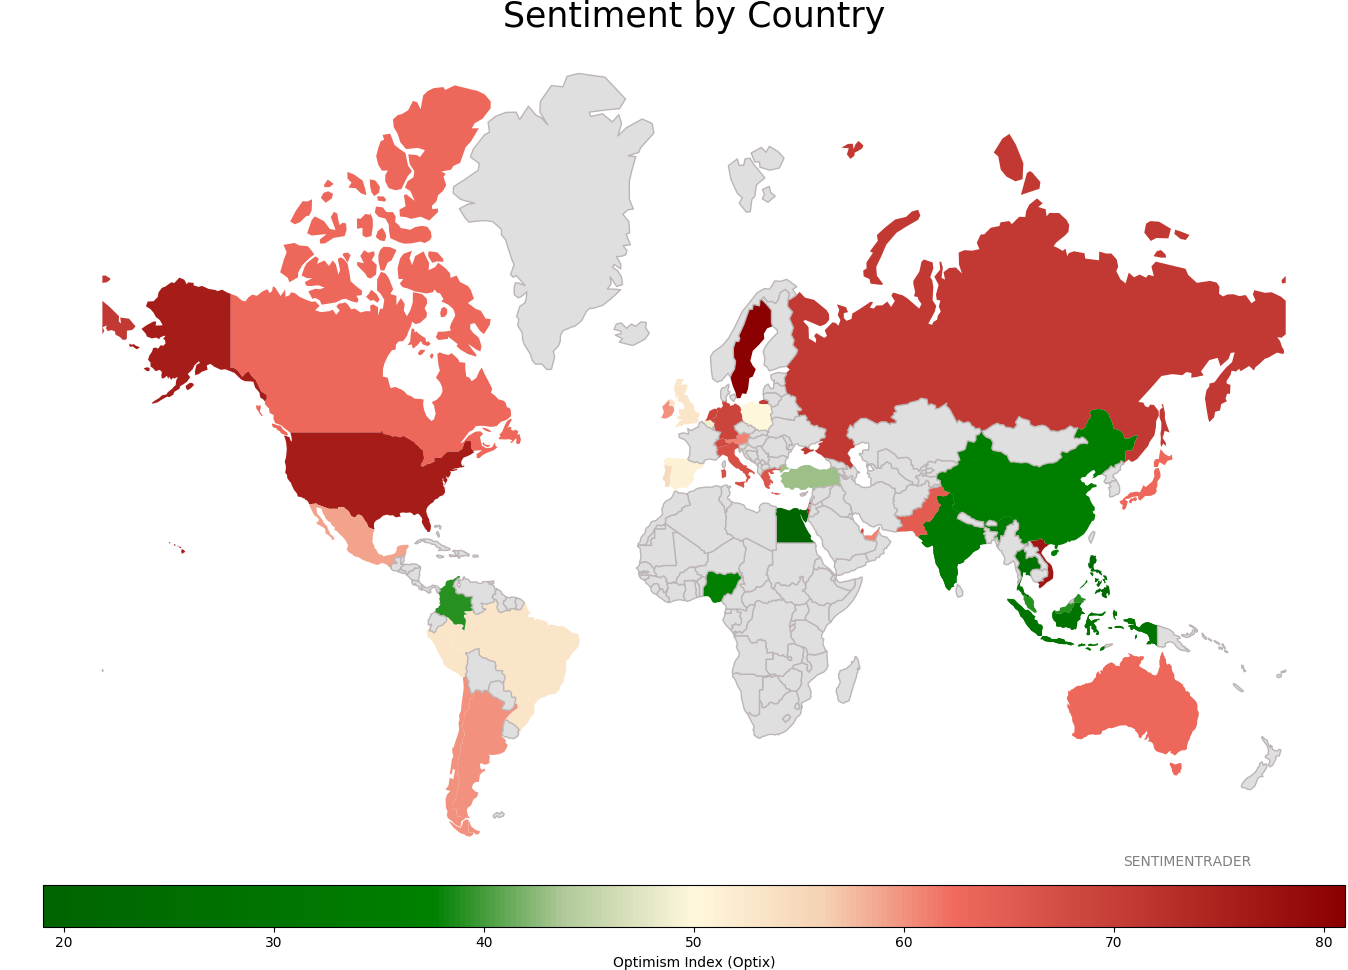
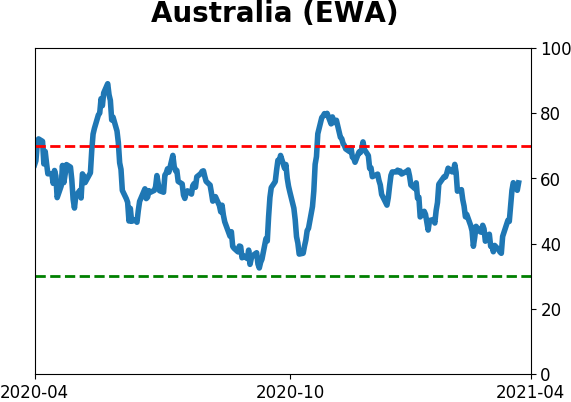
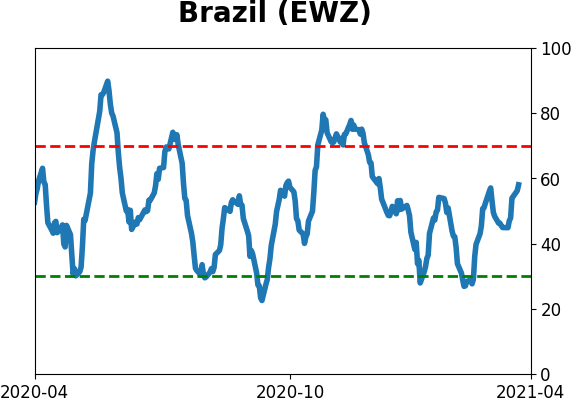
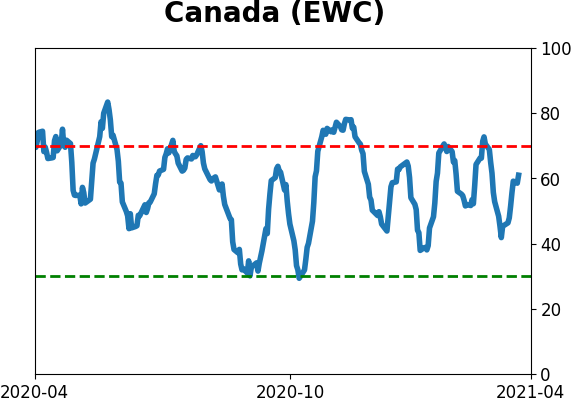
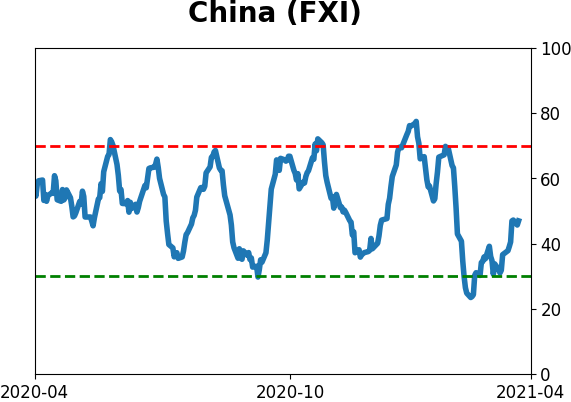
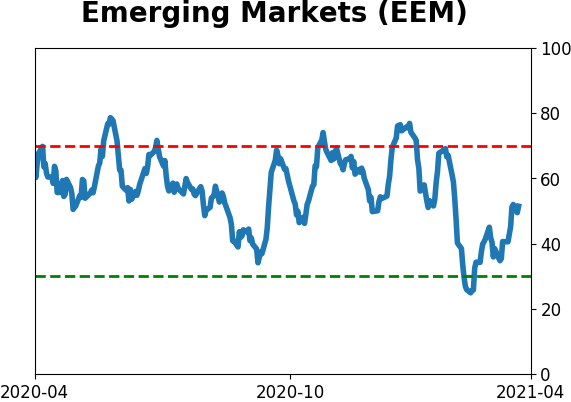
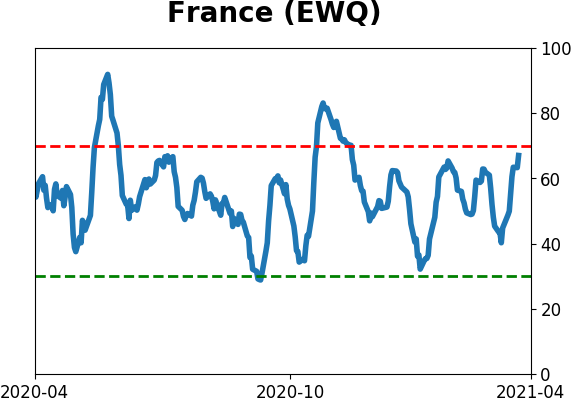
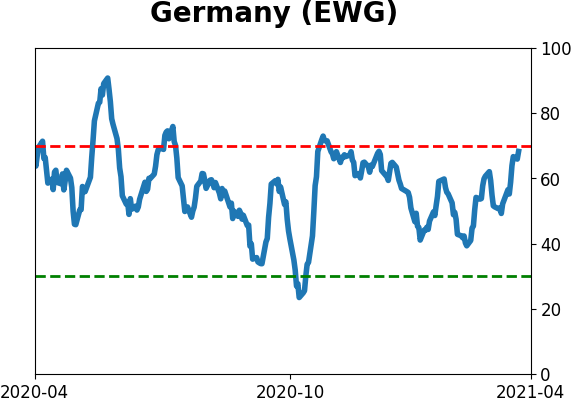
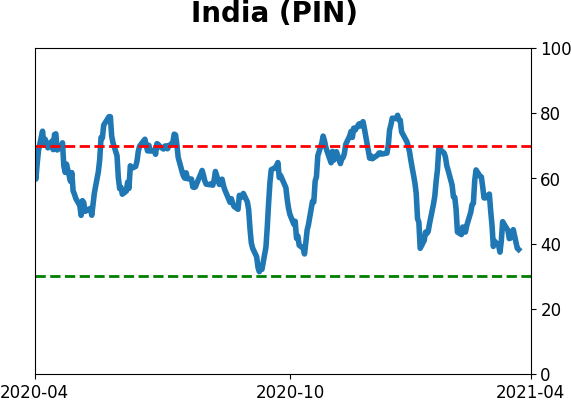
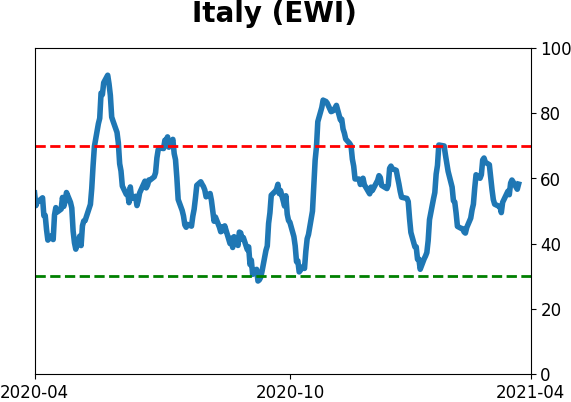
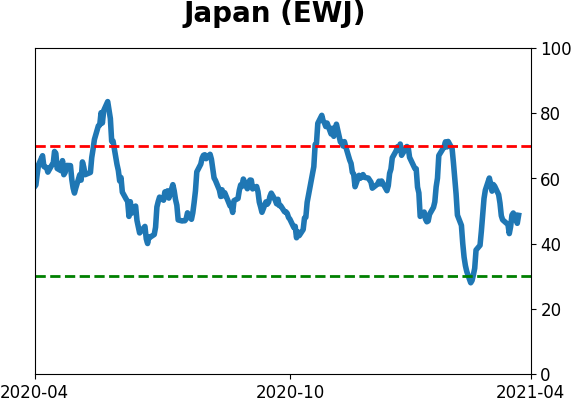
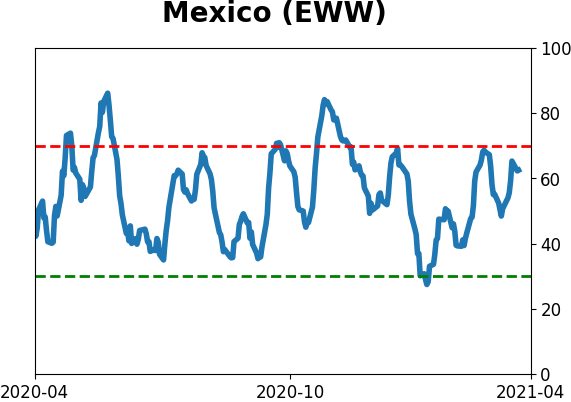
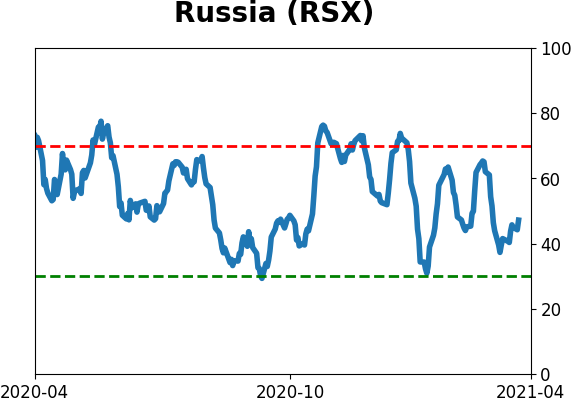
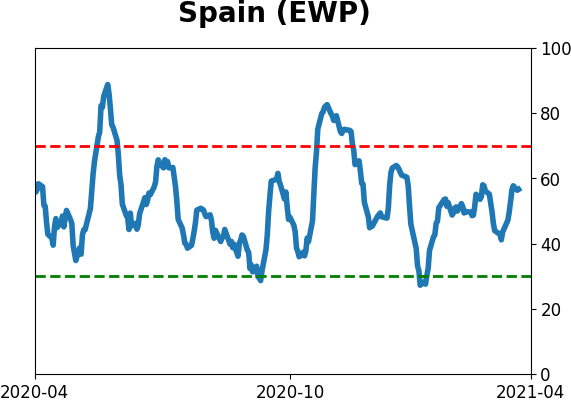
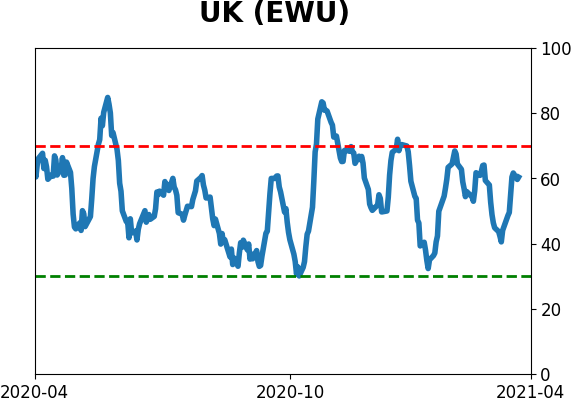
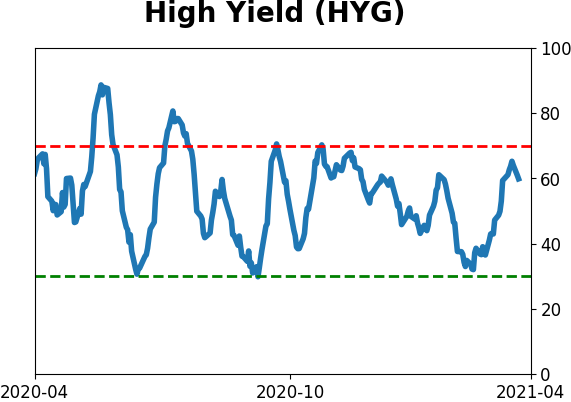
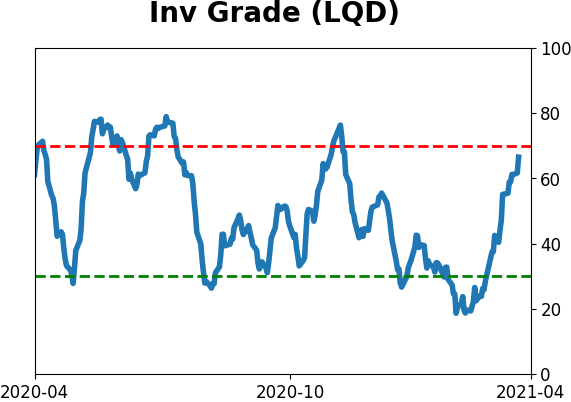
Sentiment Around The World
Optimism Index Thumbnails
|
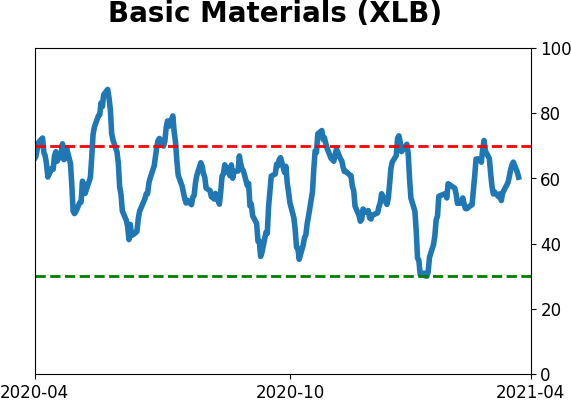
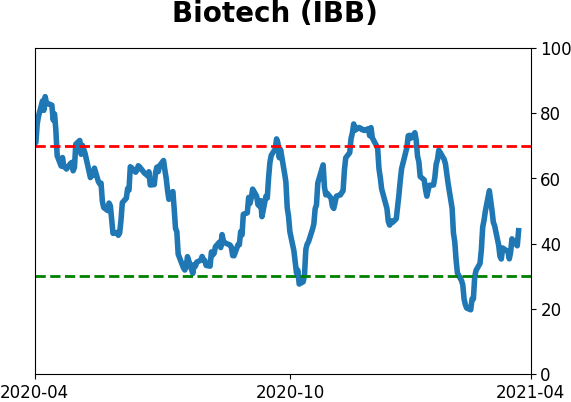
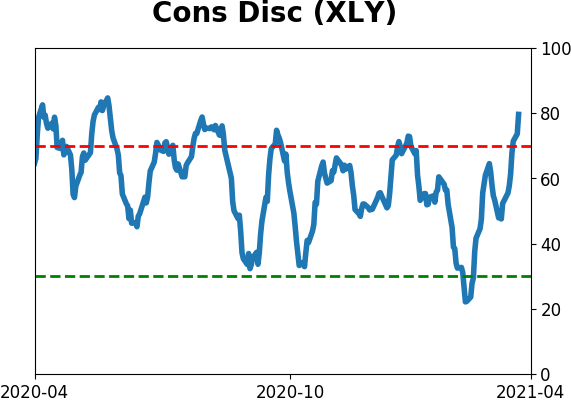
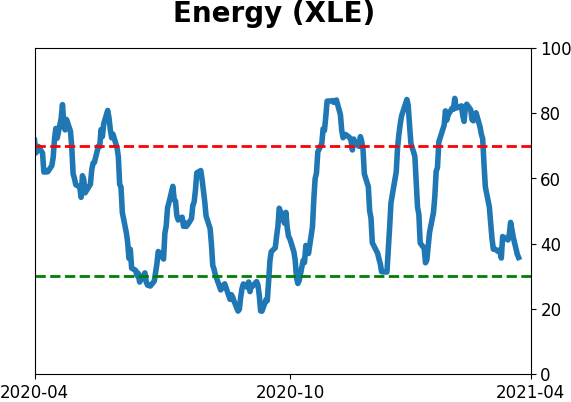
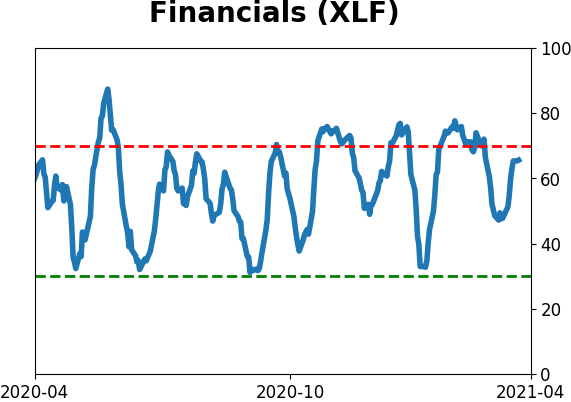
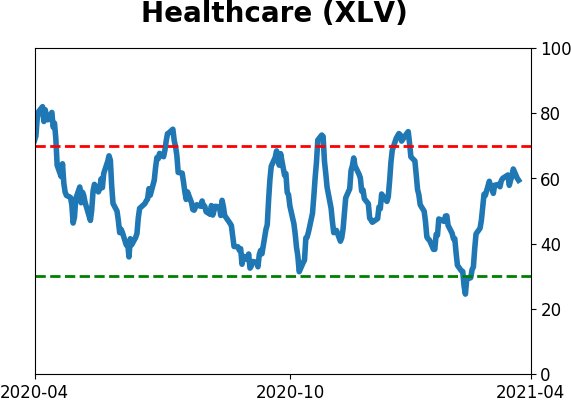
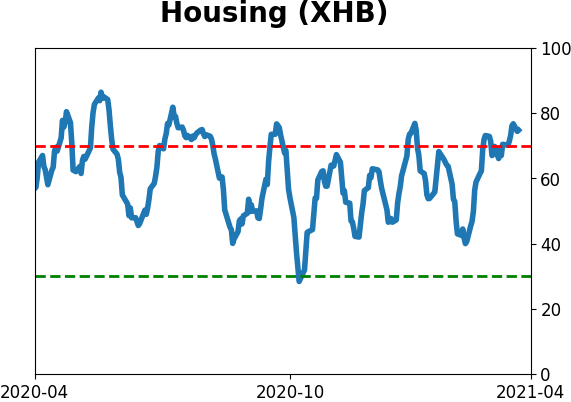
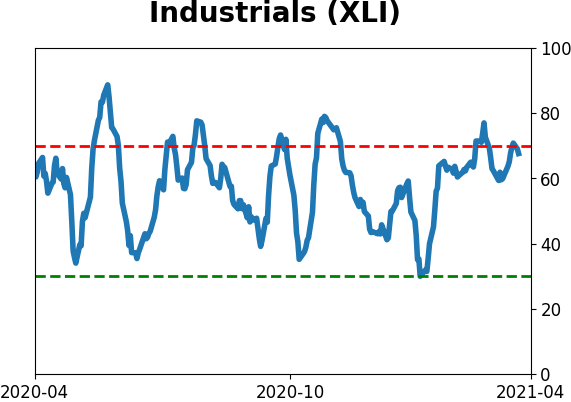
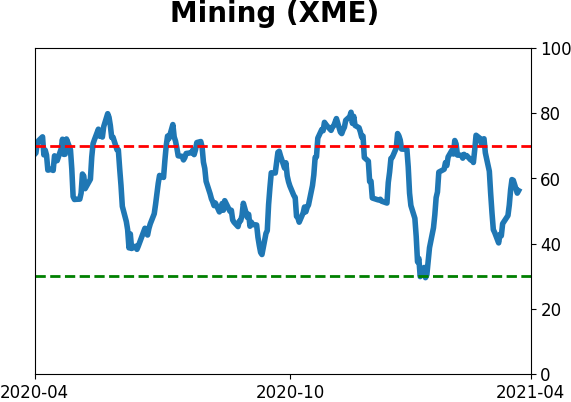
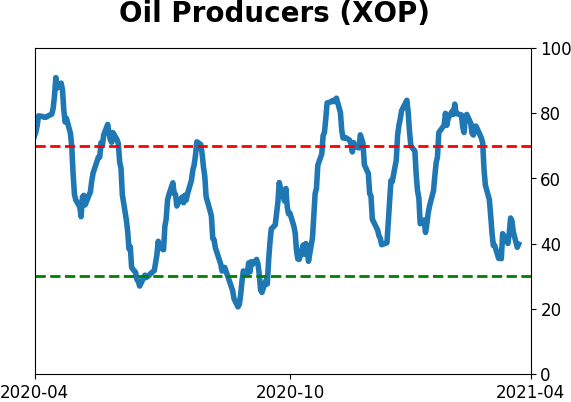
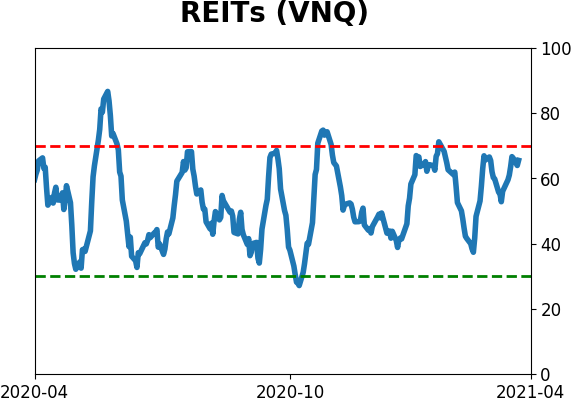
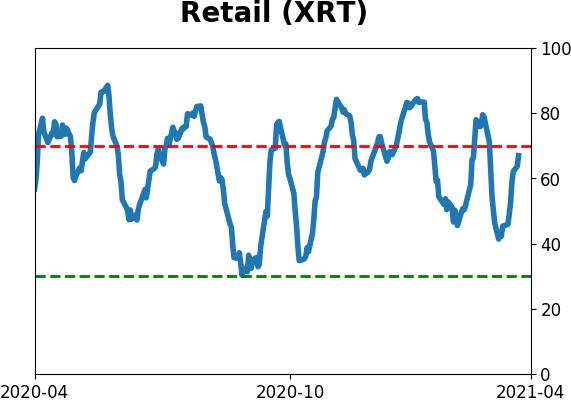
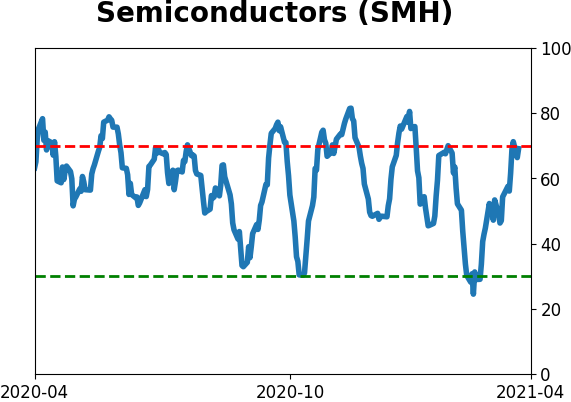
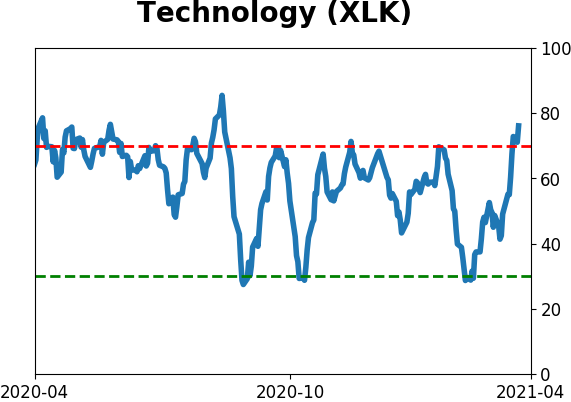
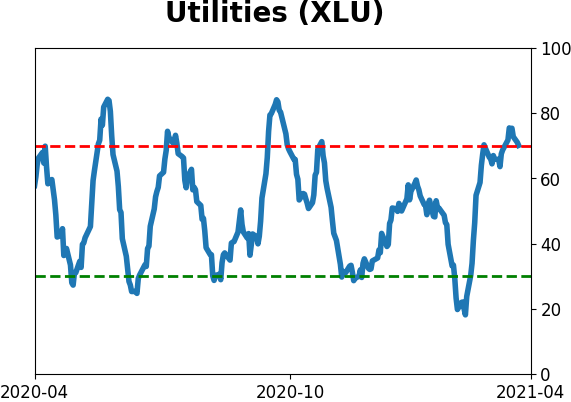
Sector ETF's - 10-Day Moving Average
|
|
|
Country ETF's - 10-Day Moving Average
|
|
|
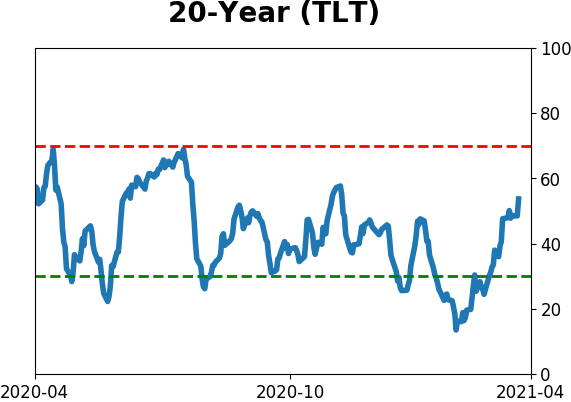
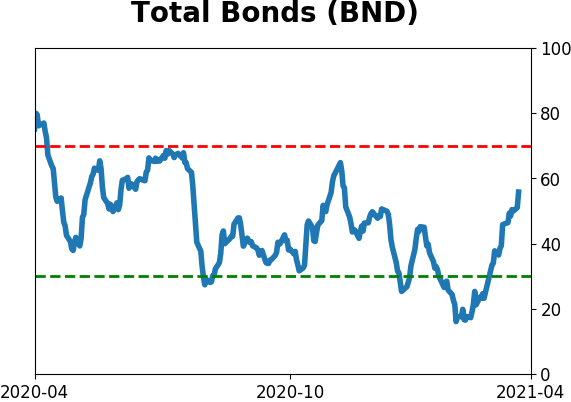
Bond ETF's - 10-Day Moving Average
|
|
|
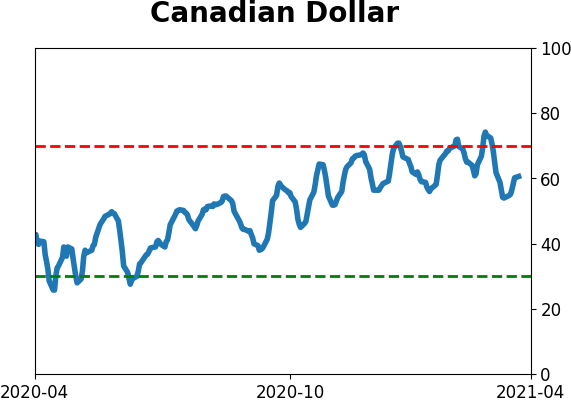
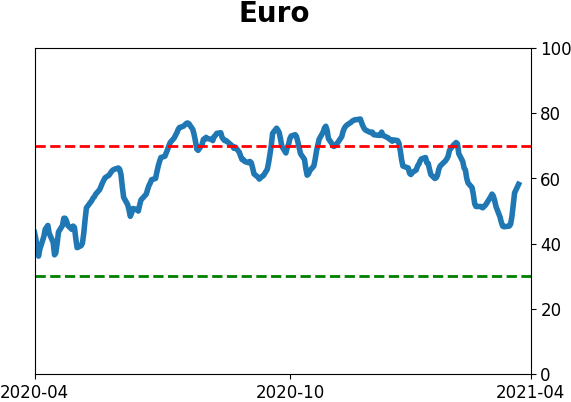
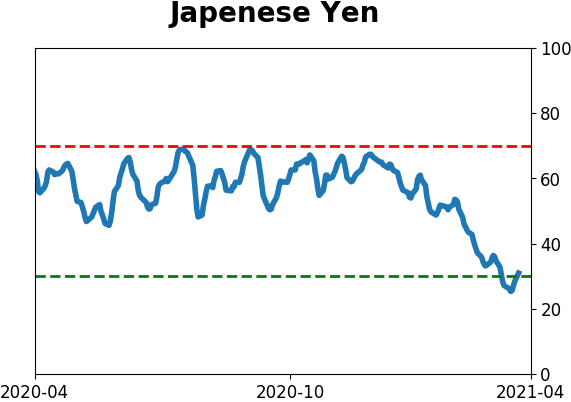
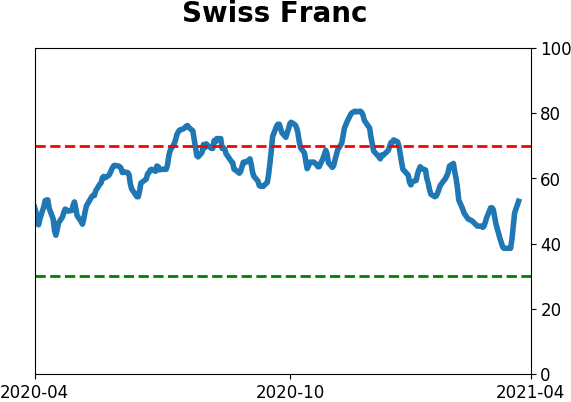
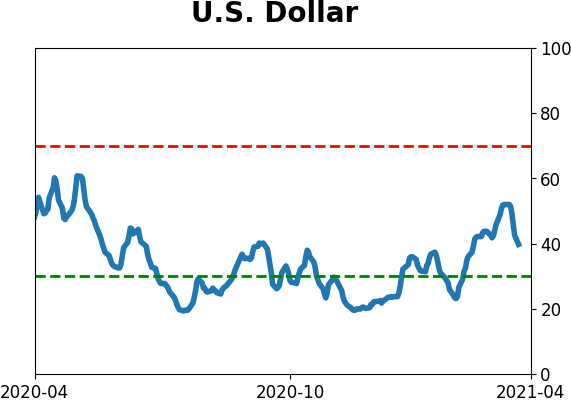
Currency ETF's - 5-Day Moving Average
|
|
|
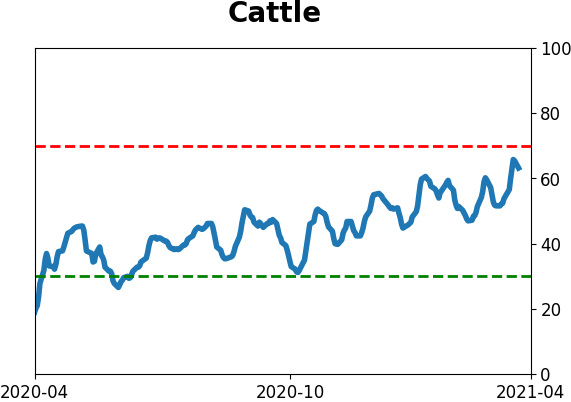
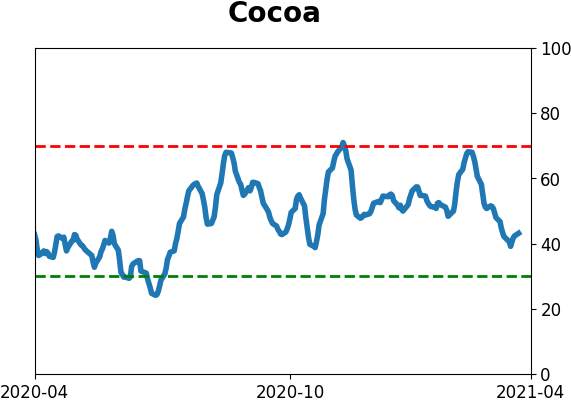
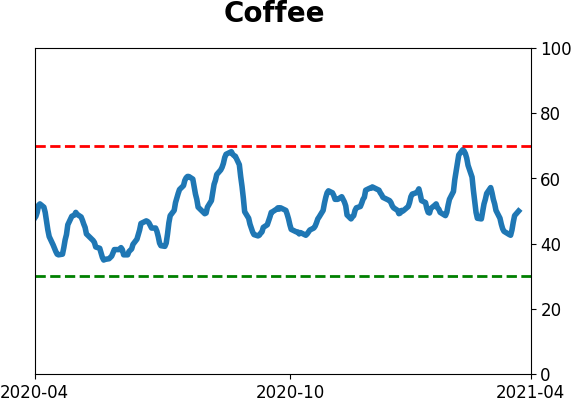
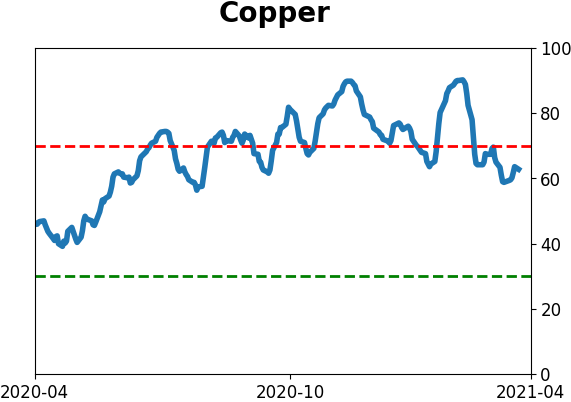
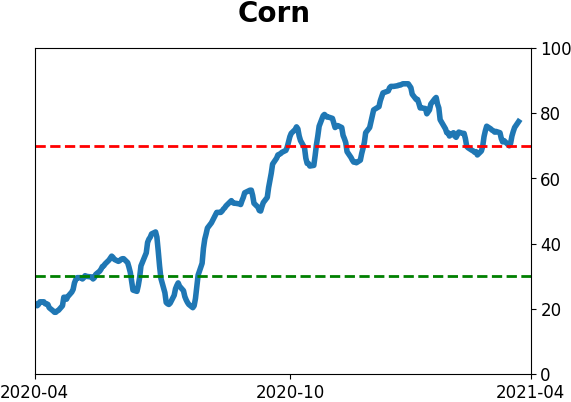
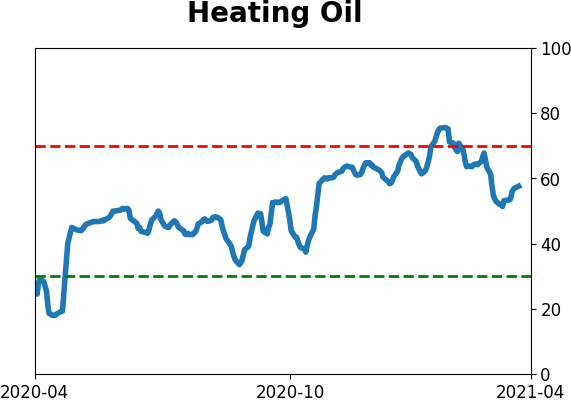
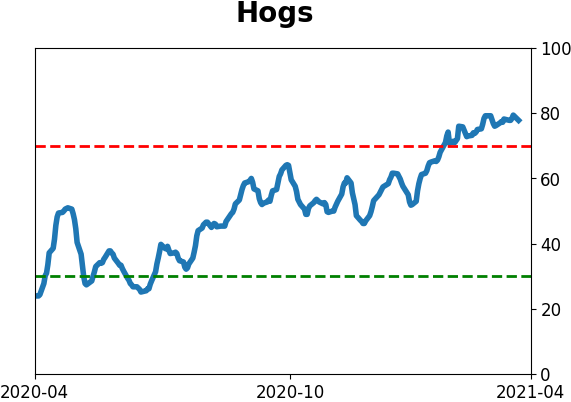
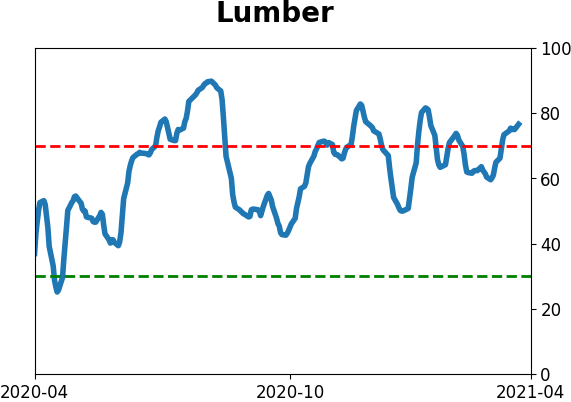
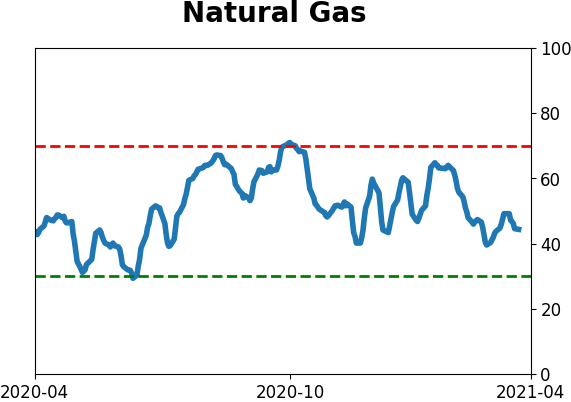
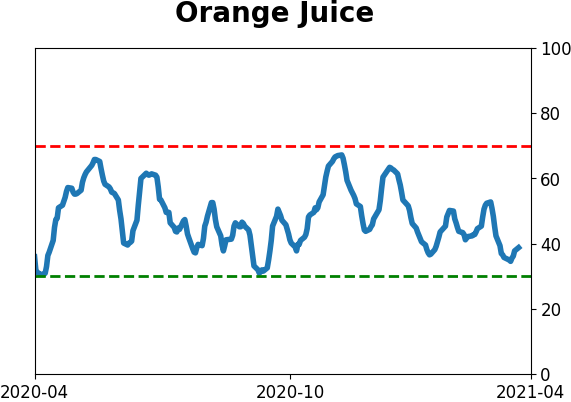
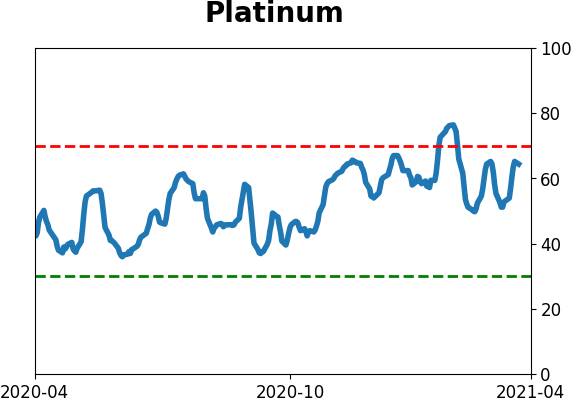
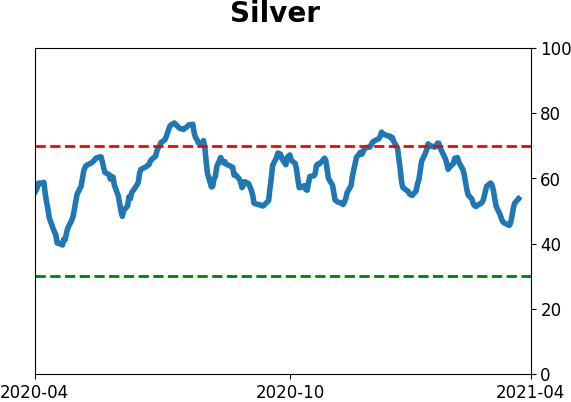
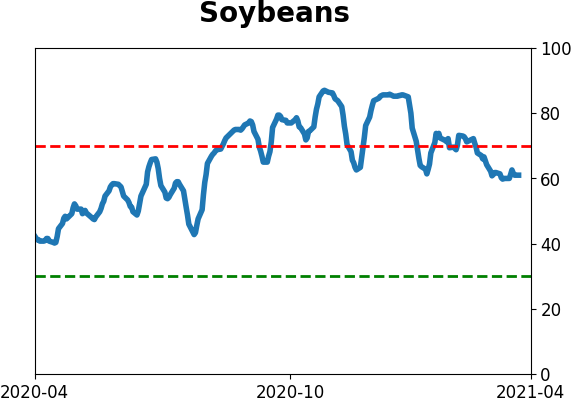
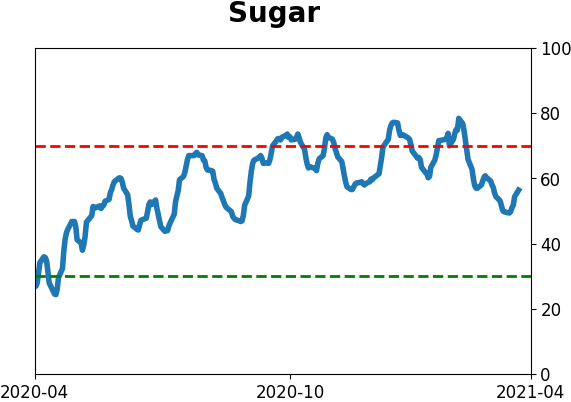
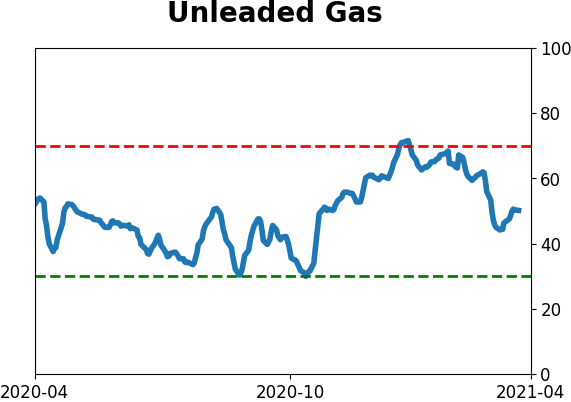
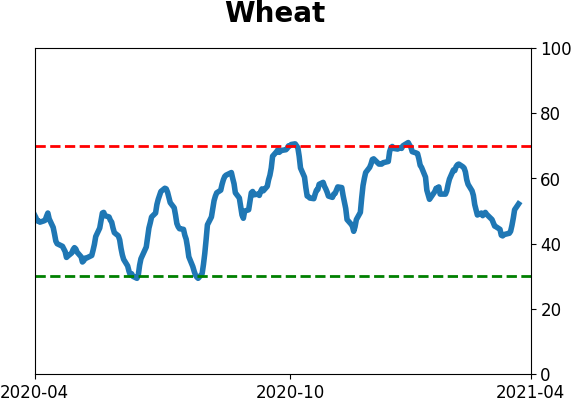
Commodity ETF's - 5-Day Moving Average
|
|