Headlines
|
|
Initial surge shouldn't give much back:
Stocks have enjoyed a massive surge in buying pressure, with breadth thrusts and a large retracement of the March decline. Other times it did this, stocks rallied long-term. We take a closer look at the historical signals to see how much of the initial surge was given back before rallying again.
First earnings season after the start of a recession, bear market:
We're heading into the first earnings season following the onset of a bear market and likely recession. But stocks have already sold off massively during the earnings off-season, and investors have already priced in some of the worst-case scenarios.
Call buying: There was a curious jump in call buying on the ISE exchange on Monday, with 300 call equity call options bought to open for every 100 puts. That's among the most in 14 years. The Backtest Engine shows that while this should be a negative sign of excessive speculation, only 2 of the 10 dates led to negative returns over the next month. The ROBO Put/Call Ratio that focuses on small traders remains stubbornly high, however, as that group continues to spend a record amount of their volume on protective put options.
NDX up, SPX down: Big tech stocks helped drive the Nasdaq 100 (NDX) to more than a 1% gain on Monday, while the S&P 500 (SPX) fell more than 1%. This has never happened before. There were 6 times when NDX gained 0.75% while SPX lost at least that much. All but one of them saw stocks drop over the next 1-2 weeks, but all of them showed a gain either 2 or 3 months later, for what it's worth. The dates were 1996-12-11, 1999-01-11, 2000-01-03, 2000-04-28, 2000-06-16, and 2001-10-18.
|
Smart / Dumb Money Confidence
|
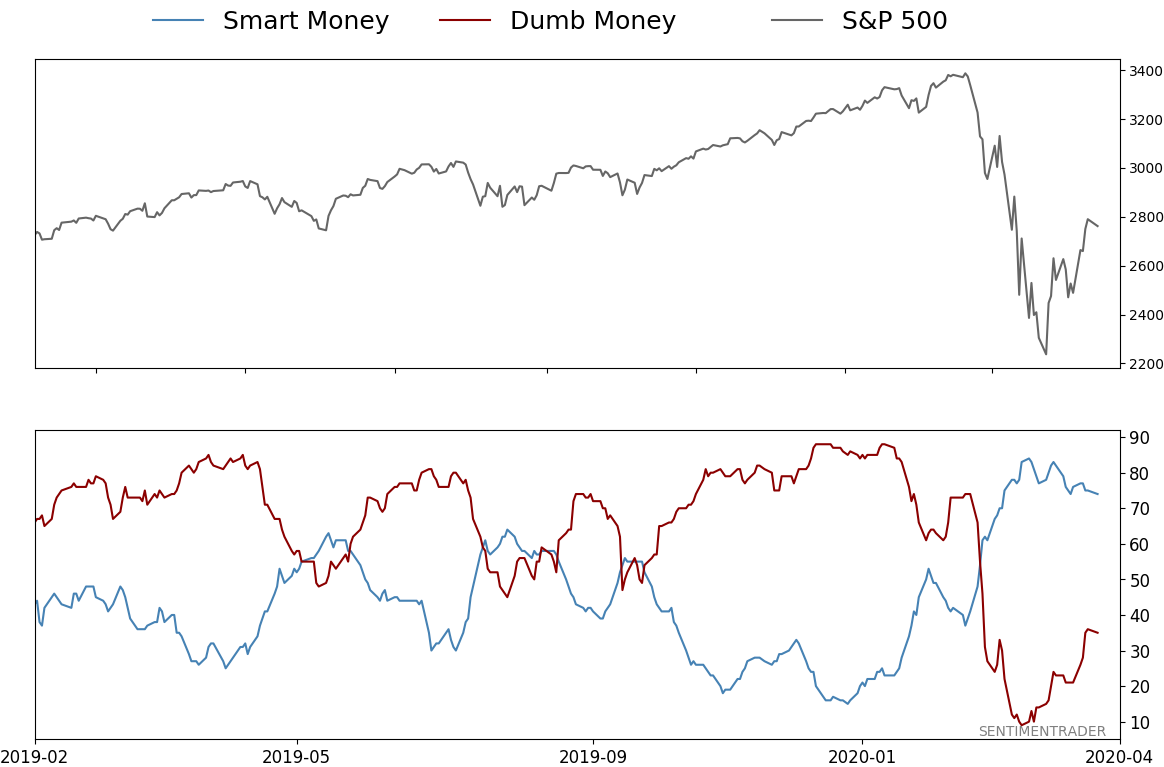
Smart Money Confidence: 74%
Dumb Money Confidence: 35%
|
|
Risk Levels
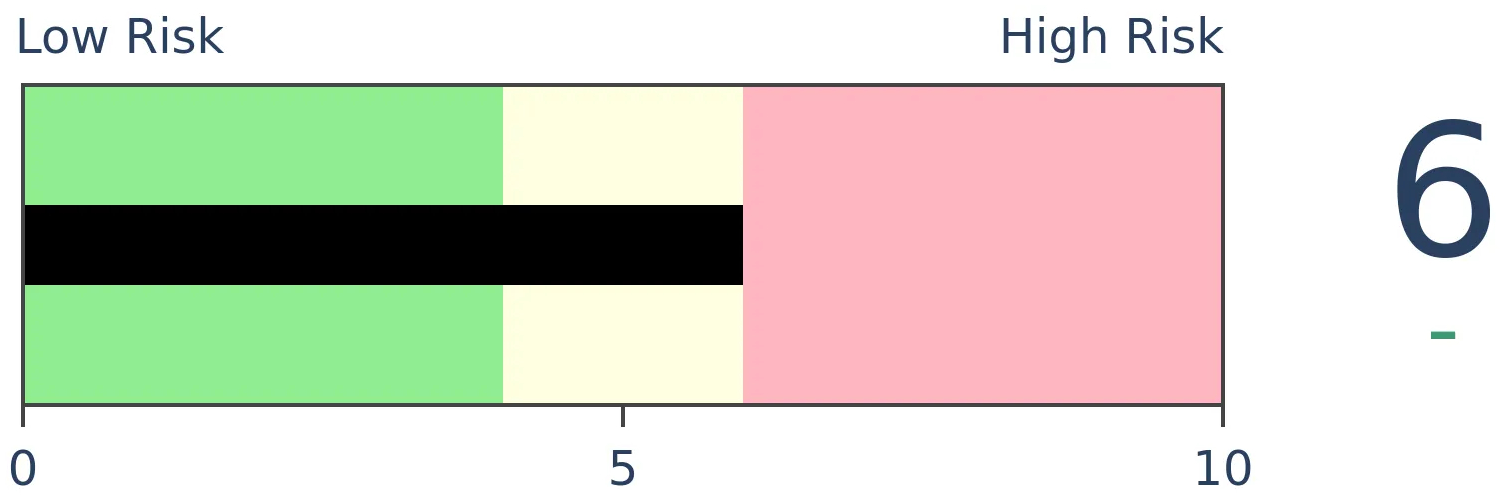
Stocks Short-Term
|
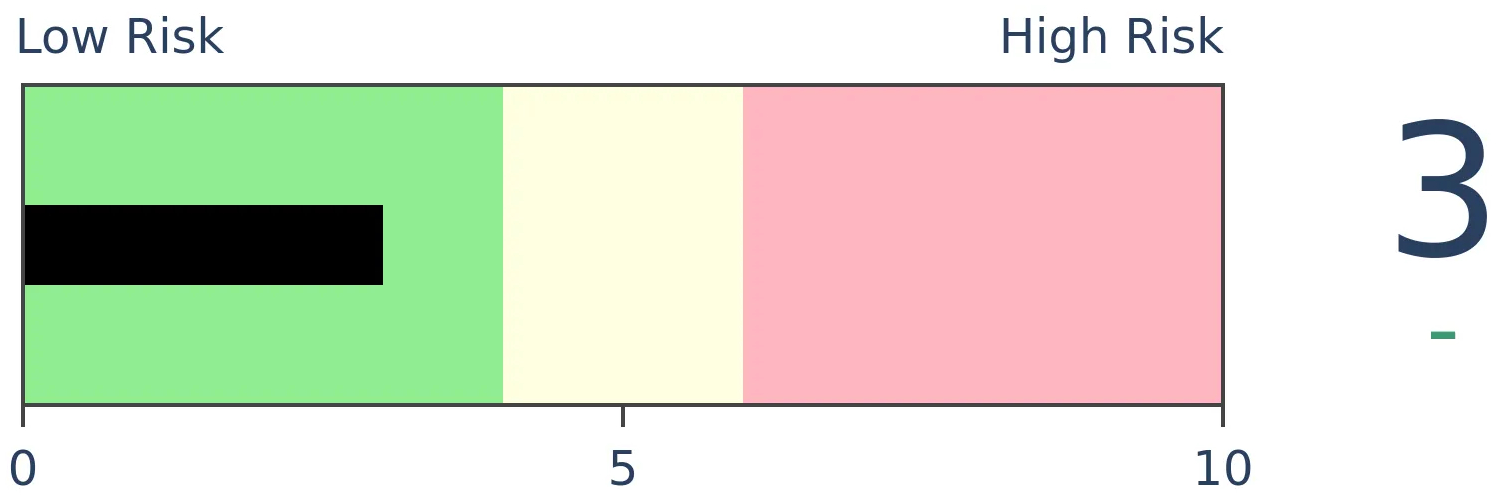
Stocks Medium-Term

|
|
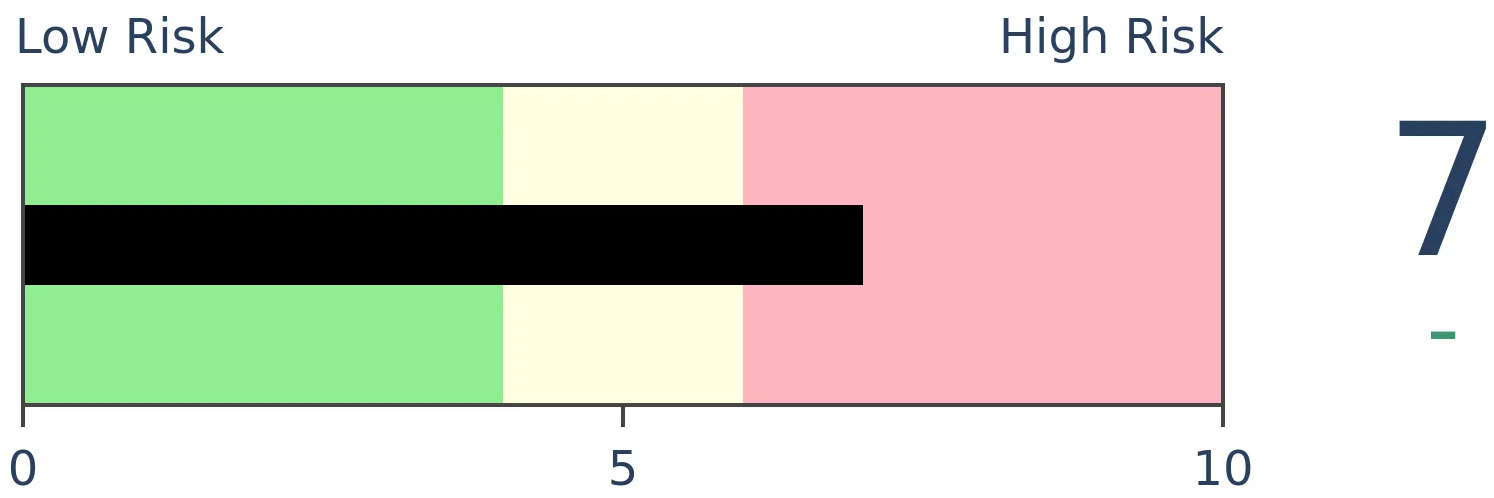
Bonds
|
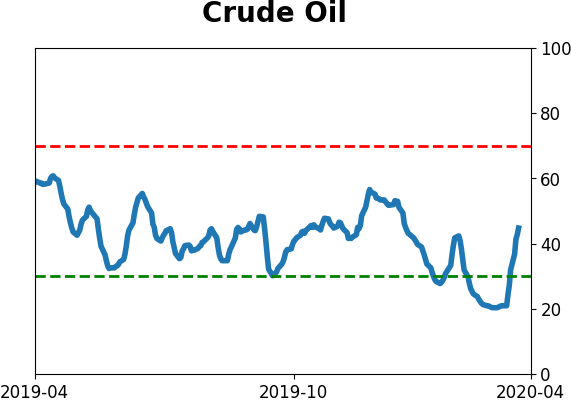
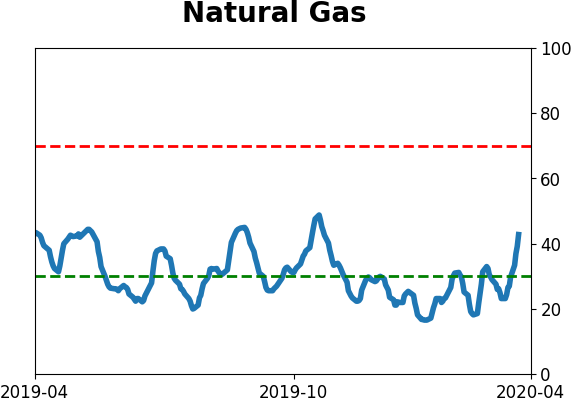
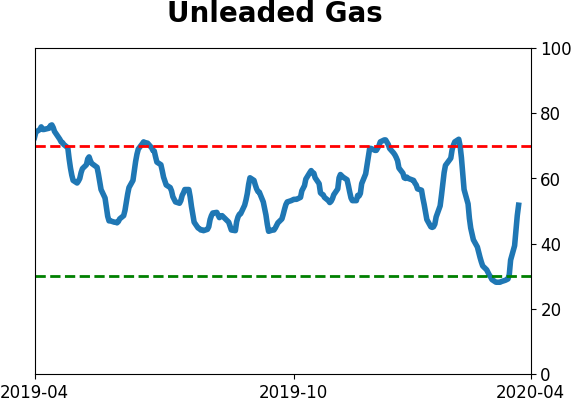
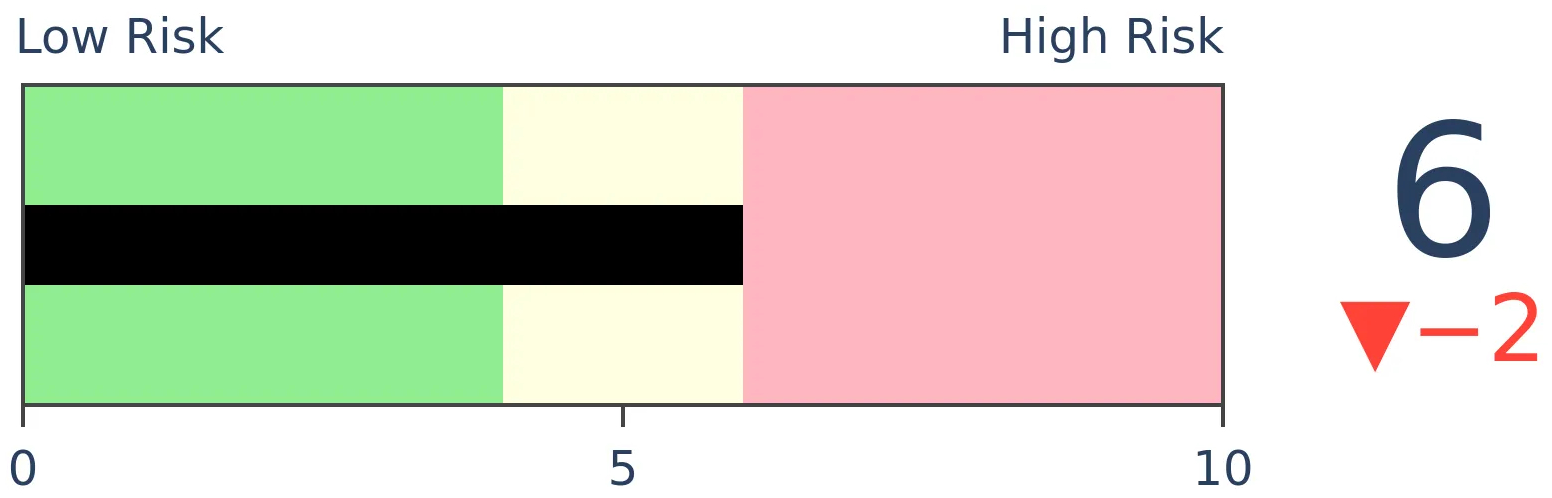
Crude Oil
|
|
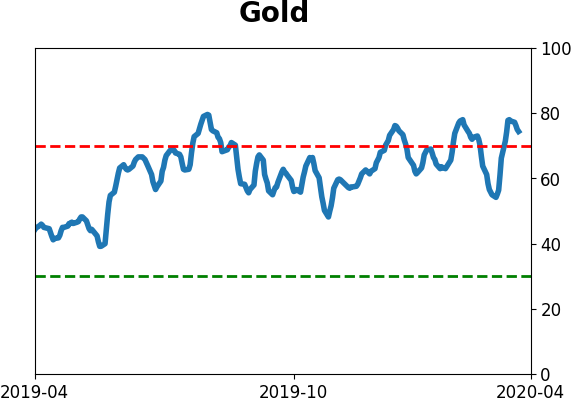
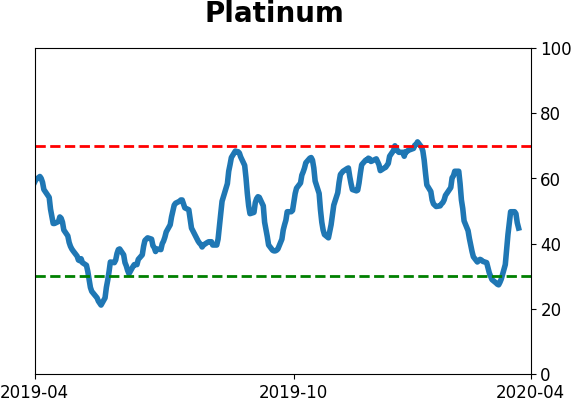
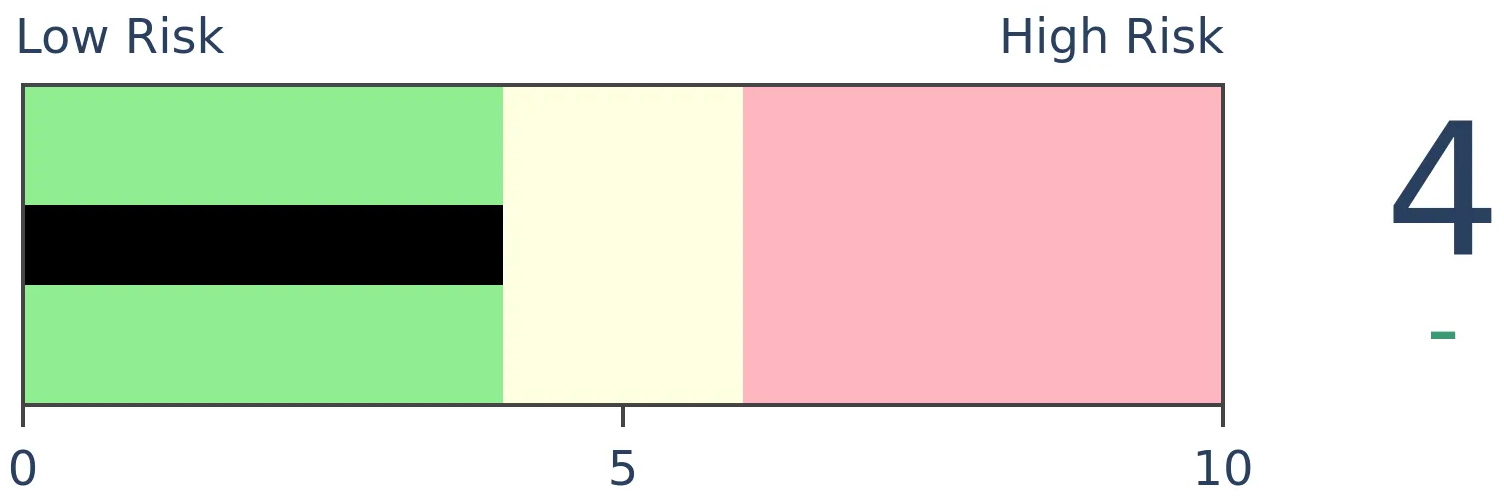
Gold
|
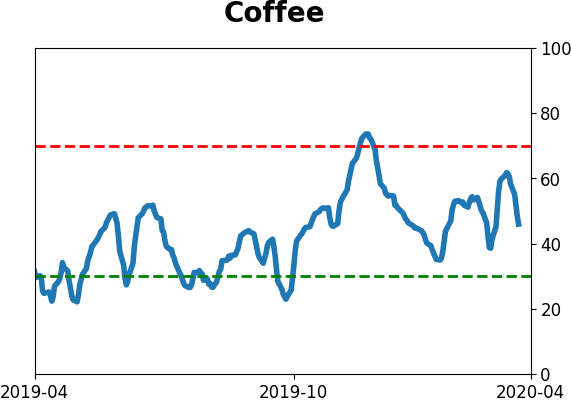
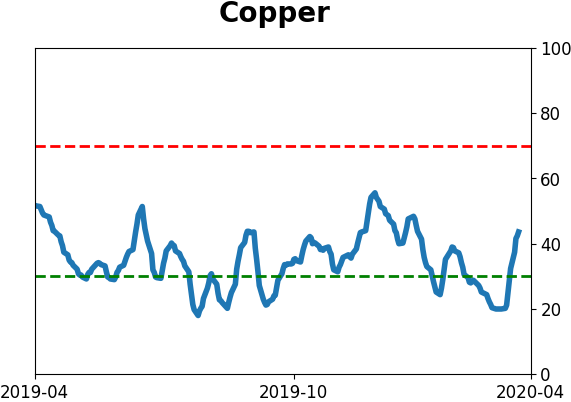
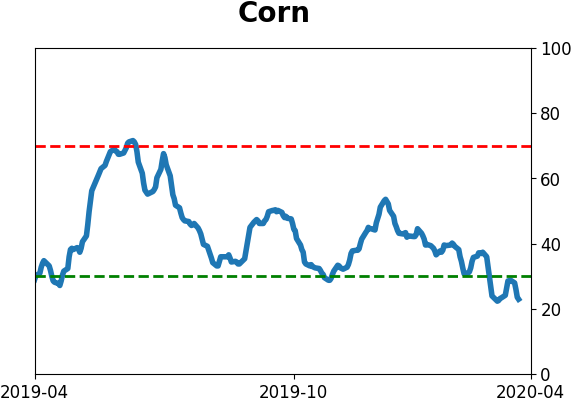
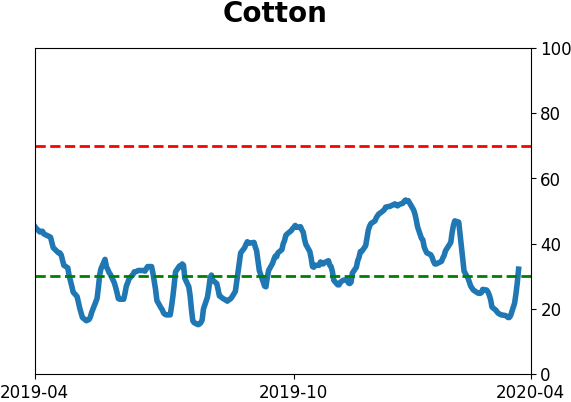
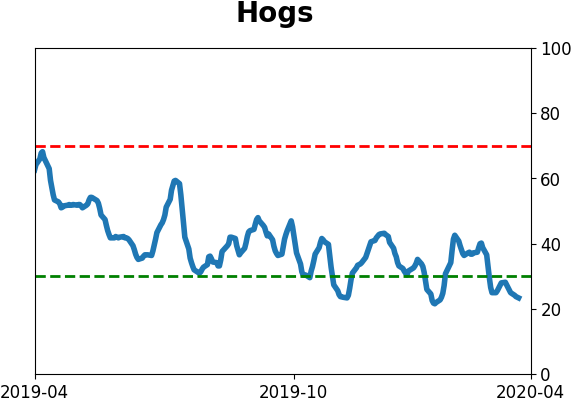
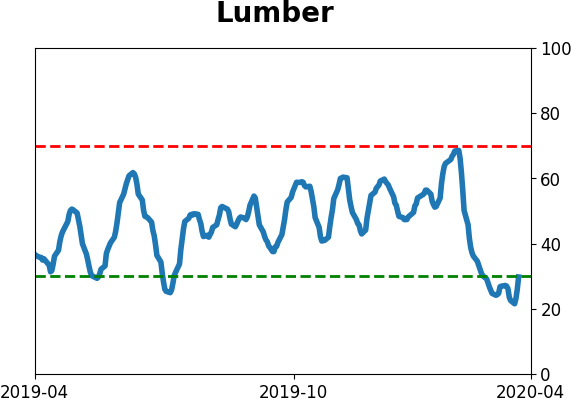
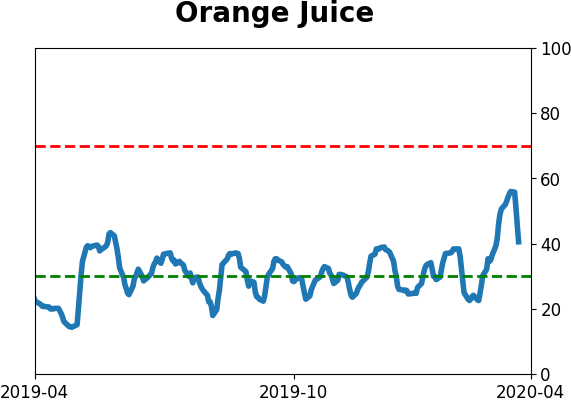
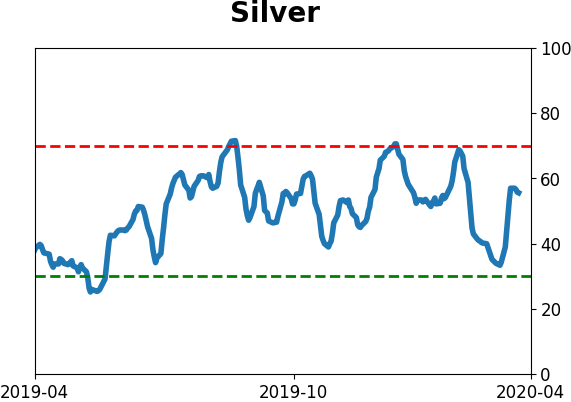
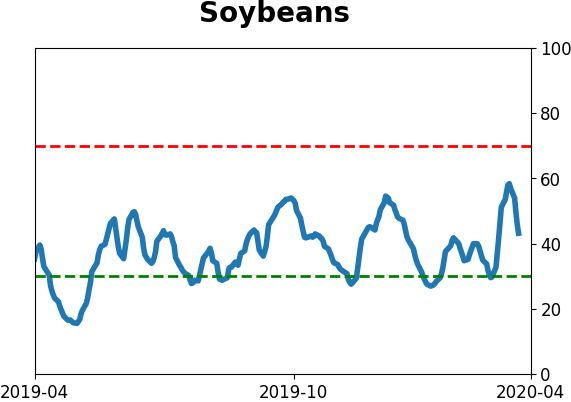
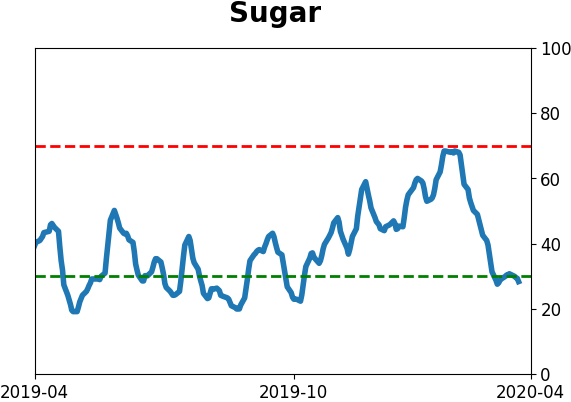
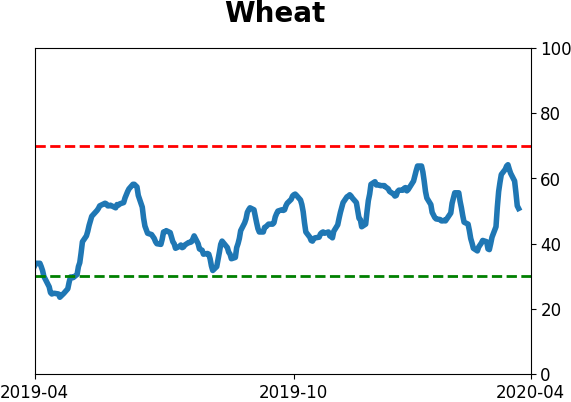
Agriculture
|
|
Research
BOTTOM LINE
Stocks have enjoyed a massive surge in buying pressure, with breadth thrusts and a large retracement of the March decline. Other times it did this, stocks rallied long-term. We take a closer look at the historical signals to see how much of the initial surge was given back before rallying again.
FORECAST / TIMEFRAME
None
|
The two primary reasons to be optimistic about the past couple of weeks are that we've had a historic surge of buying pressure (here and here) and the major indexes have retraced a substantial portion of the February-March decline. When either of those conditions triggered, it was rare to see much, if any, loss going forward, especially over the next 6-12 months.
Let's go over each of them and see if there is any pattern to how stocks reacted after the breadth and/or retracement signal. According to the textbooks, we shouldn't see much of the initial thrust given back, and volatility should calm down almost immediately.
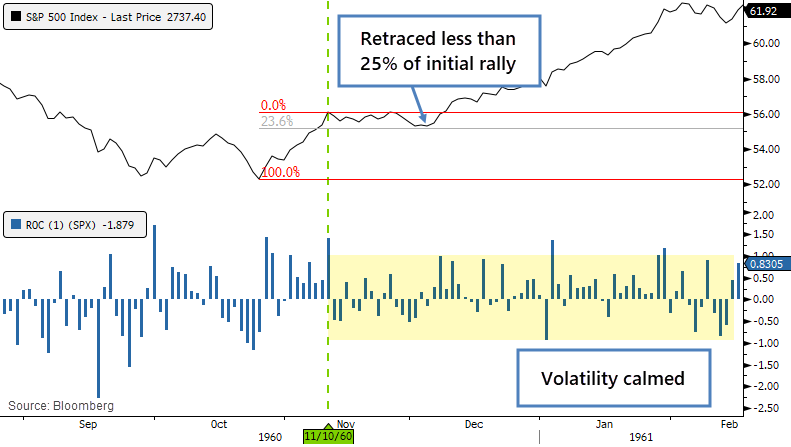
The 1960 thrust was a perfect example. After the initial surge, the S&P 500 gave back less than a quarter of its gains, and its daily swings immediately calmed down. Can't ask for any better than that.
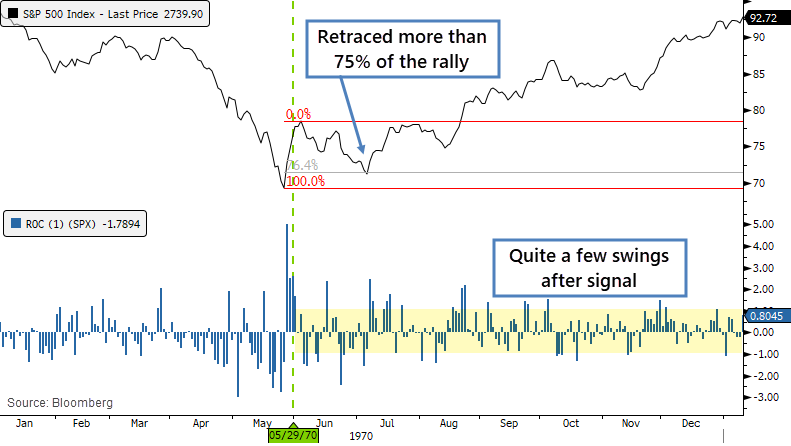
In 1970, it didn't behave so well. The S&P gave back more than 3/4 of the initial surge, but at least it didn't set a lower low. Volatility remained quite high, with a number of +/- 1% daily swings in the months ahead.
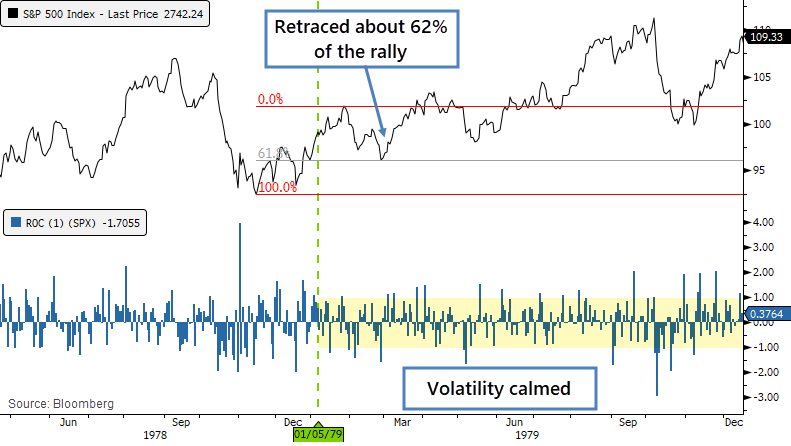
In 1979, the S&P retraced about 62% of the initial rally, and volatility calmed down quite a bit after the signal.
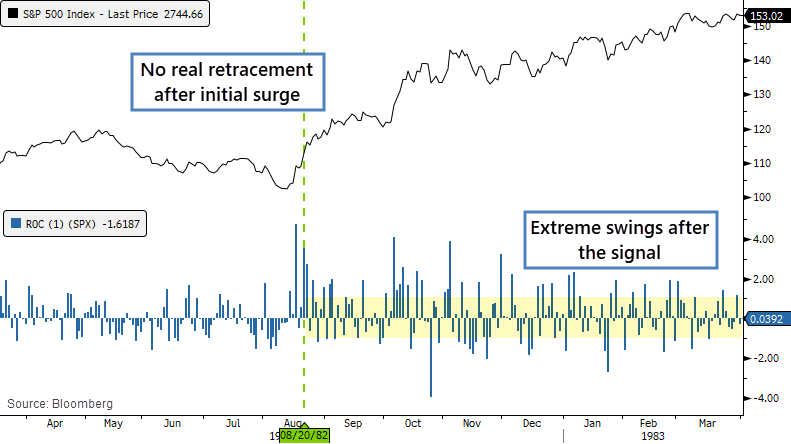
The bottom in 1982 is one of the few major bottoms (really the only one) when volume increased as stocks rallied. There was essentially no retracement after the initial kick-off surge, but volatility remained very high. This was an odd case, since not only volume increased, but volatility did, too, even as stocks rallied. It's extremely rare to see anything like this.
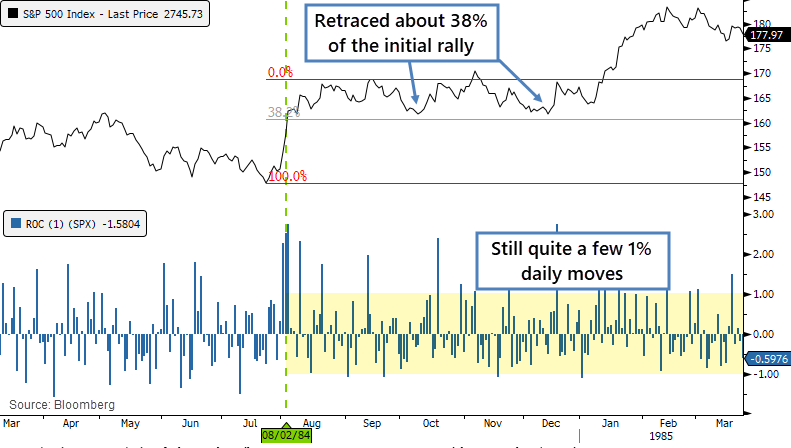
In 1984, stocks went into a holding pattern for almost 6 months after the initial thrust off the low. There wasn't much of a retracement of the initial gain, less than 38%, but volatility was still quite high for a market that was recovering.
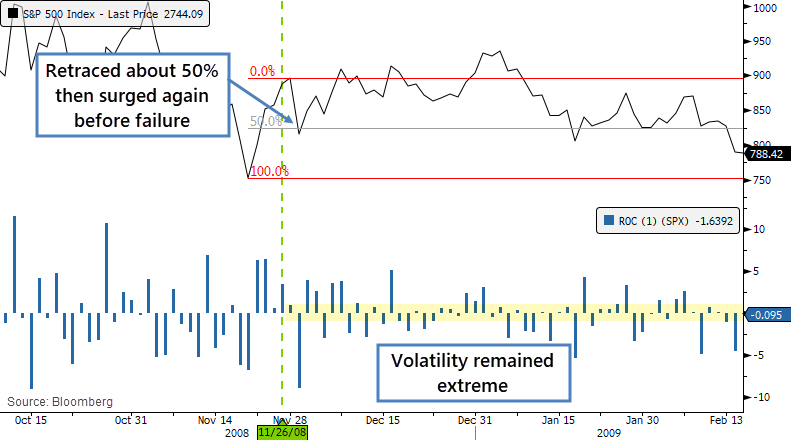
There wasn't another breadth and/or retracement signal until November 2008. That initial breadth surge led to an immediate pullback of about 50% of the initial gain, then the S&P managed a higher high even though volatility was extreme. It topped out about a month later and suffer a lower low.
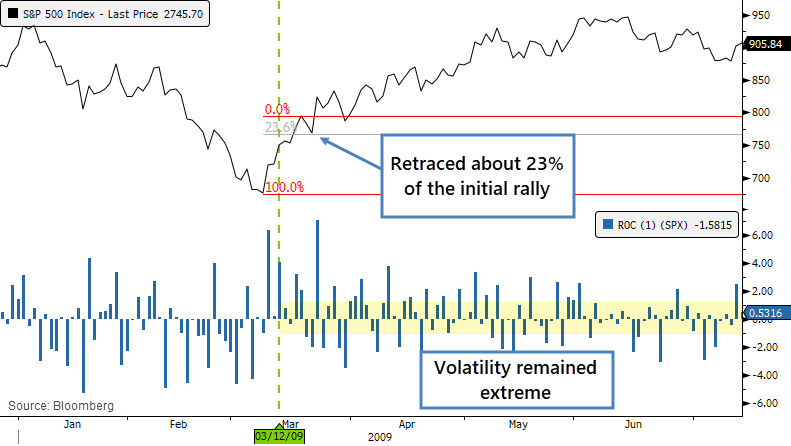
The next signal, in March 2009, marked the end of the bear market. There was a tiny retracement of about 23% of the initial surge but it's barely a blip. Volatility was still very high for months afterward.
More recent signals preceded much less of a dramatic decline, but were also more similar to our current environment in terms of structural factors like an active Federal Reserve, large flows into passive funds, dominant computerized trading, etc.
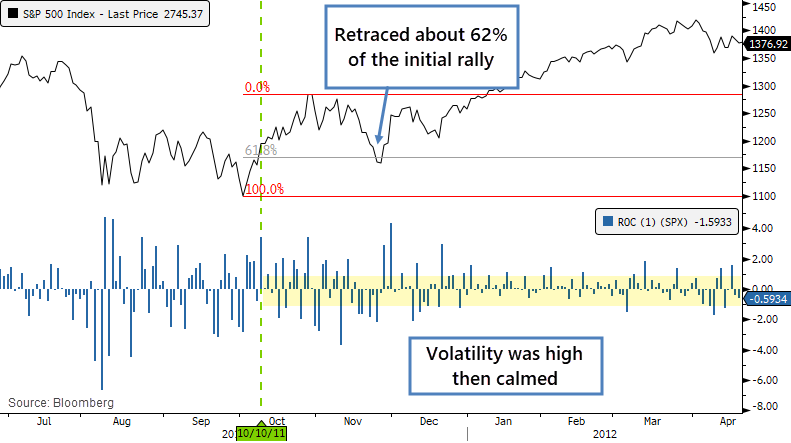
When stocks showed a signal in October 2011, the initial surge kept going for several weeks, then ended up giving back about 62% of that gain. Volatility remained very high, but as stocks recovered to a higher high, those swings dampened.
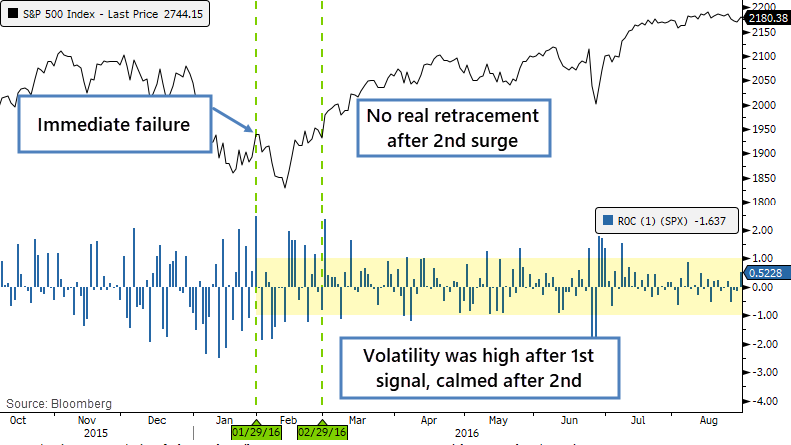
There was a breadth surge in January 2016, and stocks immediately failed afterward, taking the S&P to a lower low, which caused a high degree of consternation among traders, and almost every day saw a swing of more than 1%. Buyers stepped in right away, though, and it led to another surge by the end of February. That one didn't see any real retracement after the kick-off, and volatility started to drop right away.
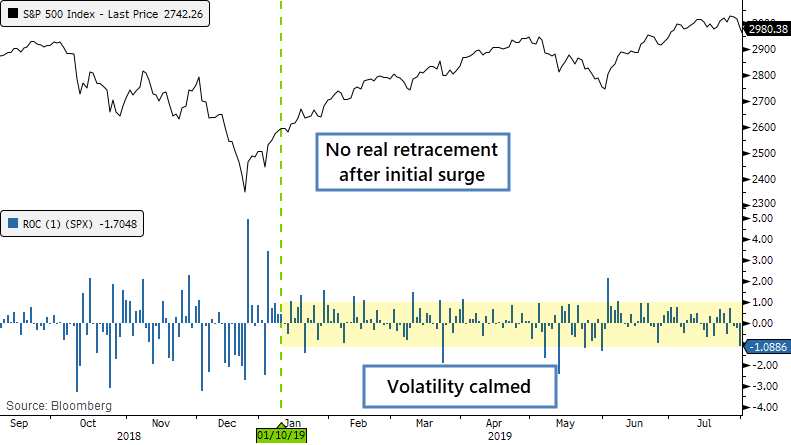
The last signal, from January 2019, also didn't see any retracement from the initial kick-off surge, and volatility calmed immediately. That was a classic v-shaped bottom that is not very common.
There was no clear pattern among all the signals - sometimes there was only a shallow retracement (or none at all) after the initial surge, sometimes a deep one. Sometimes volatility calmed down immediately, sometimes stocks continued to swing by more than 1% daily for weeks or months afterward.
Very generally, we might be able to say that the better bottoms saw volatility ease quickly after the signal. Ideally, of course, the retracement of the initial gain would be limited, but even some of the deep ones ended up leading to massive longer-term gains. They were also scary, and a couple of them led to lower lows.
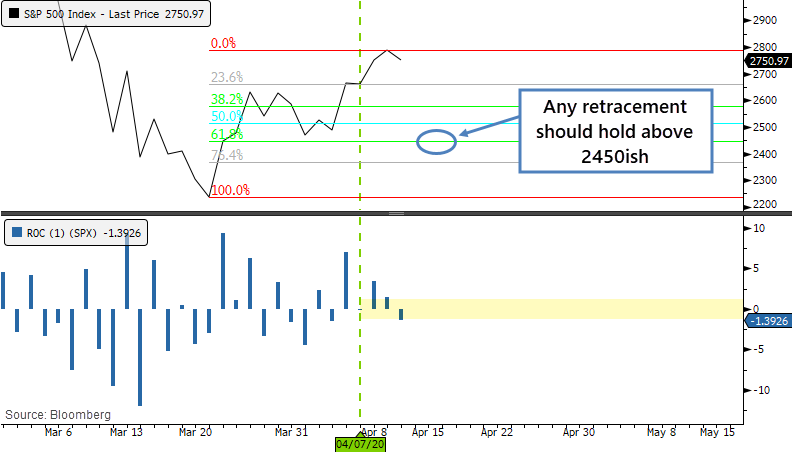
If the S&P gives back more than 62% of its gain, around the 2450 level, then it would indicate a deeper-than-usual retracement and cast the surge's effectiveness into doubt. That would also happen to show a lower low, further confirmation of a failure.
BOTTOM LINE
We're heading into the first earnings season following the onset of a bear market and likely recession. But stocks have already sold off massively during the earnings off-season, and investors have already priced in some of the worst-case scenarios.
FORECAST / TIMEFRAME
SPY -- Up, Long-Term
|
Financial media is ablaze with the idea that this week is going to be an important one for investors. We'll be getting our first real glimpse at corporate earnings and how the pandemic has altered the corporate landscape.
Even a cursory glance through news archives will show that a narrow, short-term focus on earnings reports has been misguided time and time again. Investors are forward-looking; earnings are backward-looking. Even forward earnings guidance and Wall Street estimates are heavily weighted by the recent past.
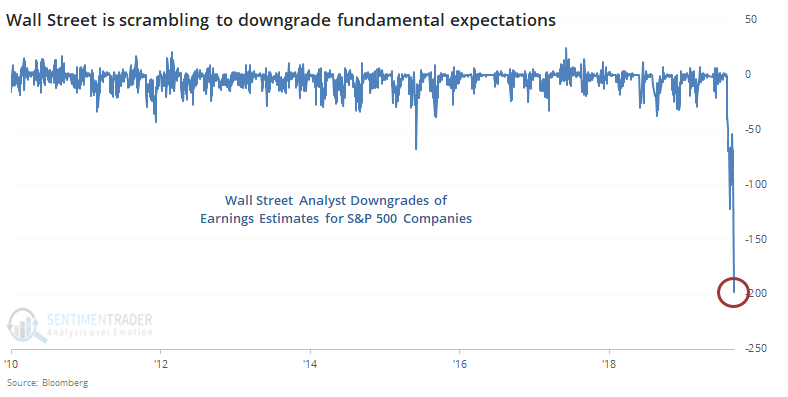
Based on the latest figures tallied by Bloomberg, Wall Street is scrambling to downgrade just about everything in sight to get ahead of these earnings releases. In recent days, they've had more net downgrades of almost 4 times as many stocks in the S&P 500 at one time as any other period in the last decade.
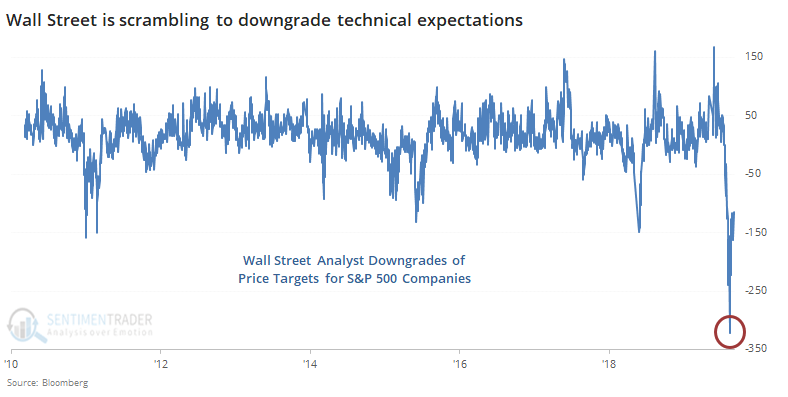
They've been downgrading the technicals of stocks at a record pace, too. There is a very strong contrary nature to this data - the more net upgrades, the worse stocks perform going forward; the more downgrades, the better they do. We saw that in January when they were busy upgrading price targets.
Still, let's look at how stocks reacted when earnings season (approximately) began during the first earnings season following the onset of recession.
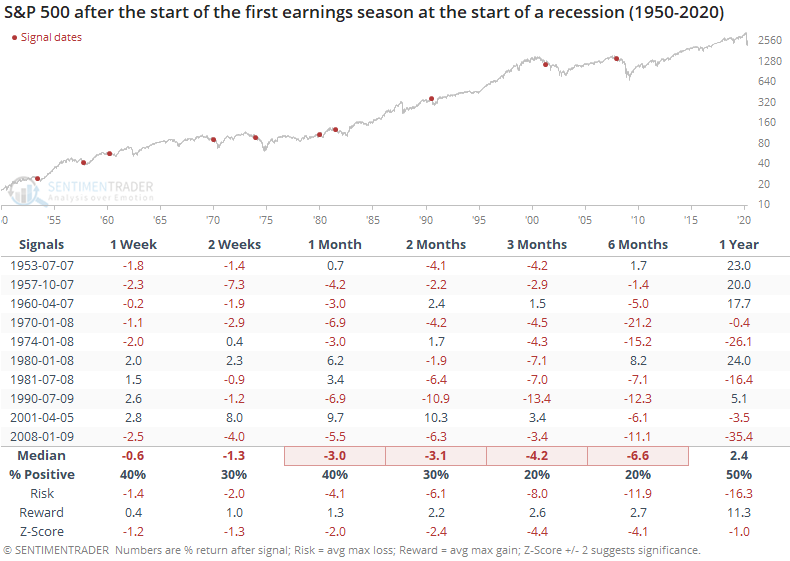
This was not good. Stocks sold off consistently and significantly over the medium-term, with heavy risk relative to reward.
Even if the economy will somehow avoid recession, by most definitions we've already suffered a bear market. Below, we can see how the S&P fared after the first earnings season following the beginning of a bear market.
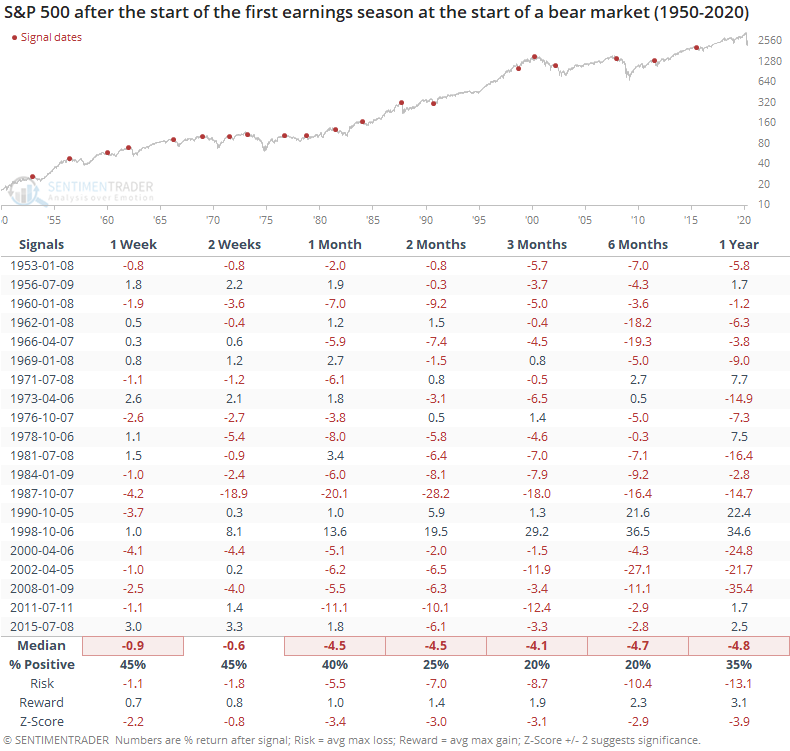
This was even worse in some respects - the numbers were about as bad but with double the sample size.
But...
The issue with looking at it this way is that it's backward-looking. Recessions and bear markets aren't dated until after the fact. Many of the dates in the above tables triggered when stocks were near all-time highs, which isn't anything like our current environment.
So, let's re-run the test and look for the starts of earnings season following a time when the S&P had already suffered at least a 30% drawdown from its 52-week high at some point during the preceding earnings off-season.
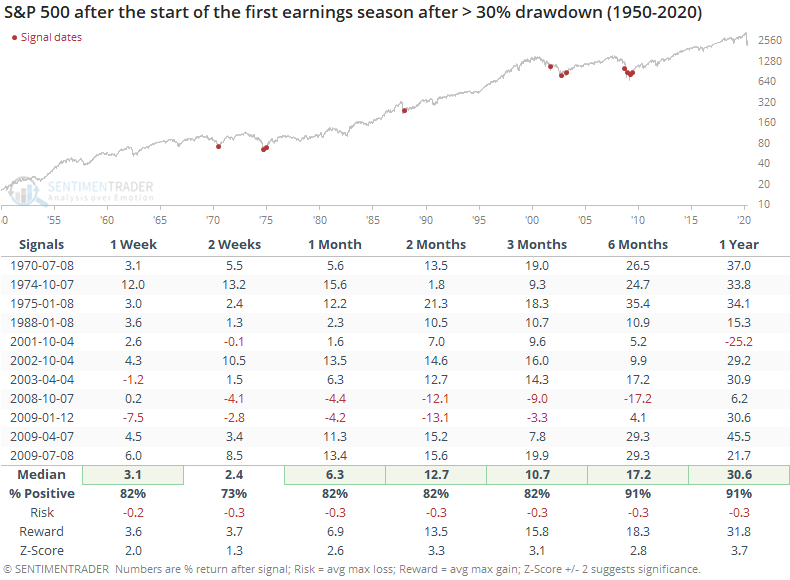
Because stocks had just suffered massive losses, investors had already baked much of the worst of the coincident recessions and bear markets. Surely, the earnings reports were about to be terrible, but investors already knew that and were trying to look around the corner about what the prospects were once the economy recovered.
There is no question that we're in unprecedented times. There are few investors alive that have seen anything even remotely what we're dealing with now. But we must steel ourselves against the easy idea that poor earnings in the coming days and weeks = poor future stock returns. Maybe it will, because uncertainty is so high. Historically, however, the fact that losses have been so large heading into a poor earnings season suggests that investors have already priced in most of the worst-case scenarios.
Active Studies
| Time Frame | Bullish | Bearish | | Short-Term | 0 | 1 | | Medium-Term | 11 | 0 | | Long-Term | 30 | 3 |
|
Indicators at Extremes
Portfolio
| Position | Weight % | Added / Reduced | Date | | Stocks | 73.2 | Added 31.3% | 2020-03-17 | | Bonds | 0.0 | Reduced 6.7% | 2020-02-28 | | Commodities | 5.5 | Added 2.4%
| 2020-02-28 | | Precious Metals | 0.0 | Reduced 3.6% | 2020-02-28 | | Special Situations | 0.0 | Reduced 31.9% | 2020-03-17 | | Cash | 21.3 | | |
|
Updates (Changes made today are underlined)
In the first months of the year, we saw manic trading activity. From big jumps in specific stocks to historic highs in retail trading activity to record highs in household confidence to almost unbelievable confidence among options traders. All of that has come amid a market where the average stock can’t keep up with their indexes. There were signs of waning momentum in stocks underlying the major averages, which started triggering technical warning signs in late January. The kinds of extremes we saw in December and January typically take months to wear away, but the type of selling we’ve seen over the past month has gone a long way toward getting there. When we place the kind of moves we saw into March 23 into the context of coming off an all-time high, there has been a high probability of a multi-month rebound. The volatility we’ve seen lately is extremely compelling from a medium-term point of view. Virtually everything we’ve looked at suggests a strong probability of gains over the next several months, even within the context of a potential bear market, and even from what had been higher prices. After stocks bottomed on the 23rd, they enjoyed a historic buying thrust. While other signs are mixed at best that panic is subsiding, that thrust is one of the most encouraging sign we've seen in years. There is often a test of a panic low in the weeks after an initial recovery, but that thrust we saw, combined with the larger-than-usual retracement, have me less convinced a test is necessary. For now, I see no overwhelming reason to add or reduce exposure.
RETURN YTD: -11.5% 2019: 12.6%, 2018: 0.6%, 2017: 3.8%, 2016: 17.1%, 2015: 9.2%, 2014: 14.5%, 2013: 2.2%, 2012: 10.8%, 2011: 16.5%, 2010: 15.3%, 2009: 23.9%, 2008: 16.2%, 2007: 7.8%
|
|
Phase Table
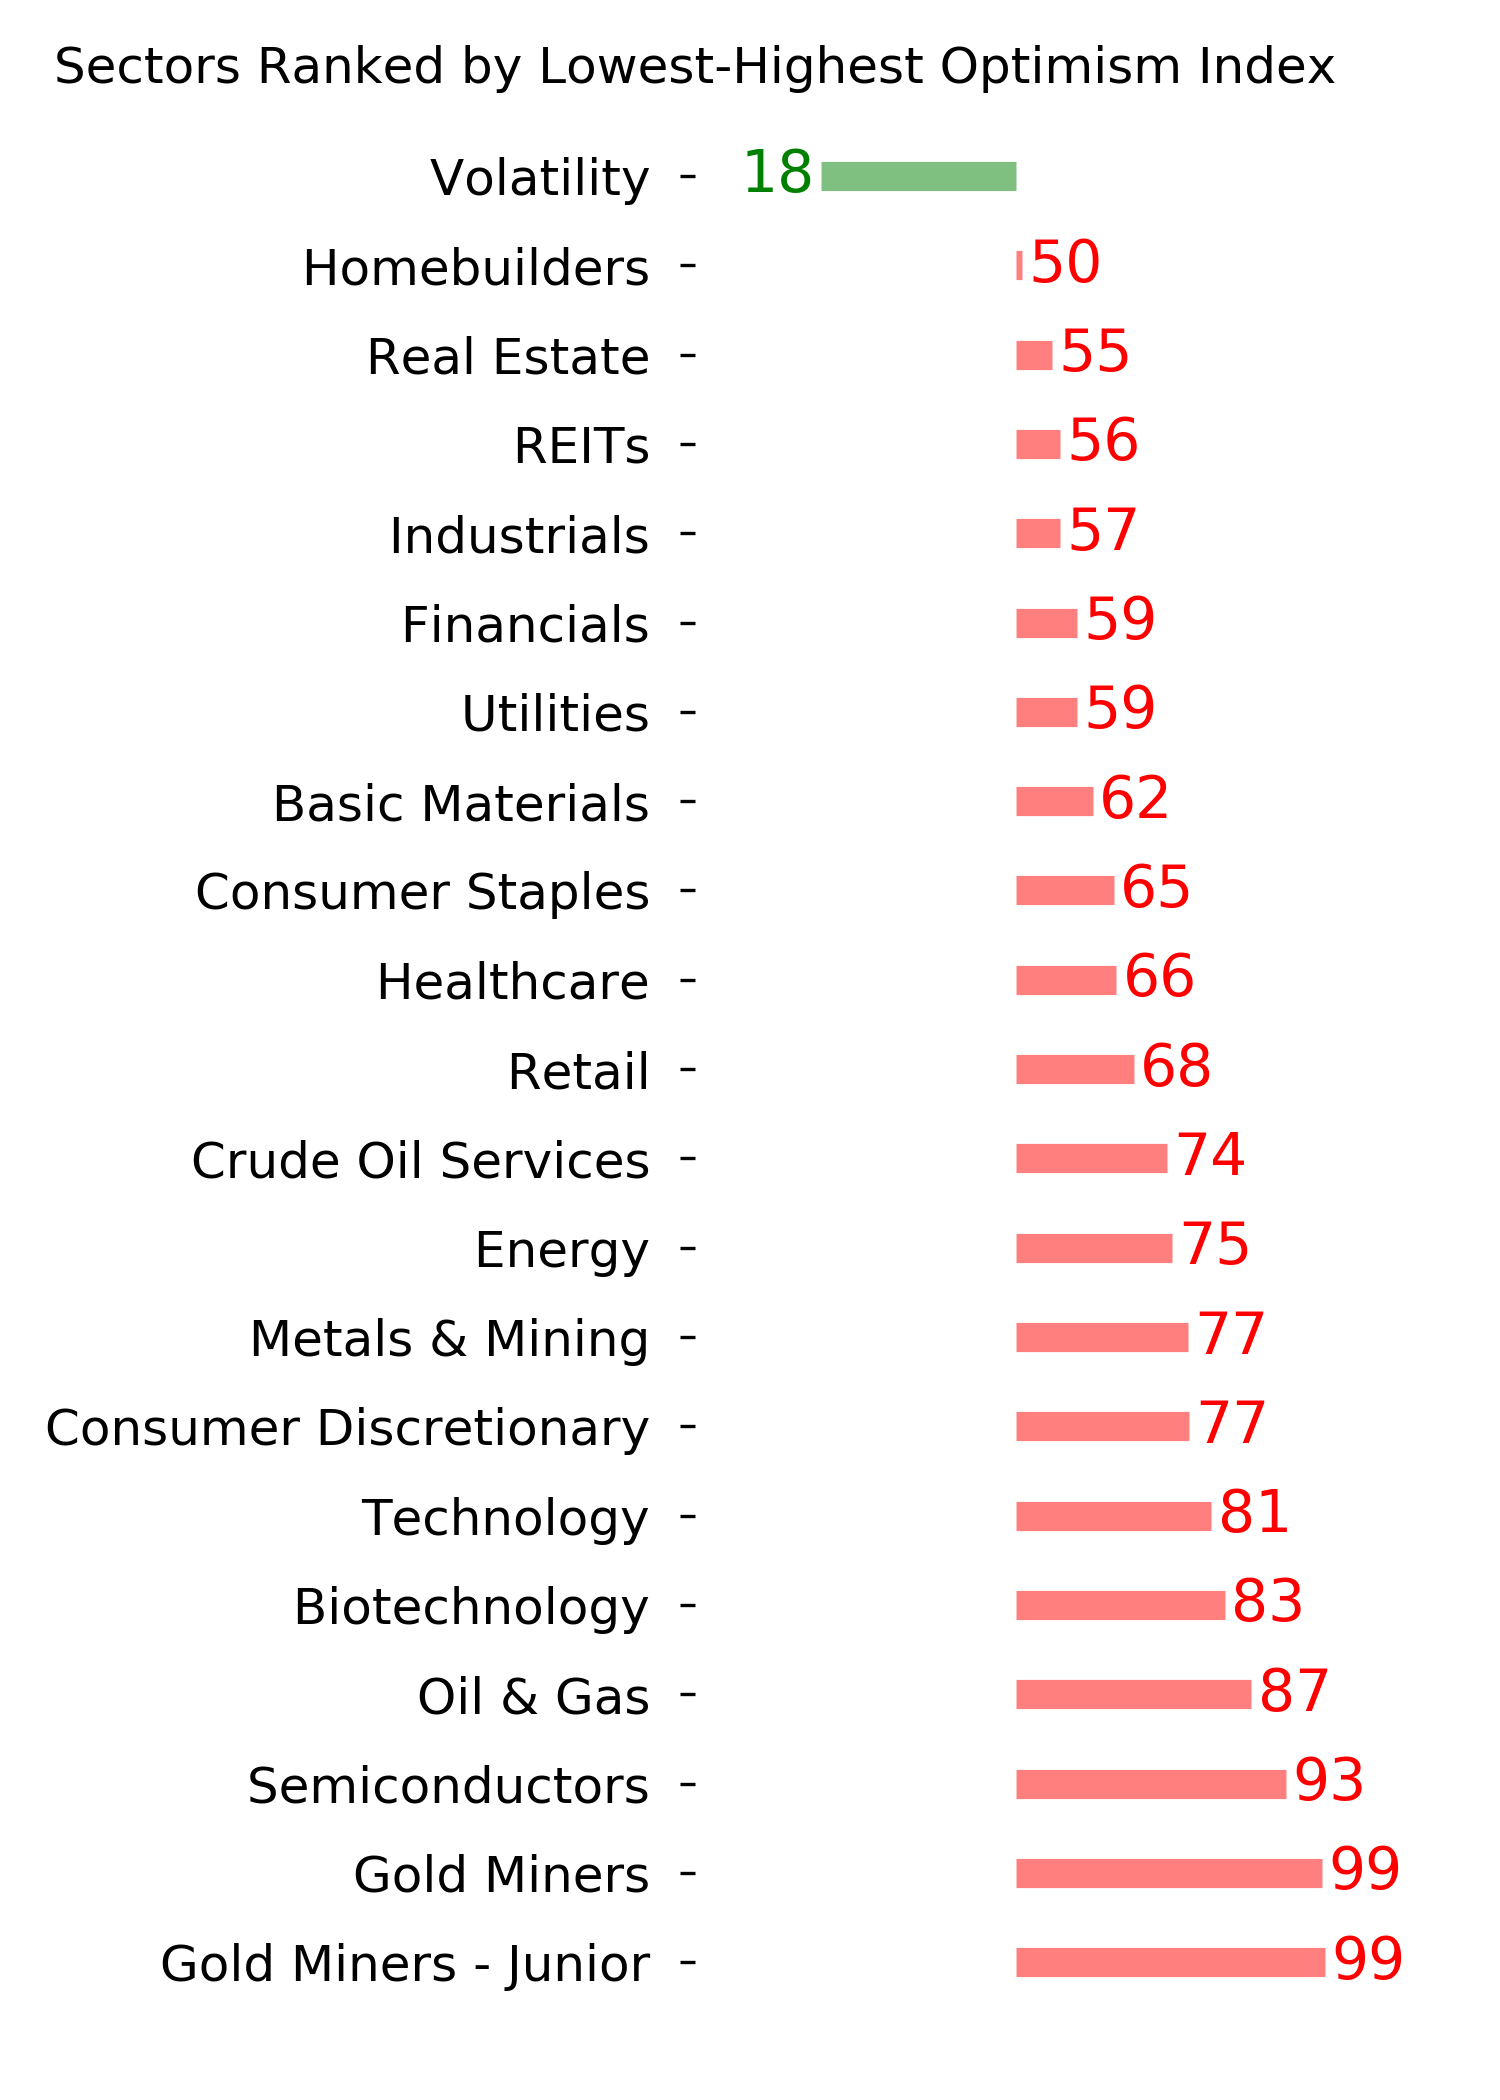
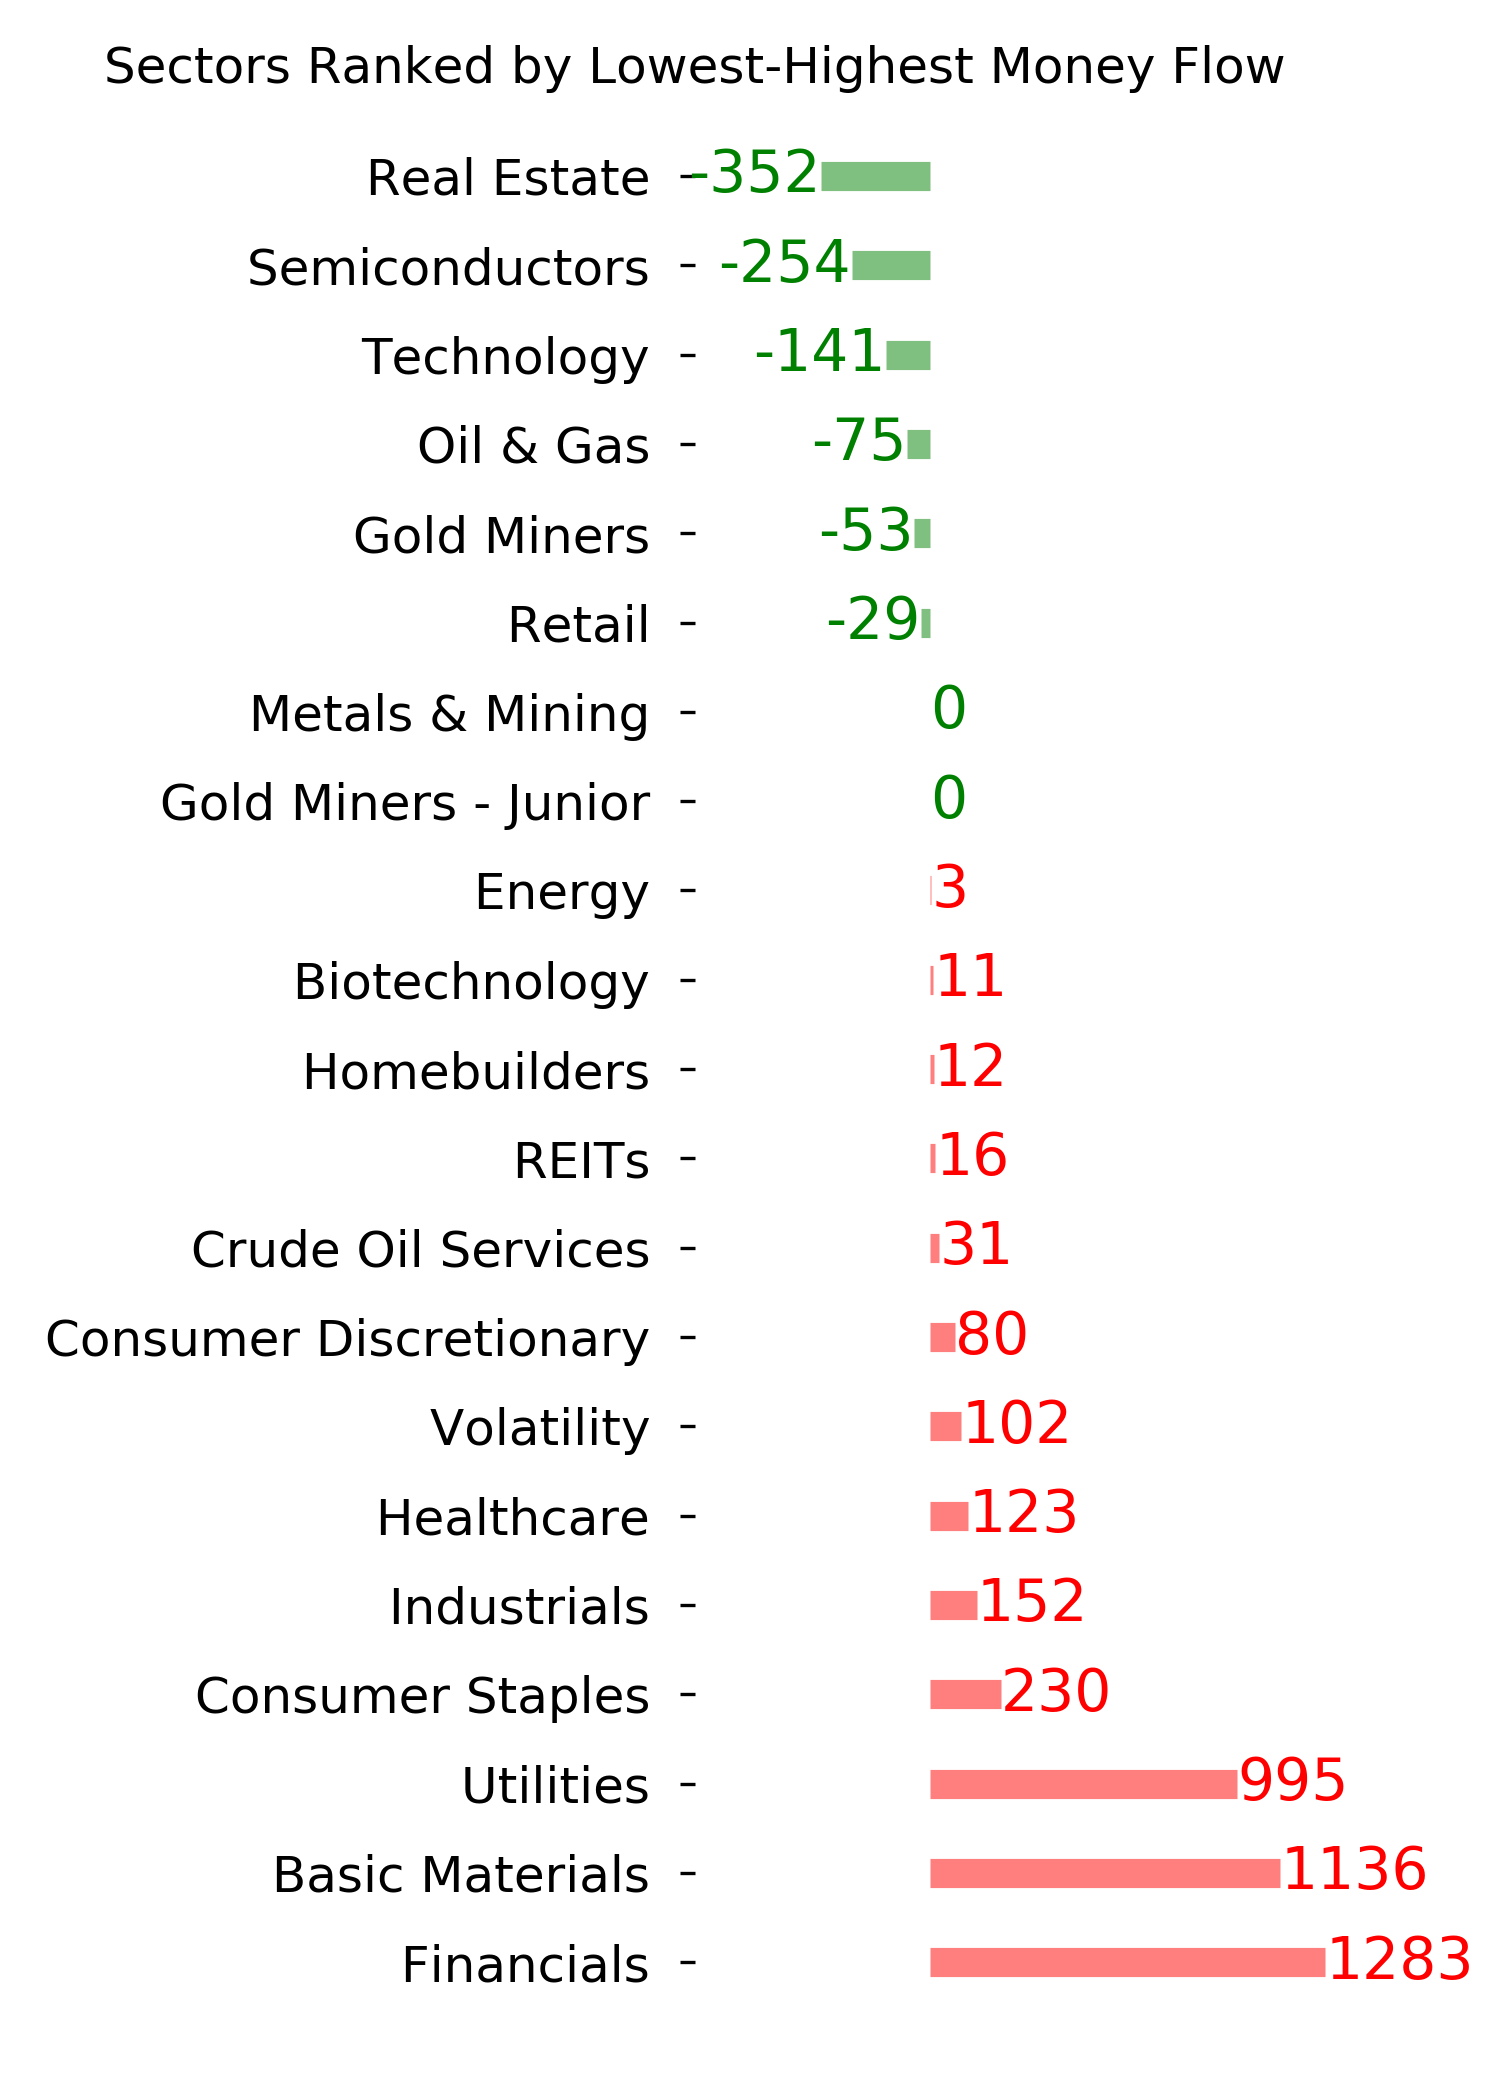
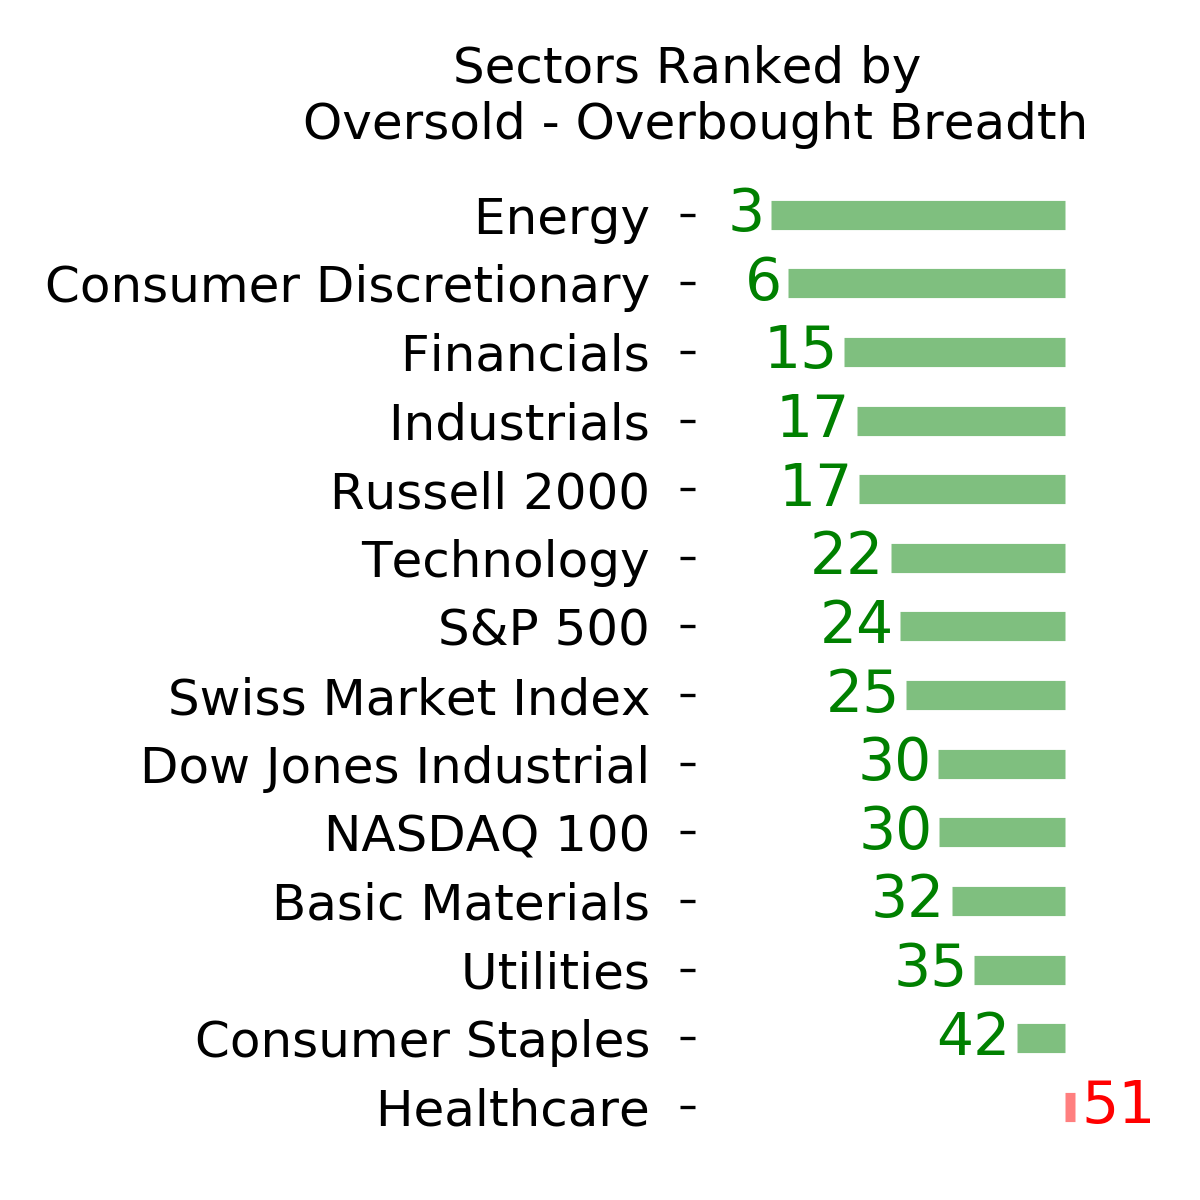
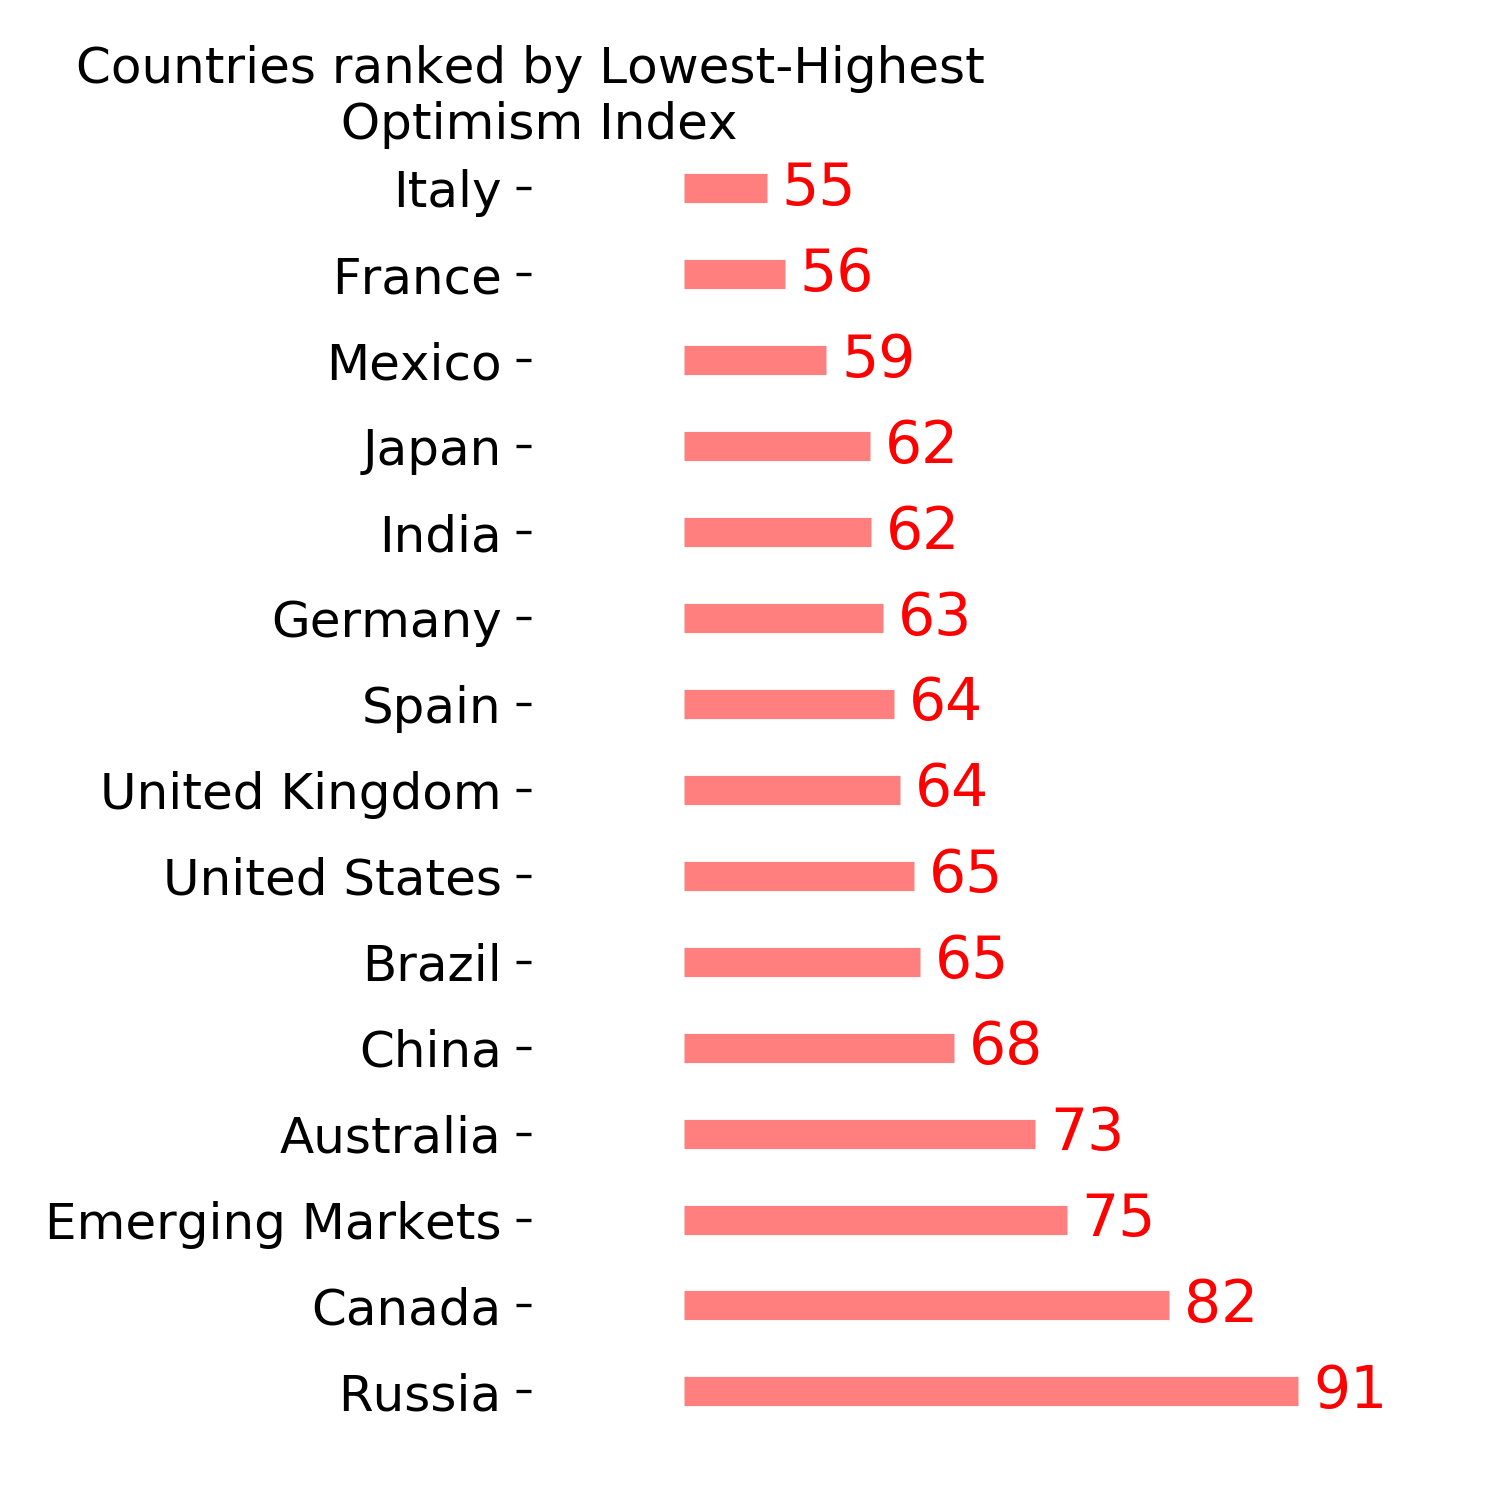
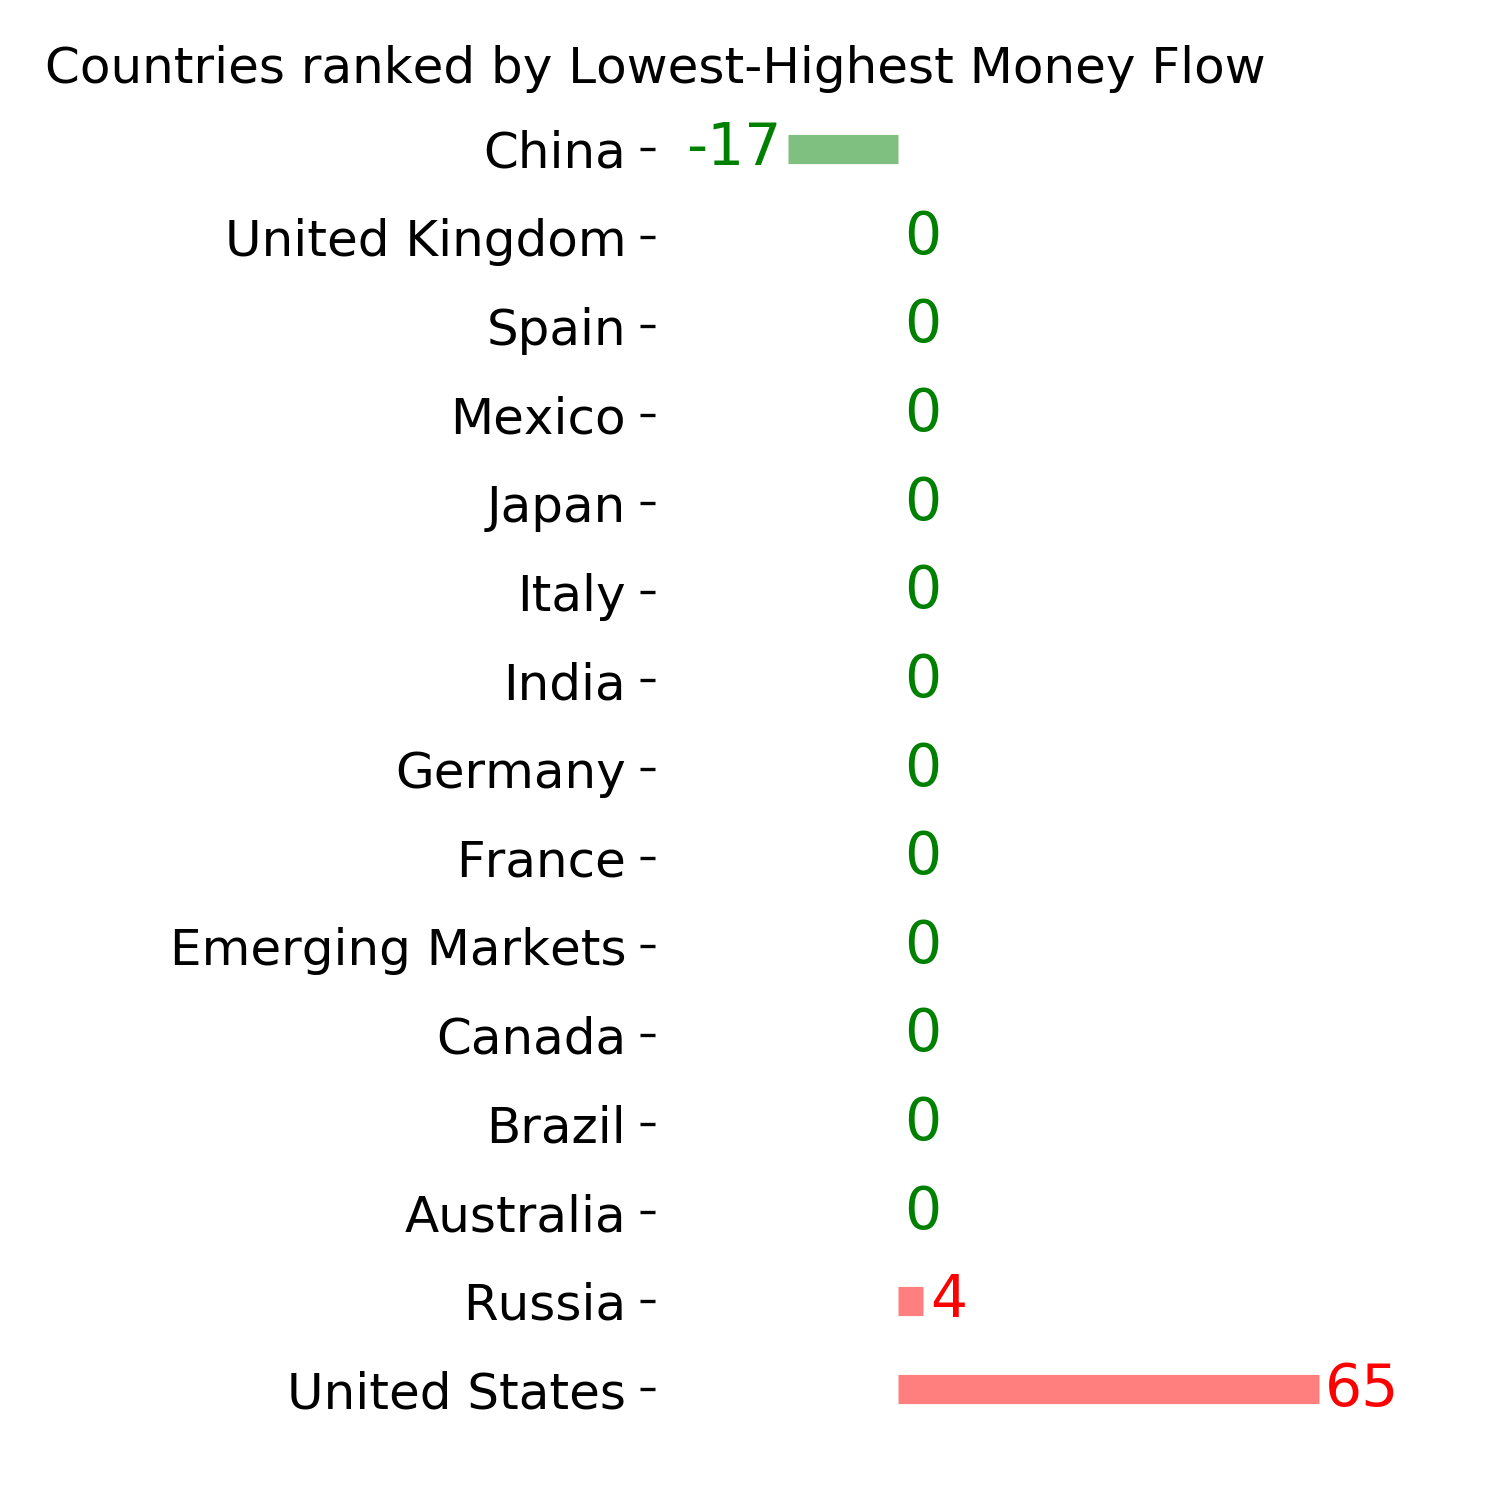
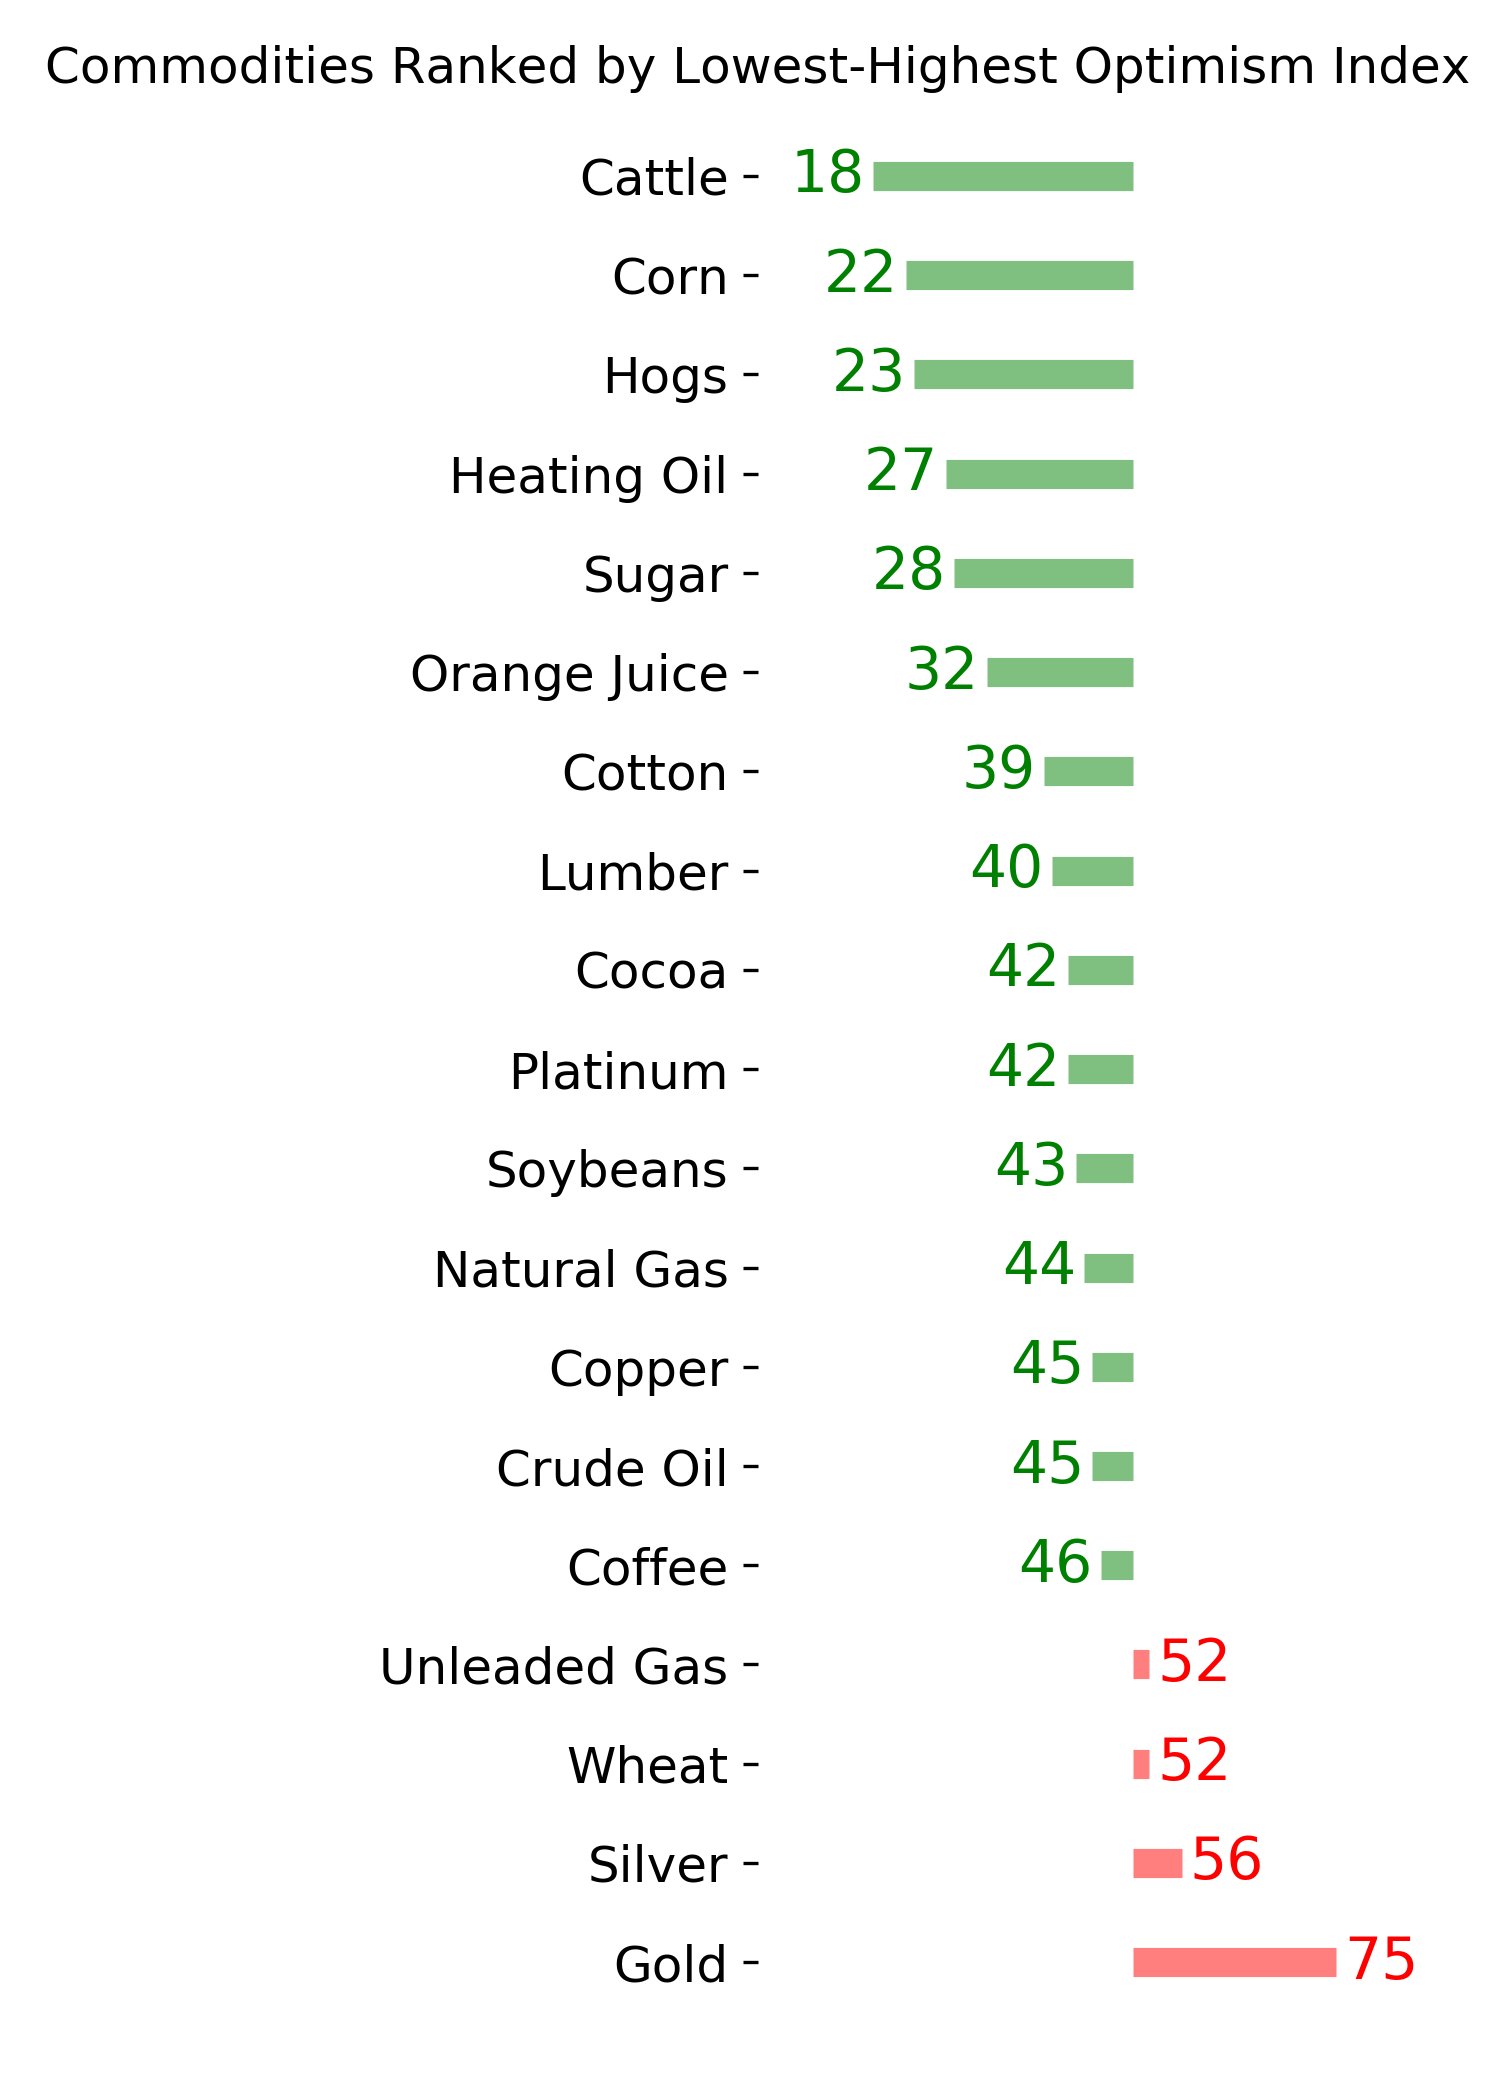
Ranks
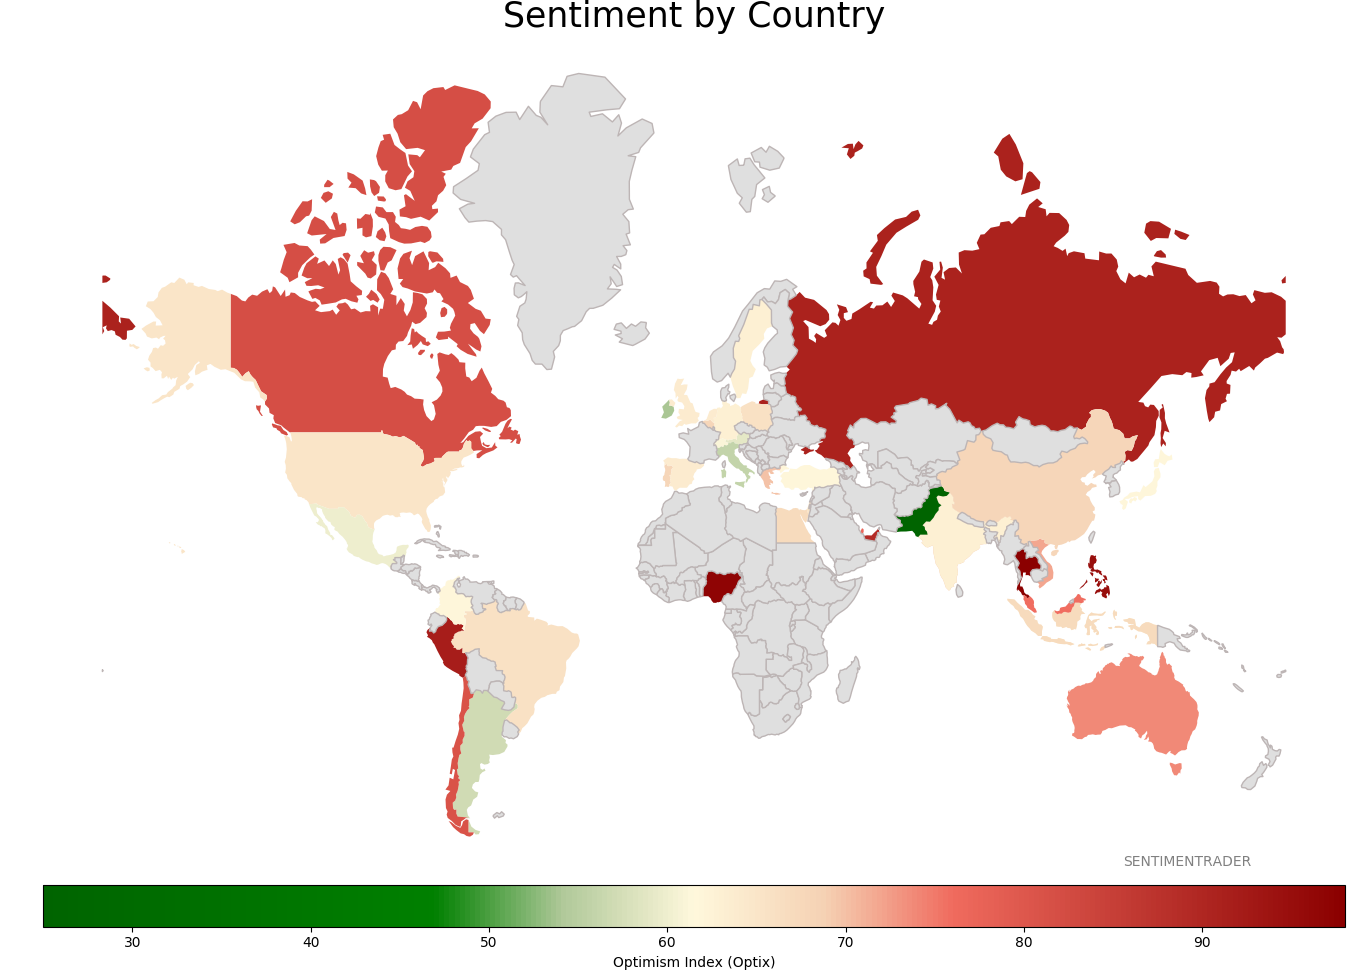
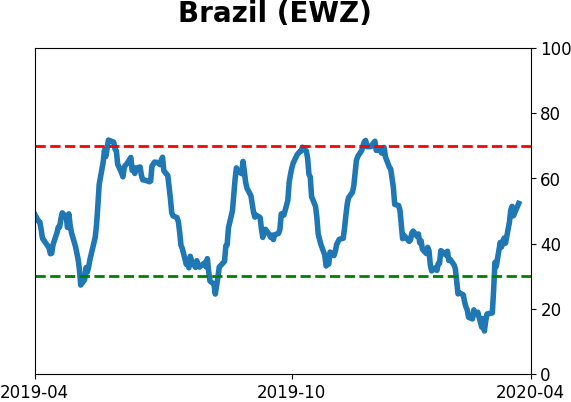
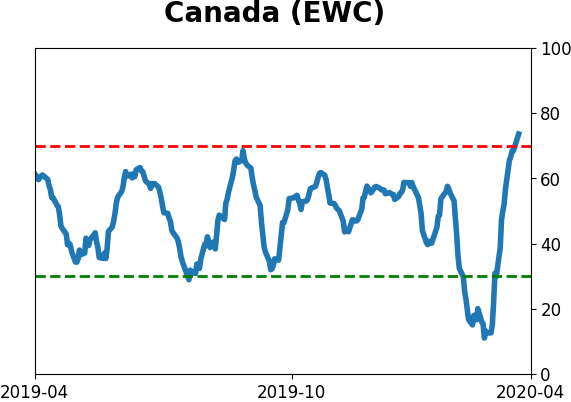
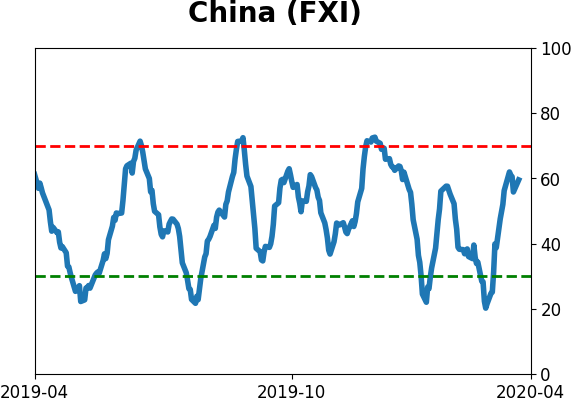
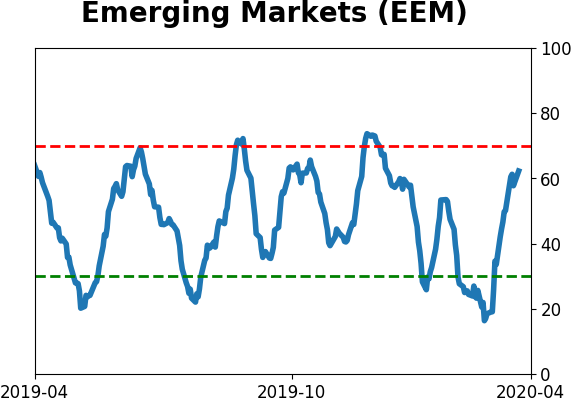
Sentiment Around The World
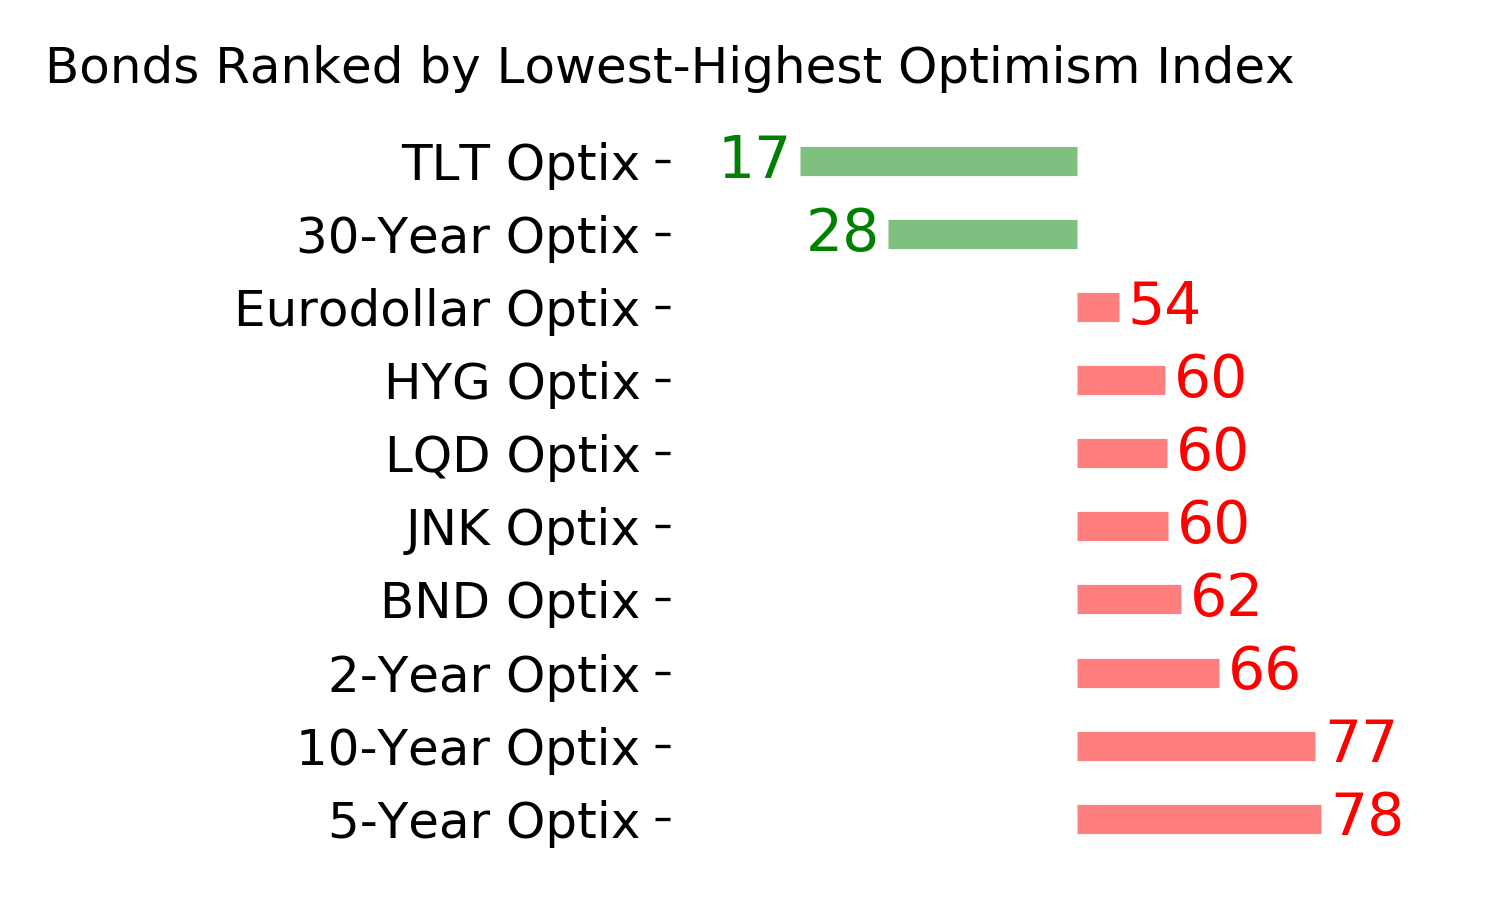
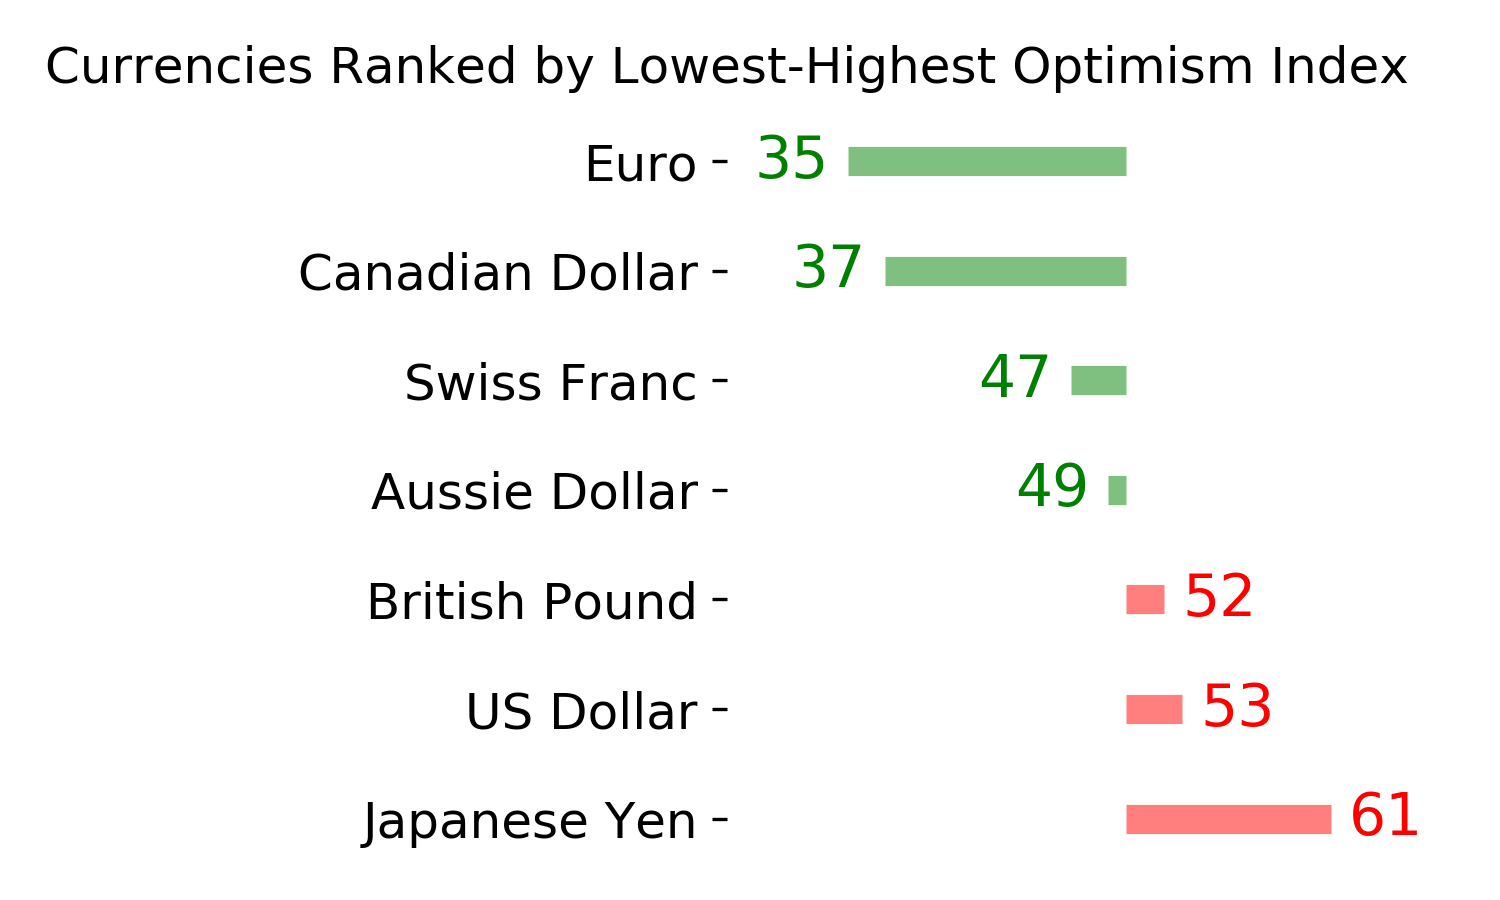
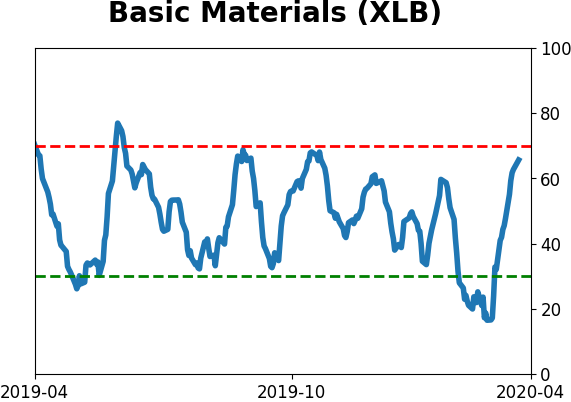
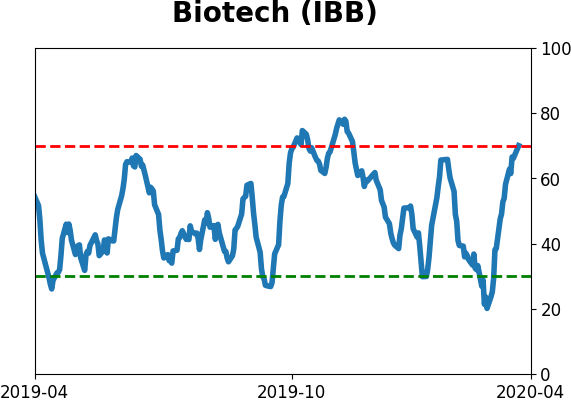
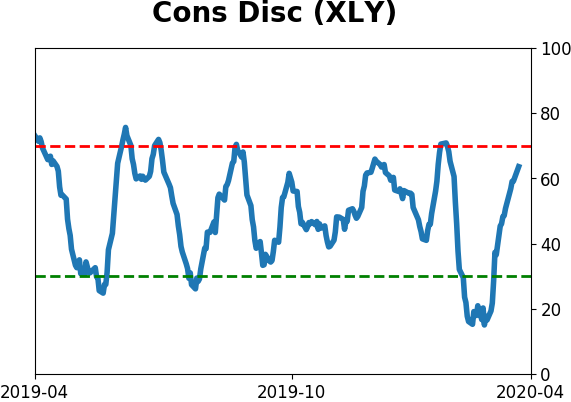
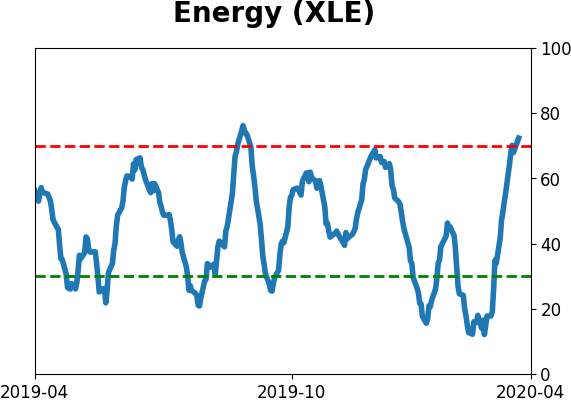
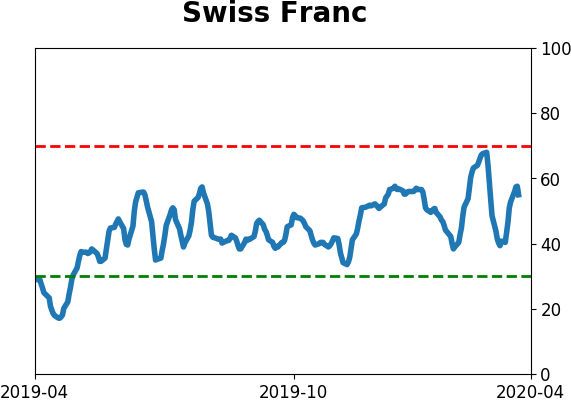
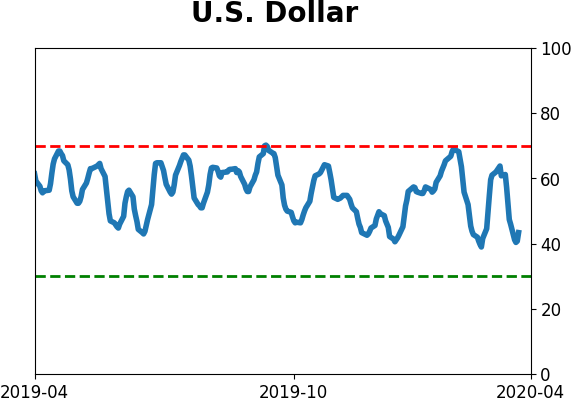
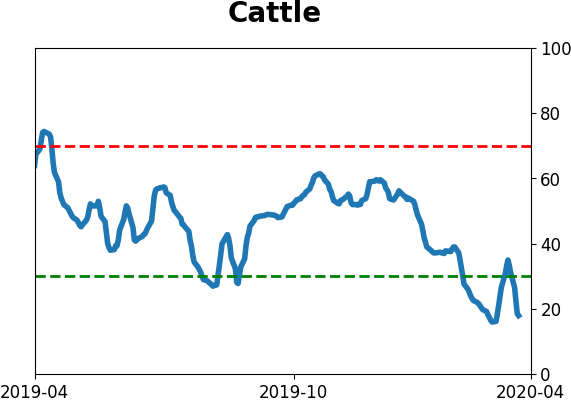
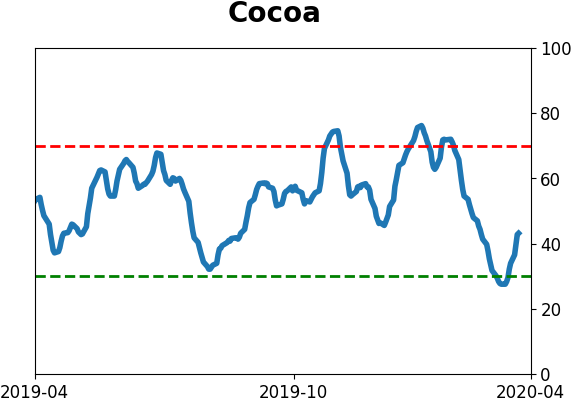
Optimism Index Thumbnails
|
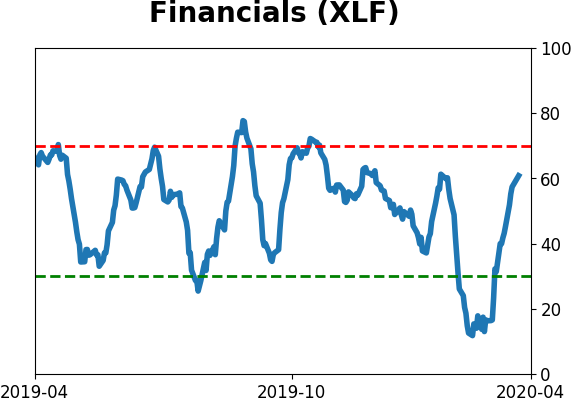
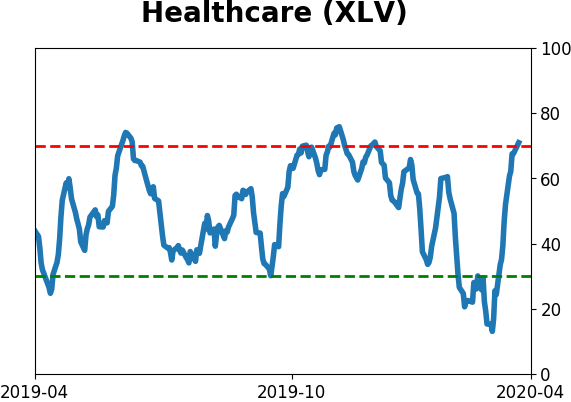
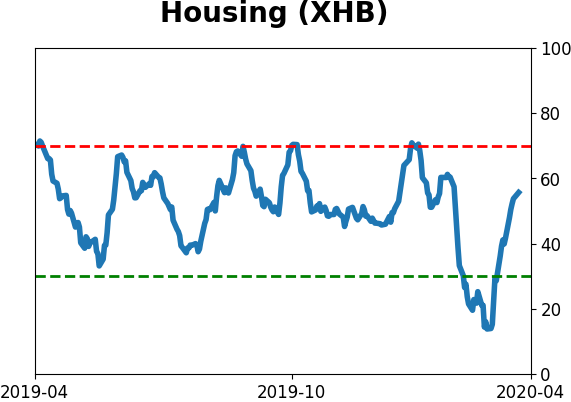
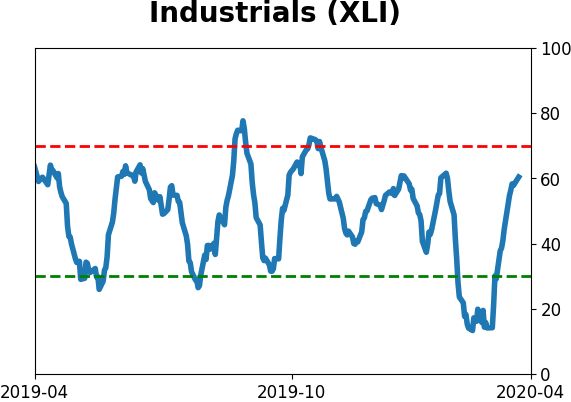
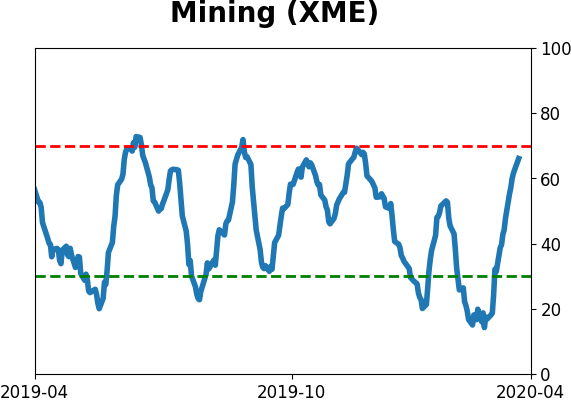
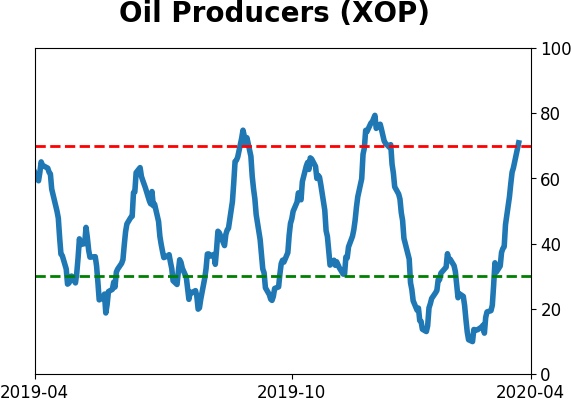
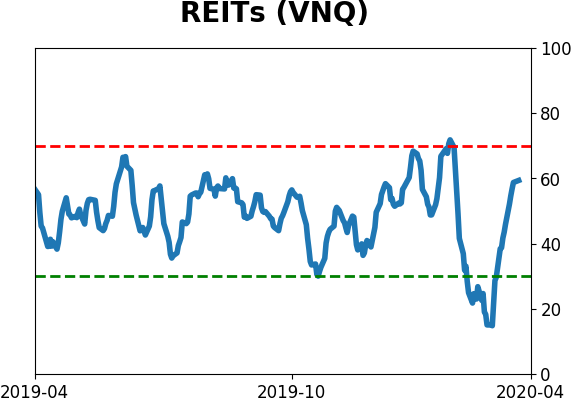
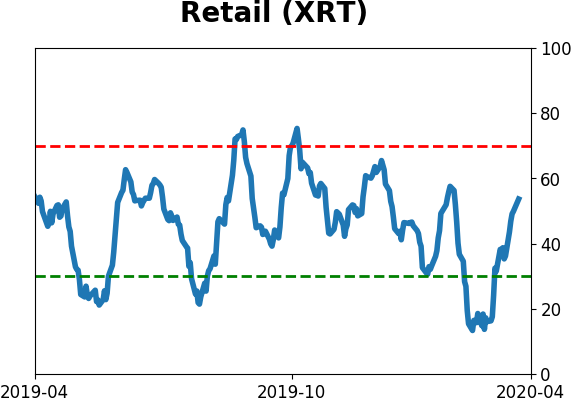
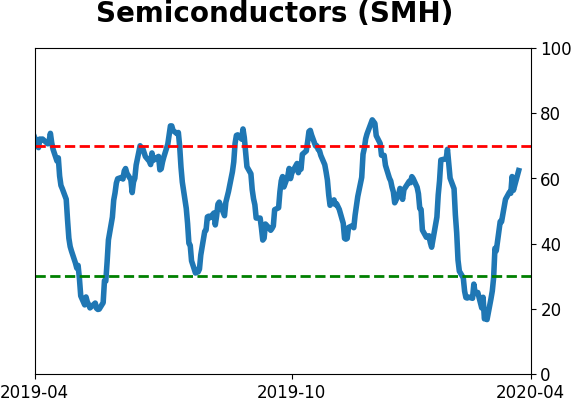
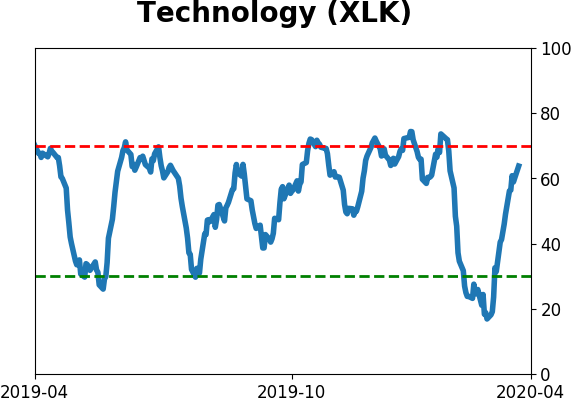
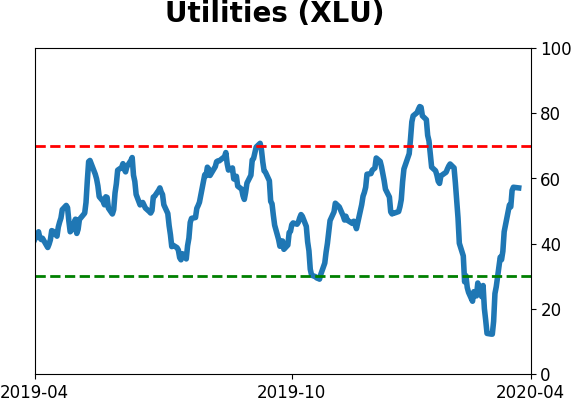
Sector ETF's - 10-Day Moving Average
|
|
|
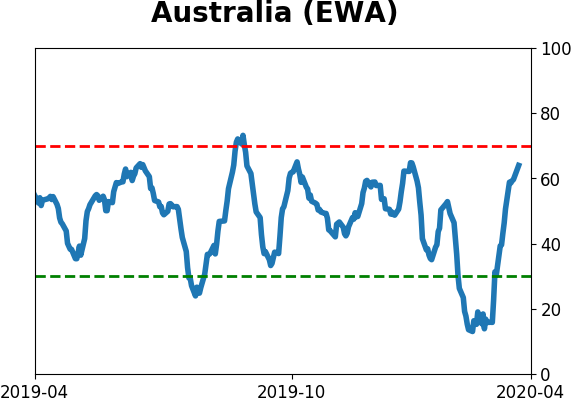
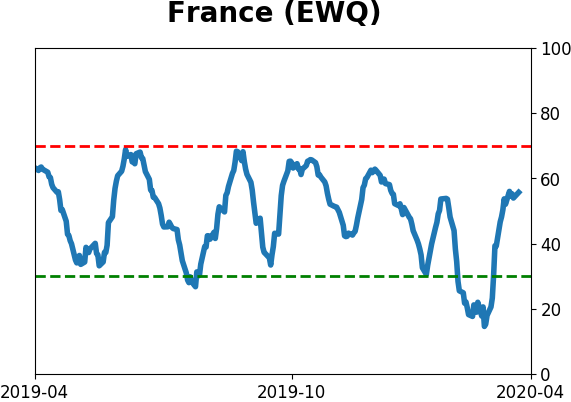
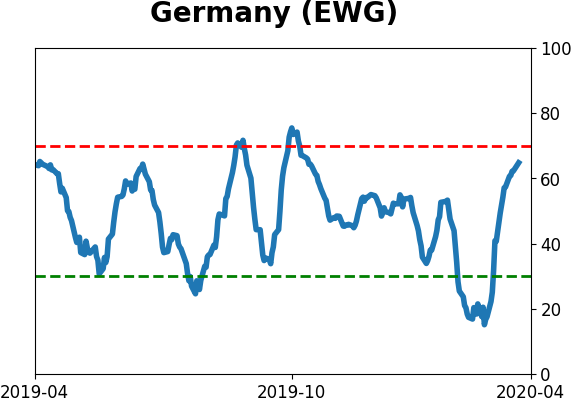
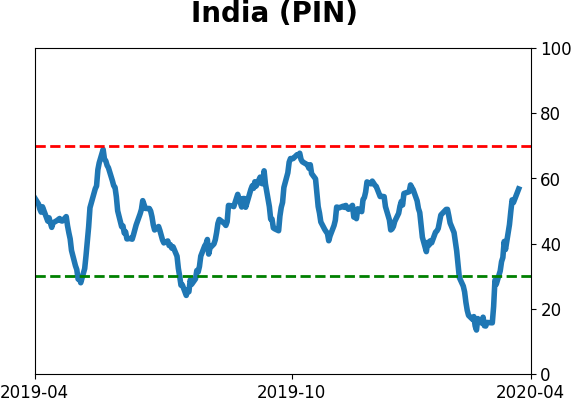
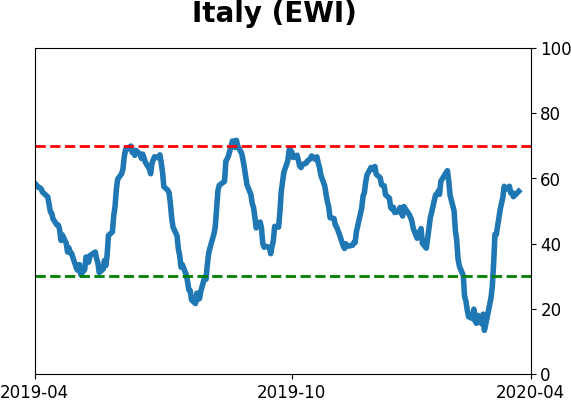
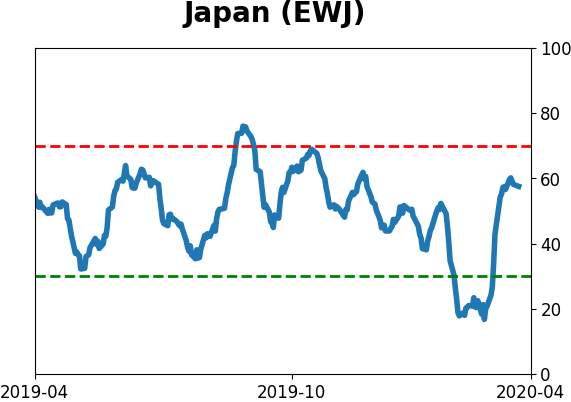
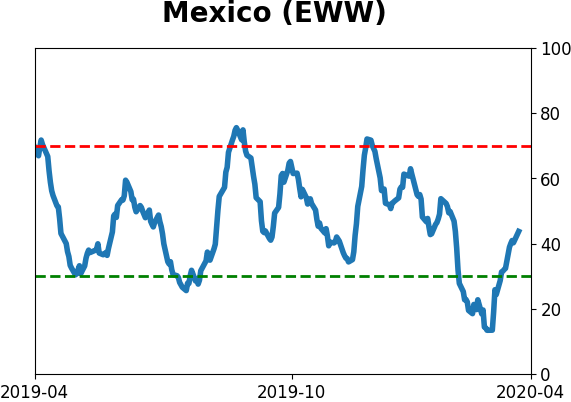
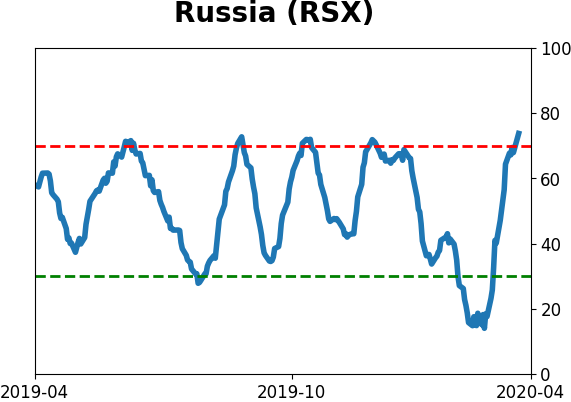
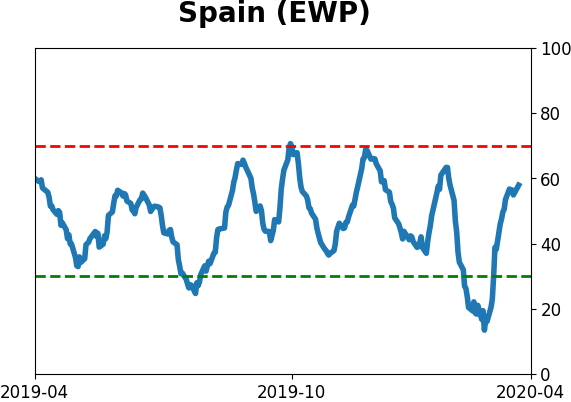
Country ETF's - 10-Day Moving Average
|
|
|
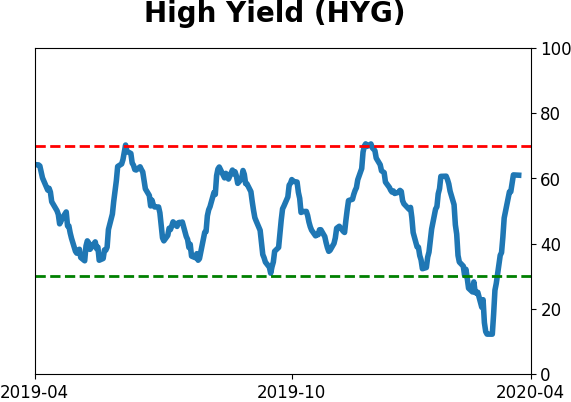
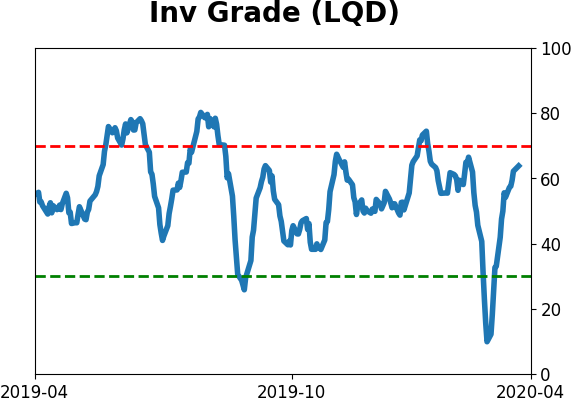
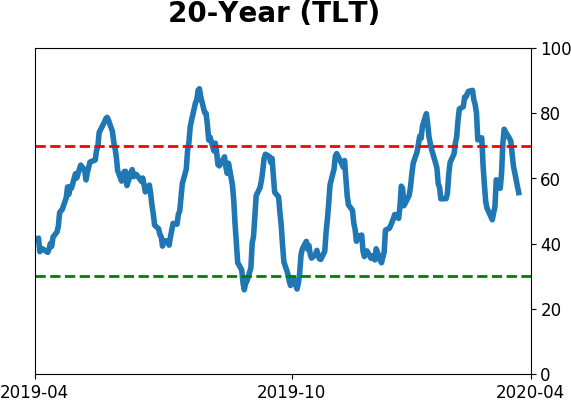
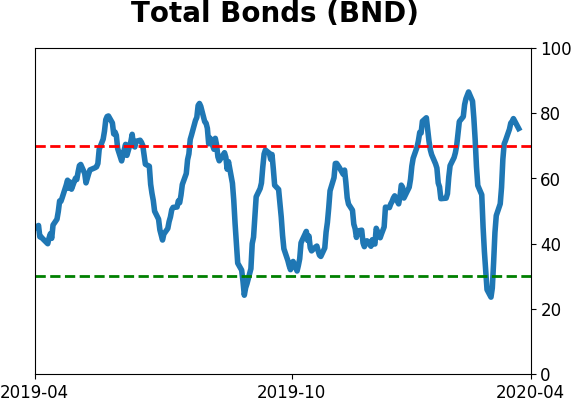
Bond ETF's - 10-Day Moving Average
|
|
|
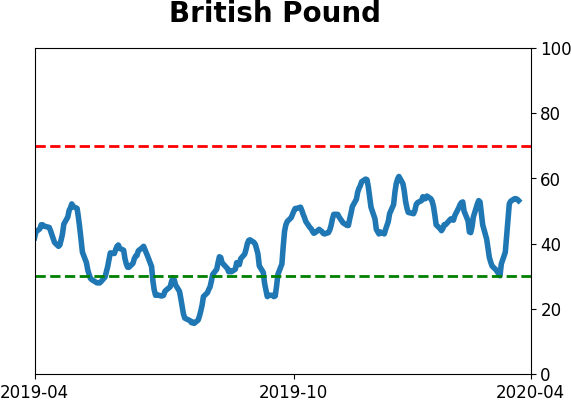
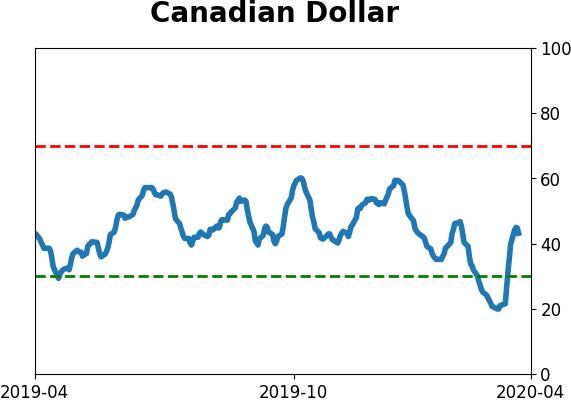
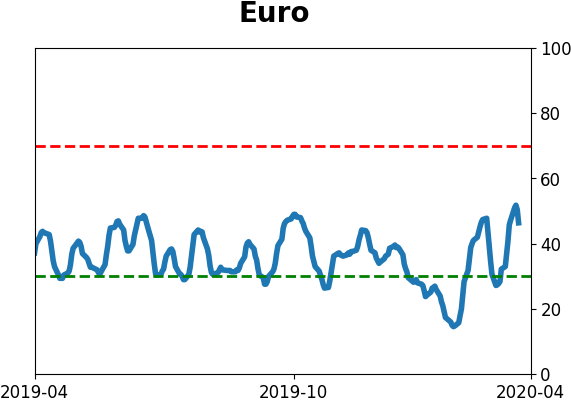
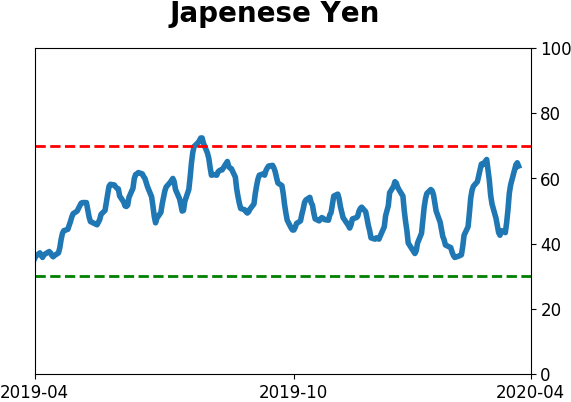
Currency ETF's - 5-Day Moving Average
|
|
|
Commodity ETF's - 5-Day Moving Average
|
|