Headlines
|
|
With stocks surging, investors give up on hedges:
With stocks surging again and sitting at new highs, investors have given up on hedging activity, with the Equity Hedging Index falling below 10 for one of the few times in its history.
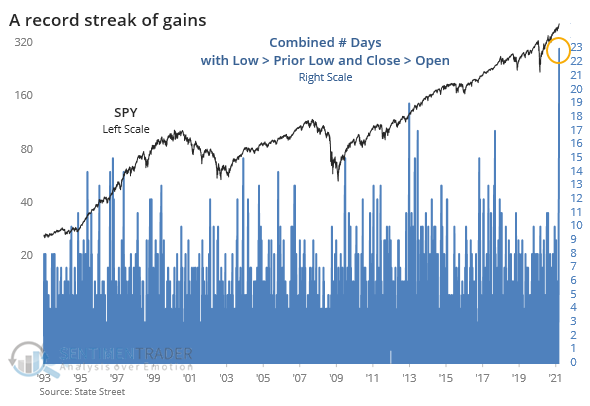
Another nothing-matters market?: In 2013 and again in 2017, stocks entered environments where nothing seemed to matter. Day after day, stocks just crept higher and it frustrated everything but pure trend-following. Based on recent price action, we've surpassed even those momo markets. The largest ETF in the world, SPY, has now closed above its open price for 12 straight days, and it's enjoyed a higher intraday low for 11 days. That combined streak of 23 days is a new record, surpassing the prior records from January 2013 and October 2017.
Bottom Line:
See the Outlook & Allocations page for more details on these summaries STOCKS: Weak sell
The extreme speculation registered in January and February is starting to get wrung out. Internal dynamics have mostly held up, so a return to neutral sentiment conditions would improve the forward risk/reward profile substantially. We're still a ways off from that. BONDS: Weak buy
Various parts of the market have been hit in recent weeks, with mild oversold conditions. The Bond Optimism Index is now about as low as it gets during healthy bond market environments. Fixed income isn't responding well, so that needs to be monitored in case it's transitioning to a longer-term negative market environment. GOLD: Weak buy
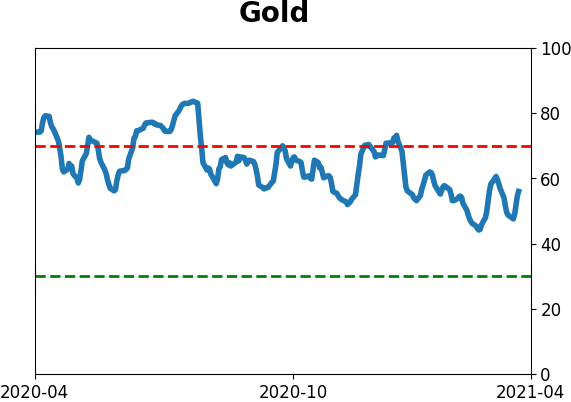
A dollar trying to rebound from a severe short position has weighed on gold and miners. The types of signals they've given in recent weeks, within the context of their recent surge, have usually resulted in higher prices over a medium- to long-term time frame. Like bonds, gold and miners aren't responding very well, and this needs to be monitored.
|
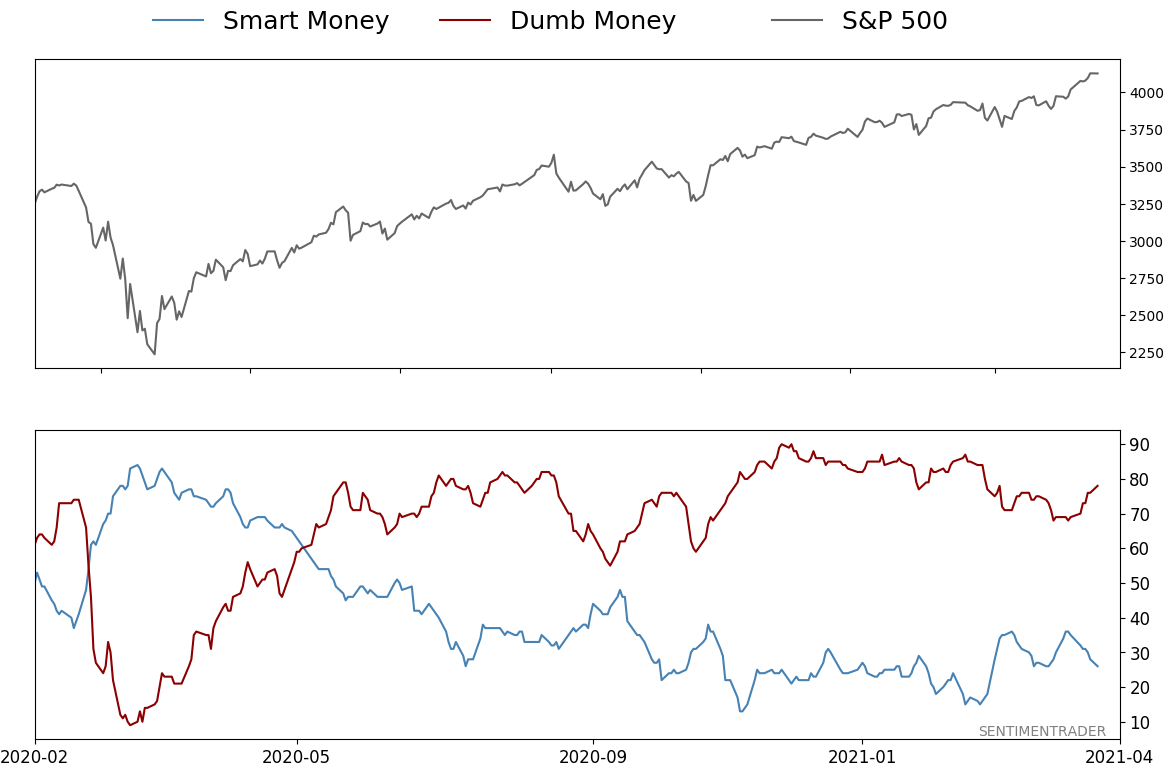
Smart / Dumb Money Confidence
|
Smart Money Confidence: 26%
Dumb Money Confidence: 78%
|
|
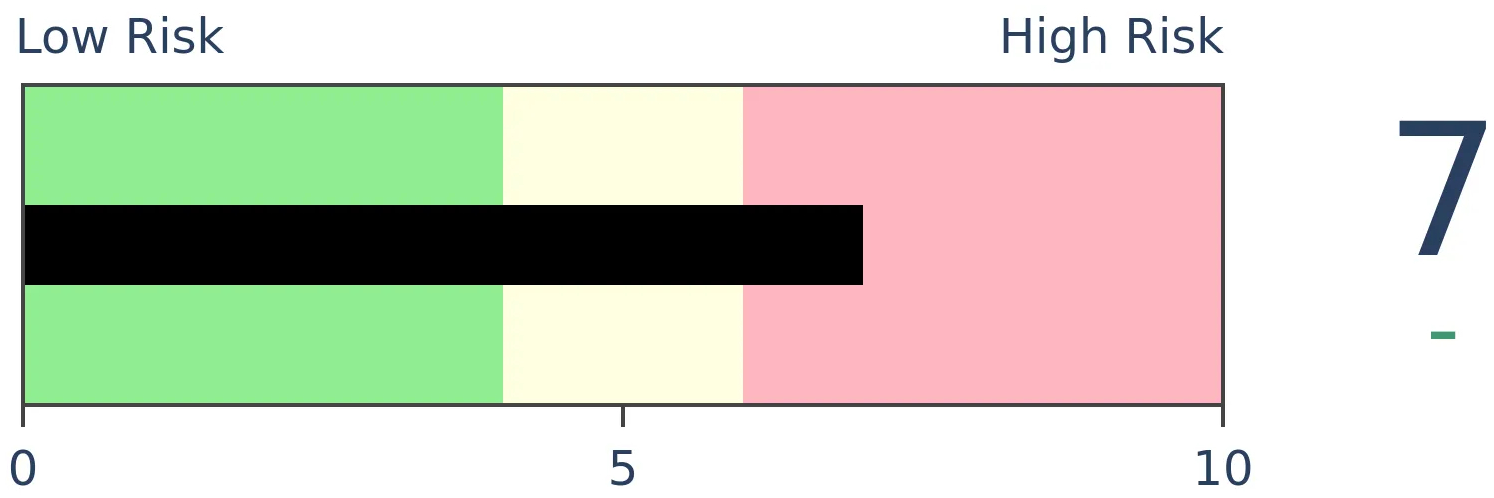
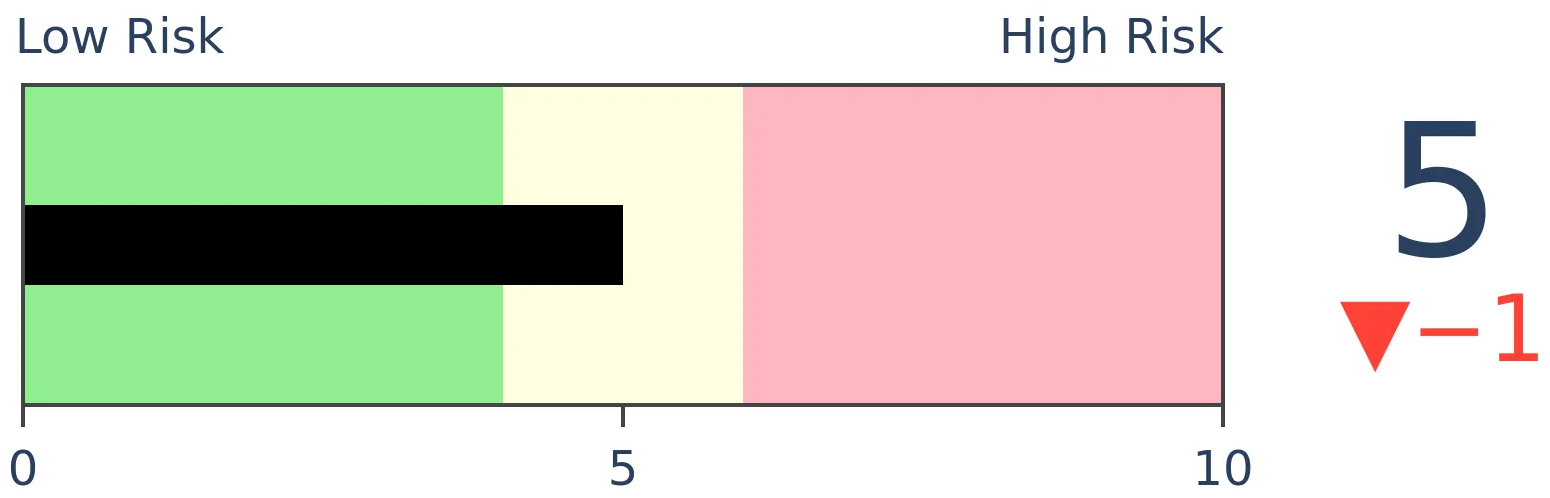
Risk Levels
Stocks Short-Term

|
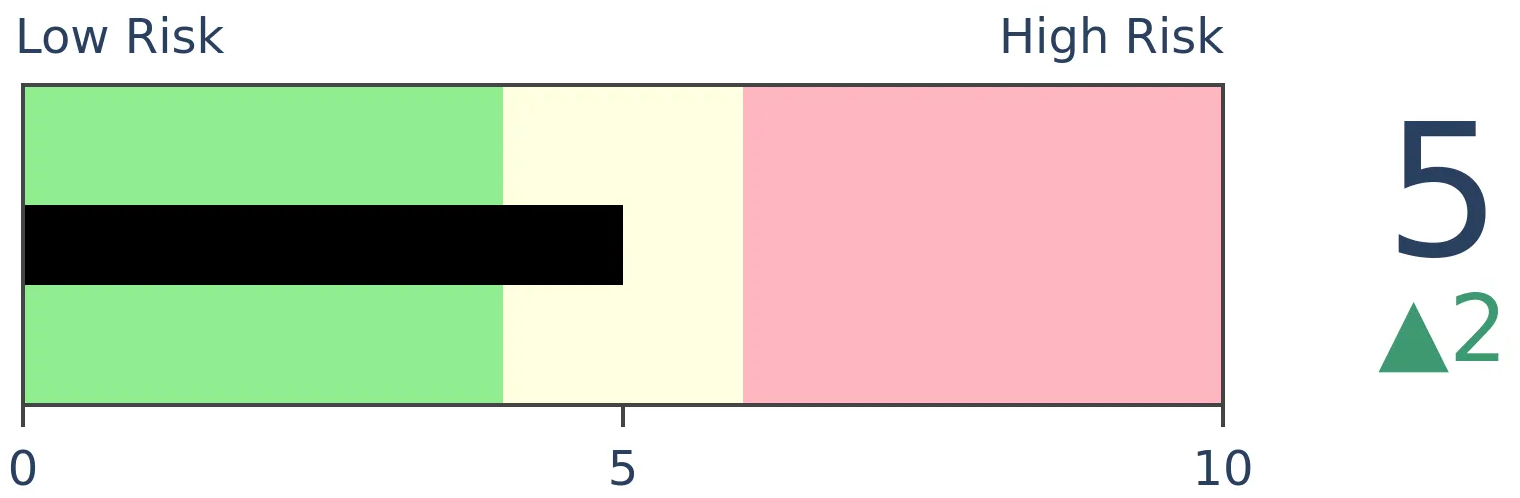
Stocks Medium-Term
|
|
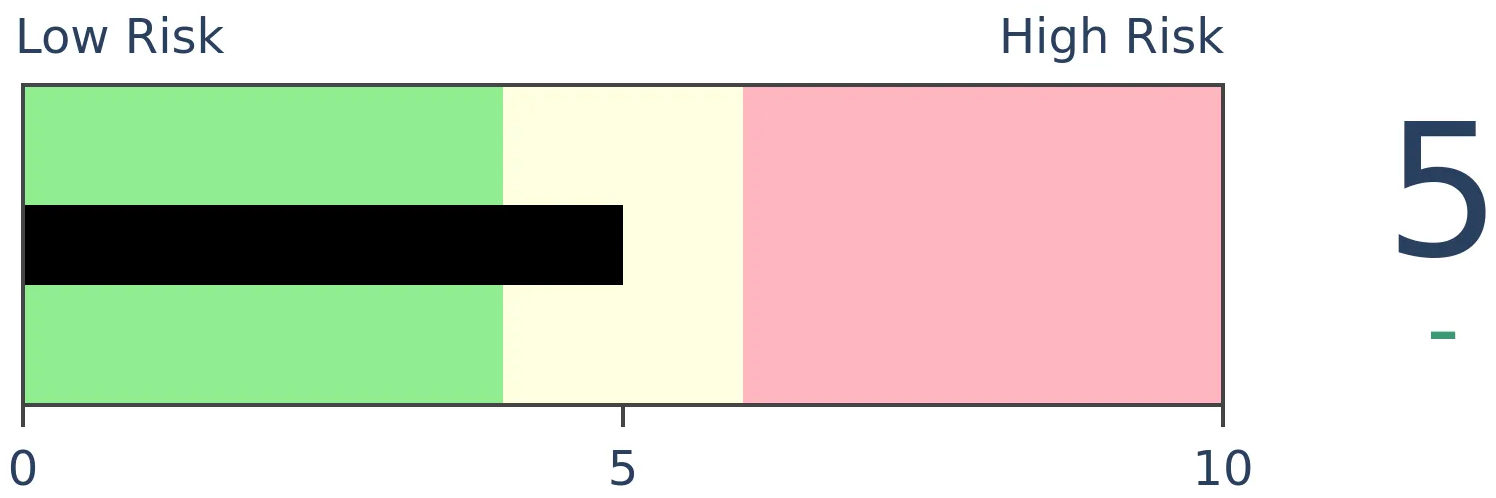
Bonds
|
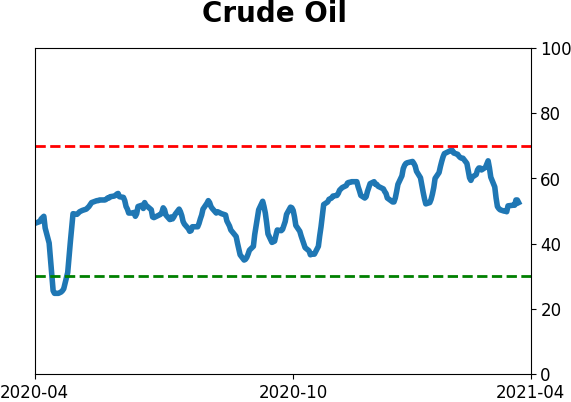
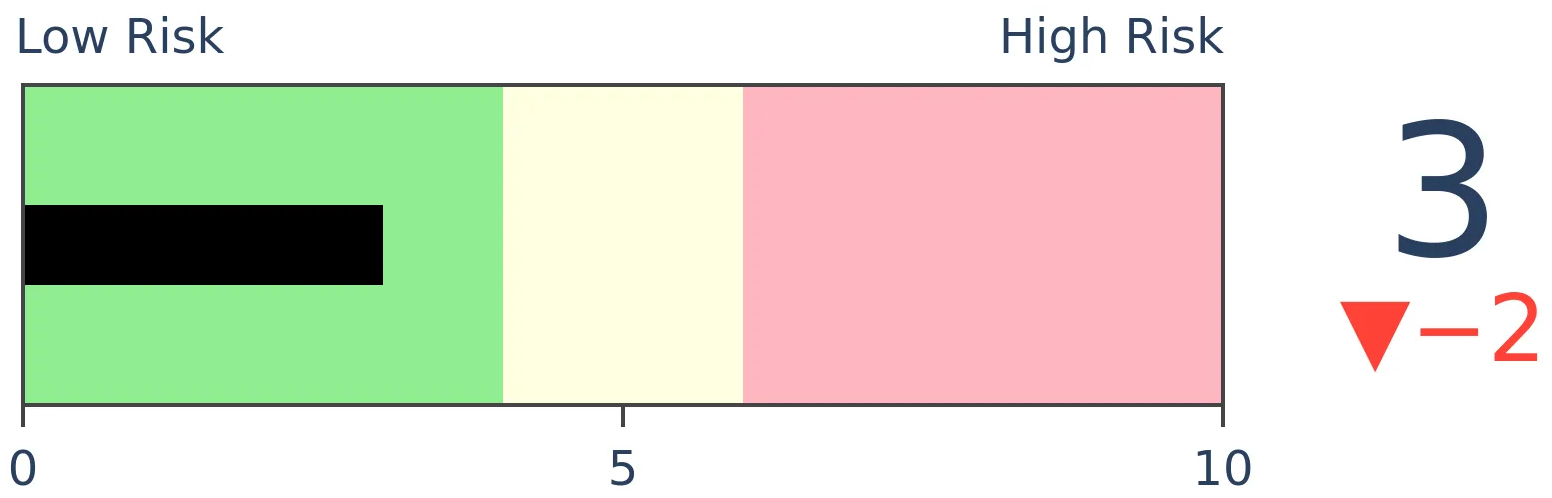
Crude Oil
|
|
Gold
|
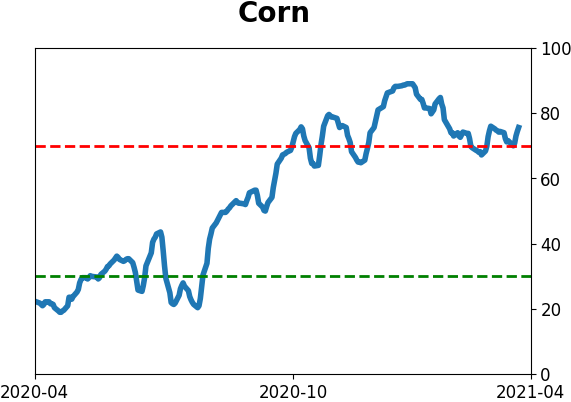
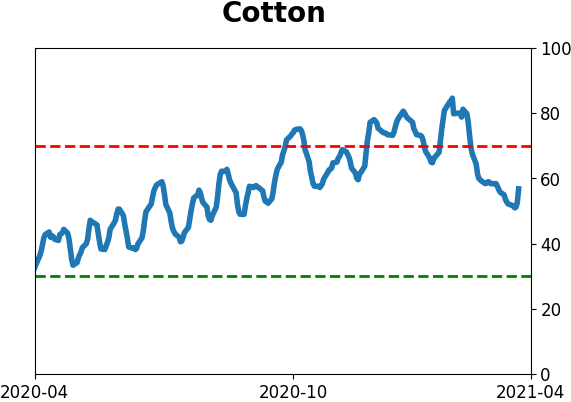
Agriculture
|
|
Research
BOTTOM LINE
With stocks surging again and sitting at new highs, investors have given up on hedging activity, with the Equity Hedging Index falling below 10 for one of the few times in its history.
FORECAST / TIMEFRAME
None
|
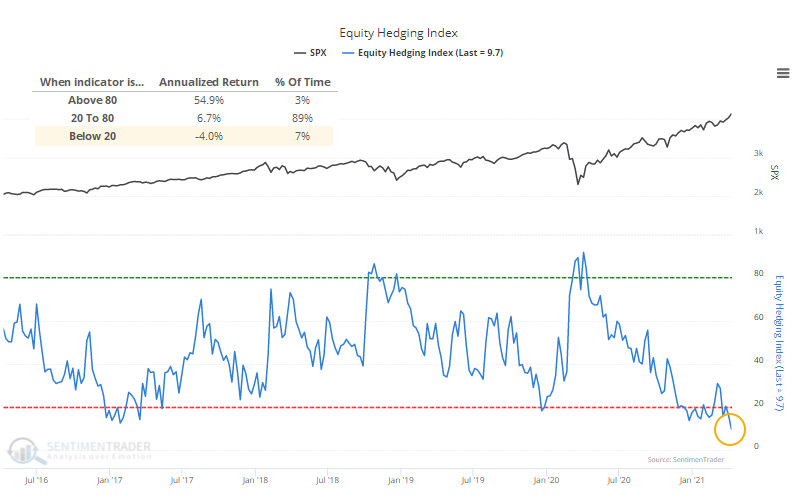
With stocks on a persistent rip higher, what's the point in hedging? Investors seem to be asking themselves that more and more.
Last week, the Equity Hedging Index (EHI) dropped below 10 for one of the few times since we began calculating this nearly 20 years ago.
There are many ways in which an investor can hedge against a stock market decline, such as:
- Raise cash
- Buy put options
- Buy an inverse exchange-traded fund
- Buy an inverse mutual fund
- Sell short a futures contract
- Buy credit default swaps
The Equity Hedging Index looks at each of the factors above and compares the current level to its historical average. The more each indicator shows hedging activity, the higher the Equity Hedging Index will be.
This is a contrary indicator, meaning that the higher the Equity Hedging Index is, the more likely stocks will rally going forward; the lower the Equity Hedging Index, the less likely stocks will rally, which we can see from the annualized returns in the chart below.
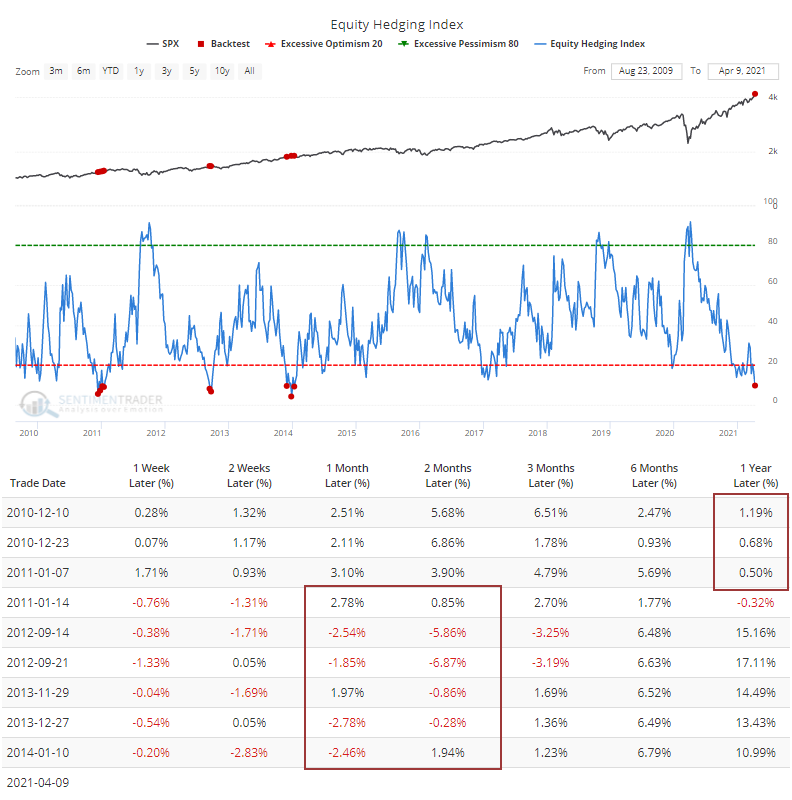
In that entire history, there have been only 9 other weeks with an EHI as low as this according to the Backtest Engine. All of them preceded weak medium- to long-term returns.
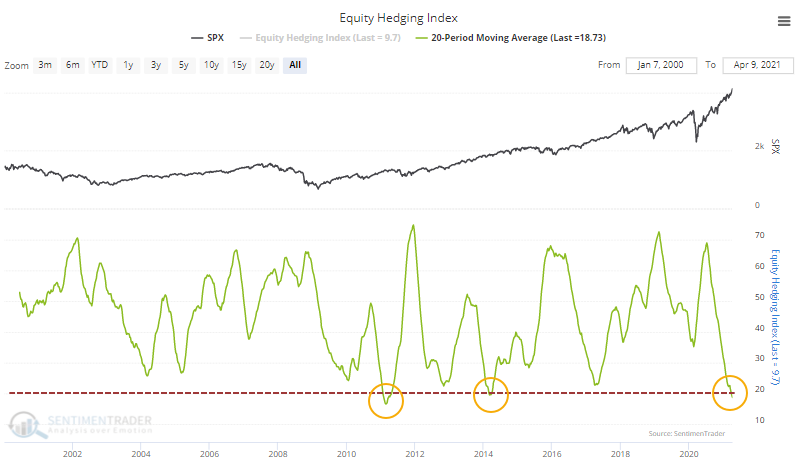
This comes after months of only sporadic bouts of interest in any kind of hedging activity. Which has been a good thing for investors, since hedges have only served to be a drag on returns. The 20-week average of the EHI has dropped below 20 for only the 3rd time ever.
Dean showed late last week that individual stocks are showing impressive resilience, with more than 90% of S&P 500 components holding above their 50-day moving averages, a fairly unique situation with the S&P itself moving to a 52-week high. That didn't prevent some double-digit declines following other signals, but that certainly wasn't the base case.
Last week, we saw the highly unusual - perhaps unprecedented - situation of massively positive medium- to long-term breadth thrusts not just among individual stocks, but also industries, sectors, and global indexes. This is happening despite many warnings from extended sentiment readings like the Equity Hedging Index. We've never really seen such a large and protracted tension like this, with the suggestion continuing to be that it's risky for late buyers, and also risky to bet against the momentum.
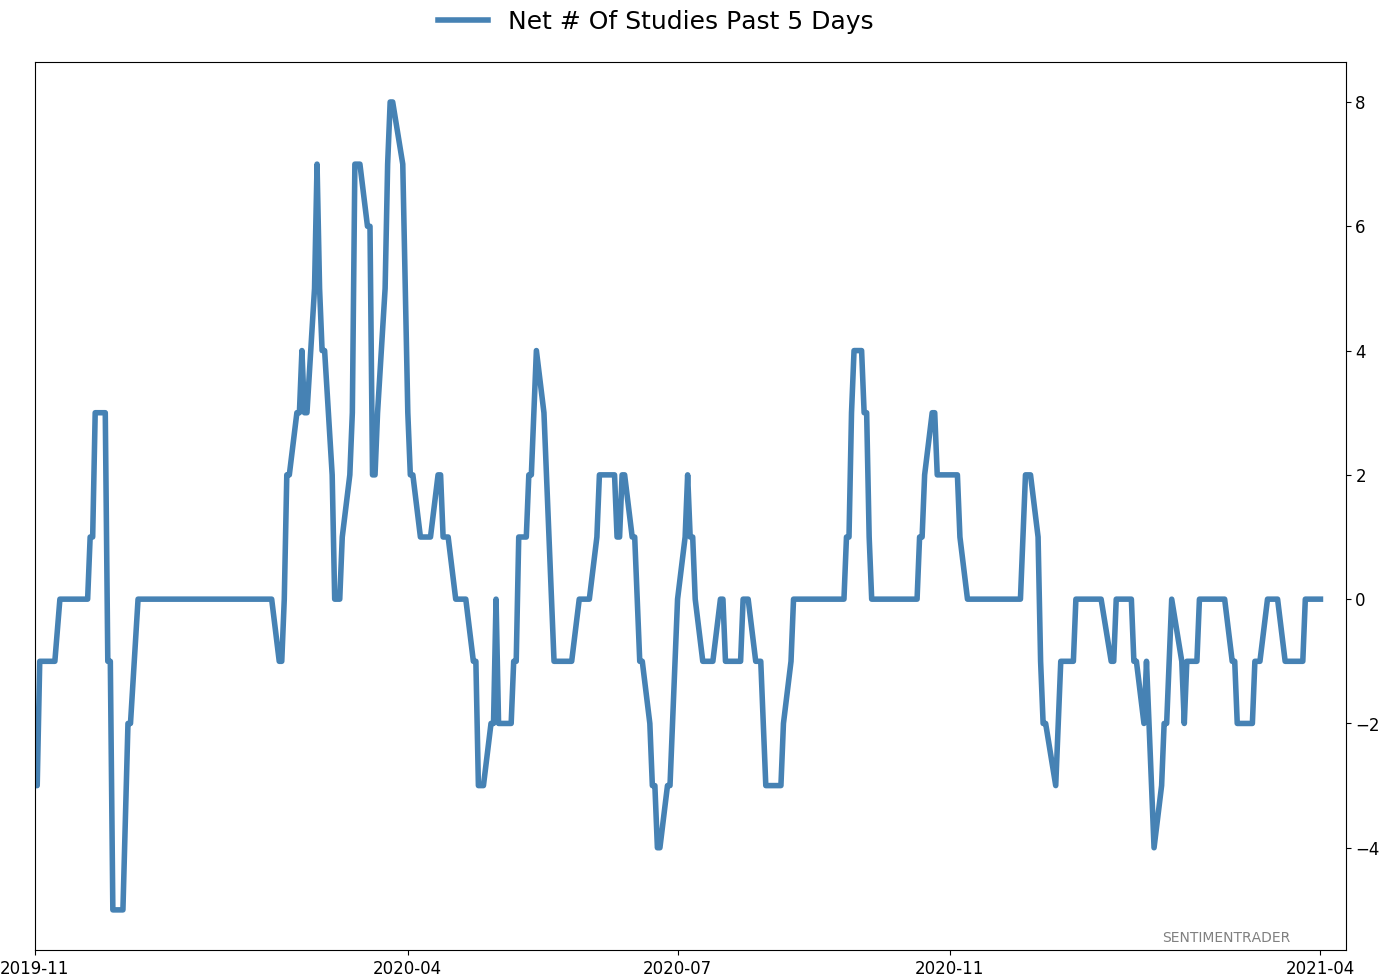
Active Studies
| Time Frame | Bullish | Bearish | | Short-Term | 0 | 0 | | Medium-Term | 0 | 10 | | Long-Term | 11 | 4 |
|
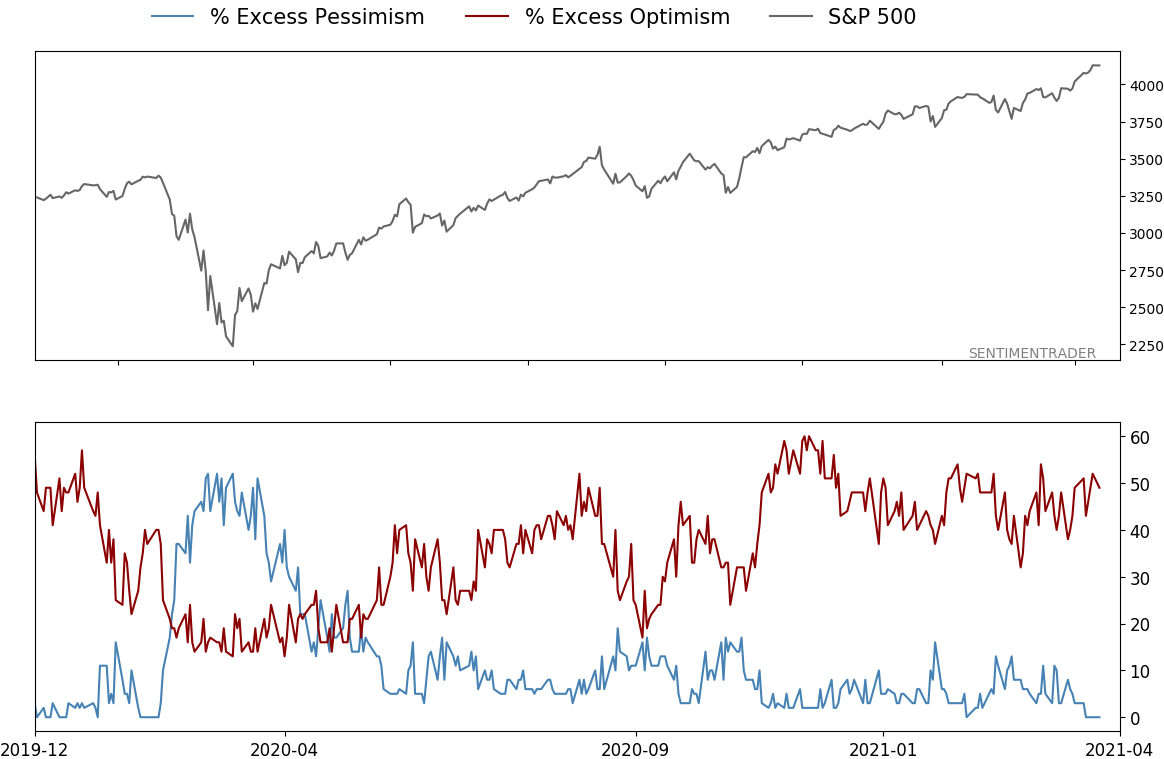
Indicators at Extremes
|
% Showing Pessimism: 0%
Bullish for Stocks
|
|
Portfolio
| Position | Description | Weight % | Added / Reduced | Date | | Stocks | RSP | 4.9 | Reduced 4% | 2021-02-09 | | Bonds | 30.0% BND, 8.8% SCHP | 38.8 | Added 15.1% | 2021-02-18 | | Commodities | GCC | 2.3 | Reduced 2.1%
| 2020-09-04 | | Precious Metals | GDX | 9.0 | Added 0.1% | 2021-02-18 | | Special Situations | 7.3% XLE, 4.8% PSCE | 12.1 | Reduced 5.6% | 2021-02-18 | | Cash | | 32.8 | | |
|
Updates (Changes made today are underlined)
With a market that has seen the kinds of broad participation and big breath thrusts like we did in the fall, it's hard to become too negative. Those kinds of conditions have consistently preceded higher returns over the next 6-12 months. It's the interim that's more of an issue. Even conditions like that haven't prevented some shorter-term pullbacks. And when we combine an environment where speculation is rampant and recent days have seen an increase in cracks under the surface of the indexes, it's enough to become more defensive over a short- to medium-term time frame. We still don't have much confirmation from the price action in the indexes, so those who are more conservative would likely wait before increasing cash levels. I've decreased risk exposure a bit more, mainly in terms of energy stocks and the ANGL fund, while adding more to the broader bond market. RETURN YTD: 6.1% 2020: 8.1%, 2019: 12.6%, 2018: 0.6%, 2017: 3.8%, 2016: 17.1%, 2015: 9.2%, 2014: 14.5%, 2013: 2.2%, 2012: 10.8%, 2011: 16.5%, 2010: 15.3%, 2009: 23.9%, 2008: 16.2%, 2007: 7.8%
|
|
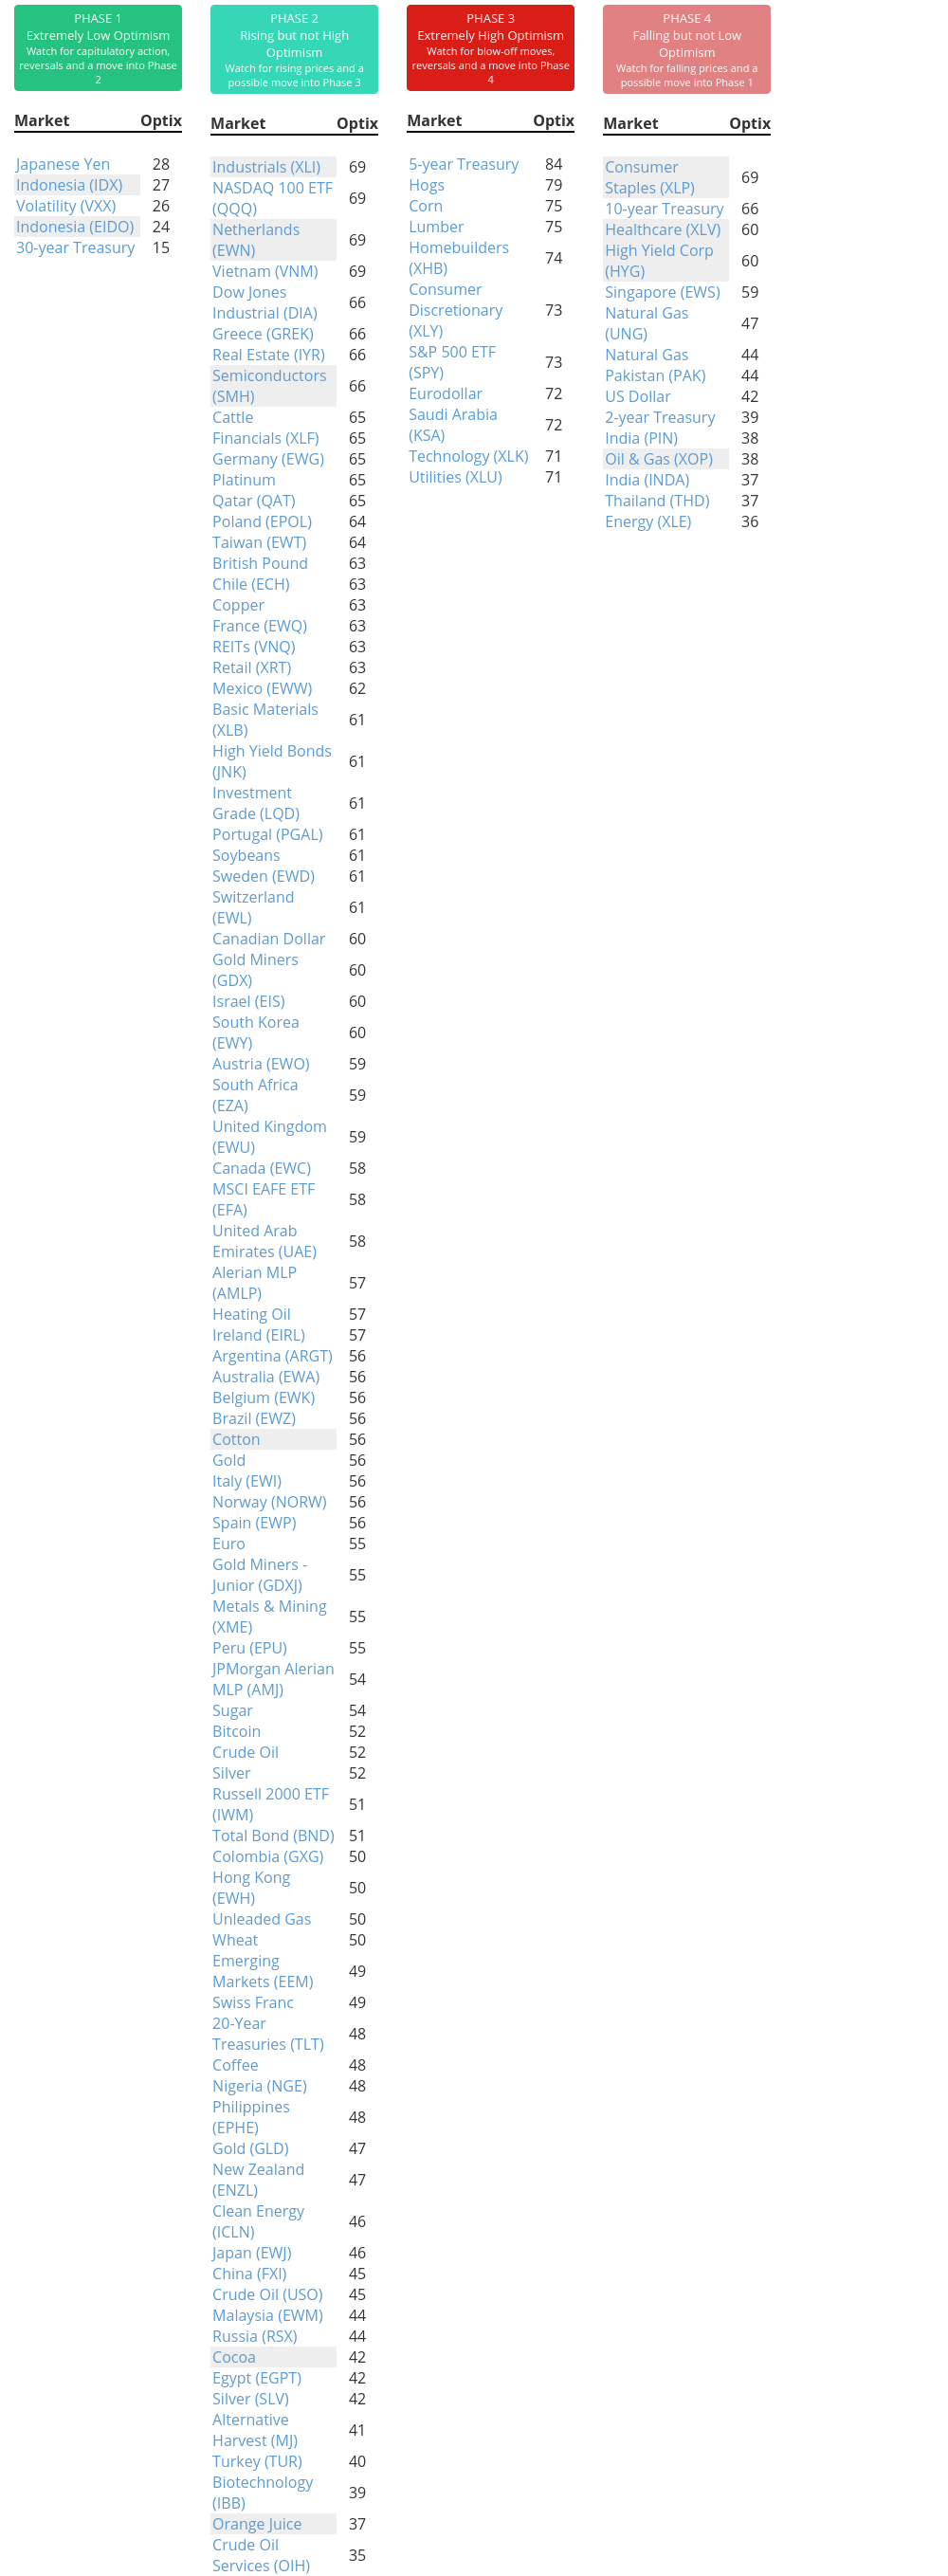
Phase Table
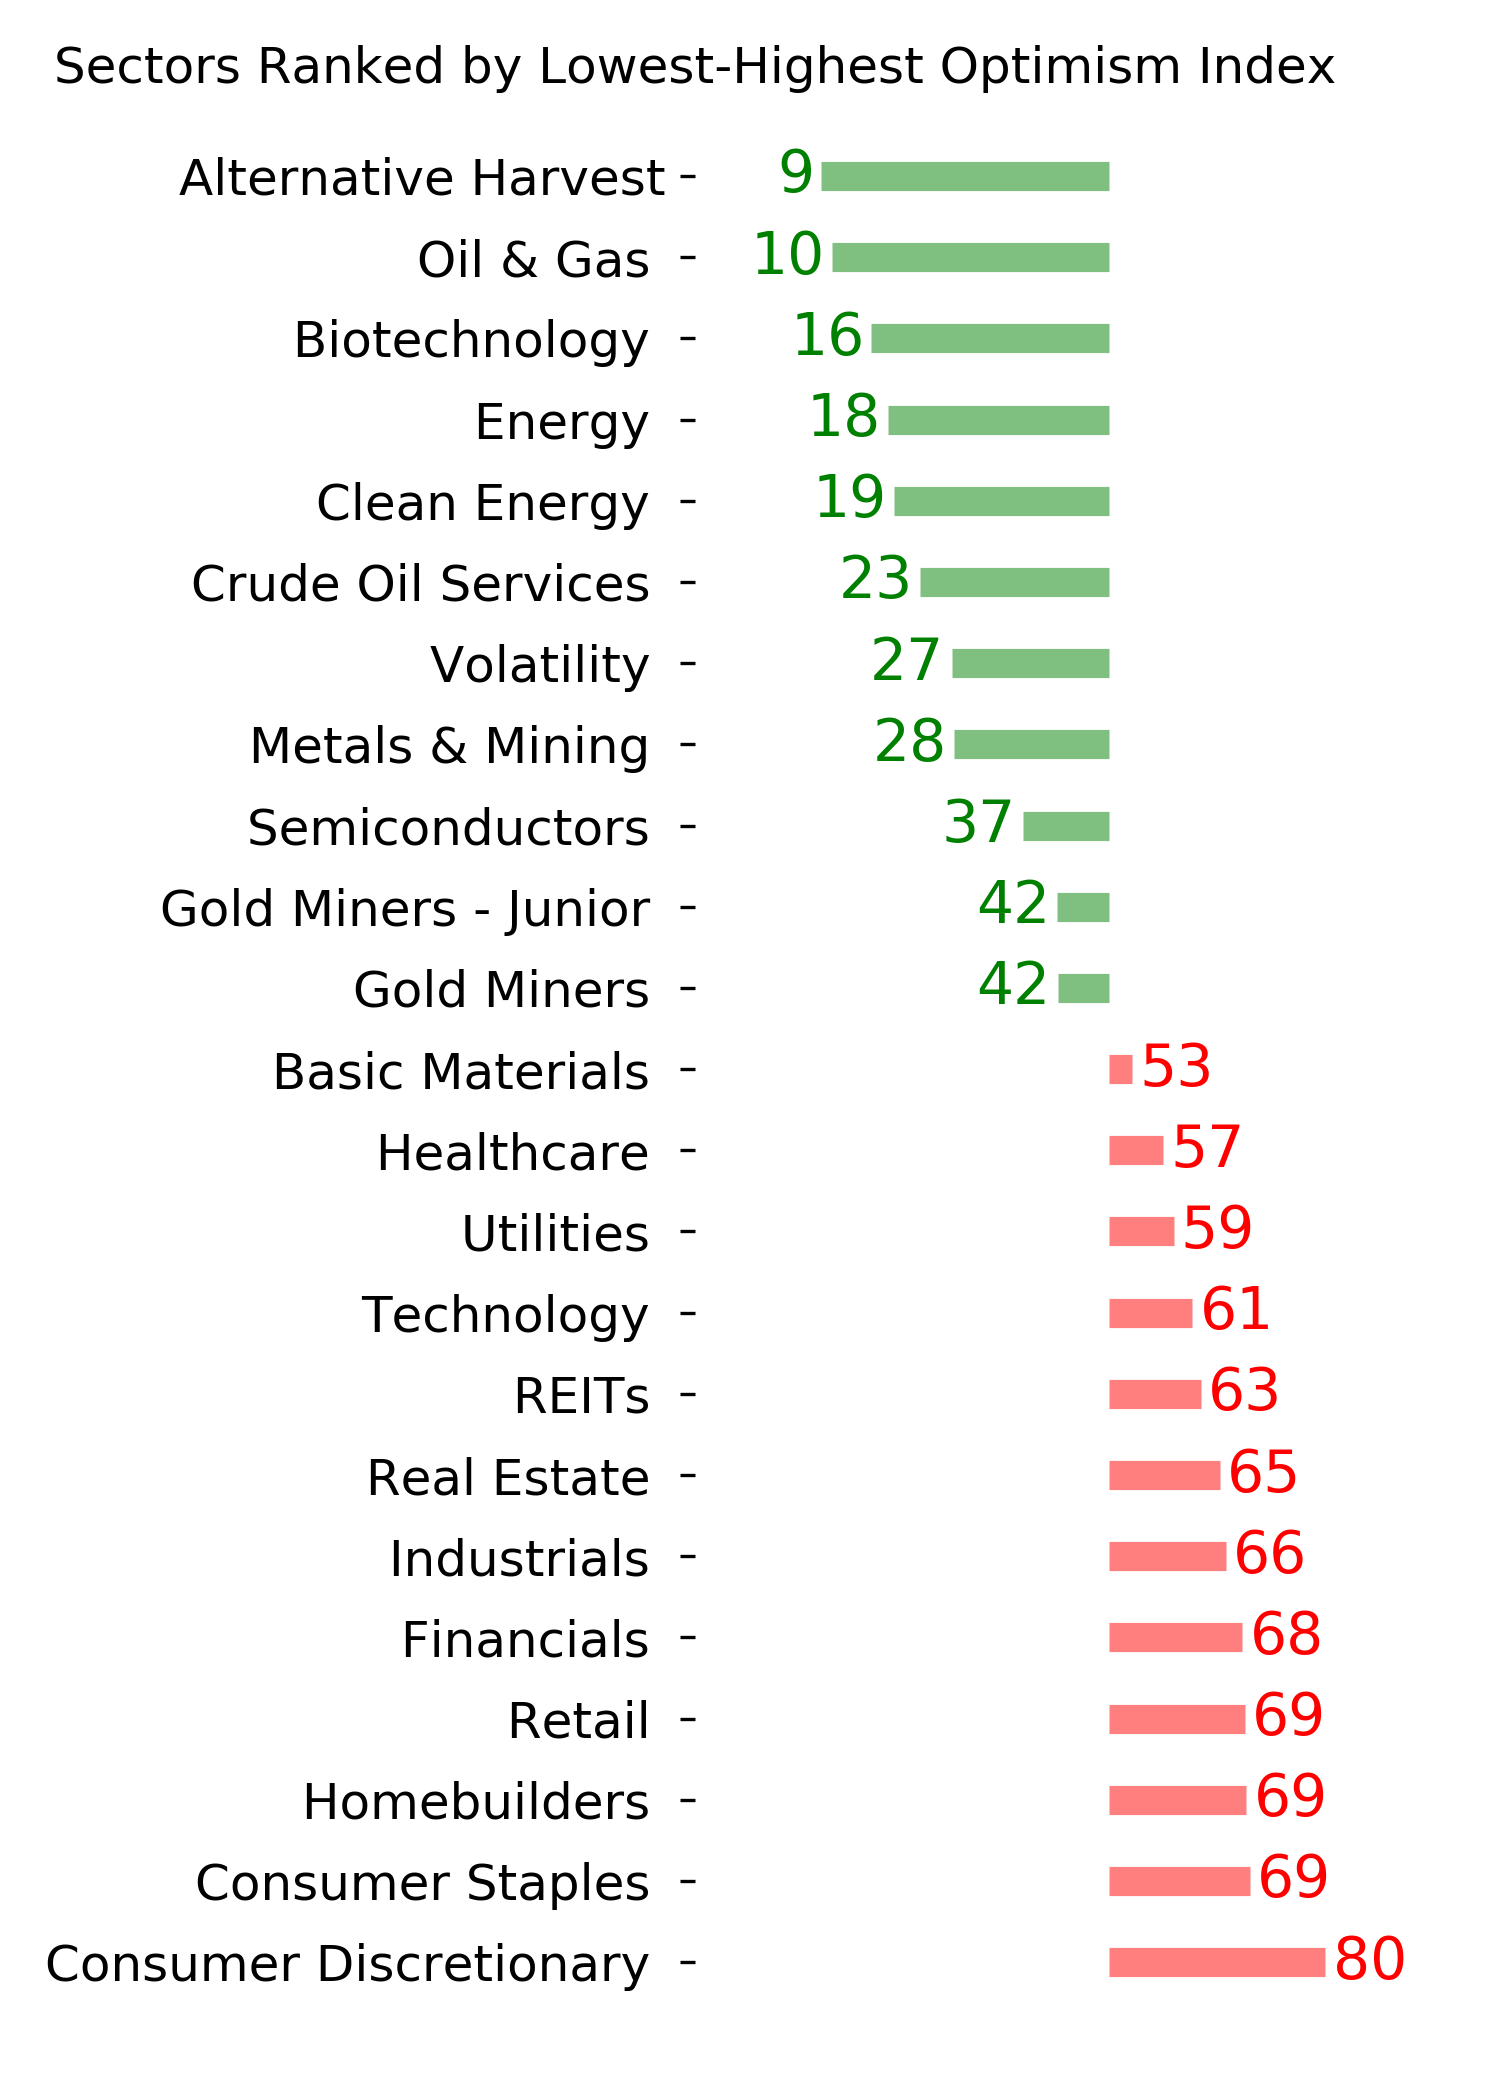
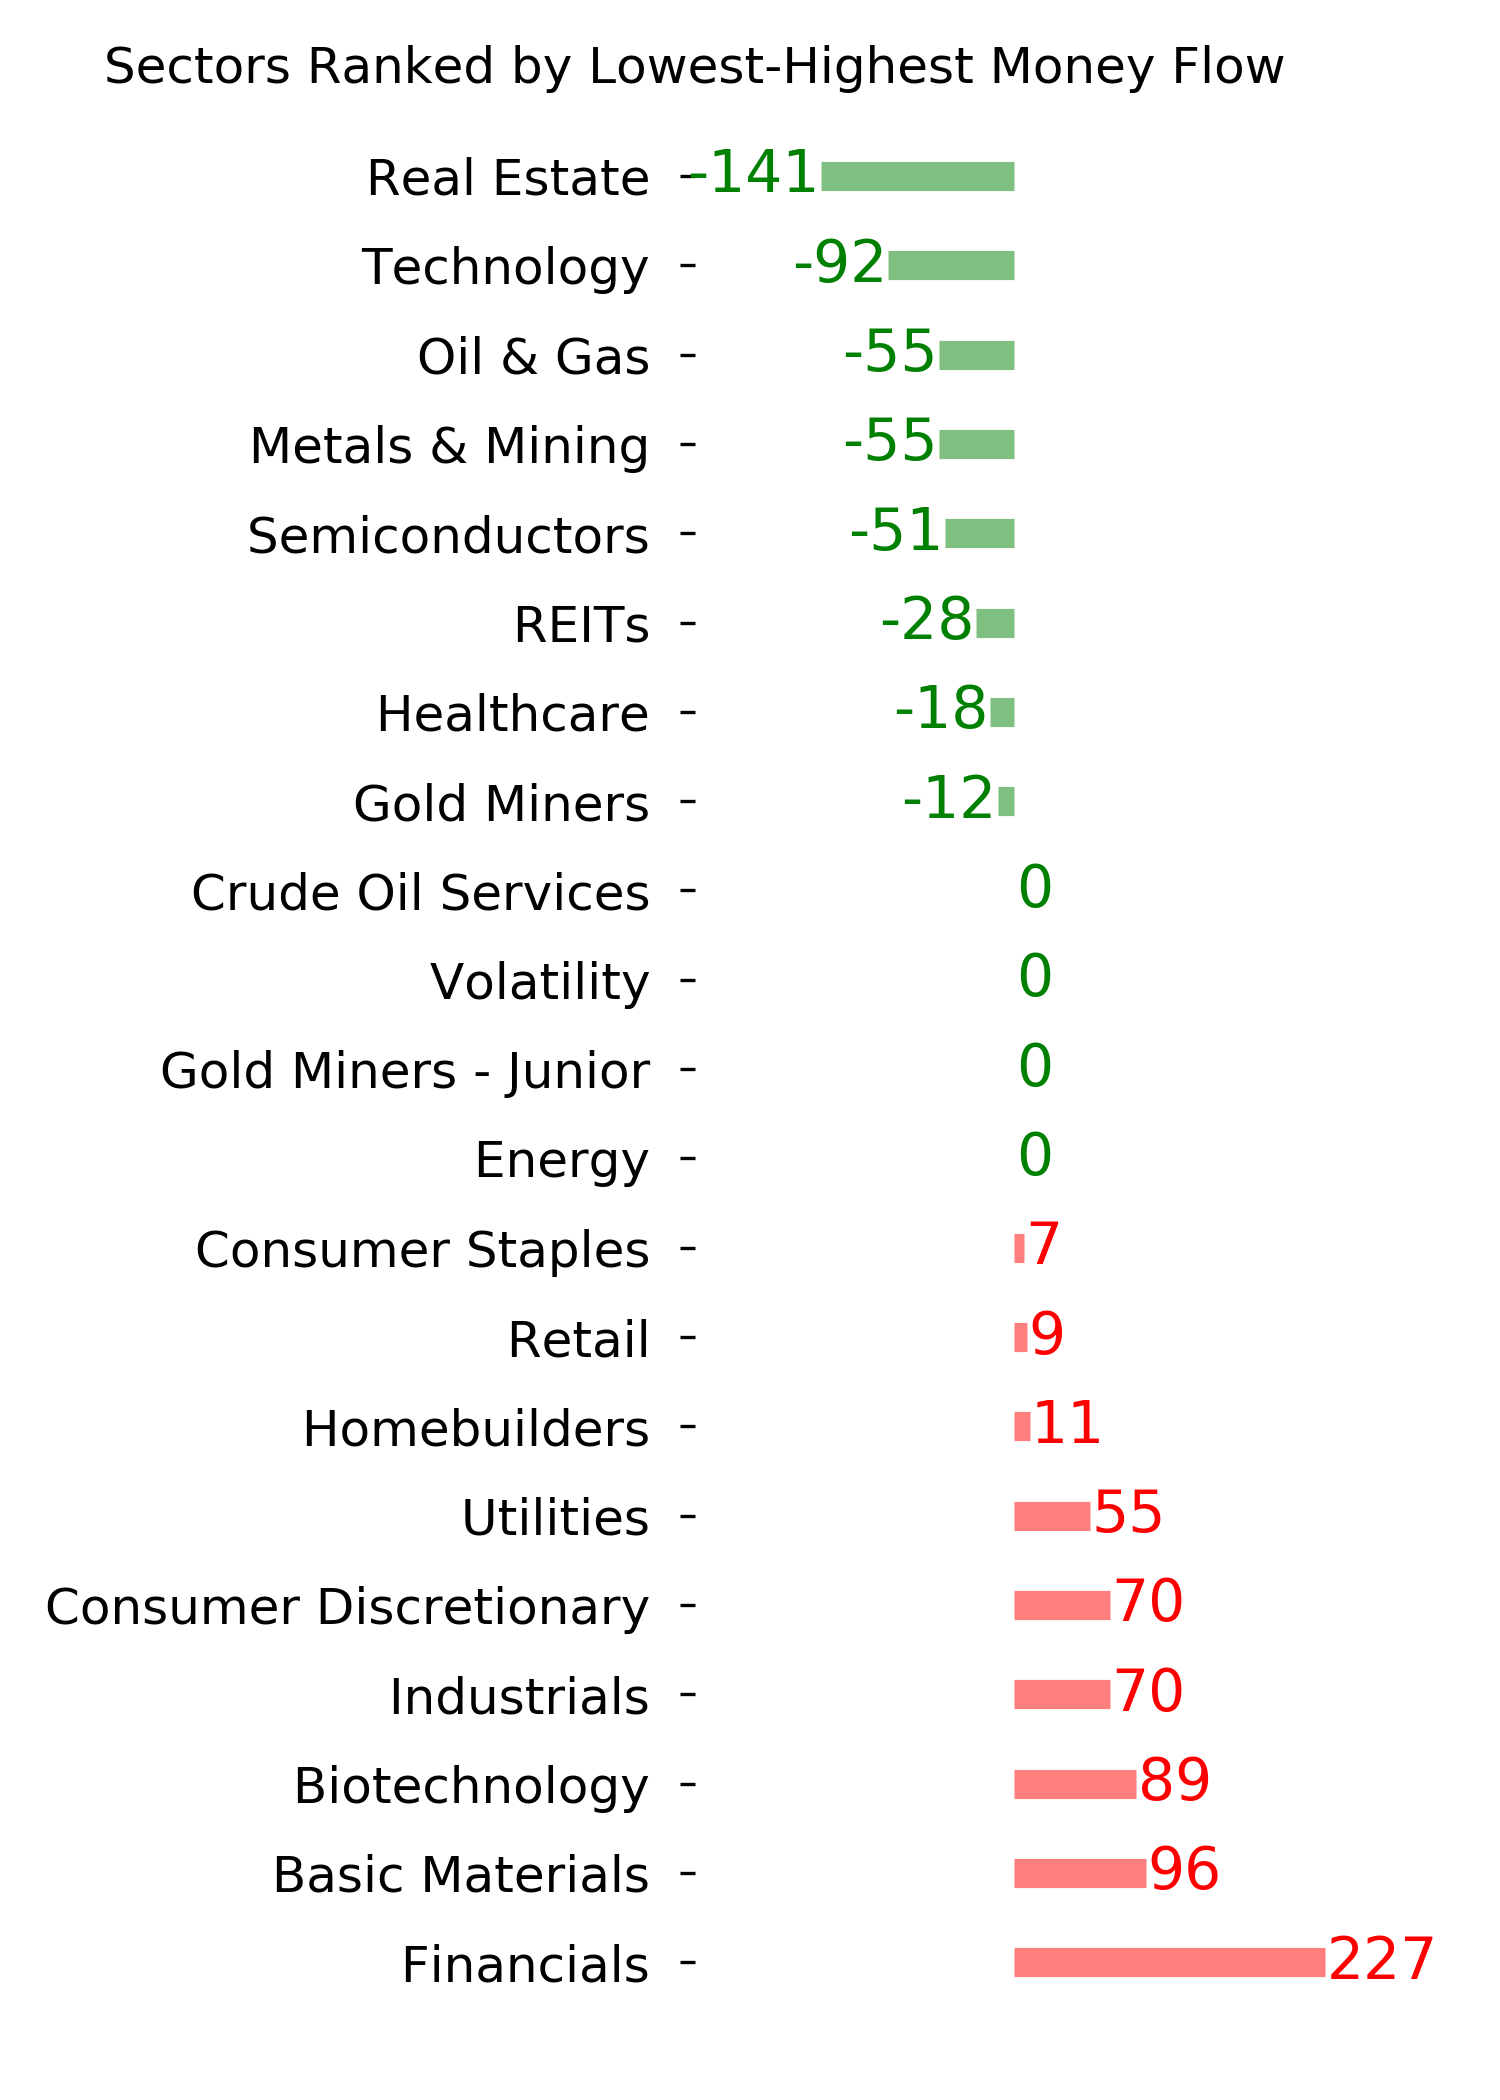
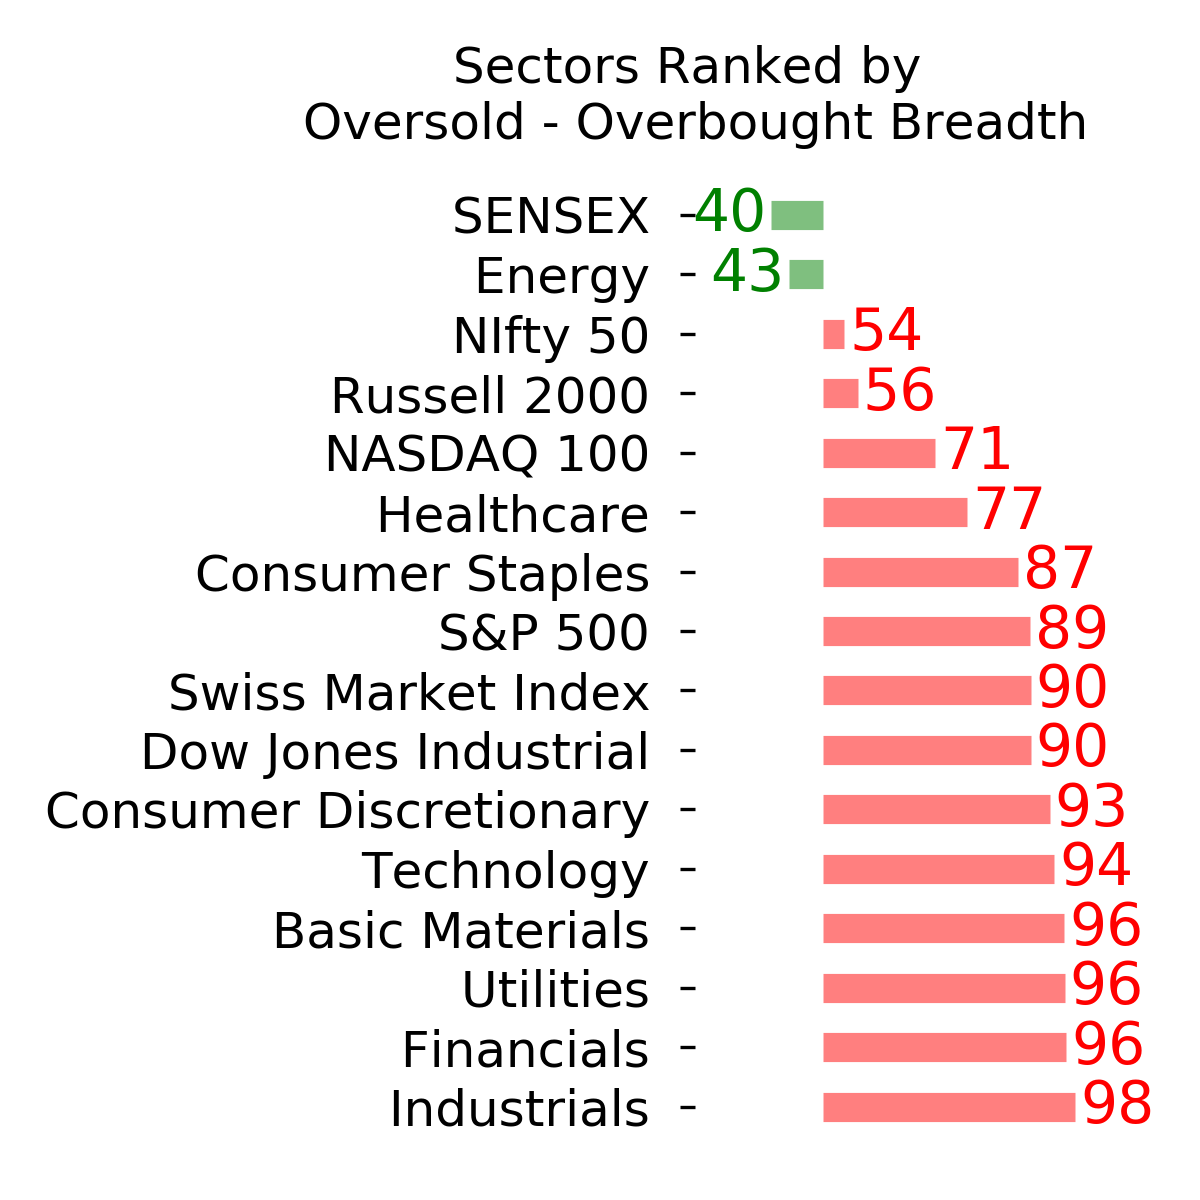
Ranks
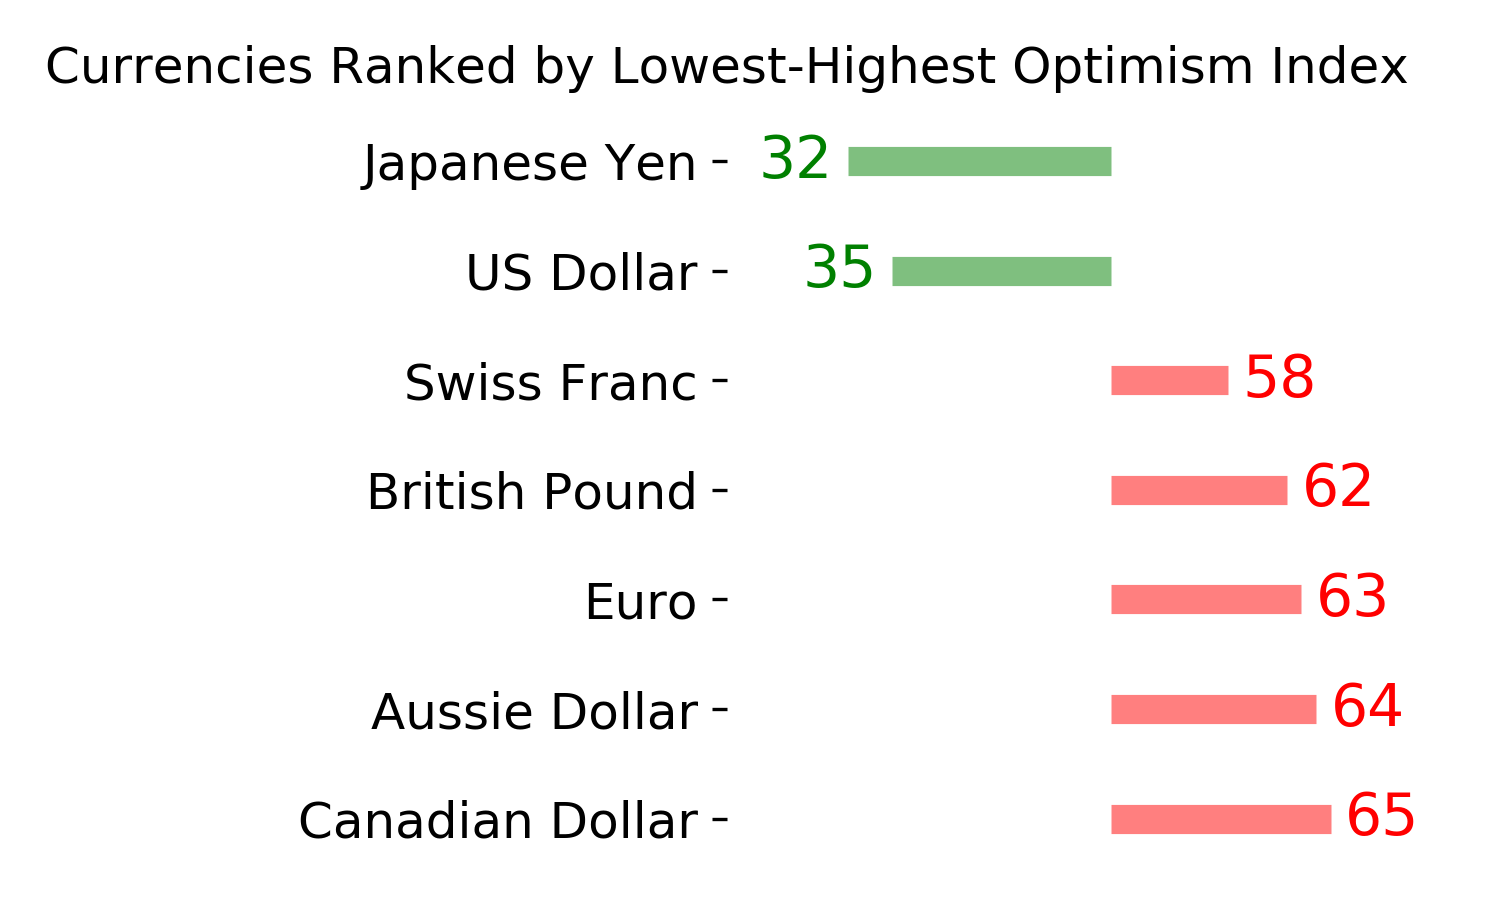
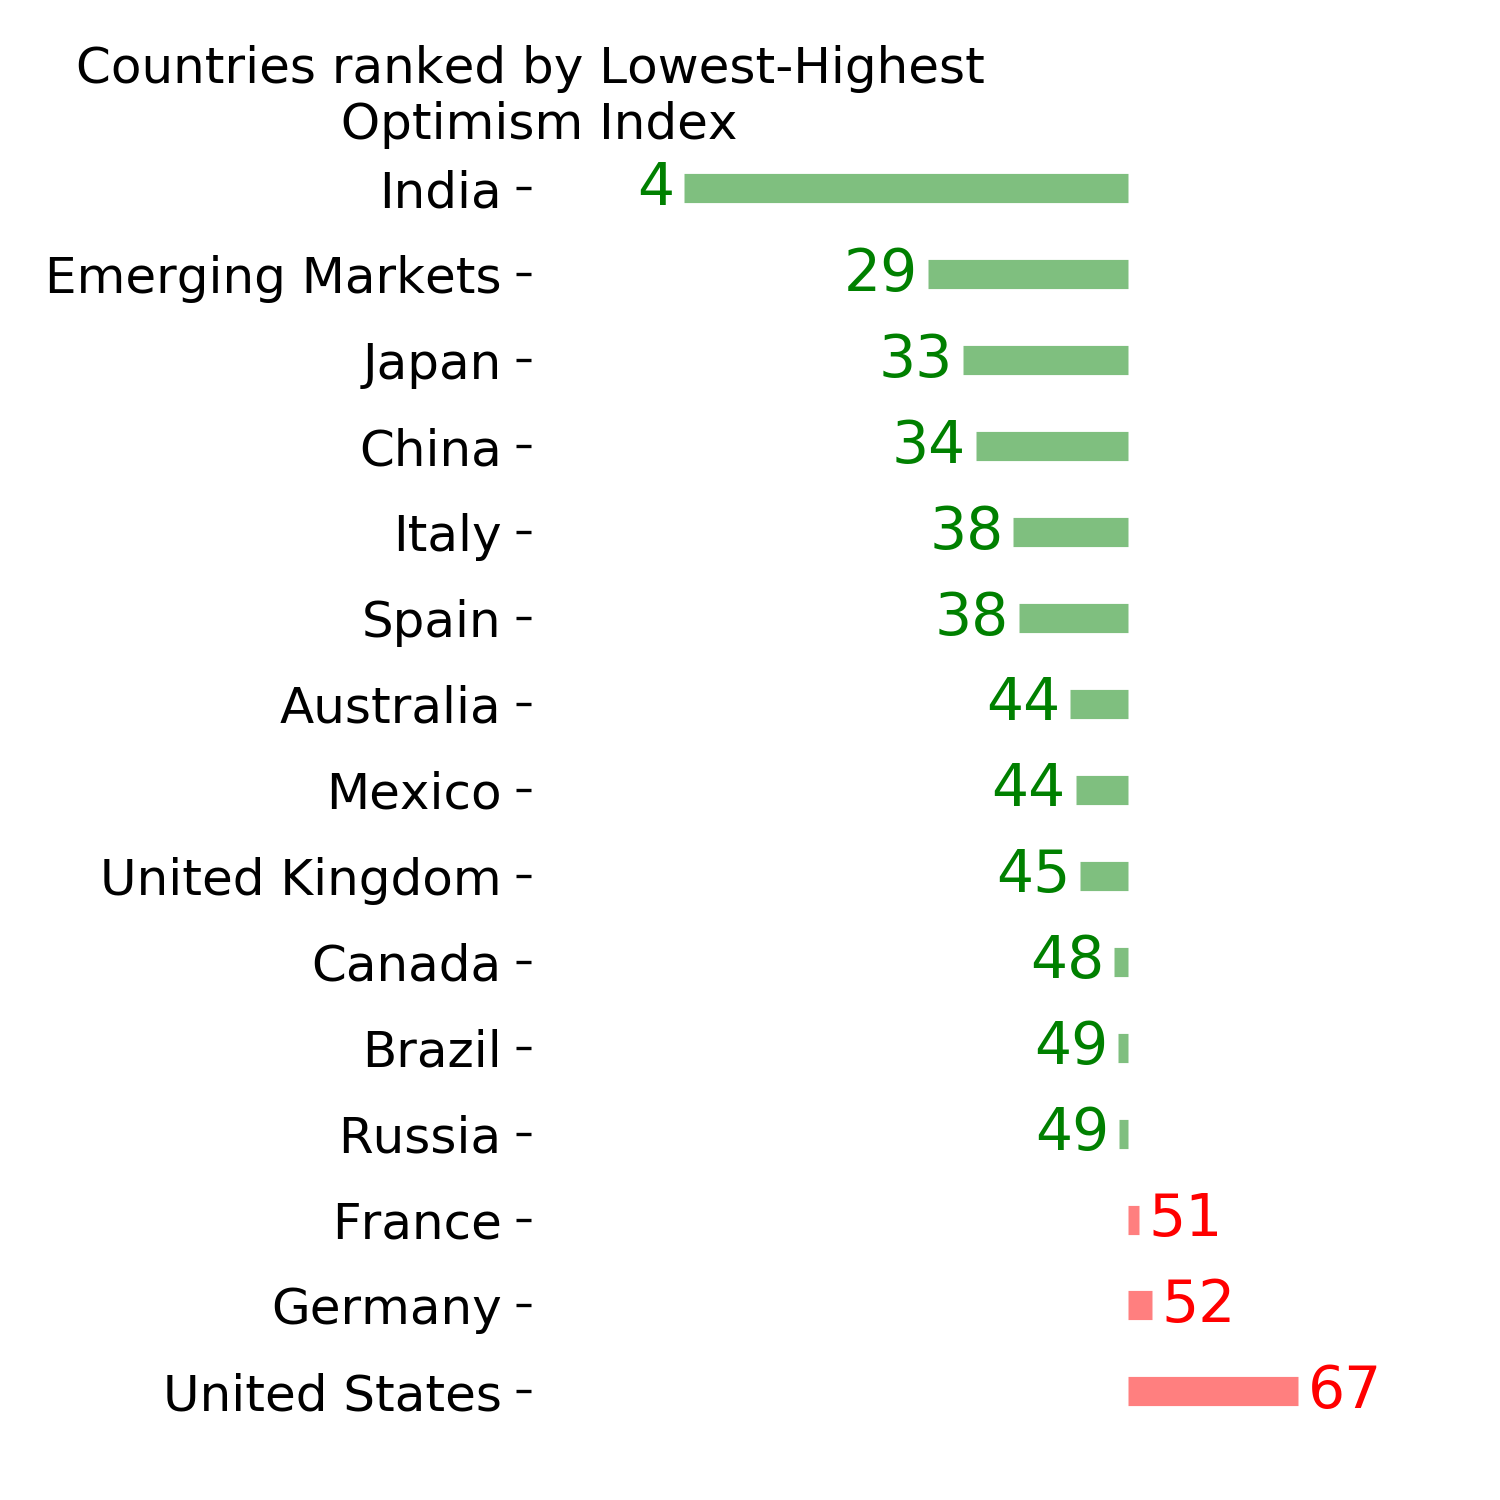
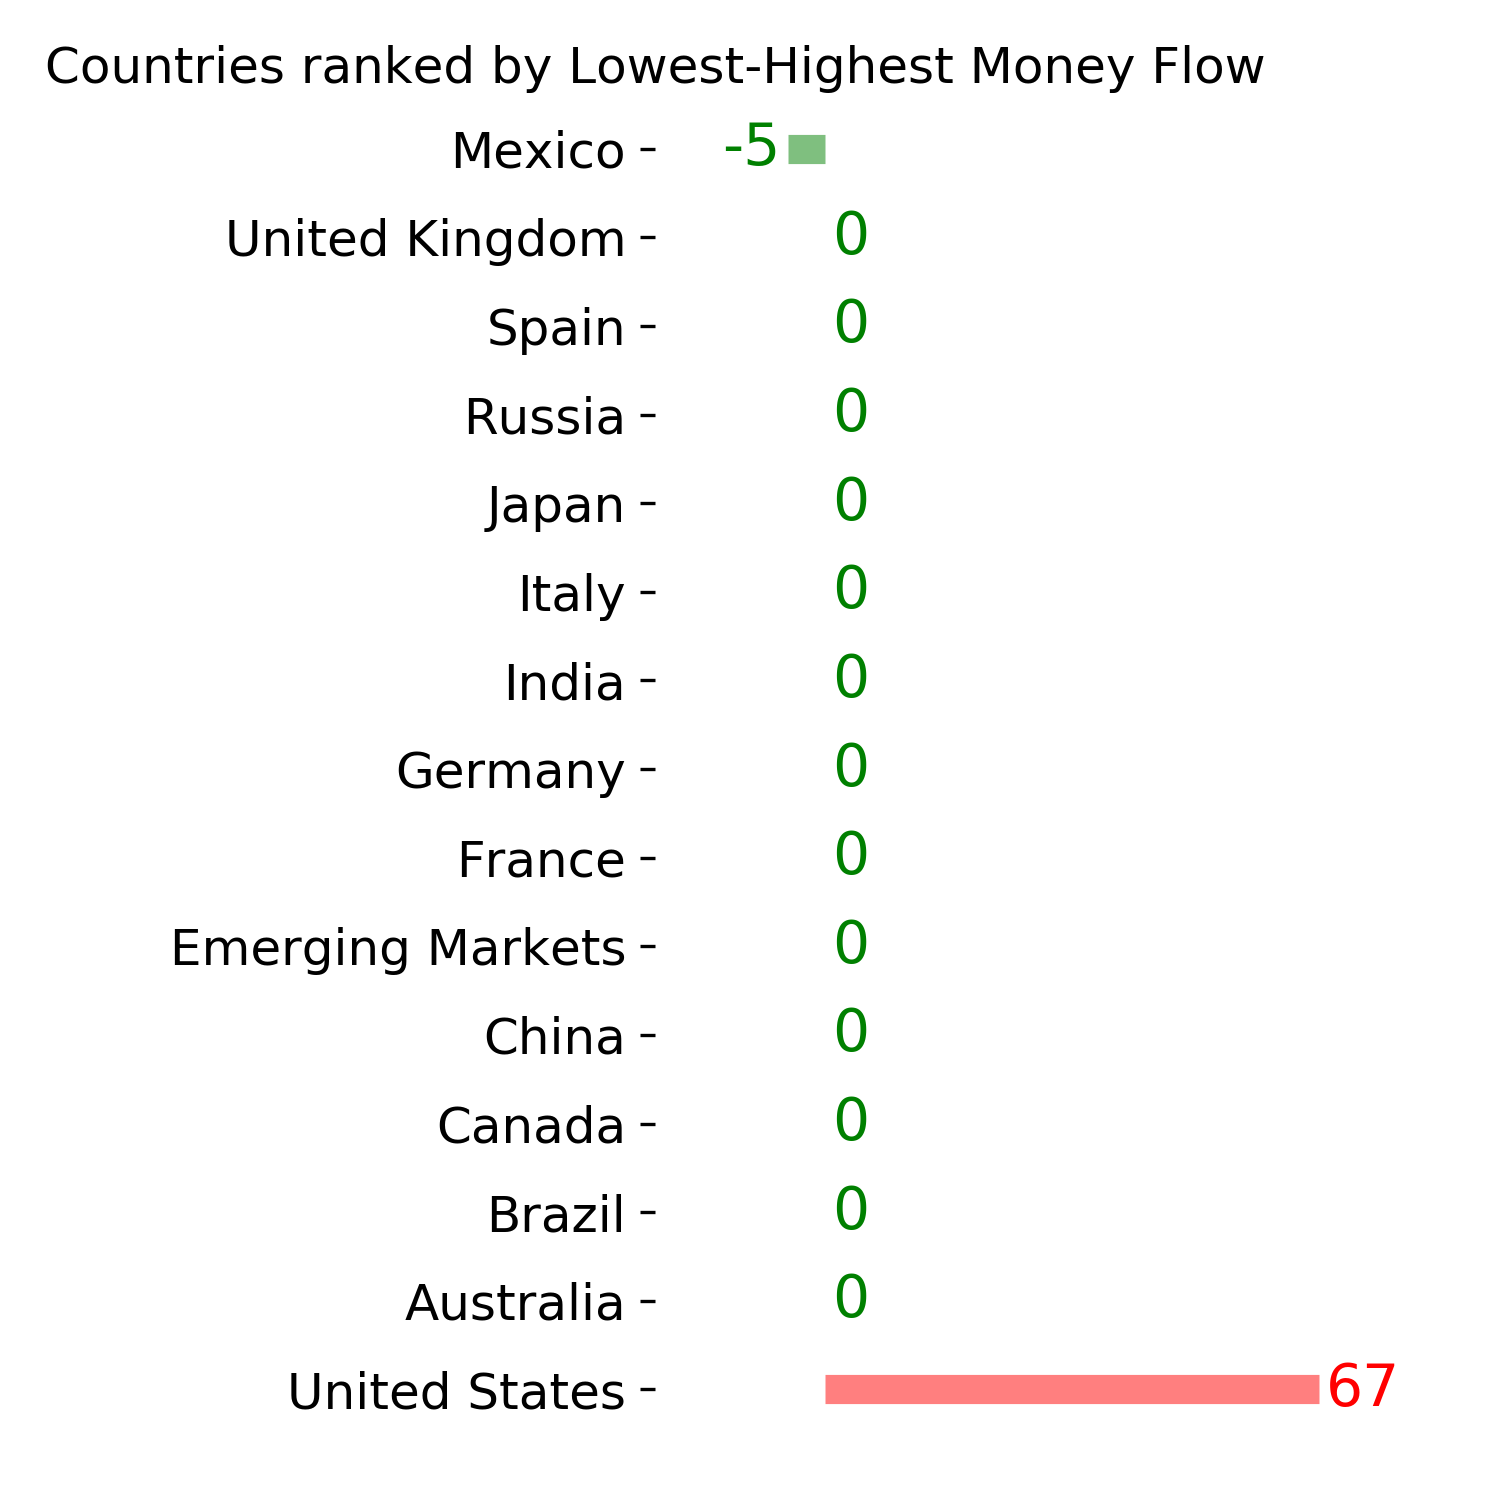
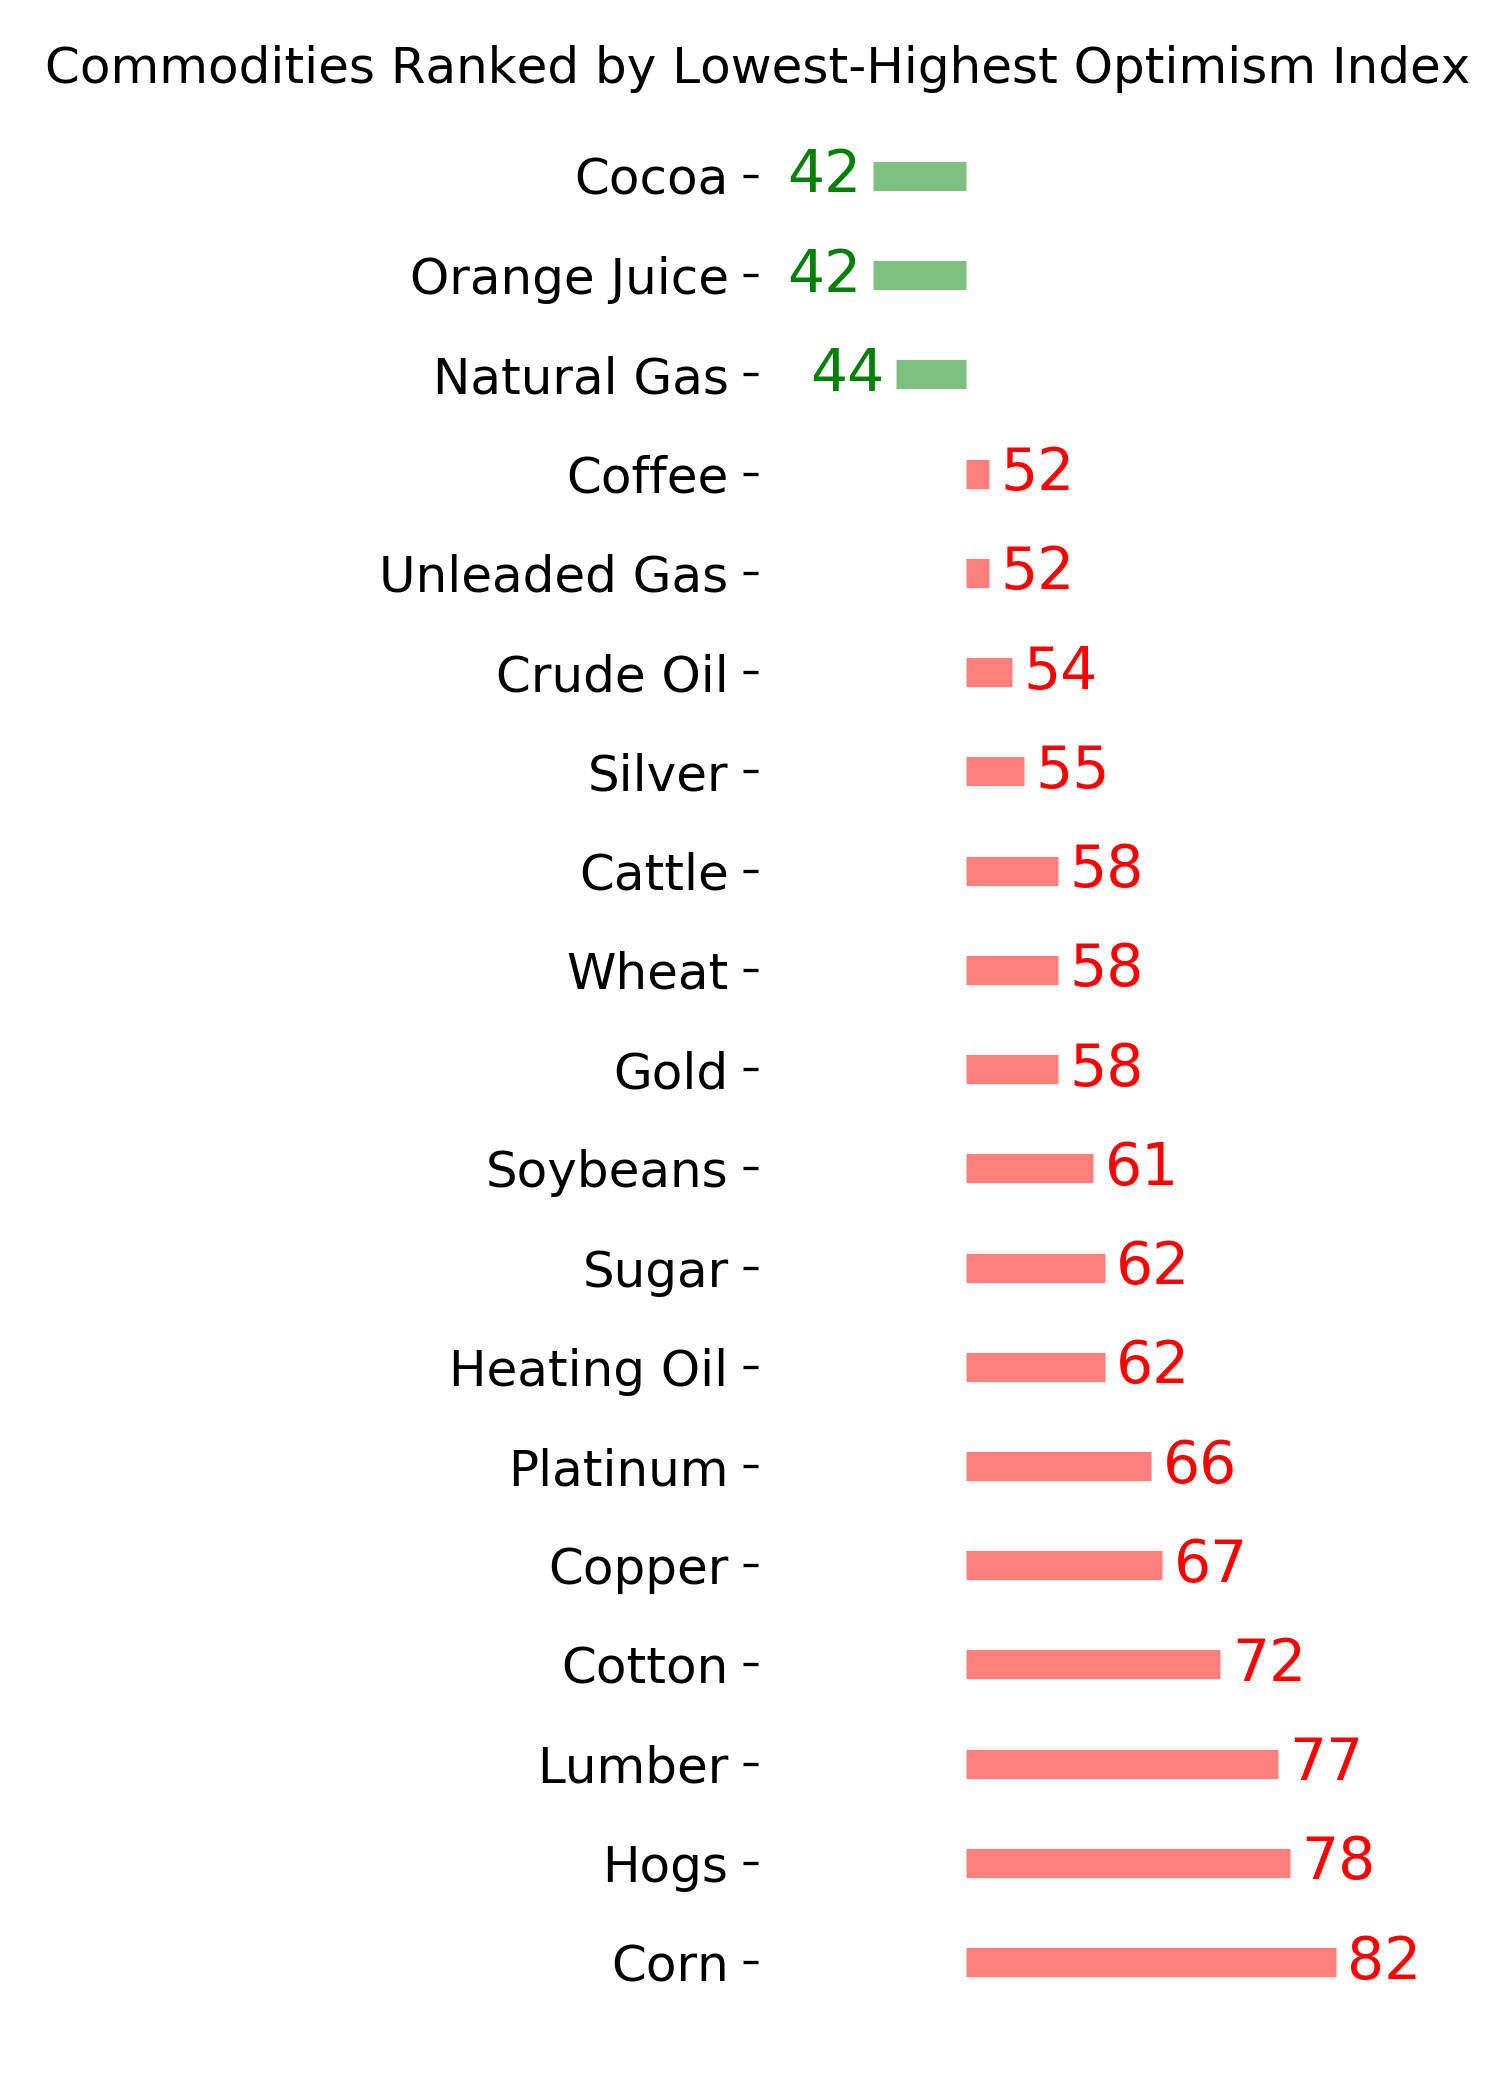
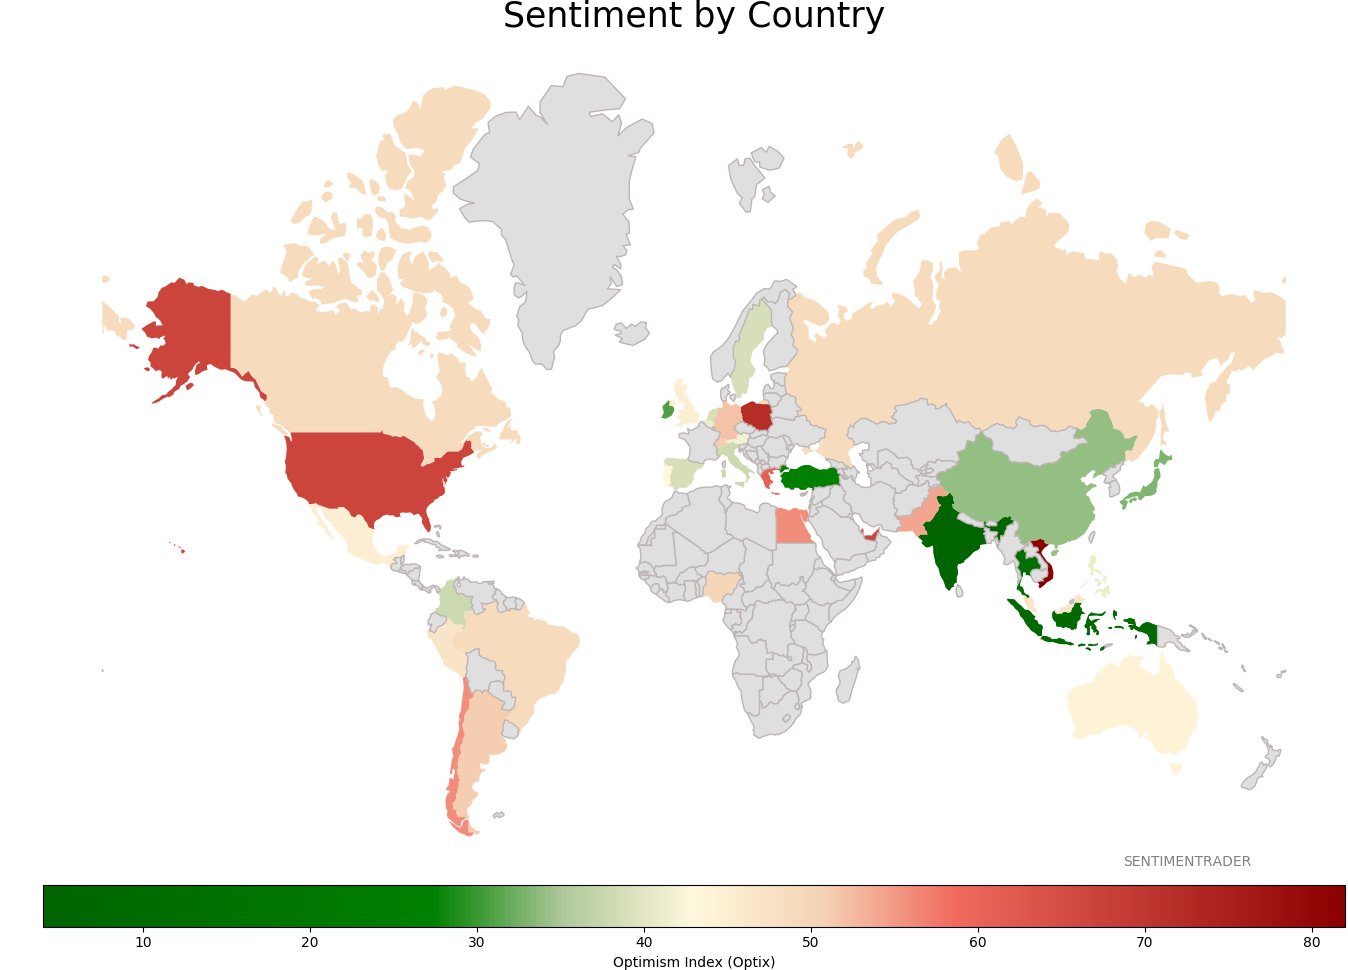
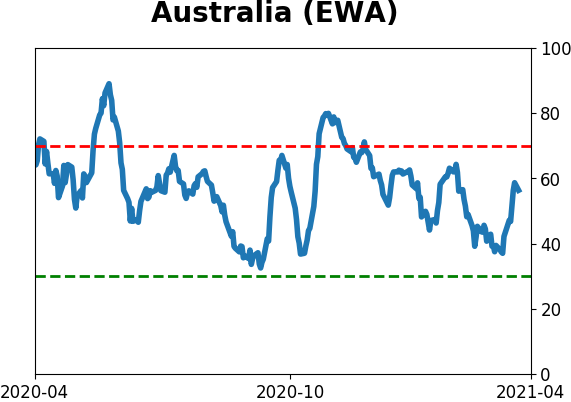
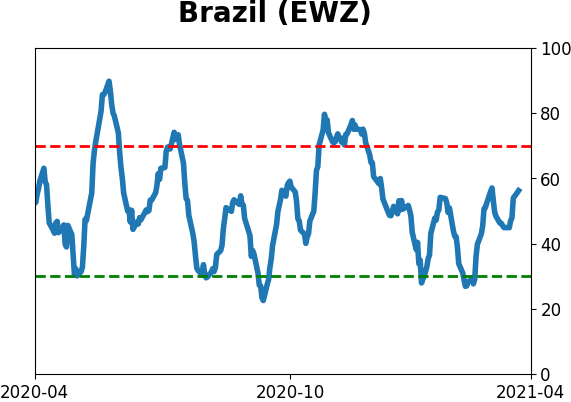
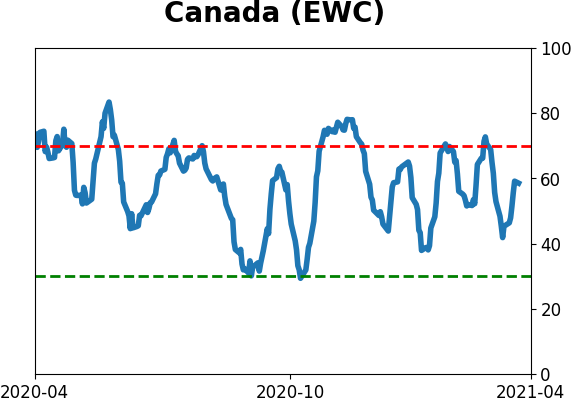
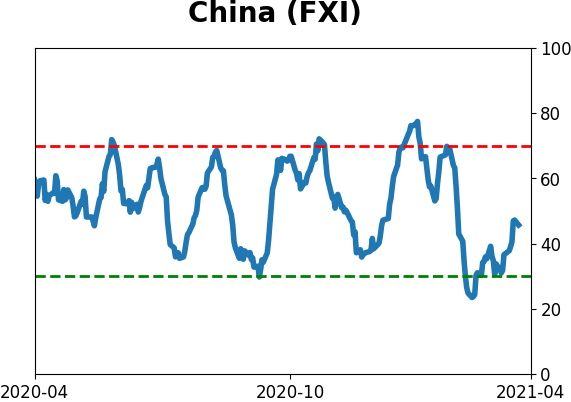
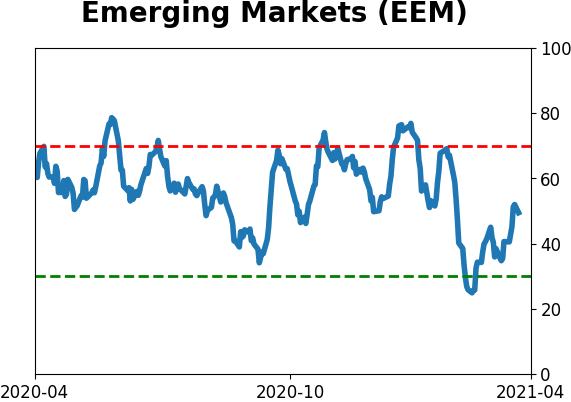
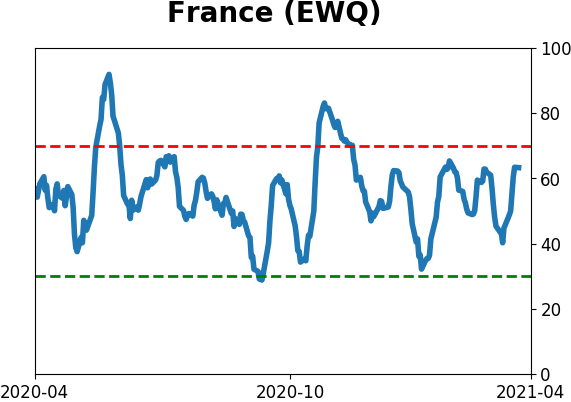
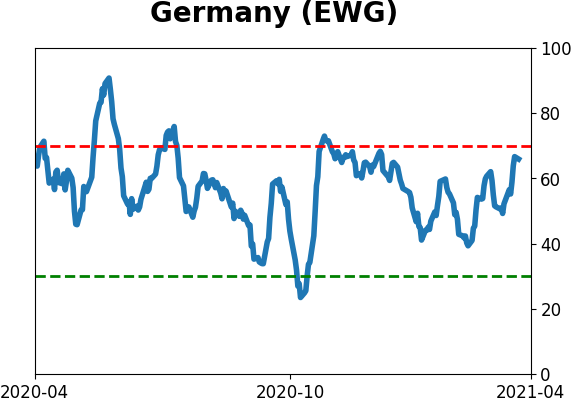
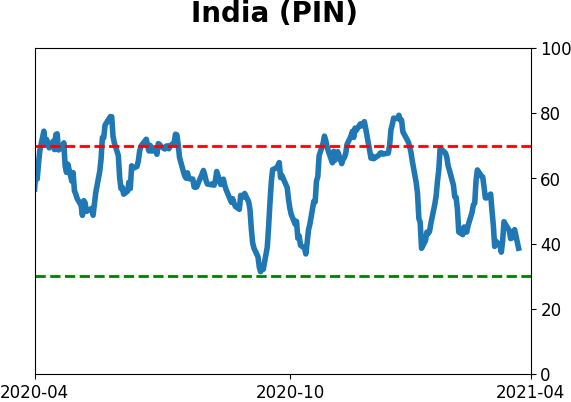
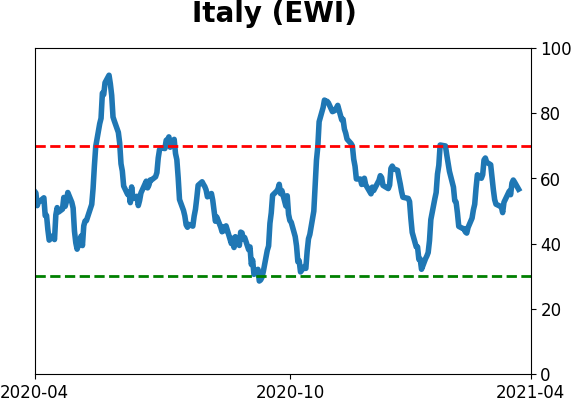
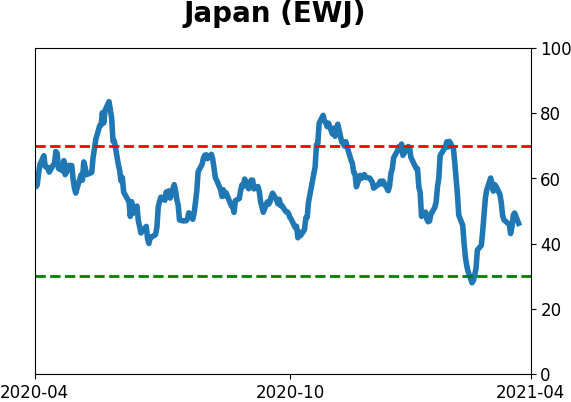
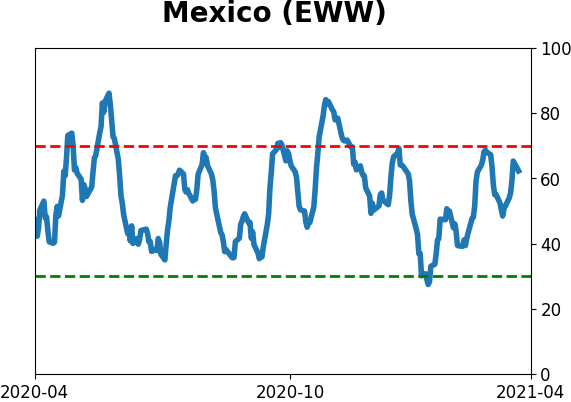
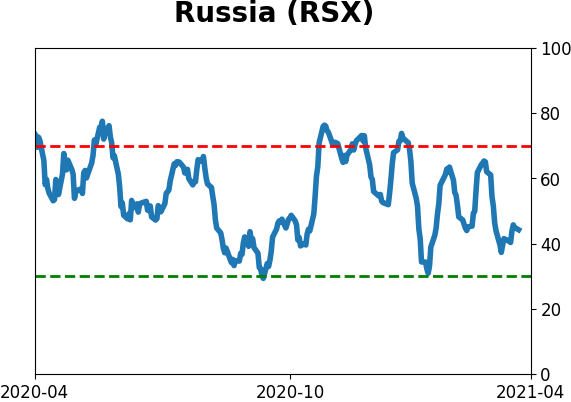
Sentiment Around The World
Optimism Index Thumbnails
|
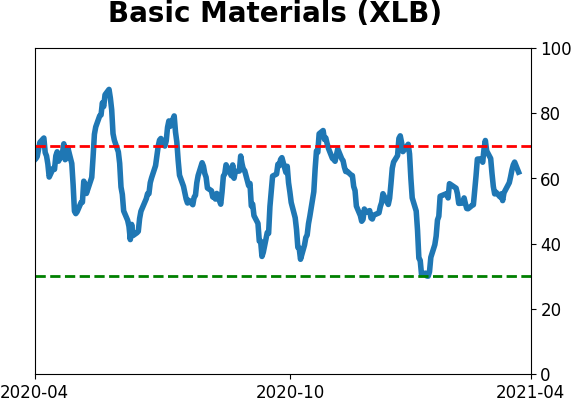
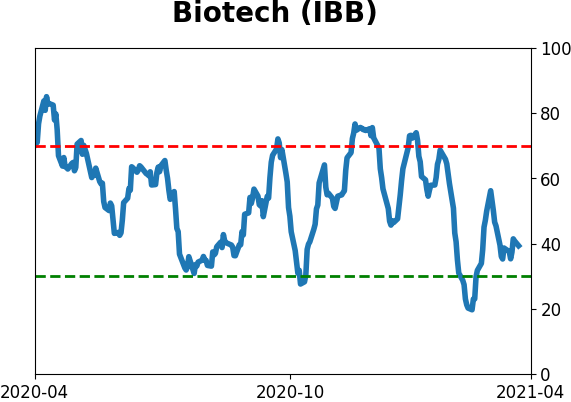
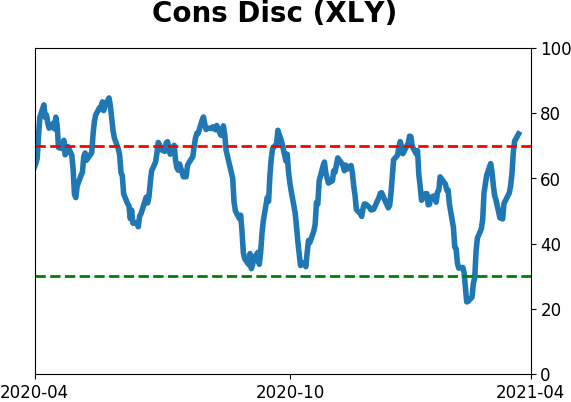
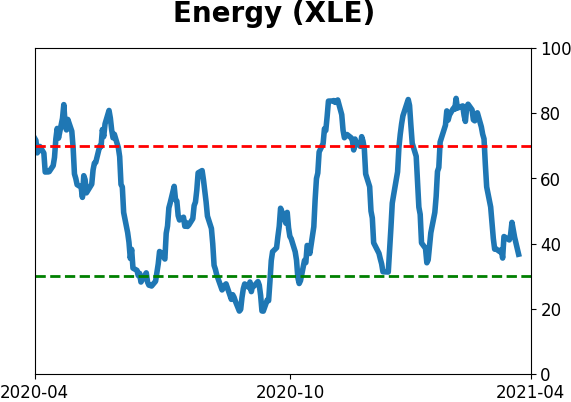
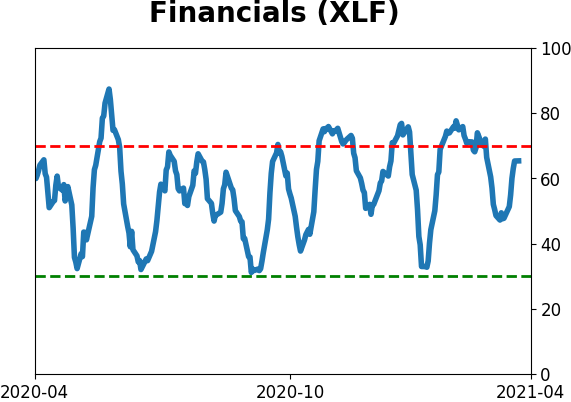
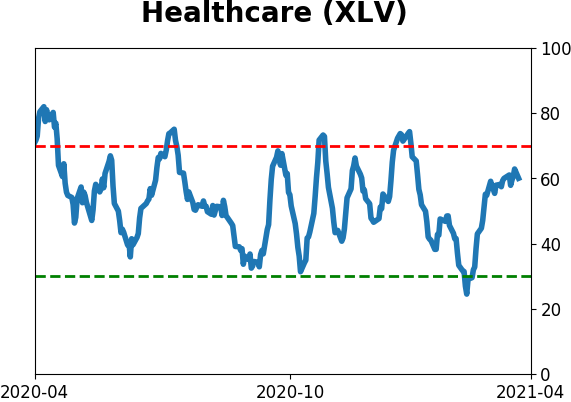
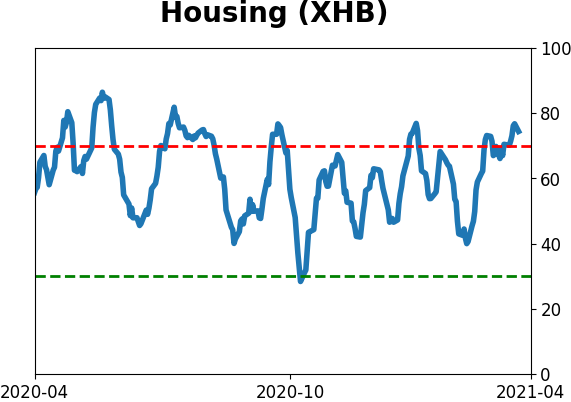
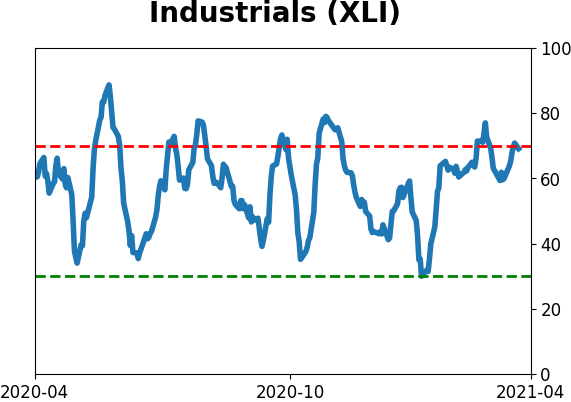
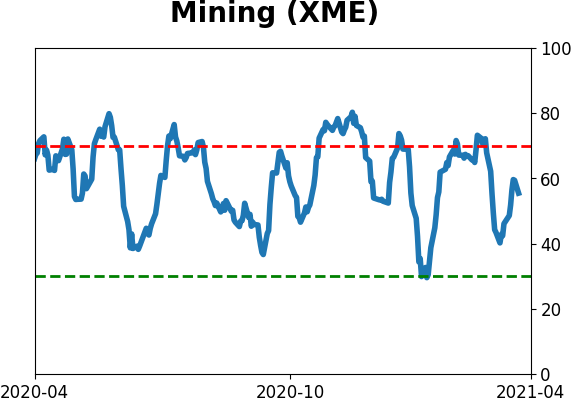
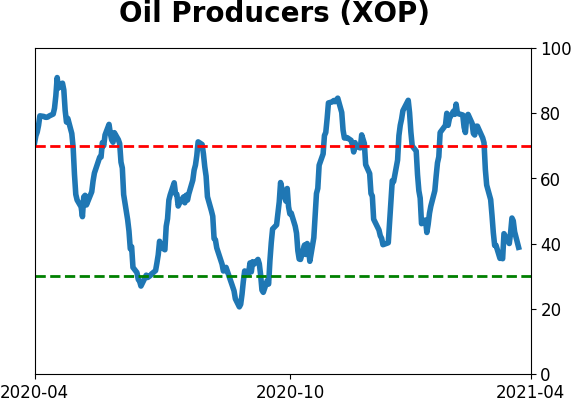
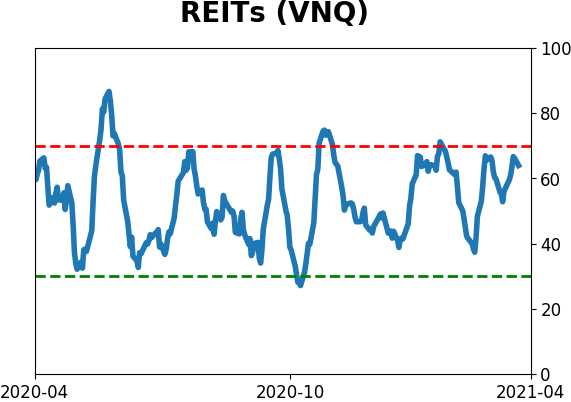
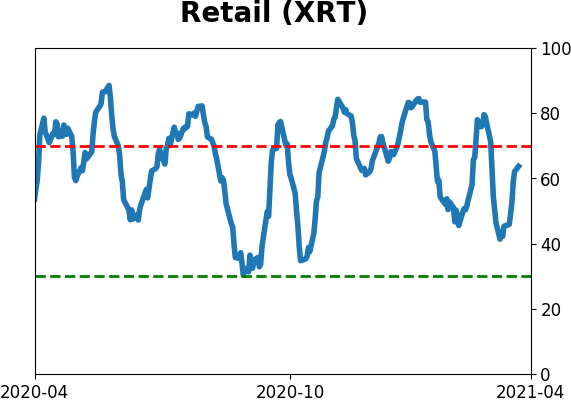
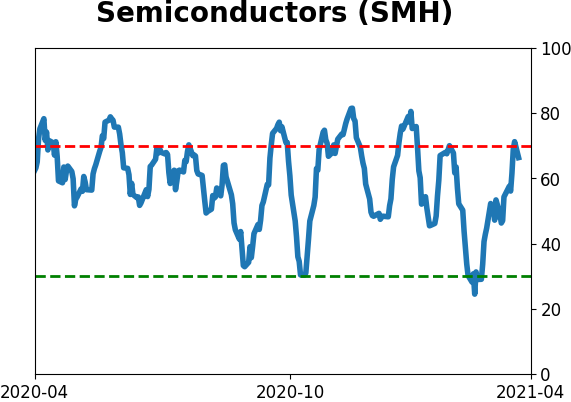
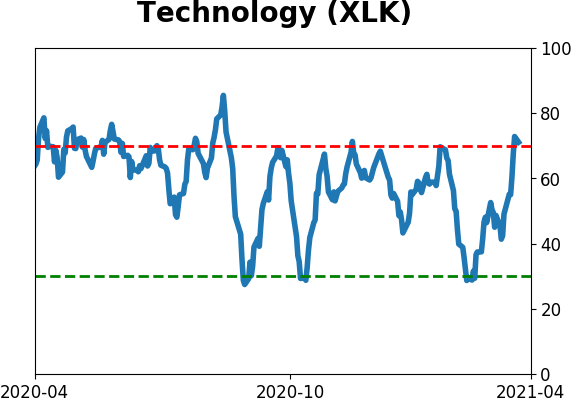
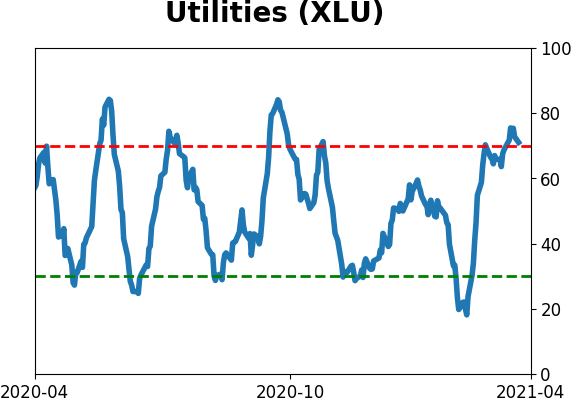
Sector ETF's - 10-Day Moving Average
|
|
|
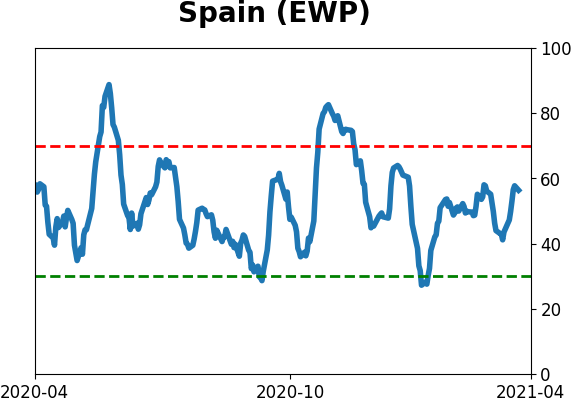
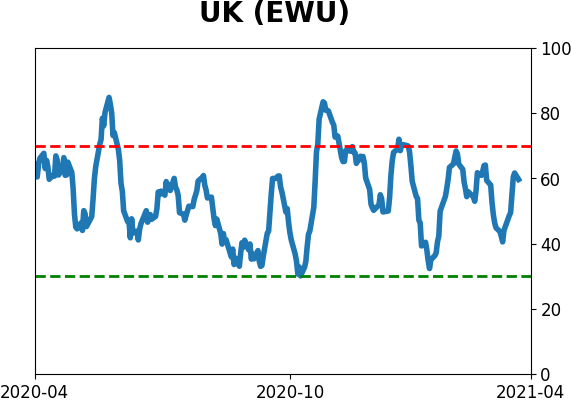
Country ETF's - 10-Day Moving Average
|
|
|
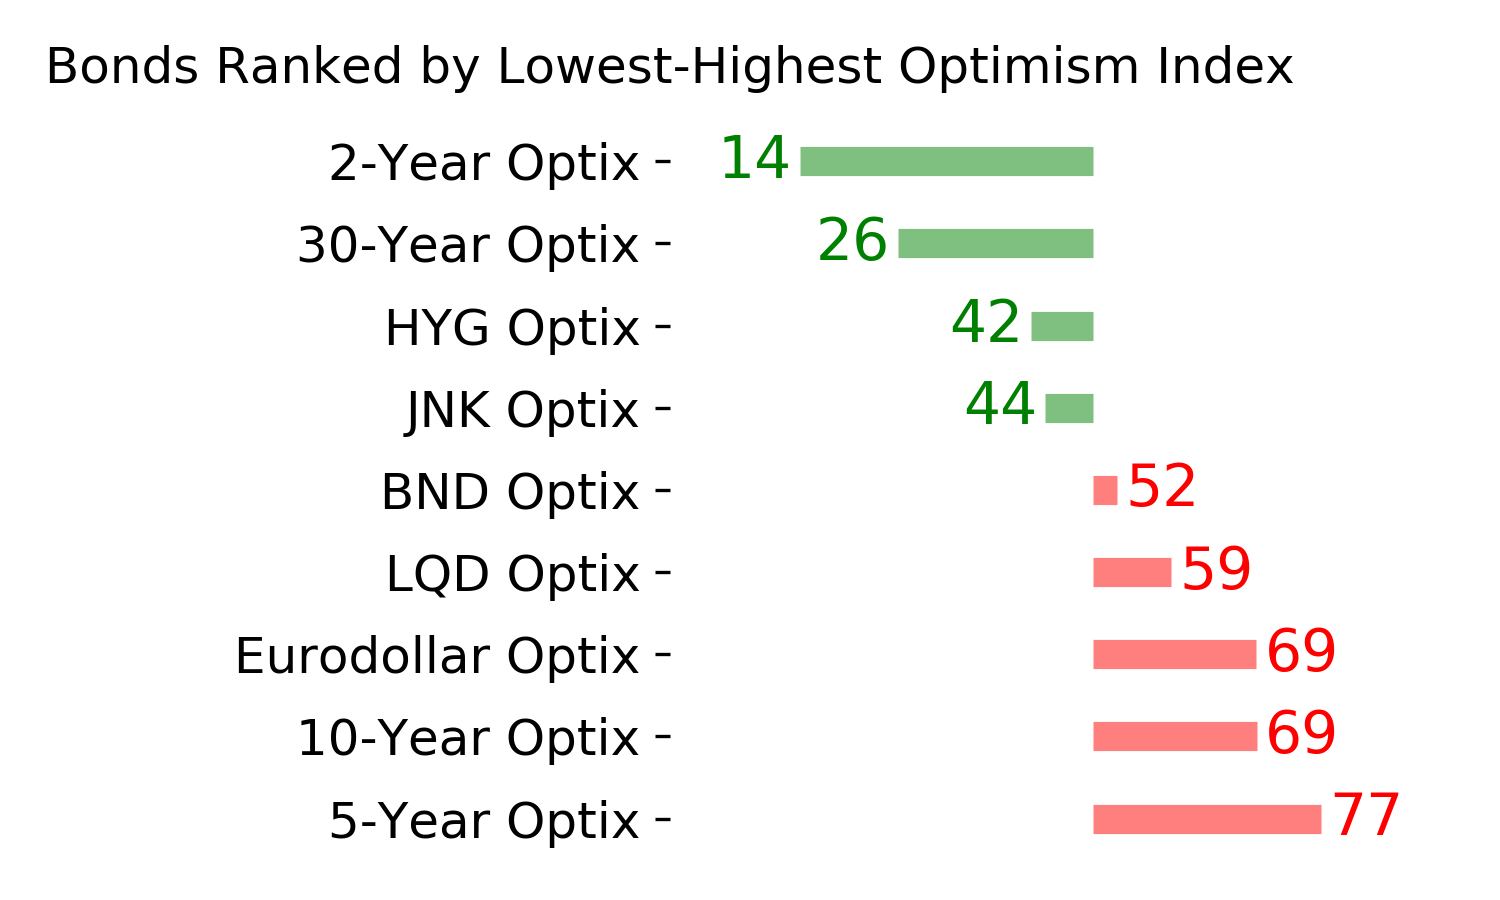
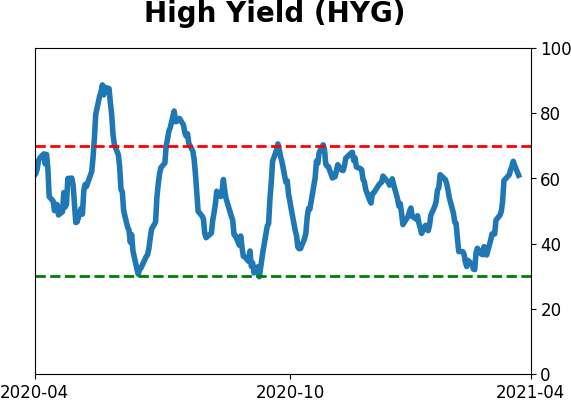
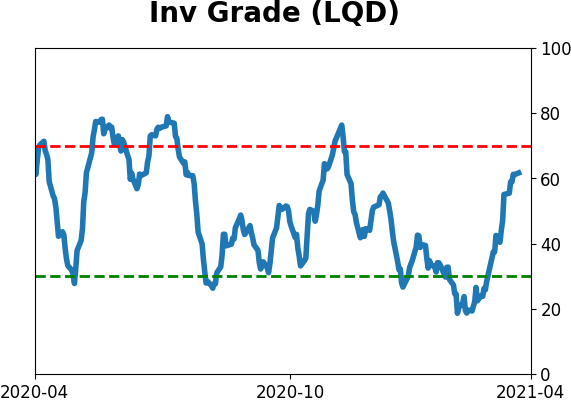
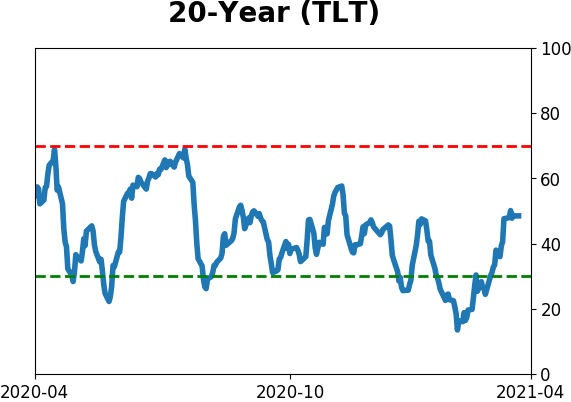
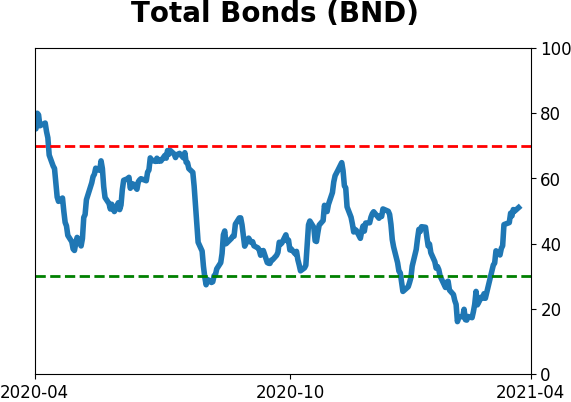
Bond ETF's - 10-Day Moving Average
|
|
|
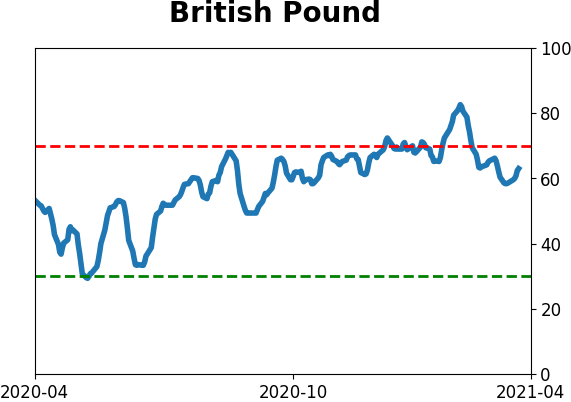
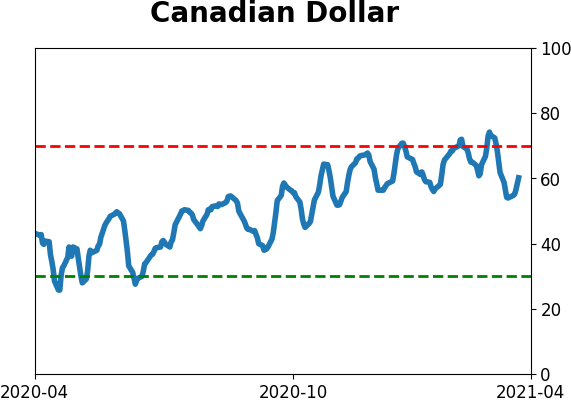
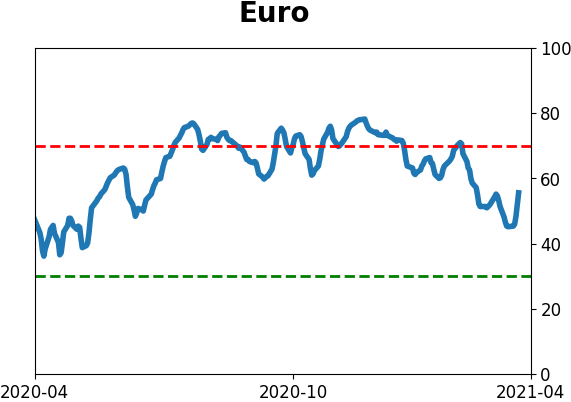
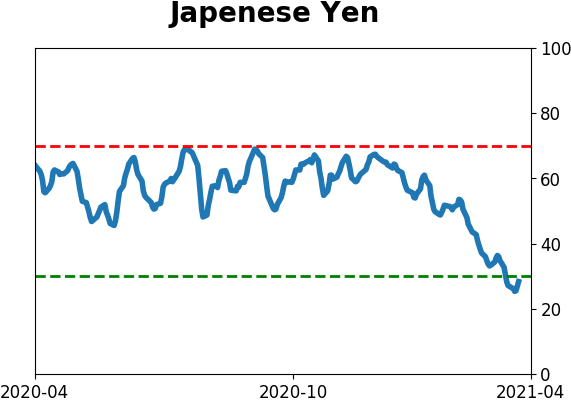
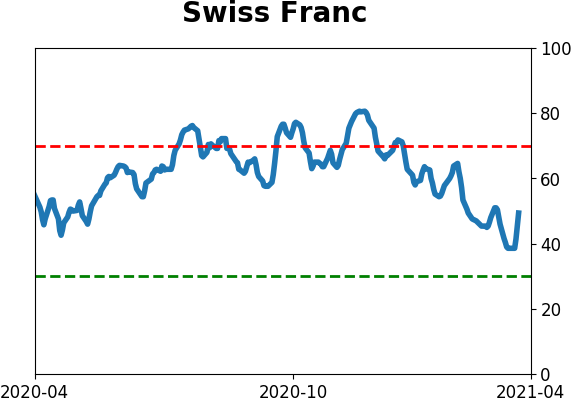
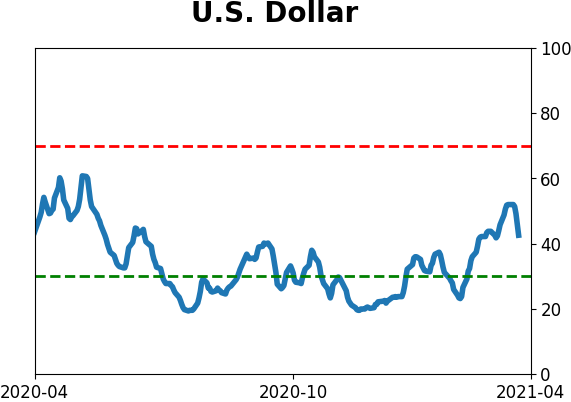
Currency ETF's - 5-Day Moving Average
|
|
|
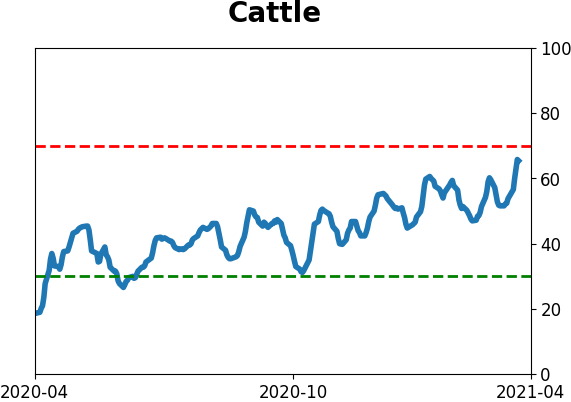
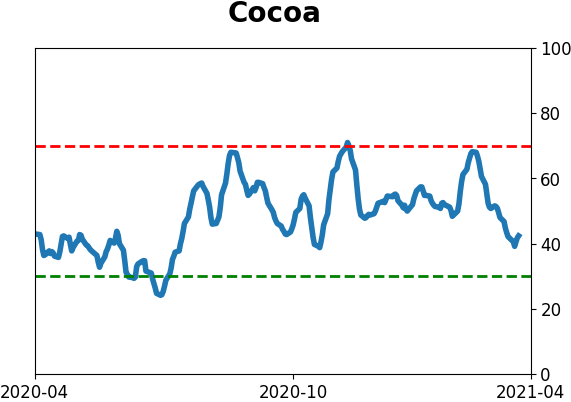
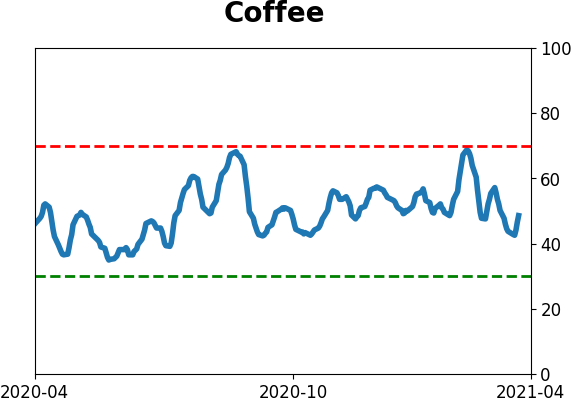
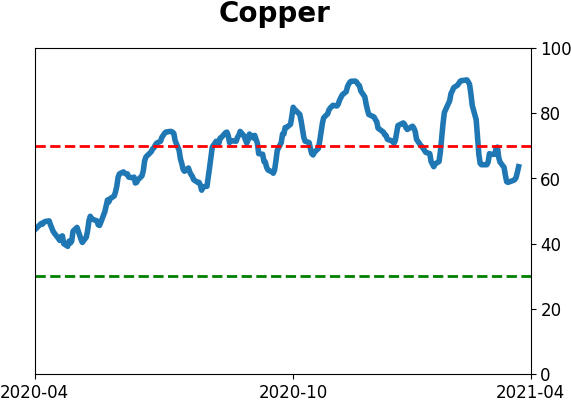
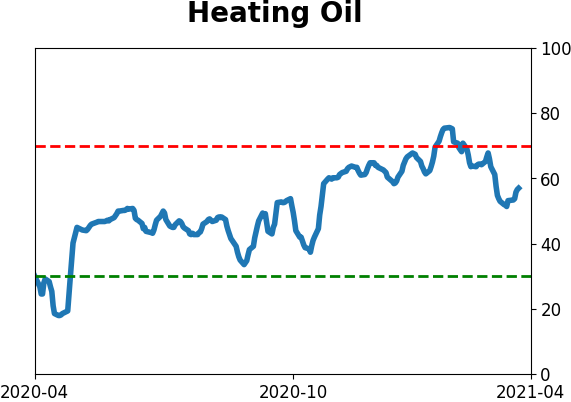
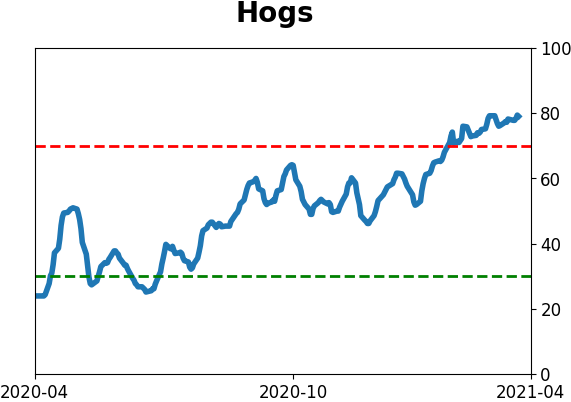
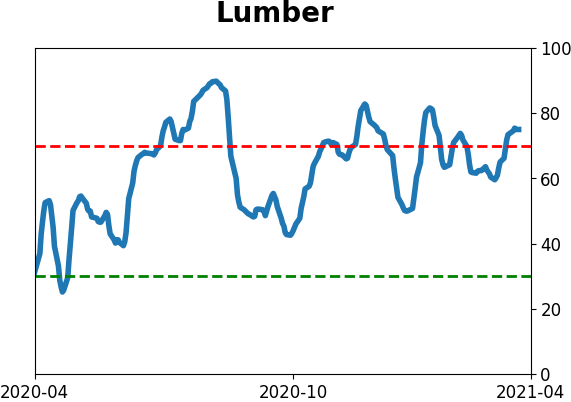
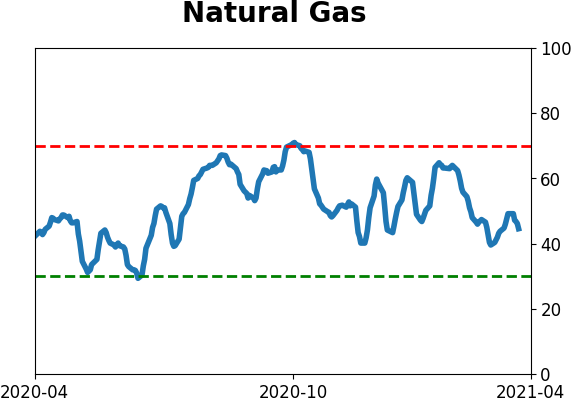
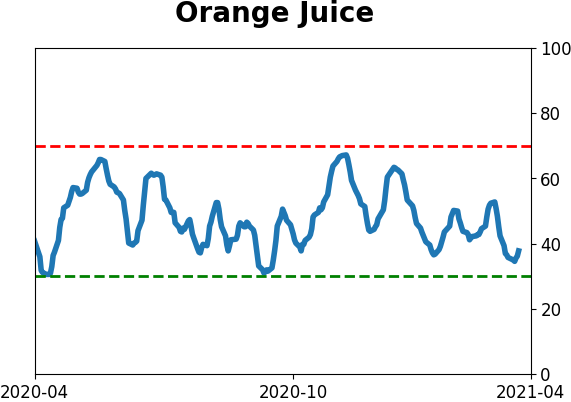
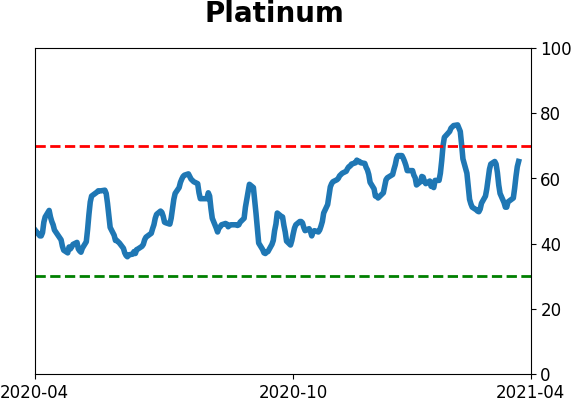
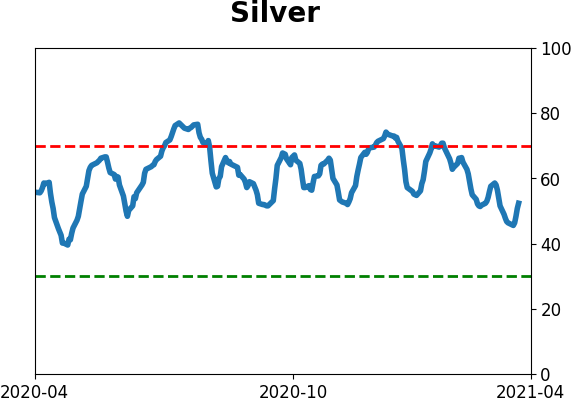
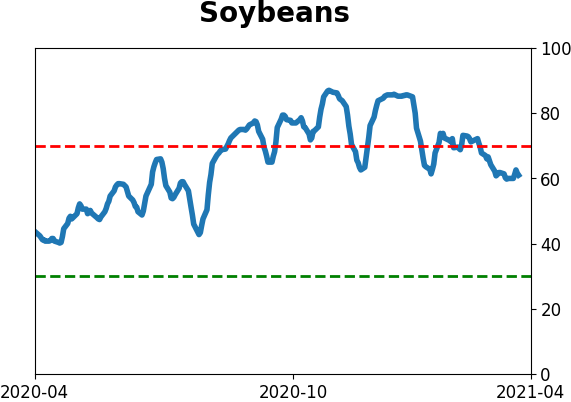
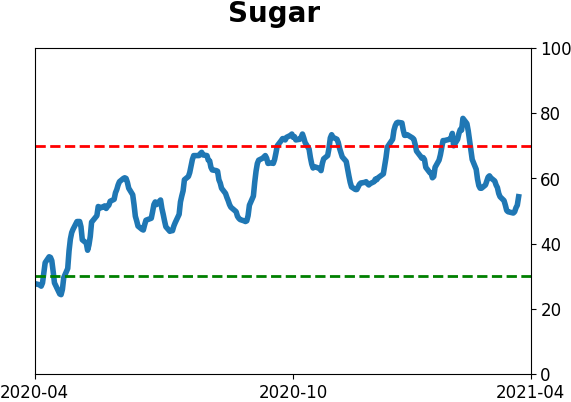
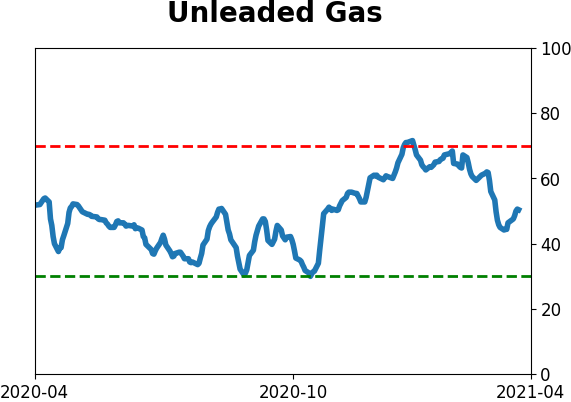
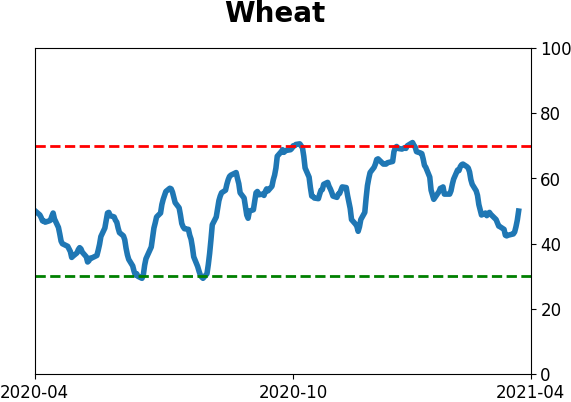
Commodity ETF's - 5-Day Moving Average
|
|