Headlines
|
|
Signs of a thaw remain elusive:
Looking at other corners of the market other than just the major stock indexes, there are still relatively few compelling signs of a thaw in the market, with most recovering in a less impressive fashion than the S&P 500.
Smart money rushes in: As equity fund investors pulled out, "smart money" hedgers rushed in. The latest Commitments of Traders data shows that hedgers were holding more than $23 billion worth of net long positions in major equity index futures as of Tuesday. That's among their biggest bets in the past decade. The Backtest Engine shows there were 20 other weeks in the past decade with a net long position more than $20 billion. Two months later, the S&P 500 was higher after all 20 weeks, averaging +4.7%. The data did not work as well in prior decades.
No flow: Investors pulled more than $60 billion from equity mutual funds and ETFs over the past week, per Lipper. That accounted for nearly 0.7% of assets, which doesn't sound like much but is 50% higher than any other week in the past 17 years. That's quite something given stocks enjoyed their best week in nearly 50 years.
Epic rally: Stocks have bounced back so strongly that nearly every stock in the S&P 500 has rallied above its 10-day moving average. In a premium note, Troy shows that there have only been 5 other unique days with so many stocks above their short-term trends (2009-03-18, 2010-09-03, 2011-07-01, 2011-08-29, and 2011-10-14). One of them was a false start, while the other four led to mostly good gains going forward.
|
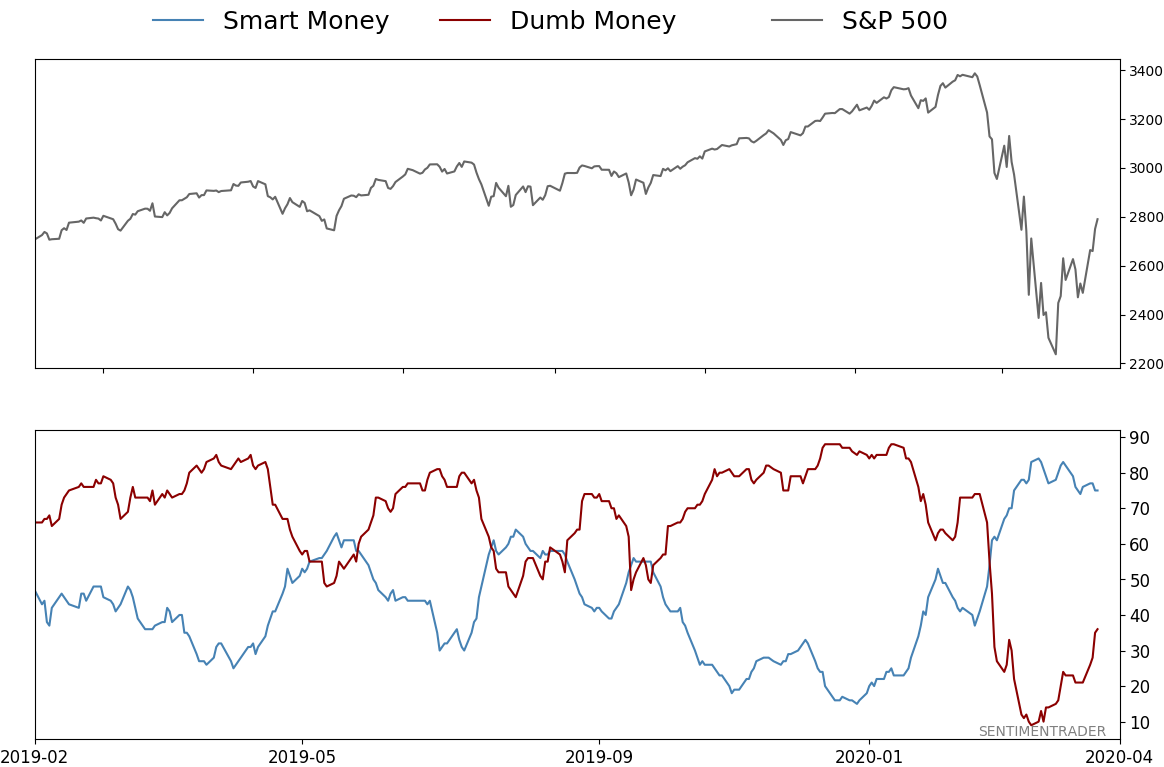
Smart / Dumb Money Confidence
|
Smart Money Confidence: 75%
Dumb Money Confidence: 36%
|
|
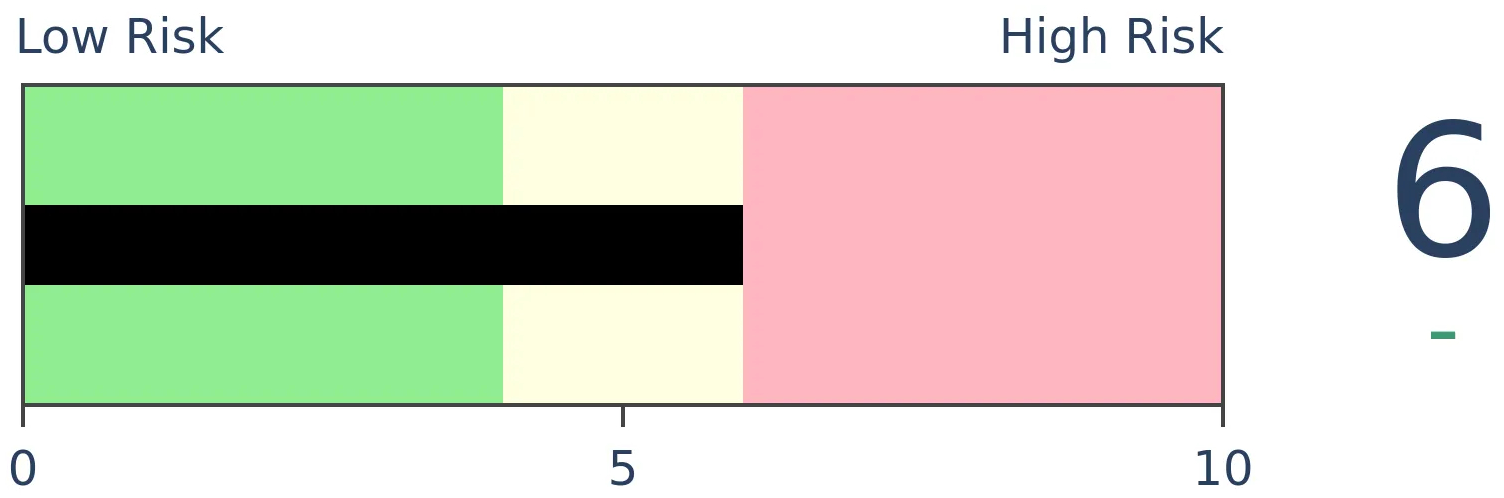
Risk Levels
Stocks Short-Term
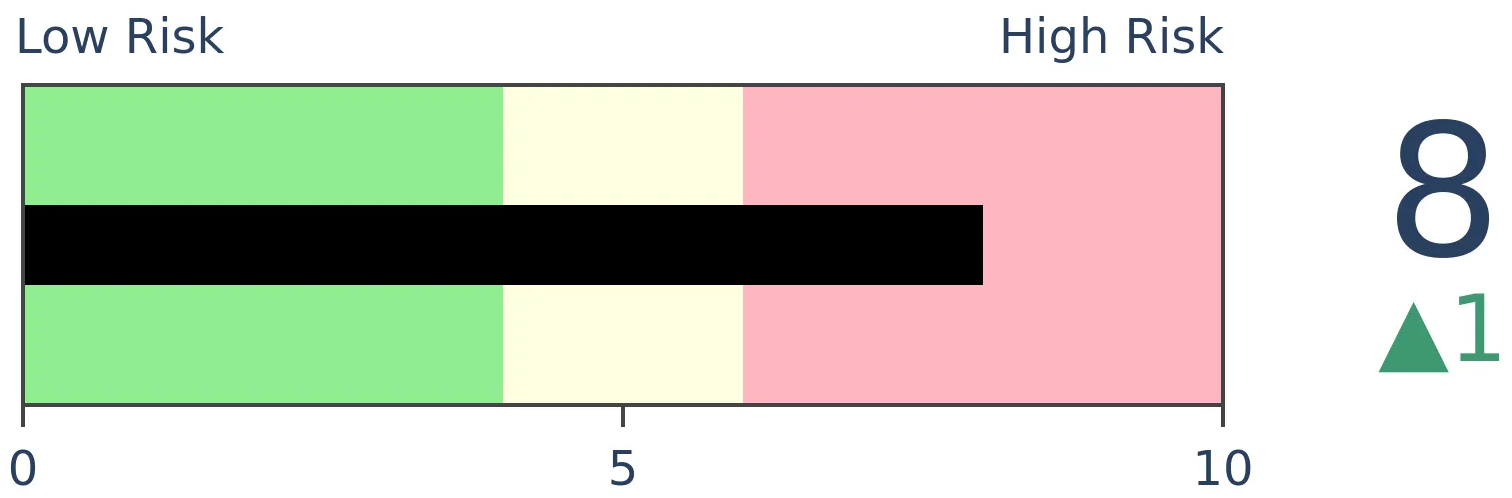
|
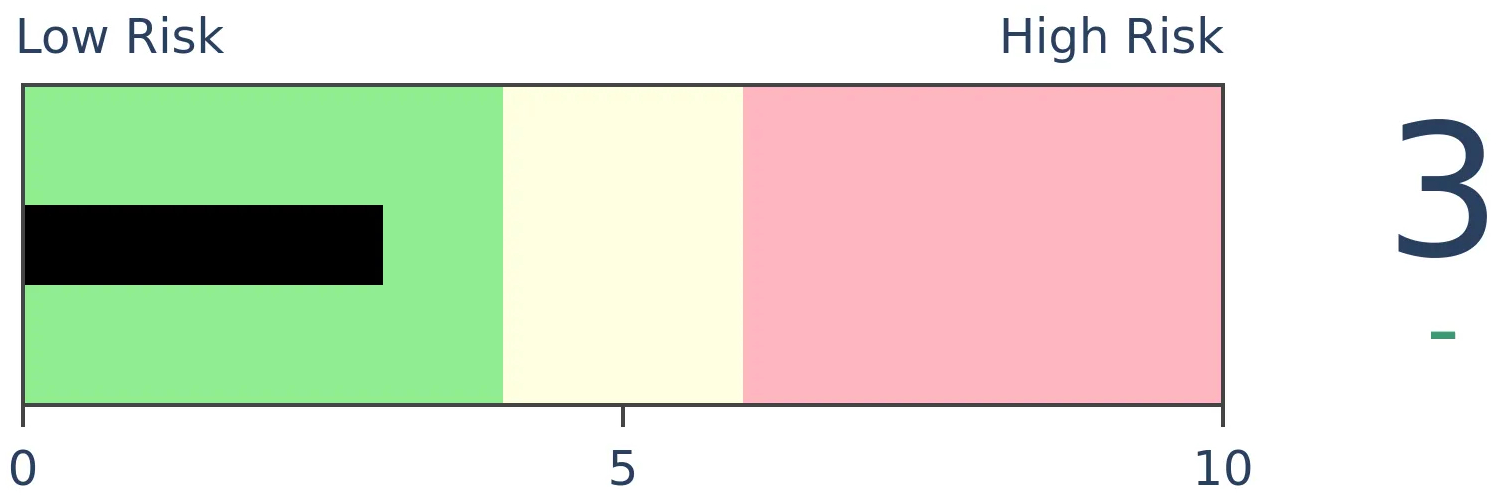
Stocks Medium-Term
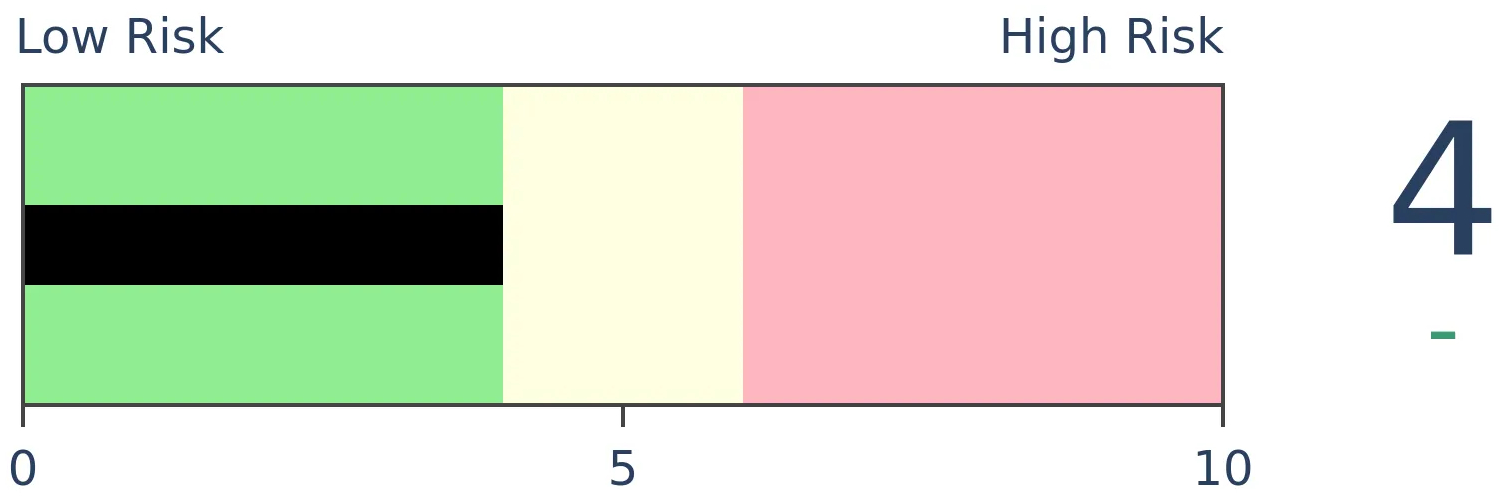
|
|
Bonds
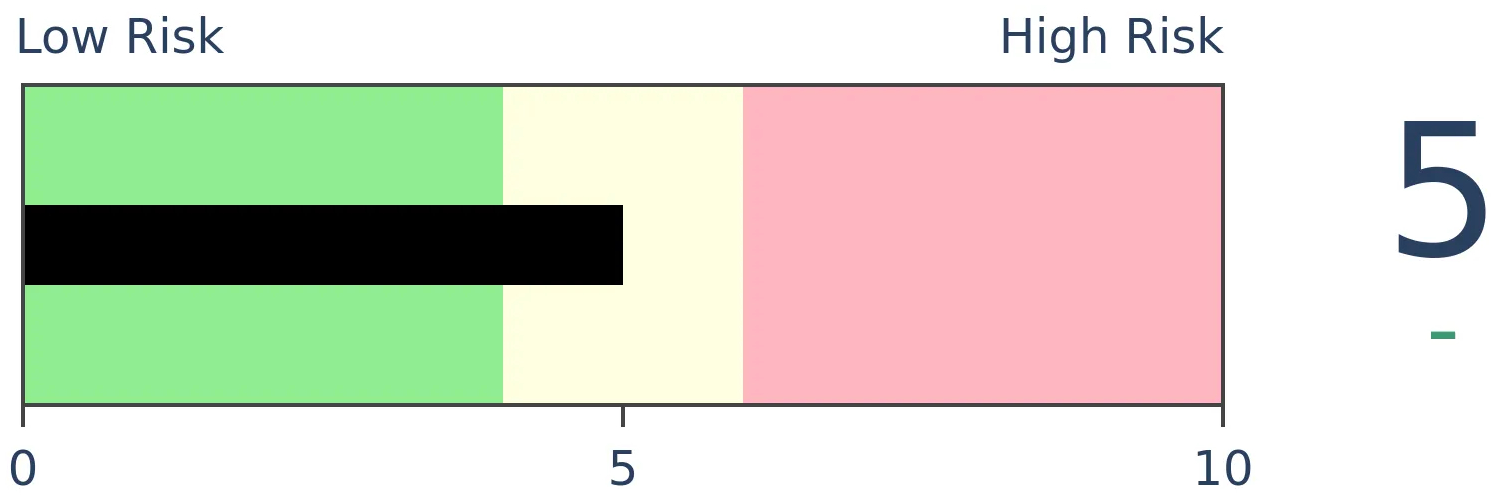
|
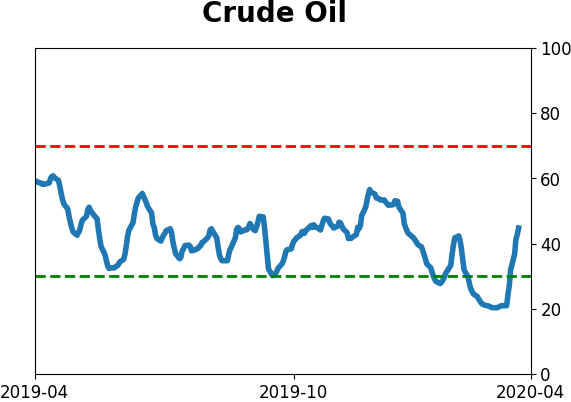
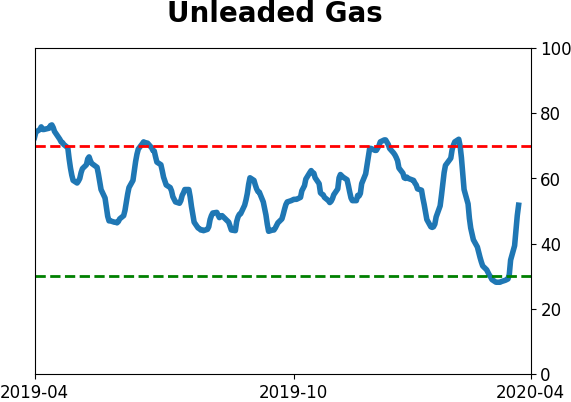
Crude Oil

|
|
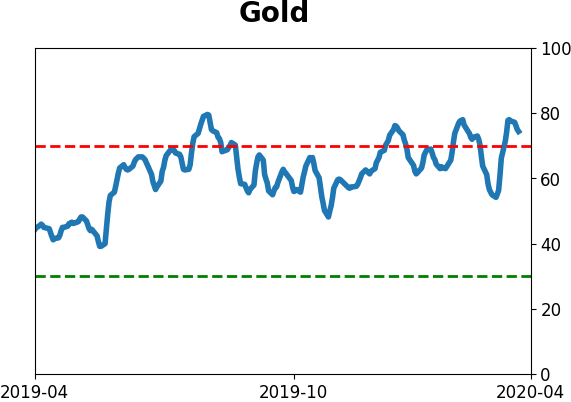
Gold
|
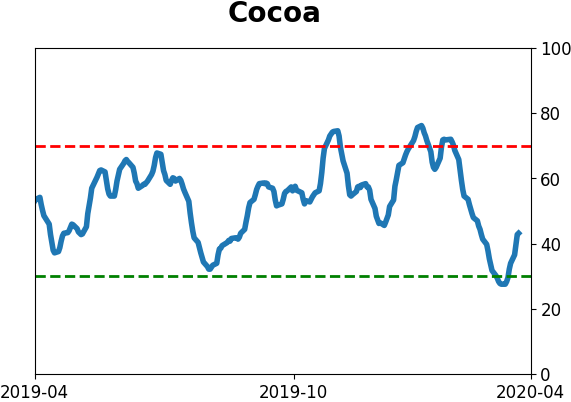
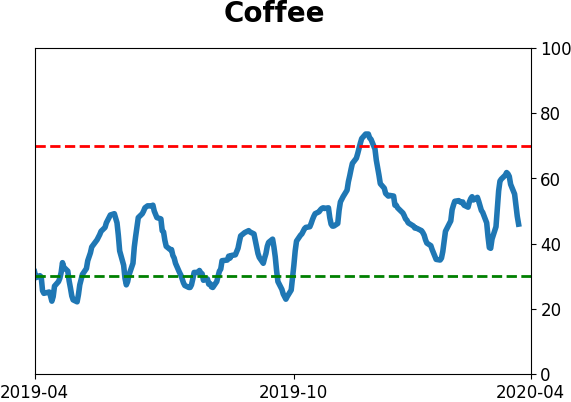
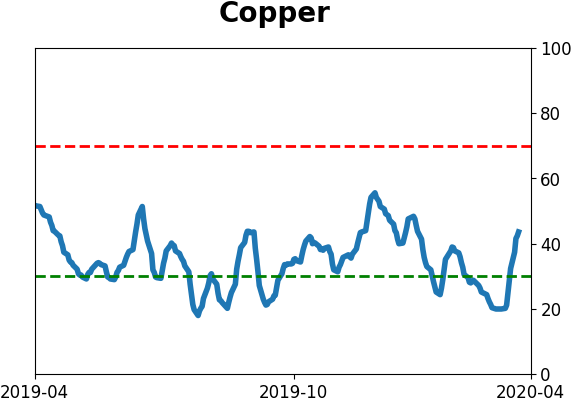
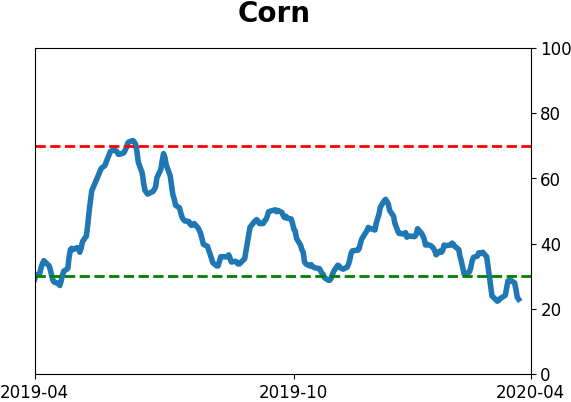
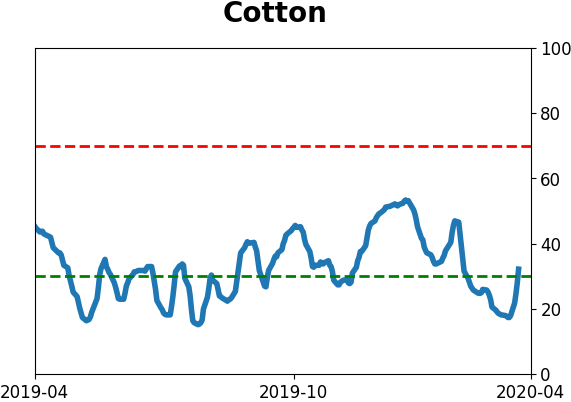
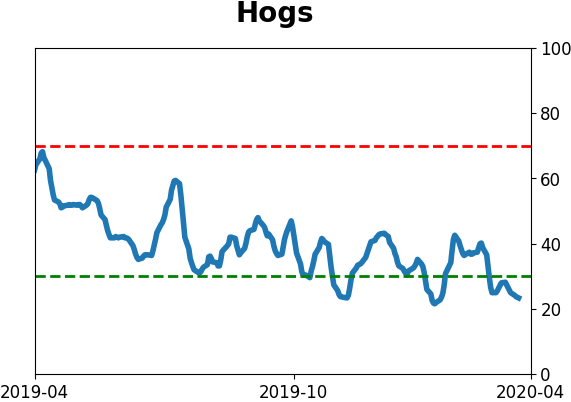
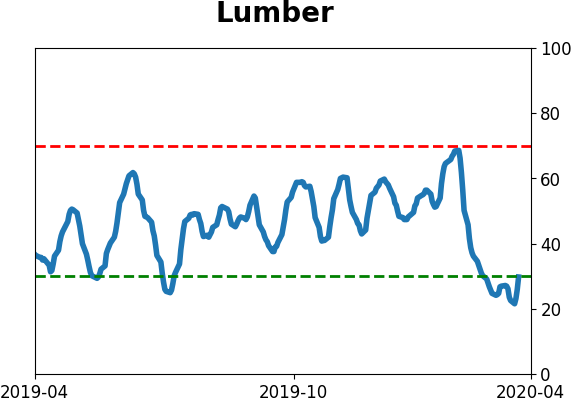
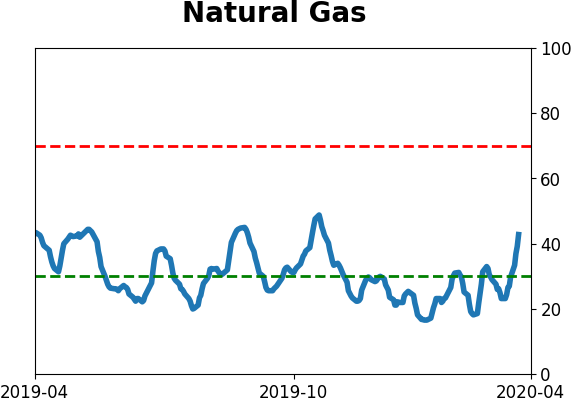
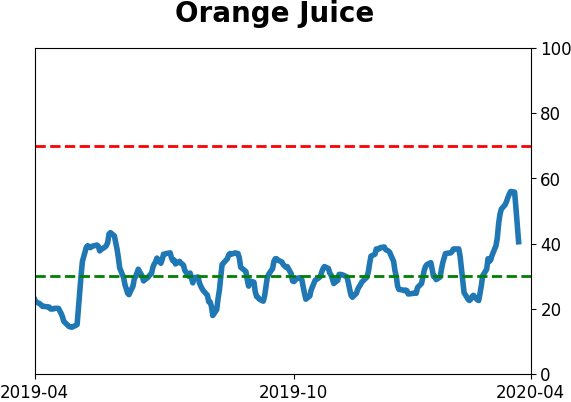
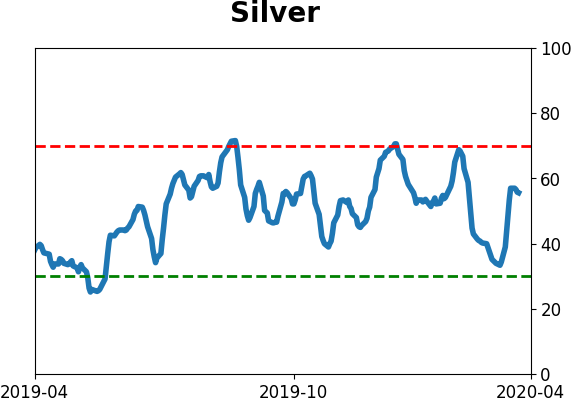
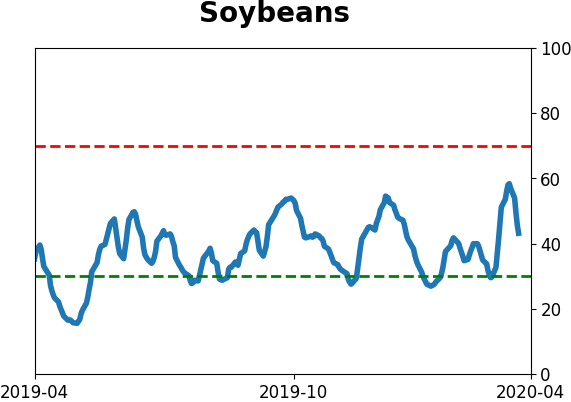
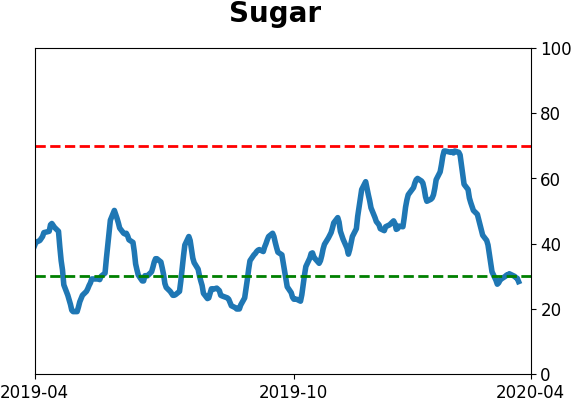
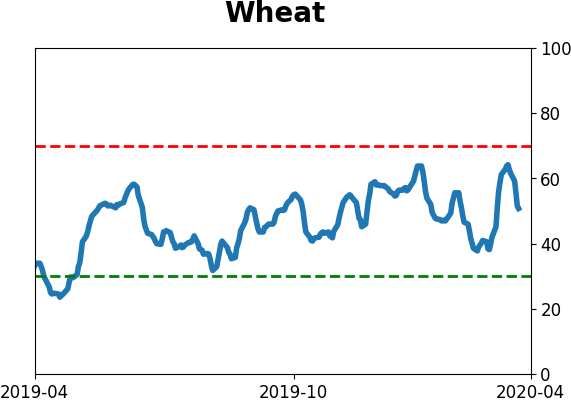
Agriculture
|
|
Research
BOTTOM LINE
Looking at other corners of the market other than just the major stock indexes, there are still relatively few compelling signs of a thaw in the market, with most recovering in a less impressive fashion than the S&P 500.
FORECAST / TIMEFRAME
None
|
A little over a week ago, we looked at signs outside of the major stock indexes to see how the nascent recovery was progressing. Other than the thrust in stocks, the signs weren't very convincing. They're still not.
The most compelling development over the past few weeks has been the historic level of selling pressure, then the buying thrust and quick retracement of the decline in major indexes like the S&P 500. When we've seen combinations like this in the past, it has led to even higher prices with great consistency. We'd still place the most weight on those factors.
It would just be nice to see other markets recover in line or better than the S&P, though. Seeing them lag continuously makes the whole recovery seem suspect. Below, we'll go over most of the same charts as we did last week.
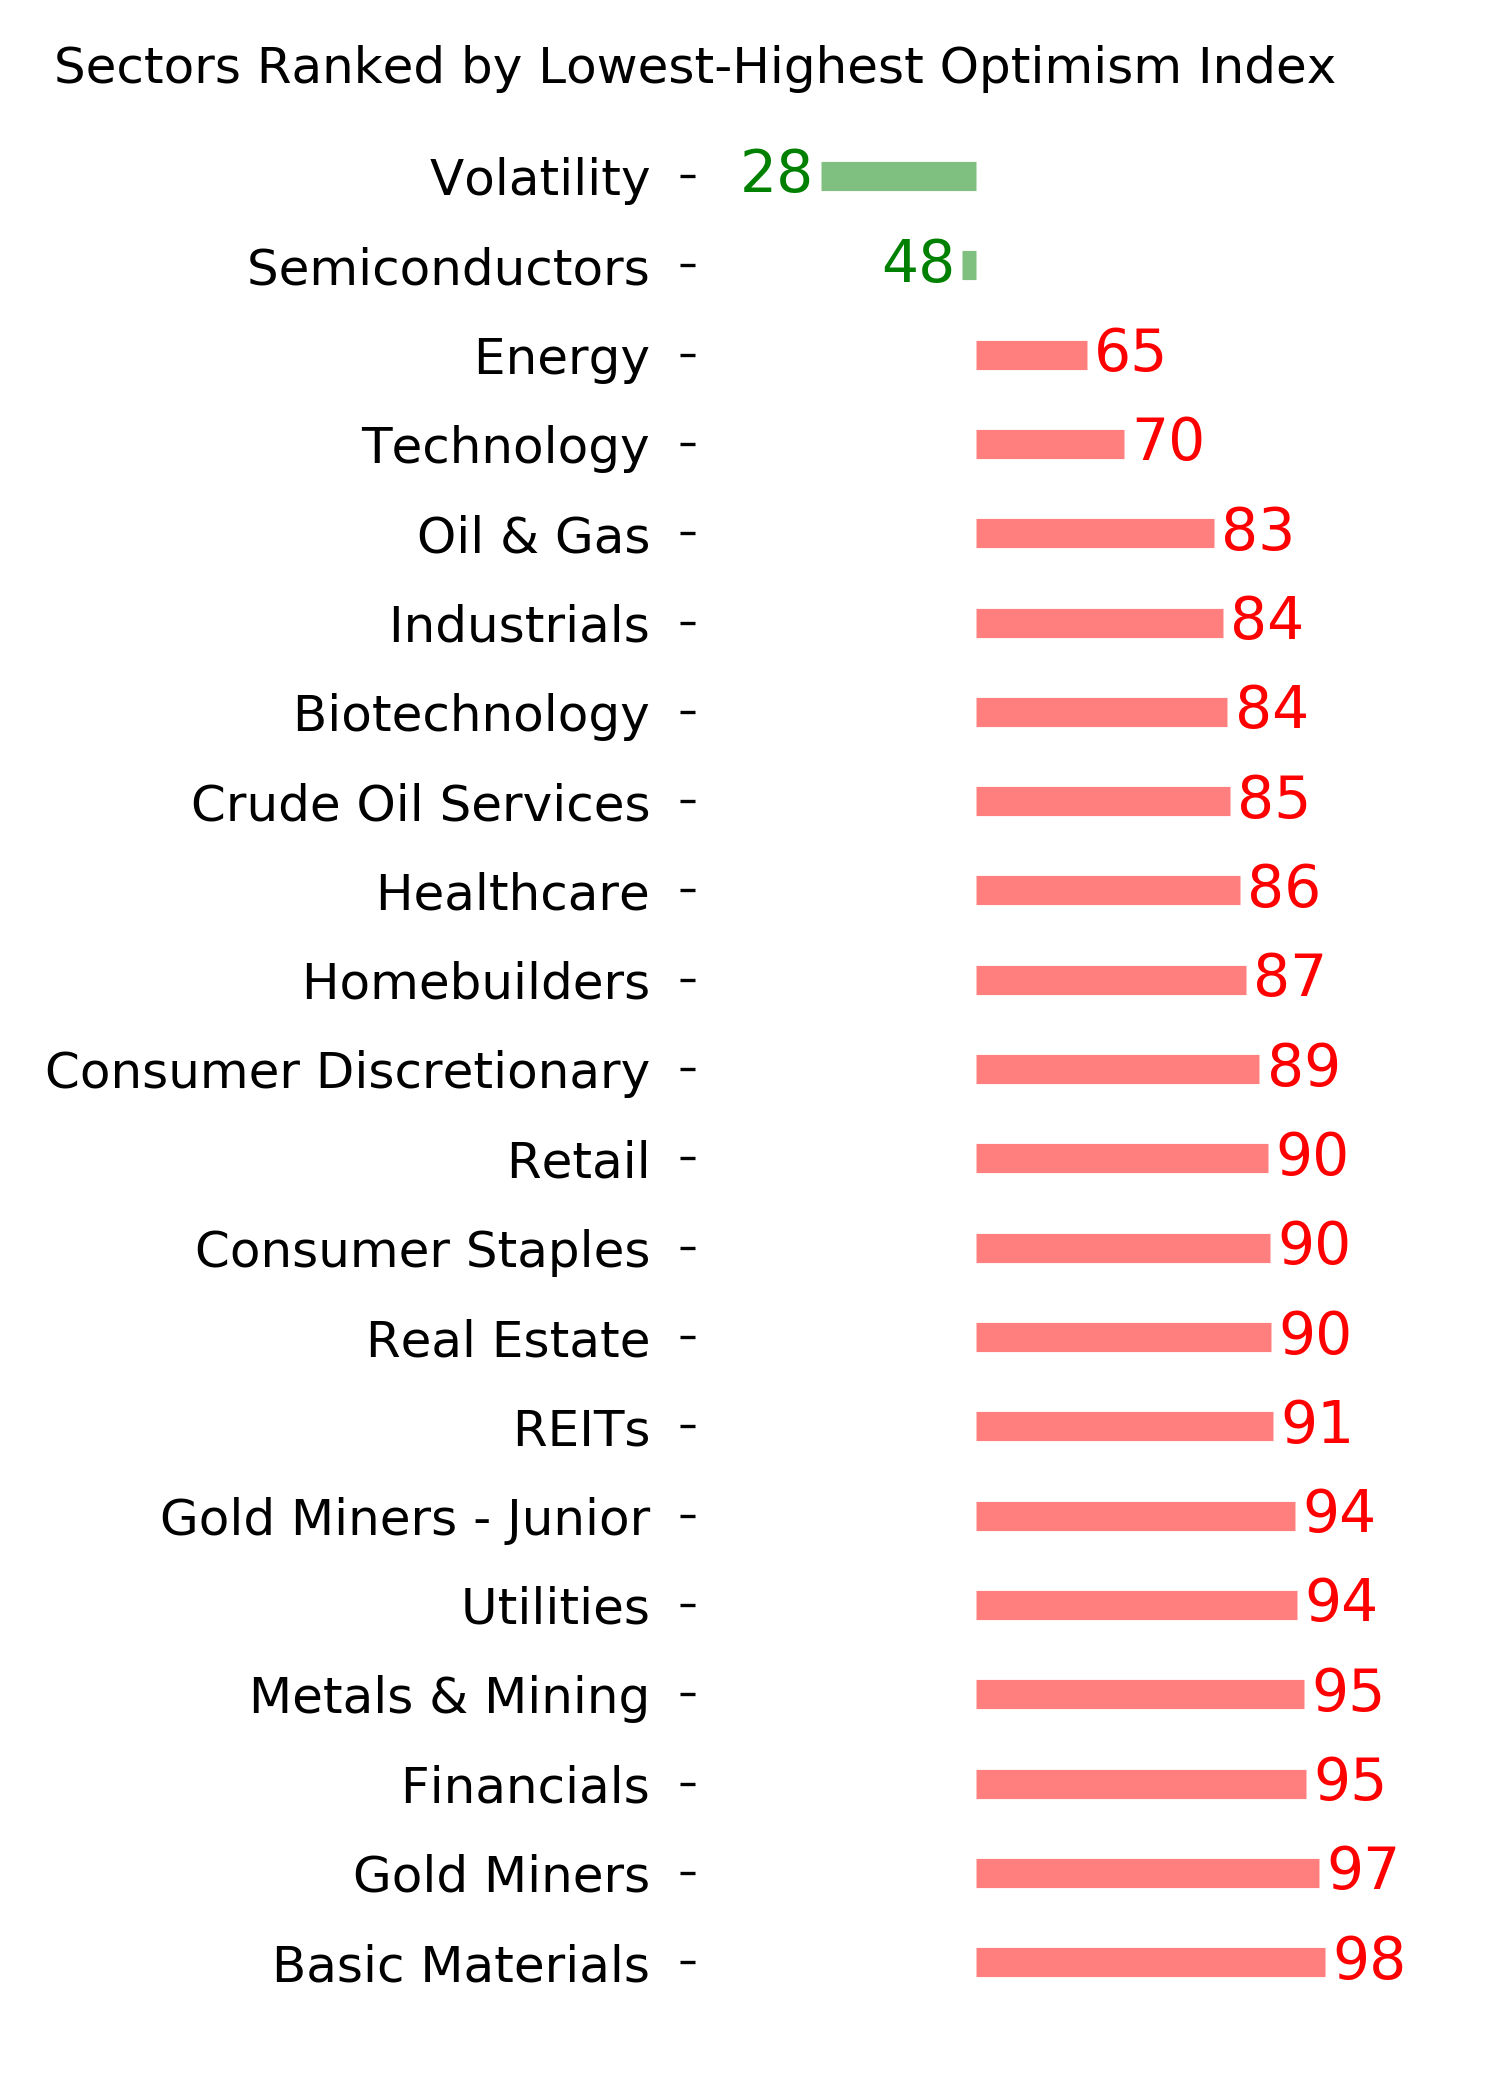
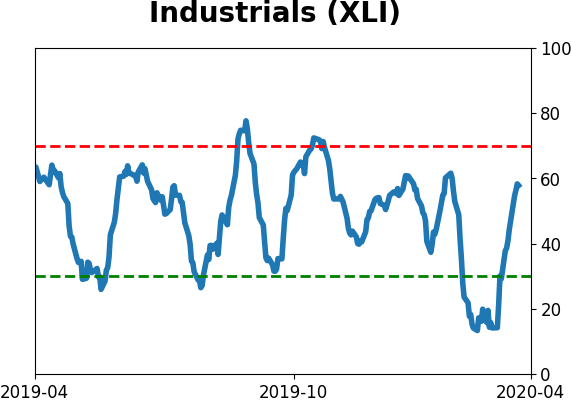
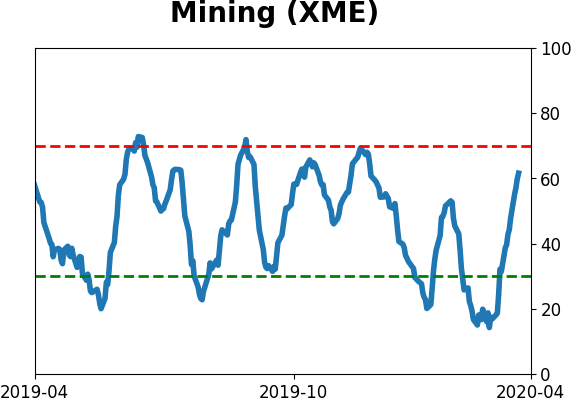
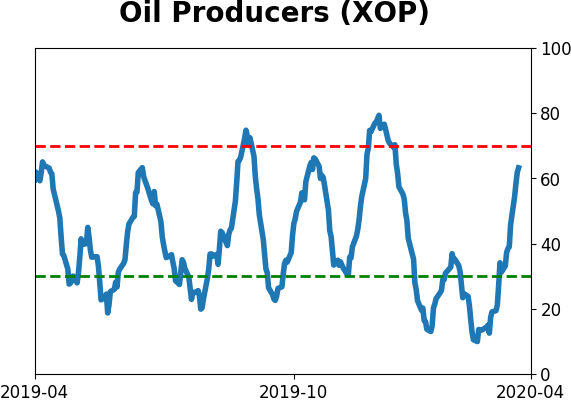
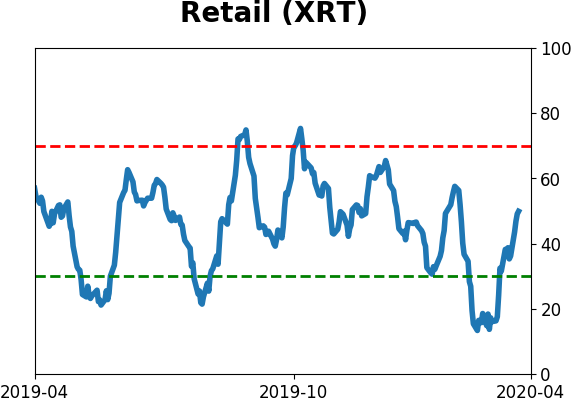
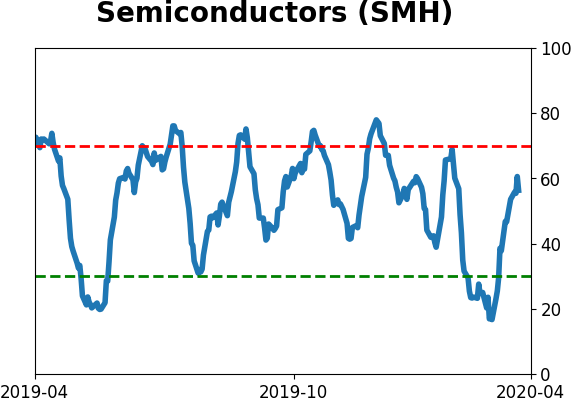
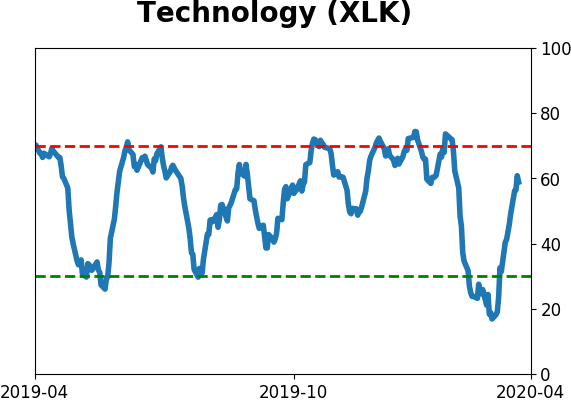
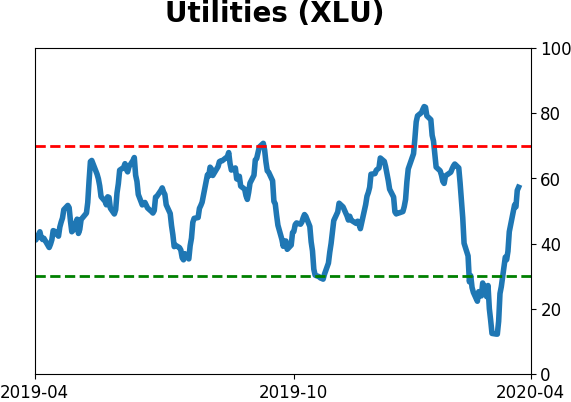
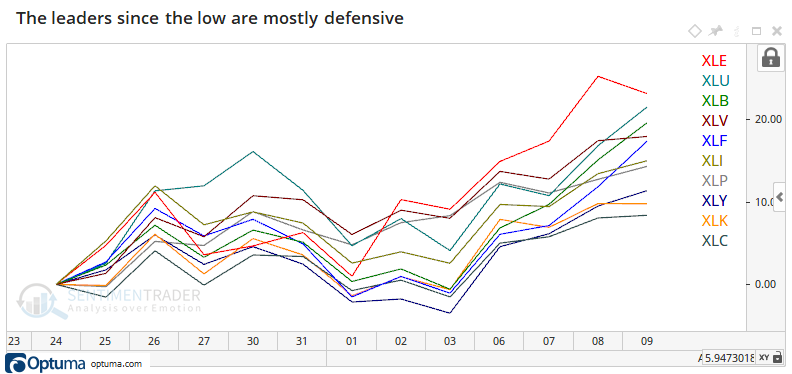
In terms of leading sectors, they continue to be defensive. This isn't a great sign - most "true" bottoms saw more cyclical stocks leading the initial thrust out of the low.
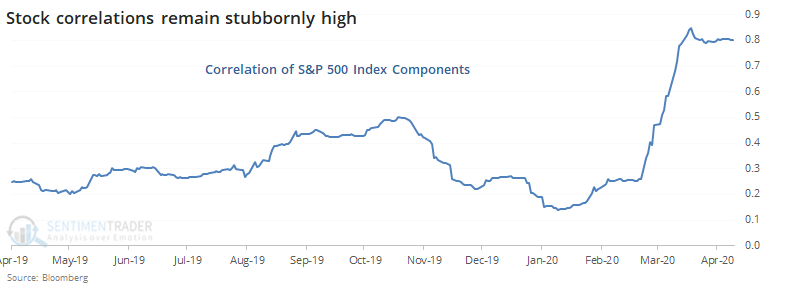
There still hasn't been much of a relaxation in the correlation among stocks. Most are rising and falling together, not trading on their own merits.
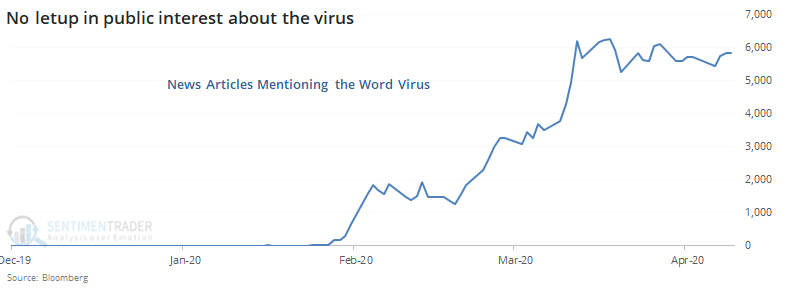
The virus remains forefront in the public mind. As long as editors see demand from their readers for articles about the virus, they'll be published.
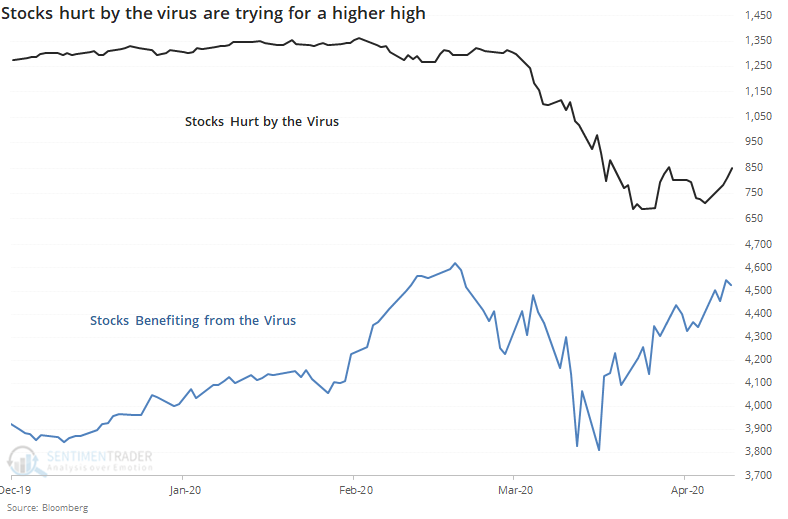
Stocks hurt by the virus are trying to make a higher high but struggling. Those benefiting from it keep rising and have nearly hit new highs.
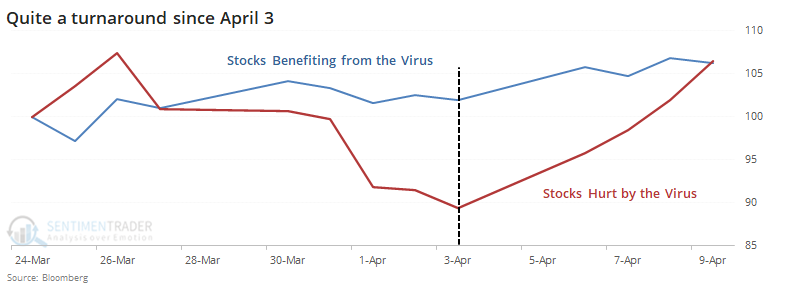
A minor good sign is that since April 3, the gap has narrowed, and the "hurt" stocks have soared. This needs to continue.
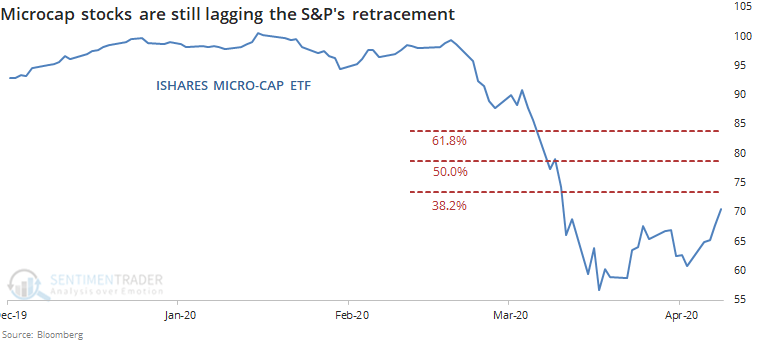
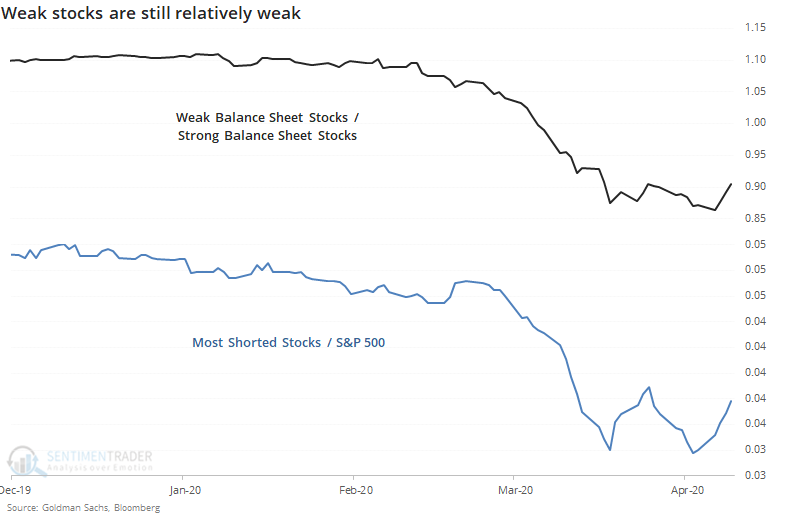
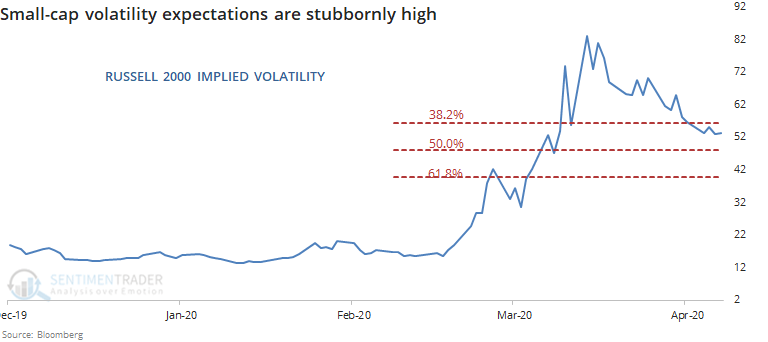
Among the worst hit were micro-cap stocks. They still haven't retraced much of their decline.
Neither have fundamentally weak and/or shorted stocks. They're still showing a pattern of lower highs and lows.
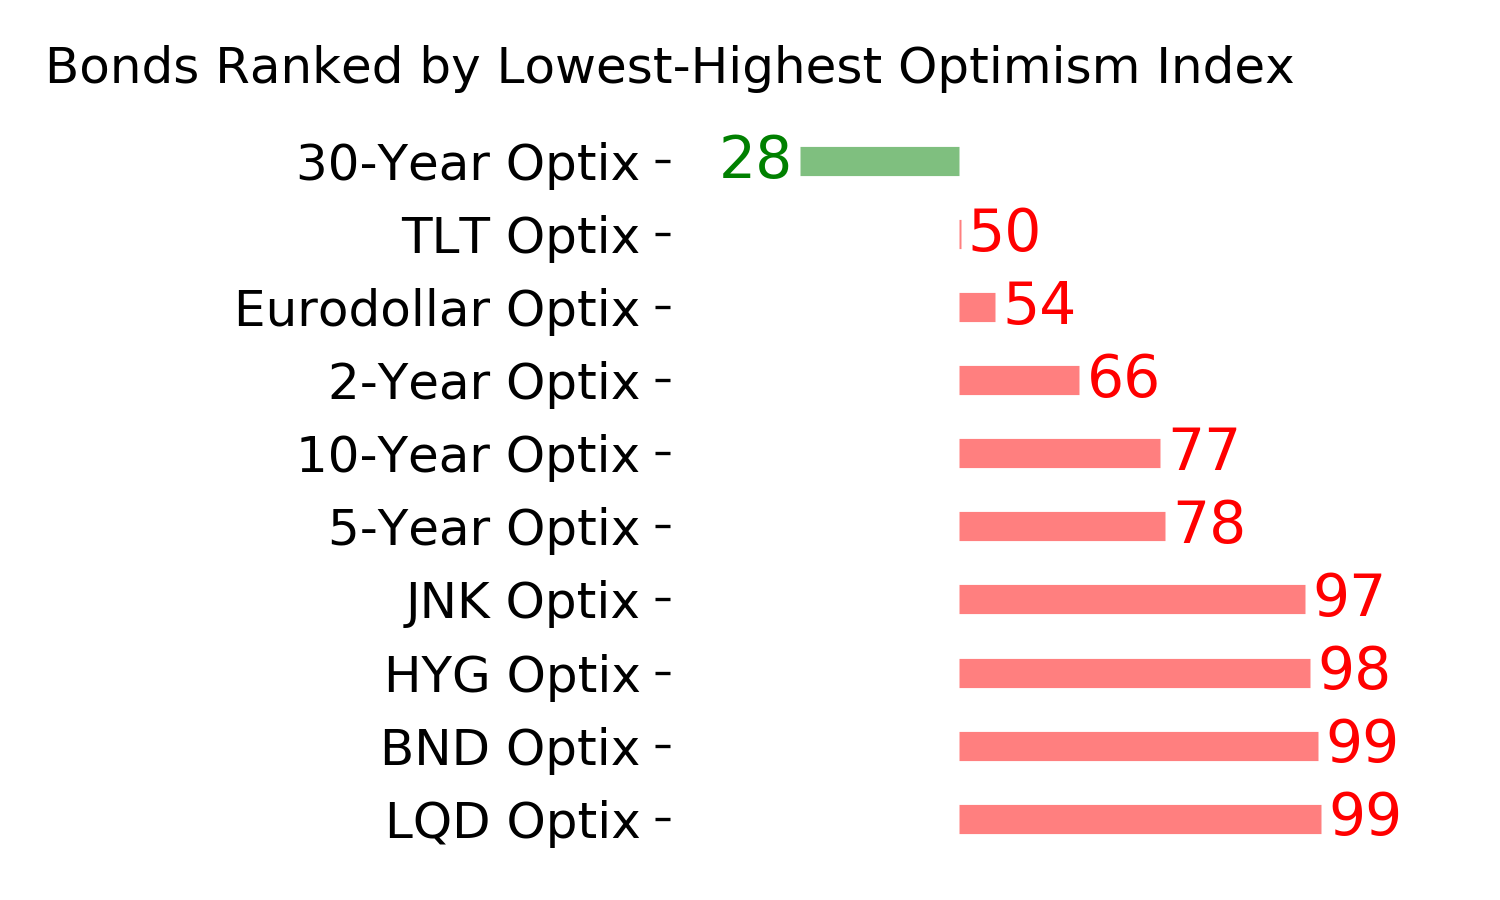
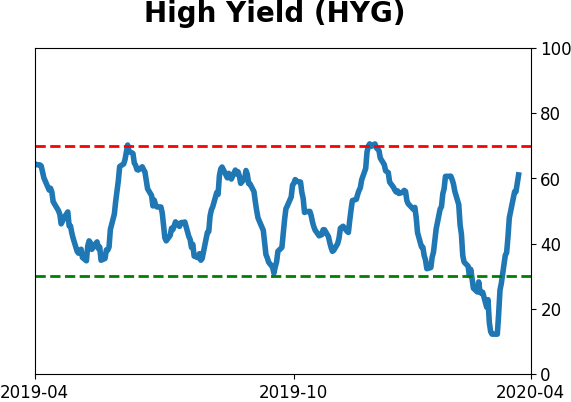
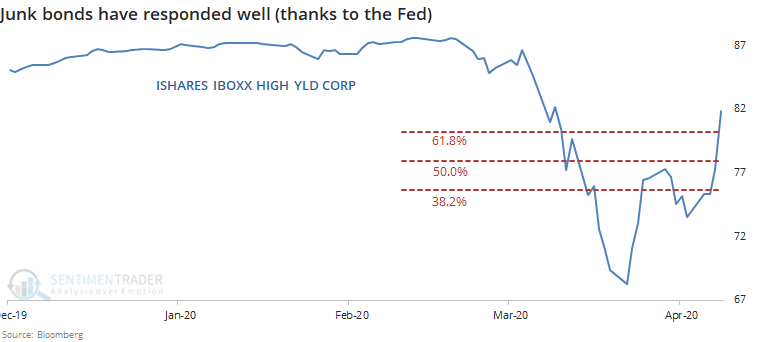
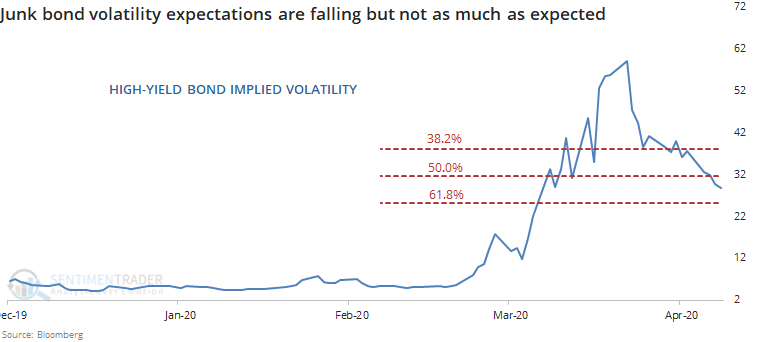
The biggest outlier here is junk bonds. They've soared, thanks to the new Fed program announced on Thursday.
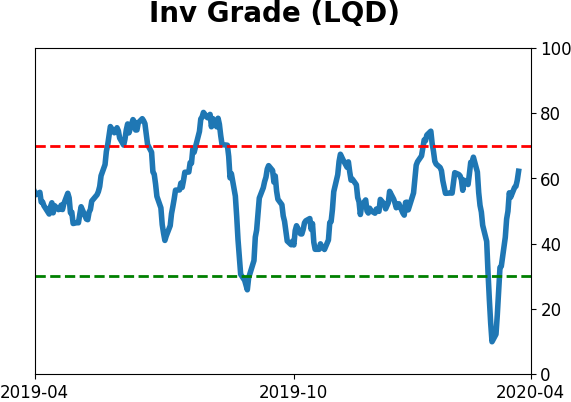
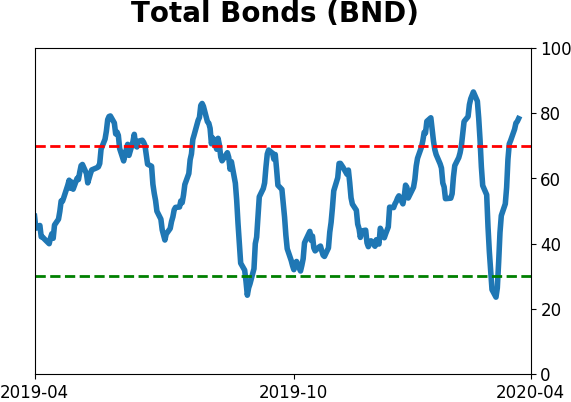
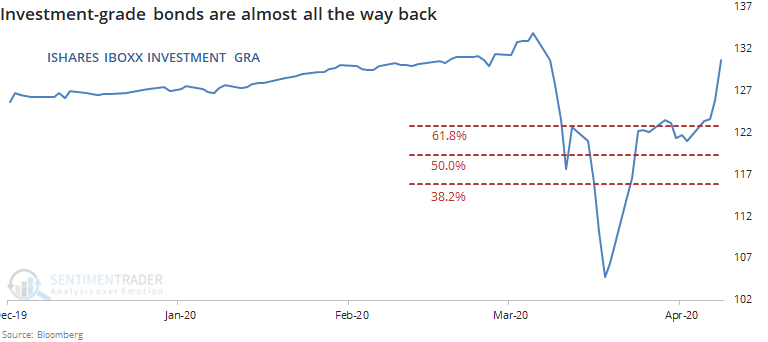
Investment-grade bonds are nearly back to their old highs. It's hard to argue this is a negative.
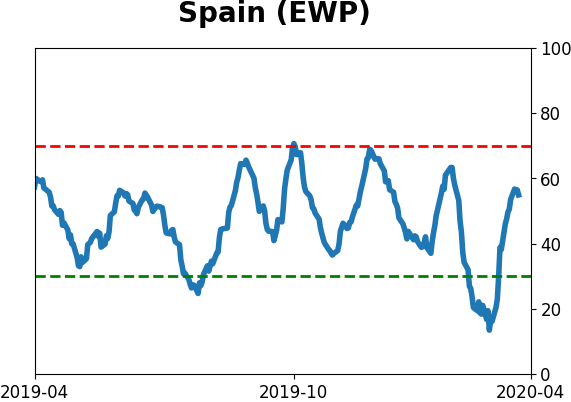
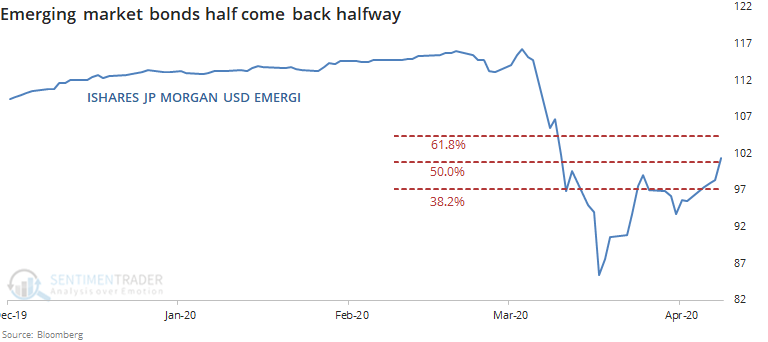
Even emerging market bonds are doing okay, retracing about as much of their decline as the S&P 500 has.
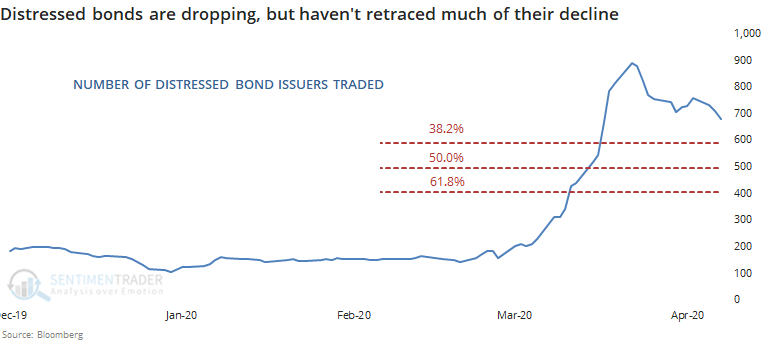
The number of bond issuers classified as distressed is dropping, but not by much. It's down a couple of hundred from the peak, which isn't saying a whole lot given how much of a spike there was.
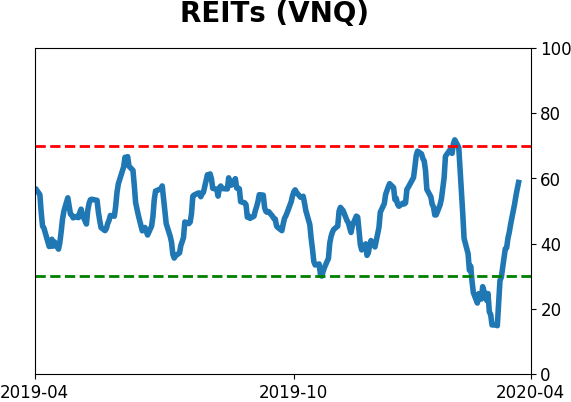
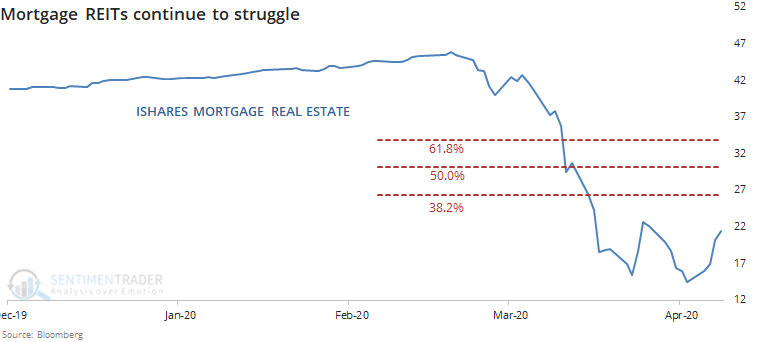
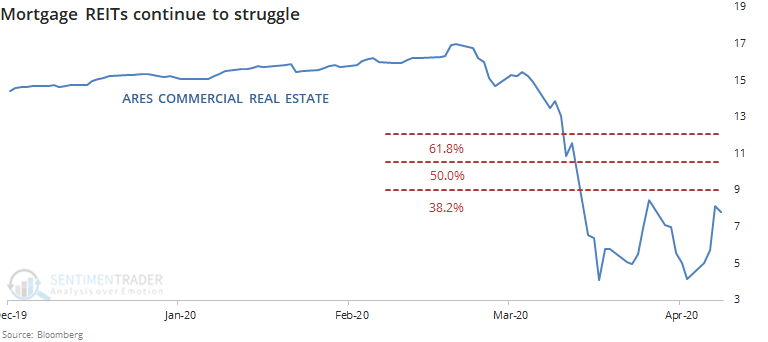
According to some, mortgage REITs are the canary in the coal mine if this whole thing is going to turn into a prolonged crisis. And so far, their bounces have been uninspiring.
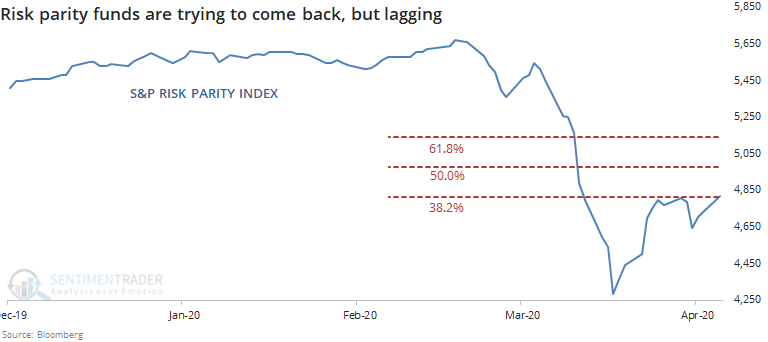
While funds employing "black swan" strategies made up years worth of losses when volatility spiked, risk parity funds suffered the opposite fate. This is another corner of the market where some think we could see systemic risk, but so far they've been bouncing and doing okay.
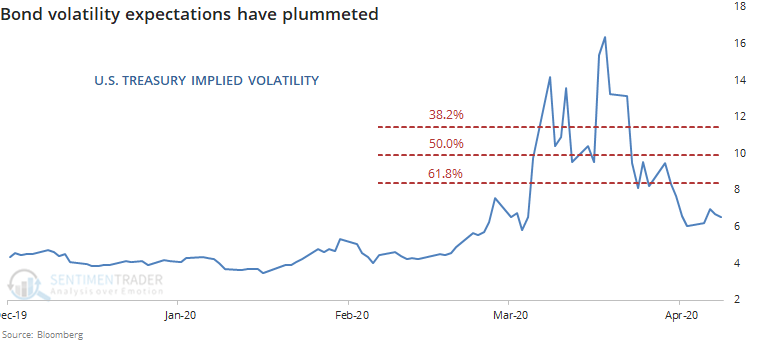
We should see traders more and more willing to price in lower volatility expectations as a recovery takes hold, and we have.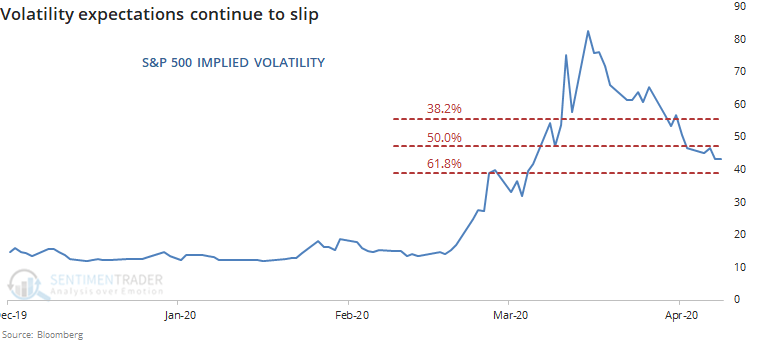
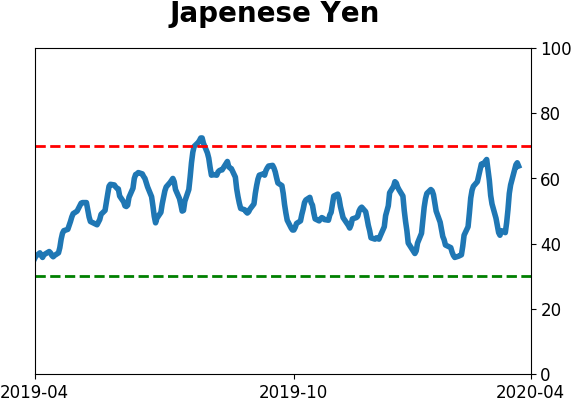
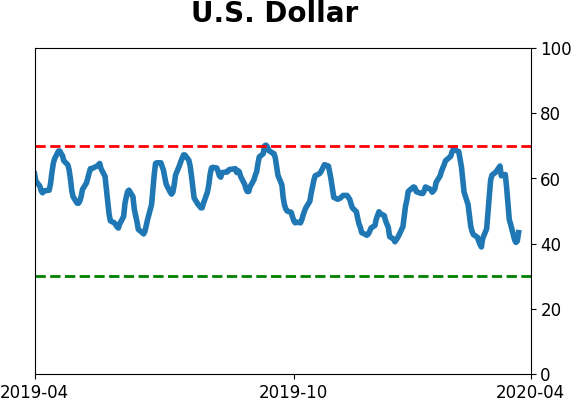
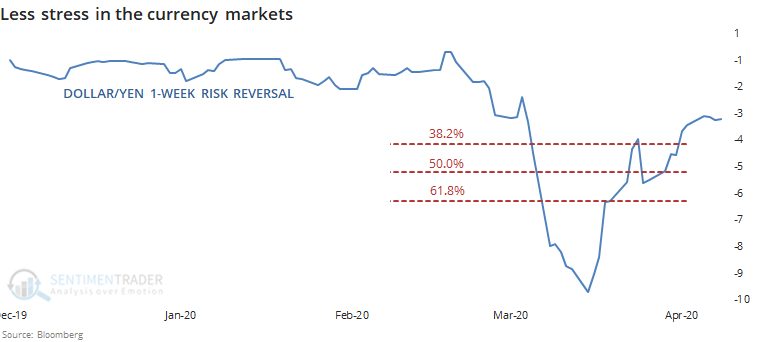
One of the signs of stress at the height of the panic was demand for dollars, and the dollar/yen risk reversal exploded like it did in 2008. Traders would not want to see this widen out again, and so far it's been contained.
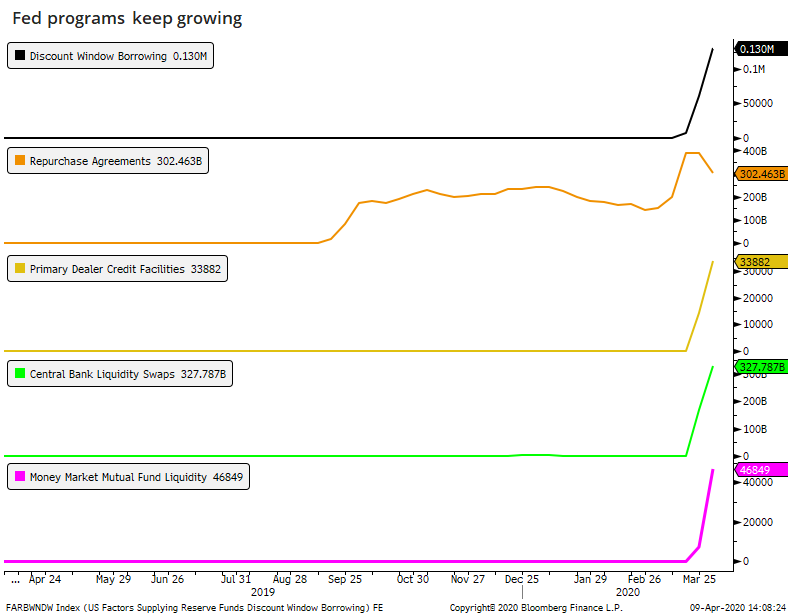
In a surprise to no one, there is still demand for the Fed's newly introduced programs. This will be the case for weeks, maybe even months, but bulls should like to see this peak sooner rather than later.
Overall, there is little here that screams "bullish," unlike a lot of the breadth stuff we've looked at. Most corners of the market are recovery, it's just not very convincing. It would be easier to have more faith in the idea of a recovery if it broadened out and signs of stress in the most exposed corners eased more than they have.
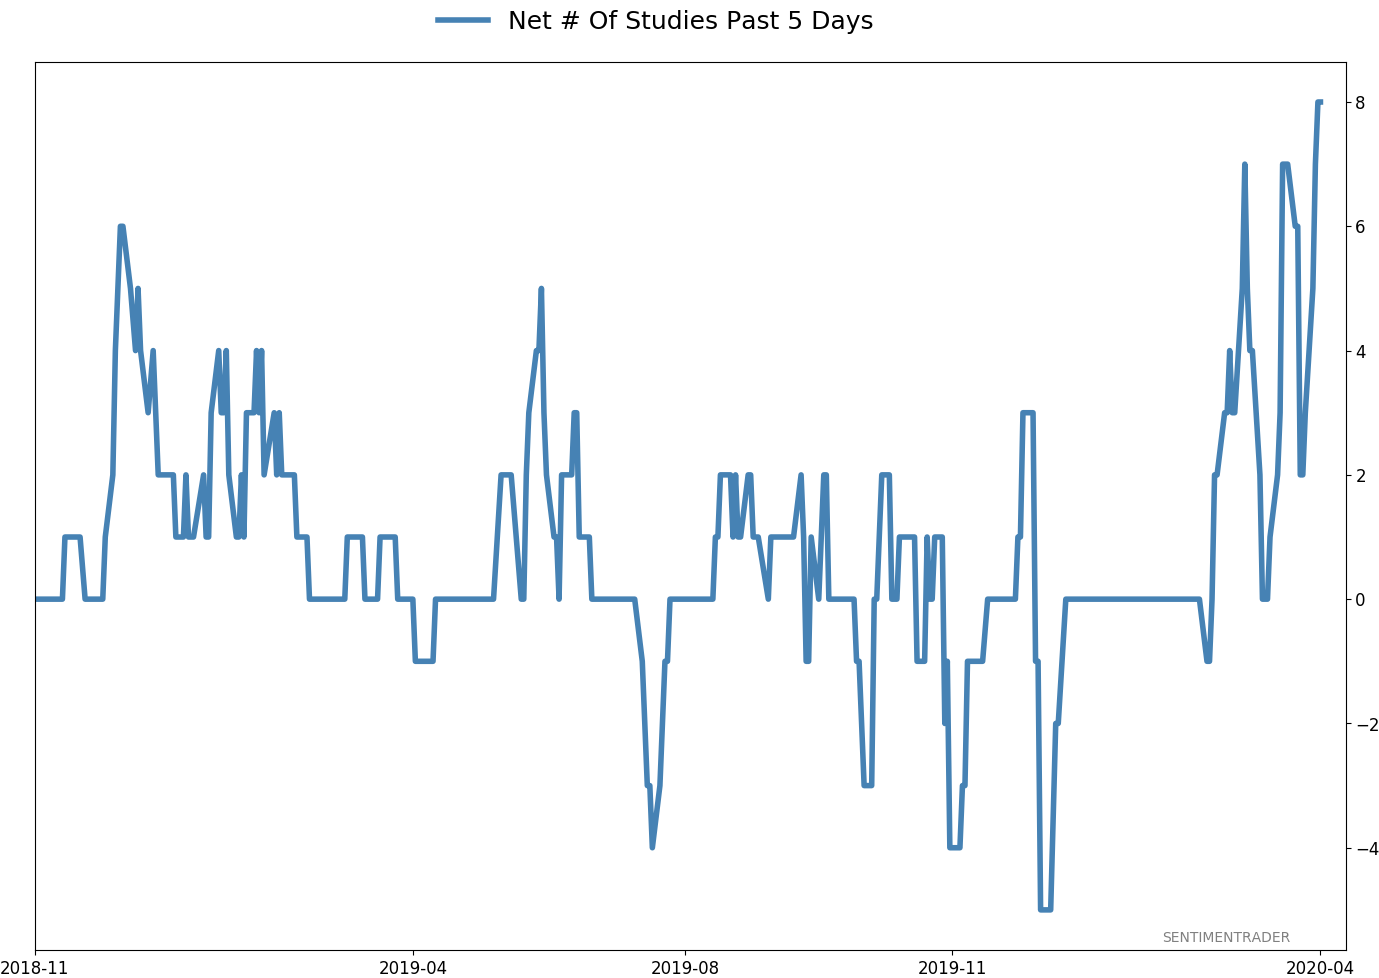
Active Studies
| Time Frame | Bullish | Bearish | | Short-Term | 0 | 1 | | Medium-Term | 11 | 0 | | Long-Term | 29 | 3 |
|
Indicators at Extremes
Portfolio
| Position | Weight % | Added / Reduced | Date | | Stocks | 73.2 | Added 31.3% | 2020-03-17 | | Bonds | 0.0 | Reduced 6.7% | 2020-02-28 | | Commodities | 5.5 | Added 2.4%
| 2020-02-28 | | Precious Metals | 0.0 | Reduced 3.6% | 2020-02-28 | | Special Situations | 0.0 | Reduced 31.9% | 2020-03-17 | | Cash | 21.3 | | |
|
Updates (Changes made today are underlined)
In the first months of the year, we saw manic trading activity. From big jumps in specific stocks to historic highs in retail trading activity to record highs in household confidence to almost unbelievable confidence among options traders. All of that has come amid a market where the average stock can’t keep up with their indexes. There were signs of waning momentum in stocks underlying the major averages, which started triggering technical warning signs in late January. The kinds of extremes we saw in December and January typically take months to wear away, but the type of selling we’ve seen over the past month has gone a long way toward getting there. When we place the kind of moves we saw into March 23 into the context of coming off an all-time high, there has been a high probability of a multi-month rebound. The volatility we’ve seen lately is extremely compelling from a medium-term point of view. Virtually everything we’ve looked at suggests a strong probability of gains over the next several months, even within the context of a potential bear market, and even from what had been higher prices. After stocks bottomed on the 23rd, they enjoyed a historic buying thrust. While other signs are mixed at best that panic is subsiding, that thrust is one of the most encouraging sign we've seen in years. There is often a test of a panic low in the weeks after an initial recovery, but that thrust we saw, combined with the larger-than-usual retracement, have me less convinced a test is necessary. For now, I see no overwhelming reason to add or reduce exposure.
RETURN YTD: -10.8% 2019: 12.6%, 2018: 0.6%, 2017: 3.8%, 2016: 17.1%, 2015: 9.2%, 2014: 14.5%, 2013: 2.2%, 2012: 10.8%, 2011: 16.5%, 2010: 15.3%, 2009: 23.9%, 2008: 16.2%, 2007: 7.8%
|
|
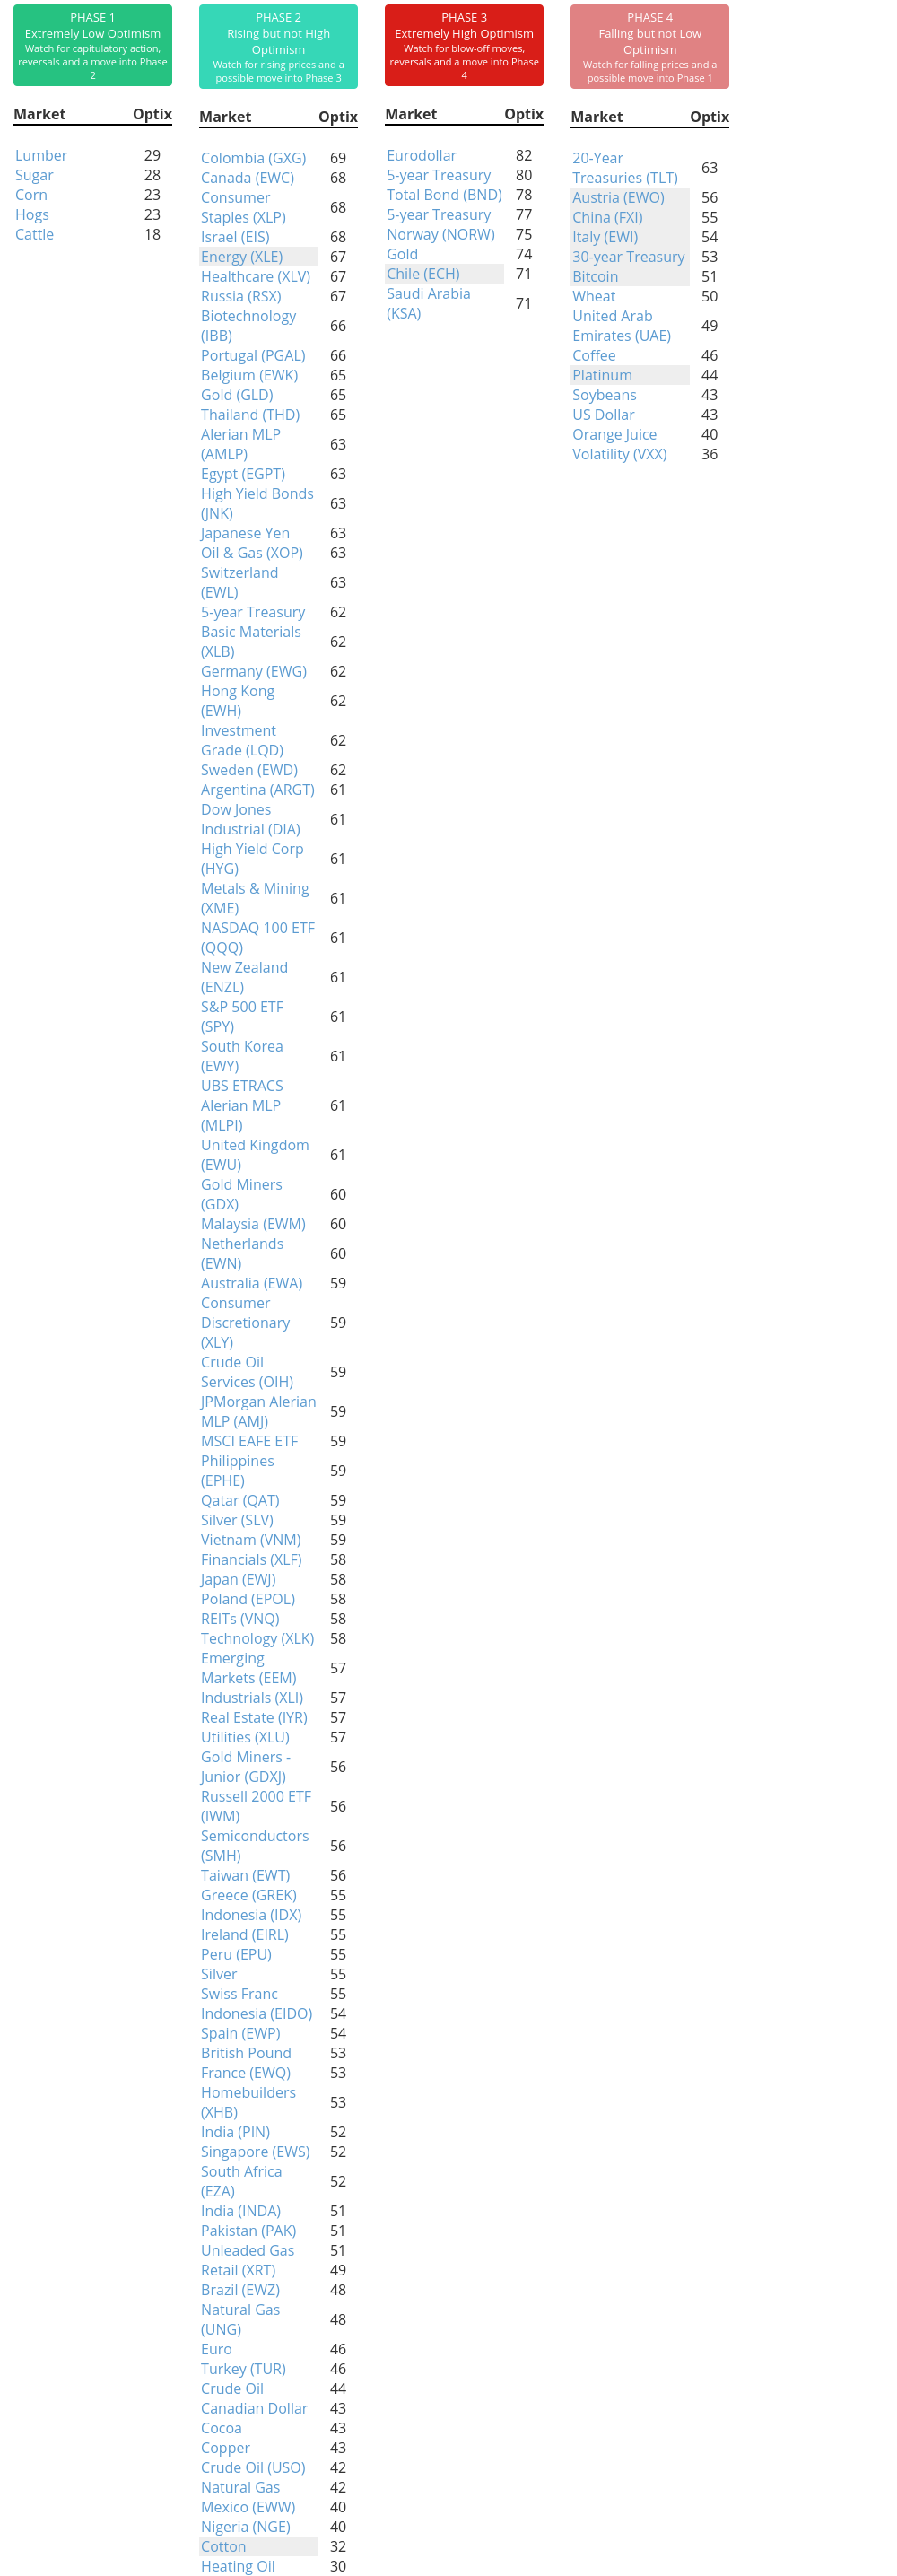
Phase Table
Ranks
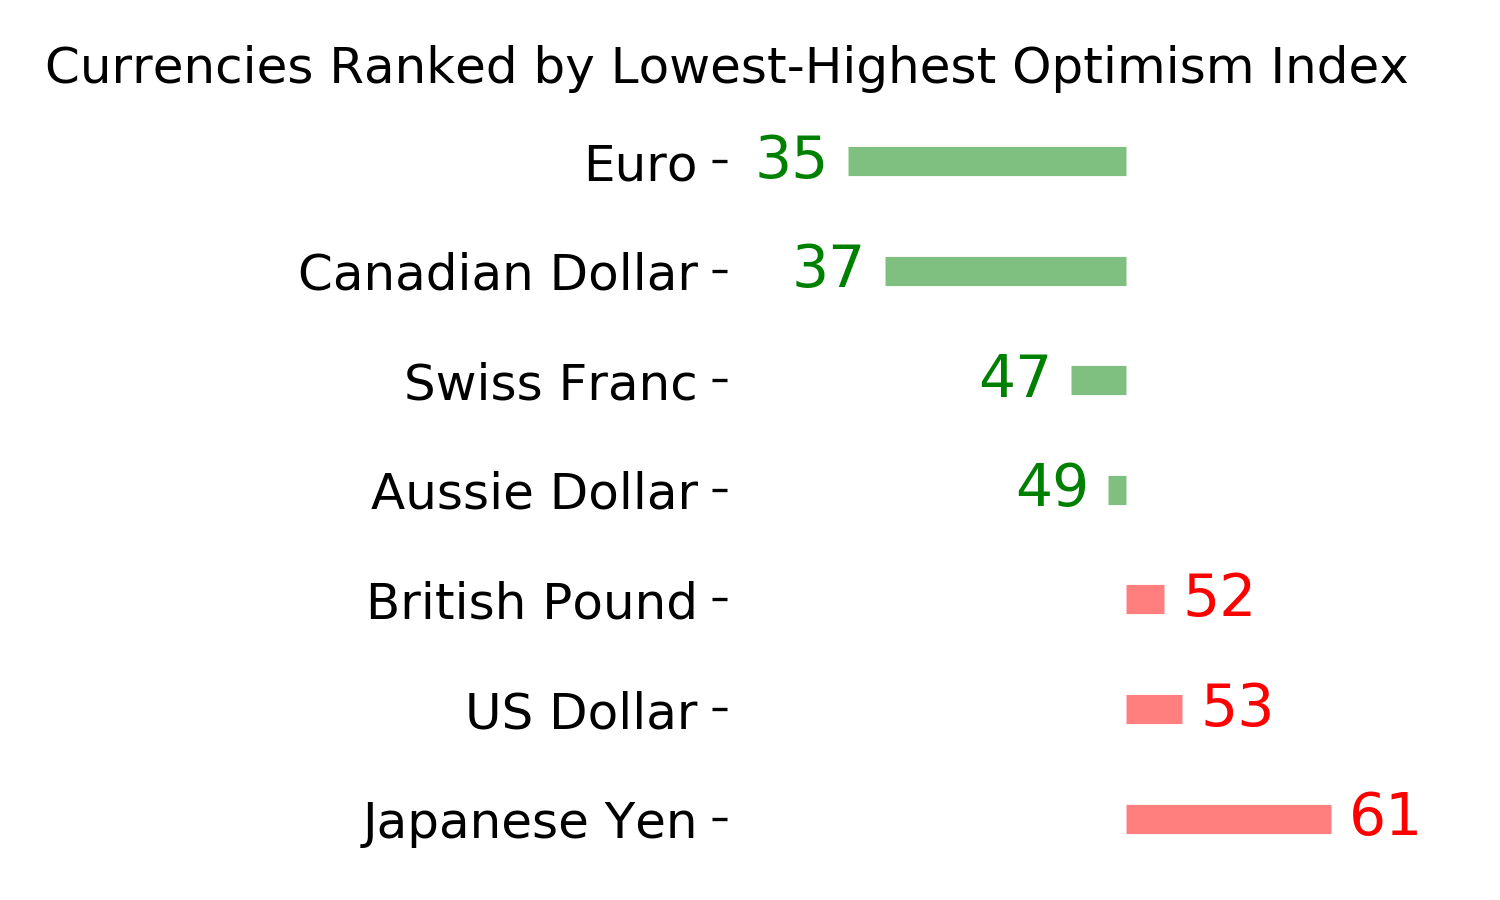
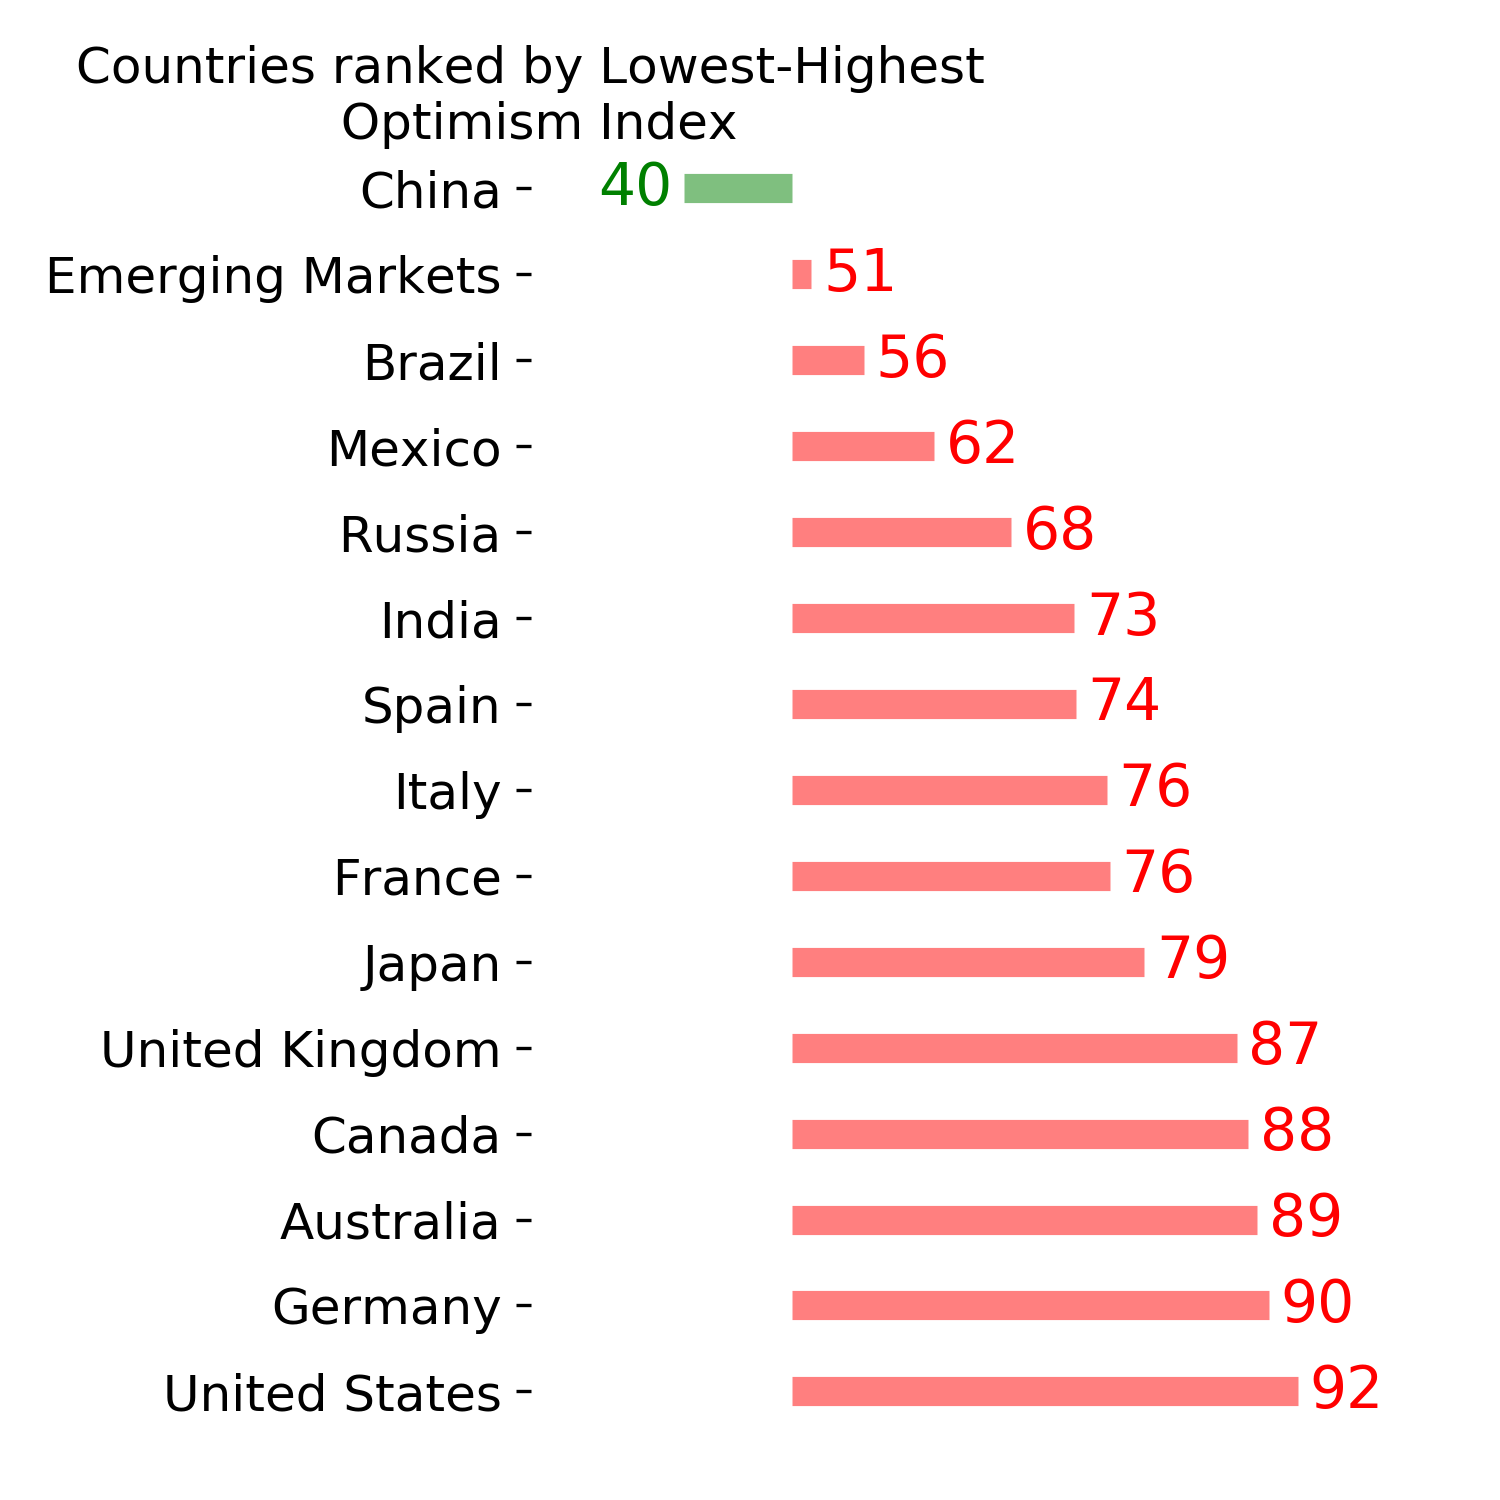
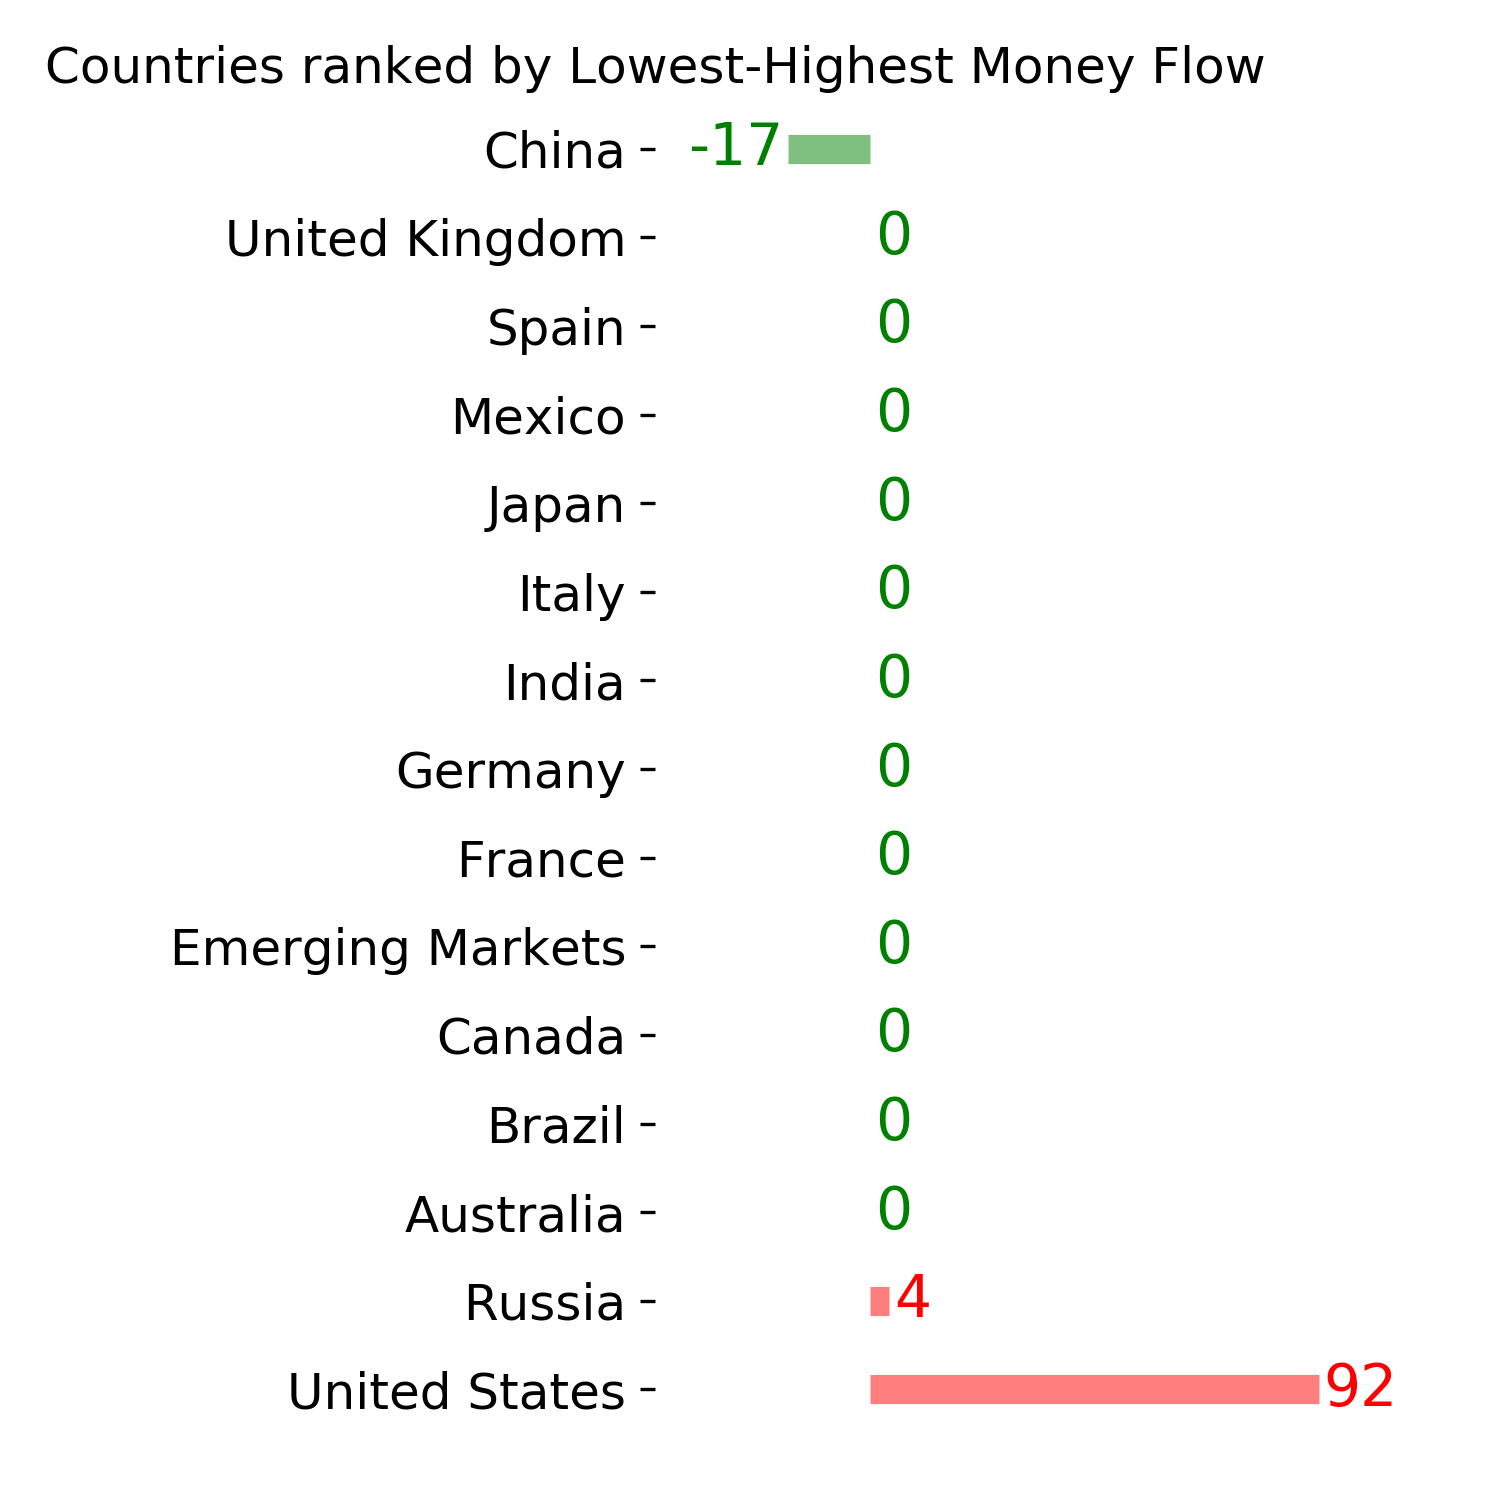
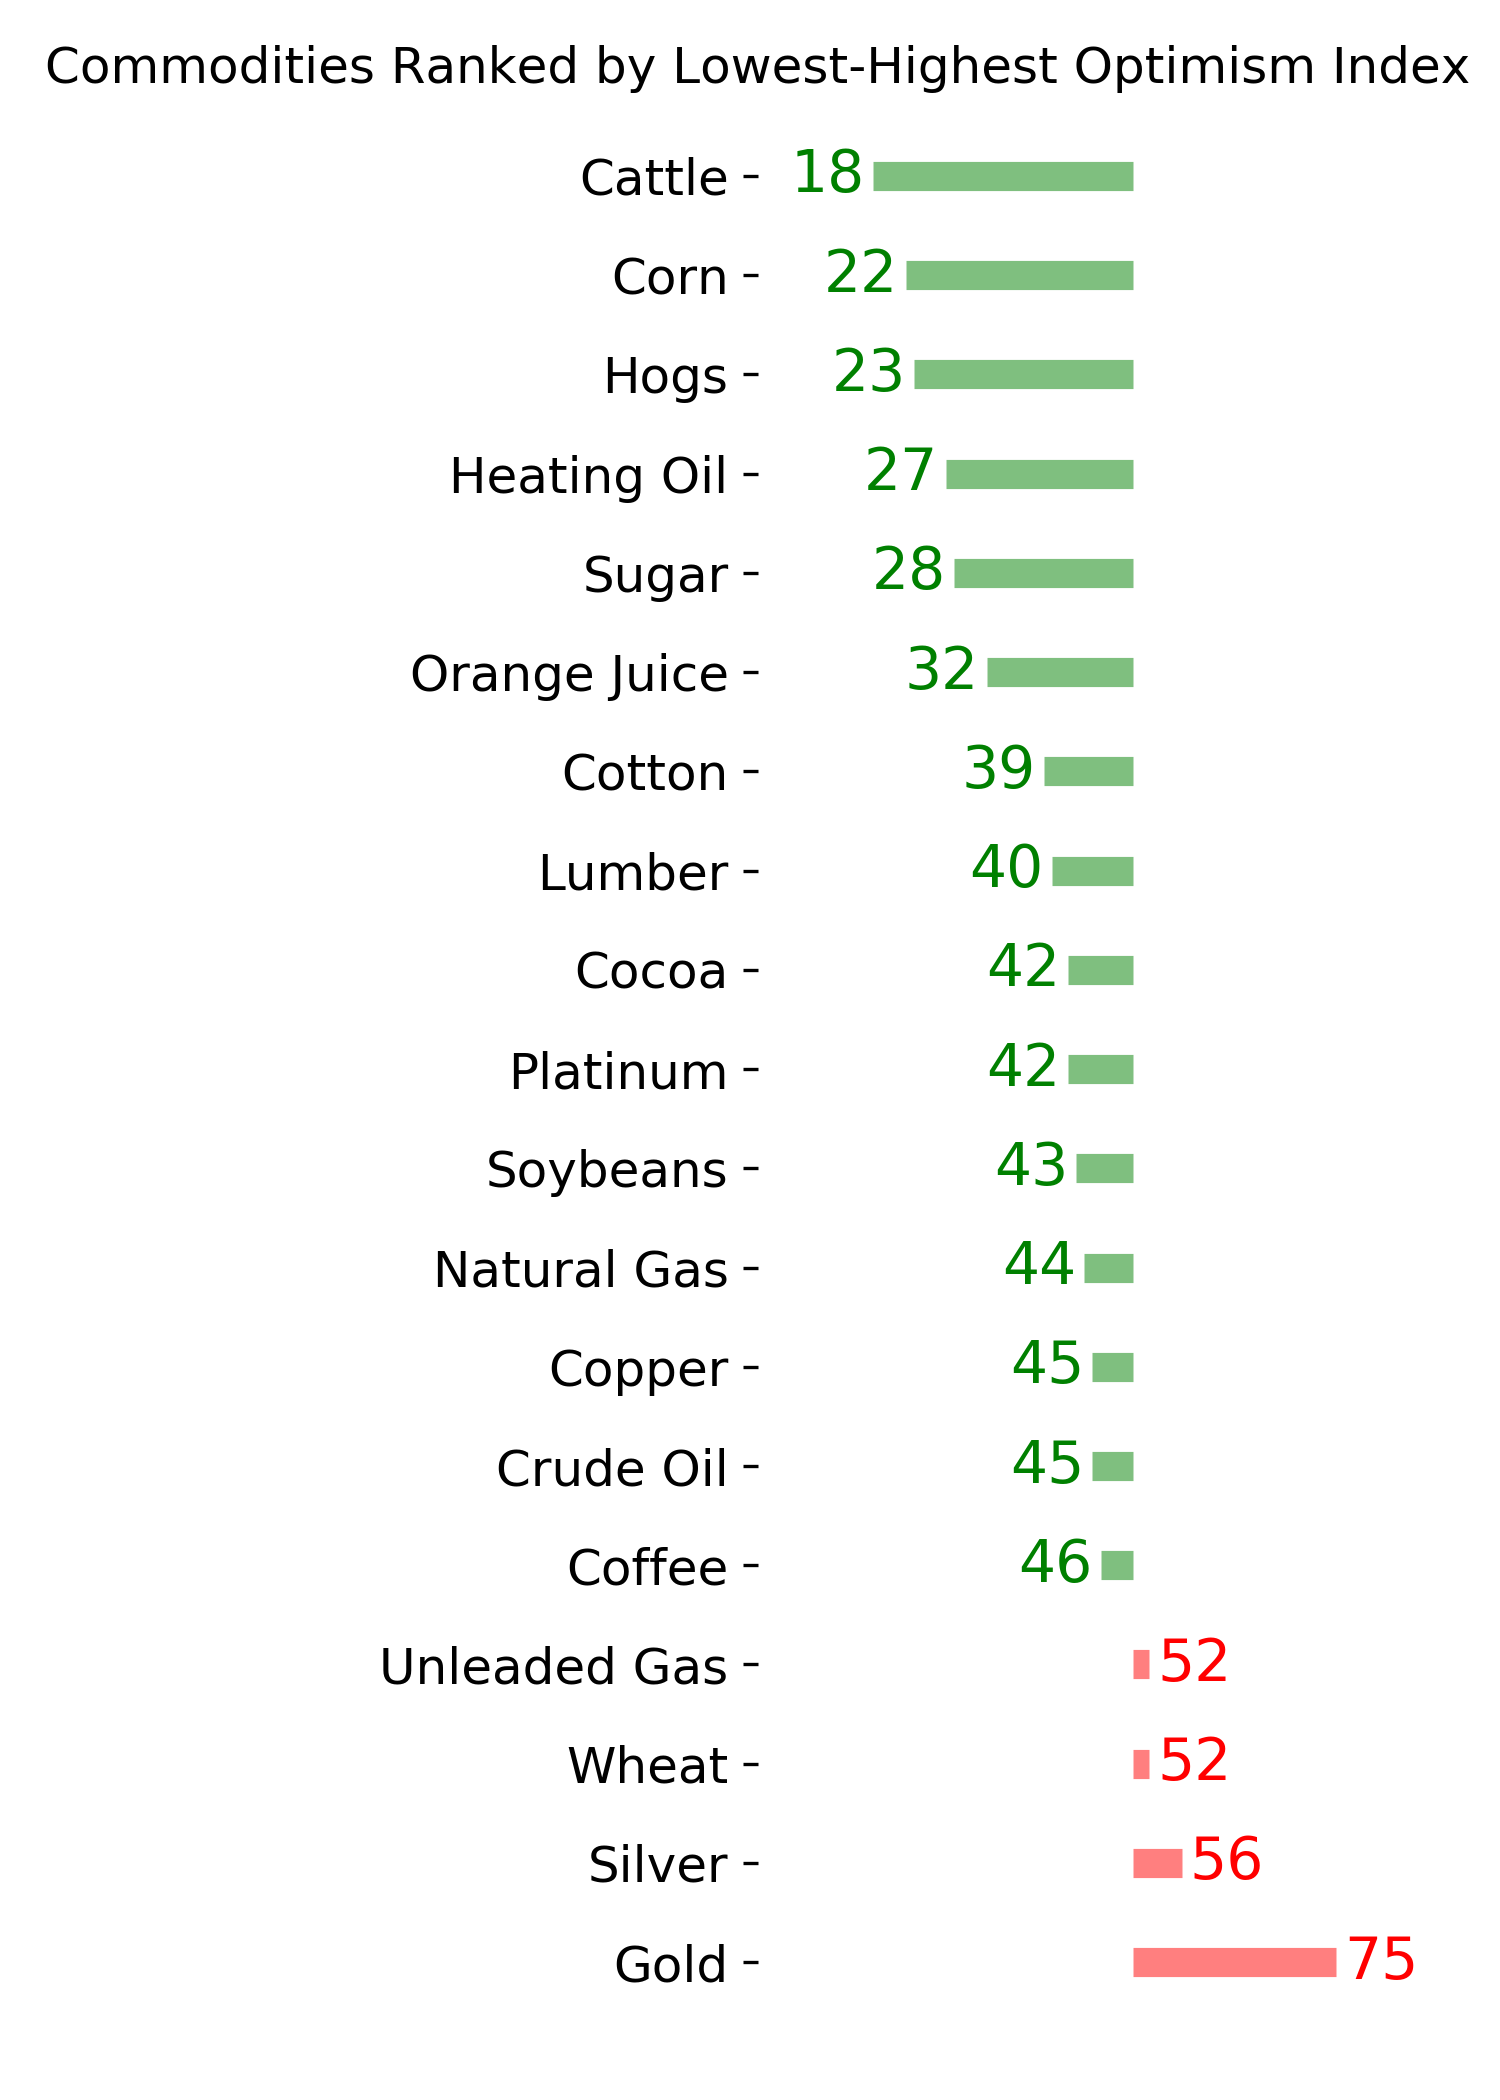
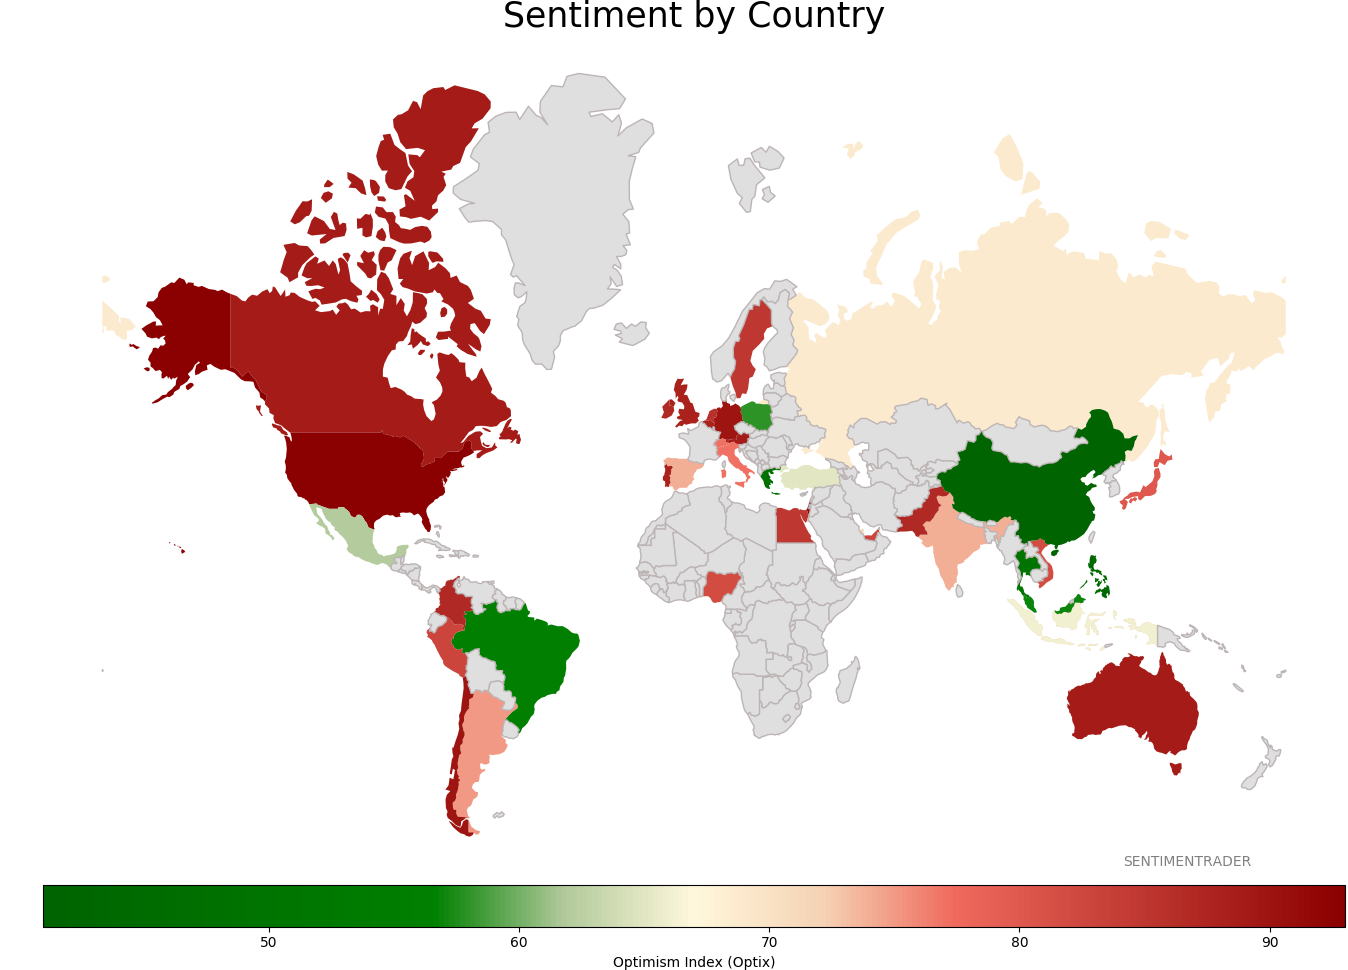
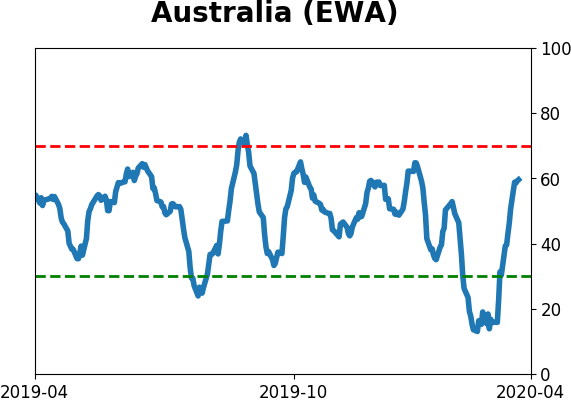
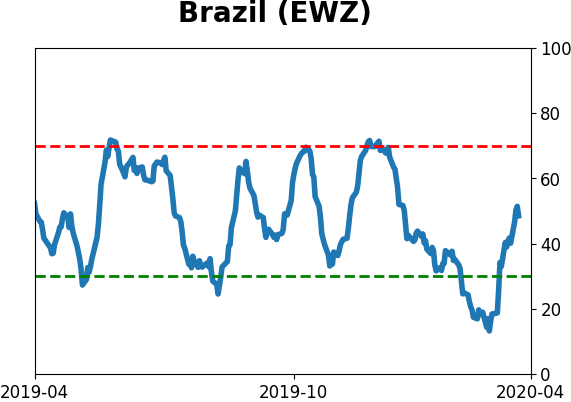
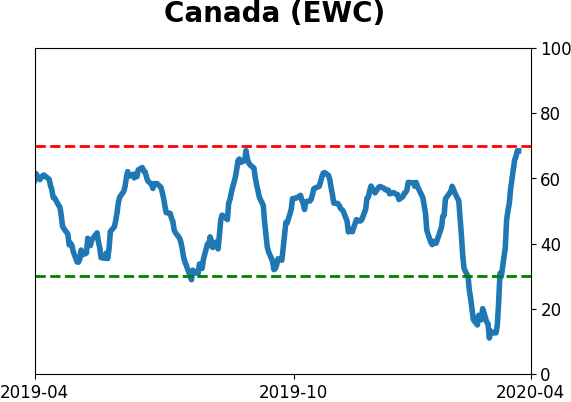
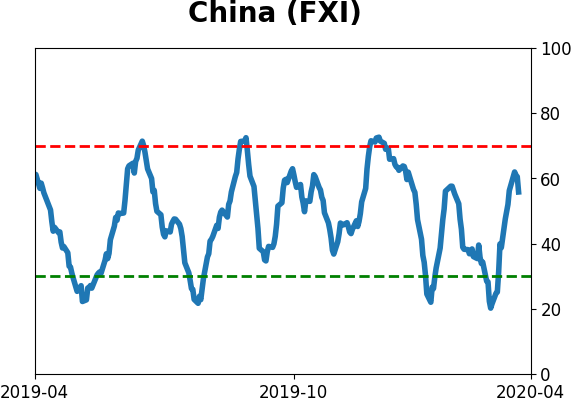
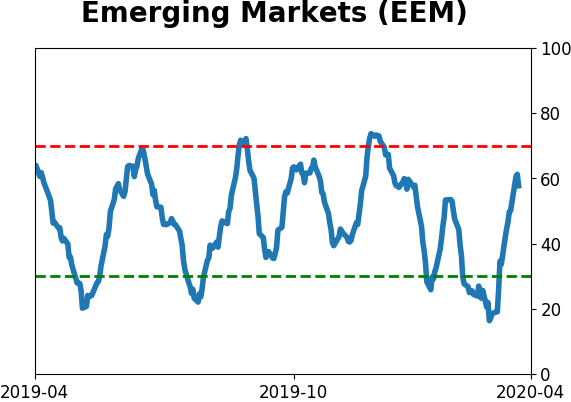
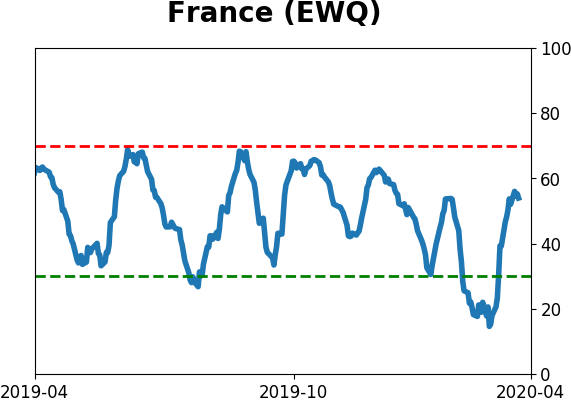
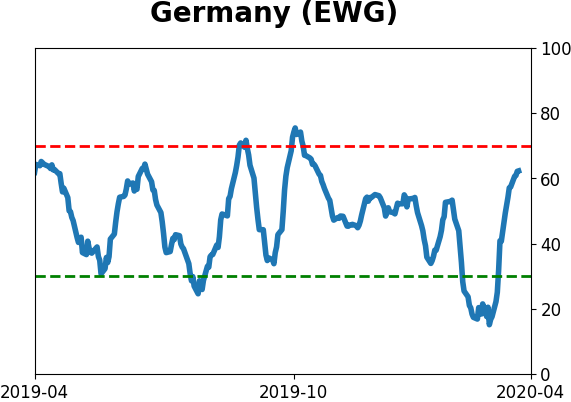
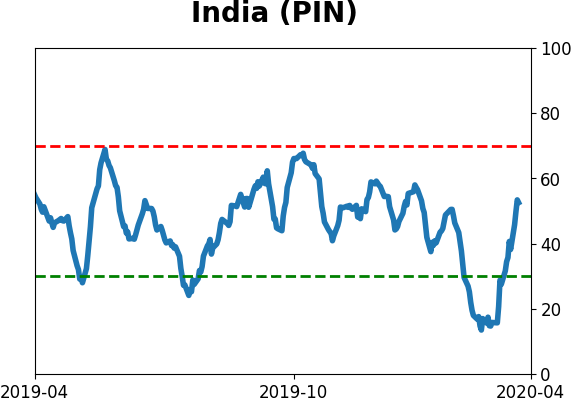
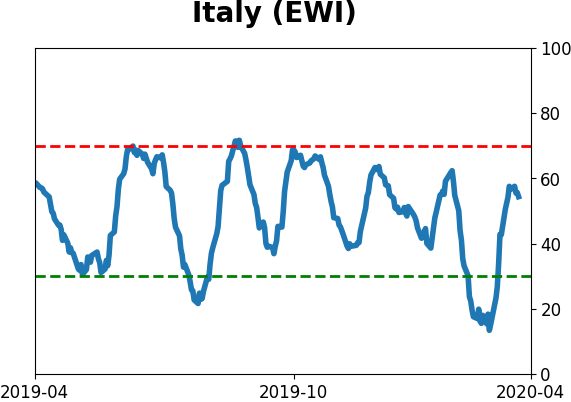
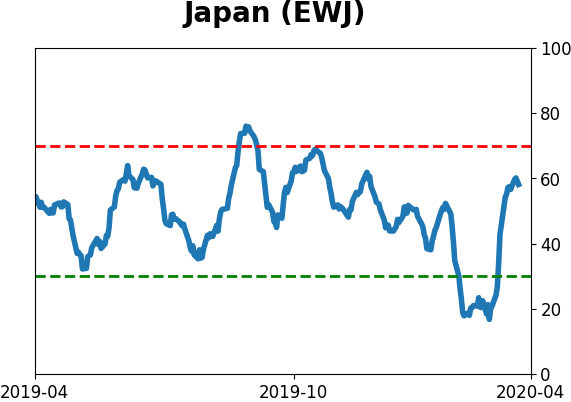
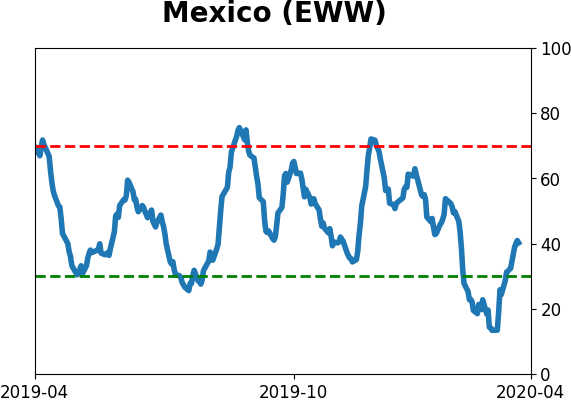
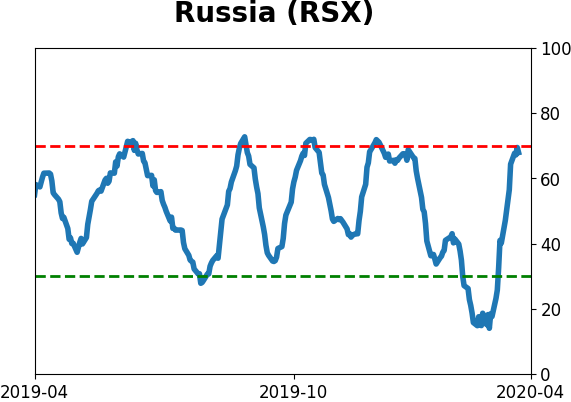
Sentiment Around The World
Optimism Index Thumbnails
|
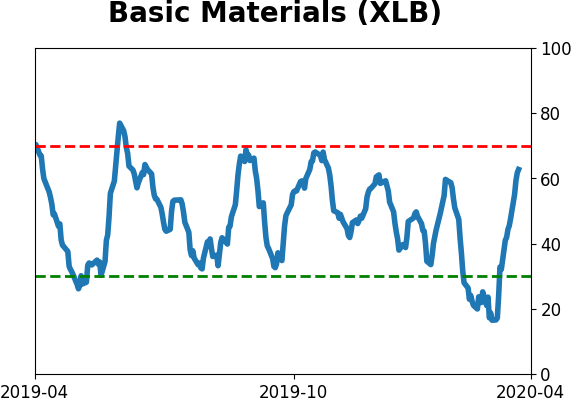
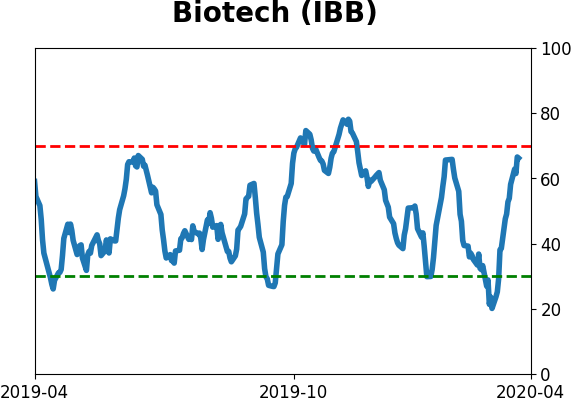
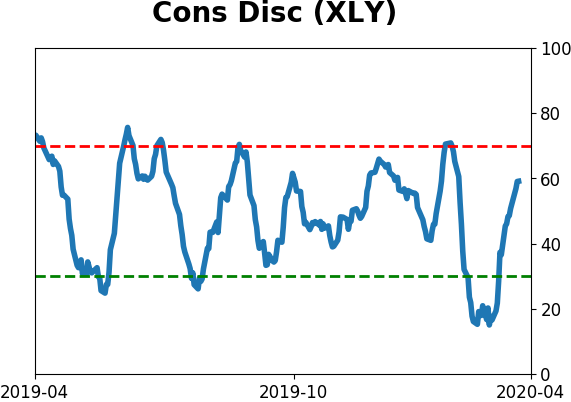
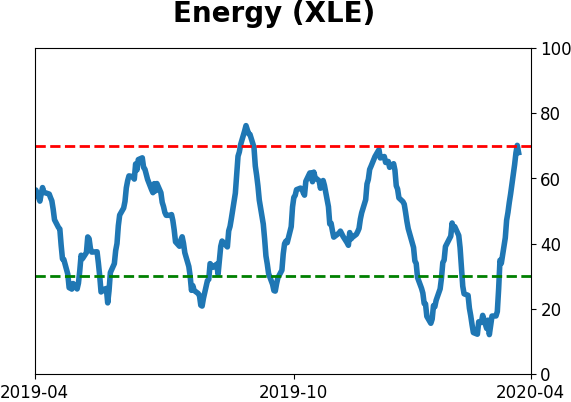
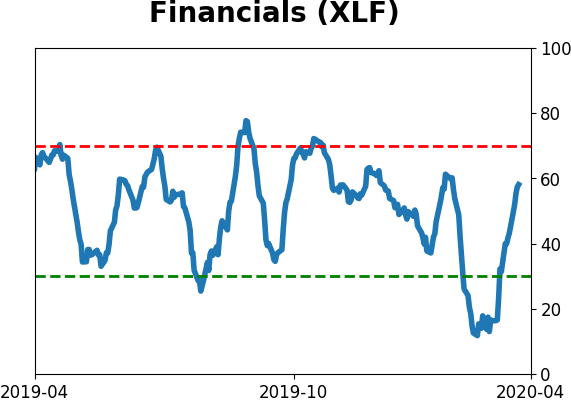
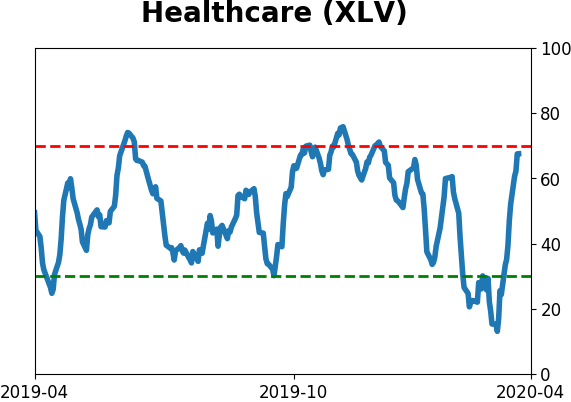
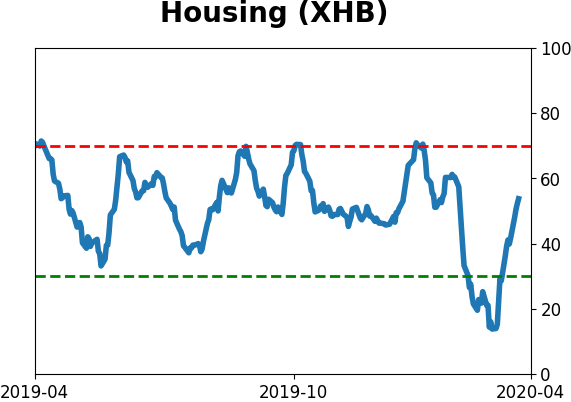
Sector ETF's - 10-Day Moving Average
|
|
|
Country ETF's - 10-Day Moving Average
|
|
|
Bond ETF's - 10-Day Moving Average
|
|
|
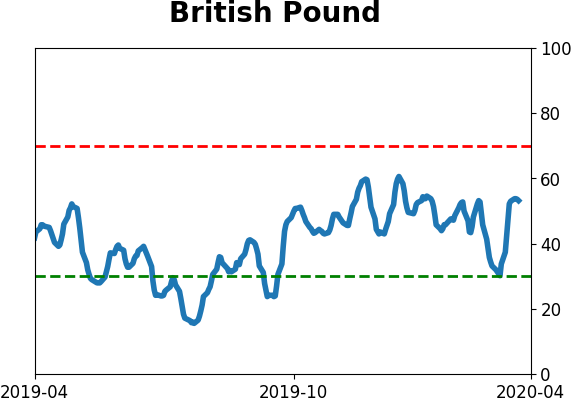
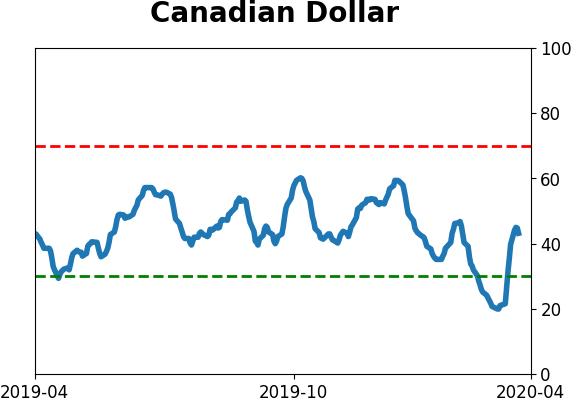
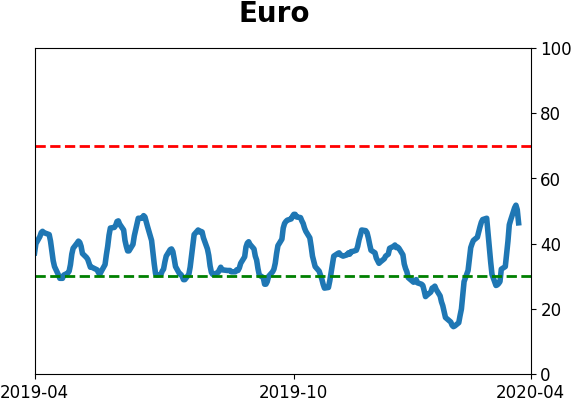
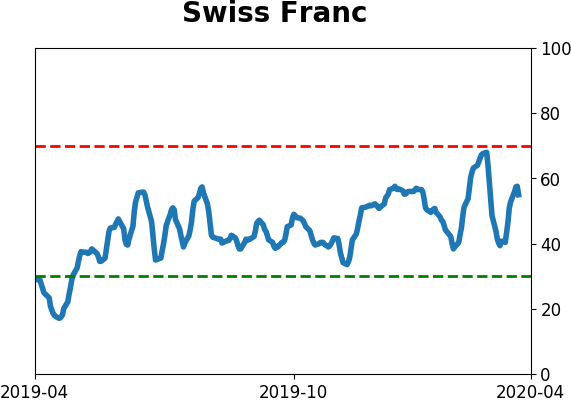
Currency ETF's - 5-Day Moving Average
|
|
|
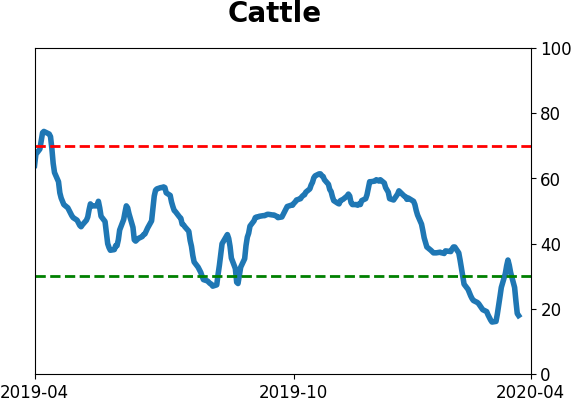
Commodity ETF's - 5-Day Moving Average
|
|