Headlines
|
|
Breadth is recovering, too:
An increasing number of stocks are recovering after hitting a historic level of oversold in March. That is causing the McClellan Summation to curl up and new 52-week highs to outnumber 52-week lows. We also just saw a 2nd day with 90% Up Volume, a rare and powerful thrust signal.
Sentiment has recovered out of deep pessimism:
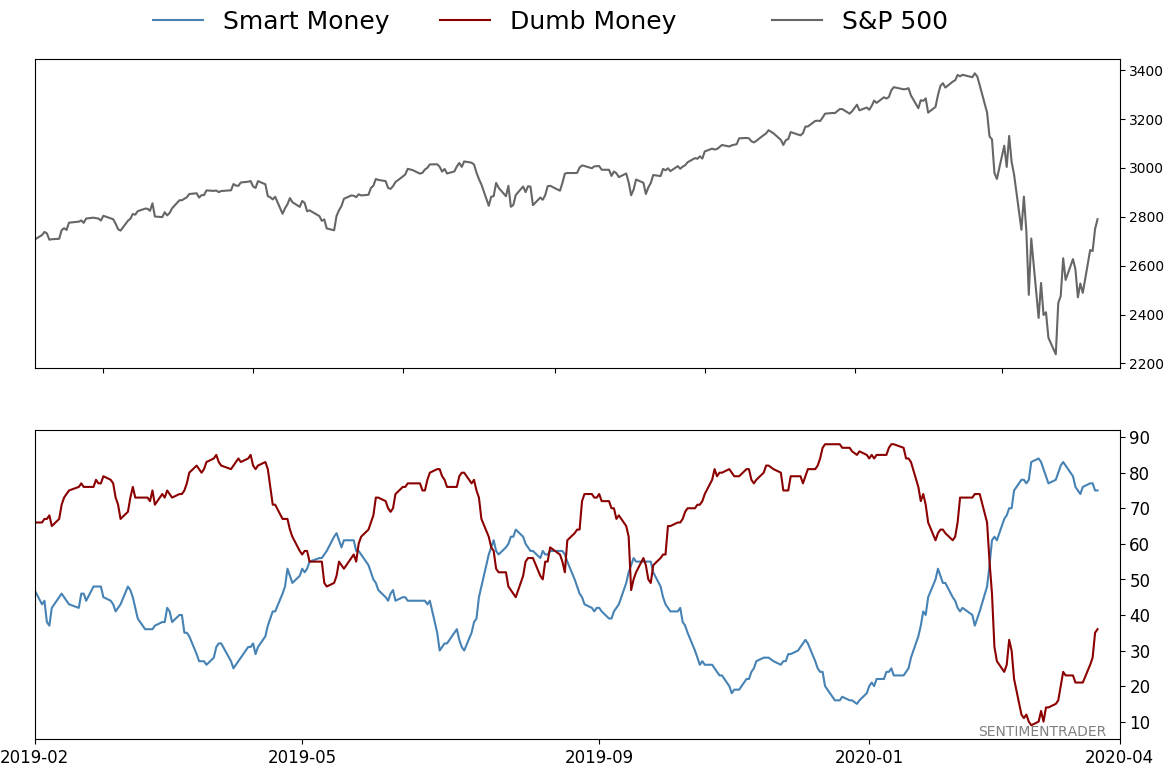
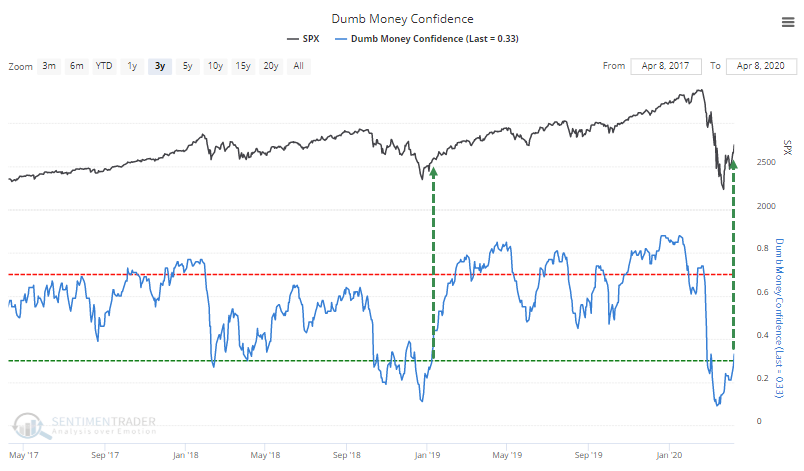
The CNN Fear & Greed model has moved into neutral territory. Dumb Money Confidence has finally pulled out of a stretch of deep pessimism. During bull markets, this is usually a sign the worst is behind us. During bear markets, this is where markets usually run into trouble.
Volume decline: As stocks have rallied, volume in the major equity ETFs has dropped. That's usually given as a negative from textbook technicians, but it's a demonstrably false premise. In a premium note, Troy shows that volume in SPY, IWM, and QQQ have all dropped dramatically. And when any of them have rallied 10% or more and volume plummeted, they've all been solidly higher across most time frames. When IWM rallied 10% over several weeks while its volume fell 20%, it was higher 2 months later 9 of 11 times by an average of 5.6%.
|
Smart / Dumb Money Confidence
|
Smart Money Confidence: 75%
Dumb Money Confidence: 36%
|
|
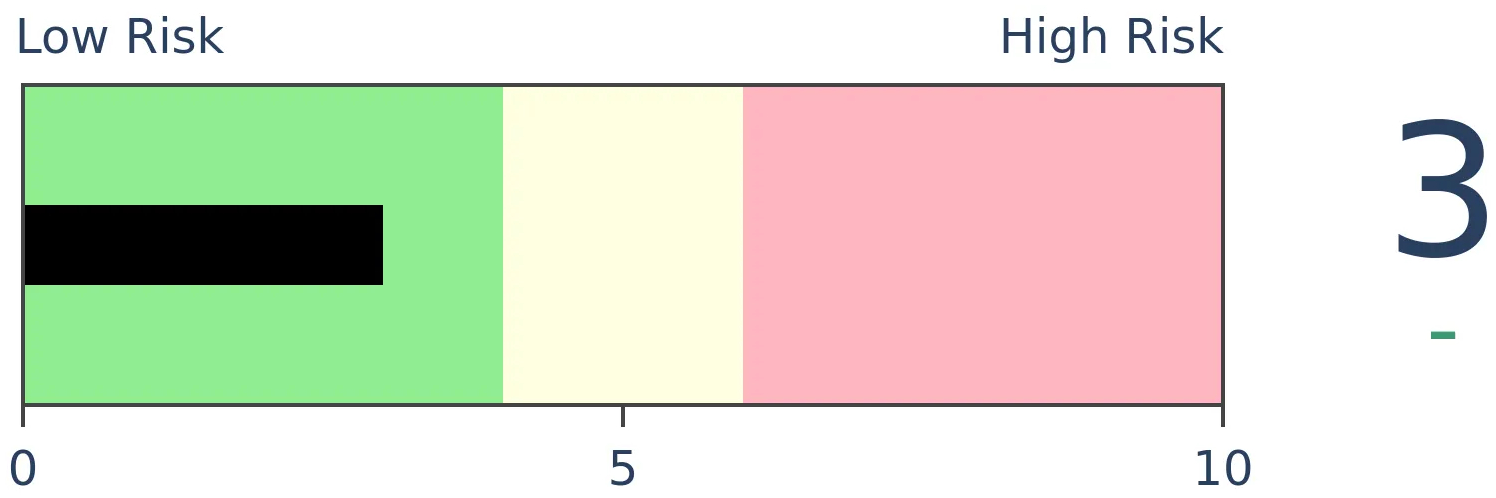
Risk Levels
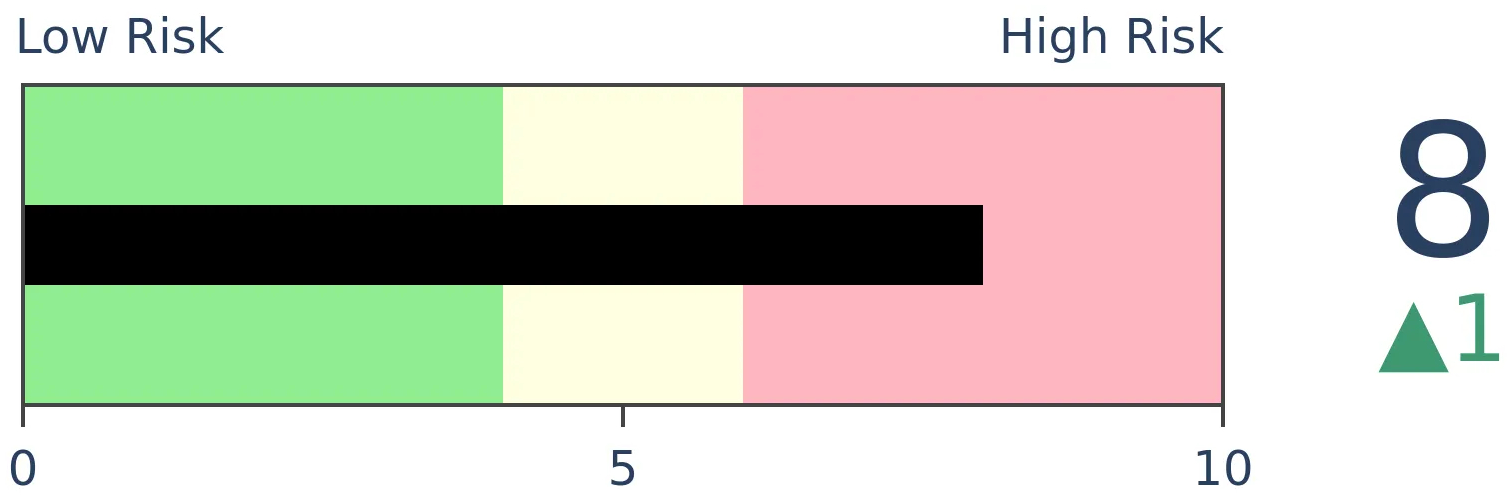
Stocks Short-Term
|
Stocks Medium-Term
|
|
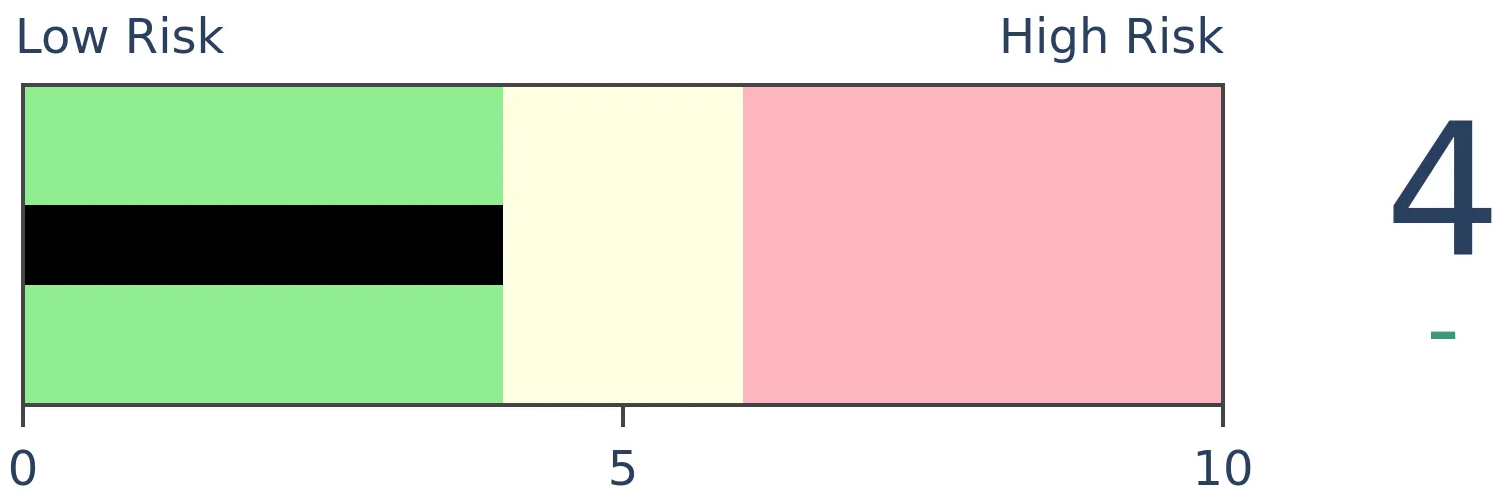
Bonds
|
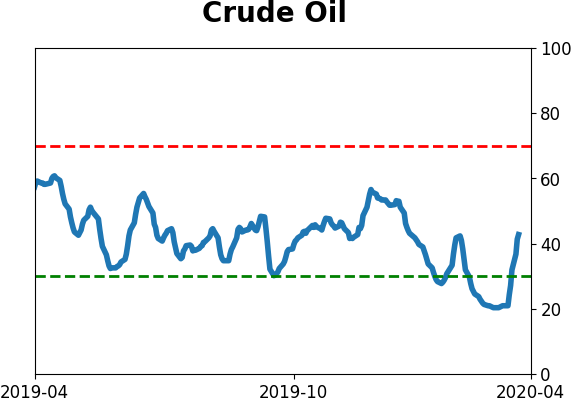
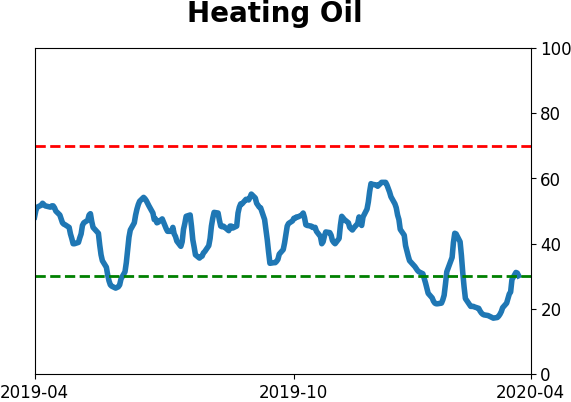
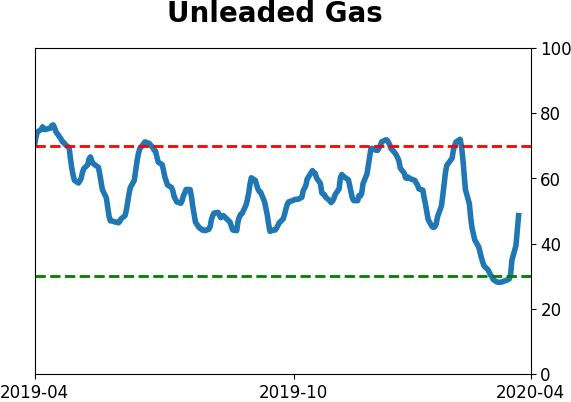
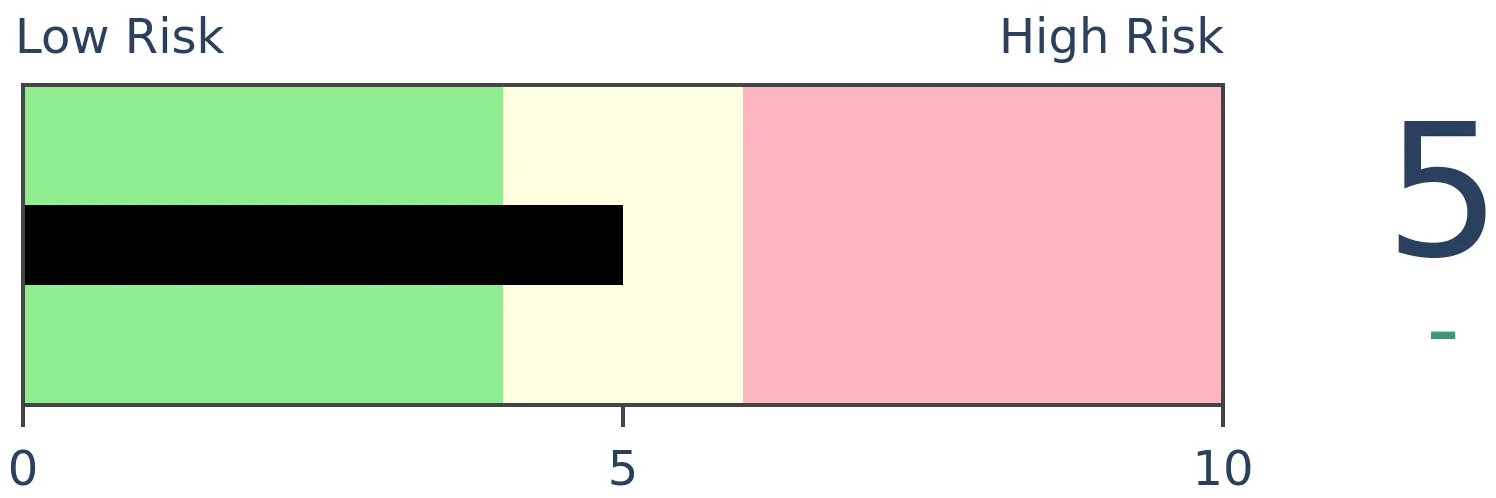
Crude Oil

|
|
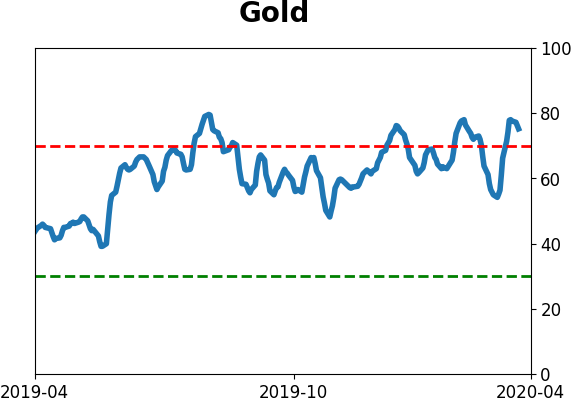
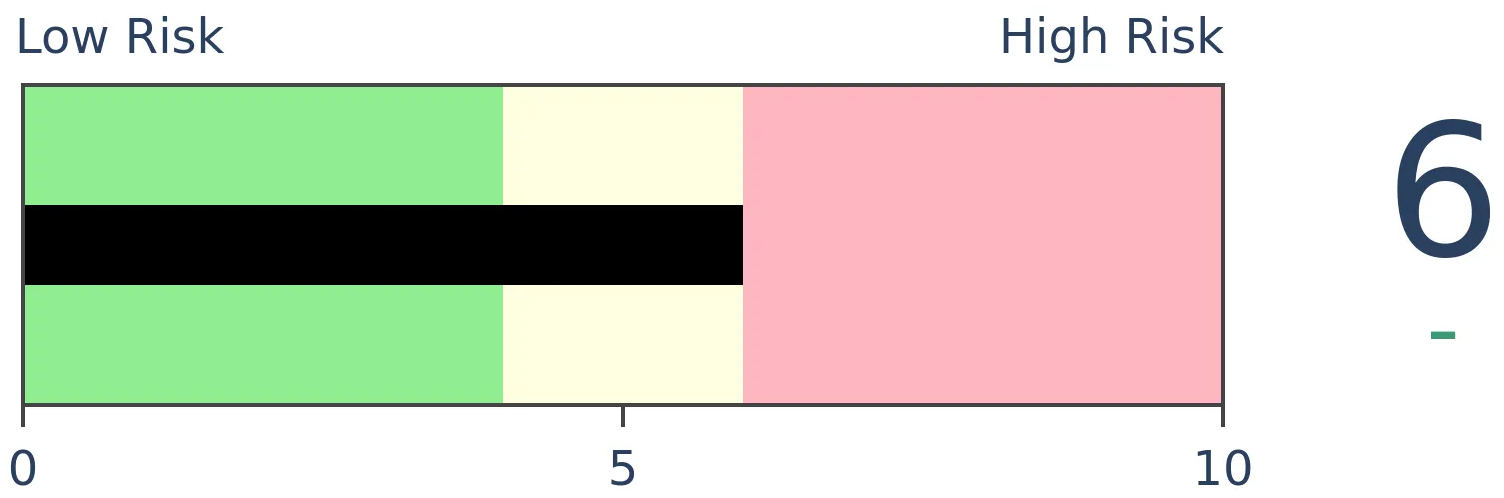
Gold
|
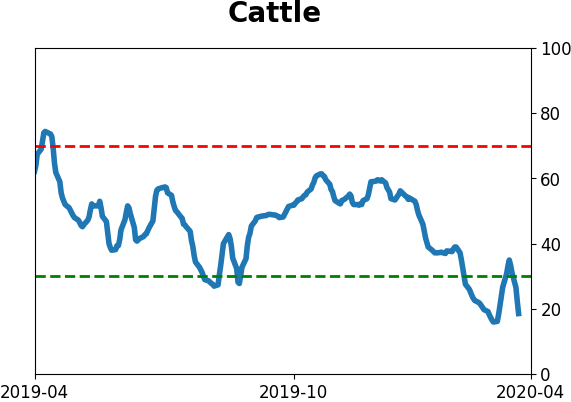
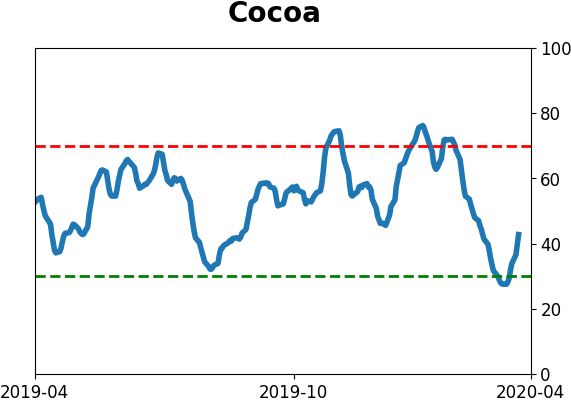
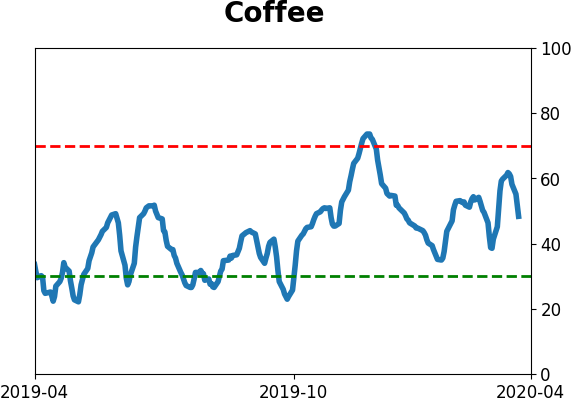
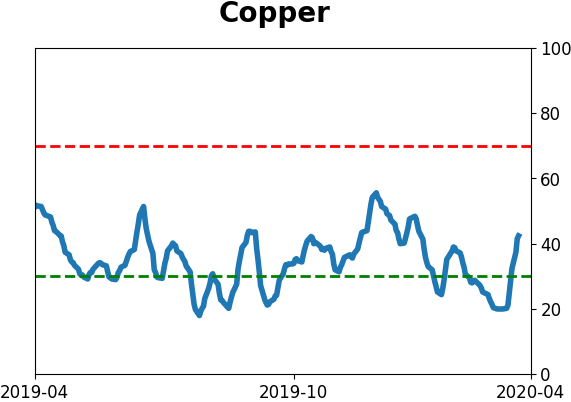
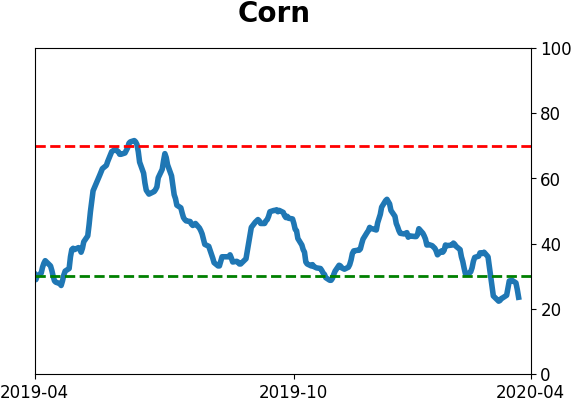
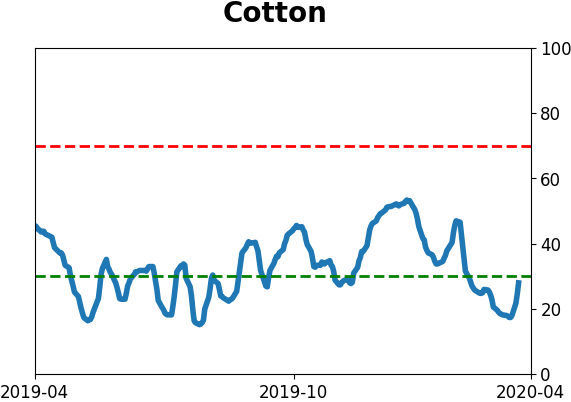
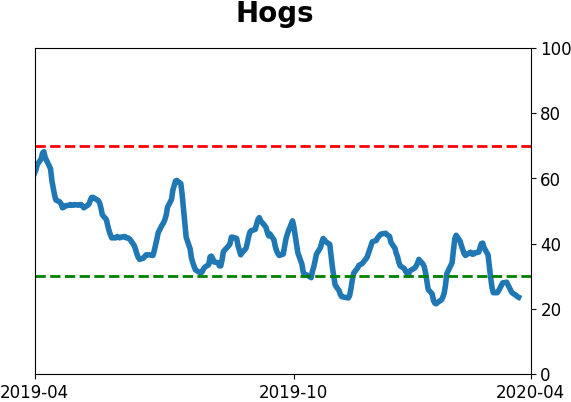
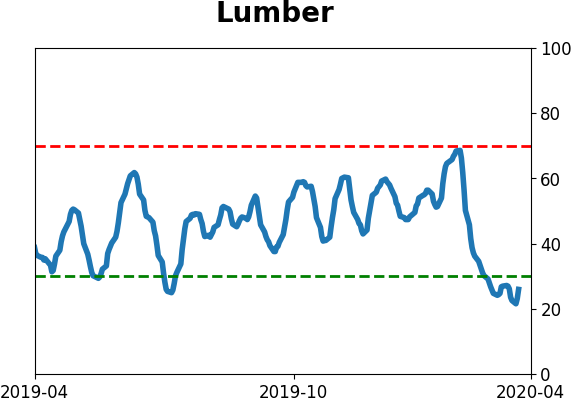
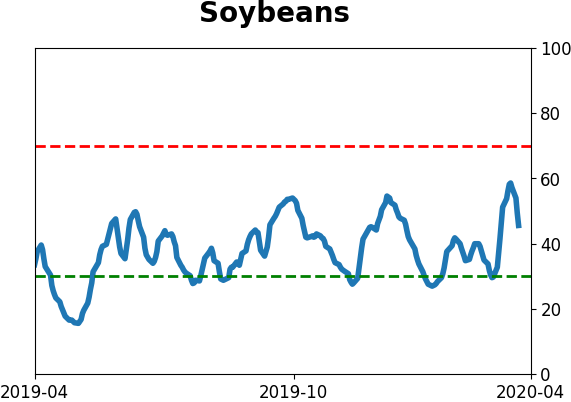
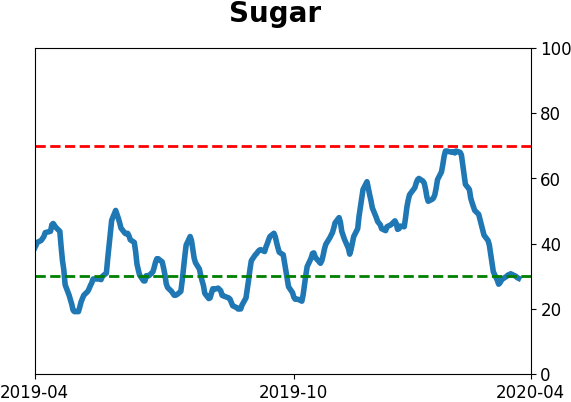
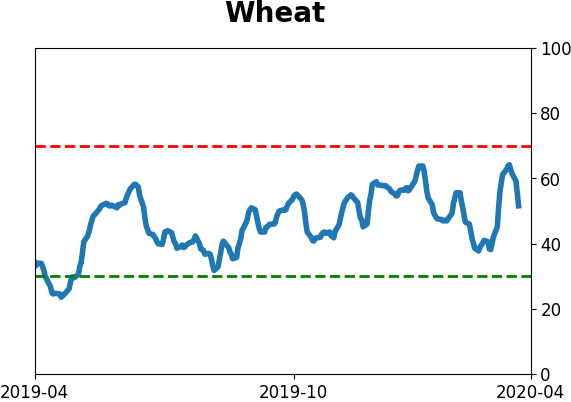
Agriculture
|
|
Research
BOTTOM LINE
An increasing number of stocks are recovering after hitting a historic level of oversold in March. That is causing the McClellan Summation to curl up and new 52-week highs to outnumber 52-week lows. We also just saw a 2nd day with 90% Up Volume, a rare and powerful thrust signal.
FORECAST / TIMEFRAME
SPY -- Up, Long-Term
|
Earlier, we looked at recoveries in sentiment from deep pessimism. Short-term returns were not encouraging, especially during unhealthy market environments. If stocks can continue to recover despite "not pessimism," it will go a long way toward the idea that we're still in the midst of a mostly positive long-term market trend.
Optimism has been returning because more and more stocks have been coming along for the ride.
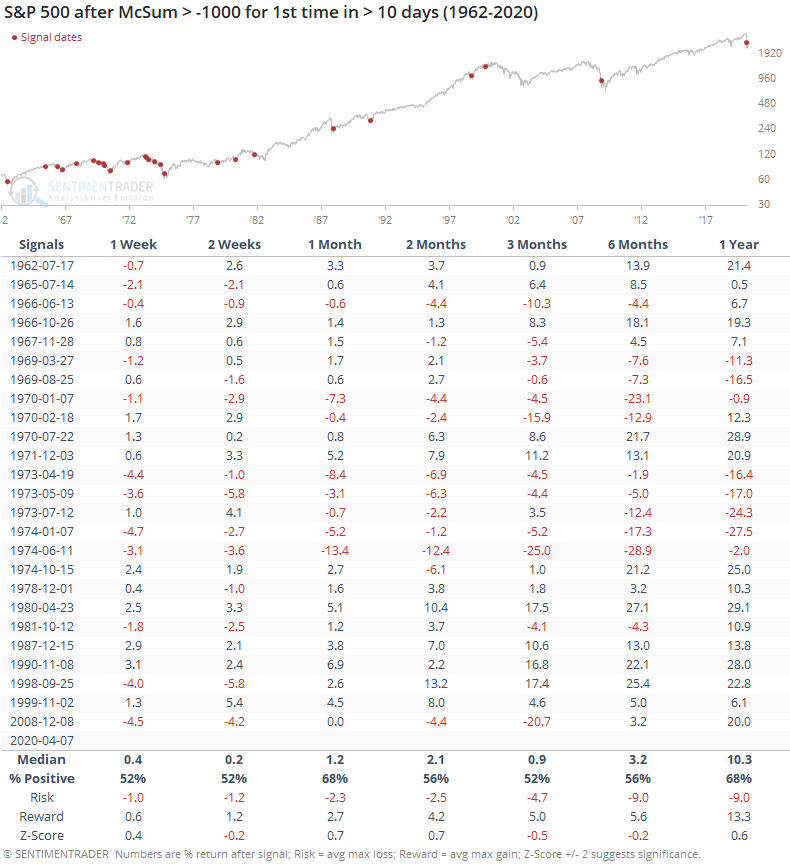
The long-term McClellan Summation Index is curling higher after the most oversold reading in a decade. It has climbed above -1000 after several weeks below.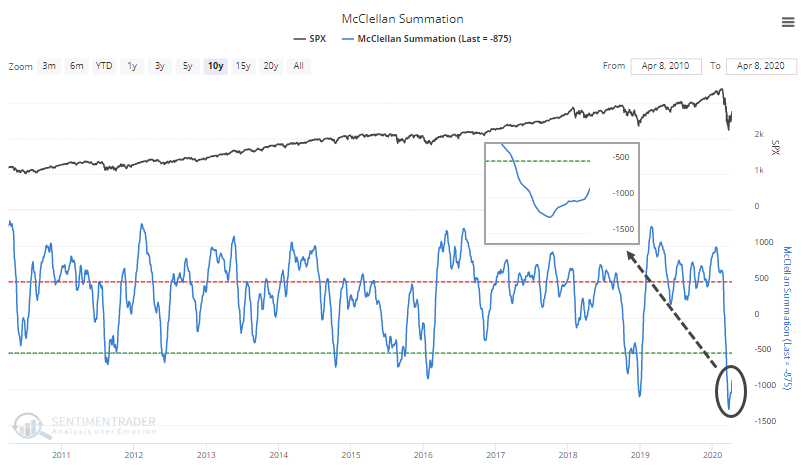
Similar recoveries led to a mixed bag of returns, especially in the 1970s.
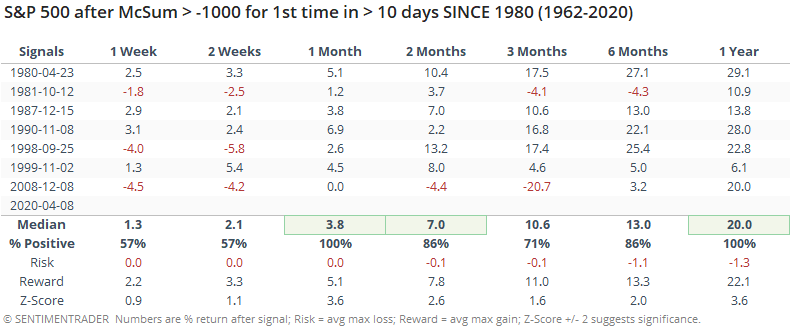
In recent decades, returns were much more consistently positive.
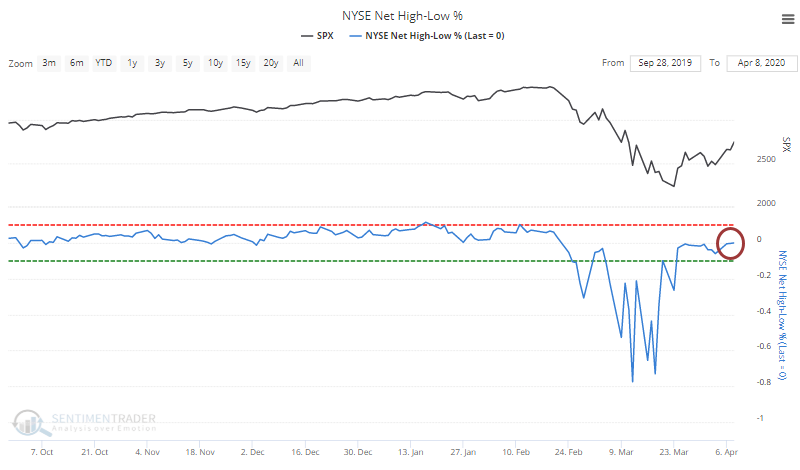
In March, we noted that 52-week lows were hitting rarely-seen or even record levels.
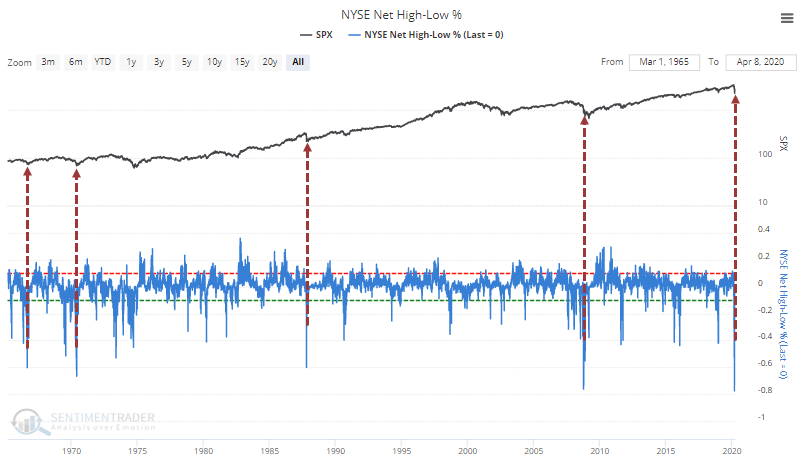
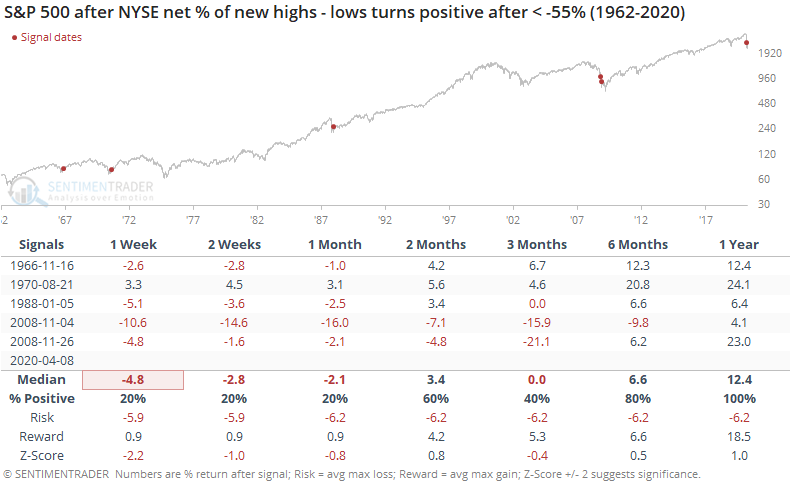
By Wednesday, there were finally more securities hitting 52-week highs than 52-week lows on the NYSE, reversing more than a month with more lows than highs.
Similar recoveries preceded some short-term ugliness, but longer-term positive returns. A year later, the S&P was higher all five times. Those false starts in November 2008 were painful, though.
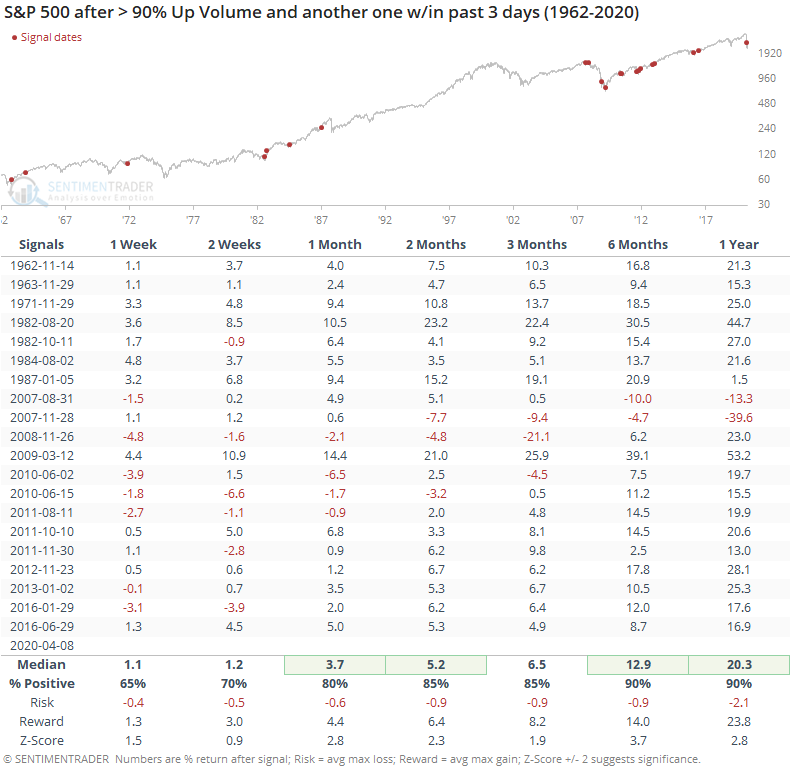
Several times over the past two weeks, we've looked at breadth thrusts as buyers returned to stocks in force (here and here and here). It's been the single most compelling aspect to this recovery, and it continued on Wednesday. Many analysts consider it important when more than 90% of NYSE volume flows into issues that advanced on the day. It's now done so twice in within 3 days.
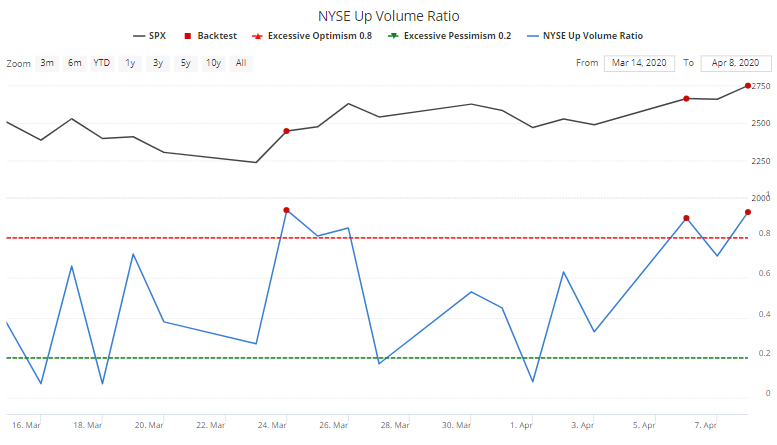
Seeing multiple 90% Up Volume days so close to each has led to impressive returns, with an even more impressive risk/reward ratio.
While we should always be skeptical of anything that claims to be perfect, when we've seen these double 90% days within a month of a 52-week low on the S&P 500, future returns were, indeed, perfect over the next 6-12 months. Those 1-year returns are stunning.
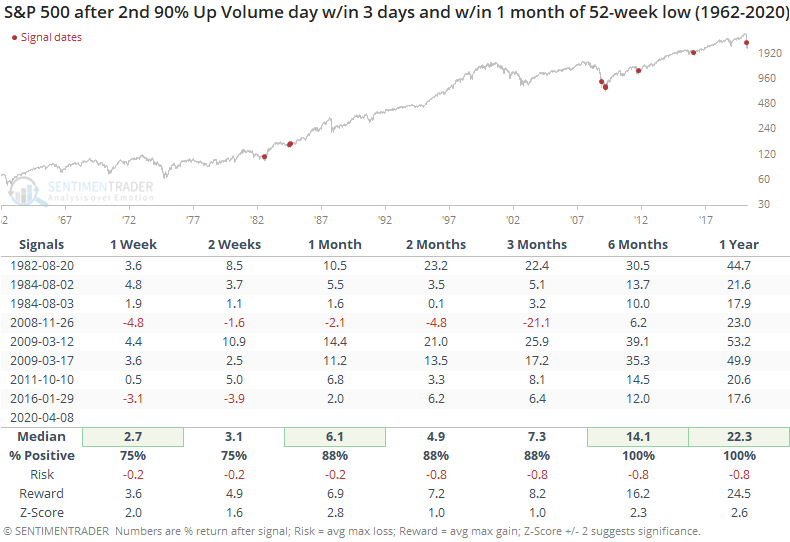
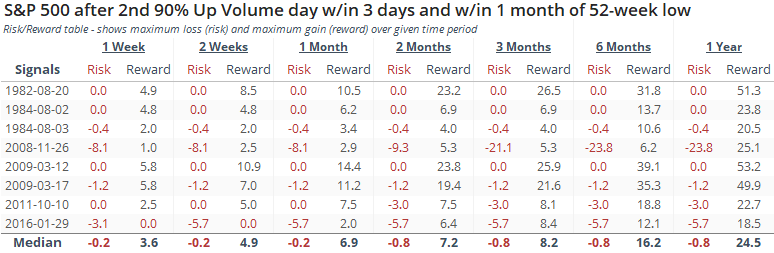
The risk/reward following these were excellent with the sole exception (and it was a big one) being November 2008.
Like we saw after times when sentiment recovered from deep pessimism, recoveries in breadth have preceded some heavy short-term volatility, usually meaning a drop over the next week or two.
The biggest mitigating factor - and it's been a factor for two weeks now - is the overwhelming thrust in buying pressure. Even if markets are being driven by algorithms making breath data less reliable, until these measures fail consistently they deserve attention. And nothing is screaming louder than these repeated days with huge buying interest. The short-term outlook is increasingly cloudy given the recoveries in so many indicators, but it's suggesting more and more that longer-term returns should be positive.
BOTTOM LINE
The CNN Fear & Greed model has moved into neutral territory. Dumb Money Confidence has finally pulled out of a stretch of deep pessimism. During bull markets, this is usually a sign the worst is behind us. During bear markets, this is where markets usually run into trouble.
FORECAST / TIMEFRAME
SPY -- Down, Short-Term
|
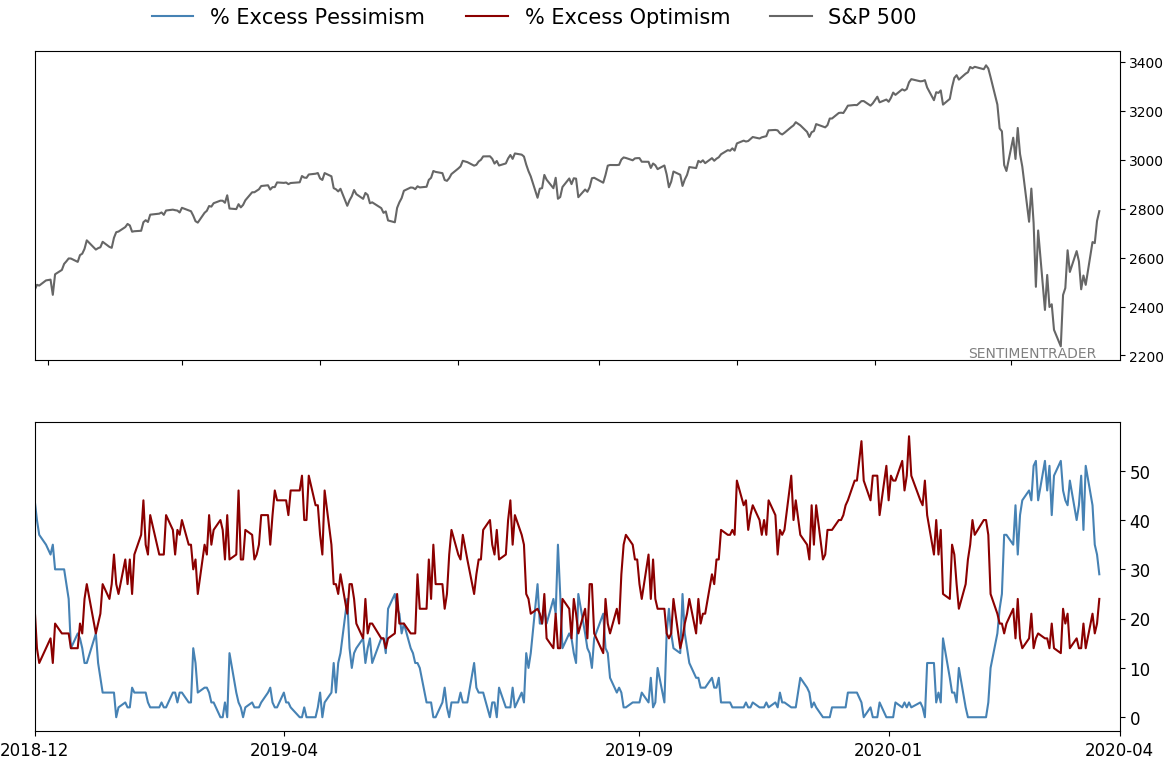
Sentiment is starting to recover. Rising optimism is a good thing, until it gets to the point where it's extreme, and we're a long way from that point.
But rising optimism in a bull market is different from during a bear market, and this is where it gets tricky. During bull markets, extreme pessimism tends to find buyers almost immediately. We started to see pessimistic extremes as early as the end of February, and really by mid-March, yet stocks continued to sink. It wasn't a complete failure, but the subsequent drawdown was larger than we normally see after bull market panics.
Now stocks have rebounded as sentiment relaxes from its extreme. During unhealthy markets, this is where the initial rebound starts to find trouble.
Our proxy of the CNN Fear & Greed model just hit neutral territory above 50% after an extended period with record-low readings. Bull markets typically don't see bouts of such extended pessimism, so that's worry #1. Worry #2 is that the pessimism is now gone. When this happened in the fall of 2018, the rallies immediately fell apart.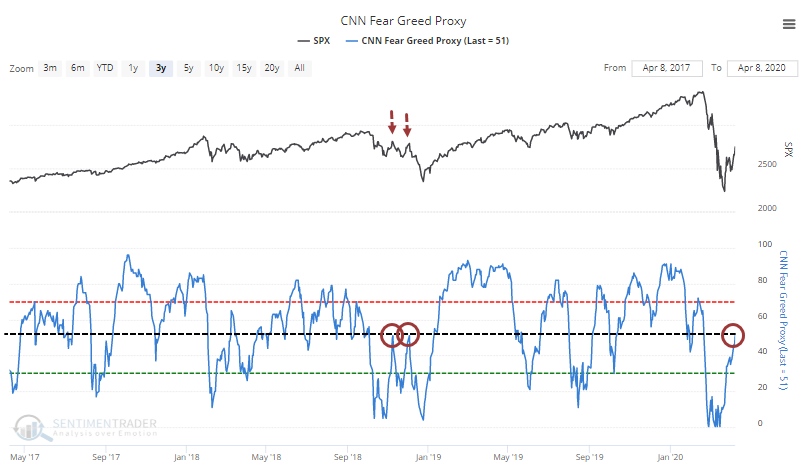
Going back to 1998, when the model had been showing pessimism for at least 30 days, including at least one day with a true extreme below 5%, then recovered above 50%, it led to some rocky returns.
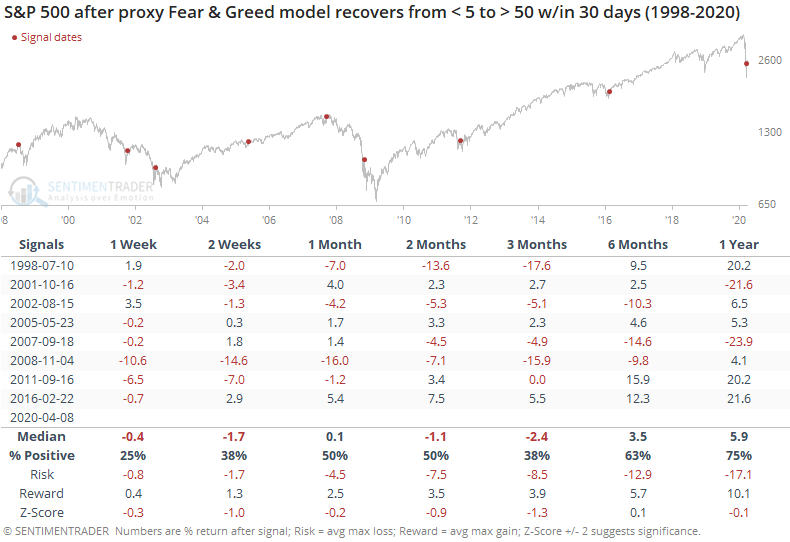
Either one or two weeks later, every signal showed a negative return. That's not totally unexpected. What's less appetizing is the 3-month performance, which was solidly negative. The only time stocks managed to shoot higher virtually without interruption was in 2016.
The others saw either losses or tepid gains over the next three months. Because these were recoveries from deep and protracted pessimism, though, the 1-year returns were mostly good. It just took a lot of risk to get there.
If we look at Dumb Money Confidence, we're seeing a similar thing but not to the same magnitude. It has recovered to 30% after several weeks of deep pessimism.
Several of these dates overlap with the Fear & Greed model, and the short-term implications were the same.
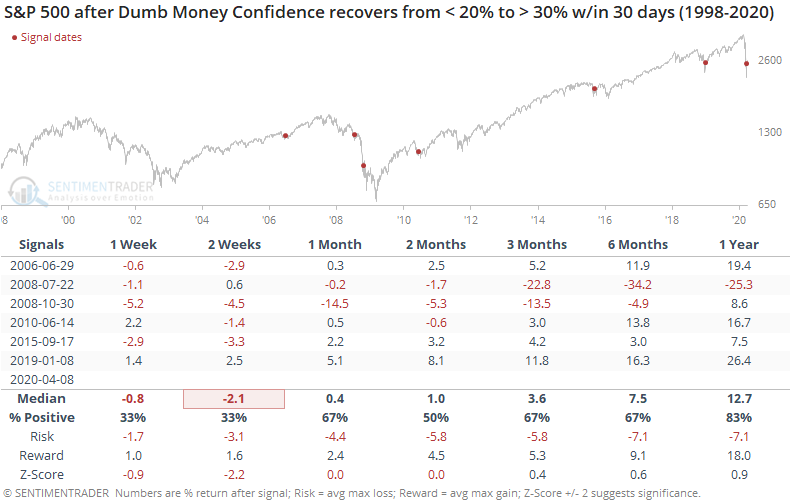
These had less of a tendency to see medium-term failures, with only the ones from July and October 2008 showing a negative return.
So, here's the test. Is the combination of unprecedented fiscal and monetary stimulus, combined with a record surge in buying pressure and retracement of the decline, enough to offset the idea (probably more like fact at this point) that we're in the midst of a recessionary bear market?
If we focus on objective clues, so far the answer is yes. We've had excellent follow-through from the good signs that started to emerge in late March. Now that sentiment is becoming more neutral, price action becomes even more important. Bull markets take it in stride. Bear markets usually roll right over.
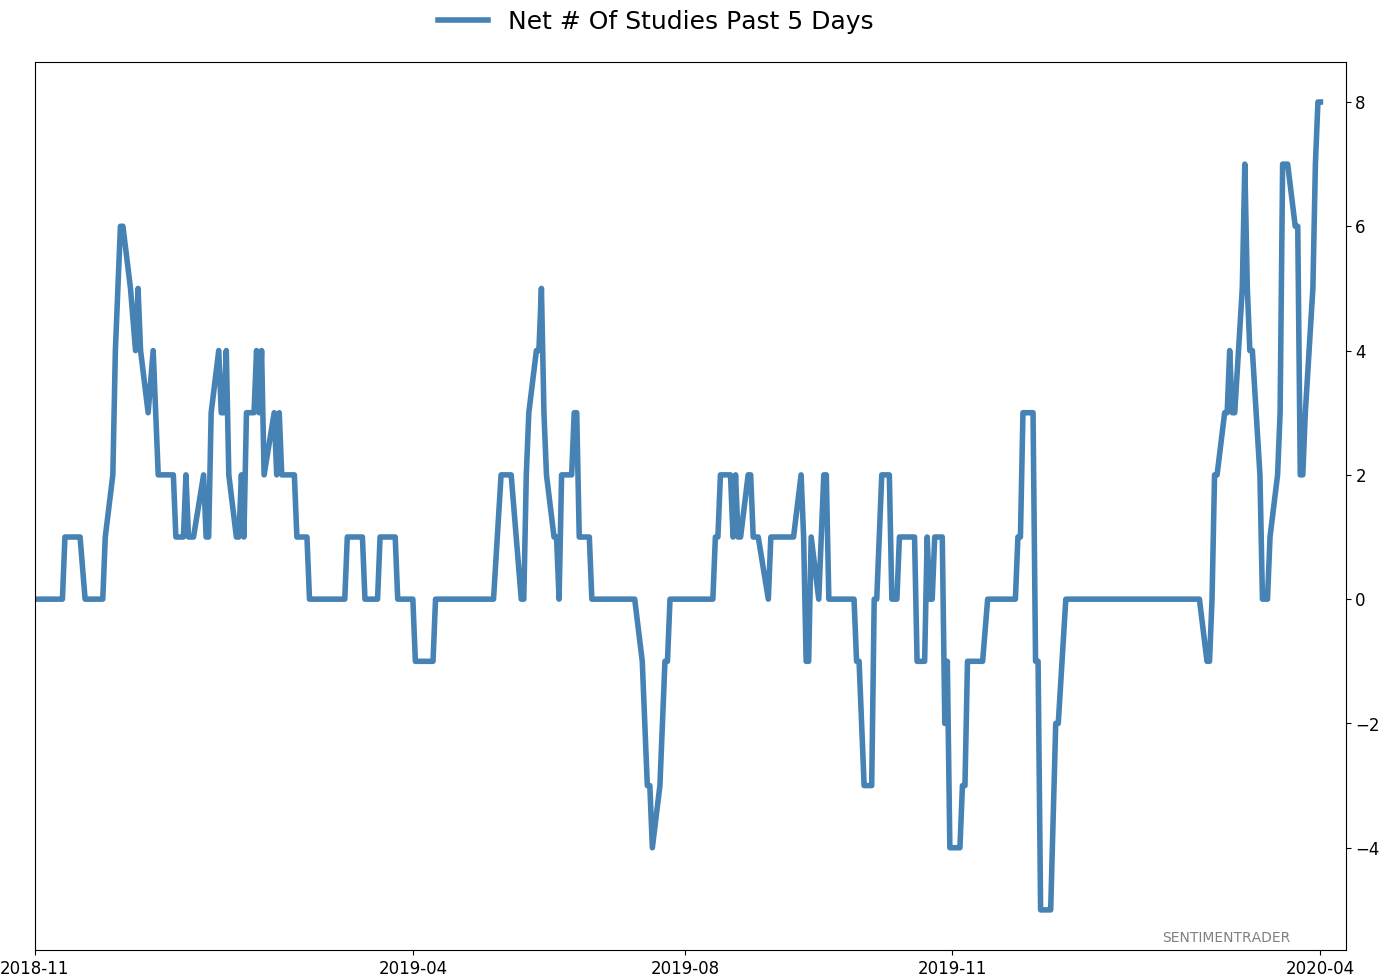
Active Studies
| Time Frame | Bullish | Bearish | | Short-Term | 0 | 1 | | Medium-Term | 11 | 0 | | Long-Term | 29 | 3 |
|
Indicators at Extremes
Portfolio
| Position | Weight % | Added / Reduced | Date | | Stocks | 73.2 | Added 31.3% | 2020-03-17 | | Bonds | 0.0 | Reduced 6.7% | 2020-02-28 | | Commodities | 5.5 | Added 2.4%
| 2020-02-28 | | Precious Metals | 0.0 | Reduced 3.6% | 2020-02-28 | | Special Situations | 0.0 | Reduced 31.9% | 2020-03-17 | | Cash | 21.3 | | |
|
Updates (Changes made today are underlined)
In the first months of the year, we saw manic trading activity. From big jumps in specific stocks to historic highs in retail trading activity to record highs in household confidence to almost unbelievable confidence among options traders. All of that has come amid a market where the average stock can’t keep up with their indexes. There were signs of waning momentum in stocks underlying the major averages, which started triggering technical warning signs in late January. The kinds of extremes we saw in December and January typically take months to wear away, but the type of selling we’ve seen over the past month has gone a long way toward getting there. When we place the kind of moves we saw into March 23 into the context of coming off an all-time high, there has been a high probability of a multi-month rebound. The volatility we’ve seen lately is extremely compelling from a medium-term point of view. Virtually everything we’ve looked at suggests a strong probability of gains over the next several months, even within the context of a potential bear market, and even from what had been higher prices. After stocks bottomed on the 23rd, they enjoyed a historic buying thrust. While other signs are mixed at best that panic is subsiding, that thrust is one of the most encouraging sign we've seen in years. There is often a test of a panic low in the weeks after an initial recovery, but that thrust we saw, combined with the larger-than-usual retracement, have me less convinced a test is necessary. For now, I see no overwhelming reason to add or reduce exposure.
RETURN YTD: -10.8% 2019: 12.6%, 2018: 0.6%, 2017: 3.8%, 2016: 17.1%, 2015: 9.2%, 2014: 14.5%, 2013: 2.2%, 2012: 10.8%, 2011: 16.5%, 2010: 15.3%, 2009: 23.9%, 2008: 16.2%, 2007: 7.8%
|
|
Phase Table
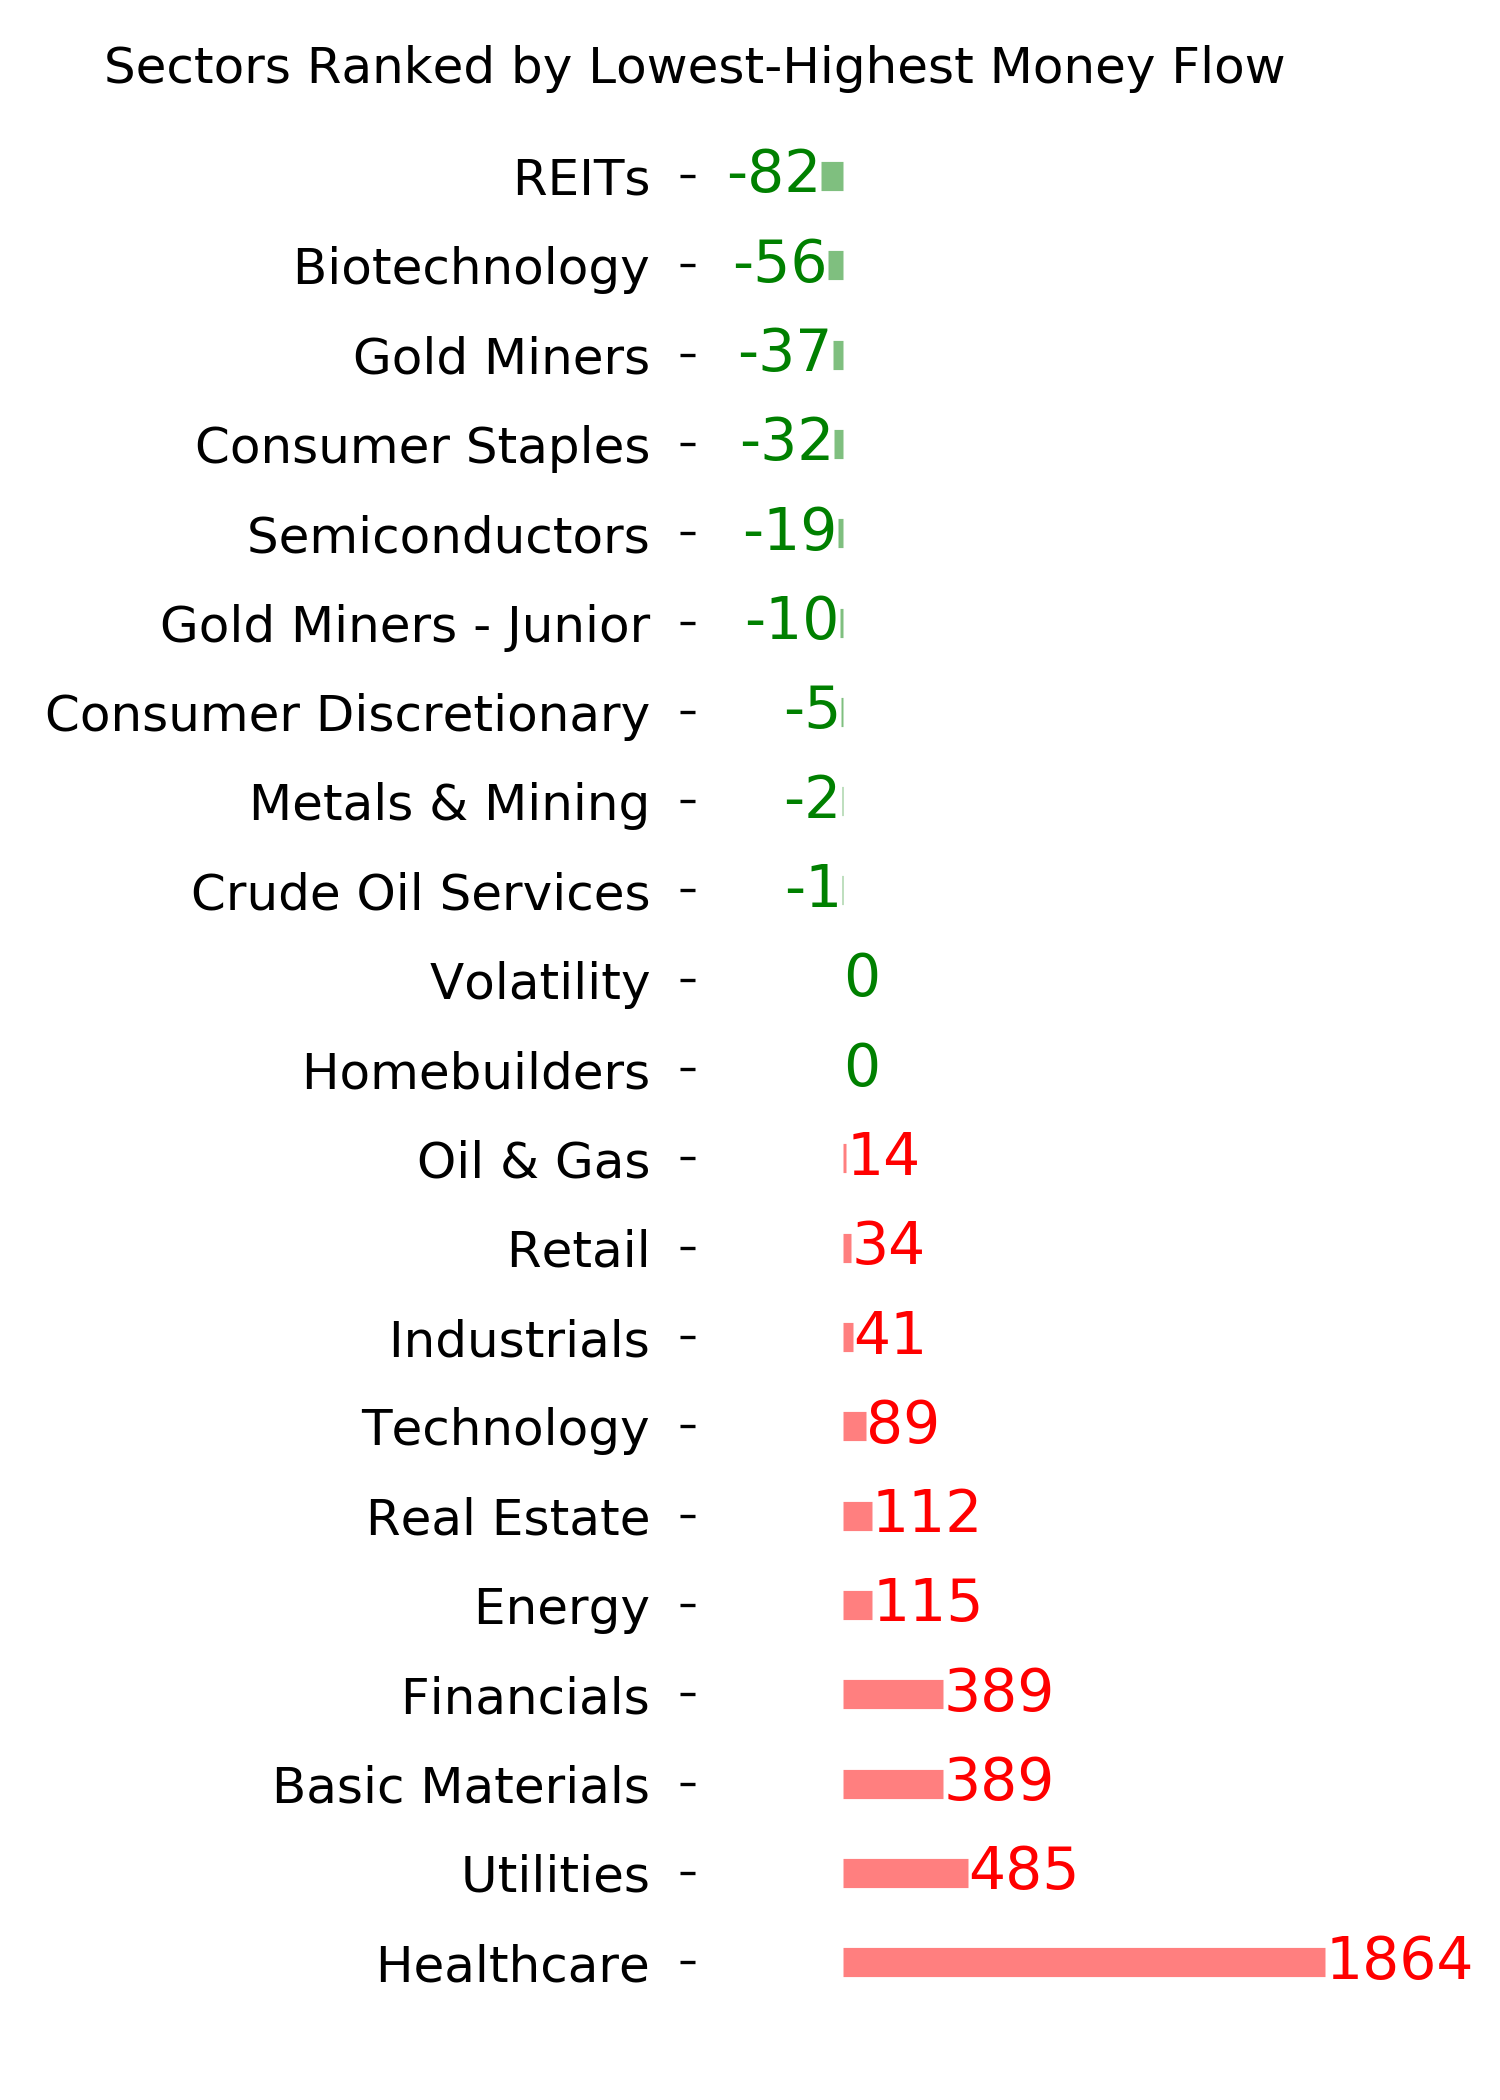
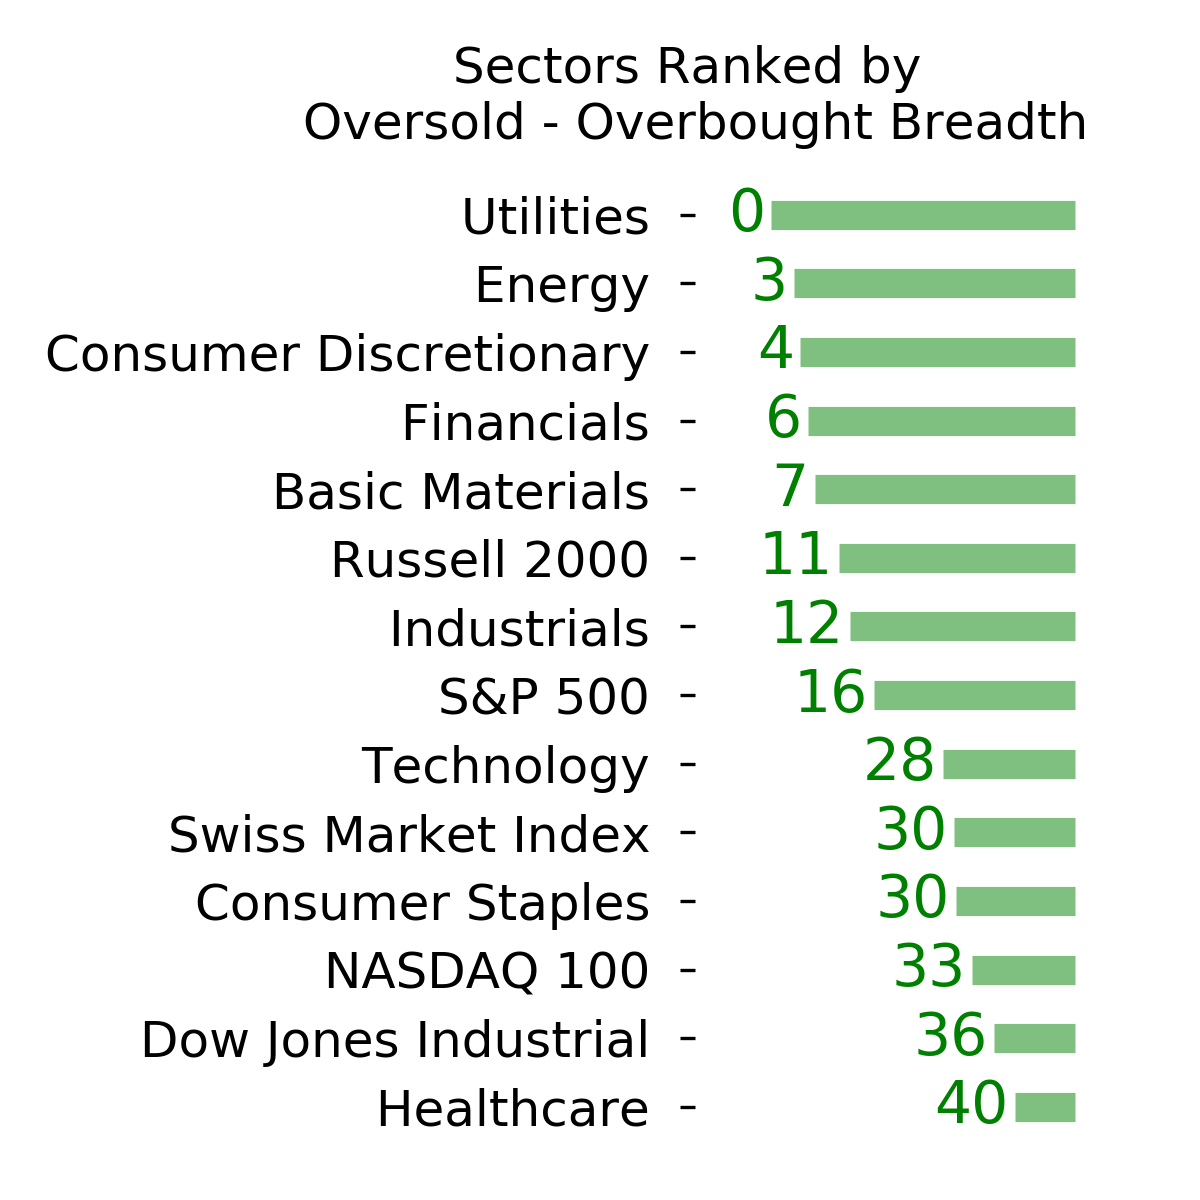
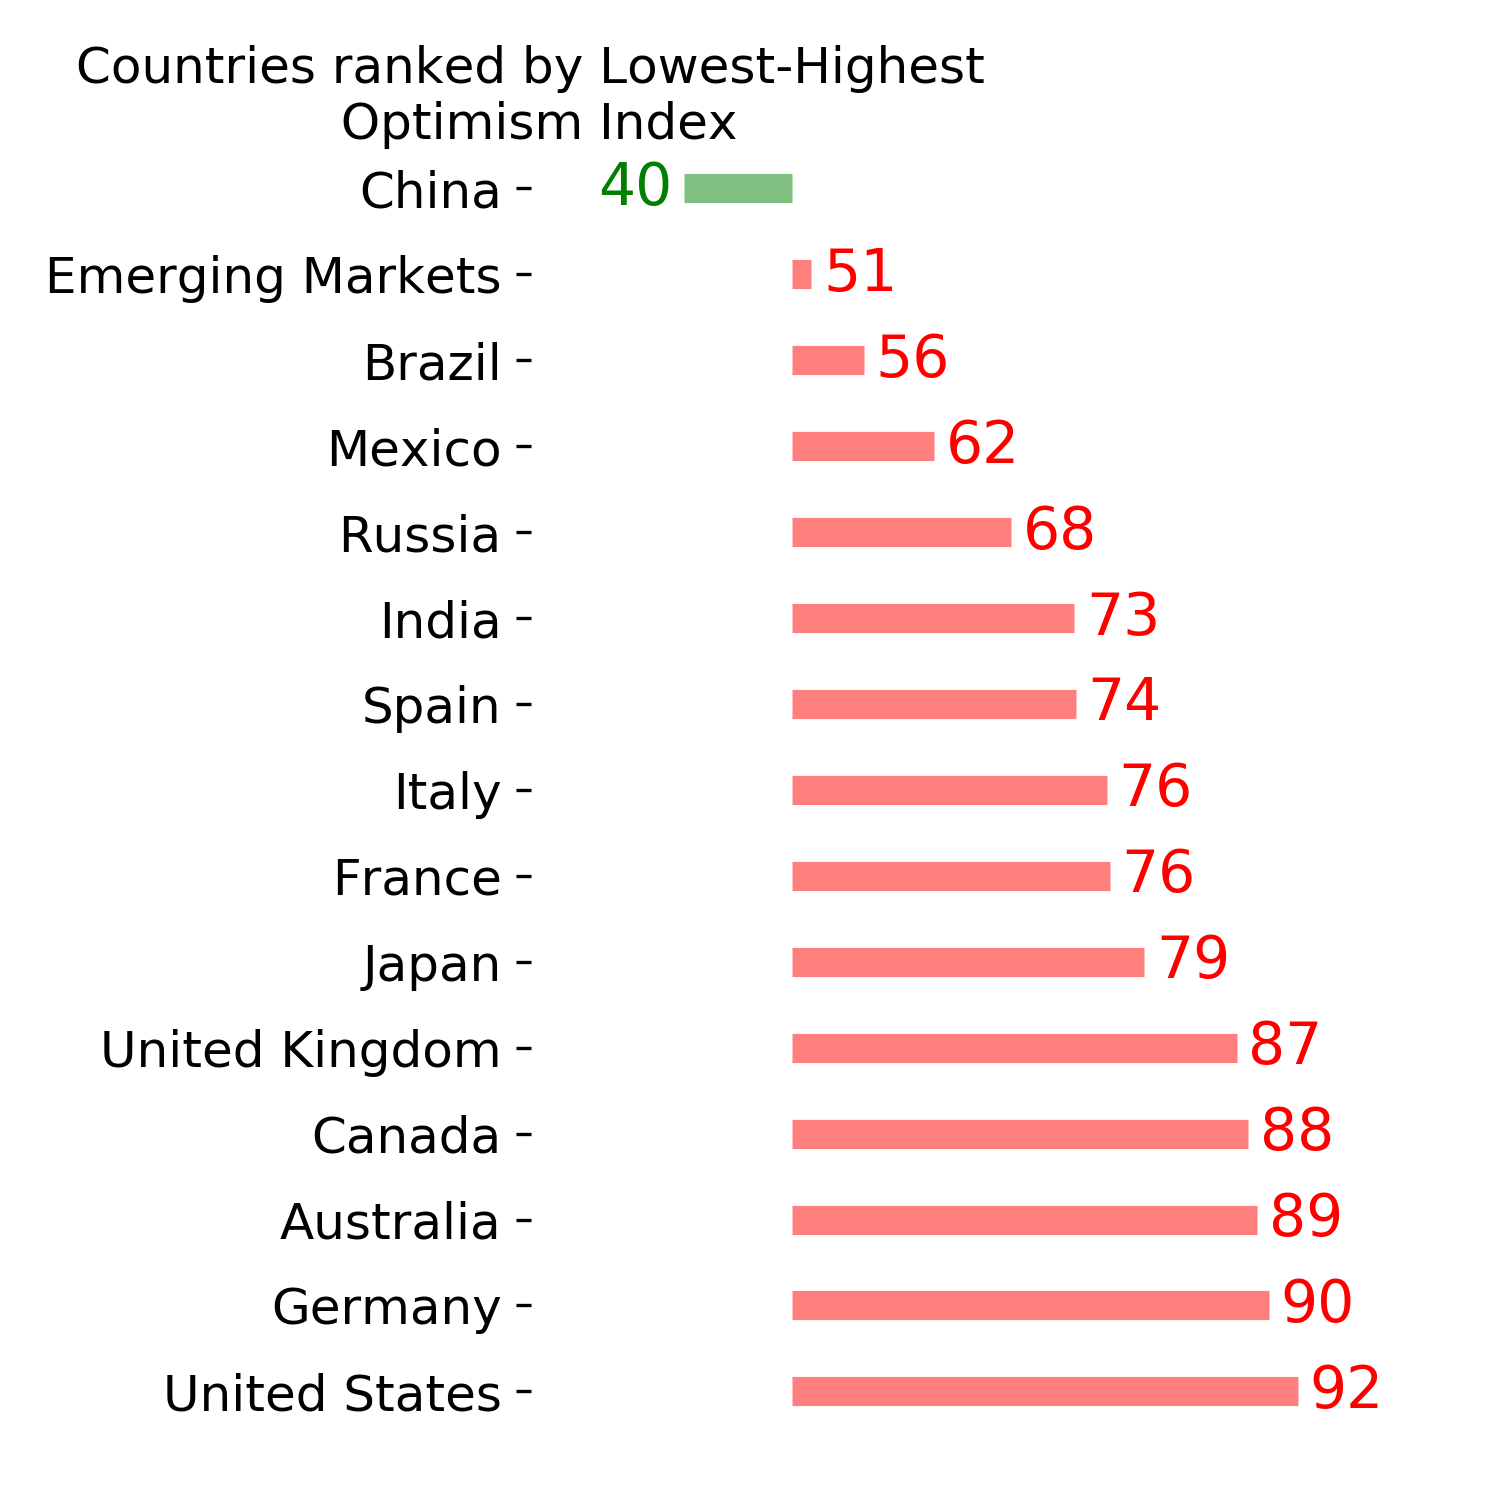
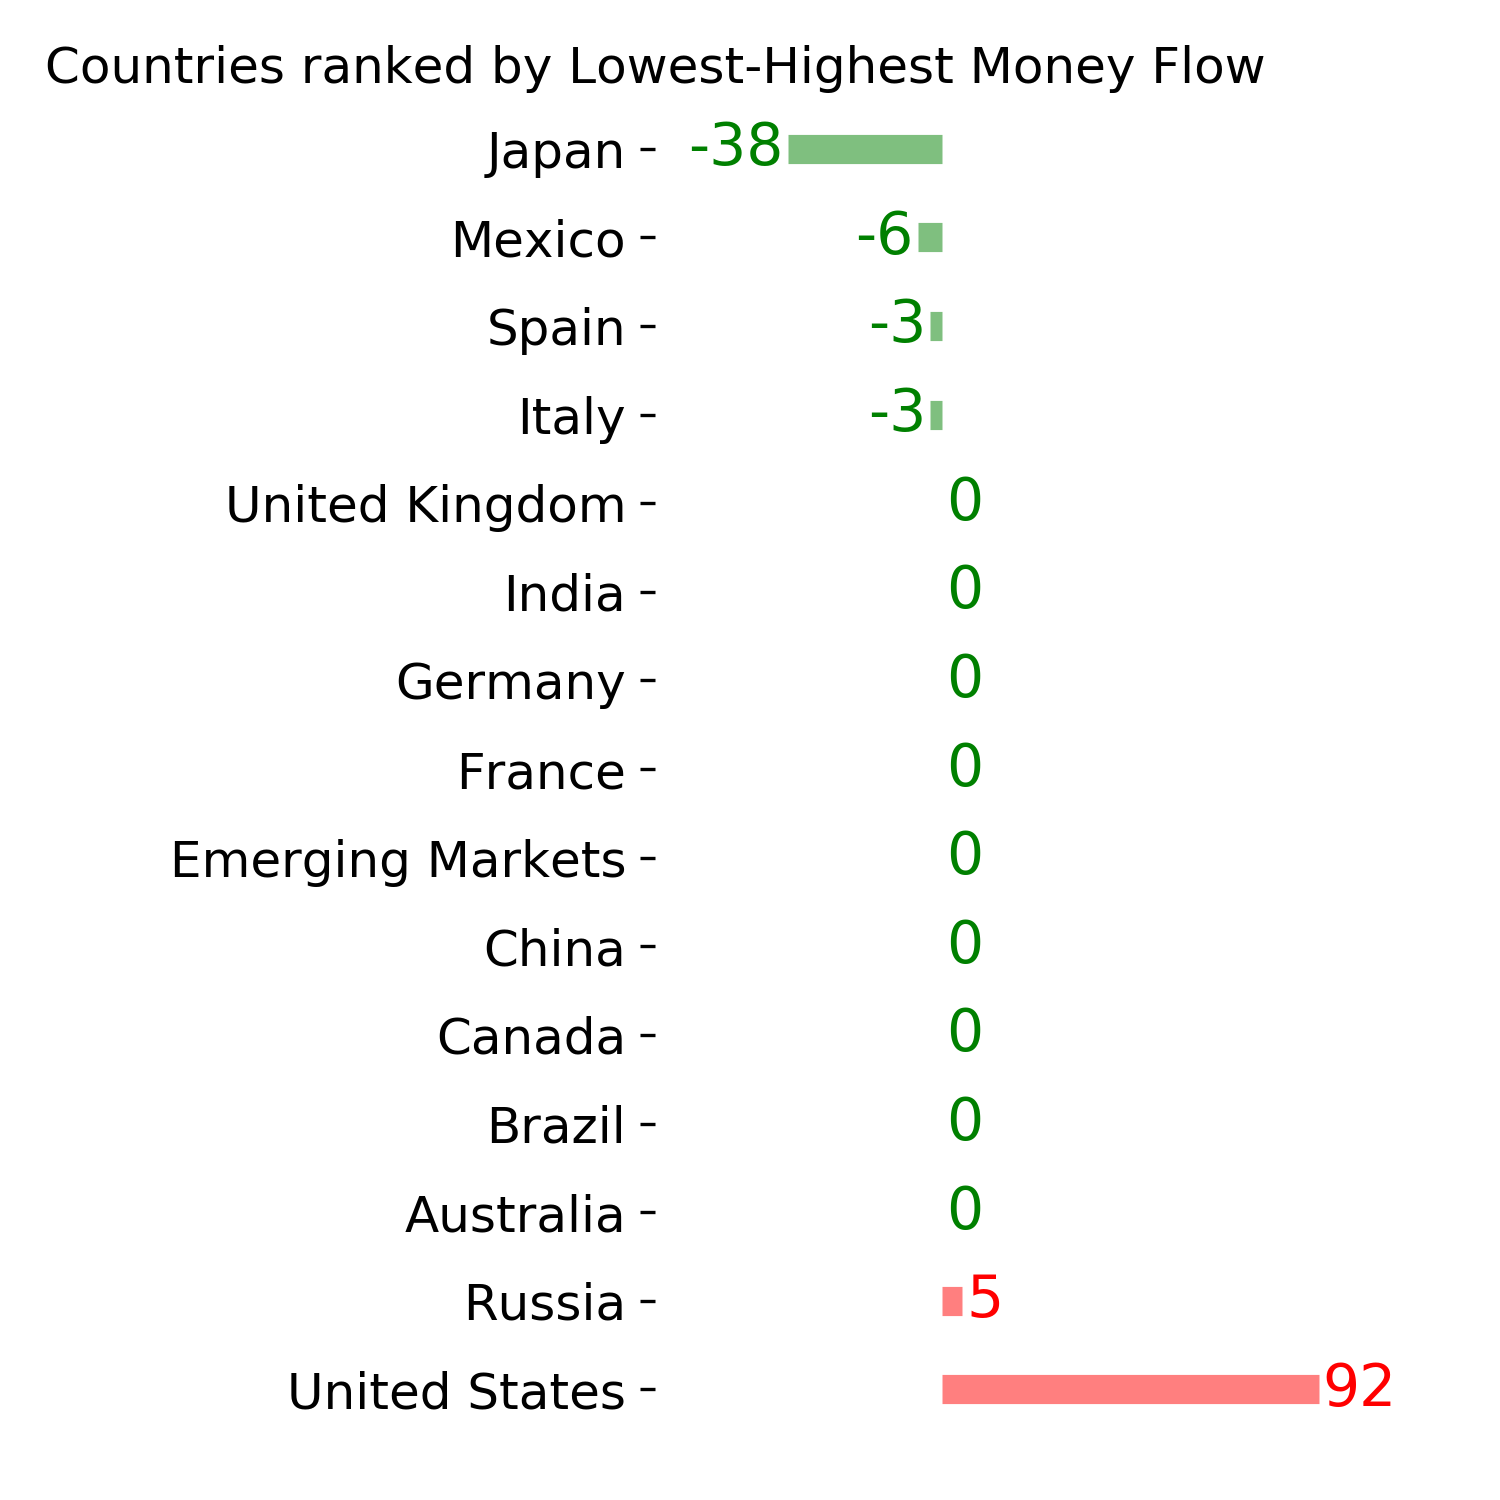
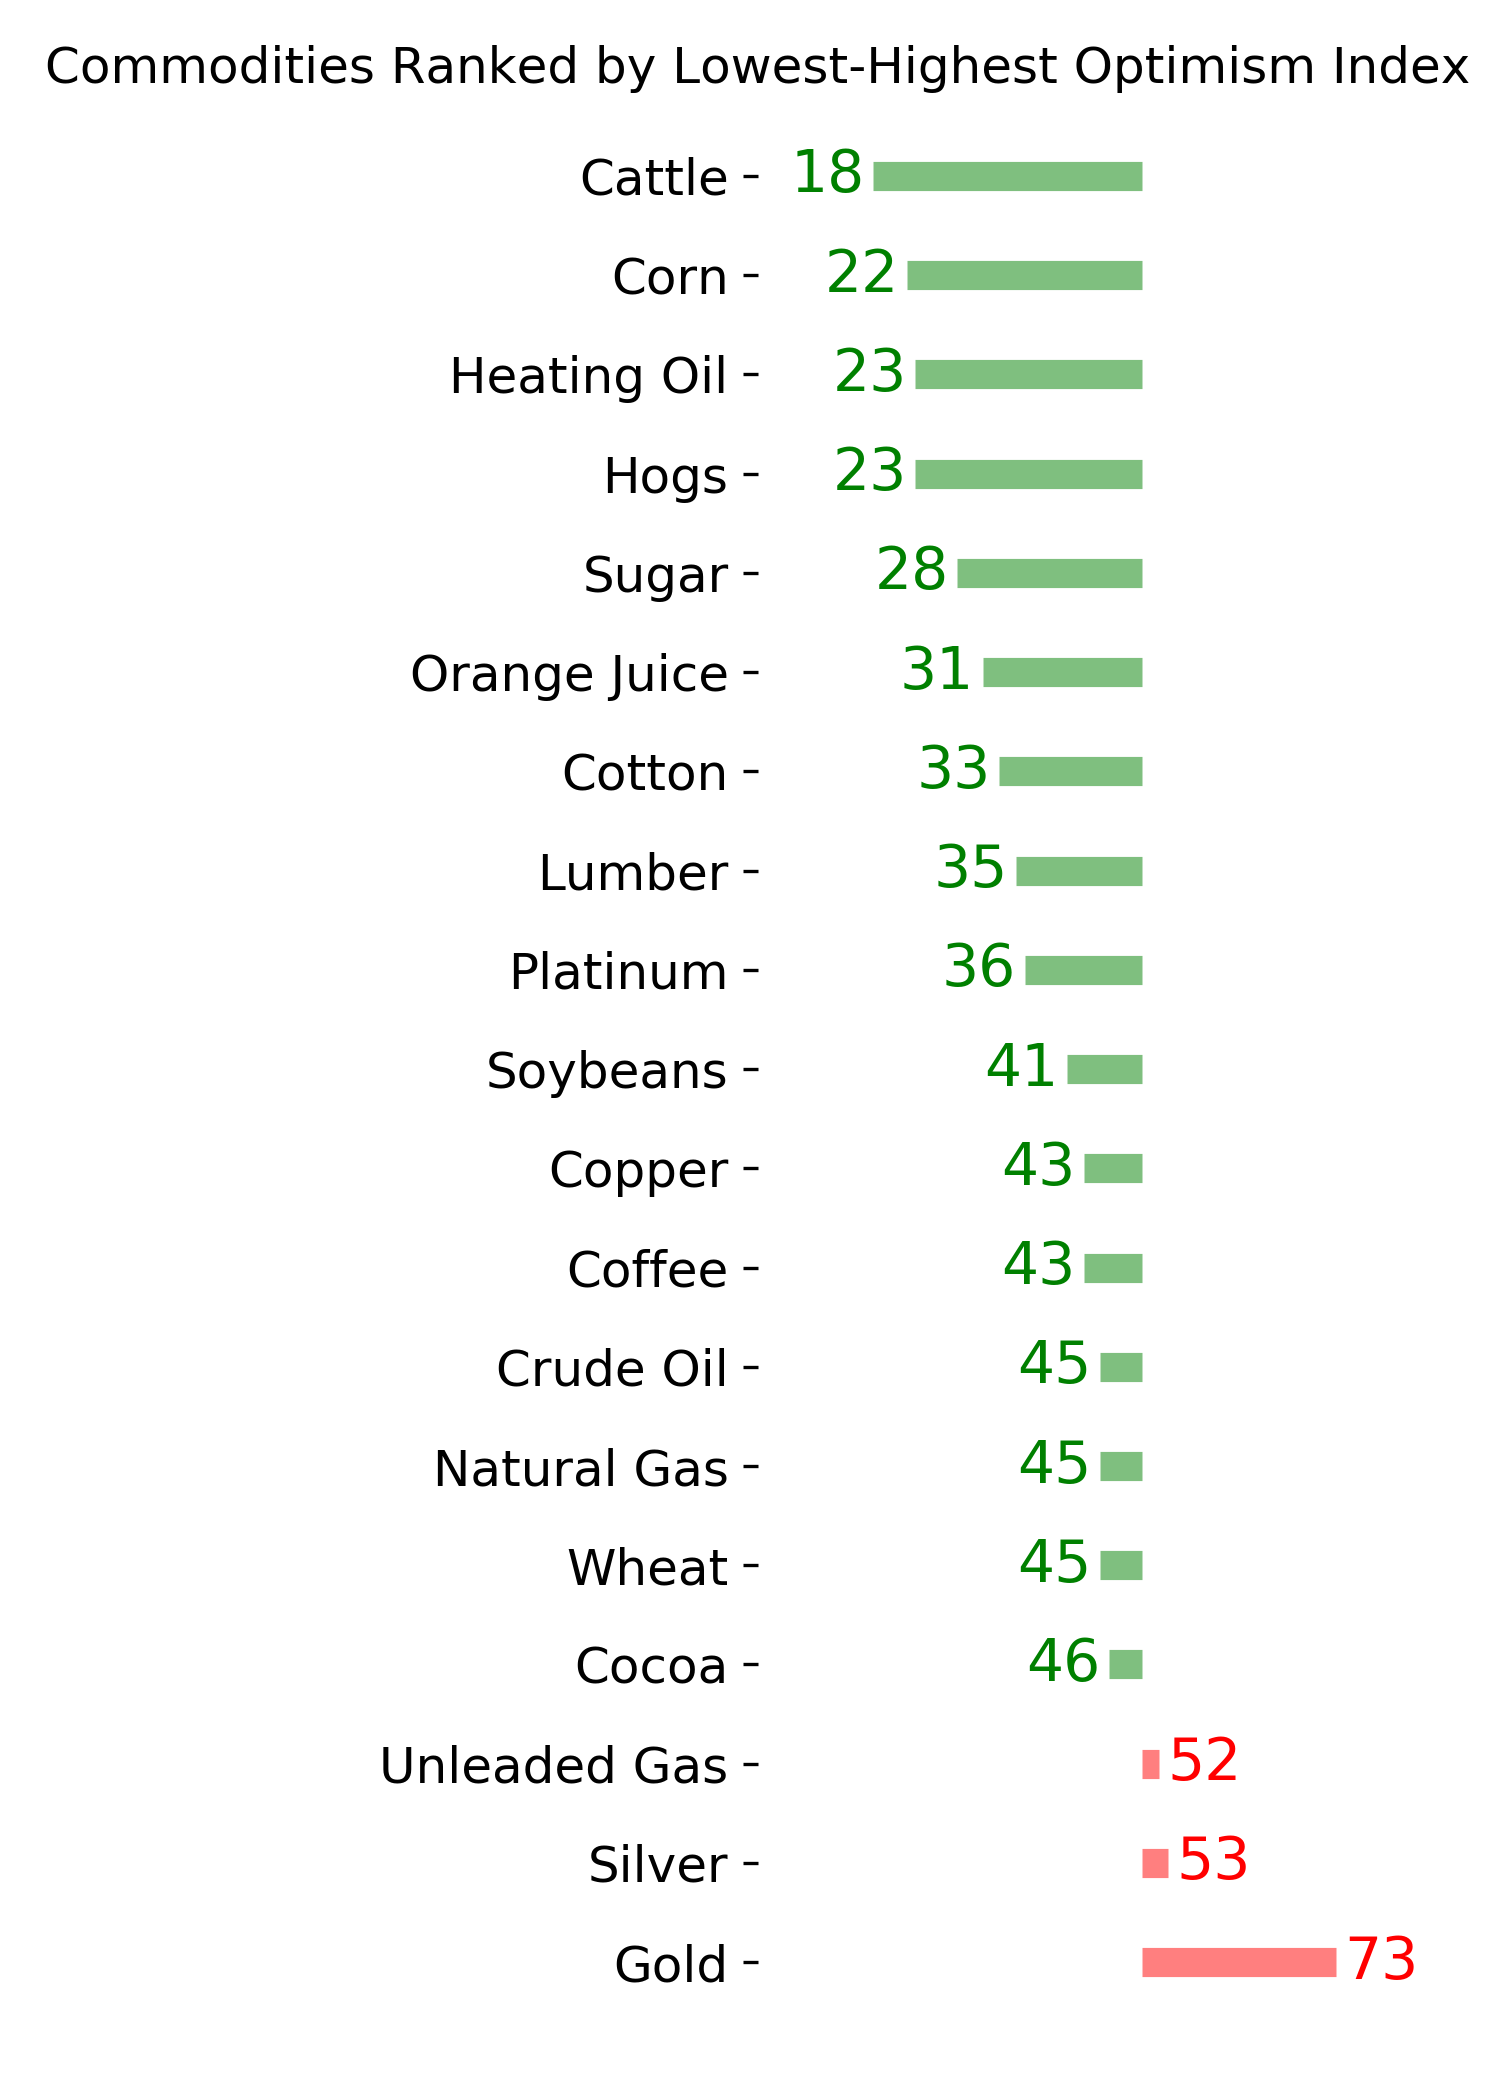
Ranks
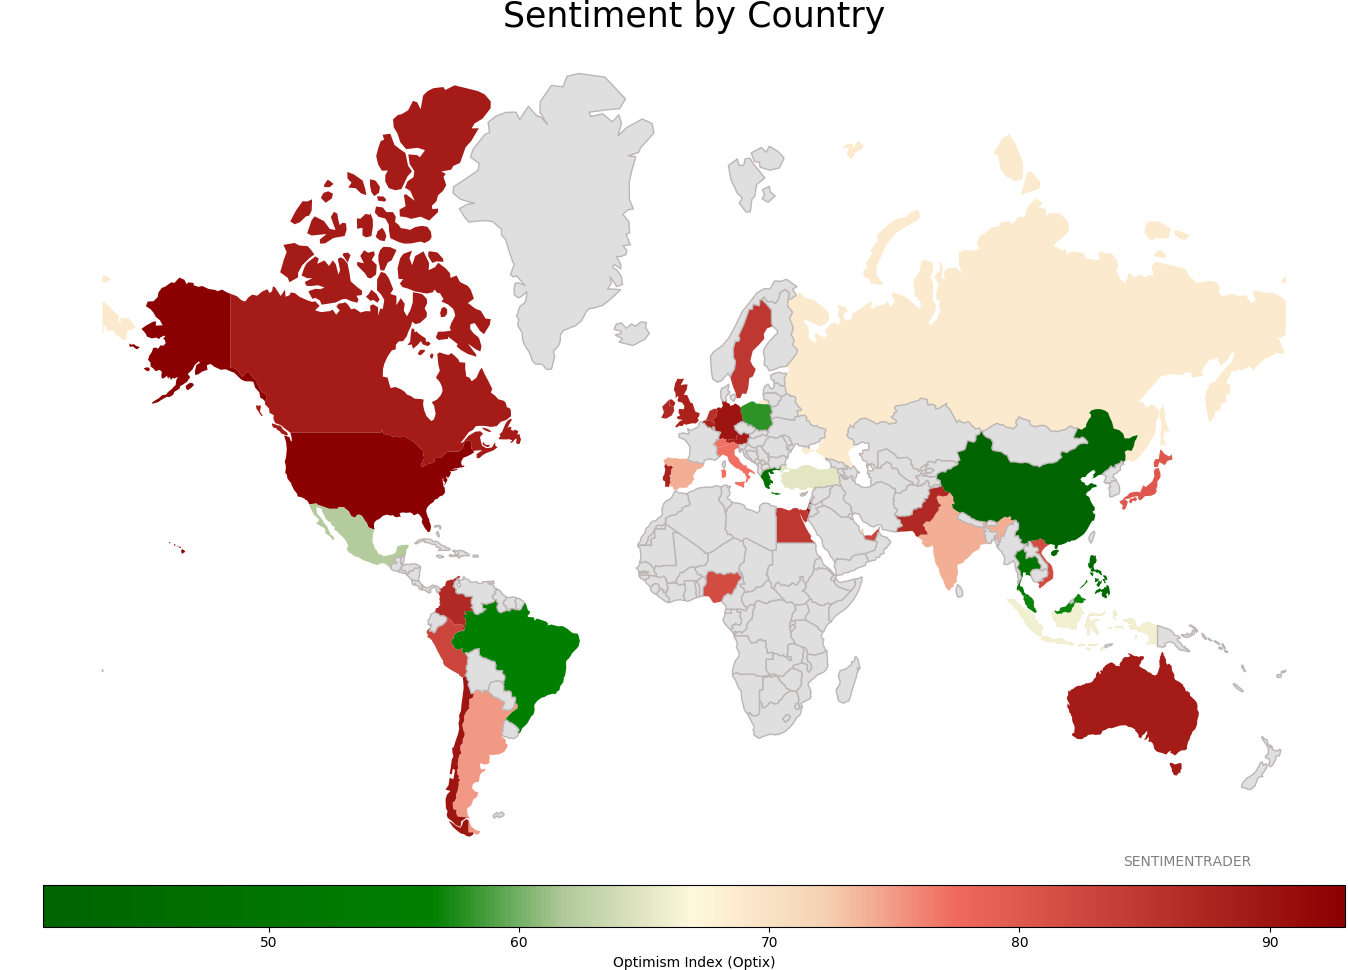
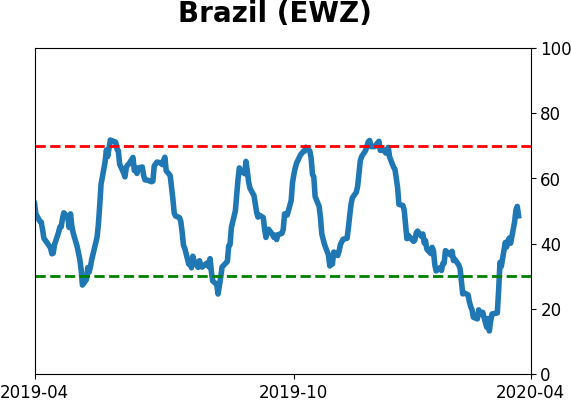
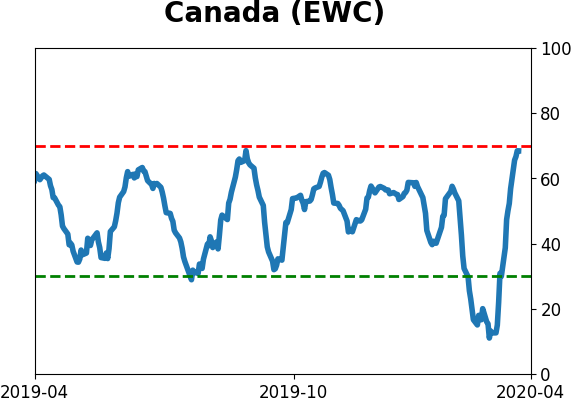
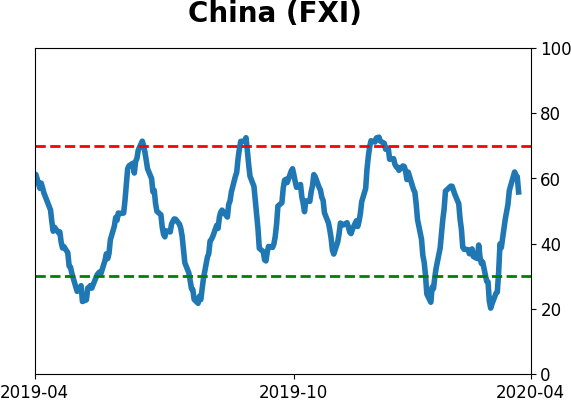
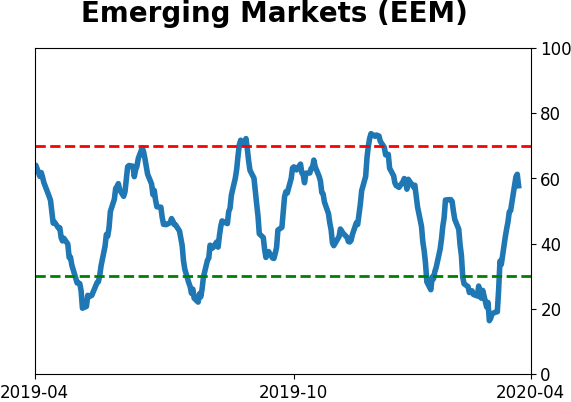
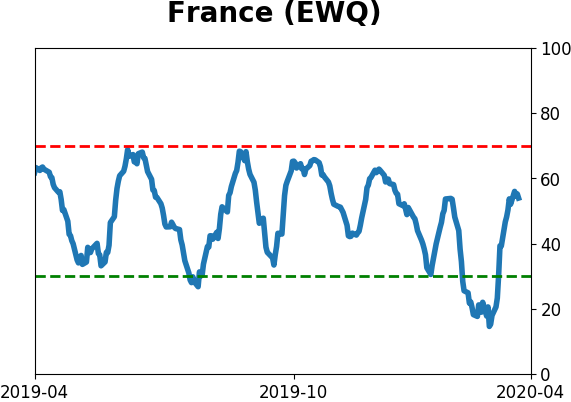
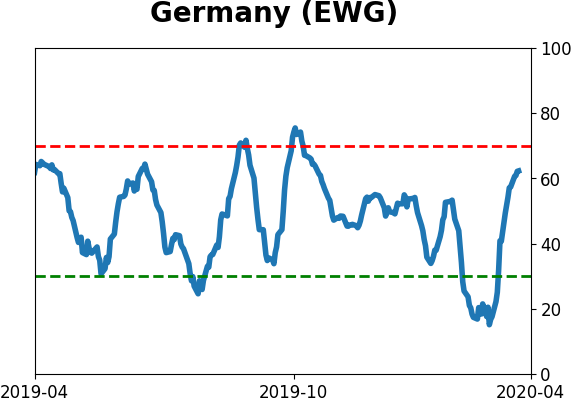
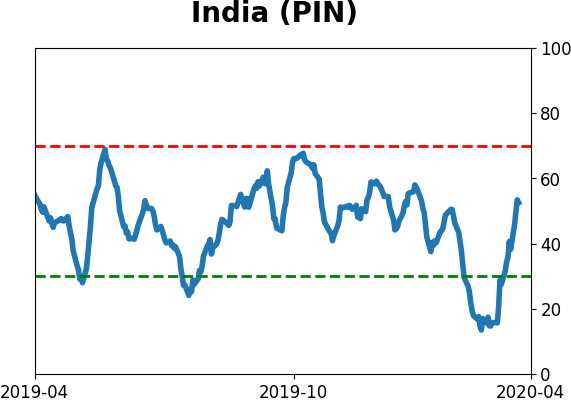
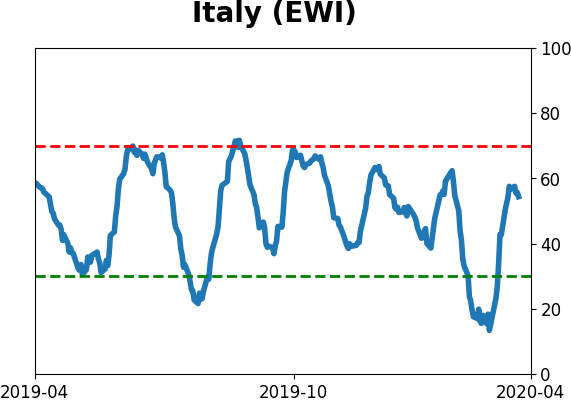
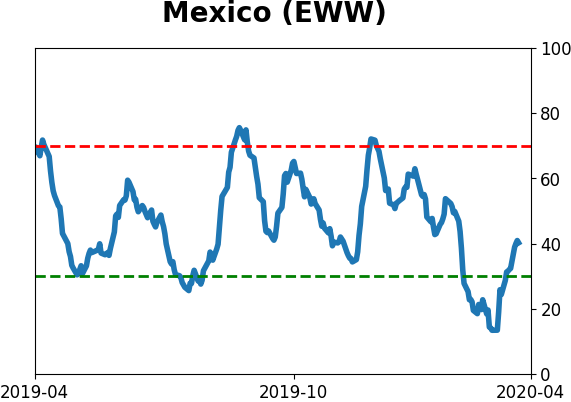
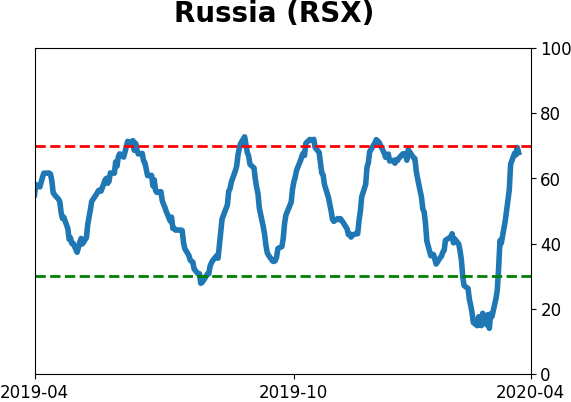
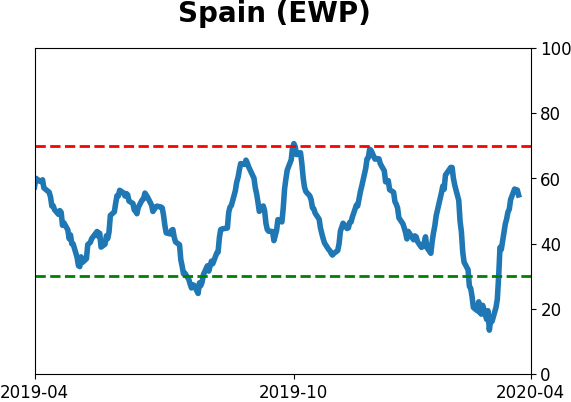
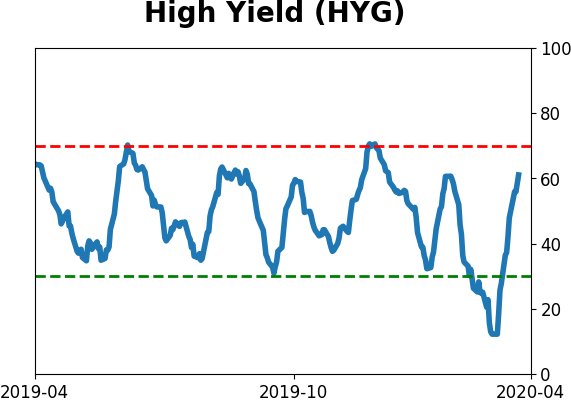
Sentiment Around The World
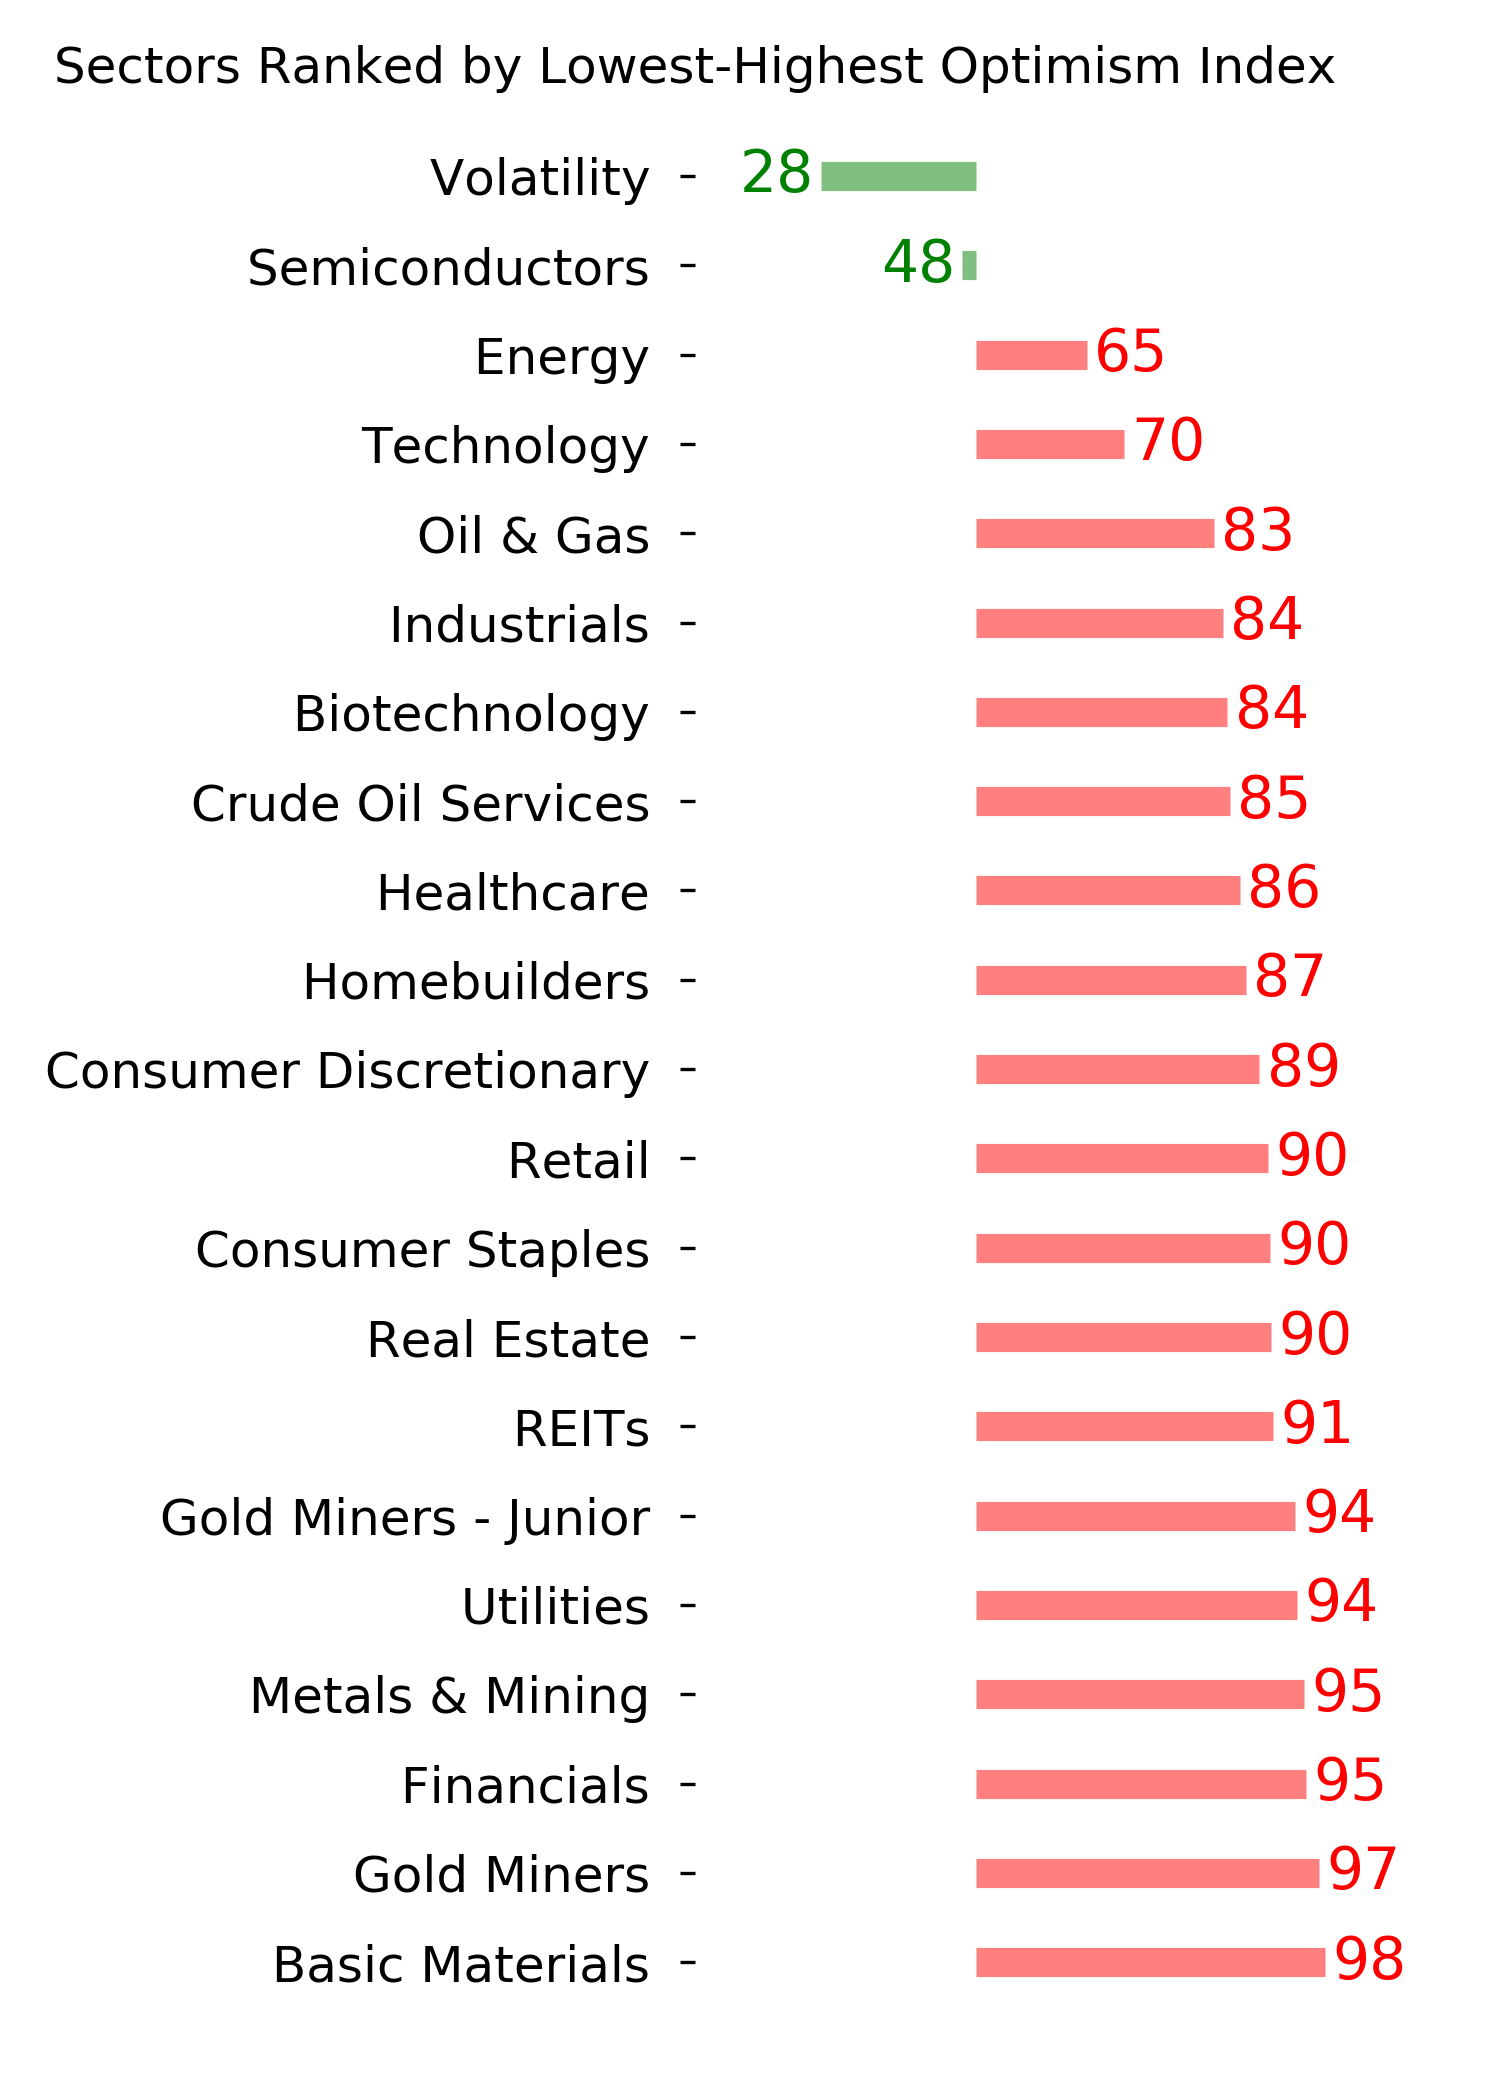
Optimism Index Thumbnails
|
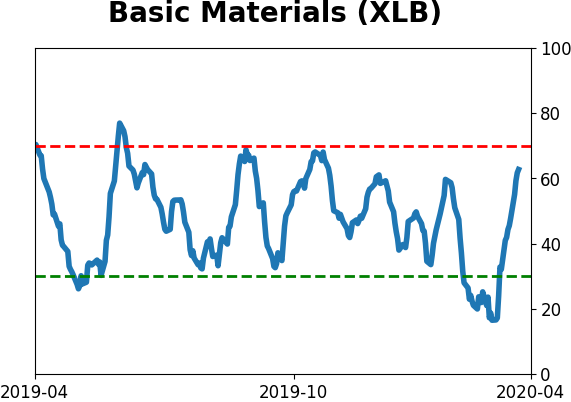
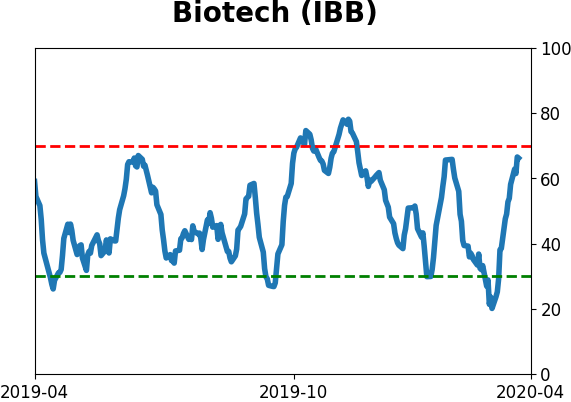
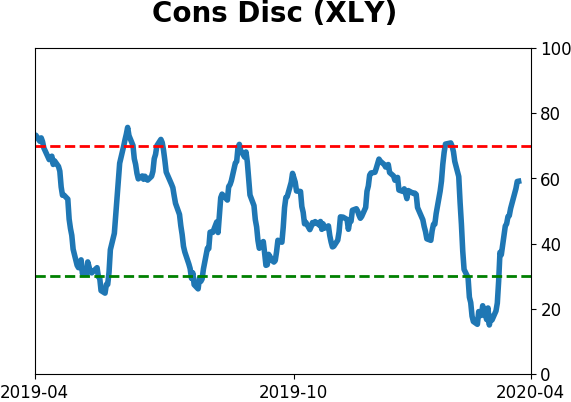
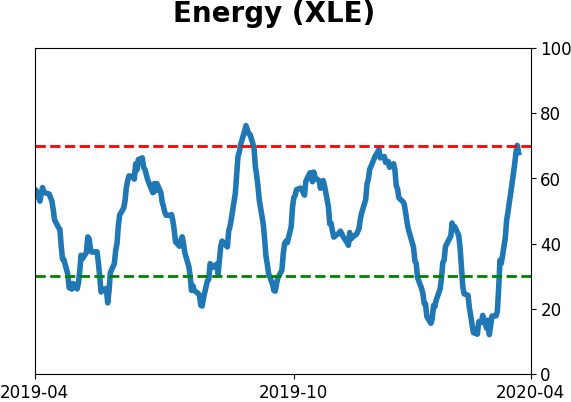
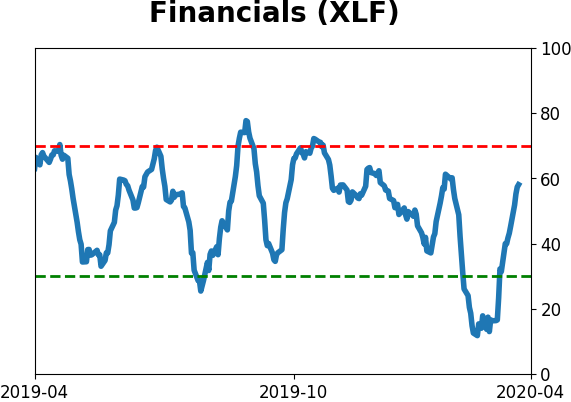
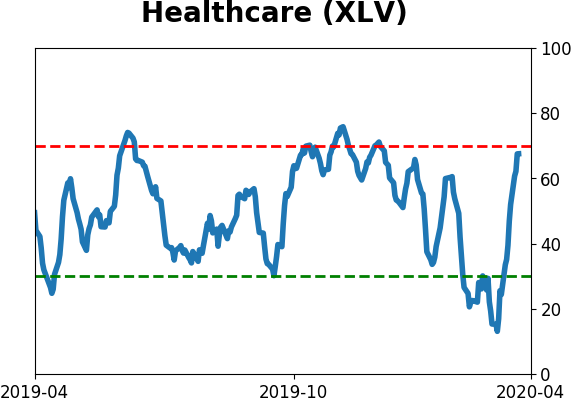
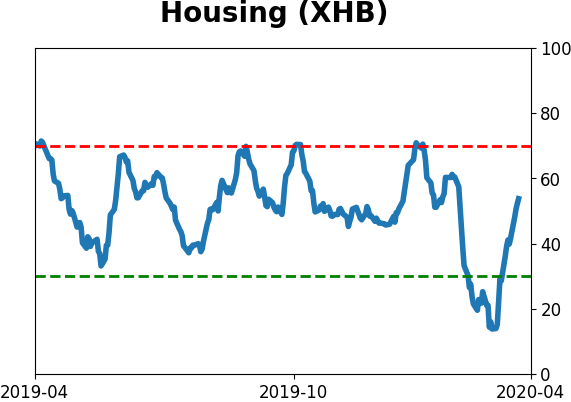
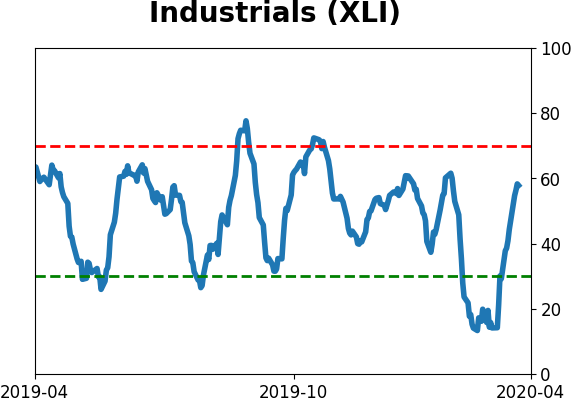
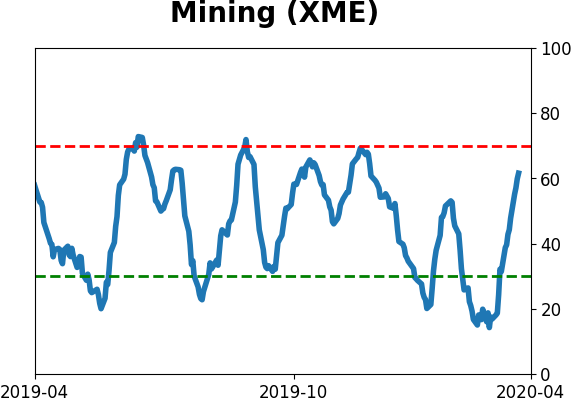
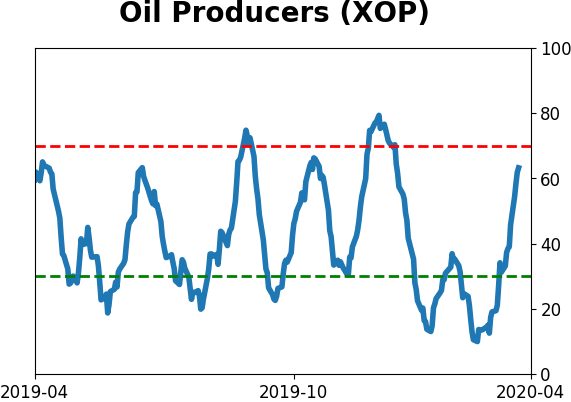
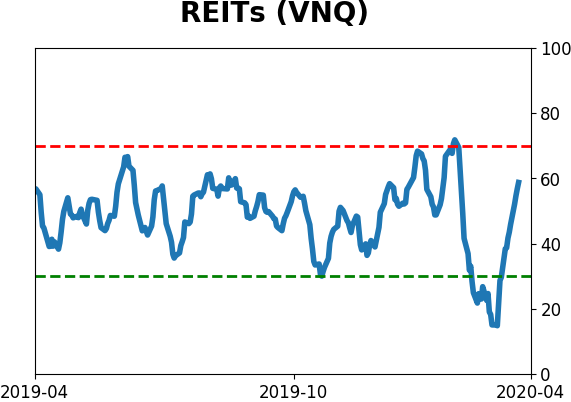
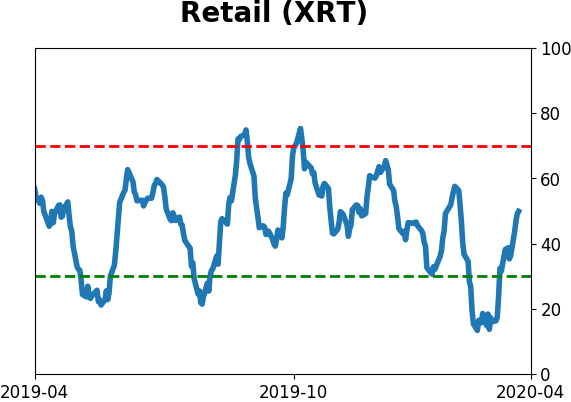
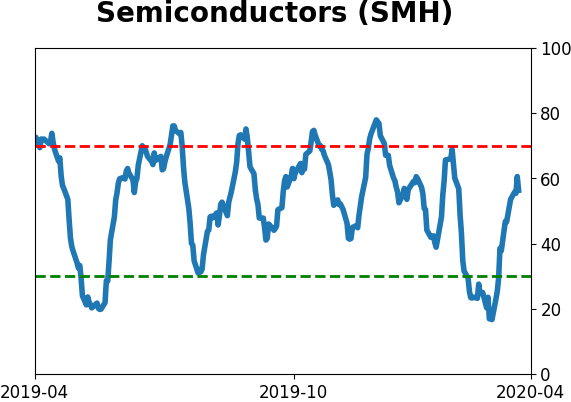
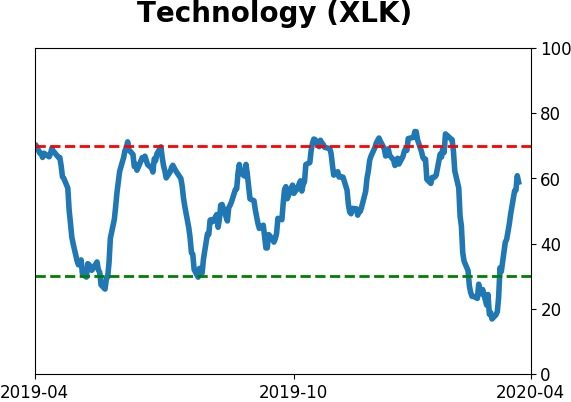
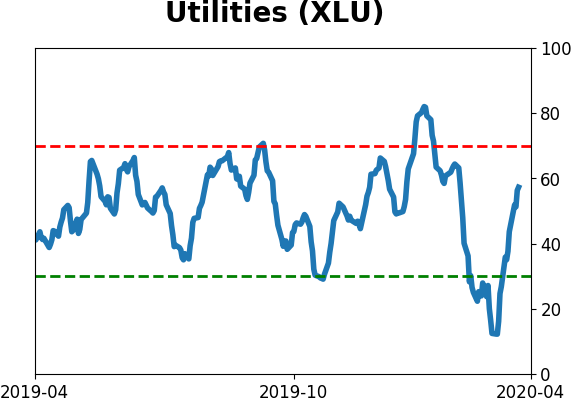
Sector ETF's - 10-Day Moving Average
|
|
|
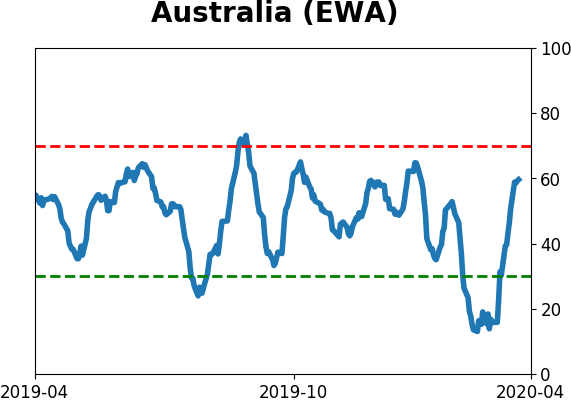
Country ETF's - 10-Day Moving Average
|
|
|
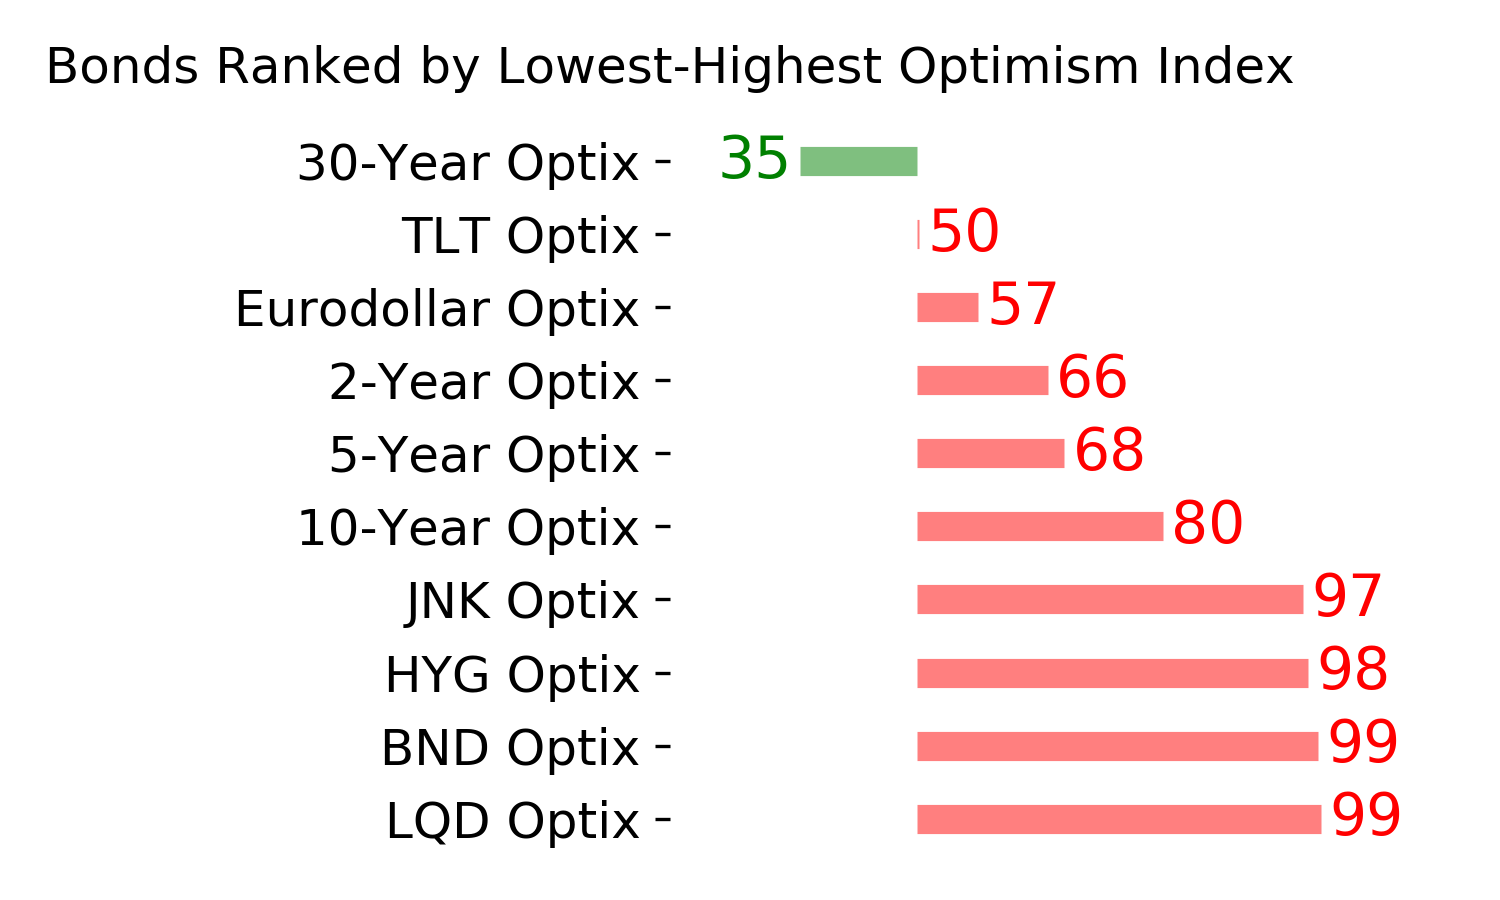
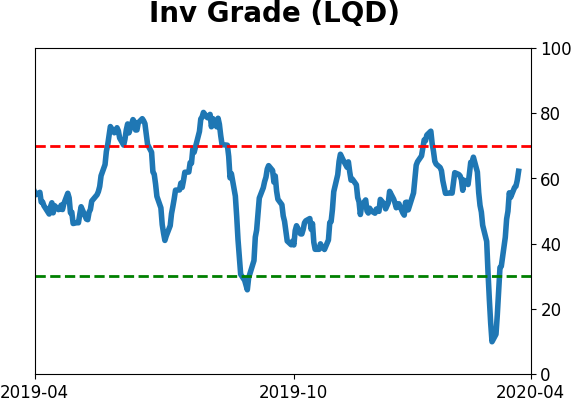
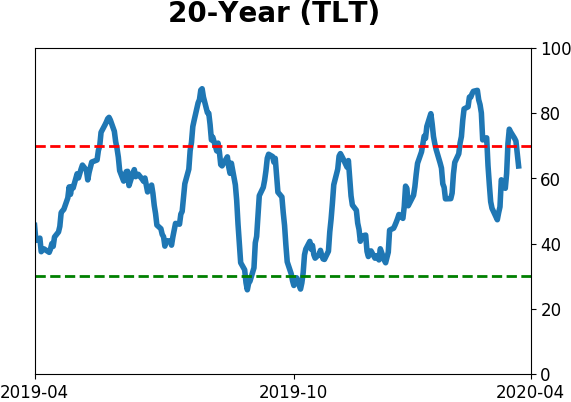
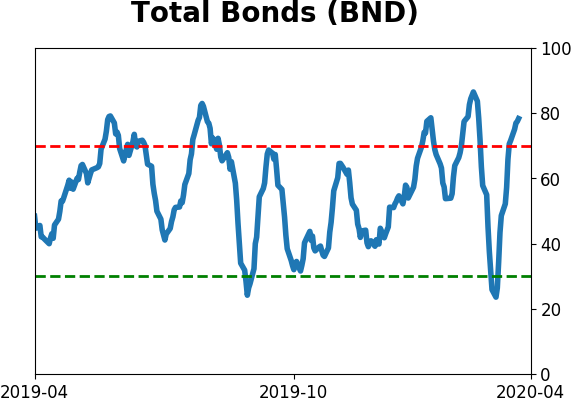
Bond ETF's - 10-Day Moving Average
|
|
|
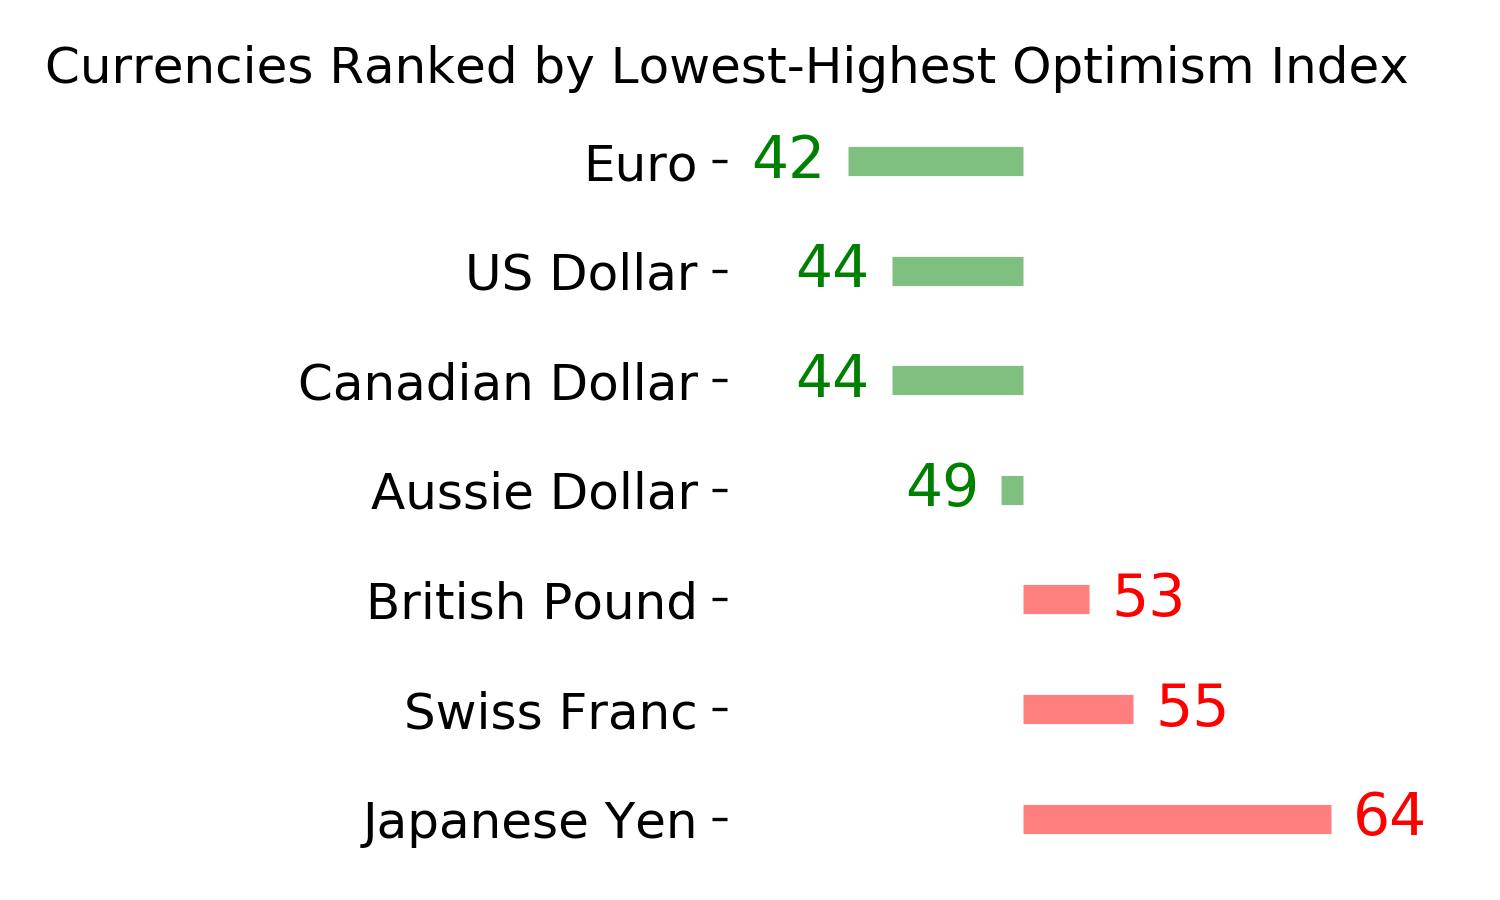
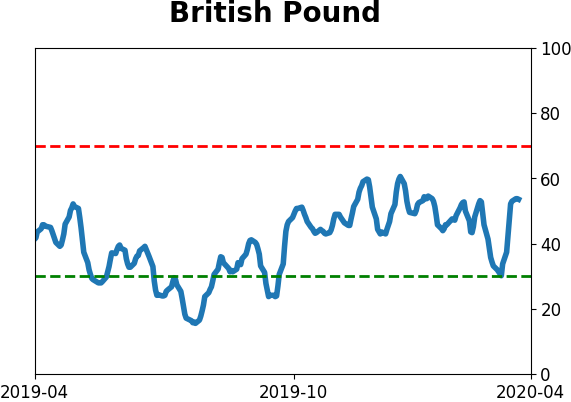
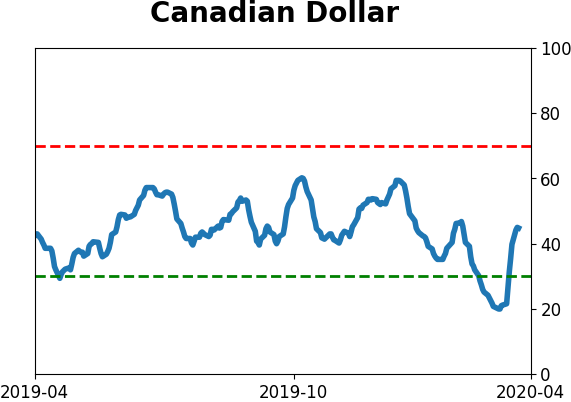
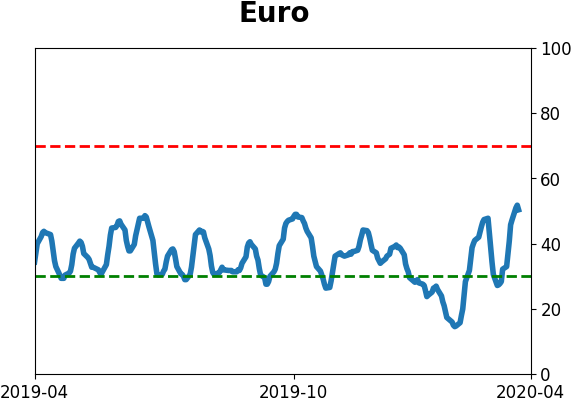
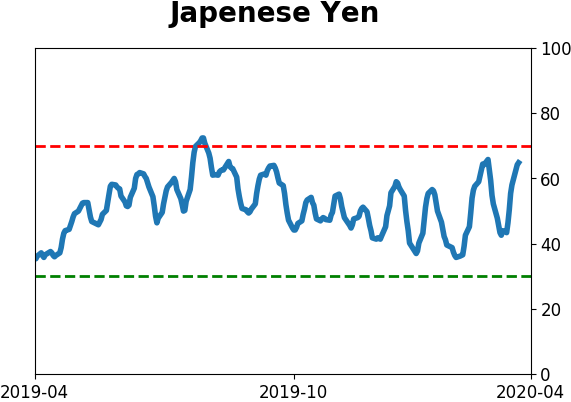
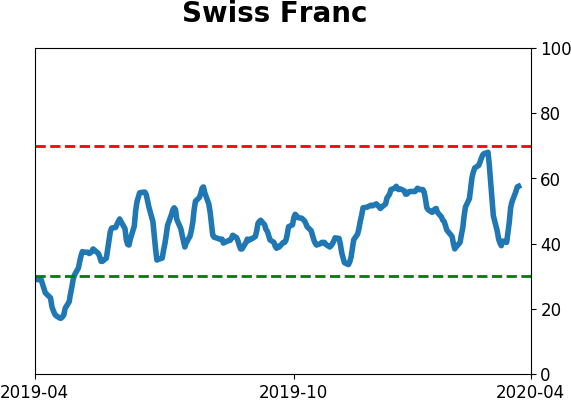
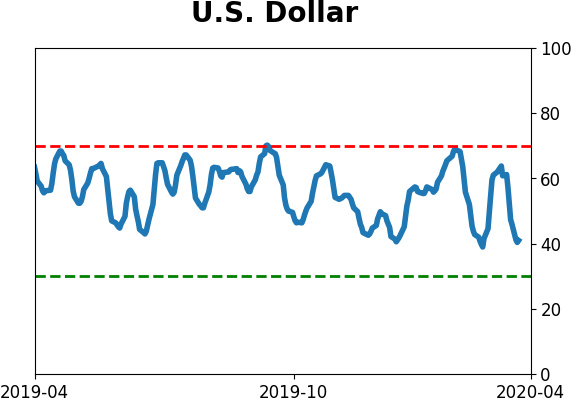
Currency ETF's - 5-Day Moving Average
|
|
|
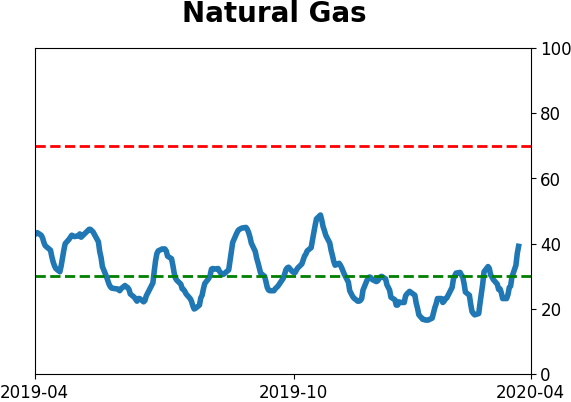
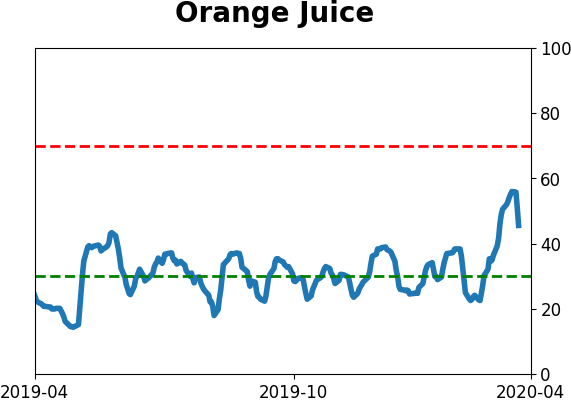
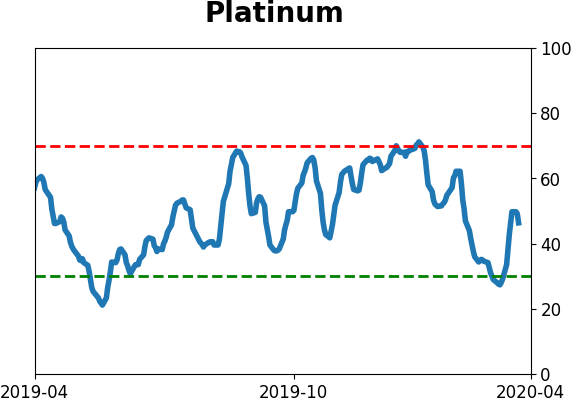
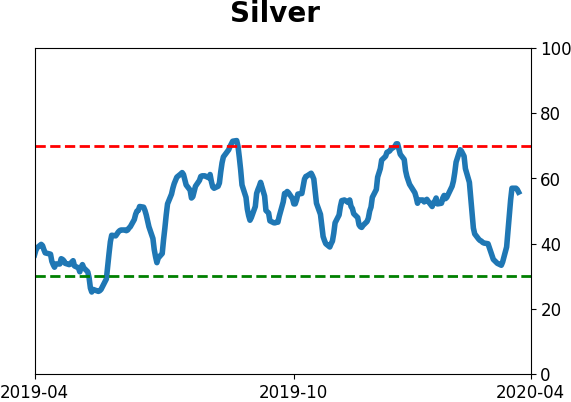
Commodity ETF's - 5-Day Moving Average
|
|