Headlines
|
|
Why it has paid to buy on Thursday and sell on Tuesday:
It's no secret that much of the gains in stocks in recent decades have come overnight. It might be surprising to some, however, just how much the day of the week has mattered to those gains. There was a very stark difference between activity on Tuesdays and Thursdays, in particular.
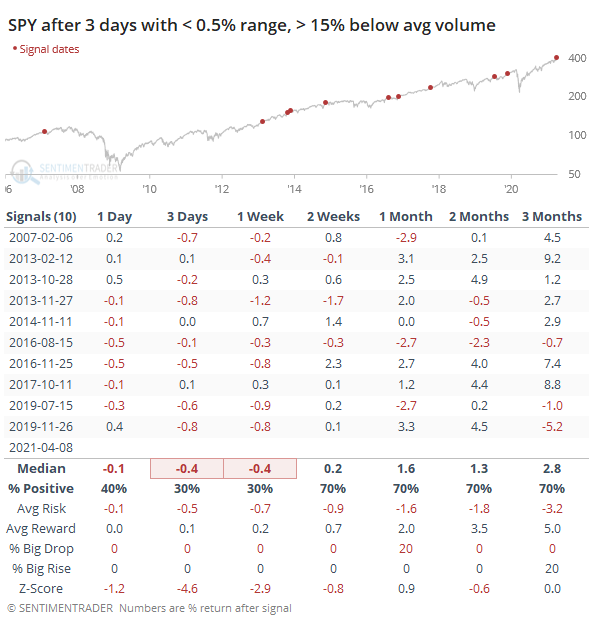
Is this thing on?: We all know the old trope about not shorting a dull market. Shorting in any sense has pretty much been a disaster for a year, but the "dull" part has become even more apropos. The most important ETF in the world, SPY, has had an intraday range of less than 0.5% for 3 consecutive days, on volume more than 15% below the 200-day average each day, all while hitting a new high. While every previous instance saw a negative return at some point (there were no signals prior to 2007), returns after the first couple of weeks tended to be positive.
Bottom Line:
See the Outlook & Allocations page for more details on these summaries STOCKS: Weak sell
The extreme speculation registered in January and February is starting to get wrung out. Internal dynamics have mostly held up, so a return to neutral sentiment conditions would improve the forward risk/reward profile substantially. We're still a ways off from that. BONDS: Weak buy
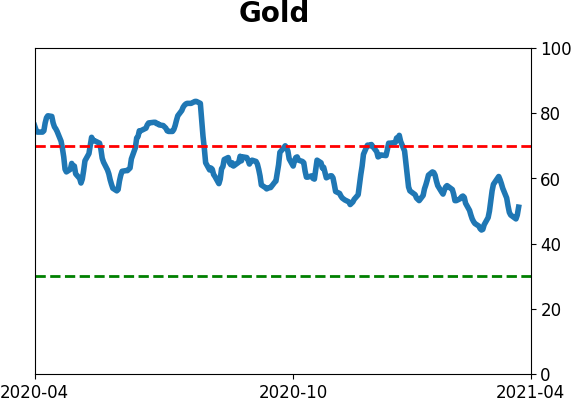
Various parts of the market have been hit in recent weeks, with mild oversold conditions. The Bond Optimism Index is now about as low as it gets during healthy bond market environments. Fixed income isn't responding well, so that needs to be monitored in case it's transitioning to a longer-term negative market environment. GOLD: Weak buy
A dollar trying to rebound from a severe short position has weighed on gold and miners. The types of signals they've given in recent weeks, within the context of their recent surge, have usually resulted in higher prices over a medium- to long-term time frame. Like bonds, gold and miners aren't responding very well, and this needs to be monitored.
|
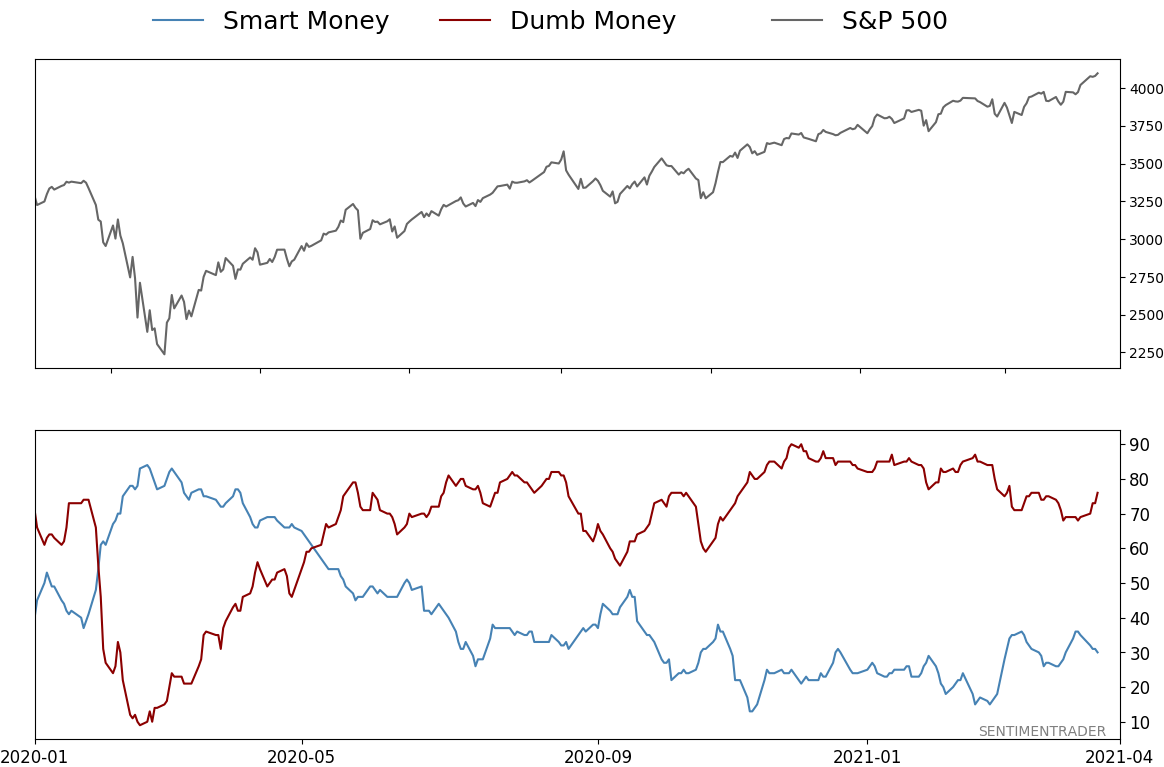
Smart / Dumb Money Confidence
|
Smart Money Confidence: 30%
Dumb Money Confidence: 76%
|
|
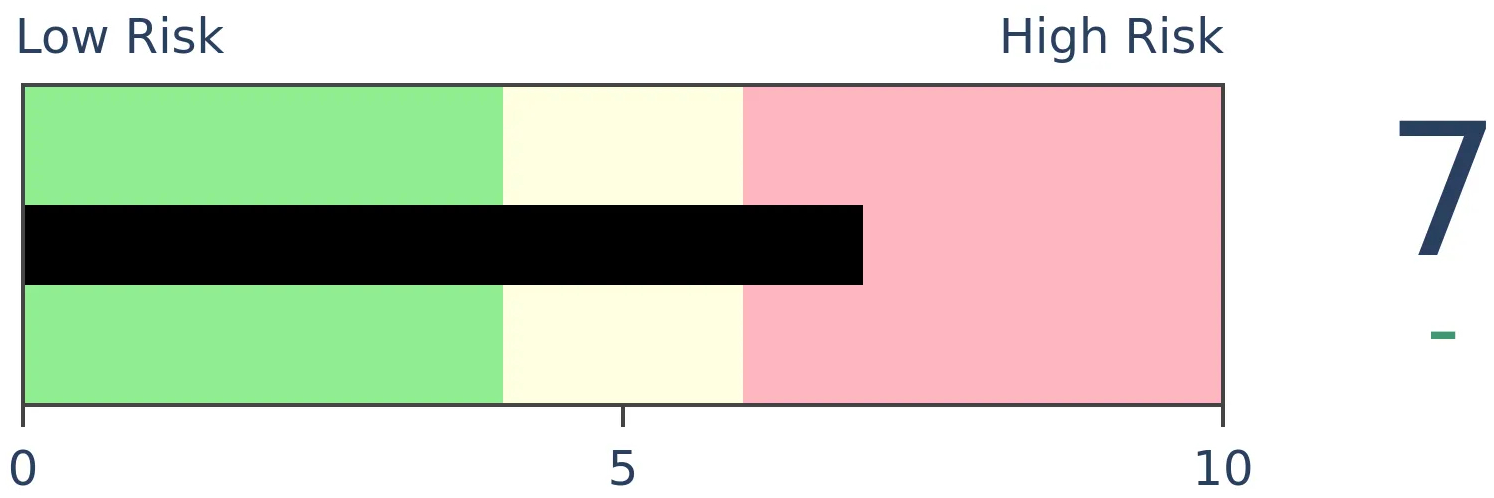
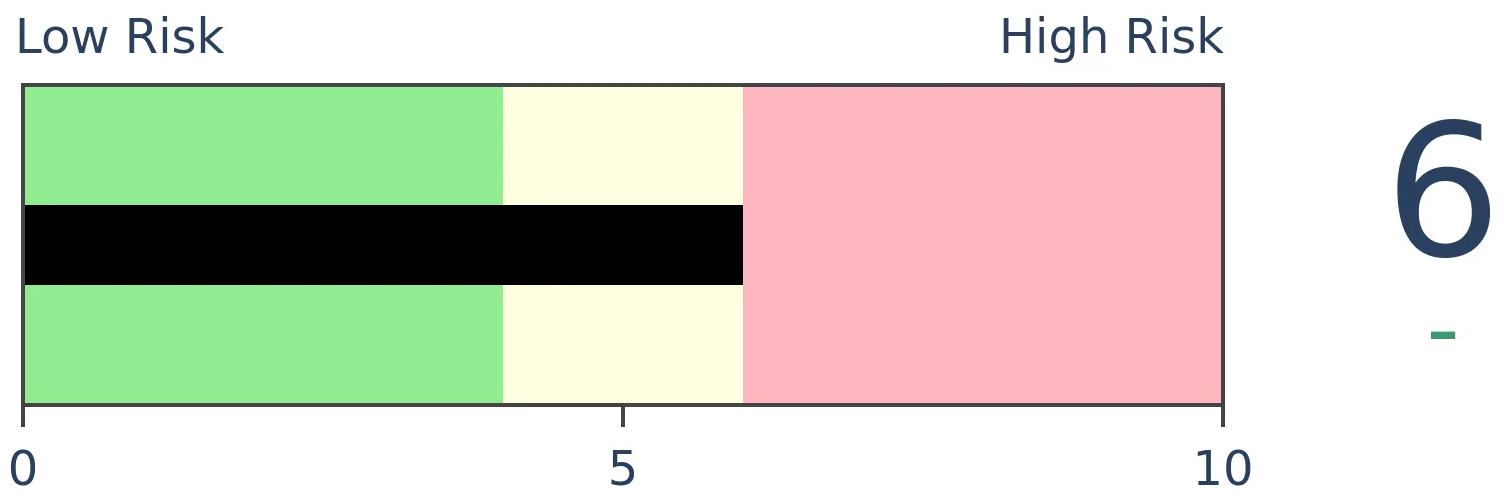
Risk Levels
Stocks Short-Term

|
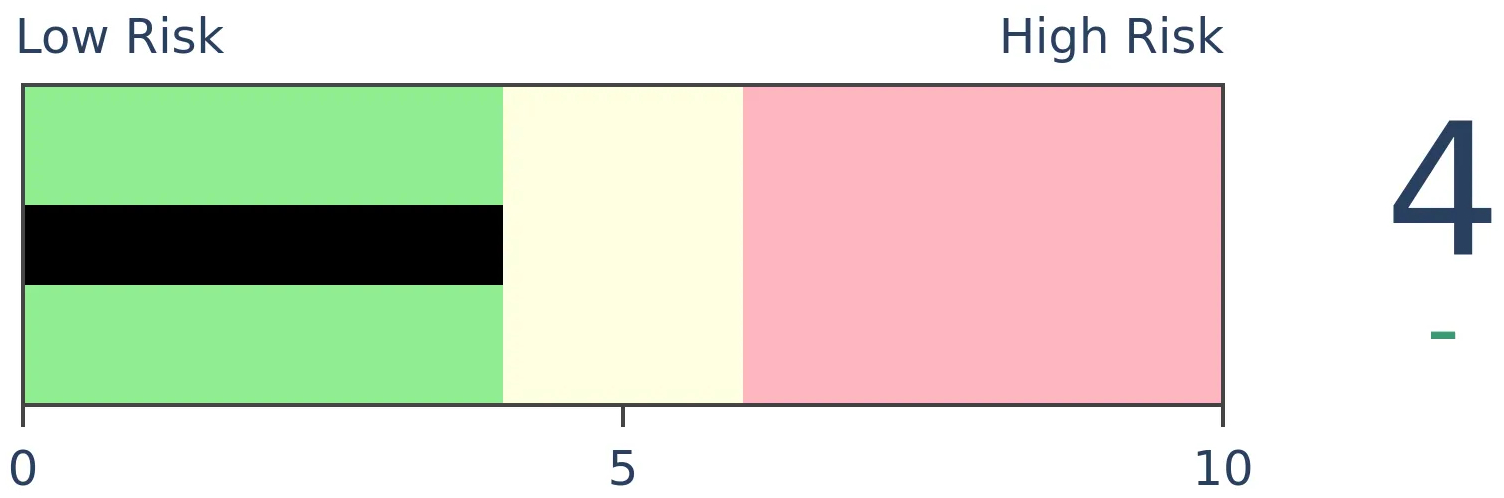
Stocks Medium-Term
|
|
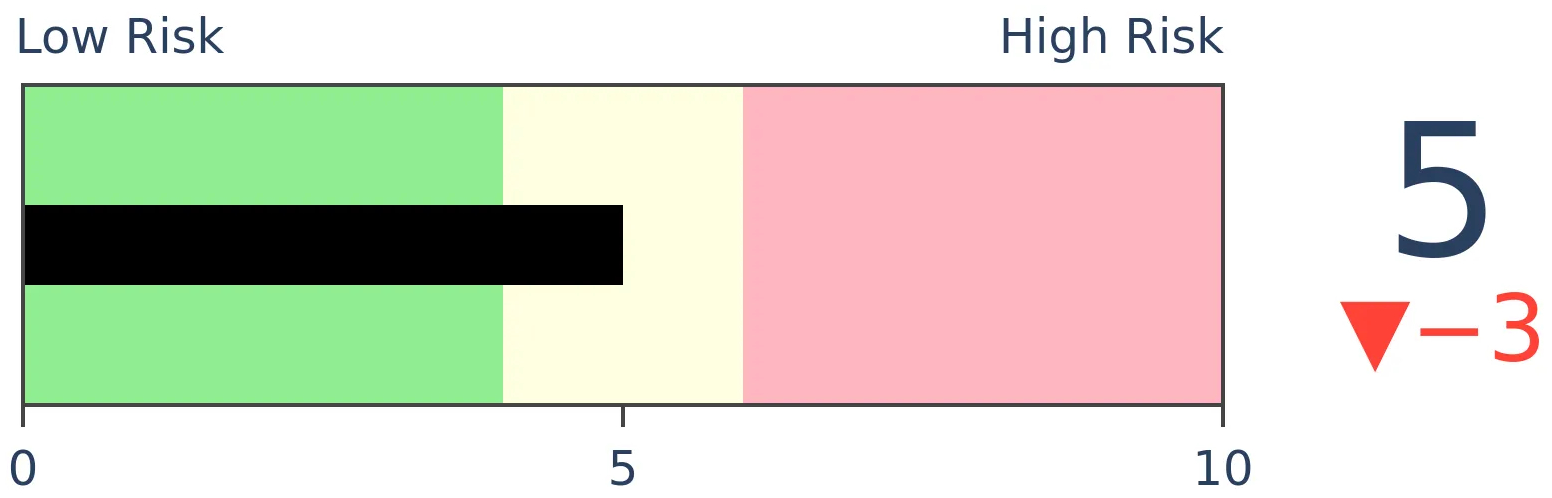
Bonds
|
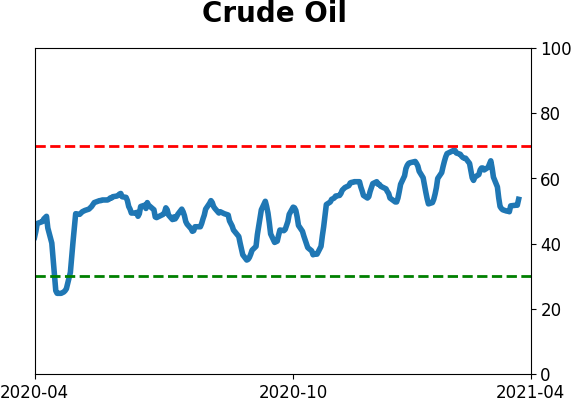
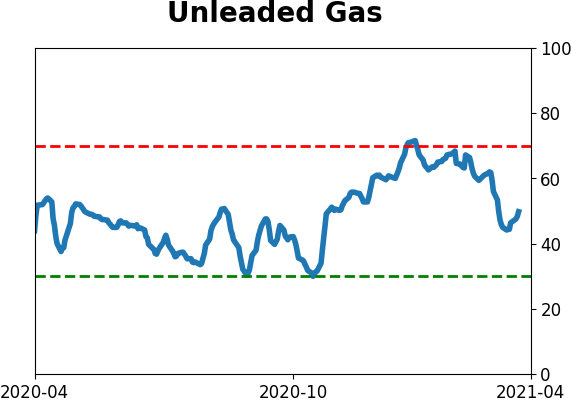
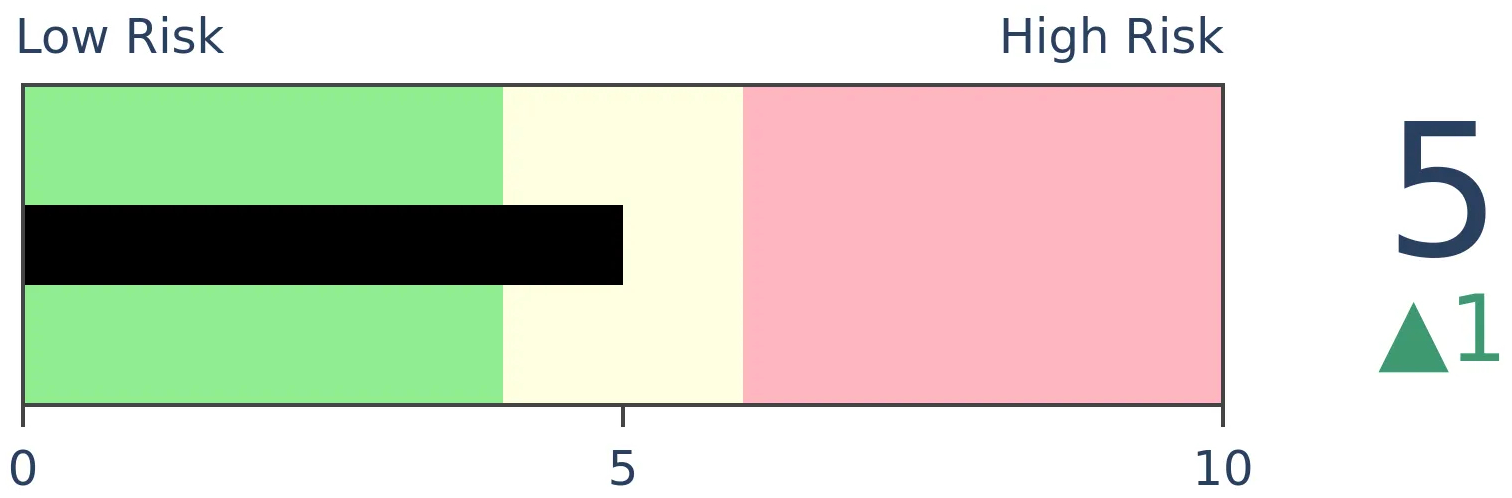
Crude Oil
|
|
Gold
|
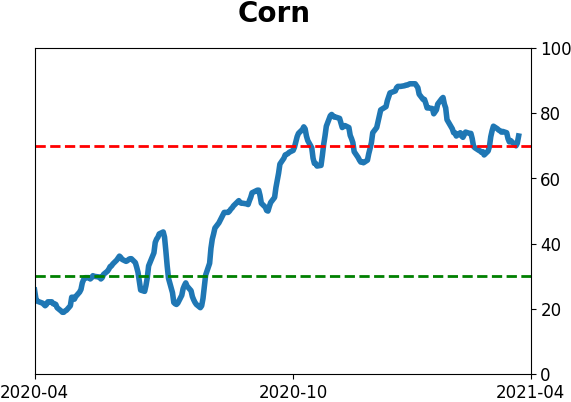
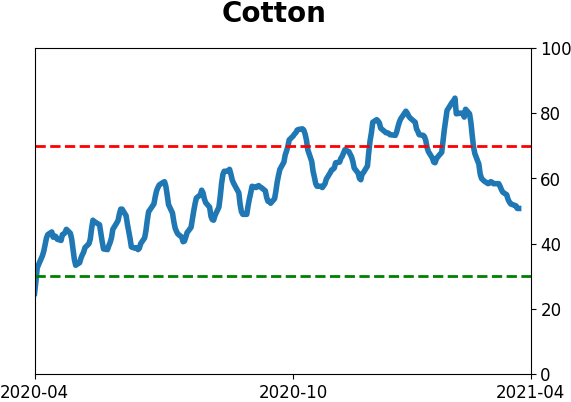
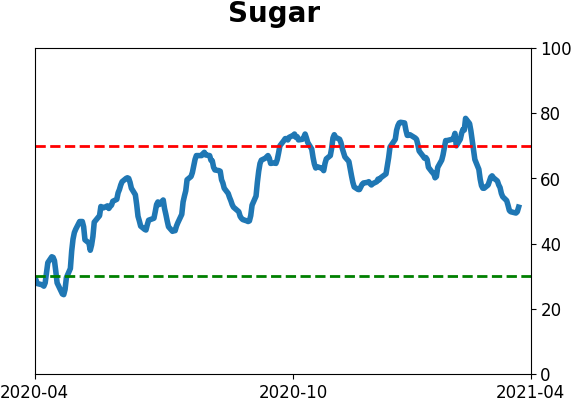
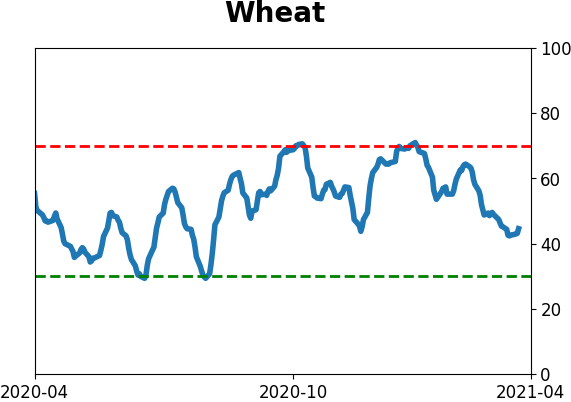
Agriculture
|
|
Research
BOTTOM LINE
It's no secret that much of the gains in stocks in recent decades have come overnight. It might be surprising to some, however, just how much the day of the week has mattered to those gains. There was a very stark difference between activity on Tuesdays and Thursdays, in particular.
FORECAST / TIMEFRAME
None
|
Stocks gapping up in the morning seems like it has become a seemingly daily occurrence. That's an exaggeration, of course, as "only" 60% of the days in 2021 have started with a gain.
Last May, we saw how stark the difference was between activity outside of regular trading hours versus the daytime session. Excluding transaction costs, a trader would have enjoyed massive gains by buying at the close each day and selling at the open the next day. Someone exposed to stocks only during the day wouldn't have participated in any gains in almost 30 years. It was even starker for the IWM small-cap fund.
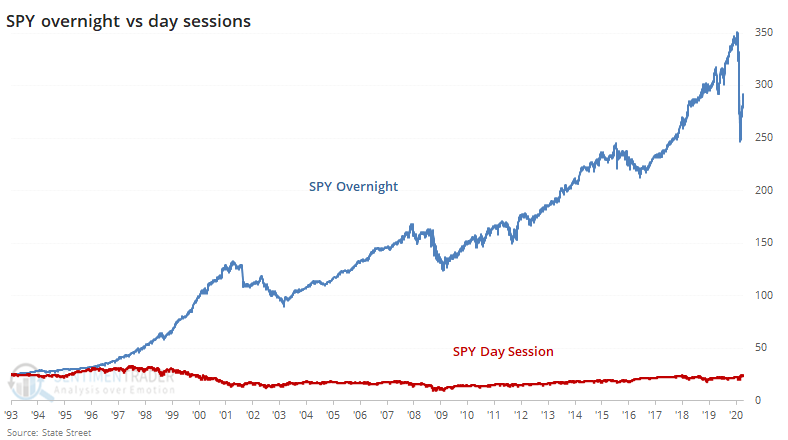
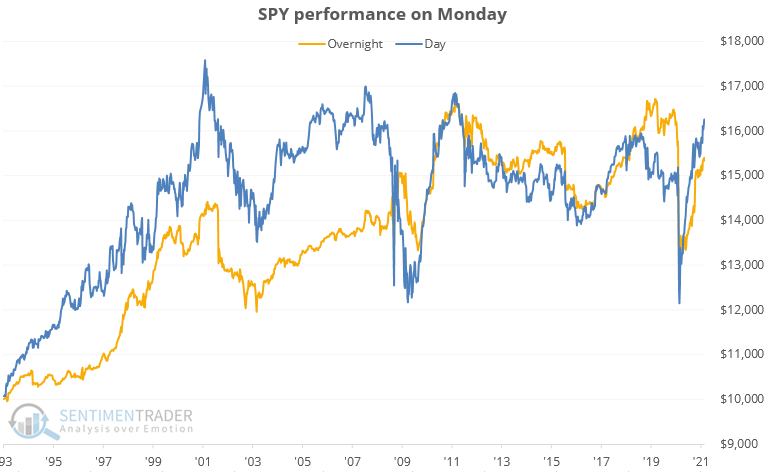
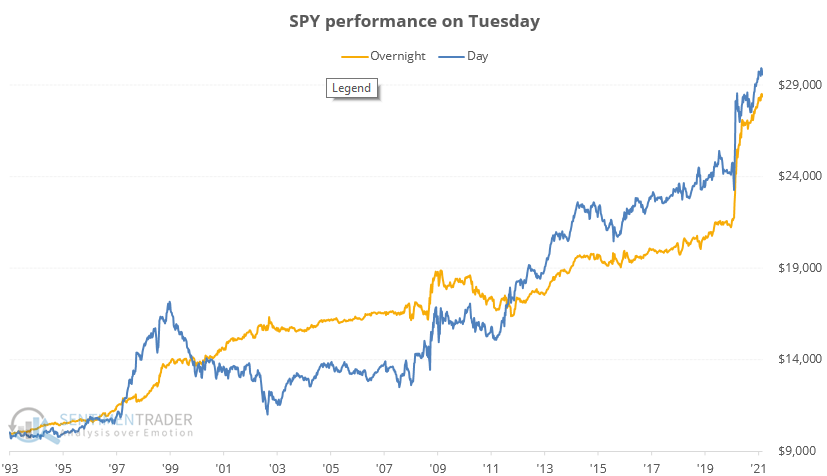
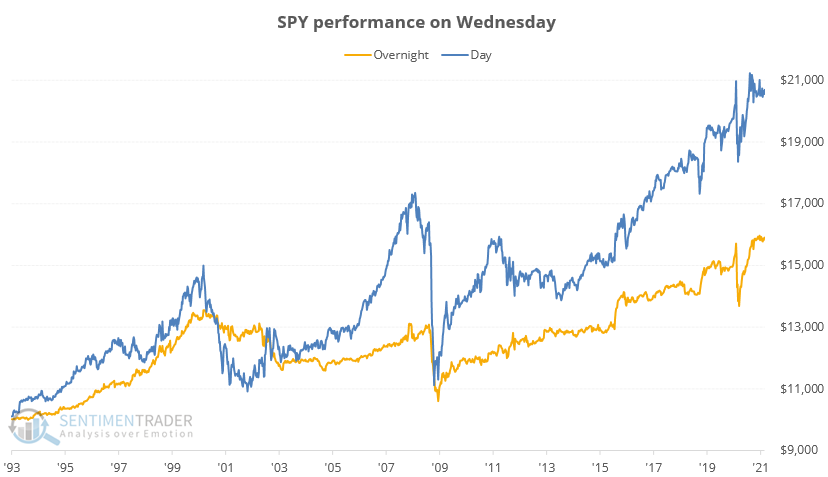
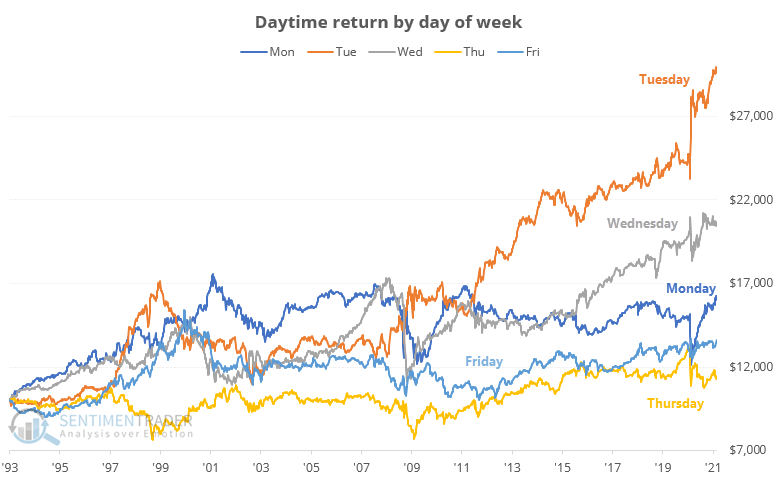
If we want to know which days provide most of the gains, then we can glean some insight from the chats below. For each day of the week, we can see the growth of $10,000 invested in SPY only overnight (gold line) or only during regular trading hours (blue line).
On Monday, the day session powered much of the gains from inception through just before the financial crisis. Not so much since then.
Tuesday has been the market's workhorse, both overnight and during the day. It wasn't that great of a weekday after the popping of the 2000 bubble, but since then it has been the best day to be invested, by far. It was even better if one just bought at Monday's close and held through Tuesday's, capturing both the overnight and regular session gains.
On Wednesdays, traders saw mostly decent returns, but during bear markets, it often bore the brunt of some of the selling pressure. Not sure why that might be.
Thursday has been, by far, the worst day of the week to hold the S&P. The gains from Wednesday's close through Thursday's open were meager, and they were even worse if holding just Thursday's day session.
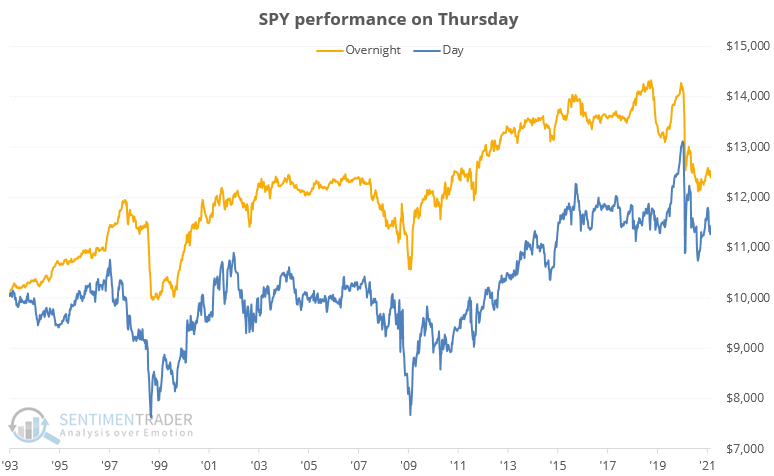
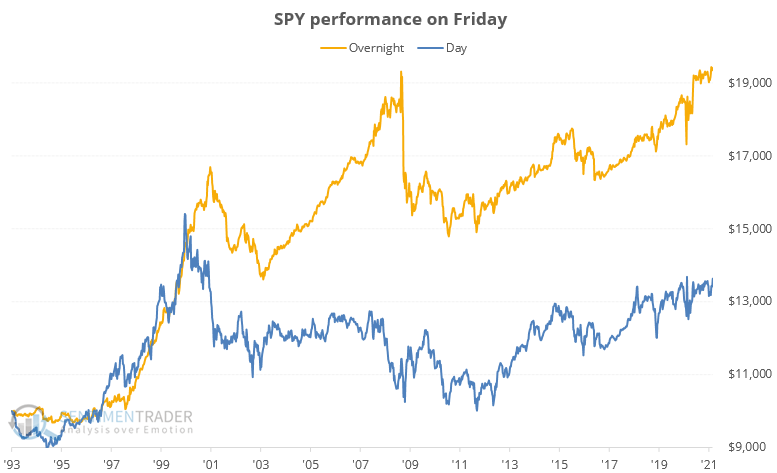
If one bought Thursday's often ugly closes, though, and held until Friday's open, then it would have generated decent gains, the 2nd-best of the week. That seemed to use up a lot of the buying power heading into the weekends, though, because Friday's regular session has gone nowhere for 20 years.
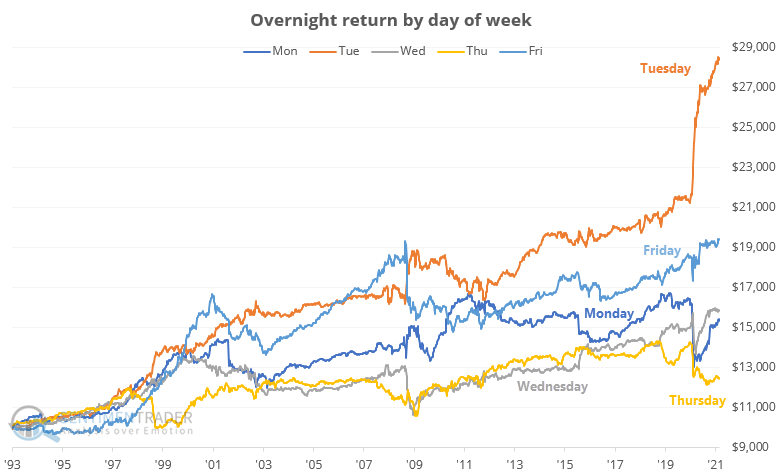
When putting them all together for the overnight session, we can see just how stark of a difference there is between days of the week. A hyperactive trader would have earned nearly 3x their money holding overnight into Tuesday mornings than they would have by holding overnight into Thursday mornings.
And for the daytime session, the differences were almost as stark, with the same two weekdays bookending the performance extremes. Tuesday's regular sessions earned nearly 3x what a trader earned during the day on Thursdays. The rest of the days were mixed in the middle, with a different order than the overnight sessions.
A long-term investor has pretty much no use for this information, even assuming that it stays somewhat static going forward. It seems like a consistent bias would be arbed away by hedge funds at some point. A major change in the market's trend can often serve as an impetus for a change like that, but with stocks soaring to new highs, a trend change doesn't look imminent.
For shorter-term traders, it's remarkable how consistent the bias has been, especially comparing Tuesday to Thursday. So if planning an entry, perhaps waiting for Thursday's close would give a better entry at a lower price, or waiting for Tuesday's close to exit would give sellers an edge. This can, of course, vary wildly from week to week, but over time it has been a consistent enough phenomenon to note.
Active Studies
| Time Frame | Bullish | Bearish | | Short-Term | 0 | 0 | | Medium-Term | 0 | 10 | | Long-Term | 11 | 4 |
|
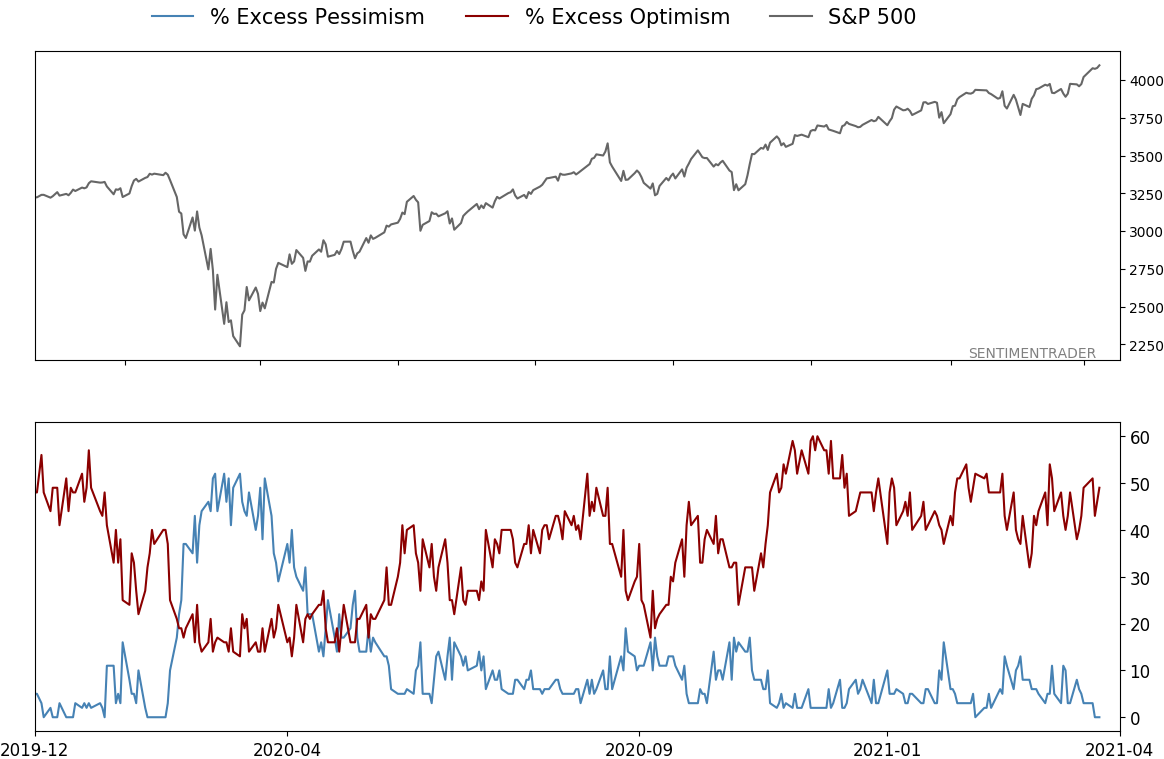
Indicators at Extremes
|
% Showing Pessimism: 0%
Bullish for Stocks
|
|
Portfolio
| Position | Description | Weight % | Added / Reduced | Date | | Stocks | RSP | 4.9 | Reduced 4% | 2021-02-09 | | Bonds | 30.0% BND, 8.8% SCHP | 38.8 | Added 15.1% | 2021-02-18 | | Commodities | GCC | 2.3 | Reduced 2.1%
| 2020-09-04 | | Precious Metals | GDX | 9.0 | Added 0.1% | 2021-02-18 | | Special Situations | 7.3% XLE, 4.8% PSCE | 12.1 | Reduced 5.6% | 2021-02-18 | | Cash | | 32.8 | | |
|
Updates (Changes made today are underlined)
With a market that has seen the kinds of broad participation and big breath thrusts like we did in the fall, it's hard to become too negative. Those kinds of conditions have consistently preceded higher returns over the next 6-12 months. It's the interim that's more of an issue. Even conditions like that haven't prevented some shorter-term pullbacks. And when we combine an environment where speculation is rampant and recent days have seen an increase in cracks under the surface of the indexes, it's enough to become more defensive over a short- to medium-term time frame. We still don't have much confirmation from the price action in the indexes, so those who are more conservative would likely wait before increasing cash levels. I've decreased risk exposure a bit more, mainly in terms of energy stocks and the ANGL fund, while adding more to the broader bond market. RETURN YTD: 6.7% 2020: 8.1%, 2019: 12.6%, 2018: 0.6%, 2017: 3.8%, 2016: 17.1%, 2015: 9.2%, 2014: 14.5%, 2013: 2.2%, 2012: 10.8%, 2011: 16.5%, 2010: 15.3%, 2009: 23.9%, 2008: 16.2%, 2007: 7.8%
|
|
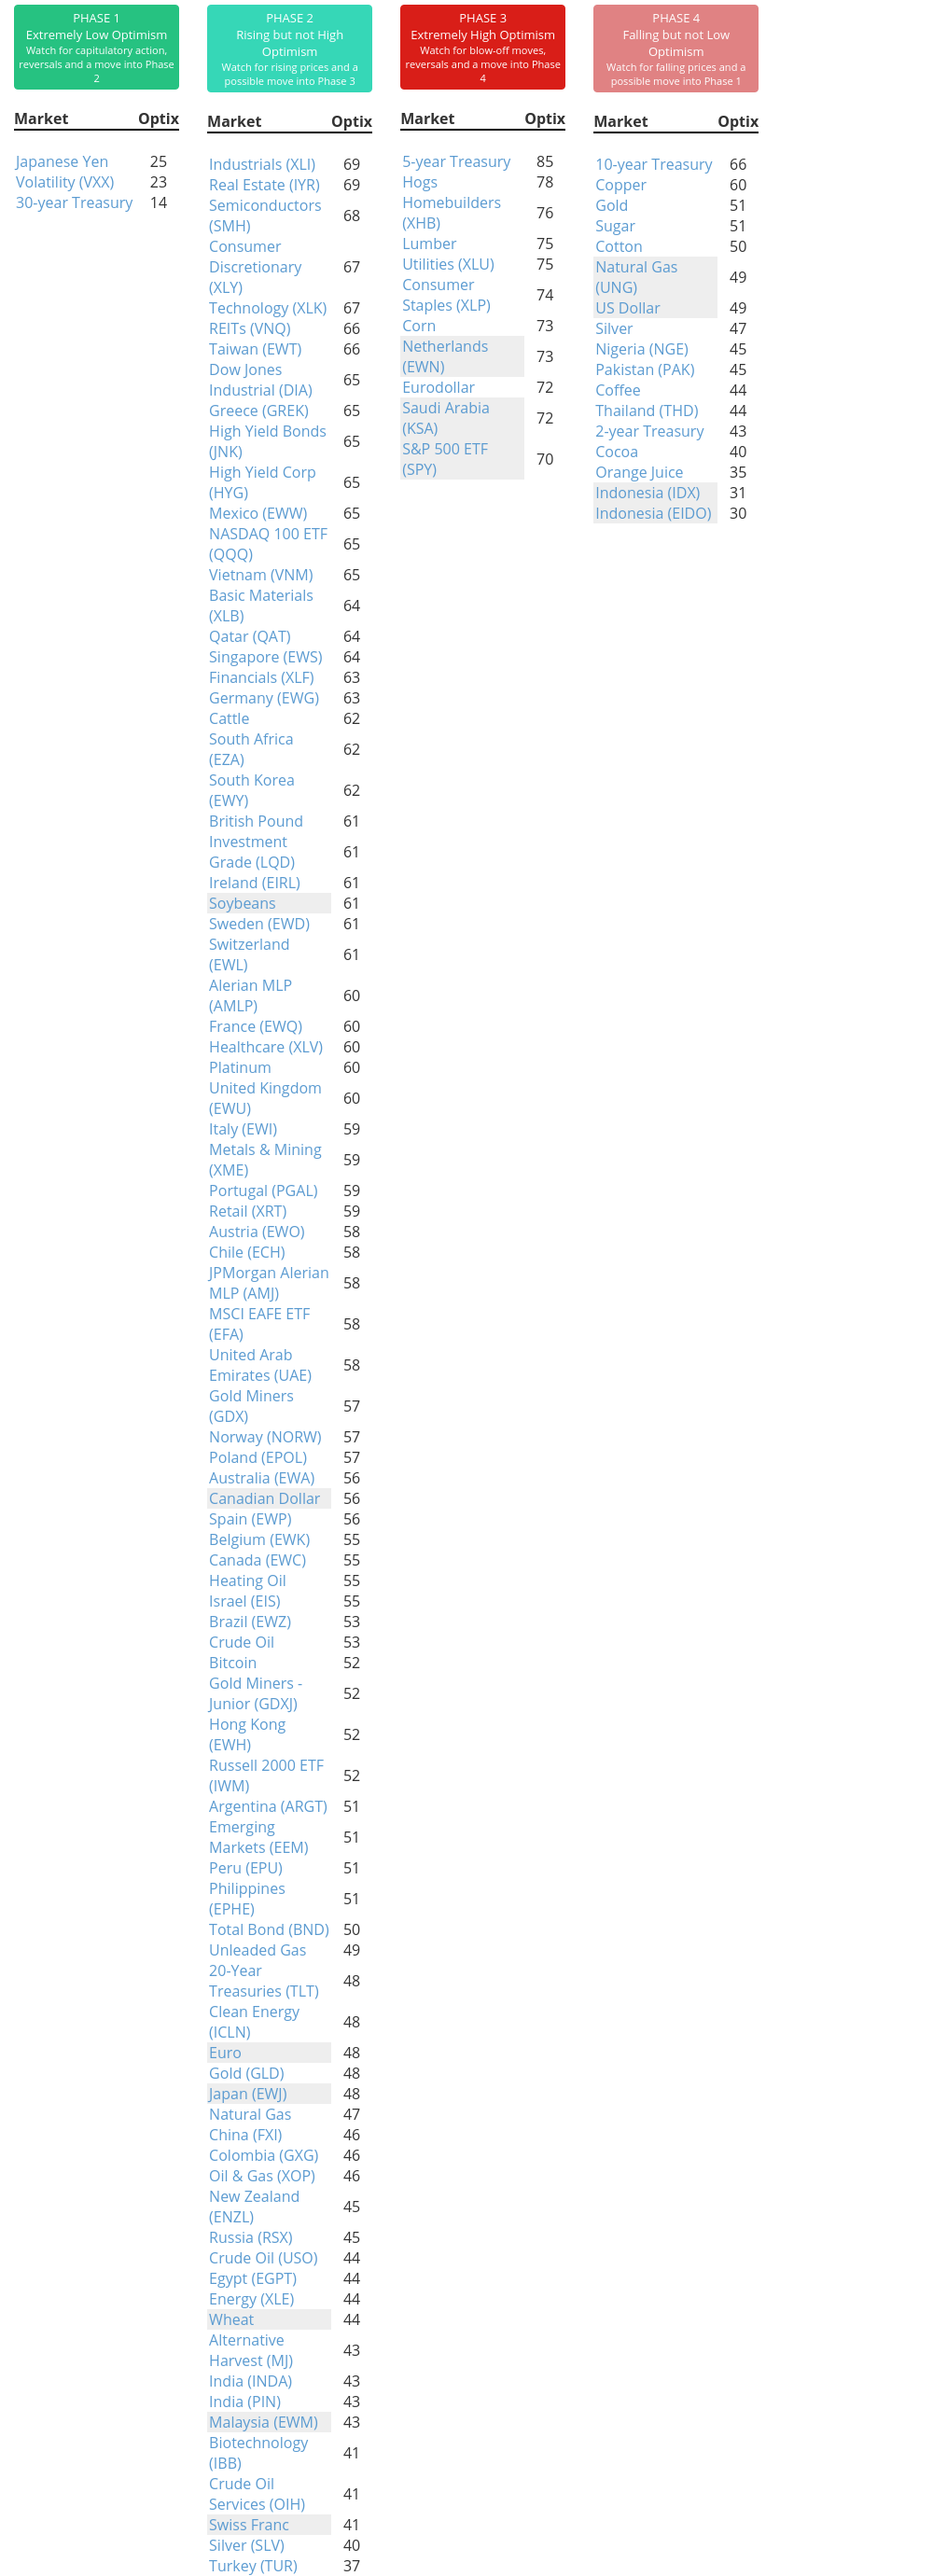
Phase Table
Ranks
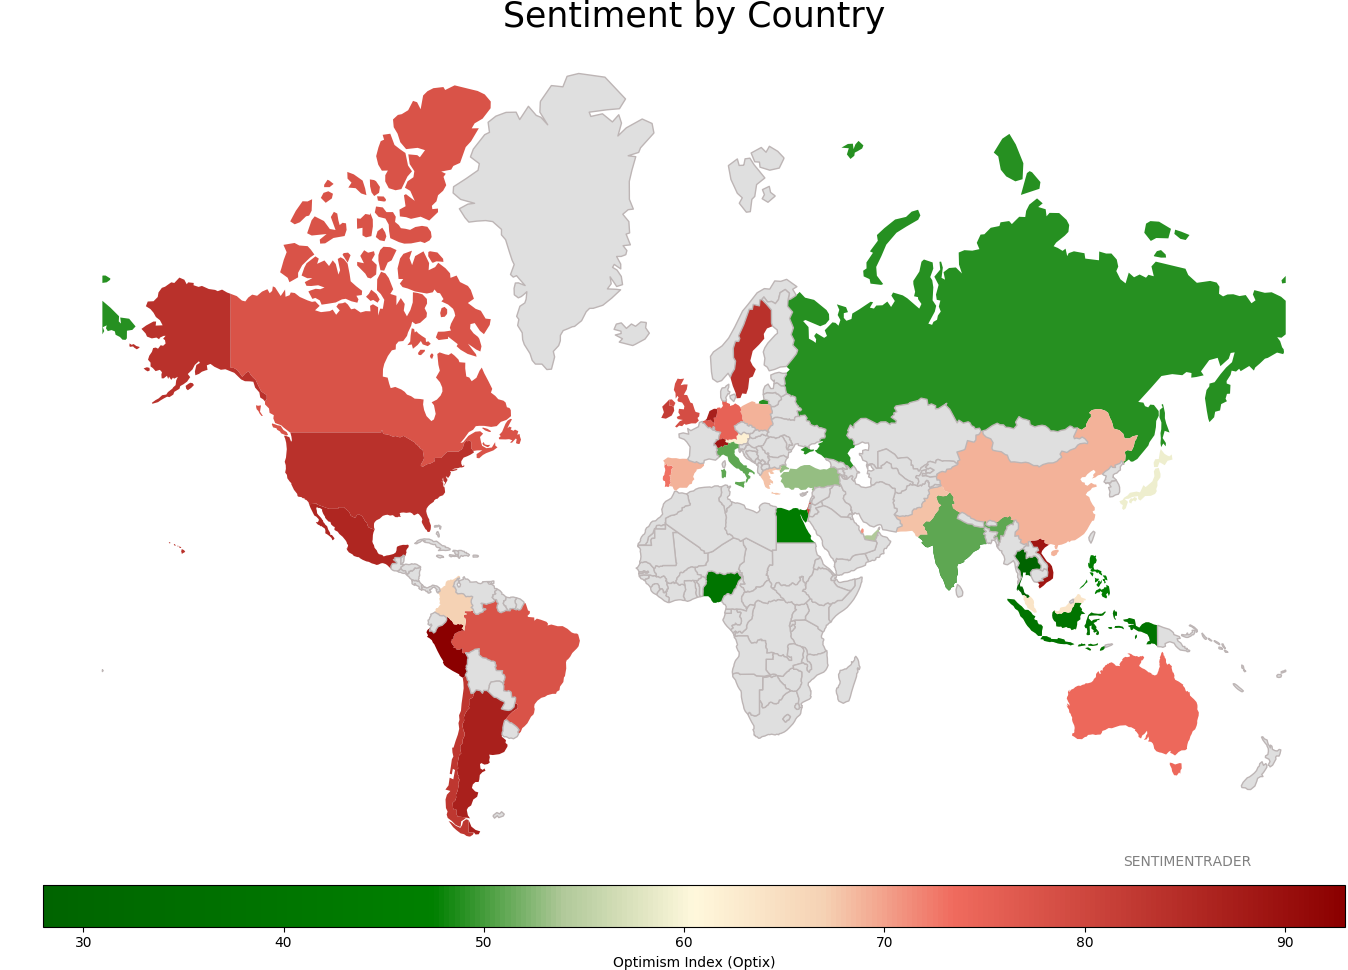
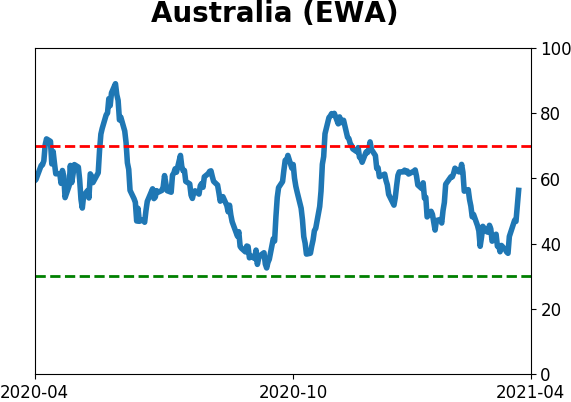
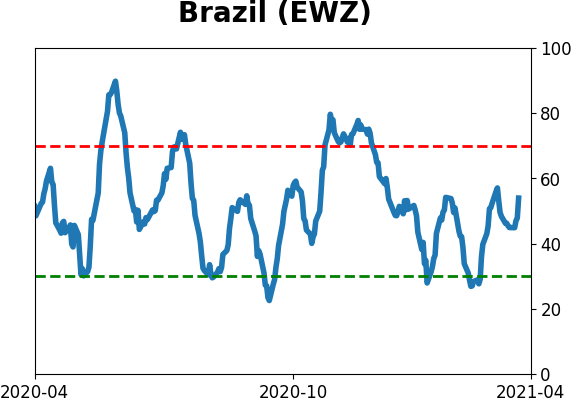
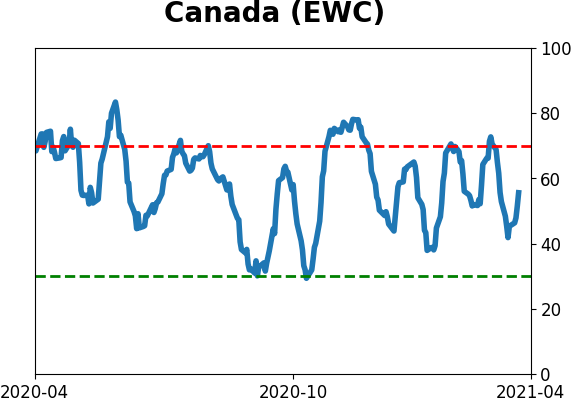
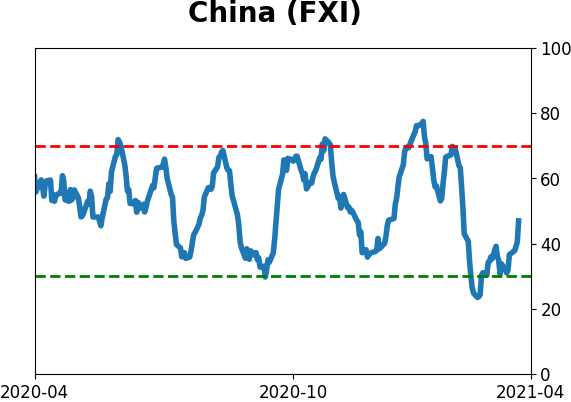
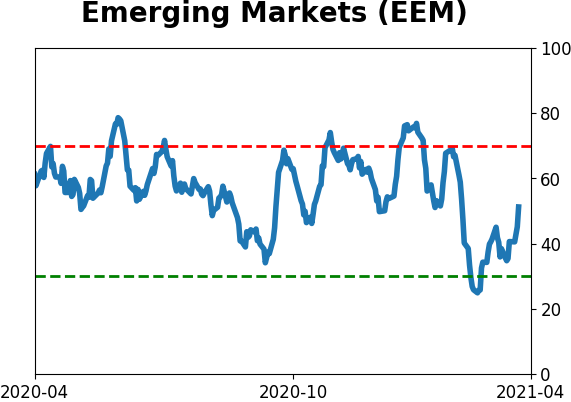
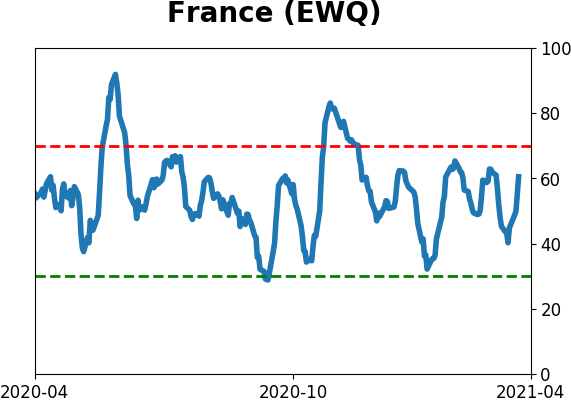
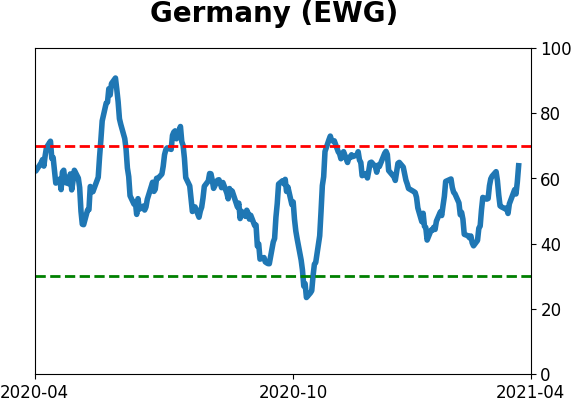
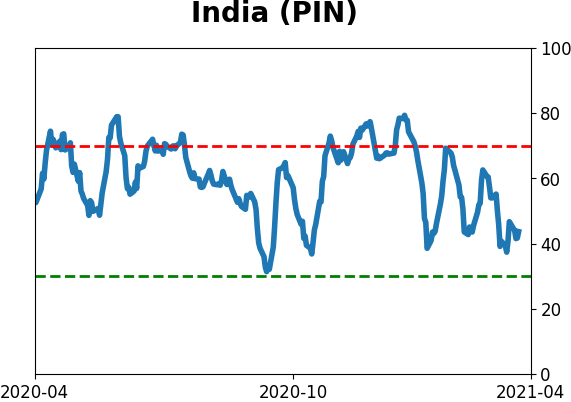
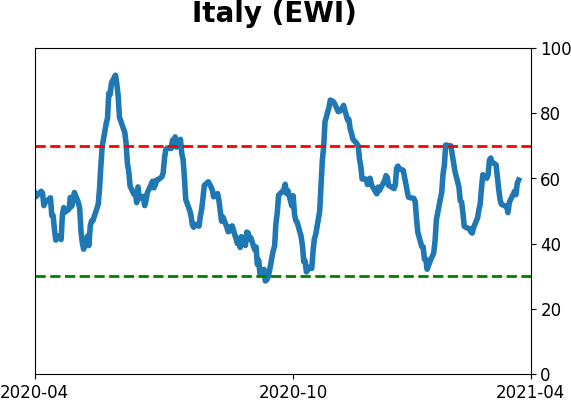
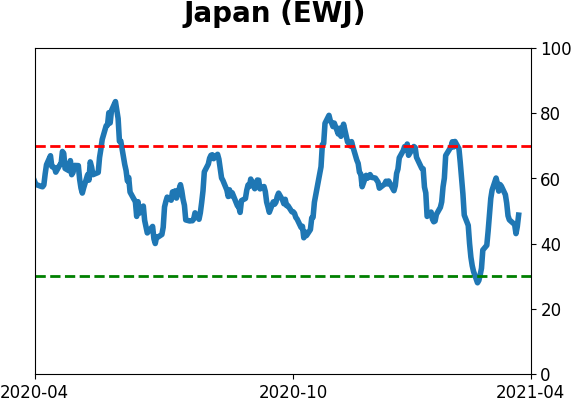
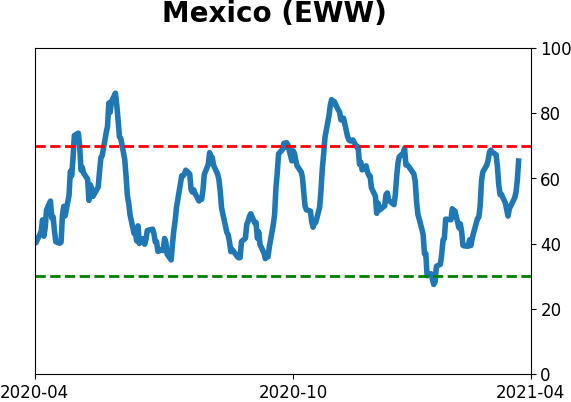
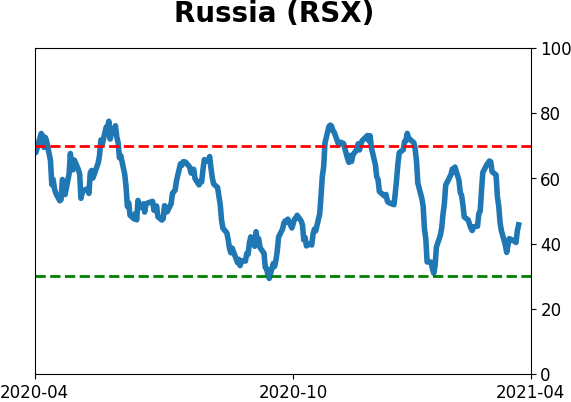
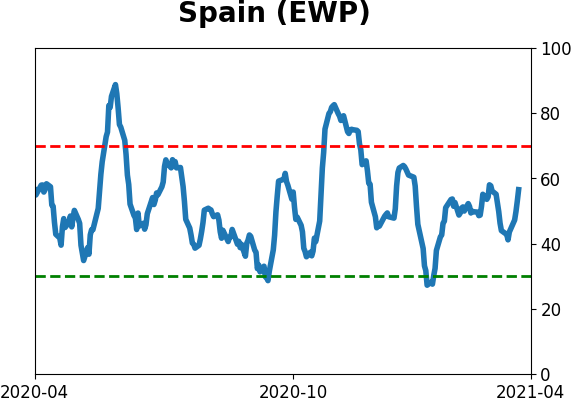
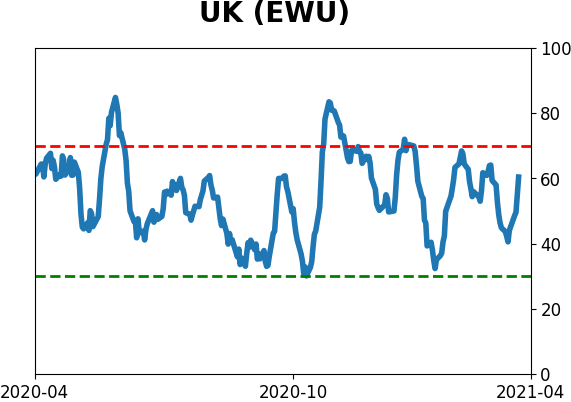
Sentiment Around The World
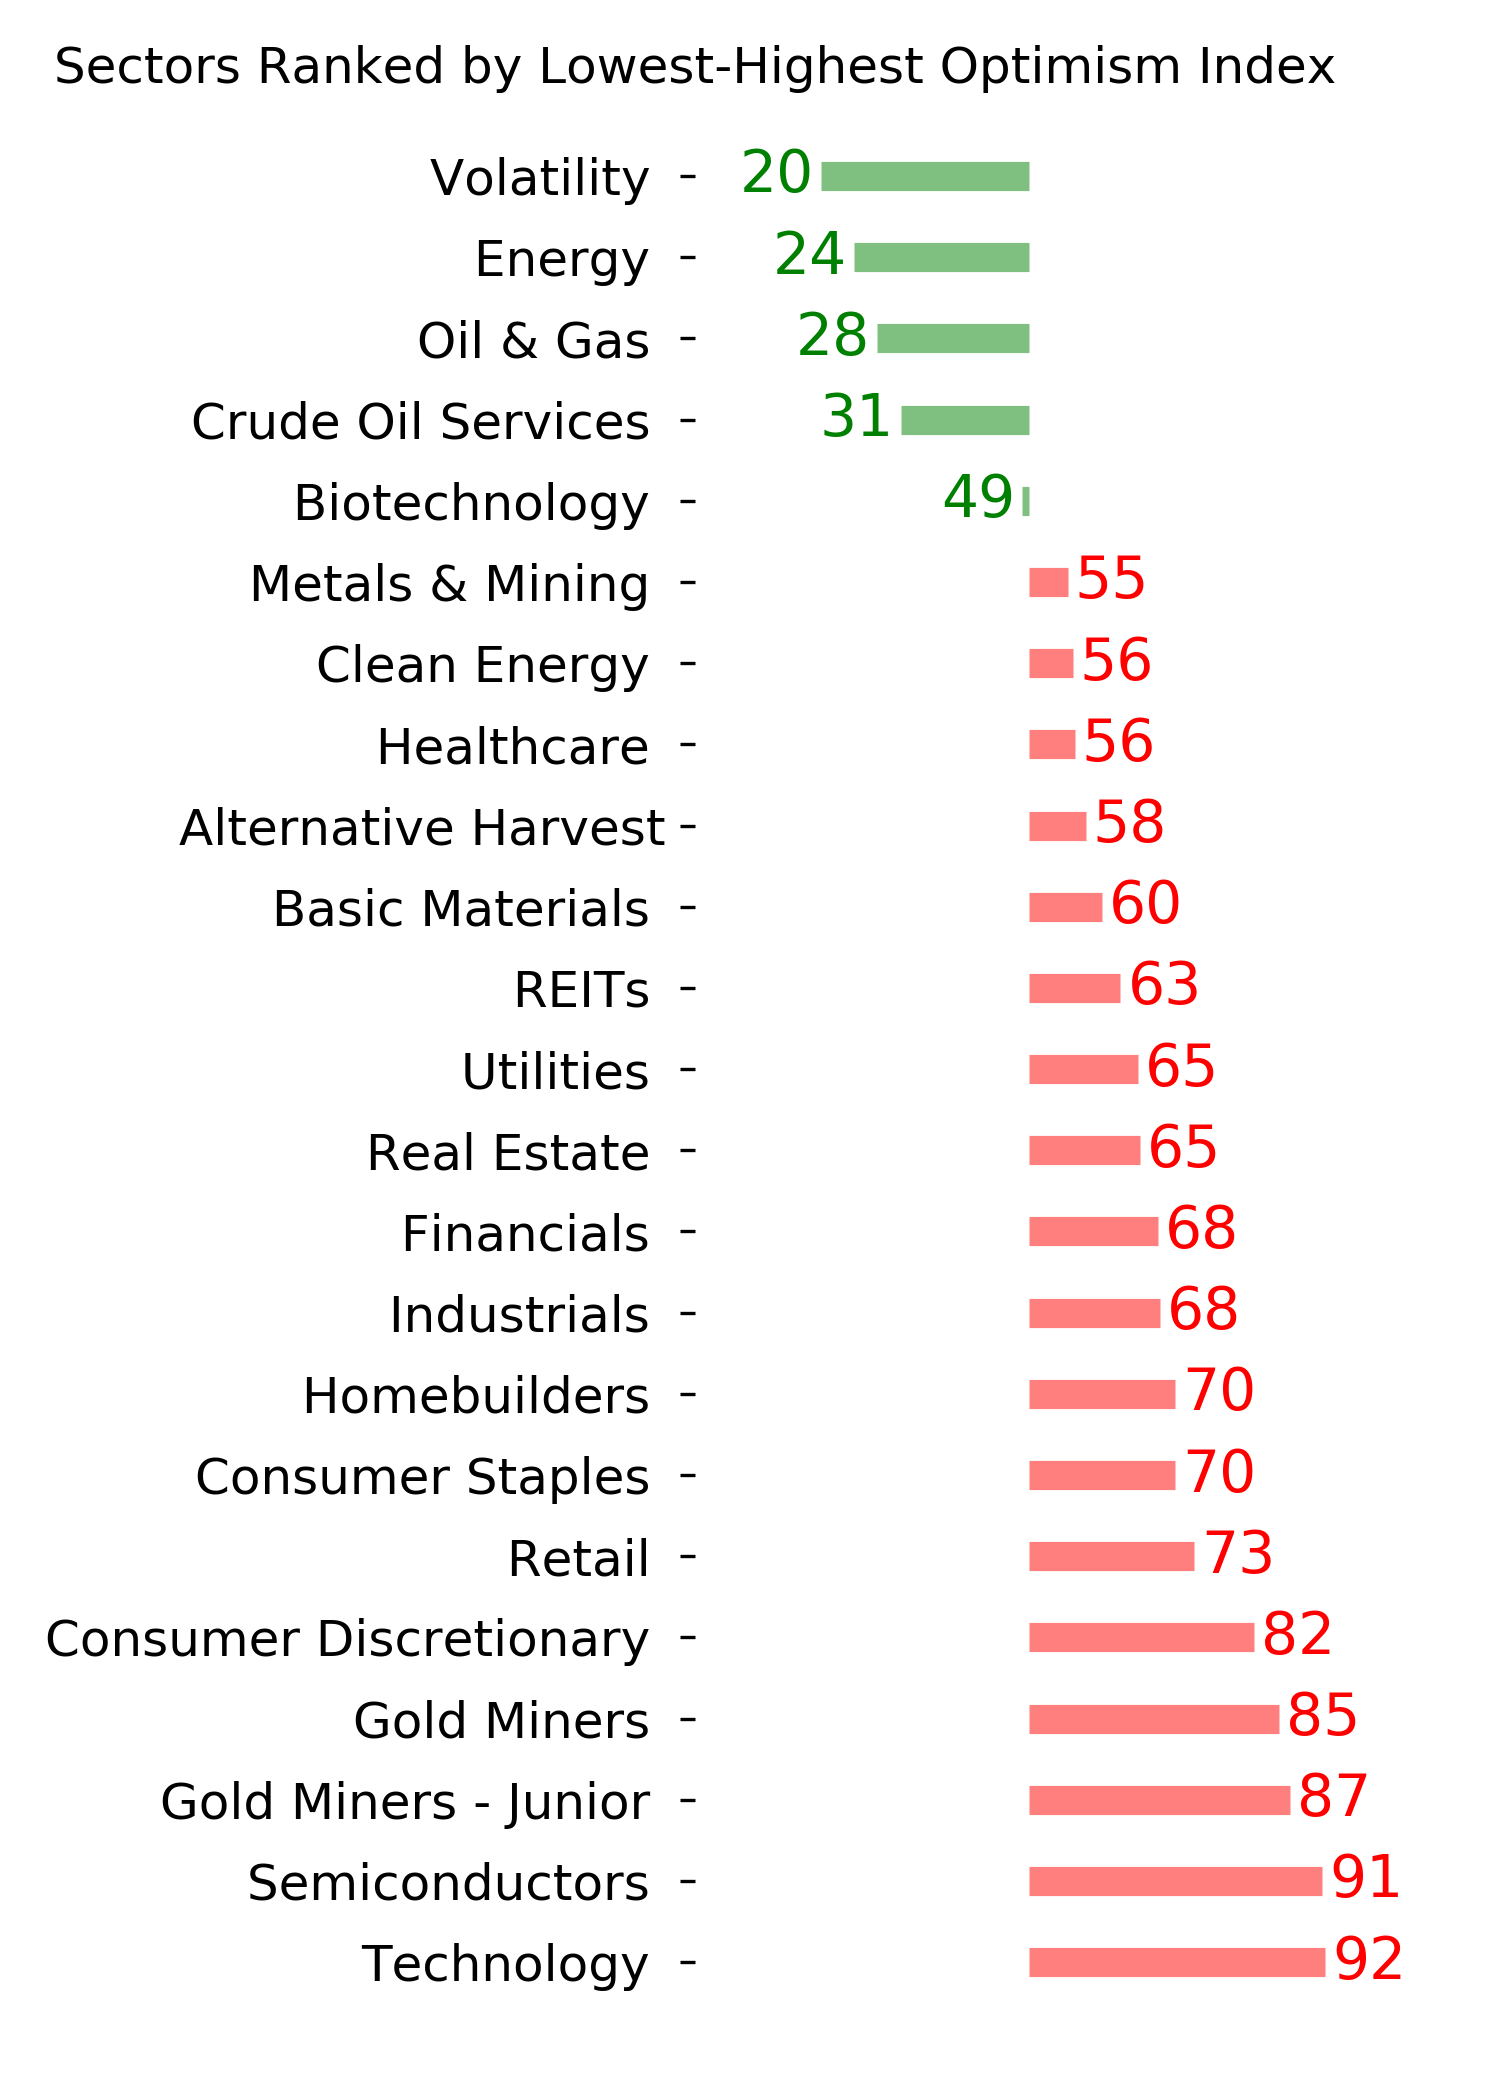
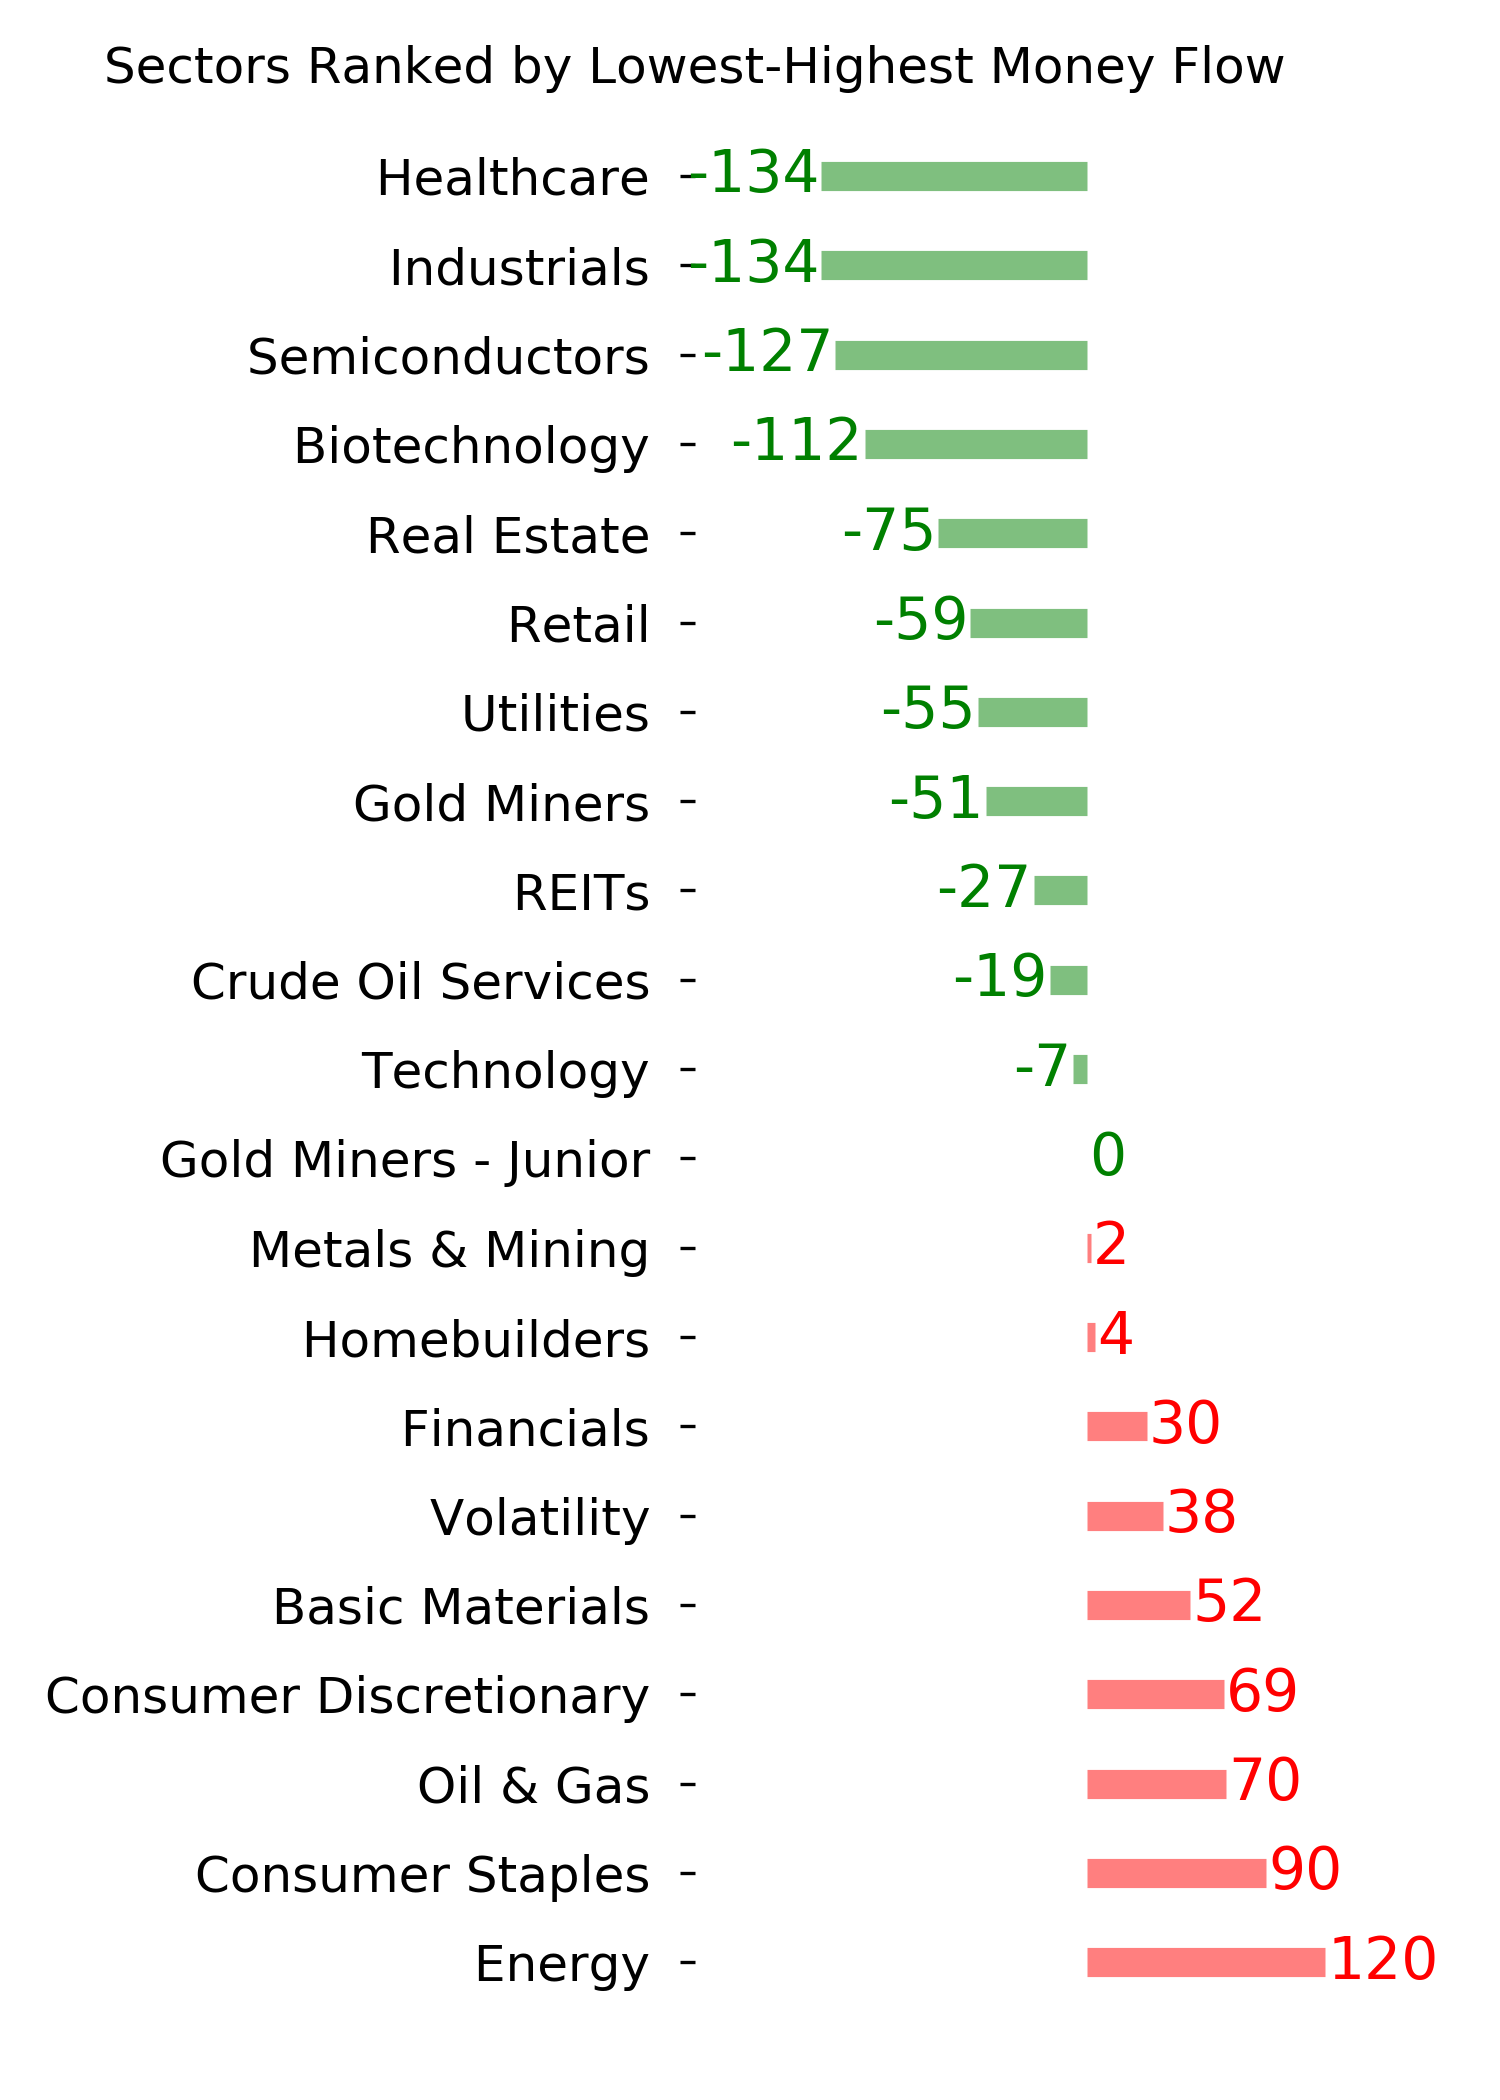
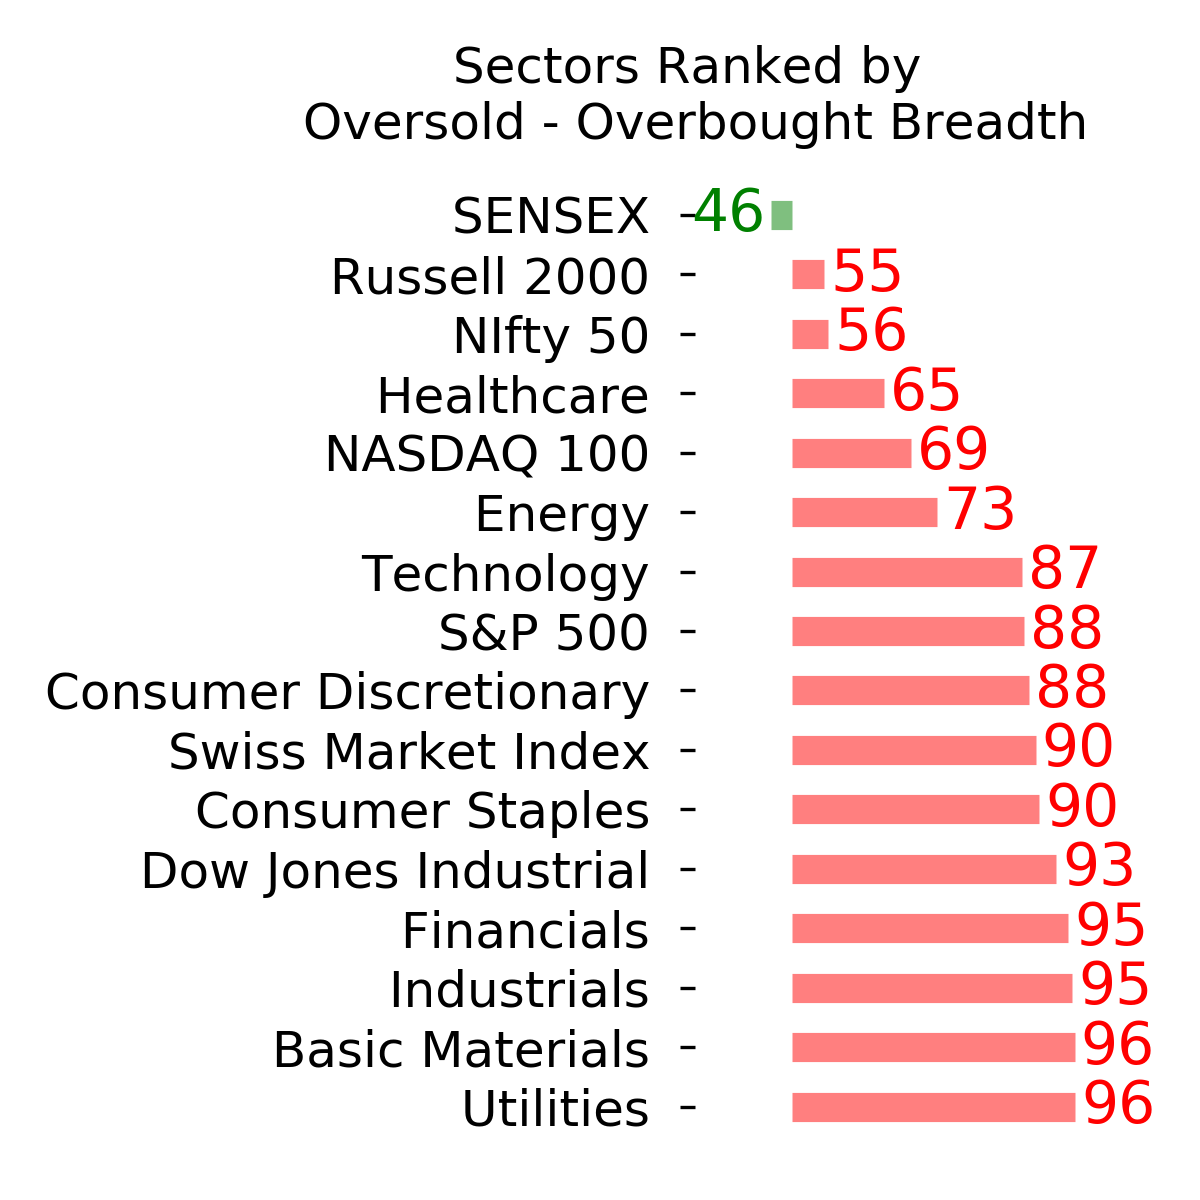
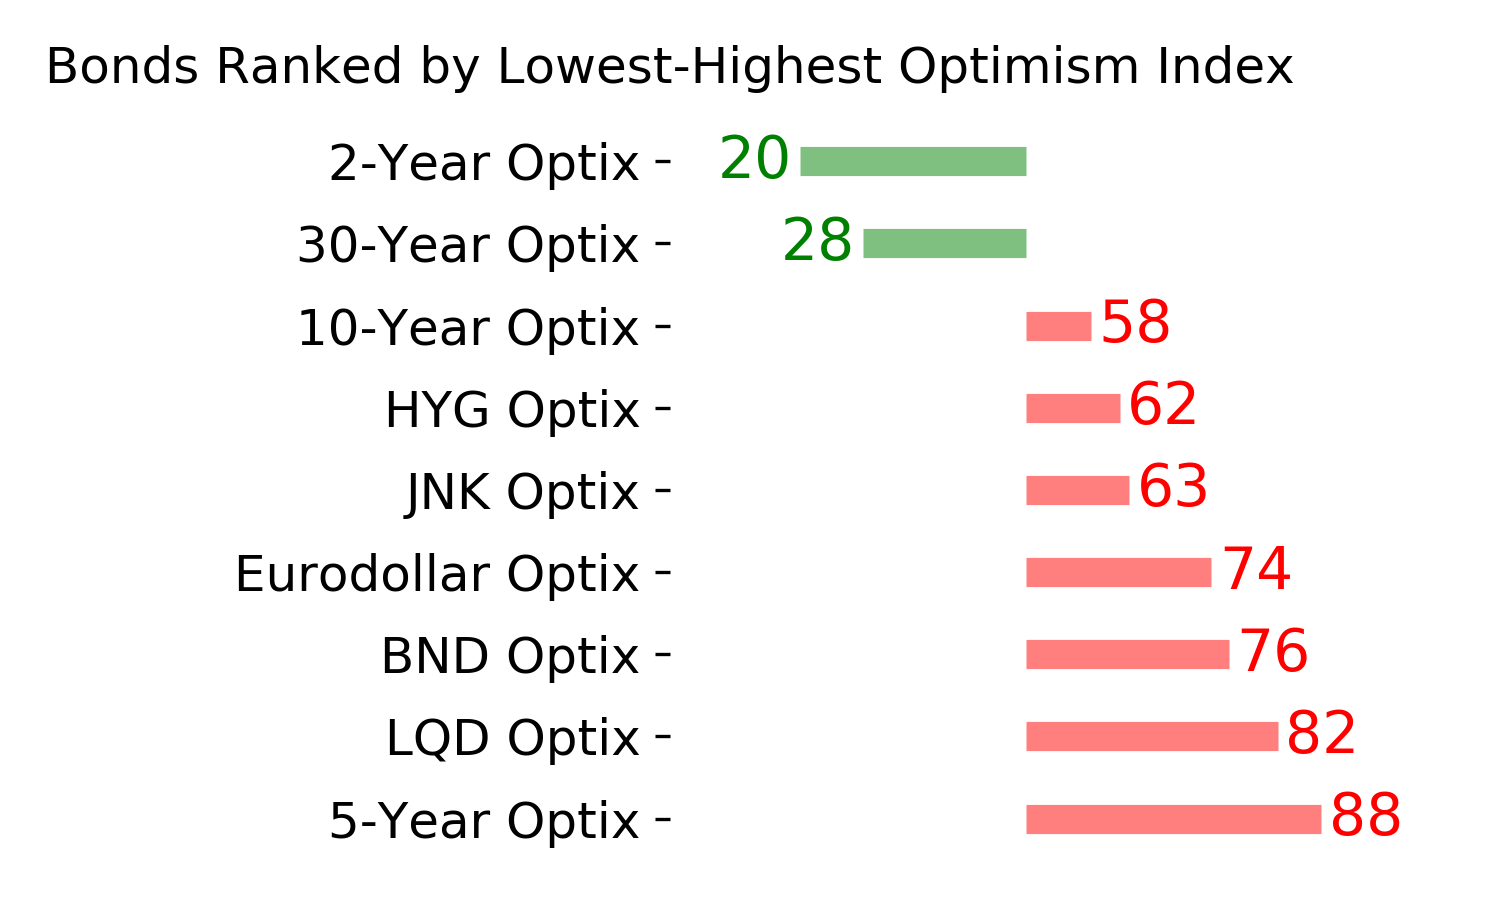
Optimism Index Thumbnails
|
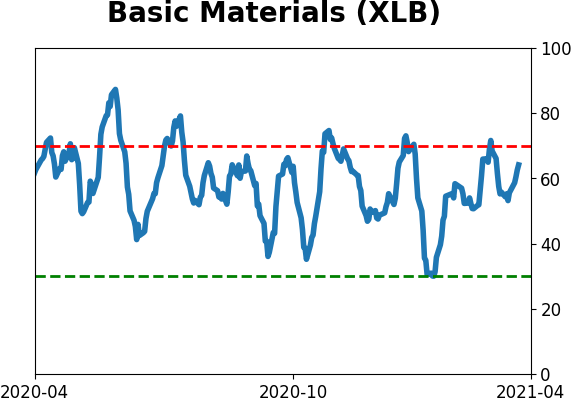
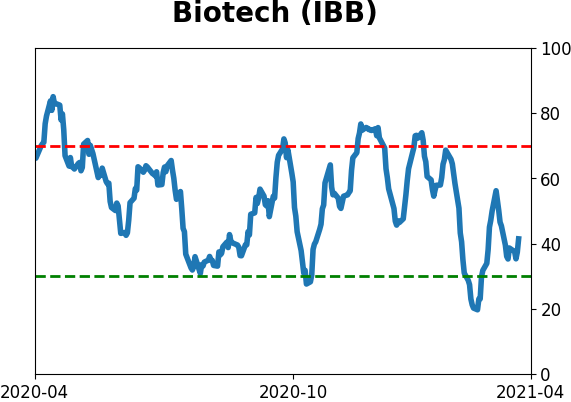
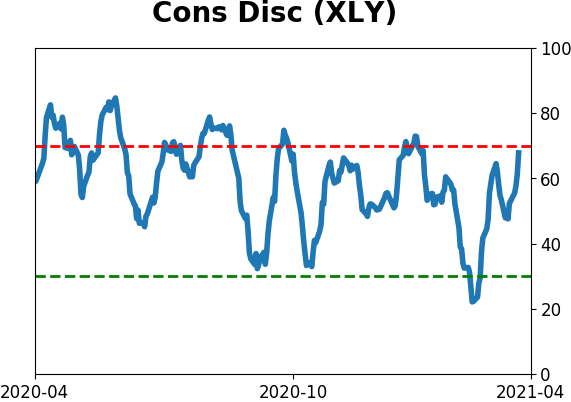
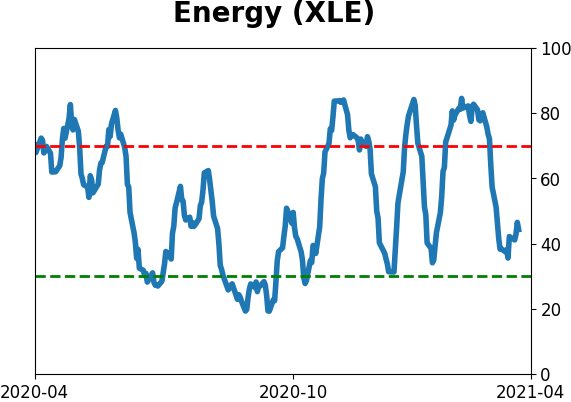
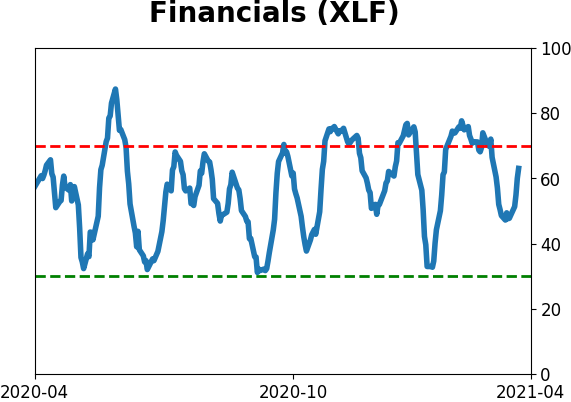
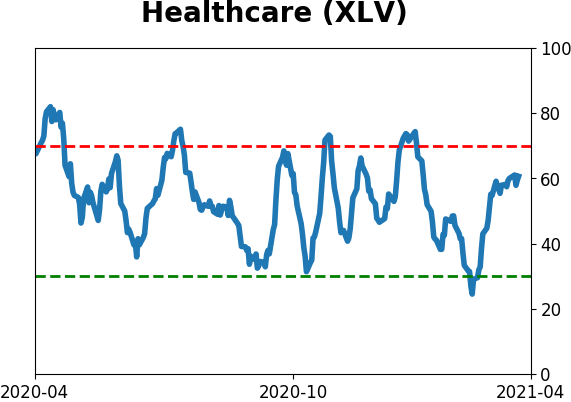
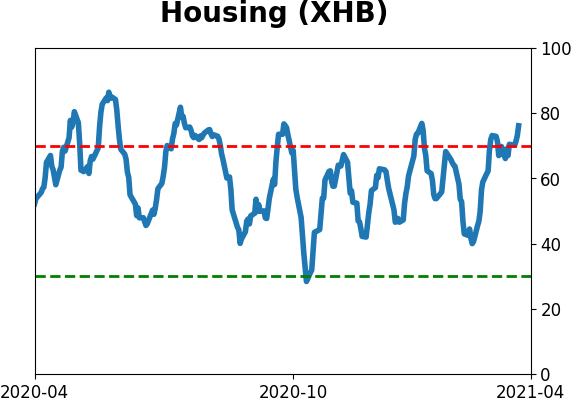
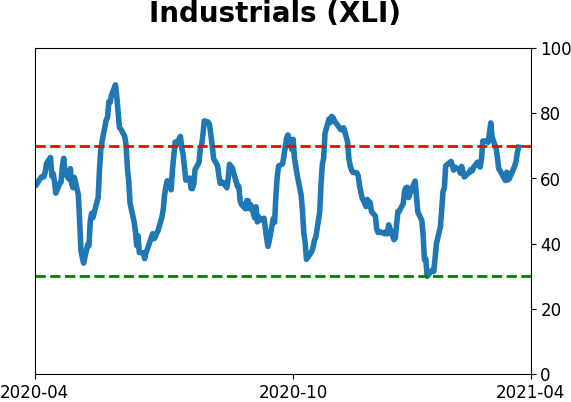
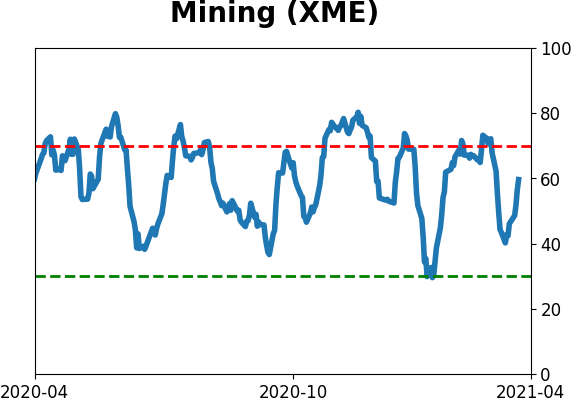
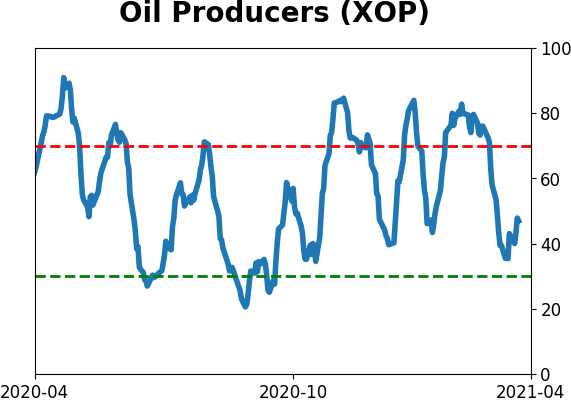
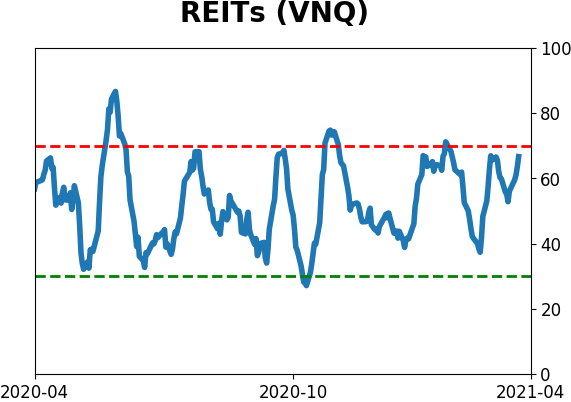
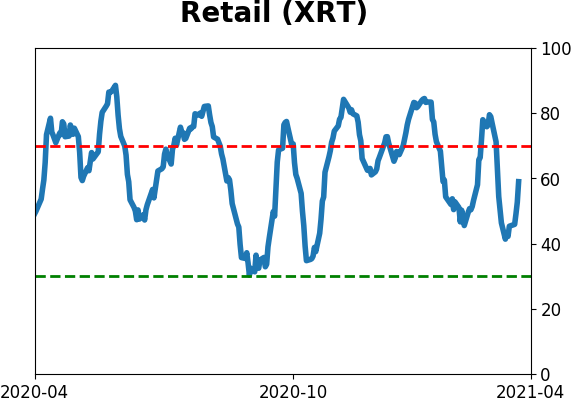
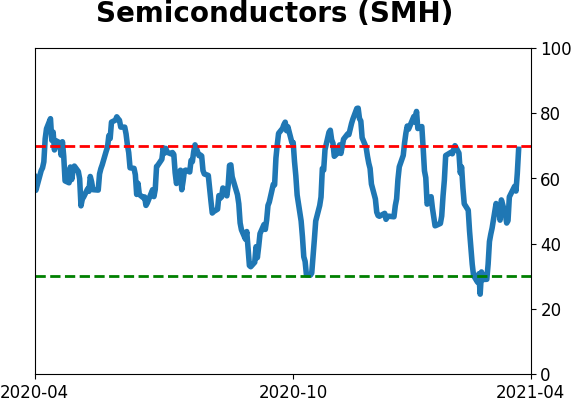
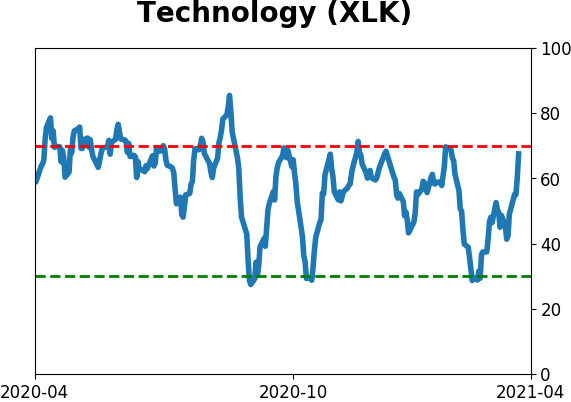
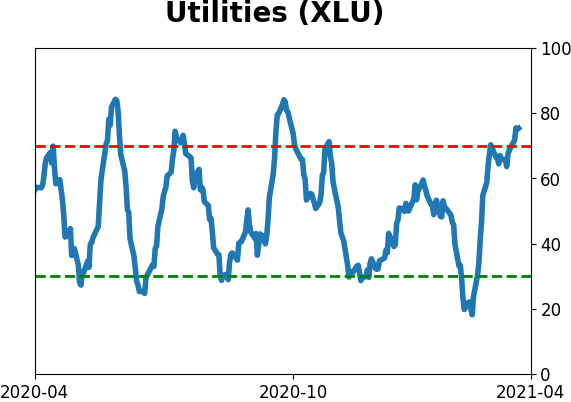
Sector ETF's - 10-Day Moving Average
|
|
|
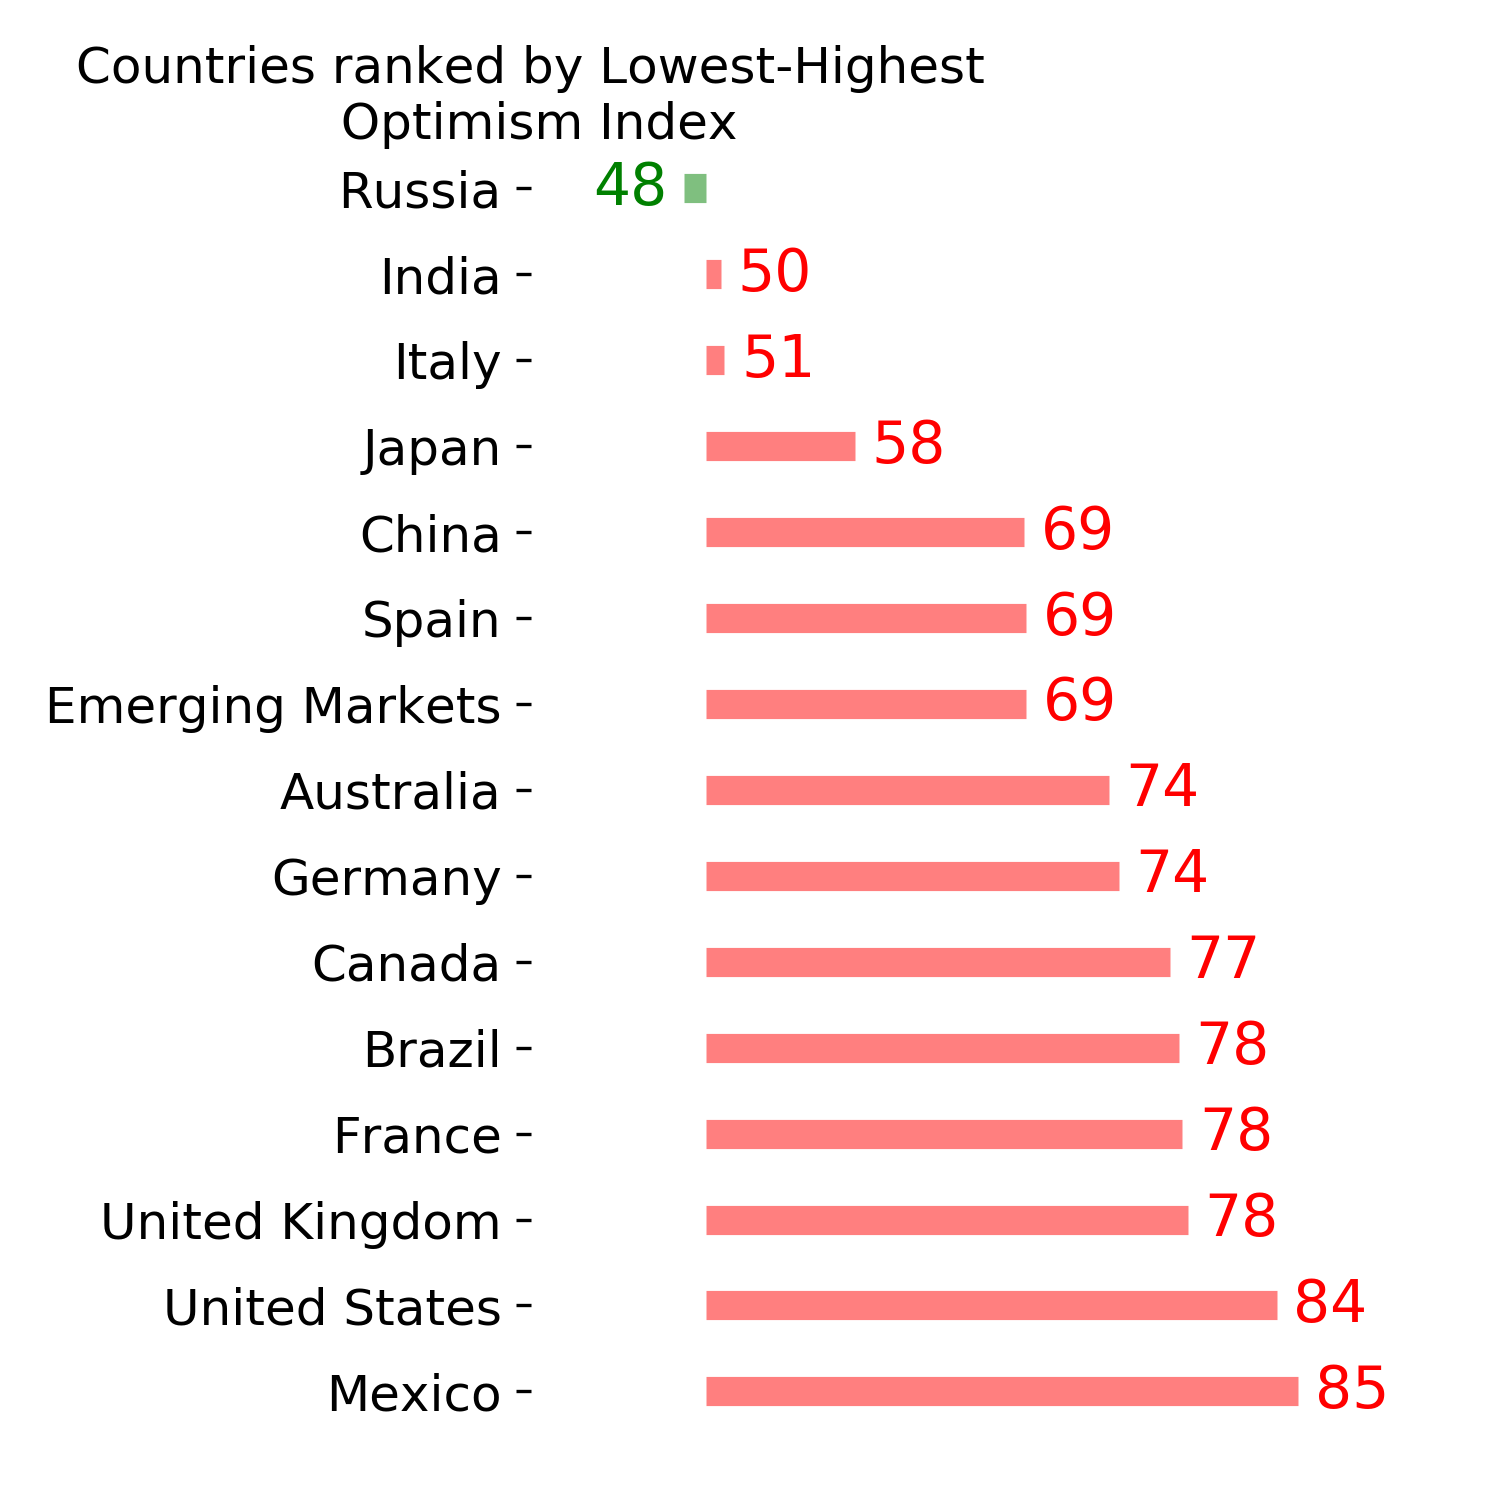
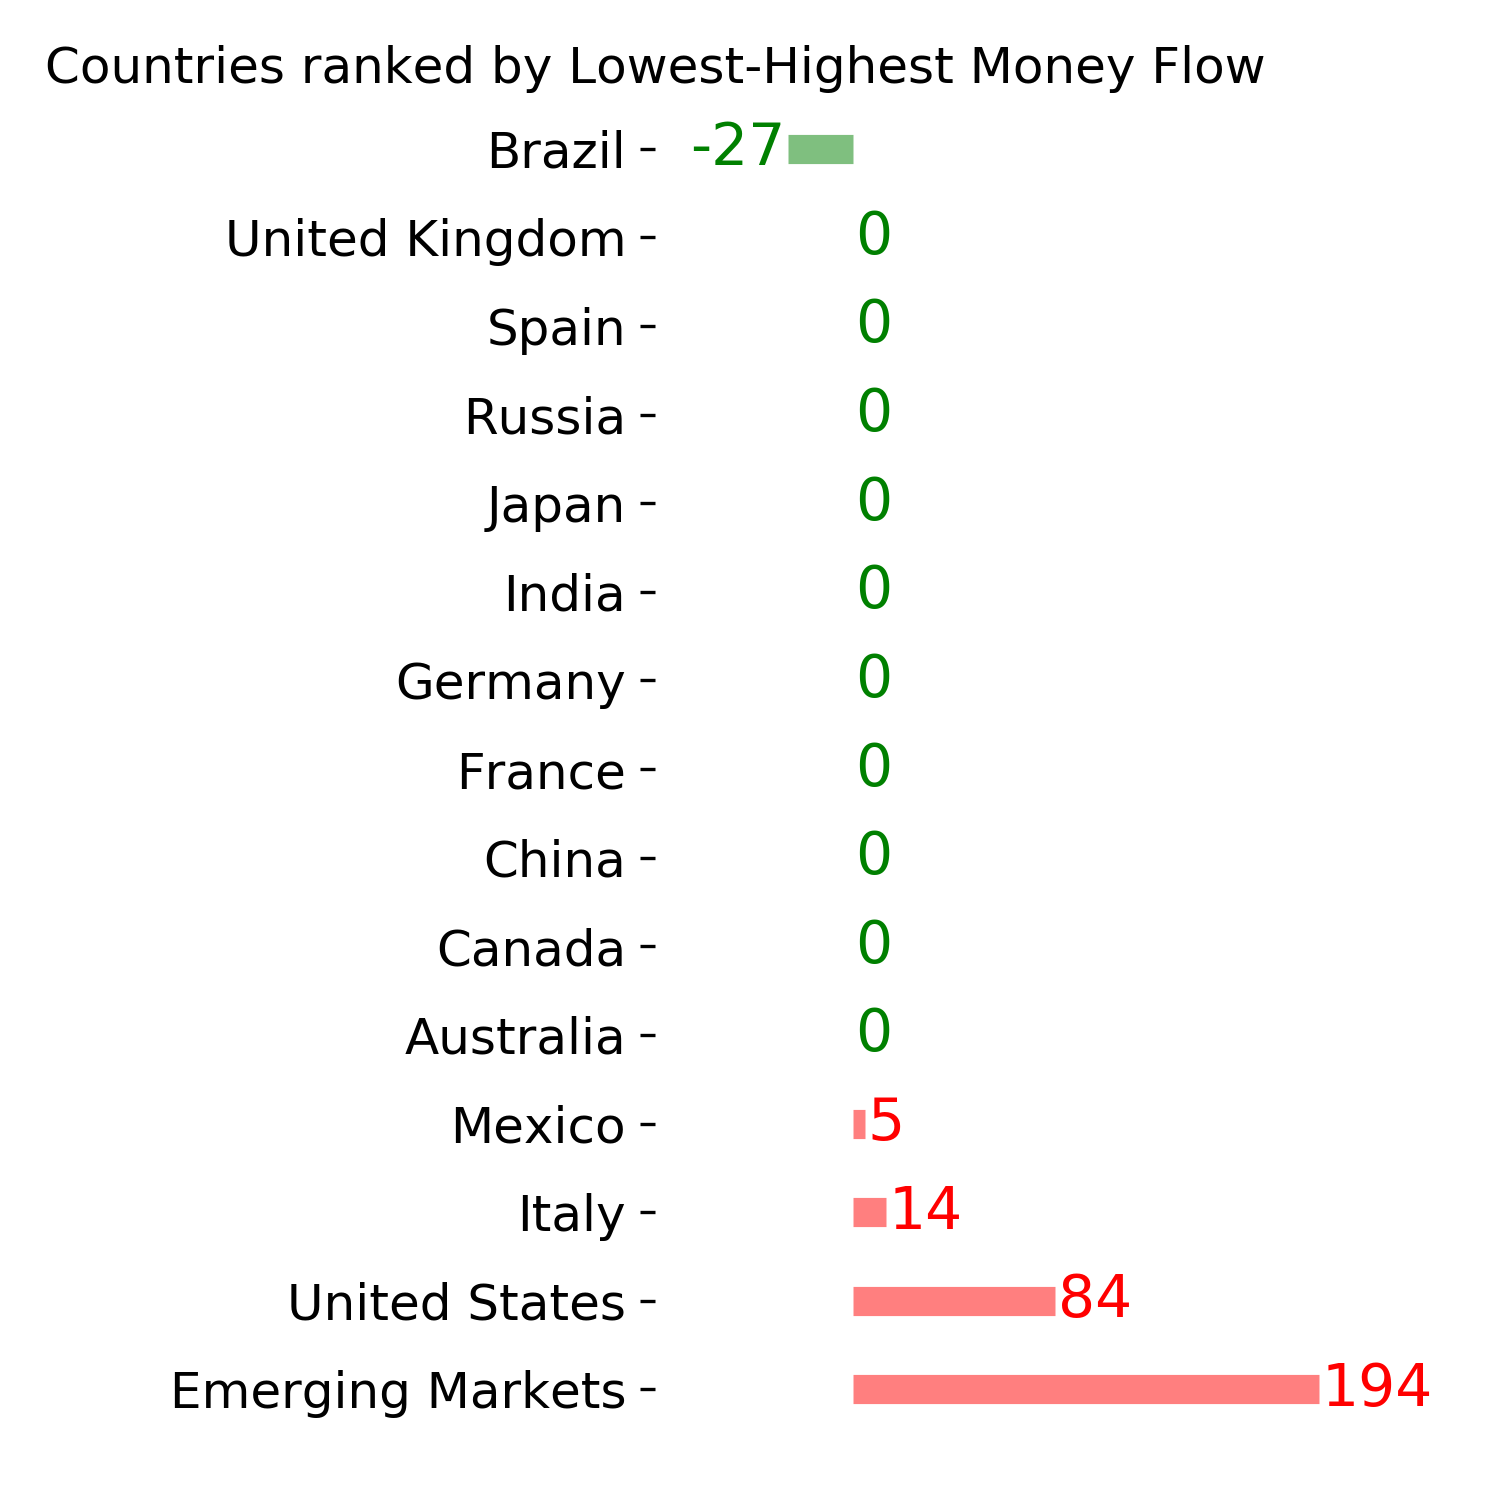
Country ETF's - 10-Day Moving Average
|
|
|
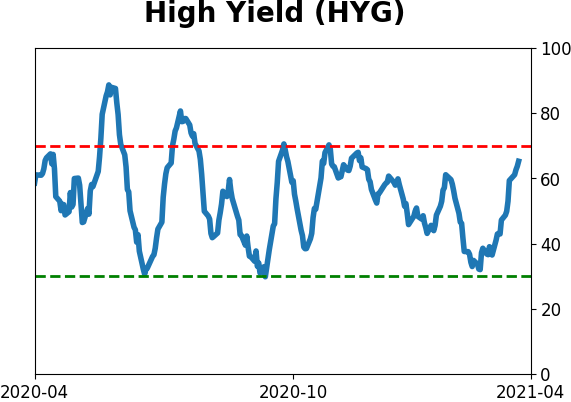
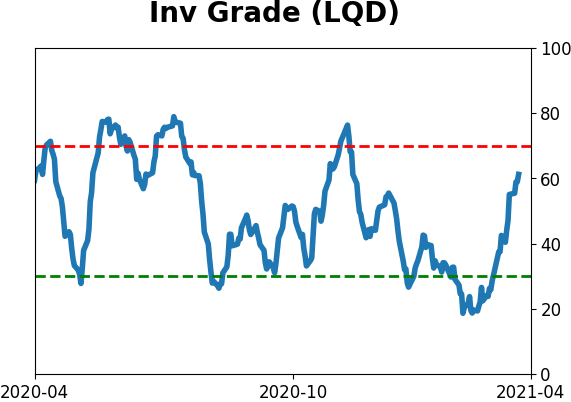
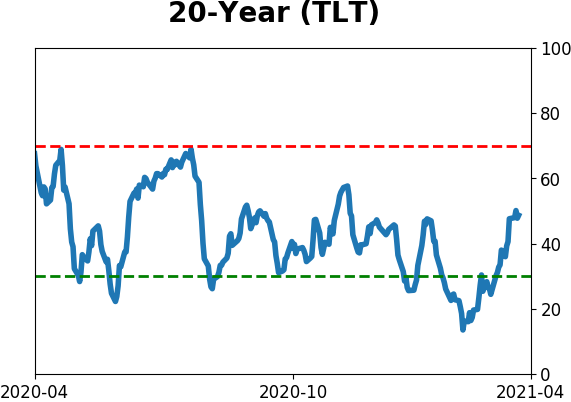
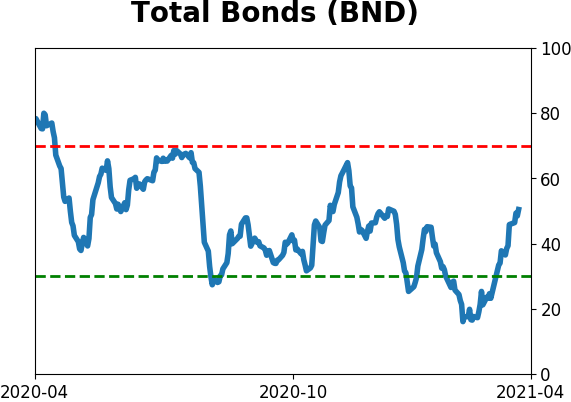
Bond ETF's - 10-Day Moving Average
|
|
|
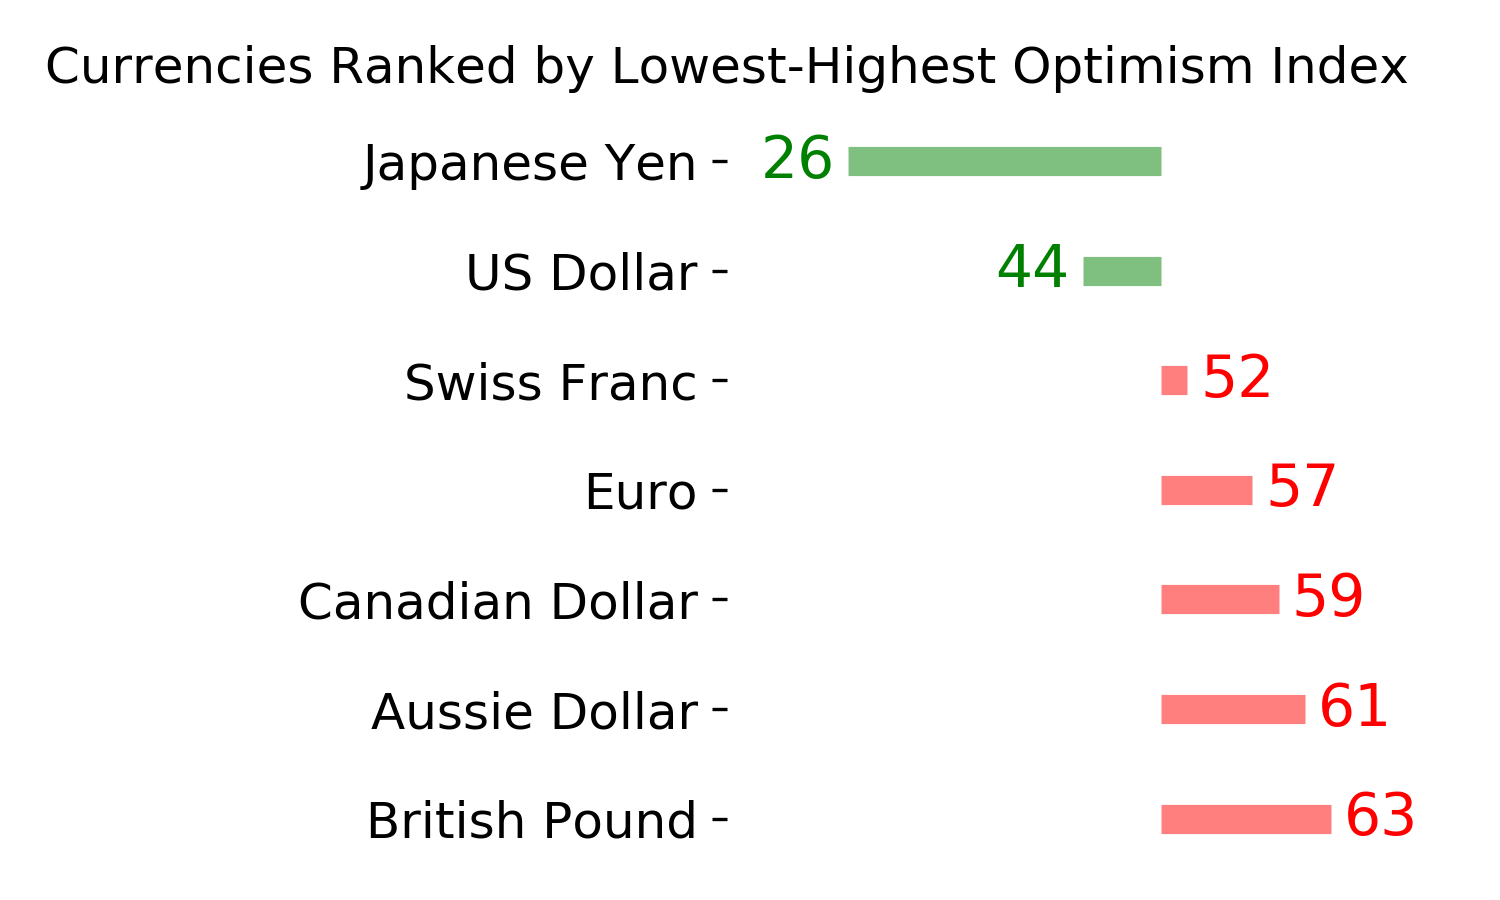
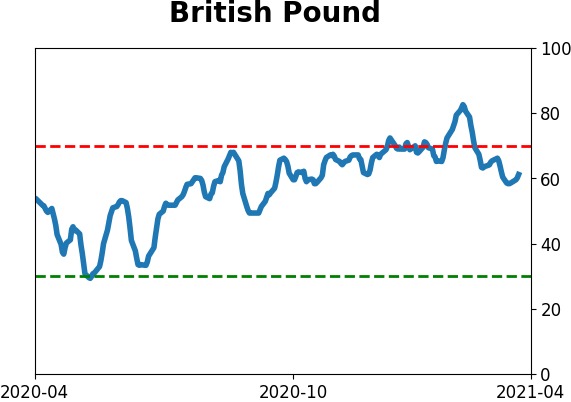
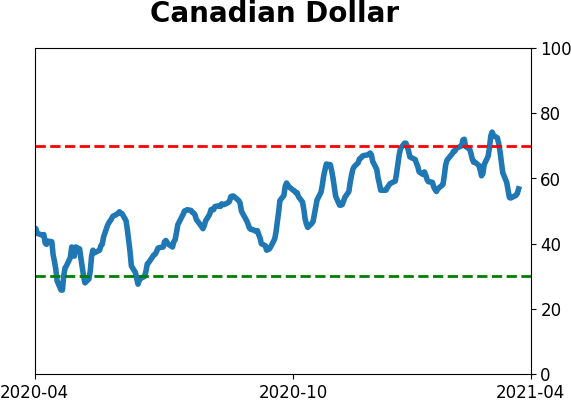
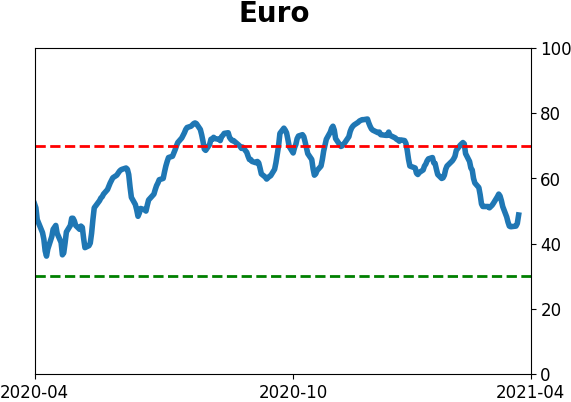
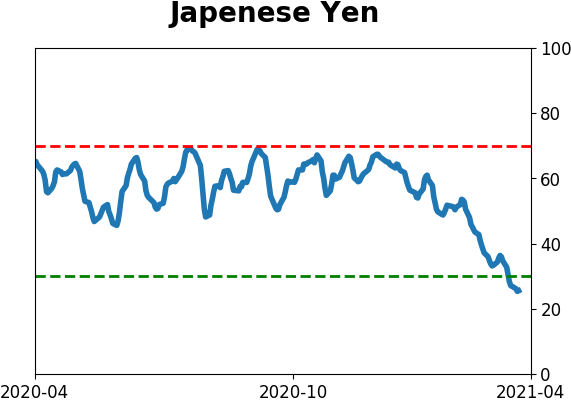
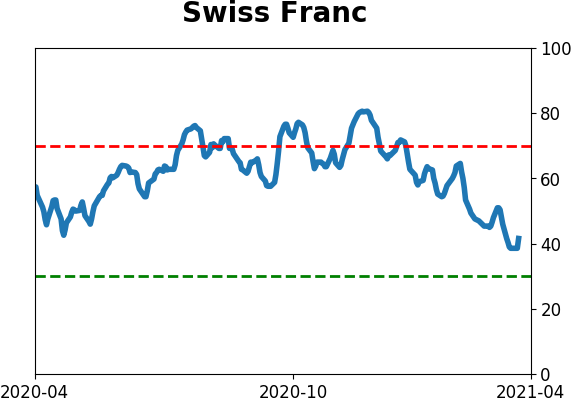
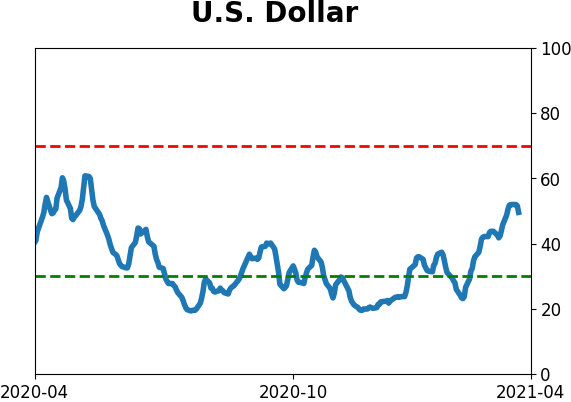
Currency ETF's - 5-Day Moving Average
|
|
|
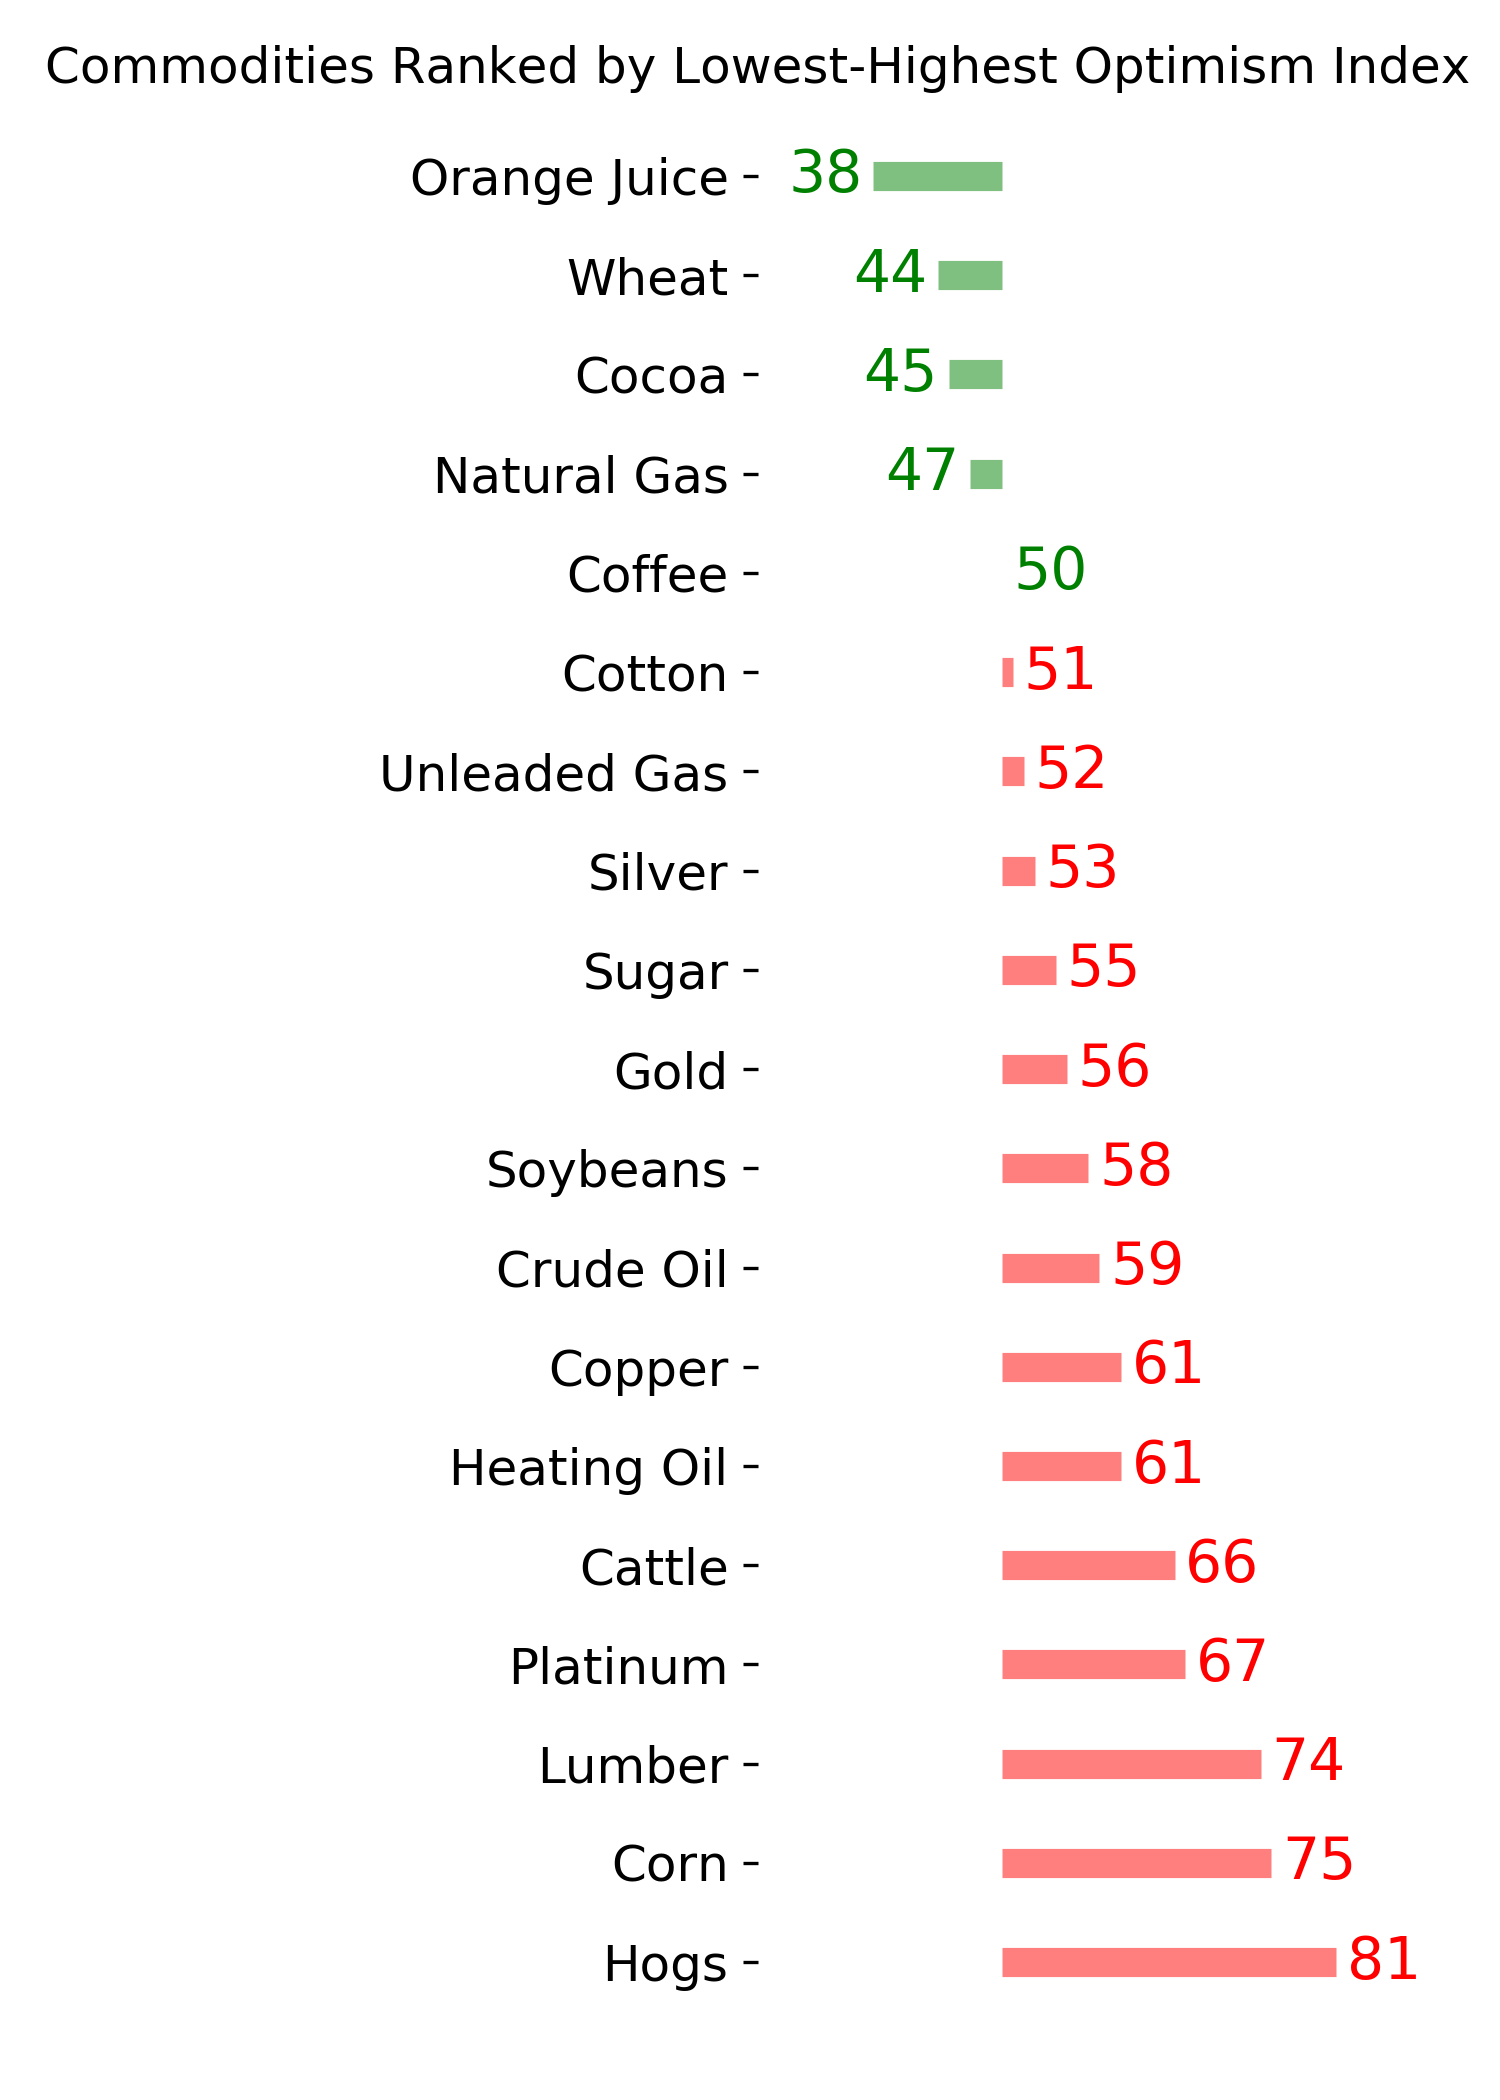
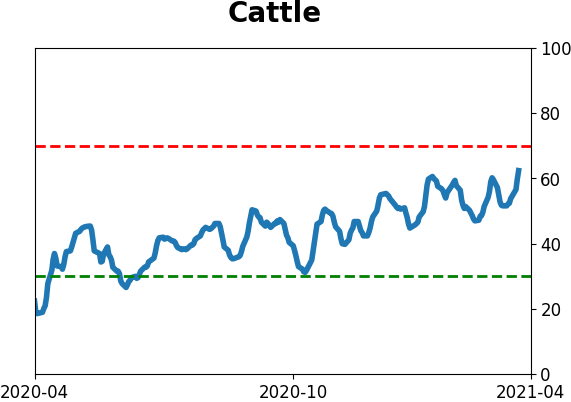
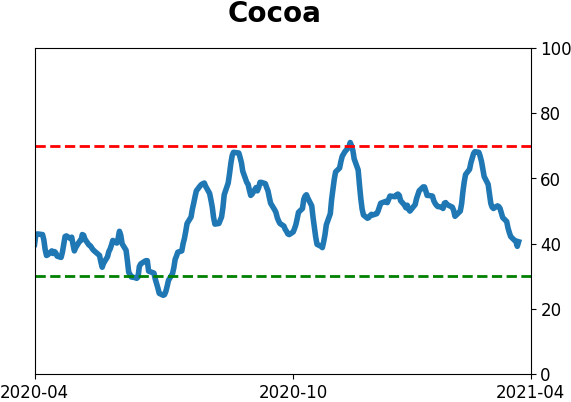
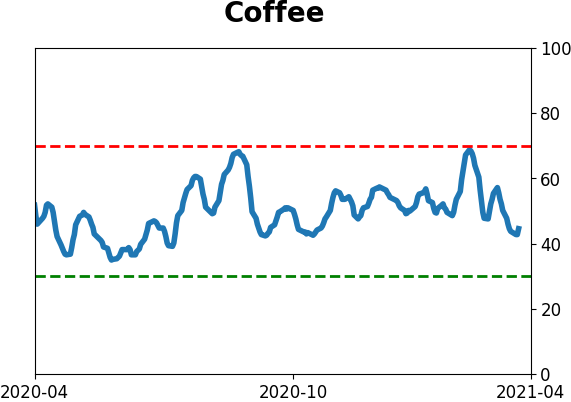
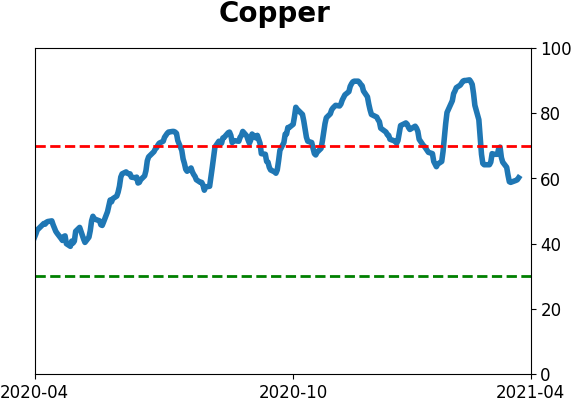
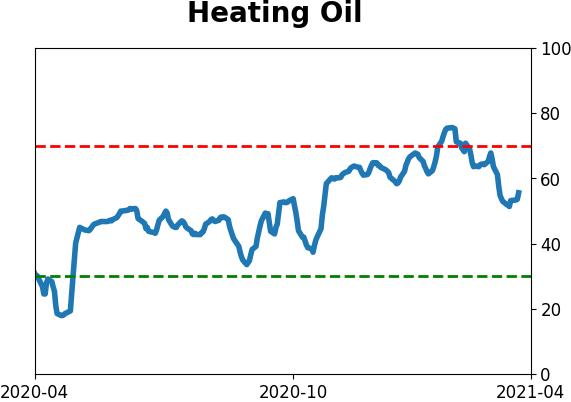
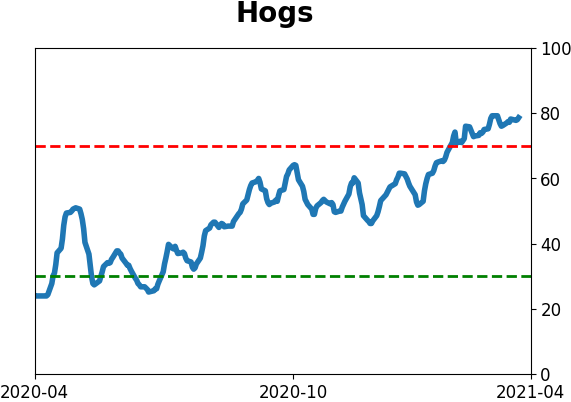
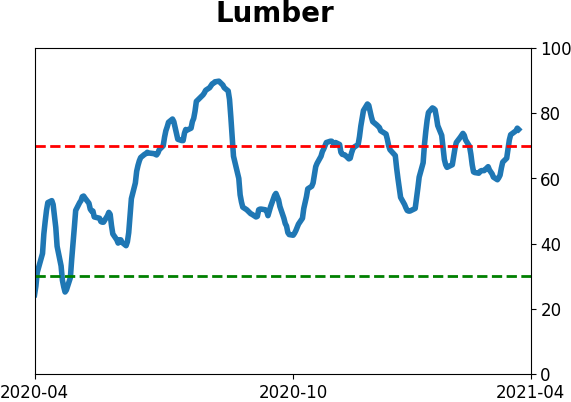
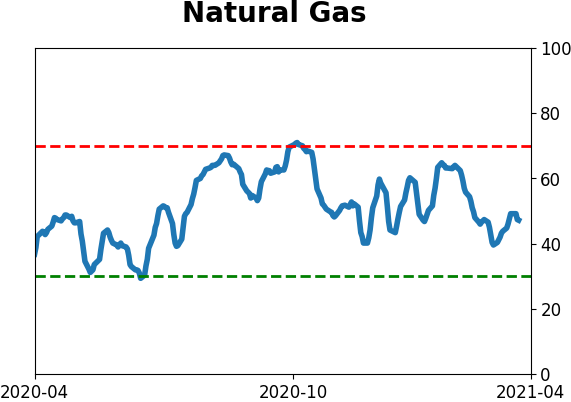
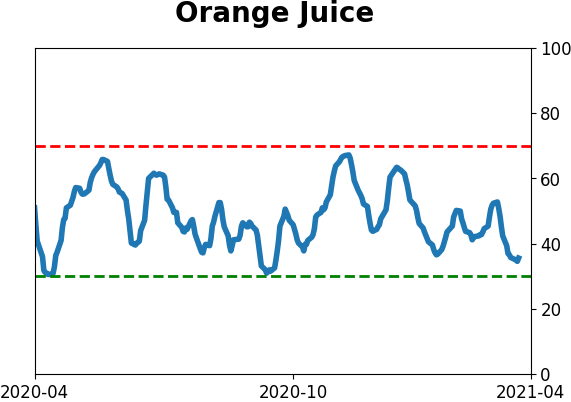
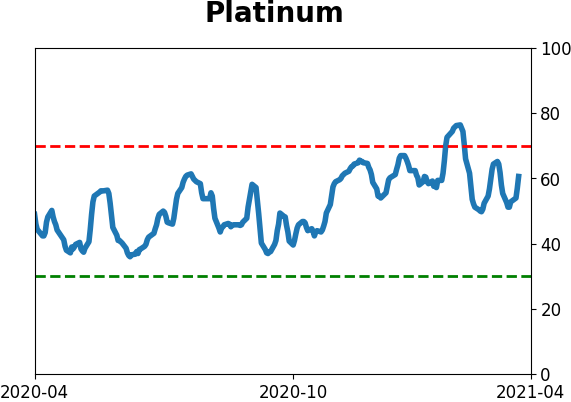
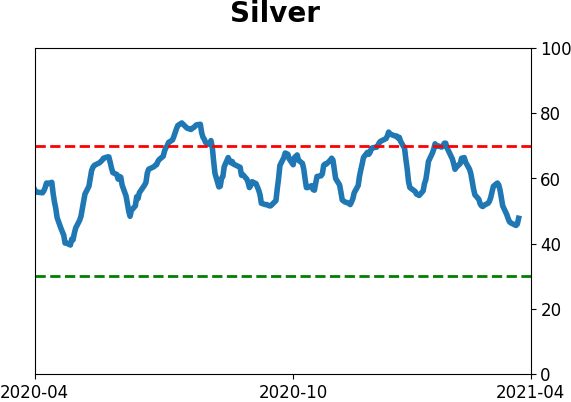
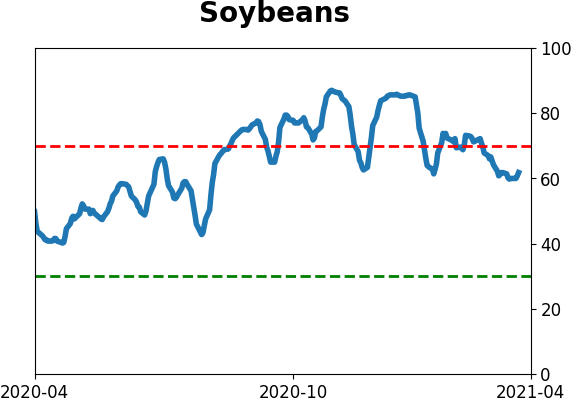
Commodity ETF's - 5-Day Moving Average
|
|