Headlines
|
|
Gold market recovering from March dislocations:
In March, the volatility triggered dislocations in the gold market. It led to a temporary bout of panic among options and futures traders, which that has quickly evaporated. ETF traders have been pulling out, but it's not enough to pull down the overall sense of optimism about the metal.
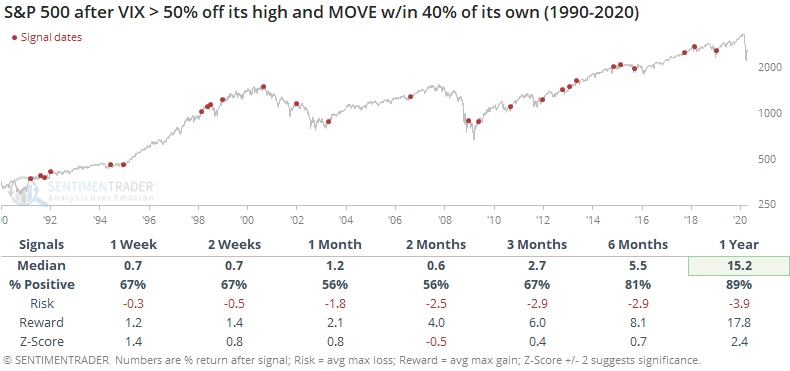
Bond volatility falls more than for stocks:
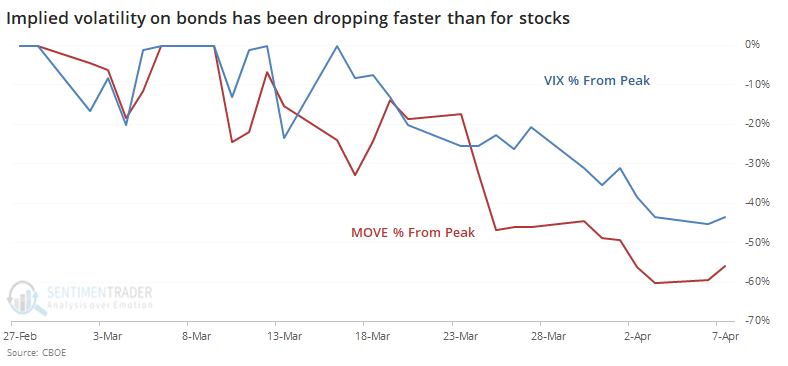
The VIX "fear gauge" has been stubborn, not falling much off its peak. But a similar measure for the bond market has fallen much more, which has typically been a good sign for stocks (less so for bonds).
More highs than lows: By March 16, we were seeing washout conditions across a wide variety of securities, with more than half of the NYSE sinking to a 52-week low. Now, for the first time in a month and a half, there are more 52-week highs than lows. The only times this net figure has gone from < -40% to above 0 within 30 days were 1980-04-28, 2015-09-17, and 2019-01-08. Stocks rallied at least 6% within the next two months each time.
Dazed and Confused: A quarterly study of E-Trade users showed a large jump in pessimism and recessionary mindset. Perhaps most telling is the question asking respondents which movie best describes how they currently feel. "Dazed and Confused" made up 31% of responses, from the prior reading of 17%. And "Singin' in the Rain" accounted for only 6%, down from 19%.
Bad news bears: Markets have a strong tendency to peak on good news and bottom on bad news. Any cursory stroll through newspaper archives can prove that. Bad news is overwhelming now, triggering ratings downgrades and dividend cuts. In a premium note, Troy shows that articles mentioning "dividend suspension" have surged to a record, exceeding prior highs from February 2009 and June 2010, both times when bad news was already being priced in by investors.
Big tech recovery: The Nasdaq 100 (NDX) pushed above its 200-day moving average after having been nearly 15% below it. This is its 2nd-quickest recovery from that much of a negative deviation in its history. Of the 11 times it recovered within 50 days of being so far below its average, the NDX mostly rallied over the next 1-2 months, fell in the month after that. A year later it was higher 9 of the 11 times by a median 24.7%.
|
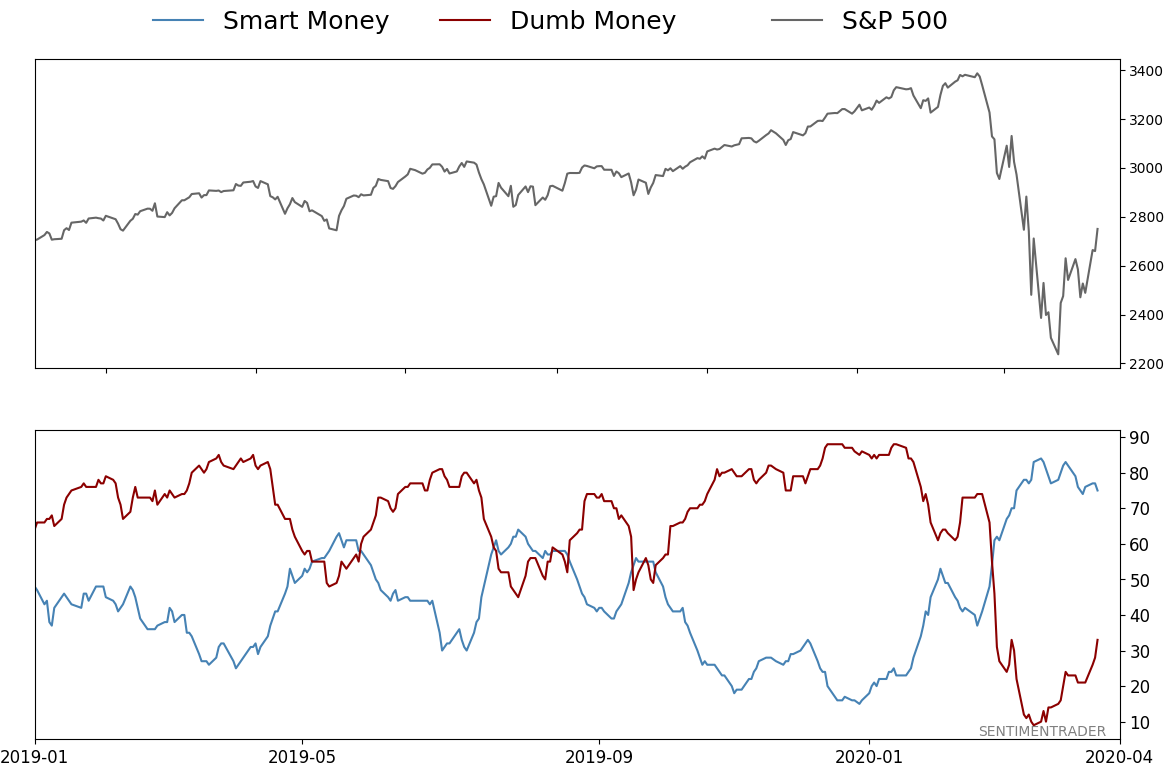
Smart / Dumb Money Confidence
|
Smart Money Confidence: 75%
Dumb Money Confidence: 33%
|
|
Risk Levels
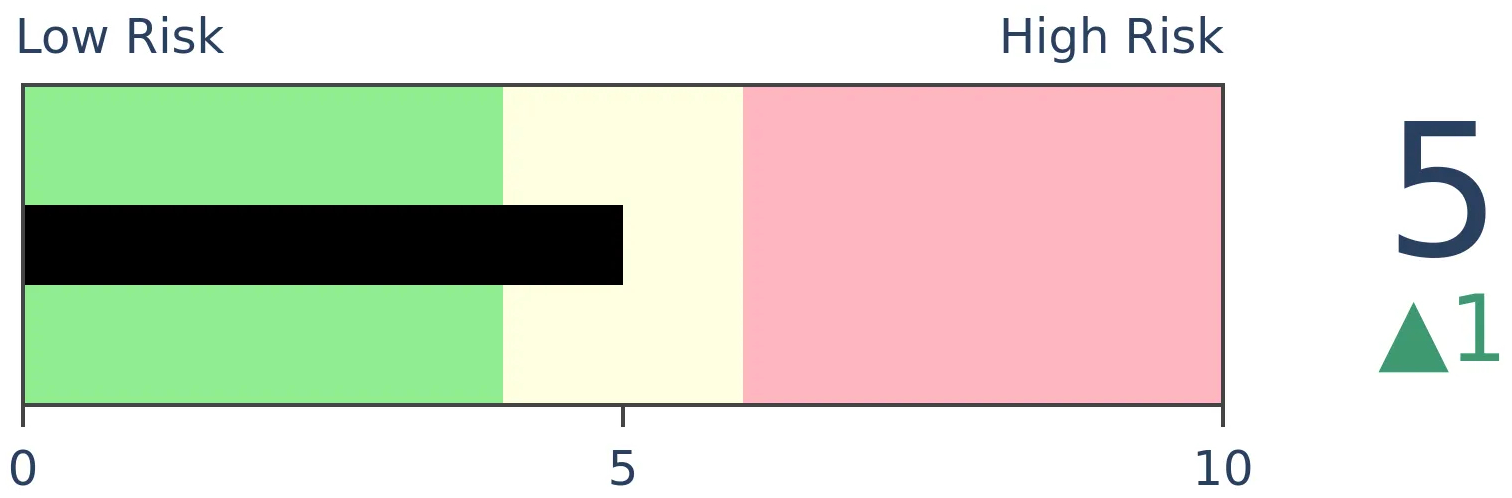
Stocks Short-Term
|
Stocks Medium-Term
|
|
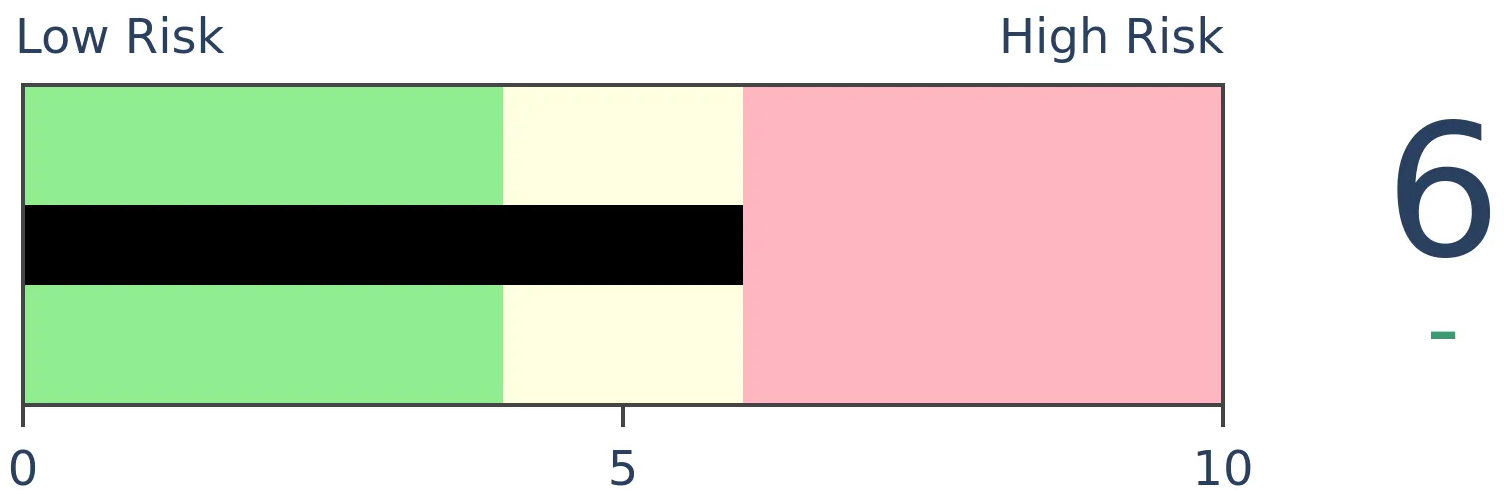
Bonds
|
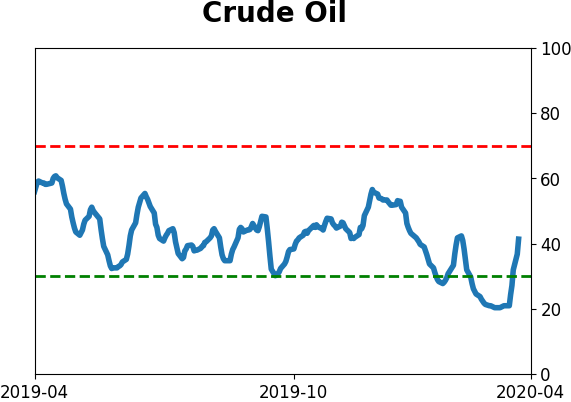
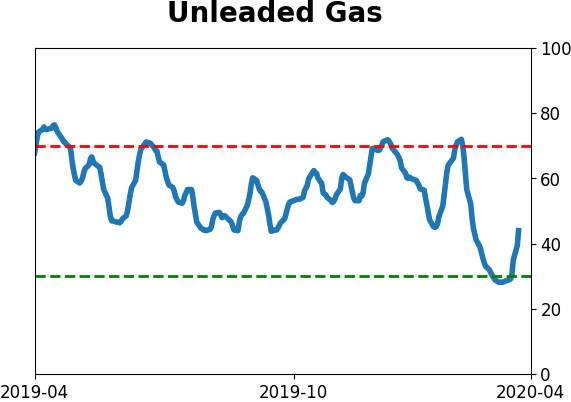
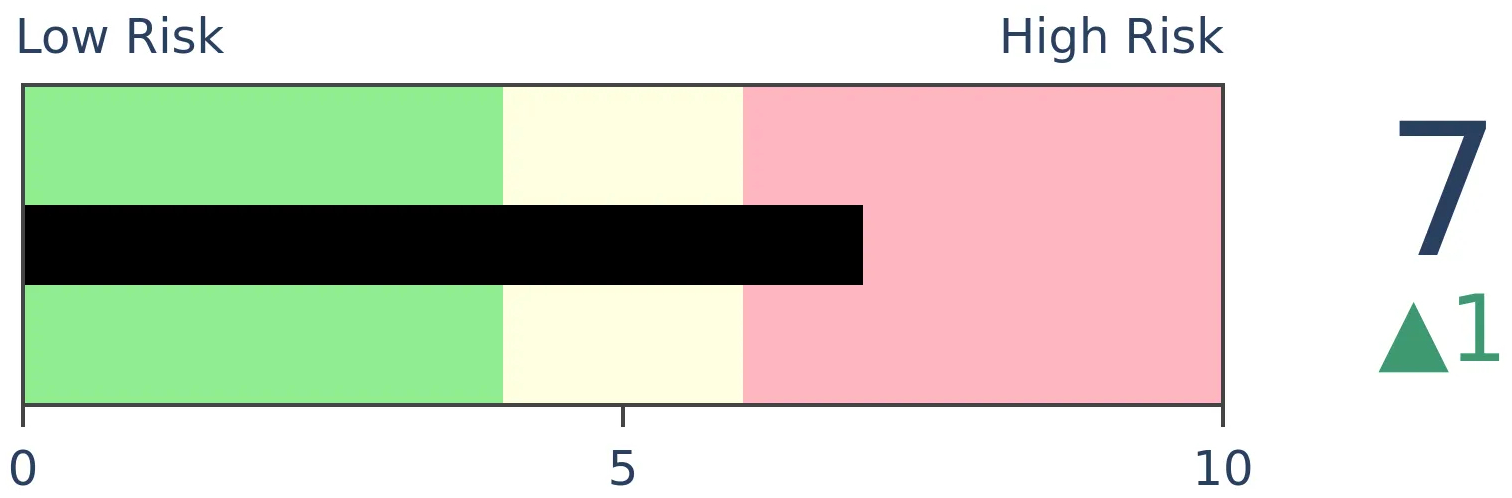
Crude Oil

|
|
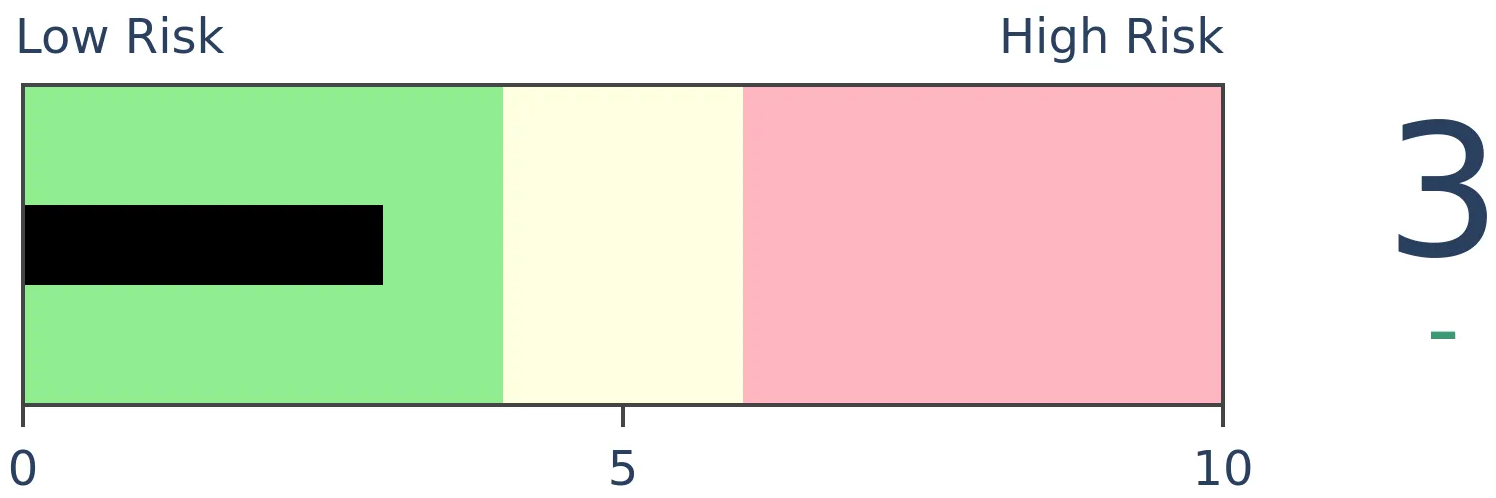
Gold
|
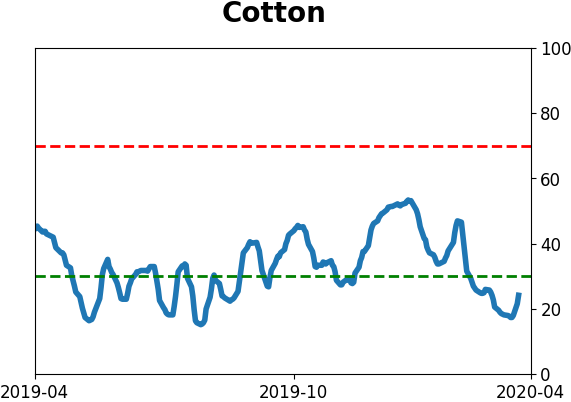
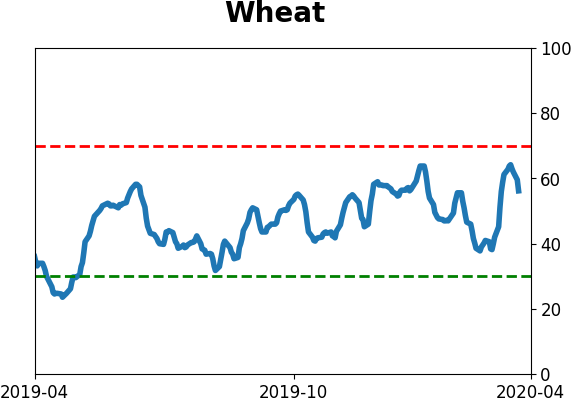
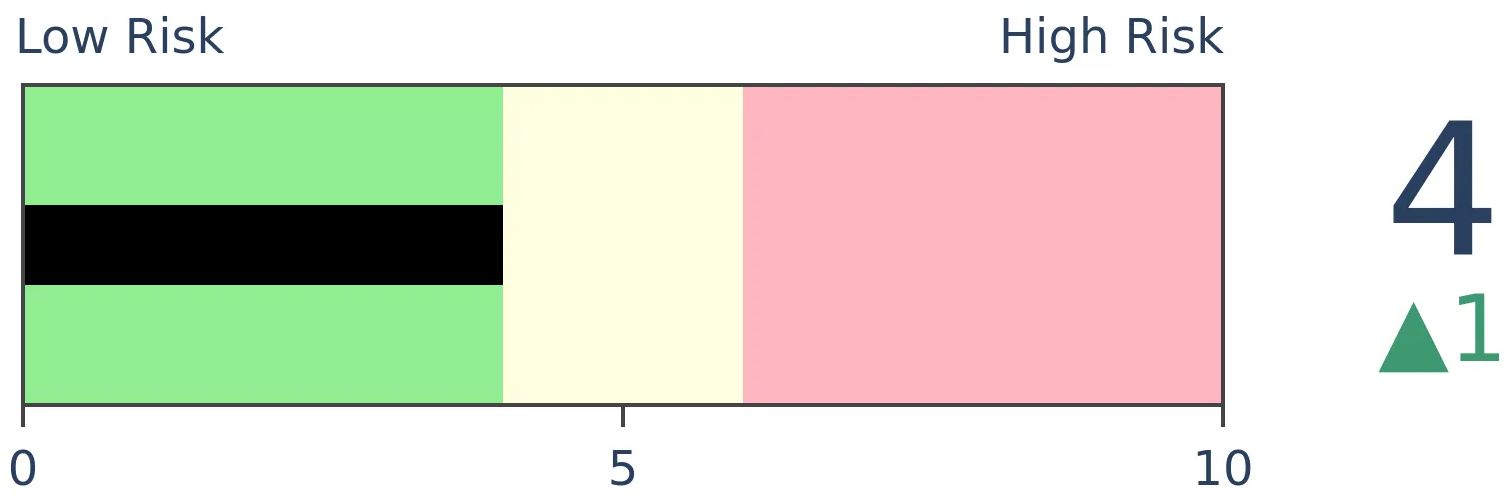
Agriculture
|
|
Research
BOTTOM LINE
In March, the volatility triggered dislocations in the gold market. It led to a temporary bout of panic among options and futures traders, which that has quickly evaporated. ETF traders have been pulling out, but it's not enough to pull down the overall sense of optimism about the metal.
FORECAST / TIMEFRAME
None
|
There have been some odd, extreme moves in stocks over the past few weeks. And bonds, and currencies, and commodities. The forced selling in mid- to late-March triggered a lot of unusual trading activity and a breakdown in correlations.
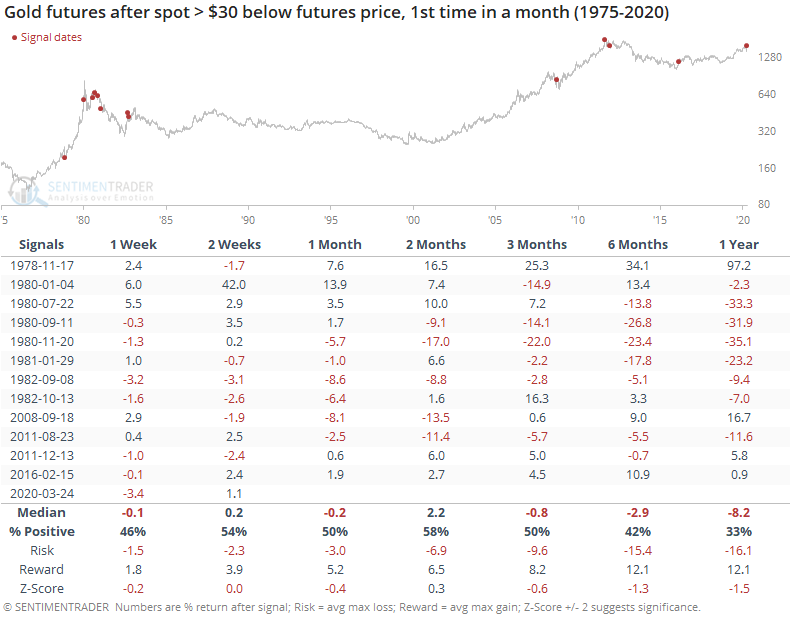
One of those correlations is that during times of duress in other markets, especially stocks, gold is supposed to be a safe haven. Yet it sold off along with stocks before recovering lately. That forced selling caused the spot price of gold to fall far below what futures traders were willing to pay.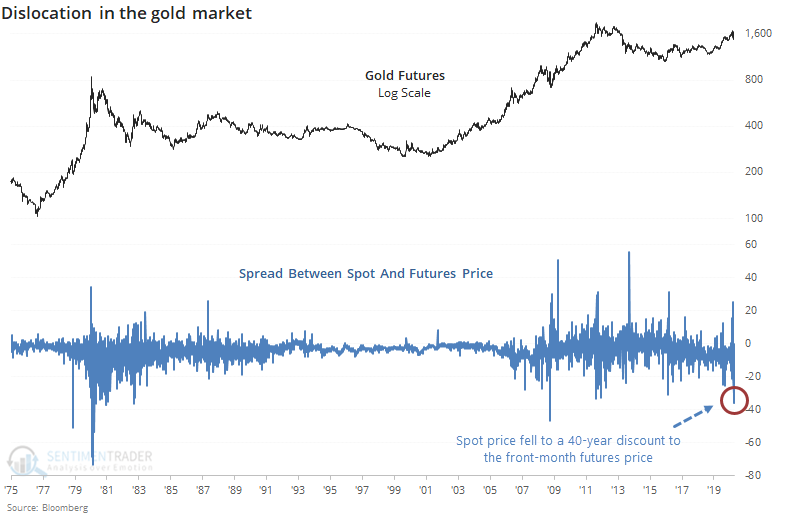
This has been alleviated in recent days, and while it typically happened near peaks in gold, it was not consistent.
More recently, traders have been putting a higher price on near-term gold futures than the contract that goes out six months. This has been highly unusual over the past 40 years.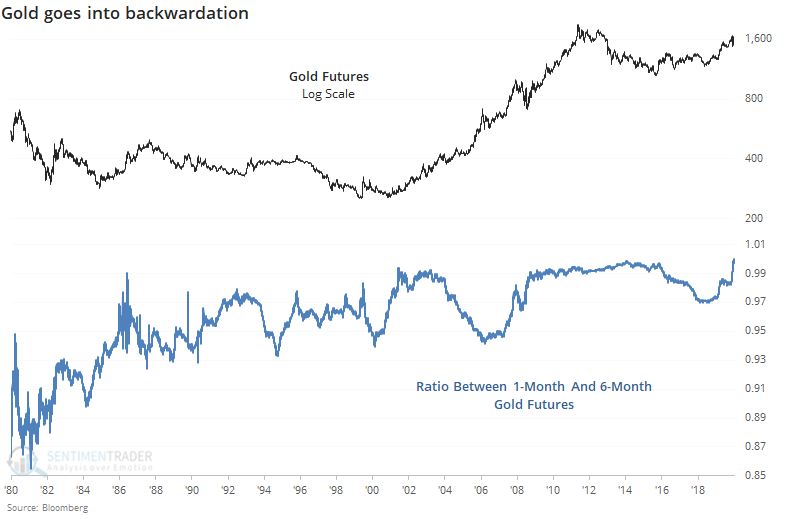
Looking at more recent years, it has been a mixed sign. While it was the case during the late run-up in 2009-12, it persisted while gold melted down after that peak. Very generally, a term structure like this would be considered a positive sign going forward.
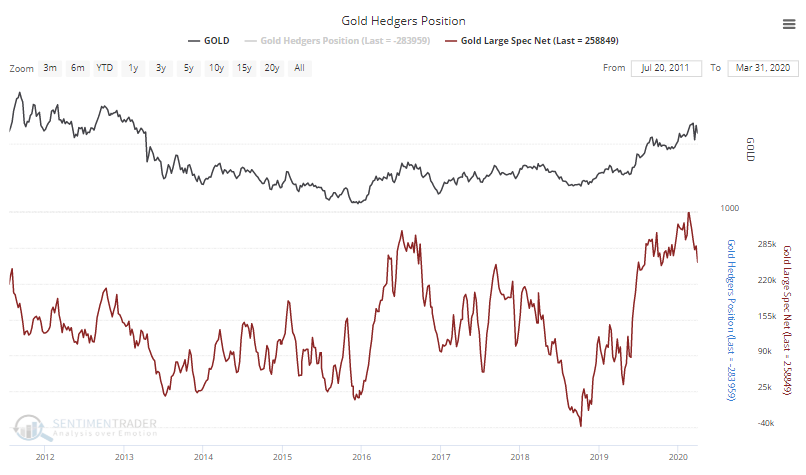
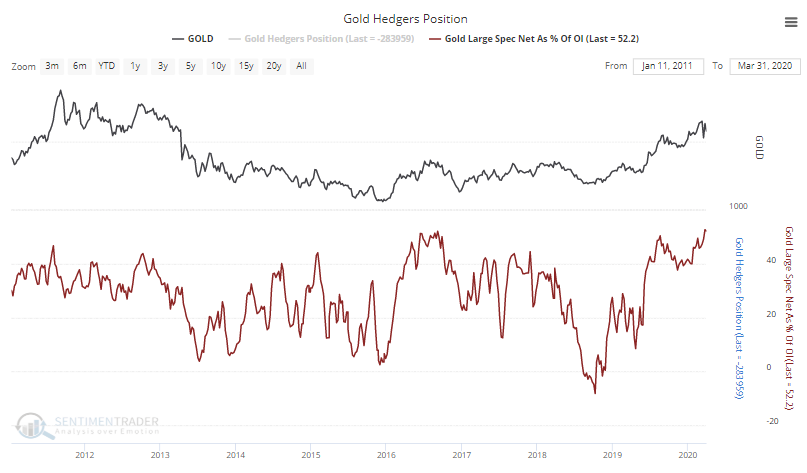
Large speculators have been scrambling to sell gold futures in recent weeks as the contract suffered volatility.
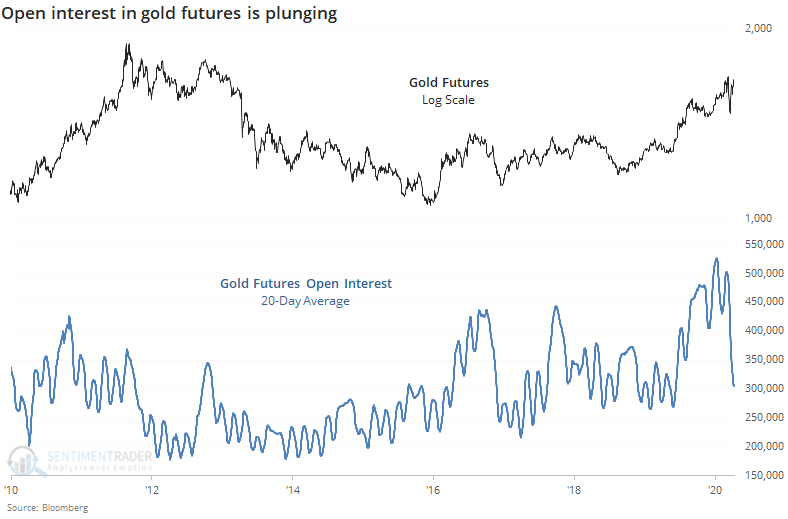
Even though speculators have sold some of their their long positions, overall open interest in gold futures is plunging. Low open interest is usually a sign of apathy and good for future returns, but it's coming off a record high, so a mixed picture there.
That means their net position as a percentage of open interest has continued to climb as is now at a record high. This is not good.
The confusion in the spot and futures markets caused traders to sell some of the oldest closed-end funds like ASA and CEF. During the tumult, they dropped to discounts of more than 12% from their net asset values (on average between them). The funds have spent about 15% of their time with a discount lower than -10% or higher than +2%.
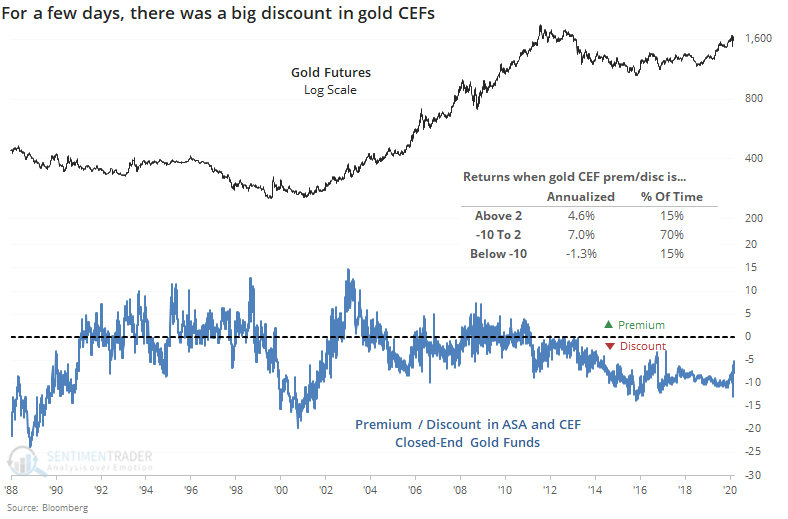
Big discounts weren't necessarily a sign of a bargain in gold (and big premiums not a consistent sign of excessive optimism) but very roughly, times when the CEF discounts were at their greatest, gold did well going forward over the past 25 years. It wasn't a help in the early 1990s.
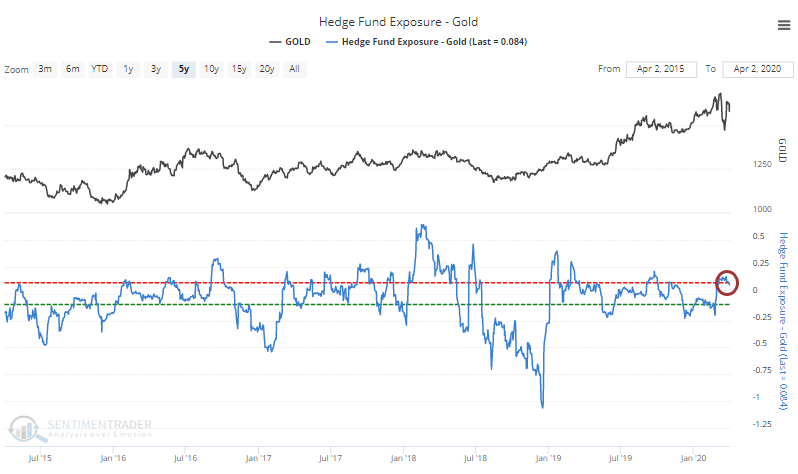
A rough estimate of hedge funds' exposure to gold has remained relatively high in recent weeks. It's not high enough to consider it a negative, but it's not a positive either. The best risk/reward points for the metal typically occurred when exposure was heavily negative.
During the worst of the volatility, options traders in gold futures were scrambling for protection, and paying up for it. The skew between puts and calls had spiked, though that has since relaxed. It's usually been a good sign when fear like that was prevalent.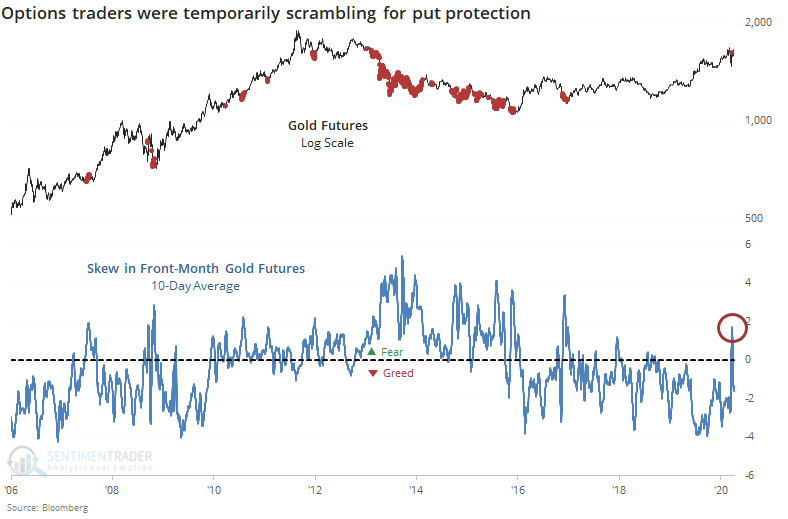
The go-to fund for ETF traders in gold is usually GLD, though that fund's dominance is being tested. The open interest in puts versus calls in that fund is about average based on its range over the past decade. When there have been relatively fewer calls open relative to puts, it's been a better sign.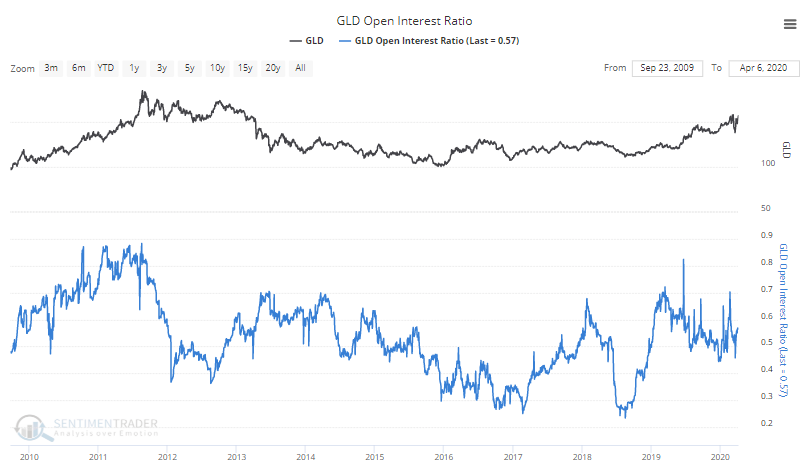
The fund has seen a big inflow in recent weeks. That could be due to the fund created units to meet demand from short-sellers, but fund flows in GLD seems more "natural" than some others, simply meaning we usually see inflows when GLD rises and outflows when it falls. There is a modest contrary nature to the flows, which would be a minor negative here given the recent surge in inflows.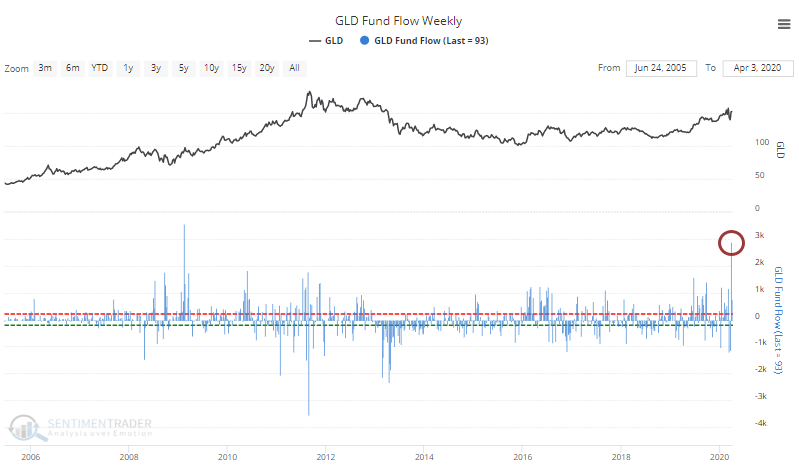
The big inflow means that the number of ounces held by the fund has hit a multi-year high. It still remains off the highest level from earlier in the decade, though.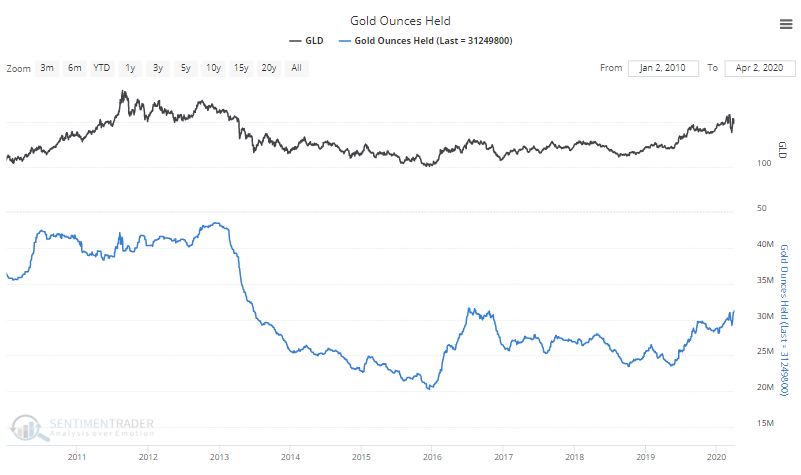
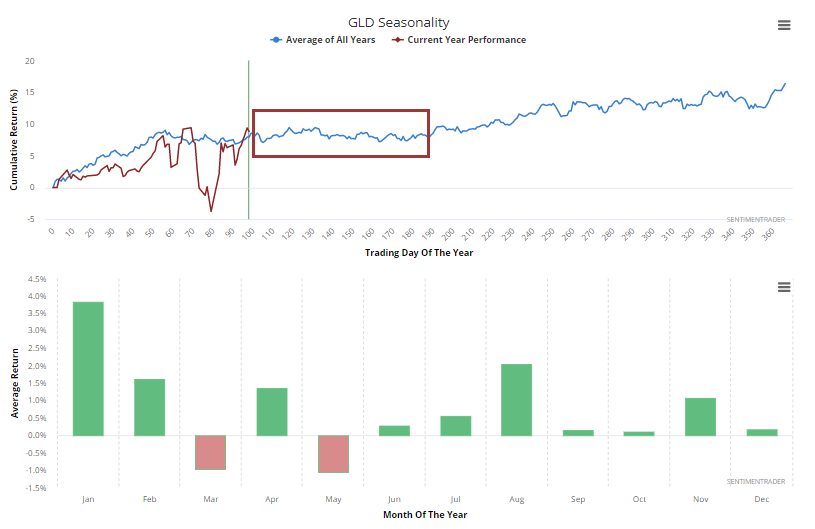
GLD has mostly followed its seasonal pattern, which turns a little rockier over the next few months.
For the miners, they got the worst of the confusion in gold along with the plunge in stocks. That caused outstanding shares in funds like GDX to decline as the fund traded at a record discount to its net asset value.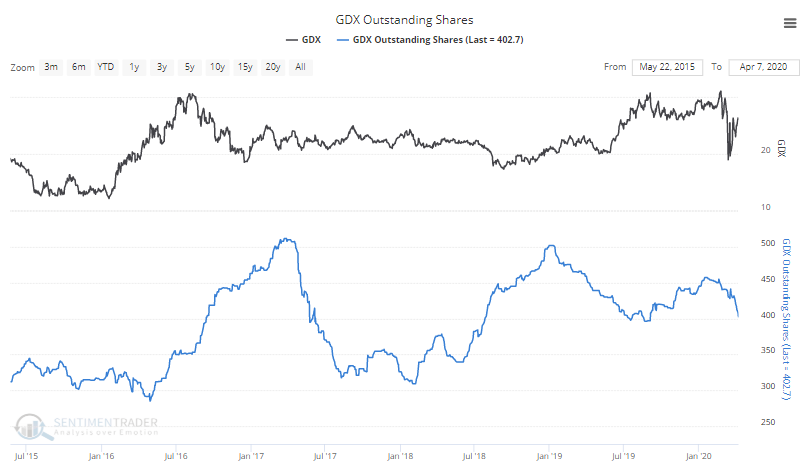
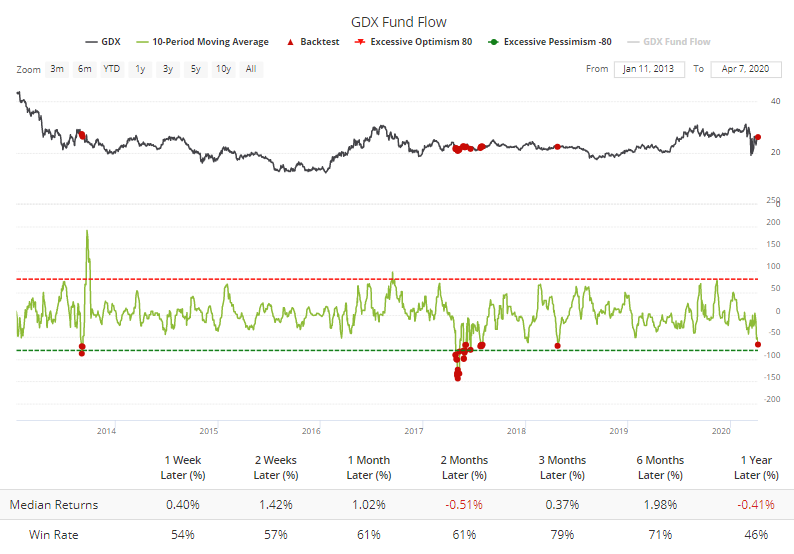
The drop in shares meant a net outflow, and over the past 10 days the fund has leaded an average of more than $65 million in assets per day. According to the Backtest Engine, this has been a mild positive the few other times it got this bad, but it's not a strong indicator.
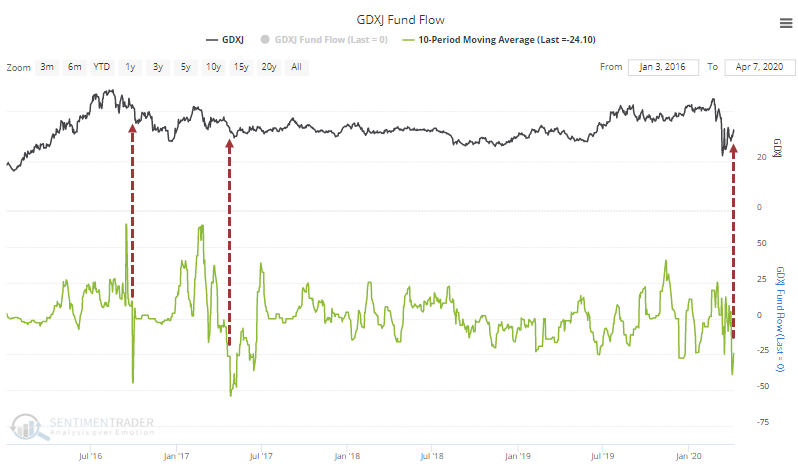
The junior gold miners tend to be more volatile, and the fund flows reflect that. The GDXJ fund has also seen a big outflow, but again it's hard to read much into this.
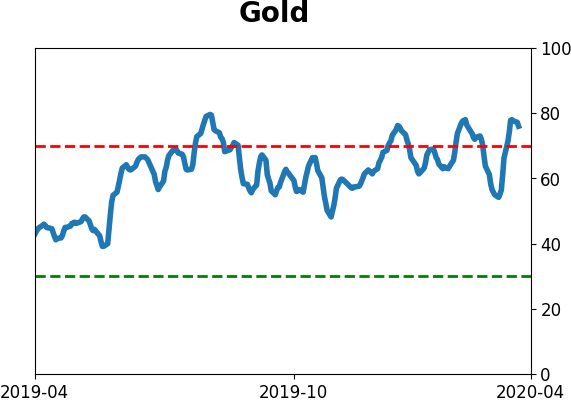
For gold itself, the overall Optimism Index, which incorporates many of these measures, recently hit 78%, after which it has been tough for gold to maintain upside momentum in recent years.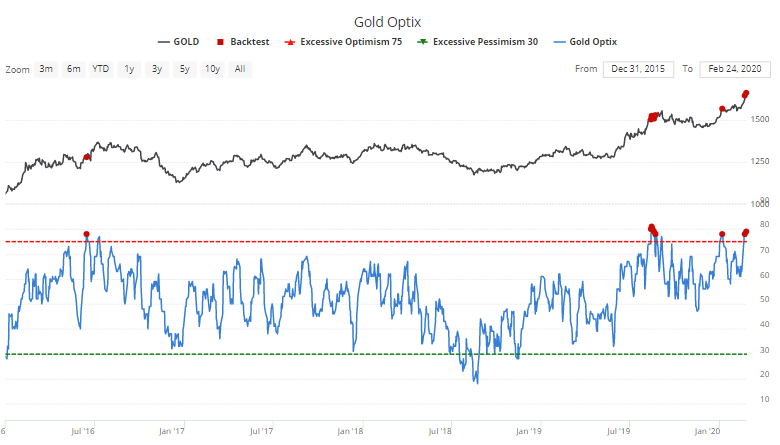
Since the most optimism is usually seen during bull markets, some of the highest readings occurred in the mid-2000s, so future returns weren't terrible...they weren't great, either. Essentially flat over the next few months according to the Backtest Engine.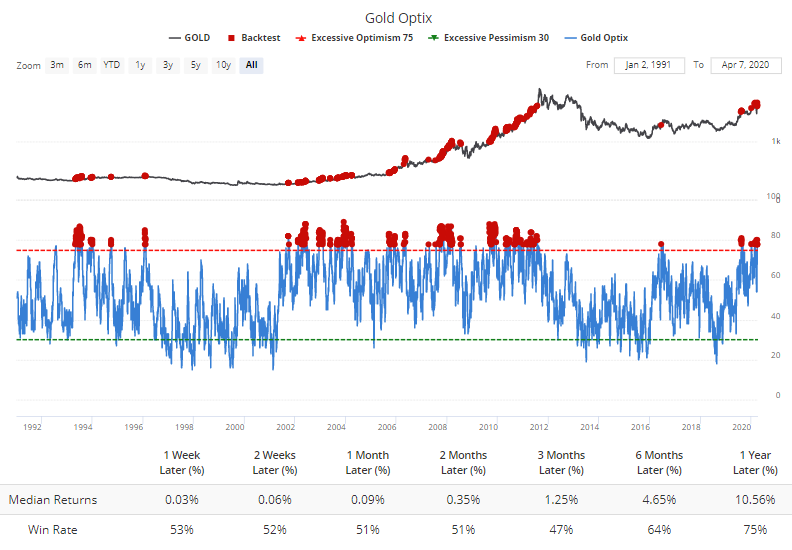
The most comprehensive of these metrics is the Optimism Index, and it's still at a high level, which has preceded flat returns over the short- to medium-term, even during the roaring 2000s bull market. That's the biggest knock against the metal right now. The dislocation in March temporarily triggered some near-panic readings, but those have quickly evaporated, and didn't usually give strong signals anyway. The surge of ETF flows and massive long position by speculators are other worries.
Overall, there isn't much of anything to suggest an edge for long positions, and if anything it would tilt to the negative side. The biggest factor is what investors feel will happen with growth and inflation once we get through the pandemic, and that has the potential to swamp any other technical, fundamental, or behavioral factors. So far, there isn't a strong sign that the metal is immune to these factors (it still hasn't been able to rally strongly in the face of excessive optimism), but it's something to watch for in the coming weeks.
BOTTOM LINE
The VIX "fear gauge" has been stubborn, not falling much off its peak. But a similar measure for the bond market has fallen much more, which has typically been a good sign for stocks (less so for bonds).
FORECAST / TIMEFRAME
SPY -- Up, Long-Term
|
Last week, we saw the unusual situation with implied volatility in the Nasdaq 100 (VXN) falling below that of the S&P 500 (VIX). Per Bloomberg via the fine folks at Leuthold, volatility in bonds (MOVE) has been dropping faster than the VIX, too.
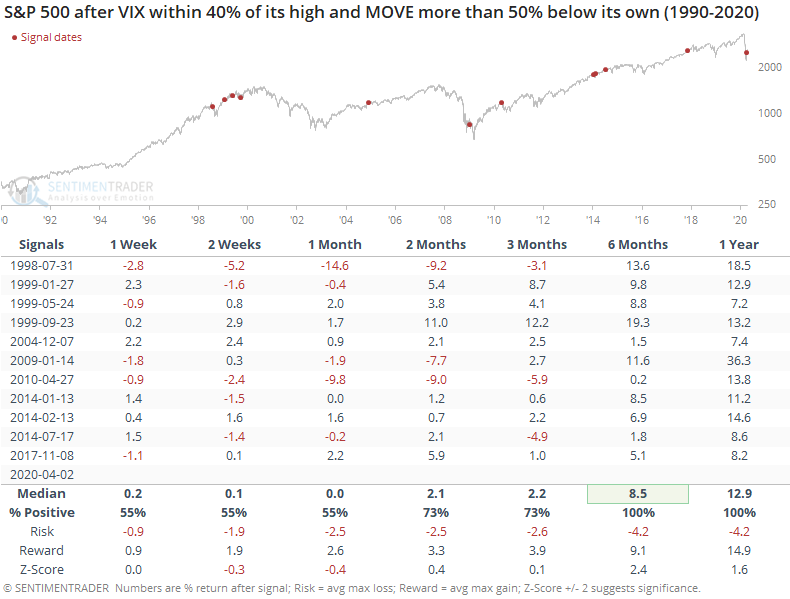
When we've seen MOVE drop further off its high than the VIX, it has preceded mostly good returns for stocks. Over the next 6-12 months, the S&P was never lower.
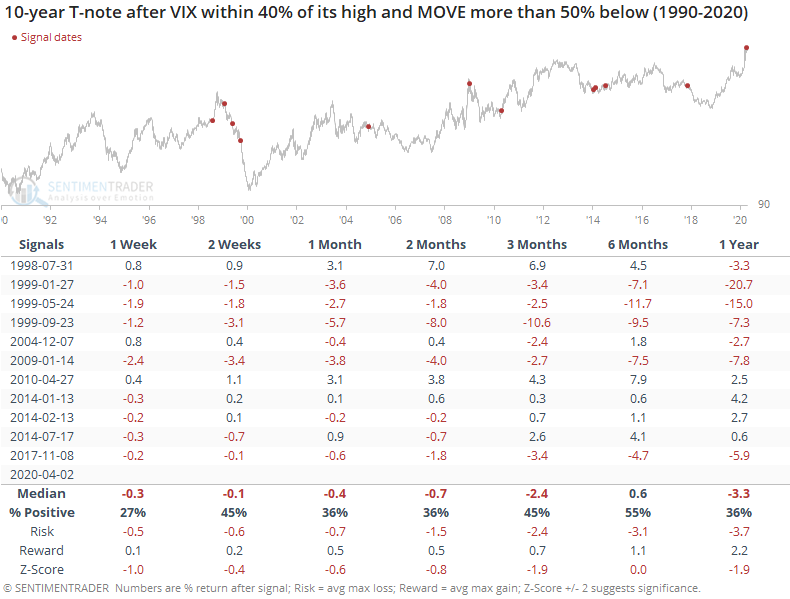
For 10-year Treasury note futures, it wasn't such a good sign.
When an indicator or study is robust, not only do we see strong returns when the conditions are met, we also usually see strong returns in the opposite direction when the inverse of the conditions are met. That's not always the case, but it's a good test to see if what we're looking at tends to work in both directions, and lends a little more confidence to the results.
If we look at the opposite conditions from the above, when the VIX fell much more than MOVE, then we should see more negative returns. That wasn't really the case, which dampens the conclusion somewhat.
A persistently high VIX is not necessarily a good thing. Bulls should want to see traders becoming more and more comfortable with the idea of a rally, causing the VIX to fall. About the only good sign when it comes to the VIX is that implied volatility in other parts of markets are falling more, and that has usually been a good thing.
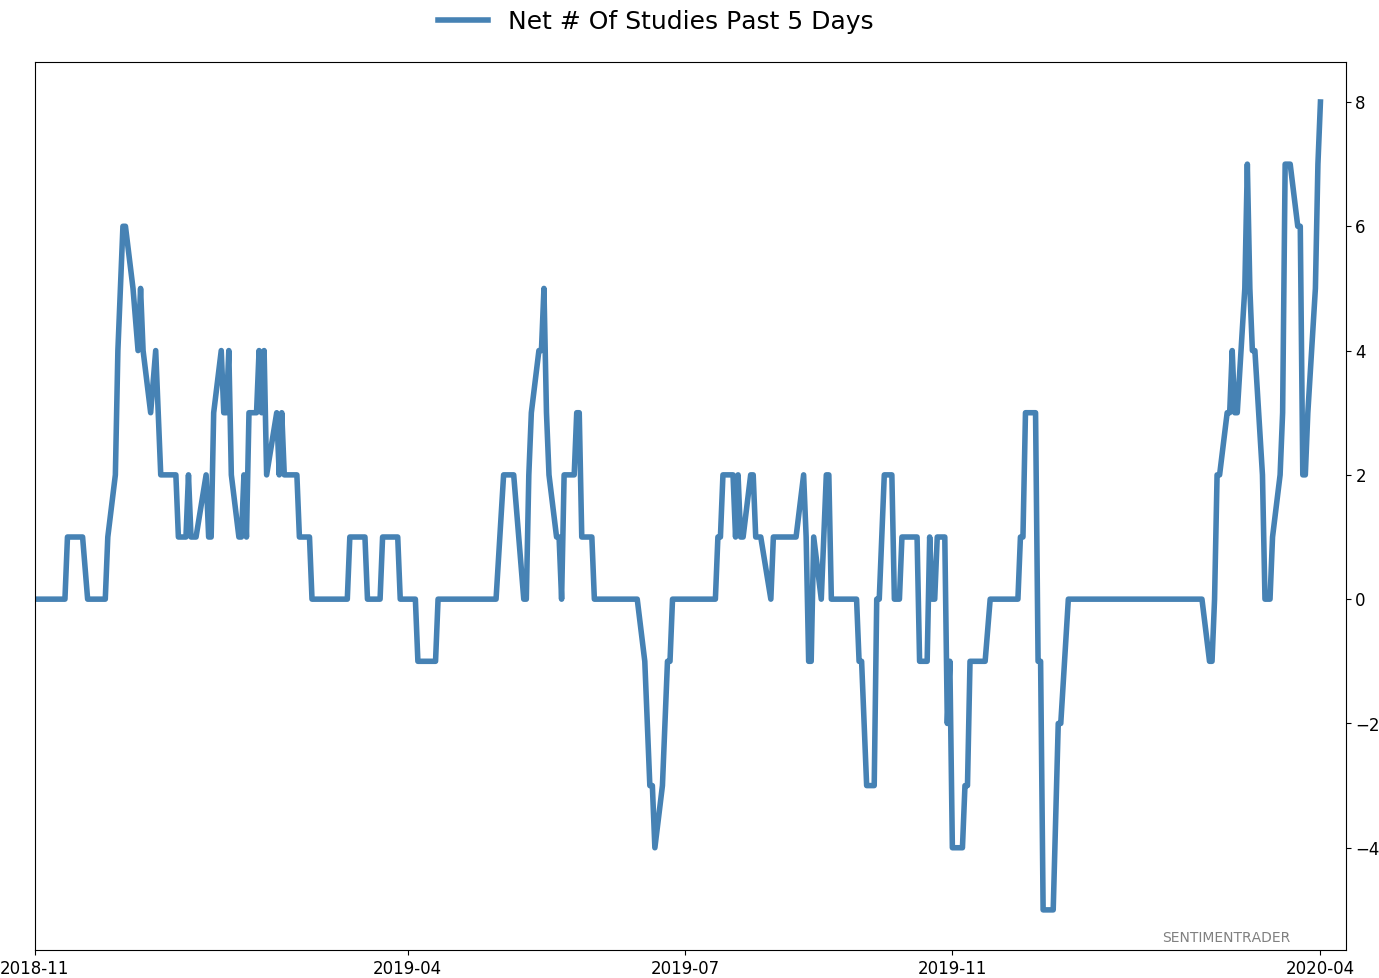
Active Studies
| Time Frame | Bullish | Bearish | | Short-Term | 0 | 0 | | Medium-Term | 11 | 0 | | Long-Term | 28 | 3 |
|
Indicators at Extremes
Portfolio
| Position | Weight % | Added / Reduced | Date | | Stocks | 73.2 | Added 31.3% | 2020-03-17 | | Bonds | 0.0 | Reduced 6.7% | 2020-02-28 | | Commodities | 5.5 | Added 2.4%
| 2020-02-28 | | Precious Metals | 0.0 | Reduced 3.6% | 2020-02-28 | | Special Situations | 0.0 | Reduced 31.9% | 2020-03-17 | | Cash | 21.3 | | |
|
Updates (Changes made today are underlined)
In the first months of the year, we saw manic trading activity. From big jumps in specific stocks to historic highs in retail trading activity to record highs in household confidence to almost unbelievable confidence among options traders. All of that has come amid a market where the average stock can’t keep up with their indexes. There were signs of waning momentum in stocks underlying the major averages, which started triggering technical warning signs in late January. The kinds of extremes we saw in December and January typically take months to wear away, but the type of selling we’ve seen over the past month has gone a long way toward getting there. When we place the kind of moves we saw into March 23 into the context of coming off an all-time high, there has been a high probability of a multi-month rebound. The volatility we’ve seen lately is extremely compelling from a medium-term point of view. Virtually everything we’ve looked at suggests a strong probability of gains over the next several months, even within the context of a potential bear market, and even from what had been higher prices. After stocks bottomed on the 23rd, they enjoyed a historic buying thrust. While other signs are mixed at best that panic is subsiding, that thrust is one of the most encouraging sign we've seen in years. There is often a test of a panic low in the weeks after an initial recovery, but that thrust we saw, combined with the larger-than-usual retracement, have me less convinced a test is necessary. For now, I see no overwhelming reason to add or reduce exposure.
RETURN YTD: -11.9% 2019: 12.6%, 2018: 0.6%, 2017: 3.8%, 2016: 17.1%, 2015: 9.2%, 2014: 14.5%, 2013: 2.2%, 2012: 10.8%, 2011: 16.5%, 2010: 15.3%, 2009: 23.9%, 2008: 16.2%, 2007: 7.8%
|
|
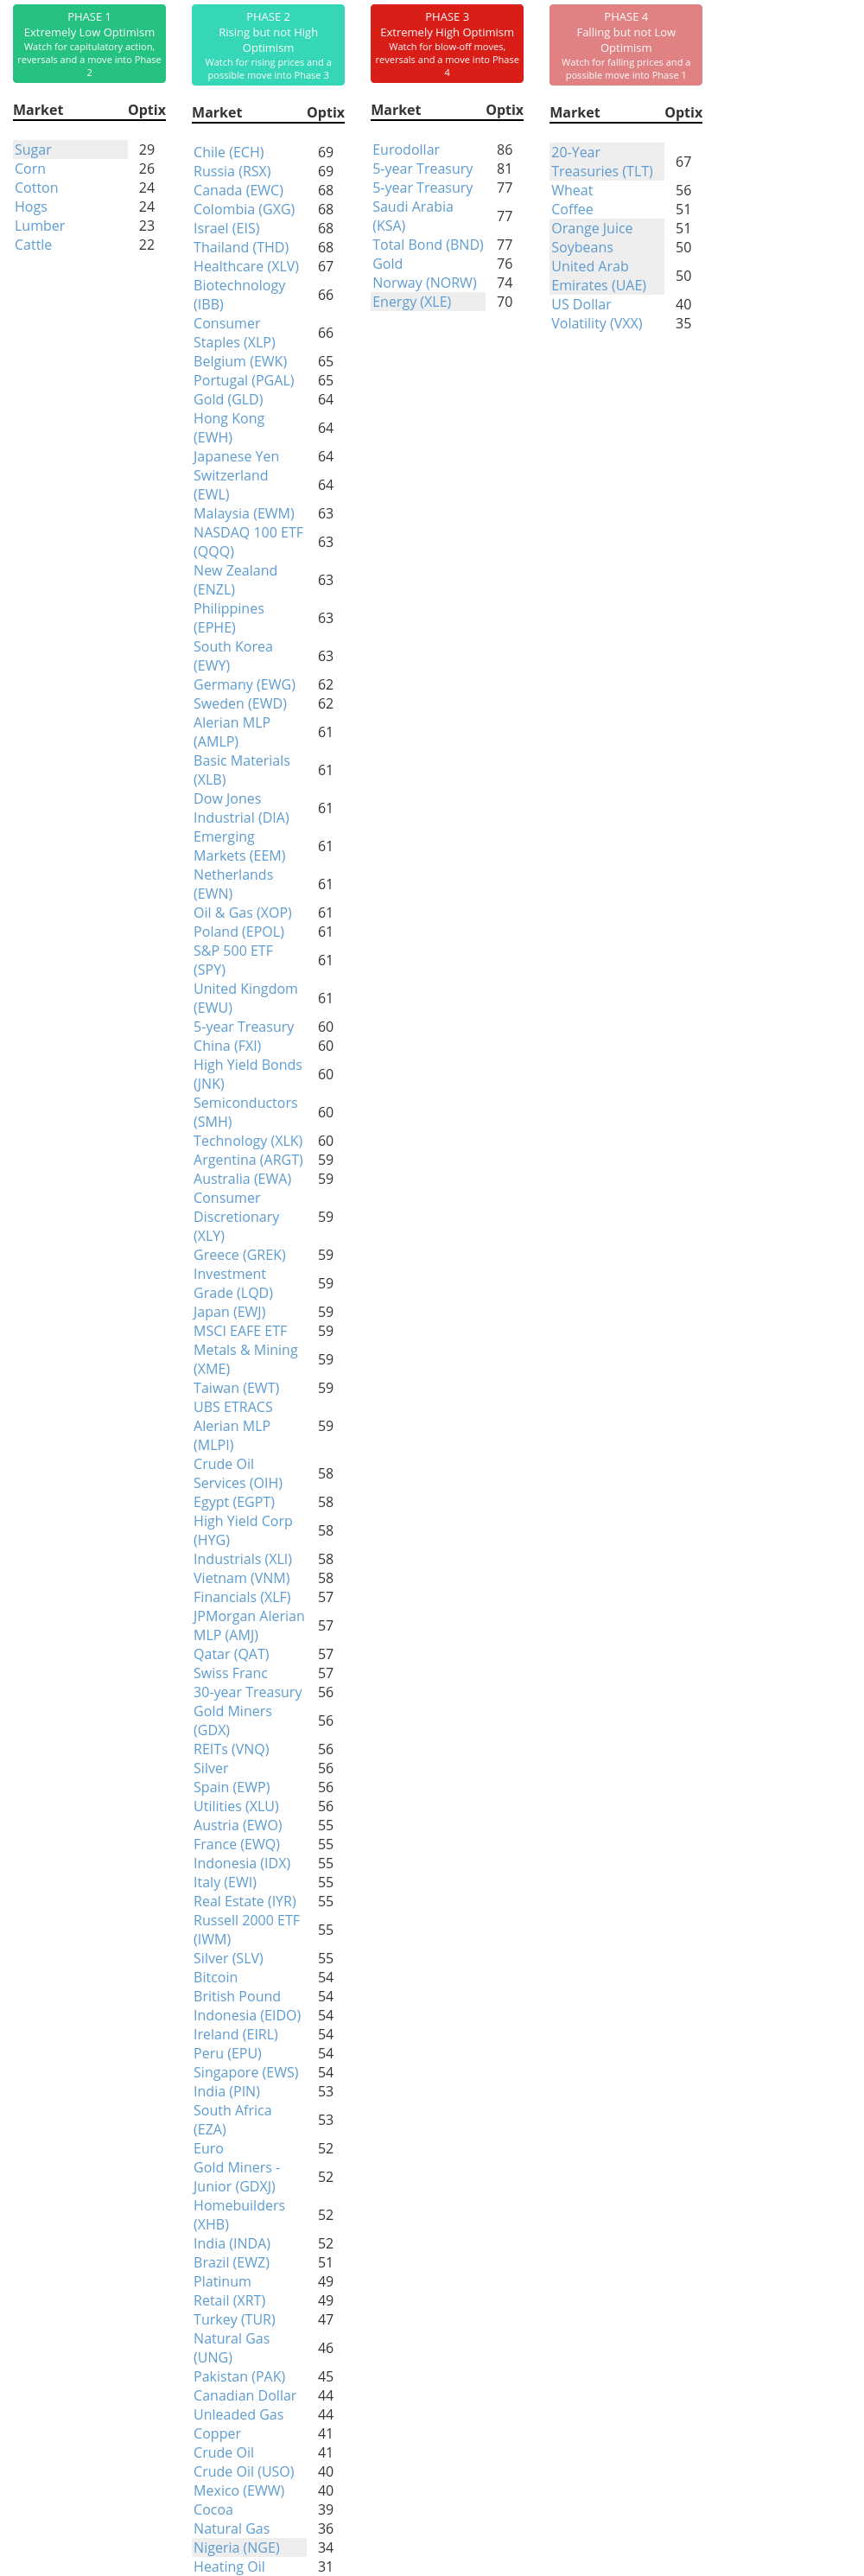
Phase Table
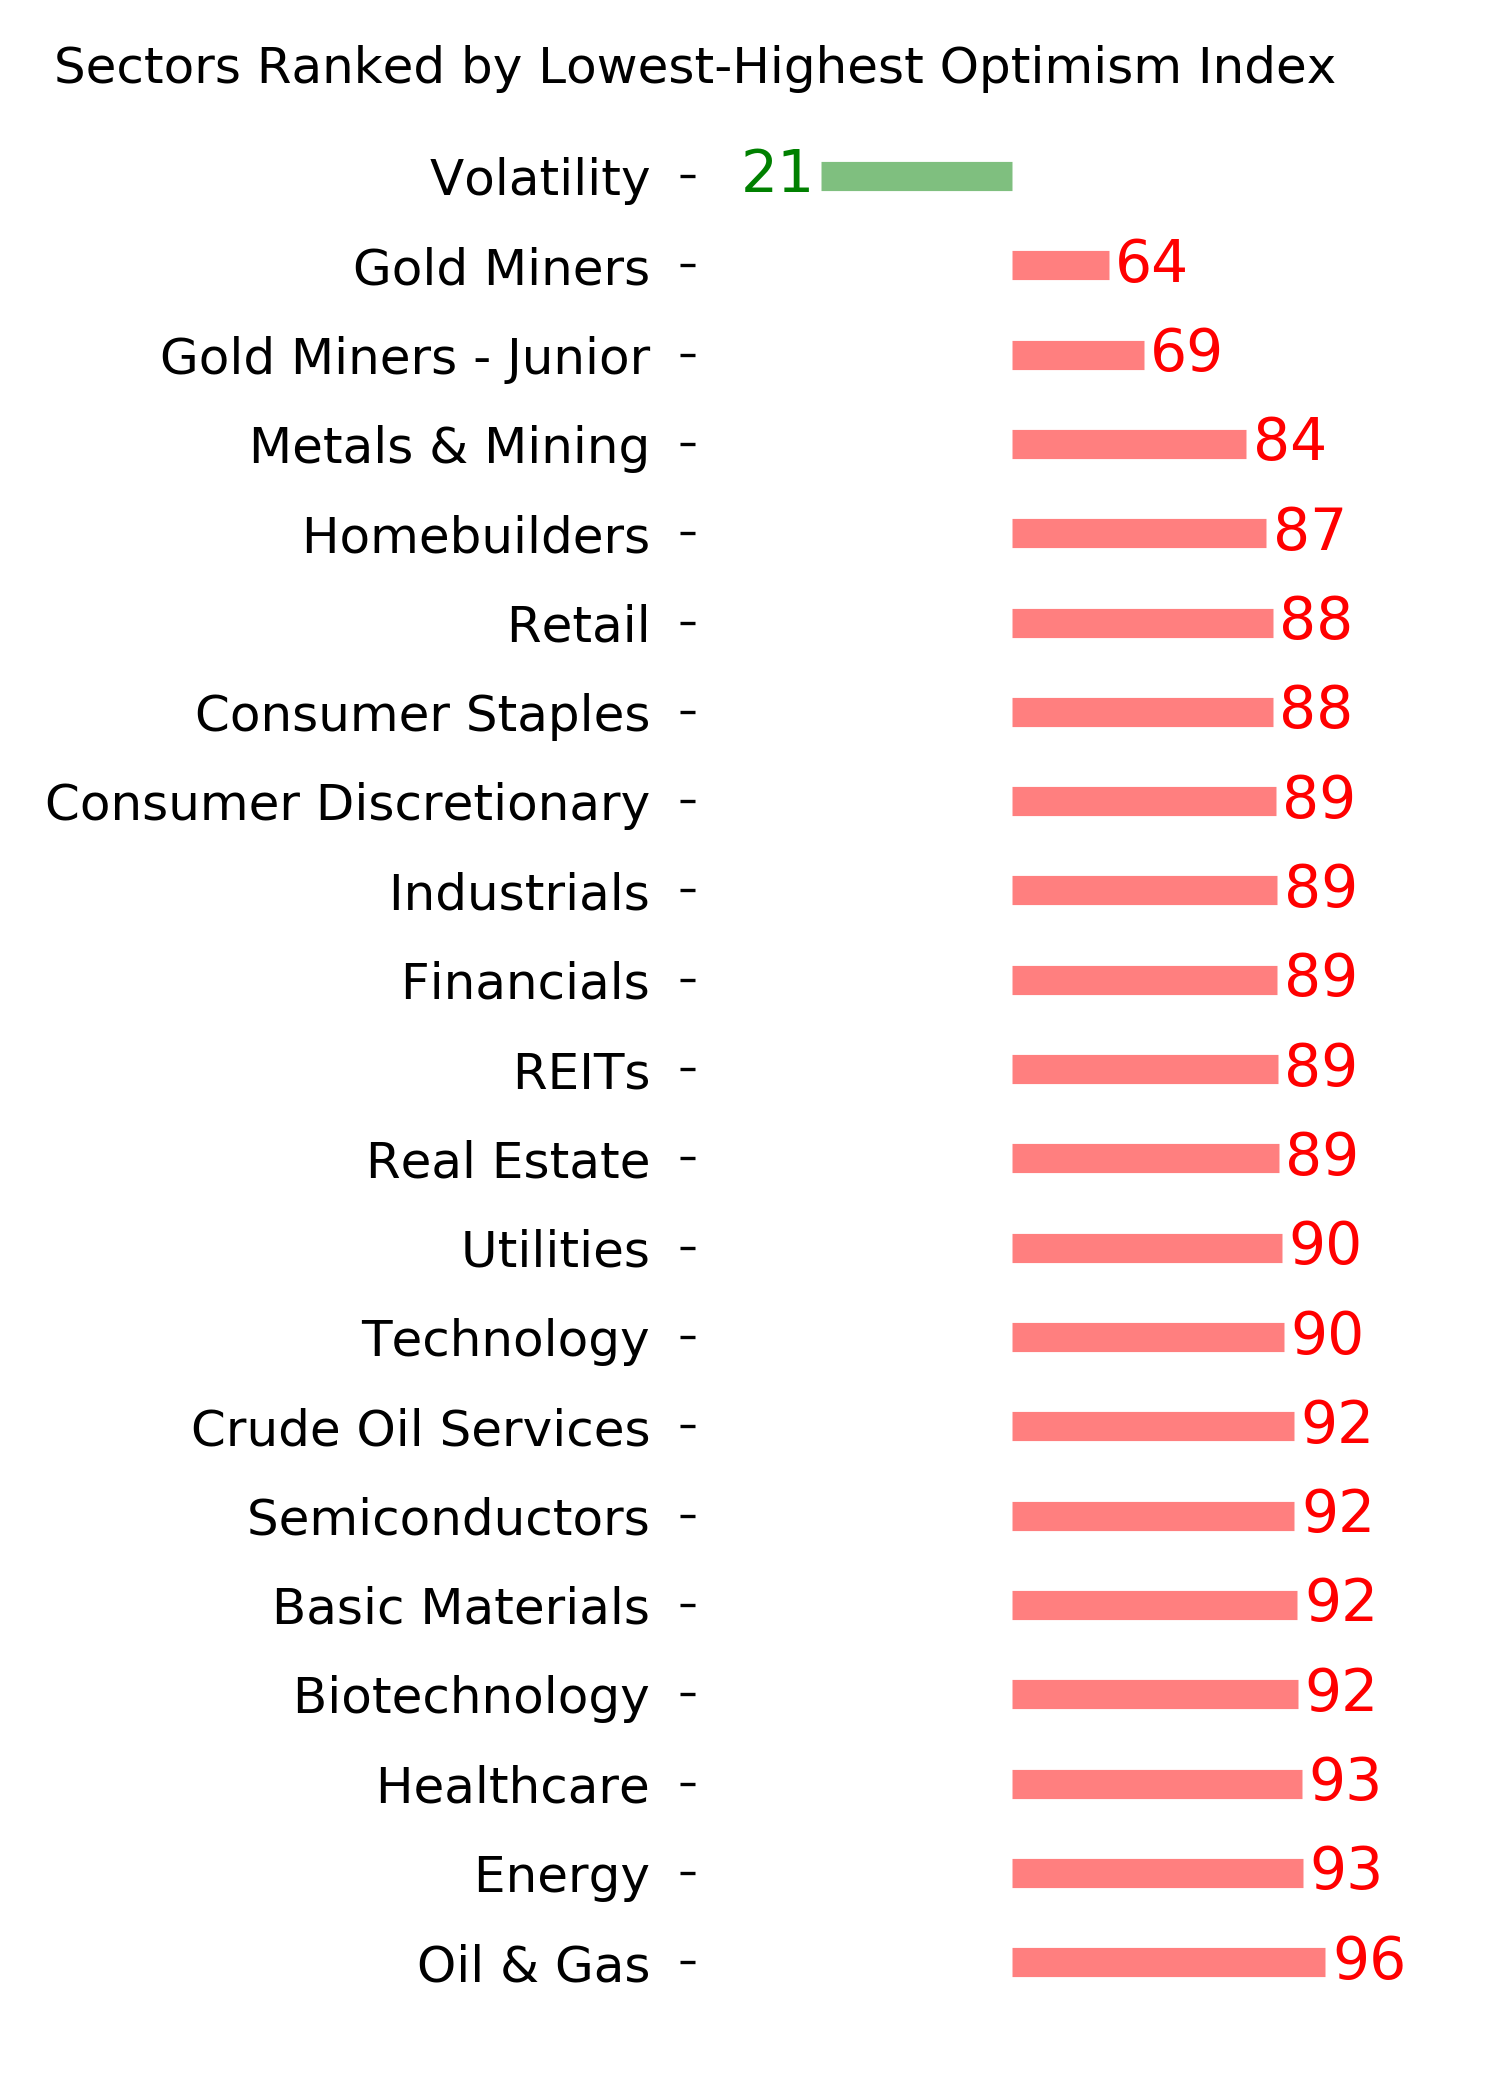
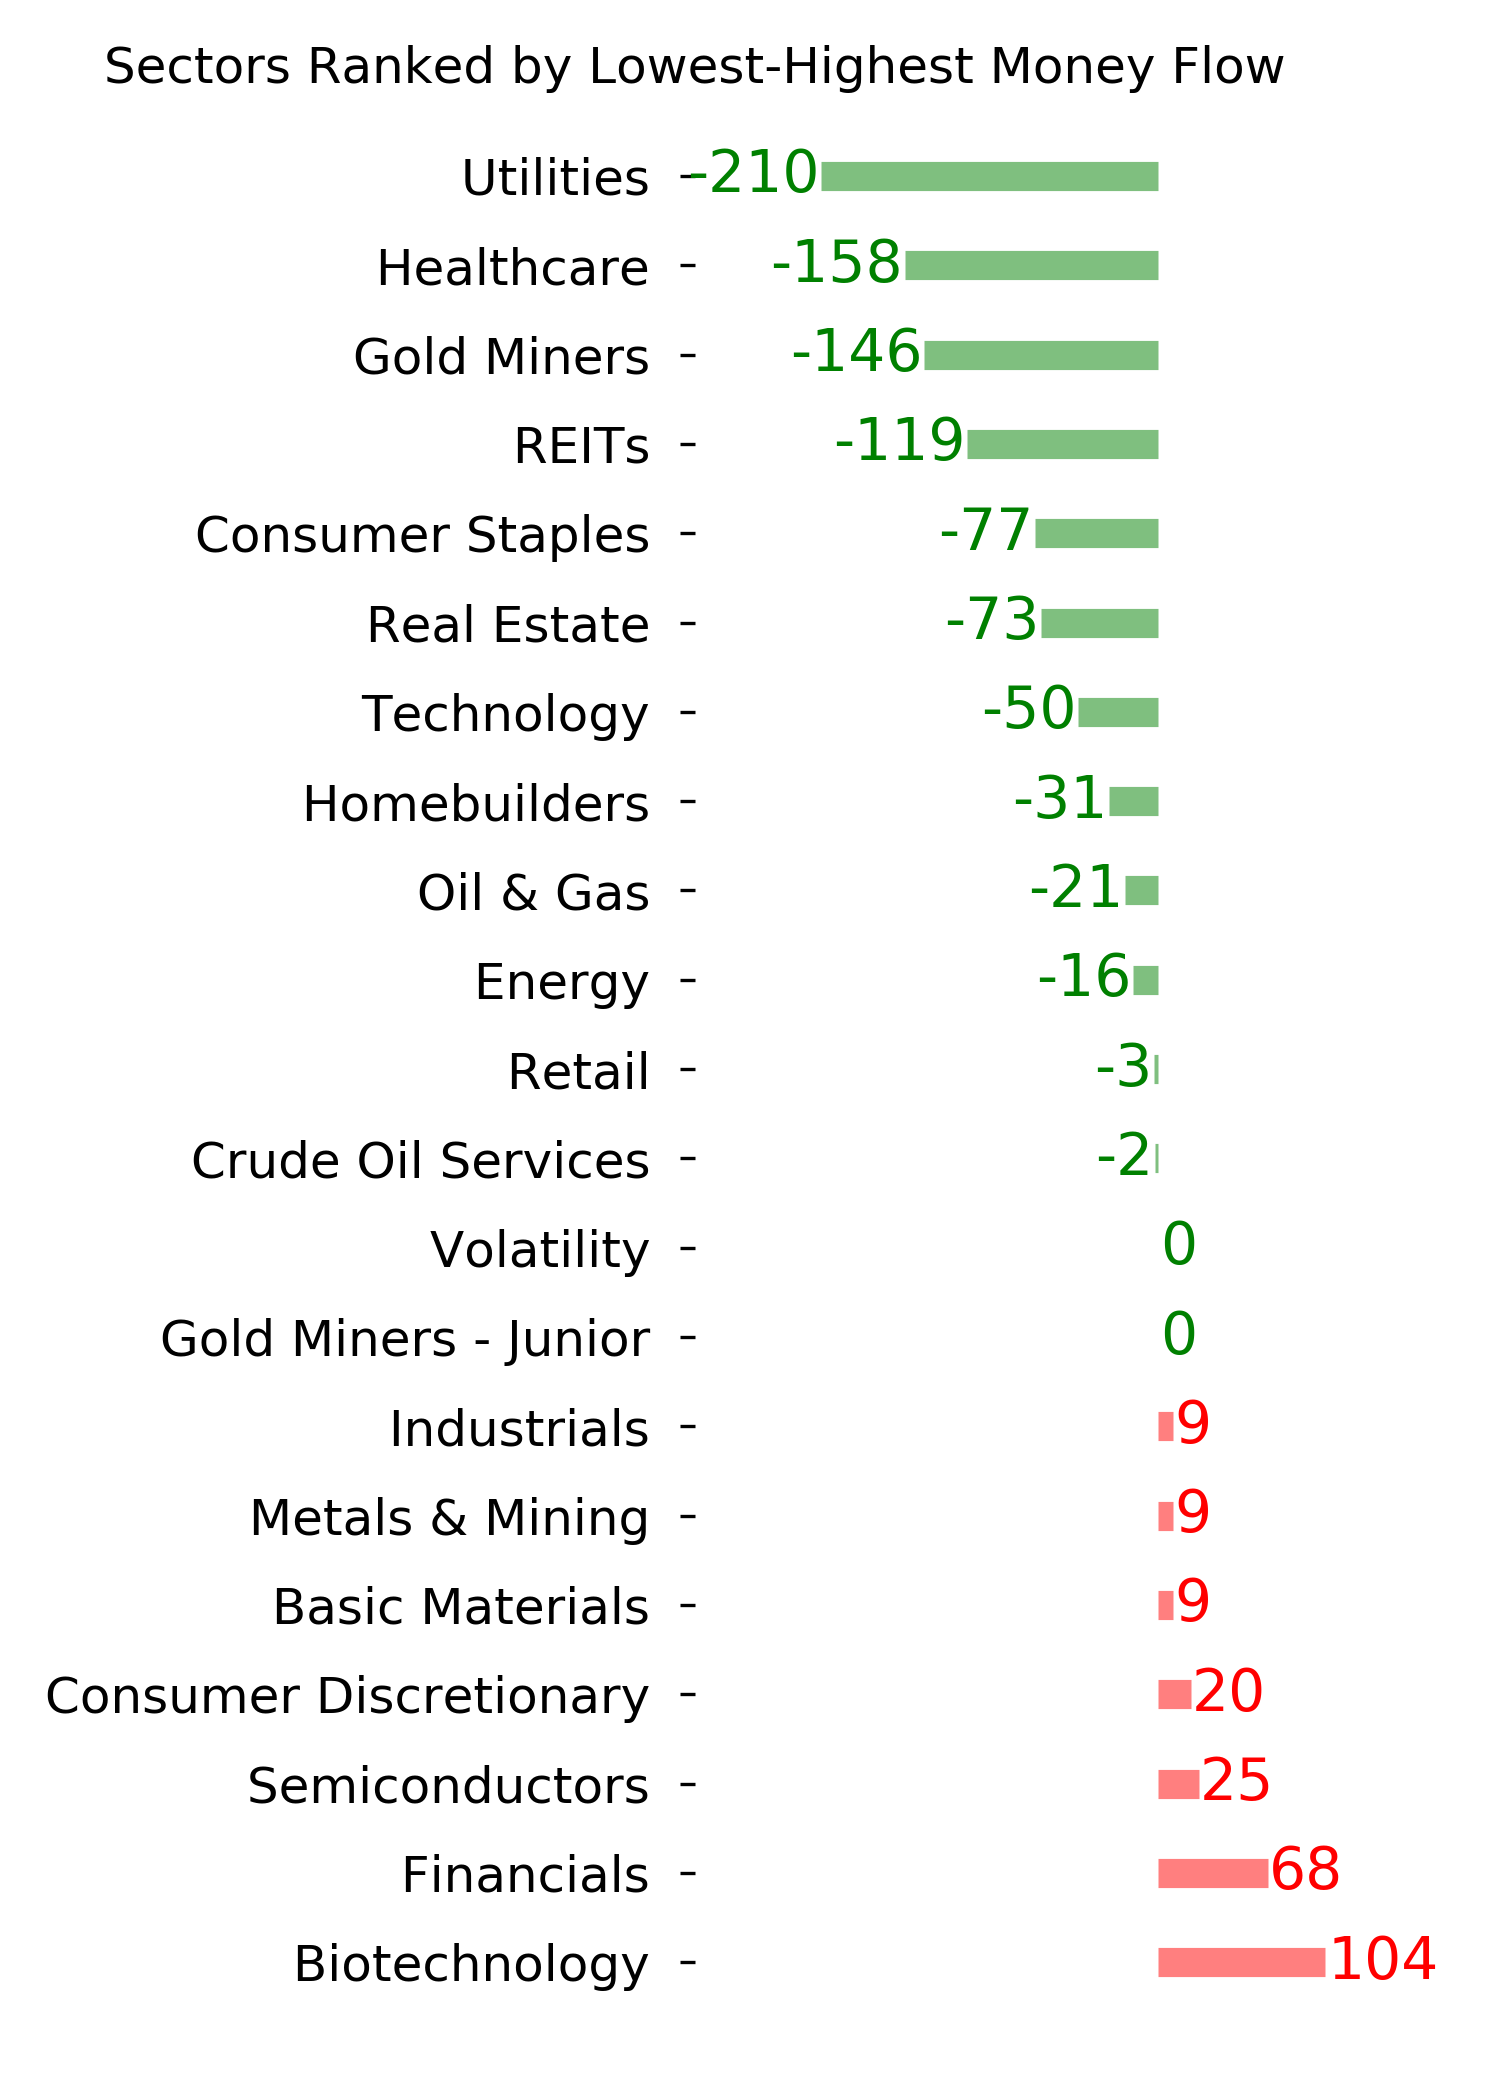
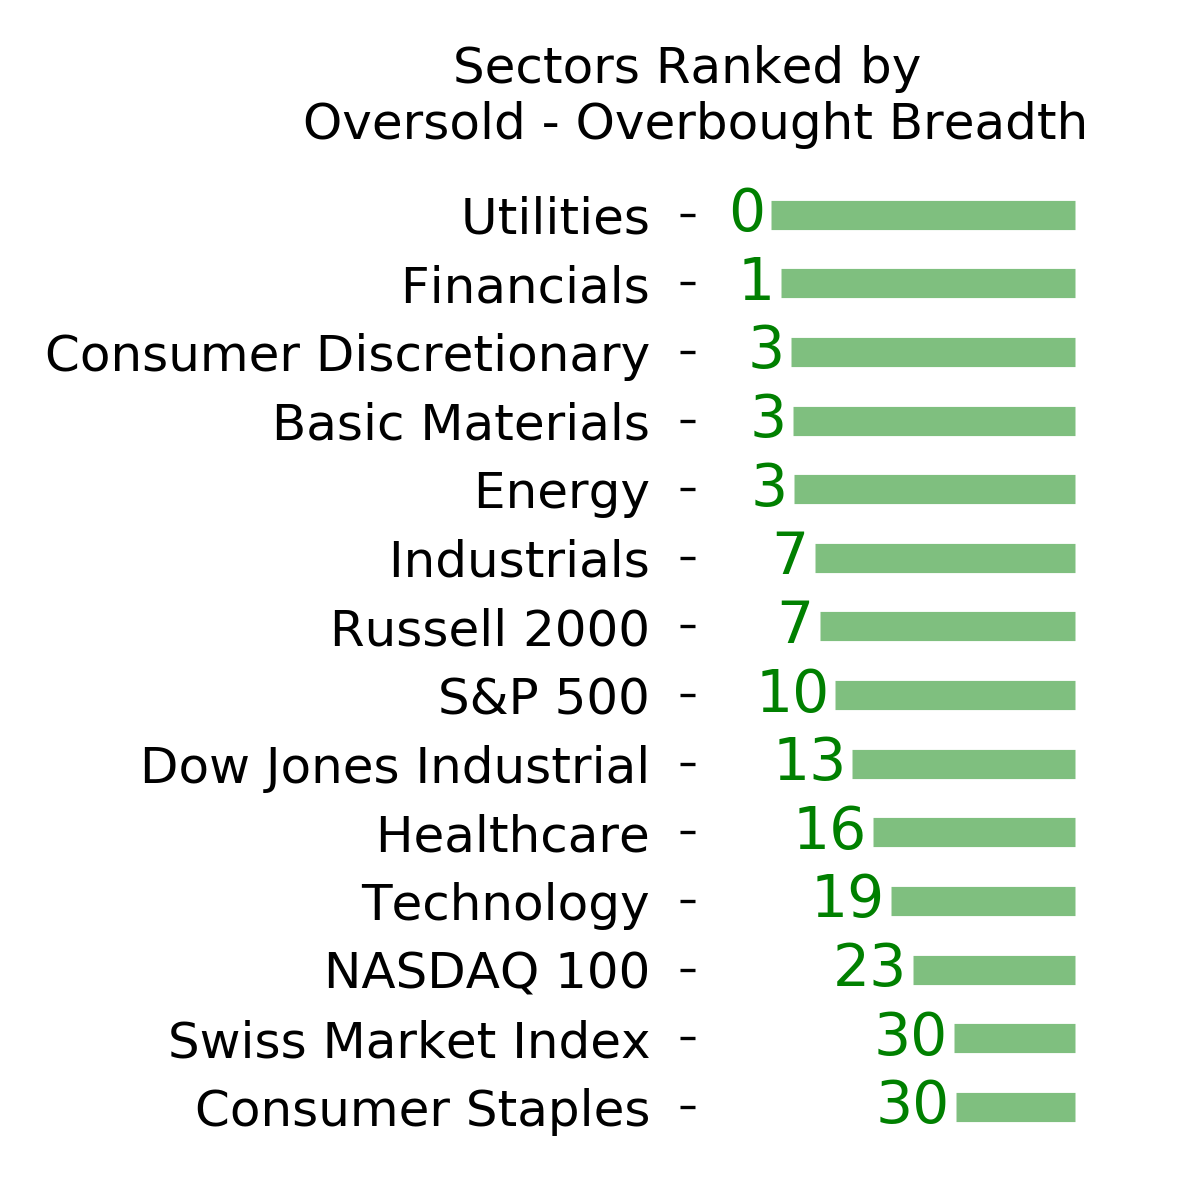
Ranks
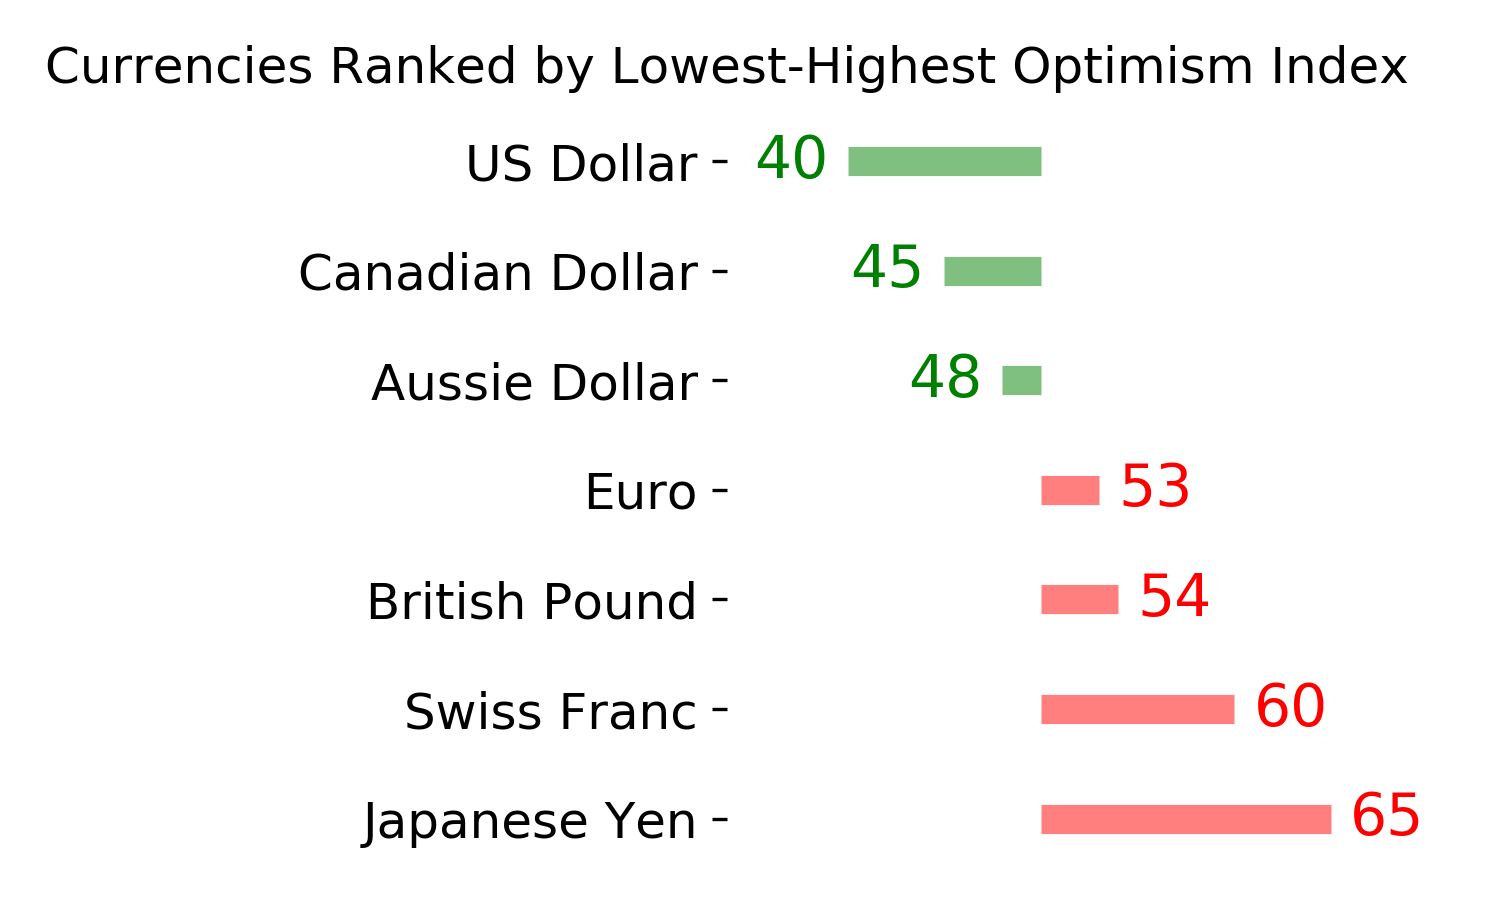
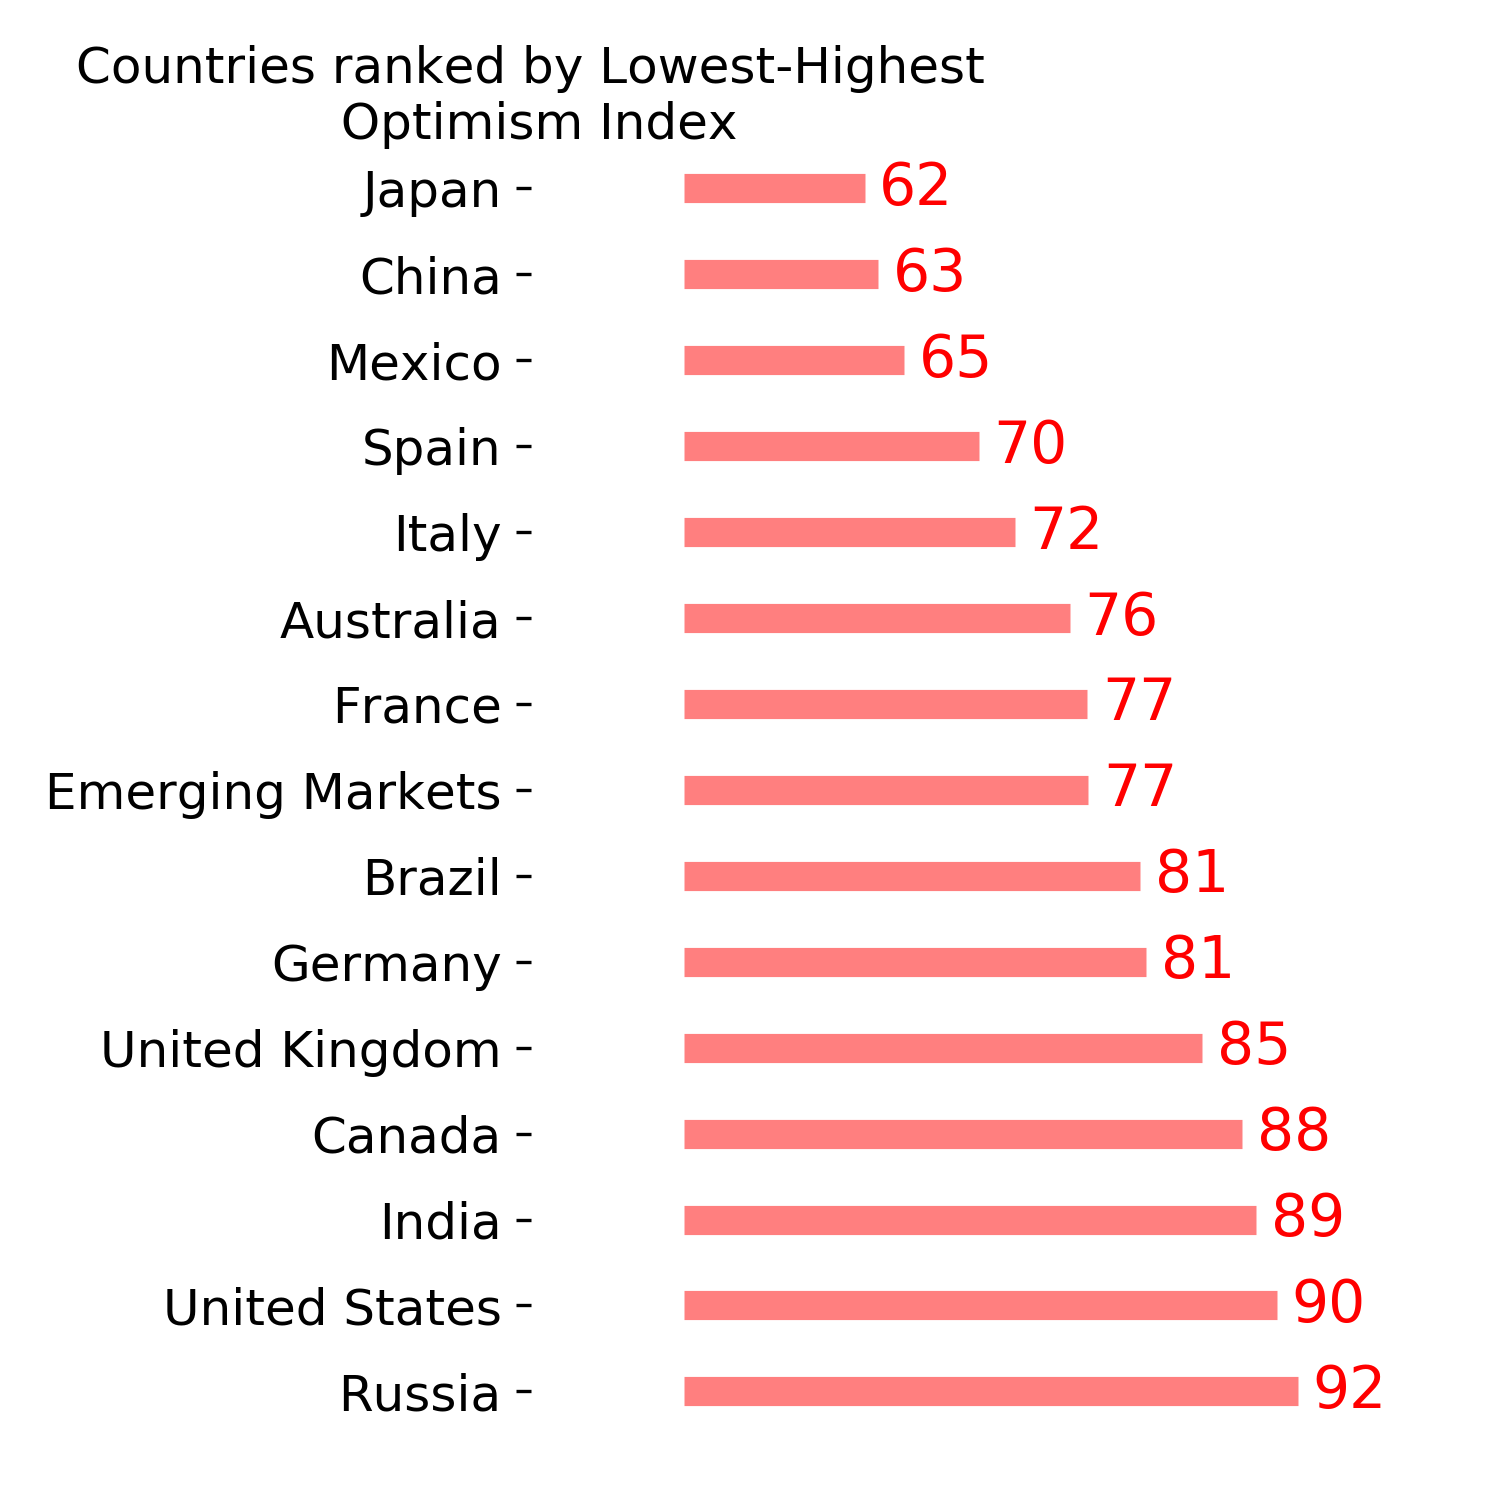
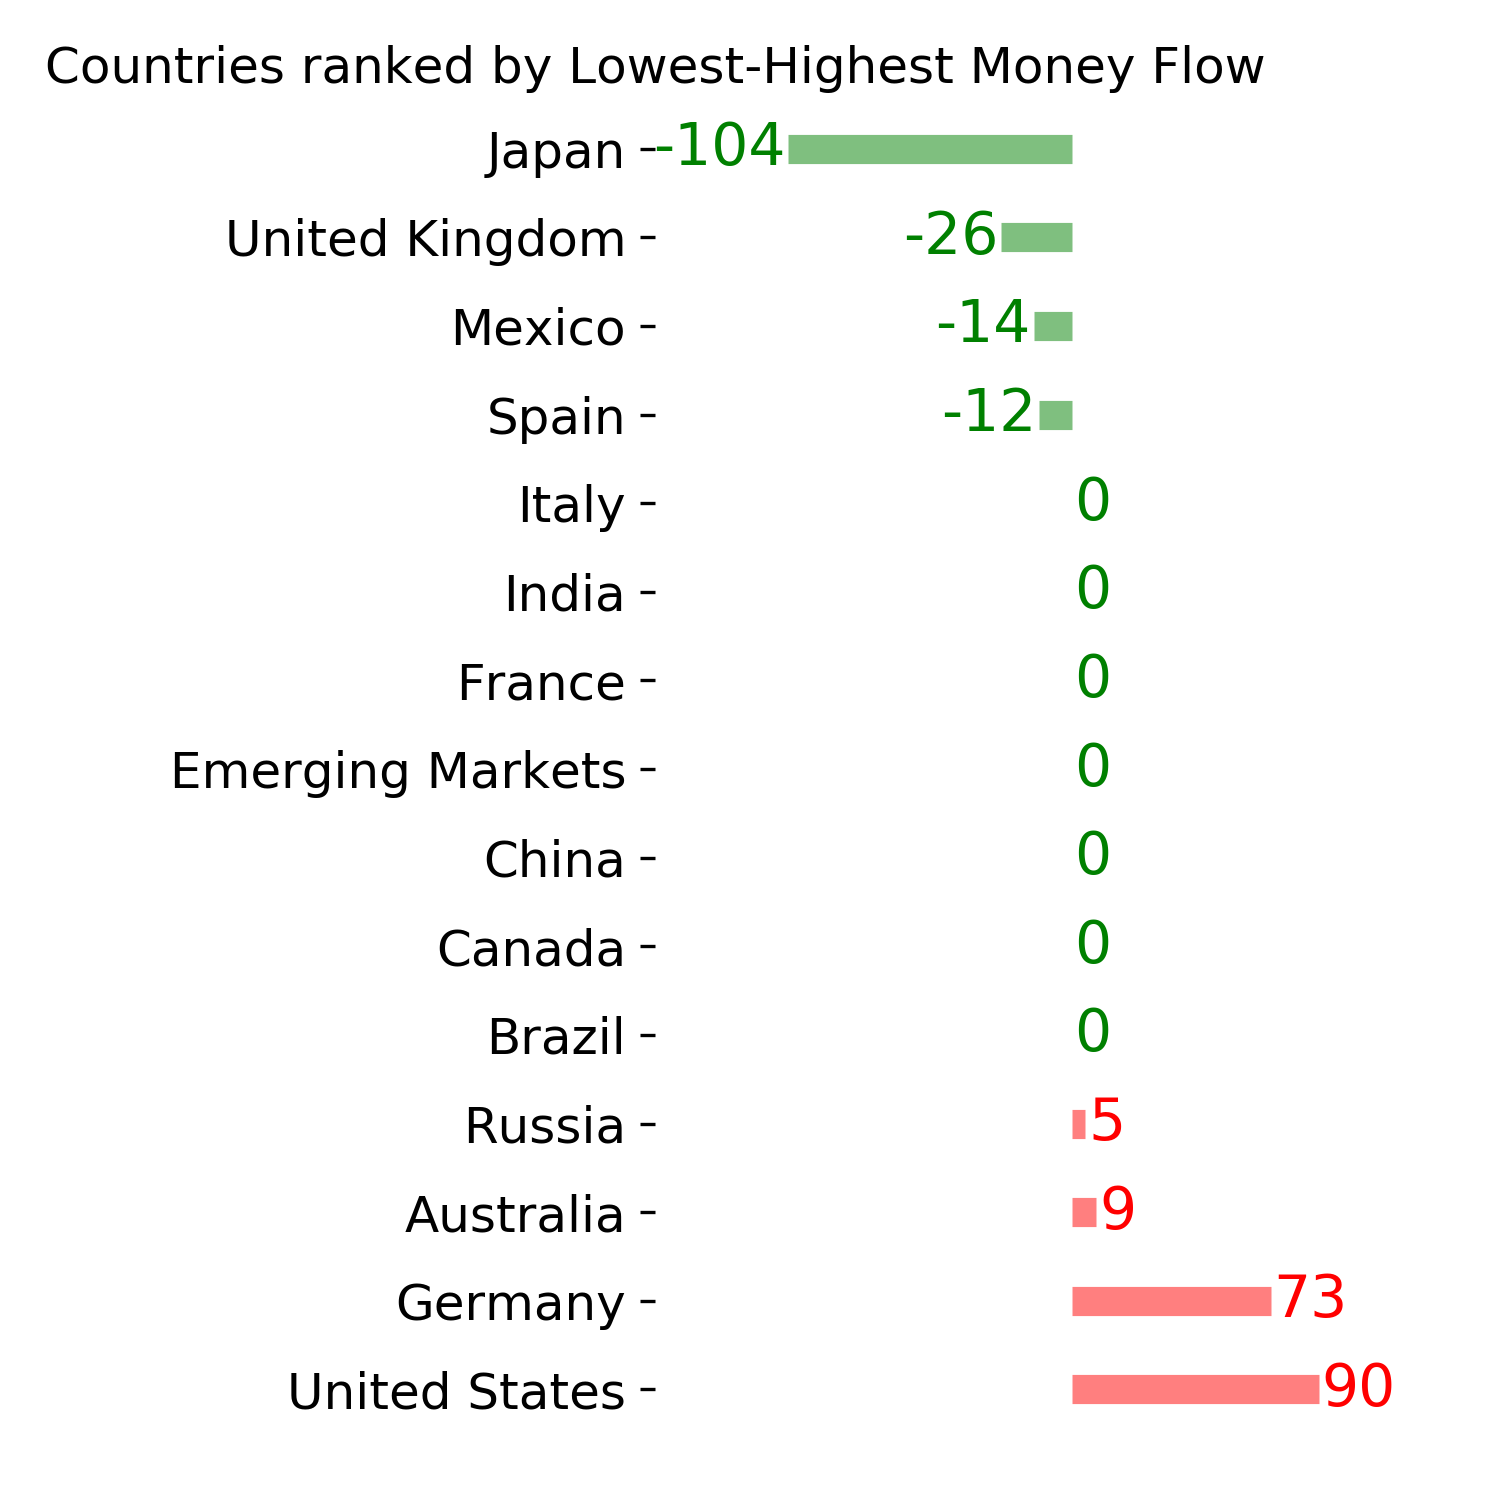
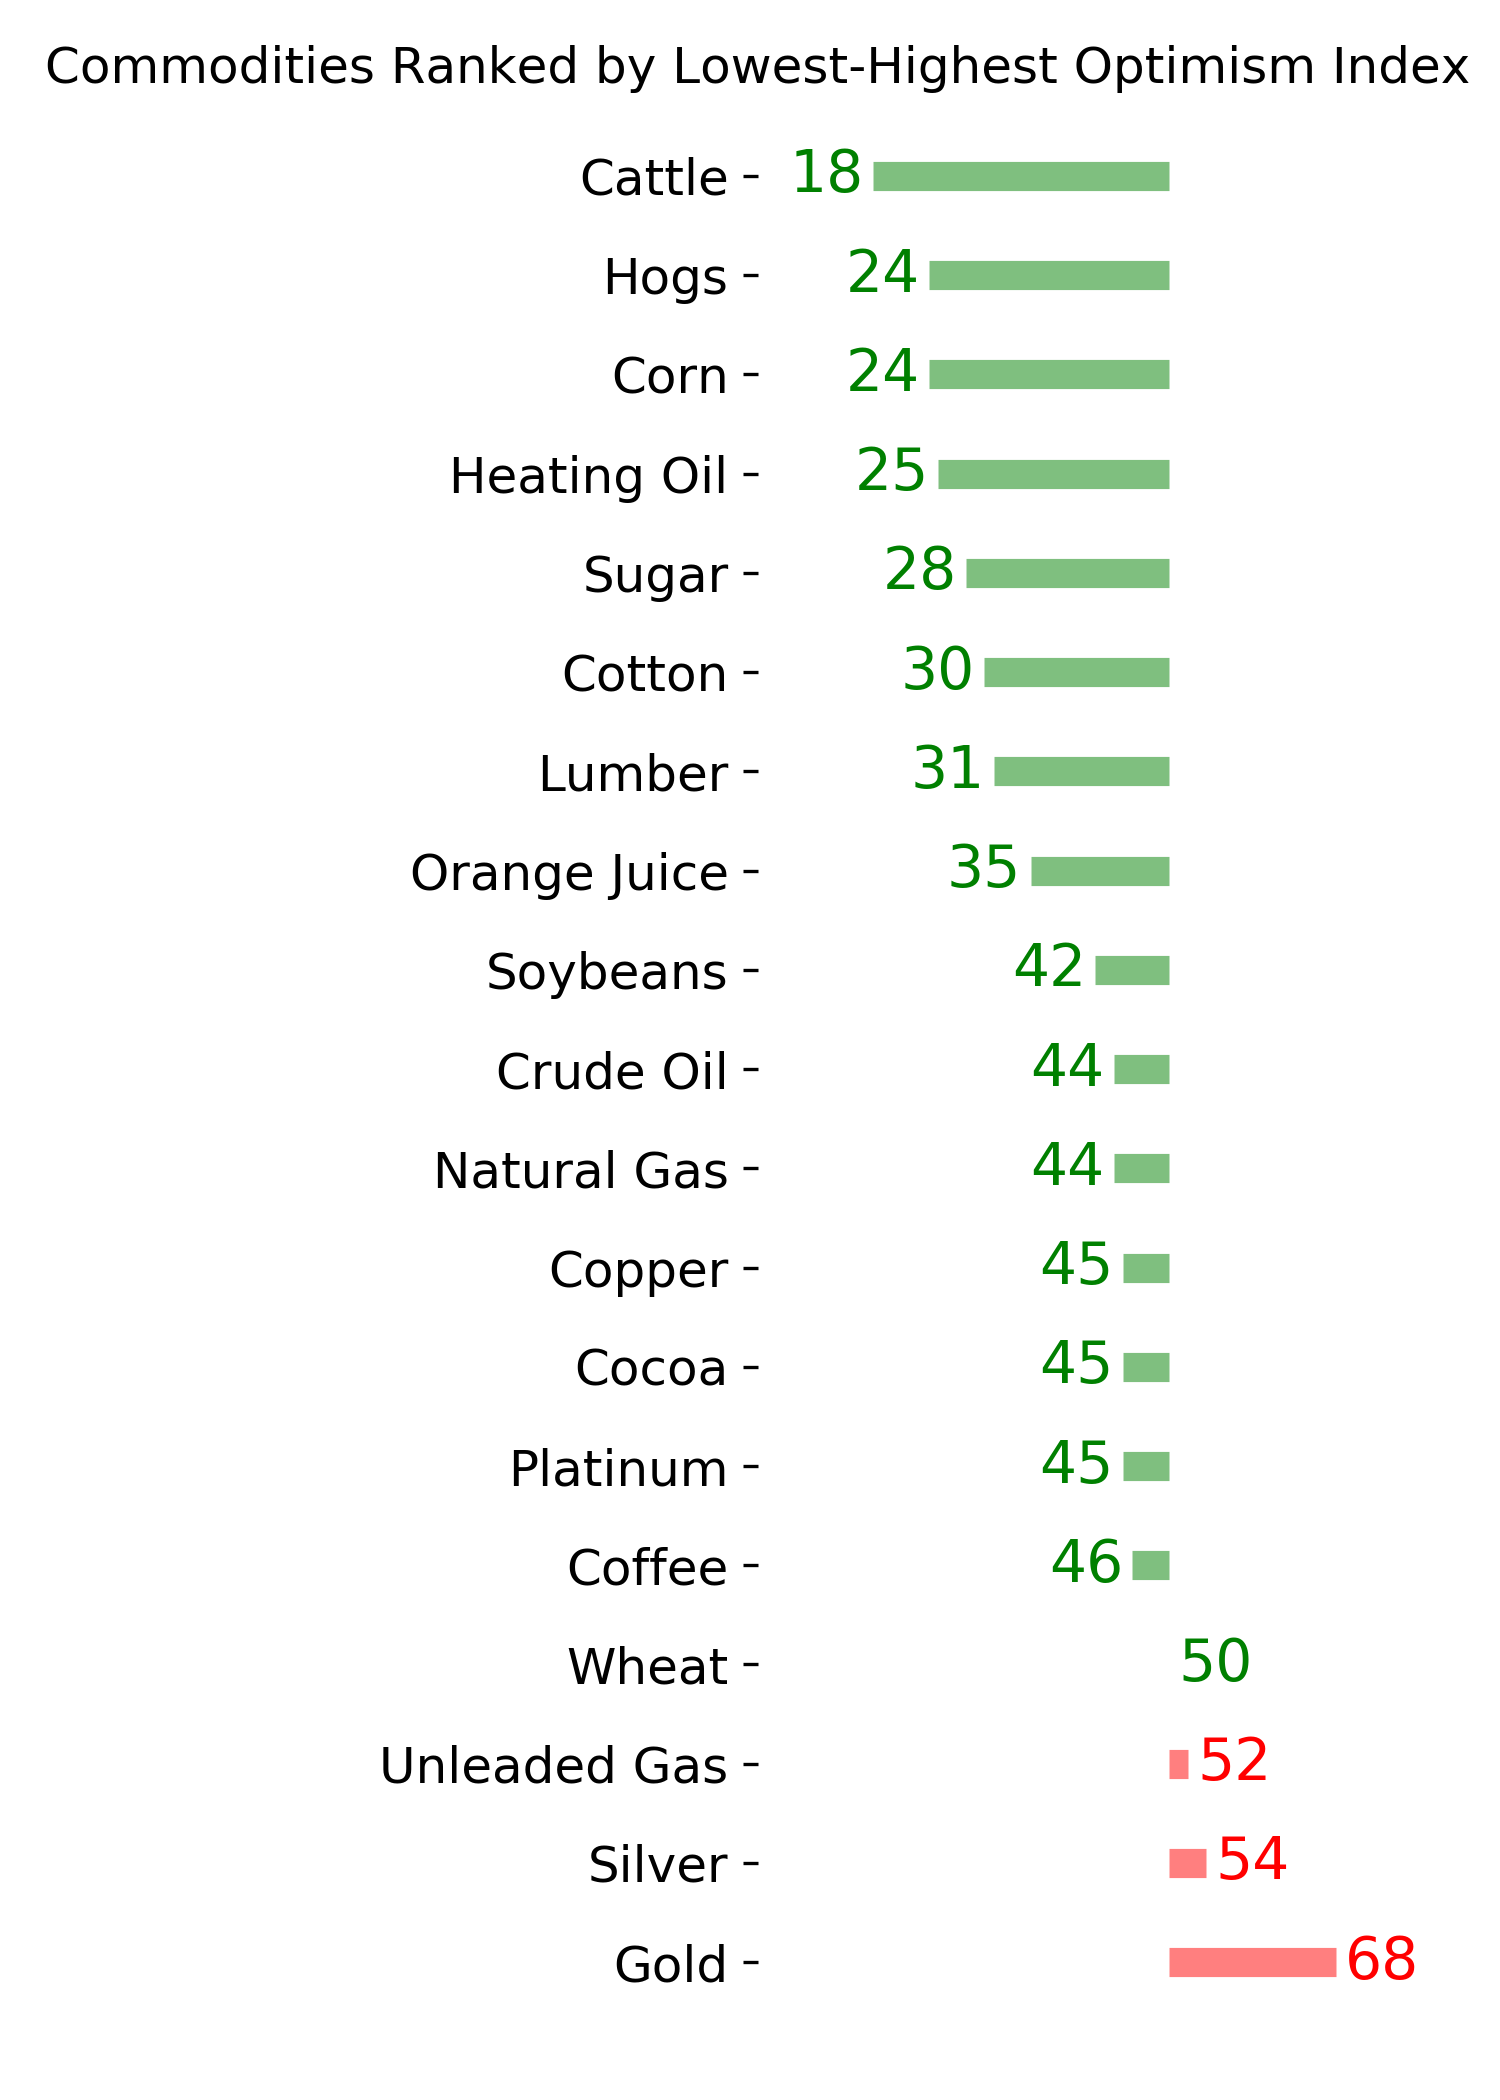
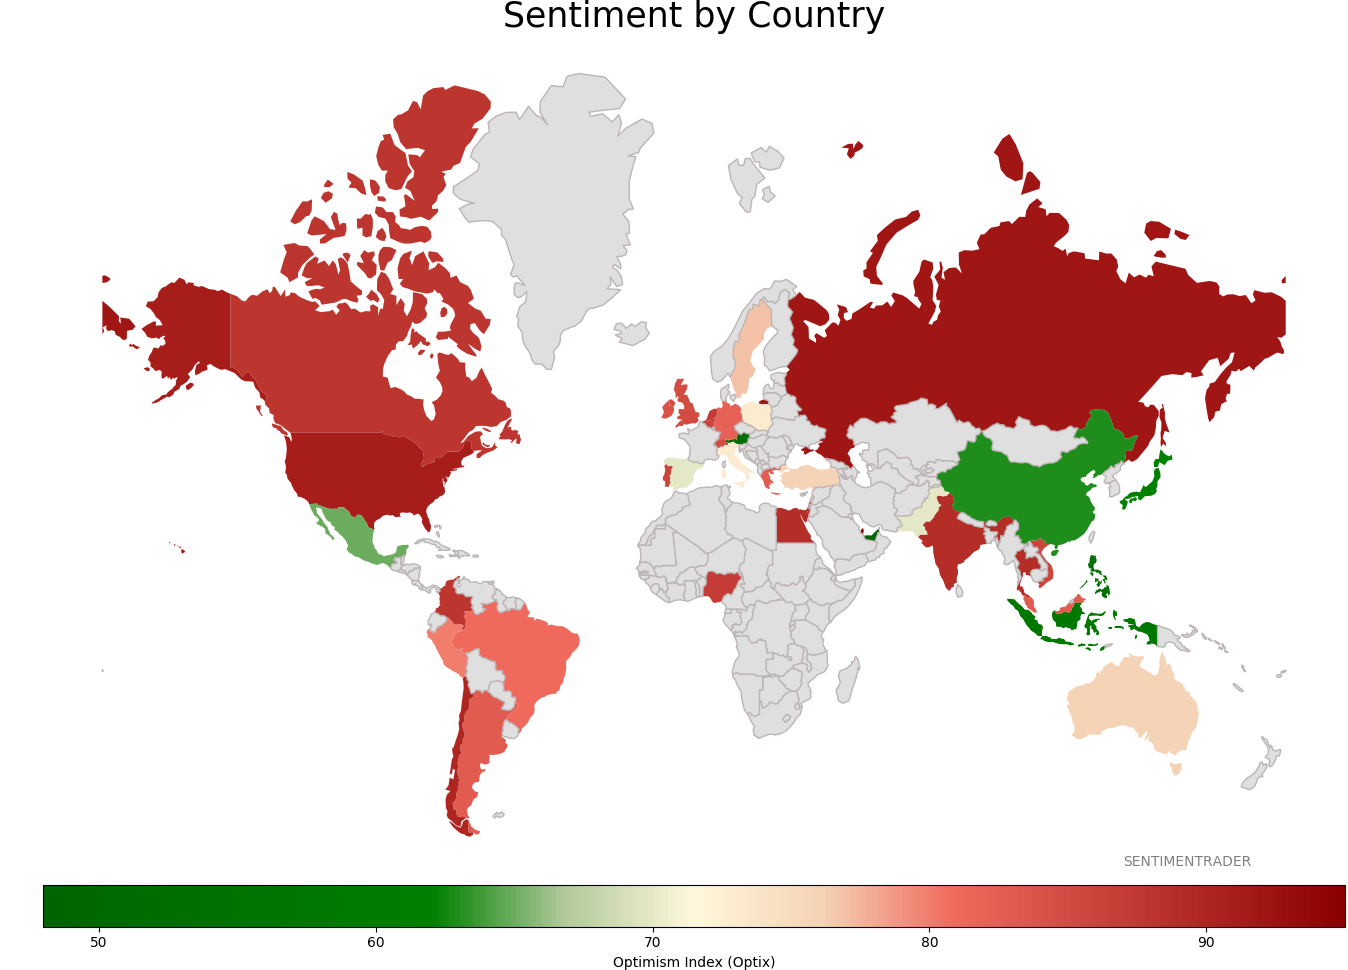
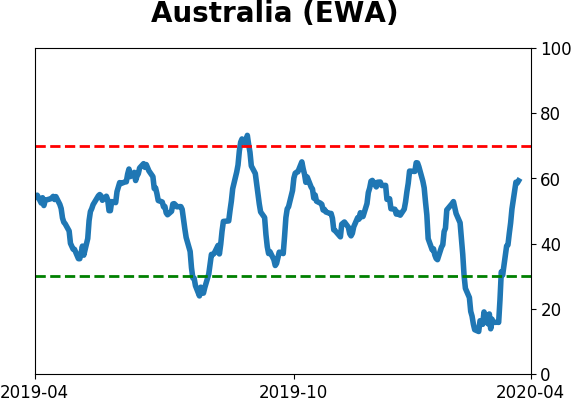
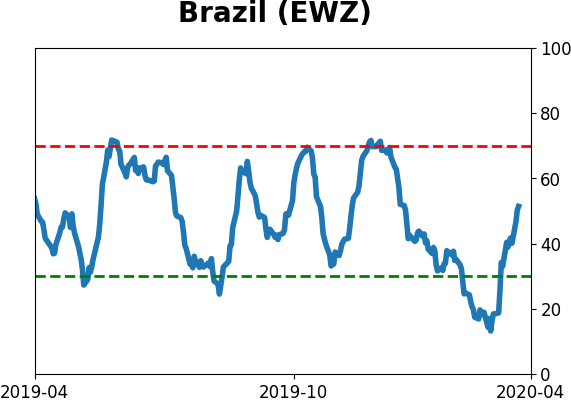
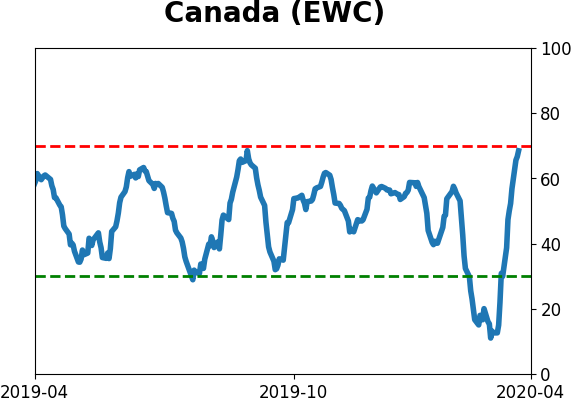
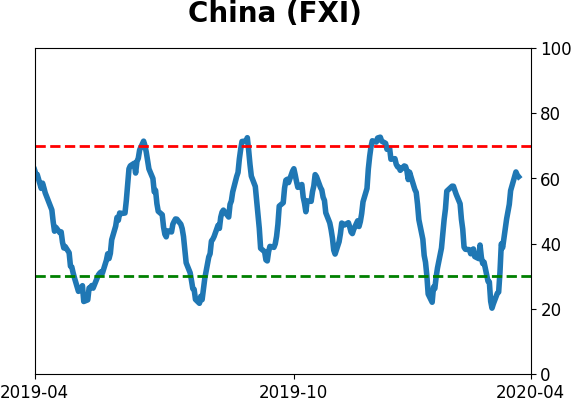
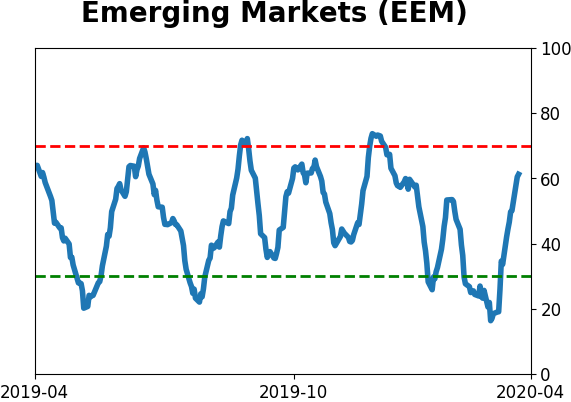
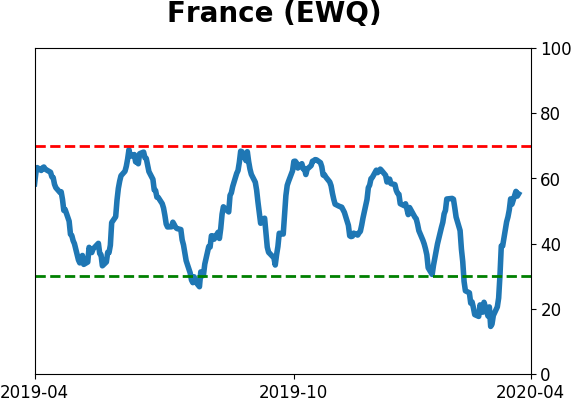
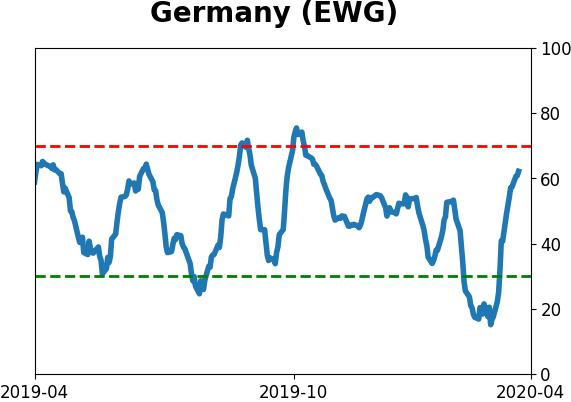
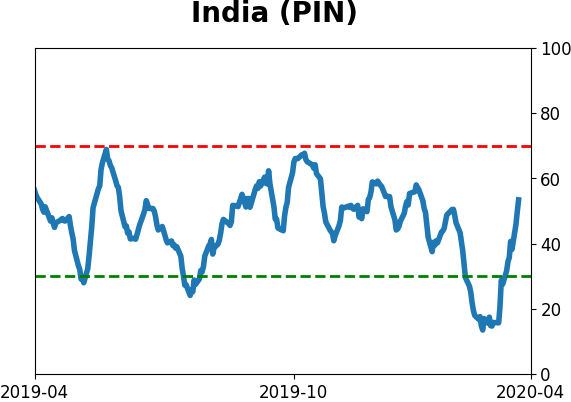
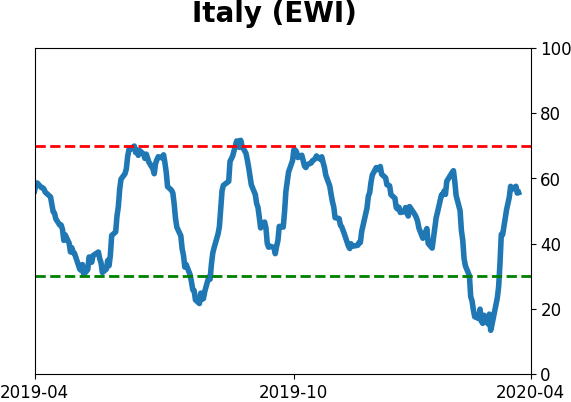
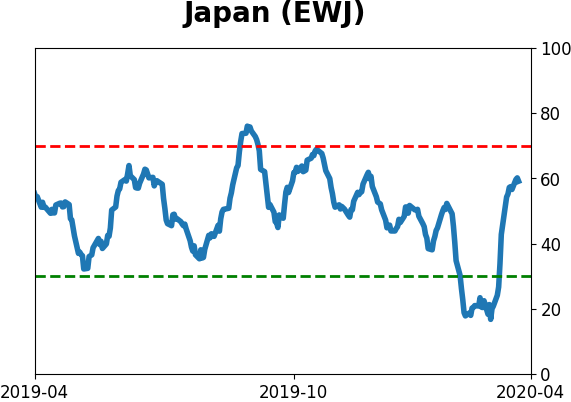
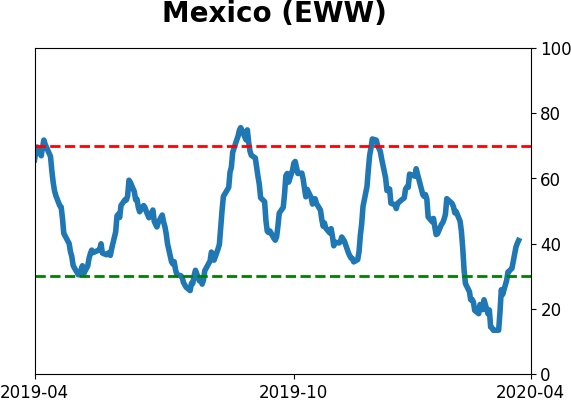
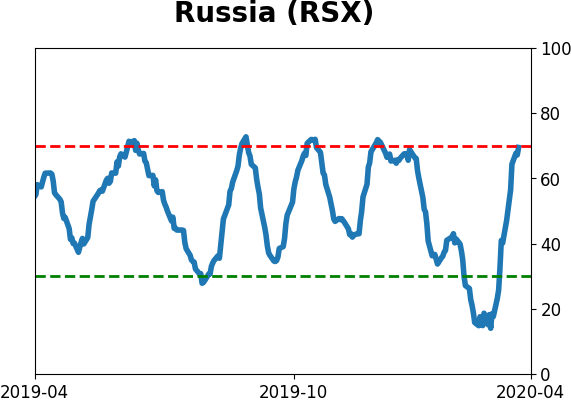
Sentiment Around The World
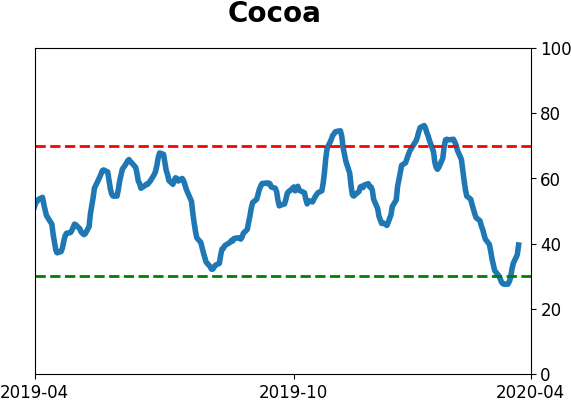
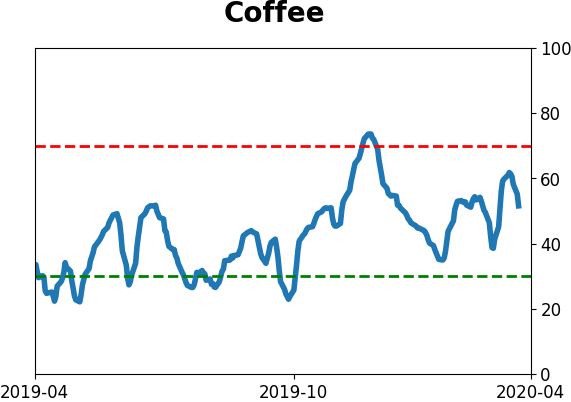
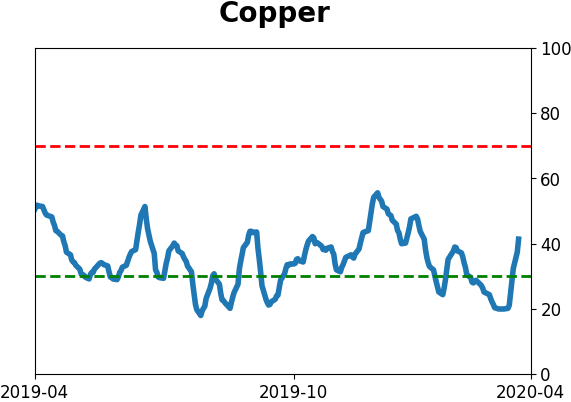
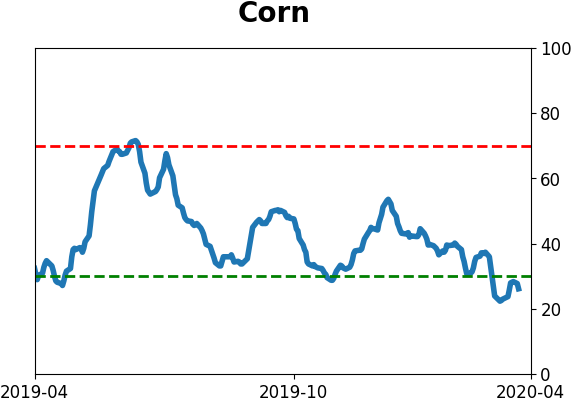
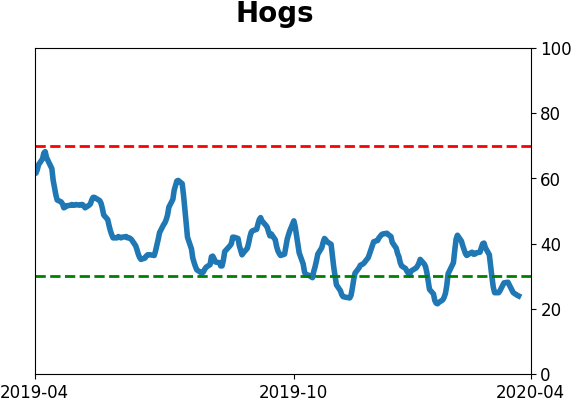
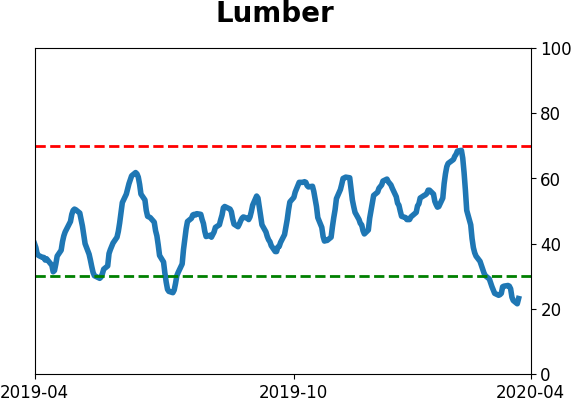
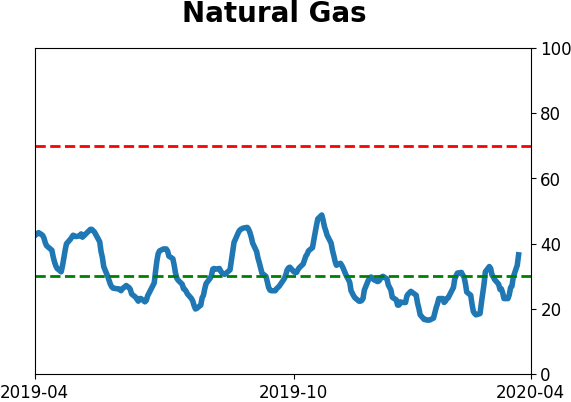
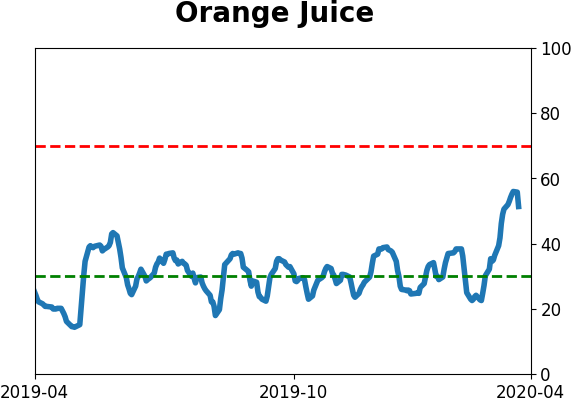
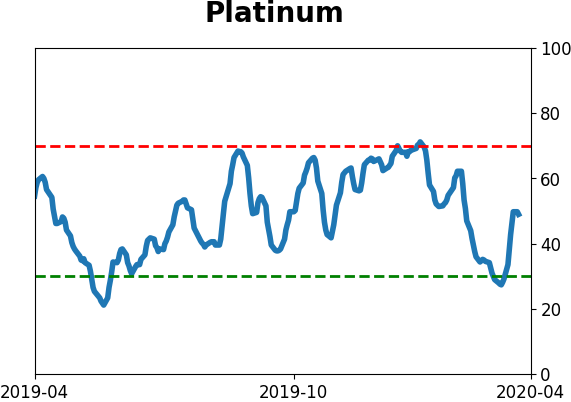
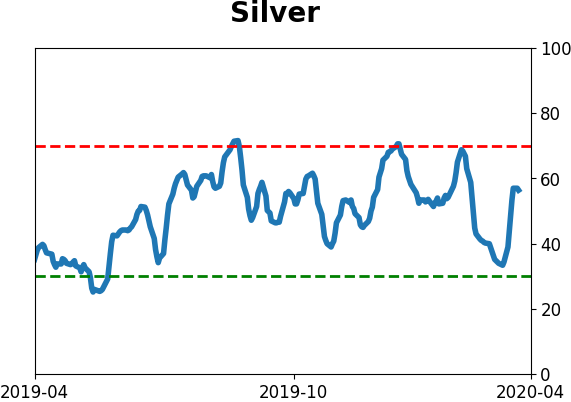
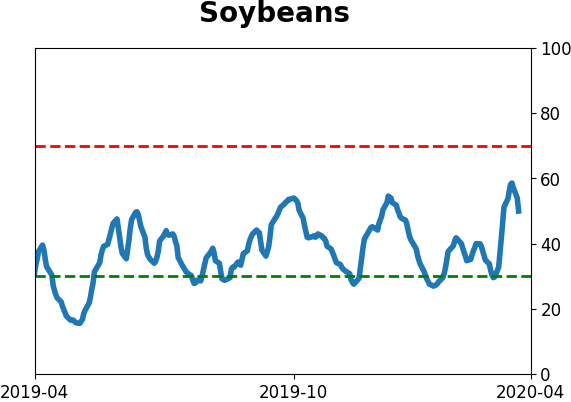
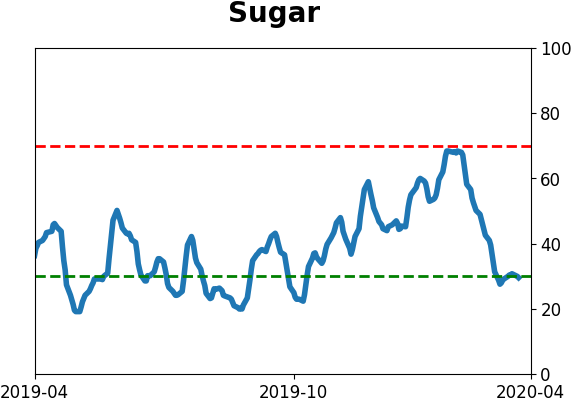
Optimism Index Thumbnails
|
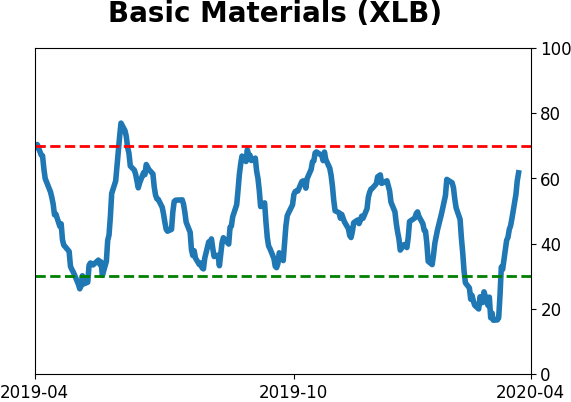
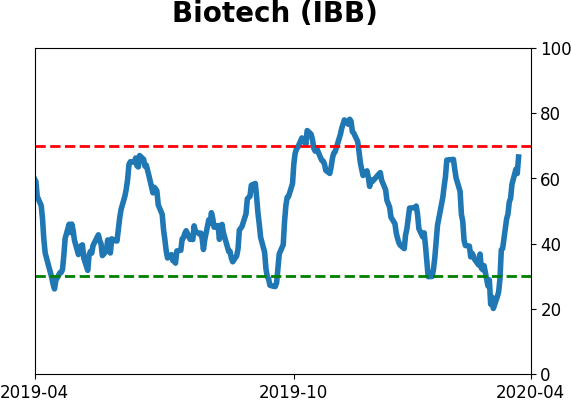
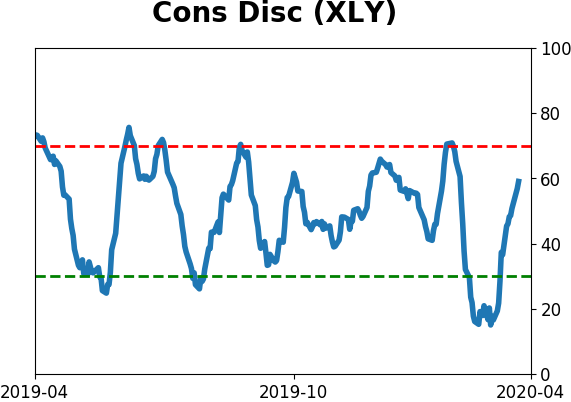
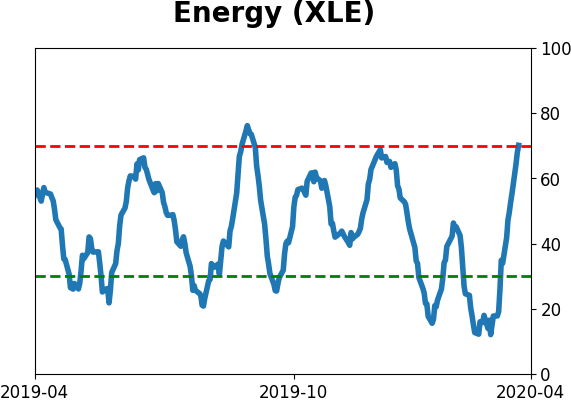
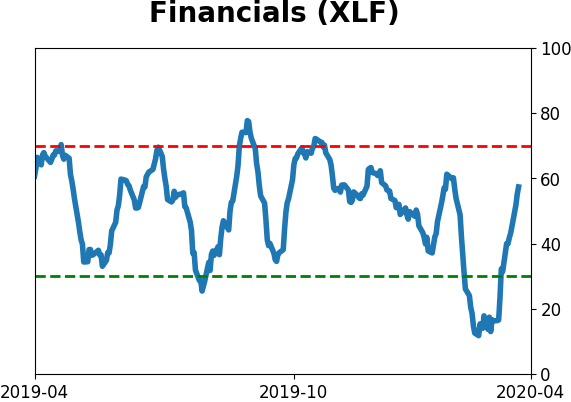
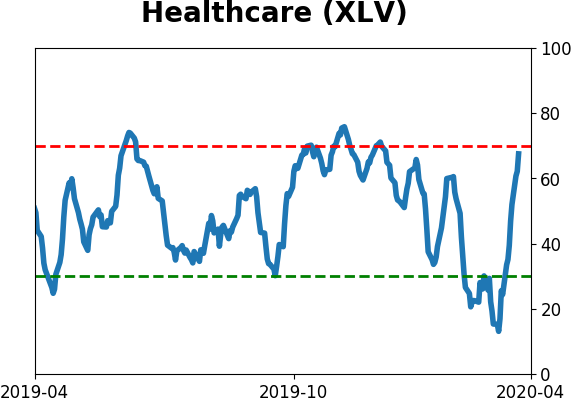
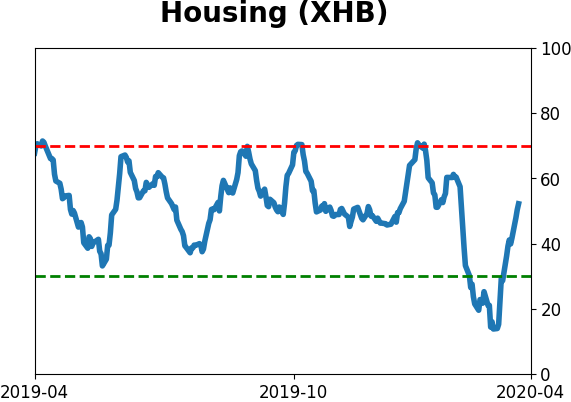
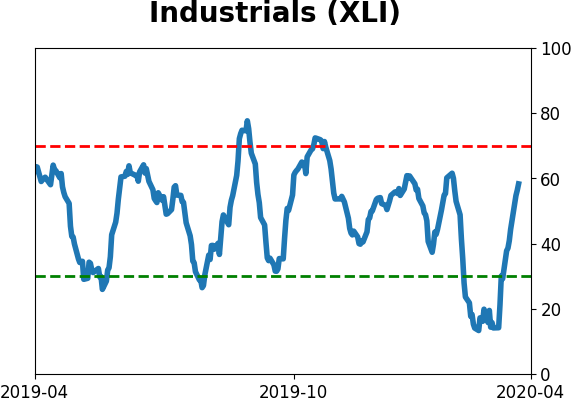
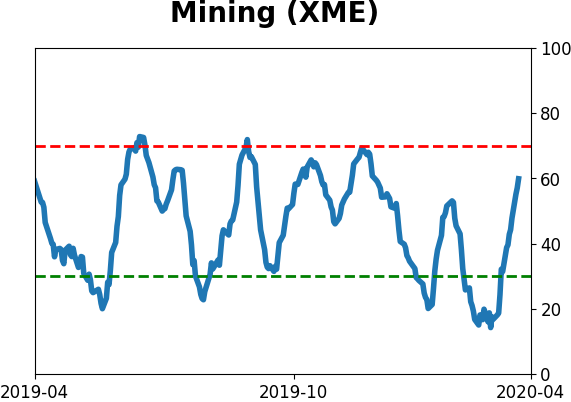
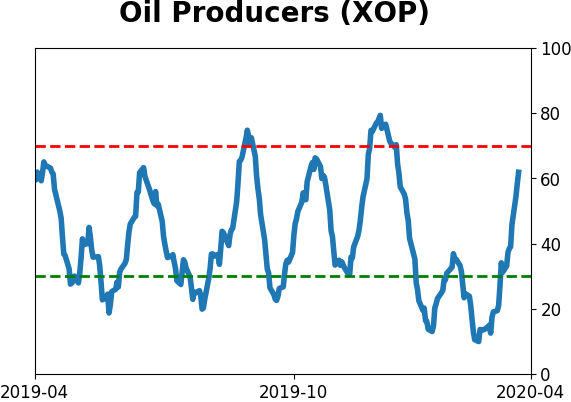
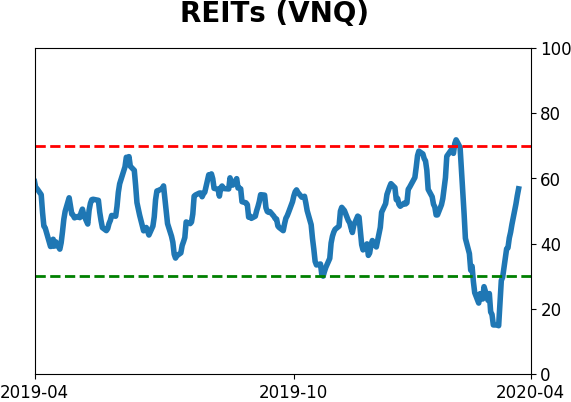
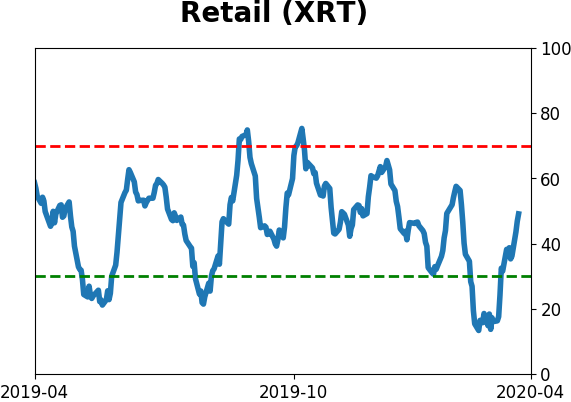
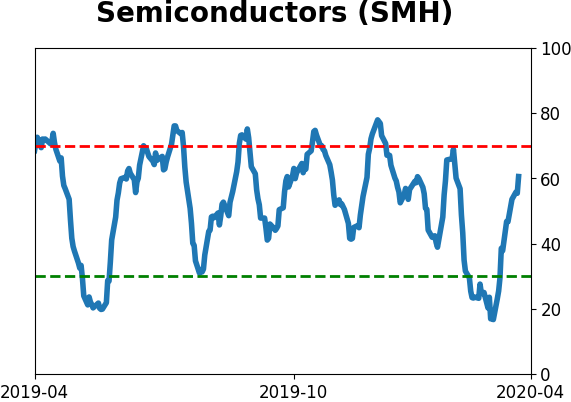
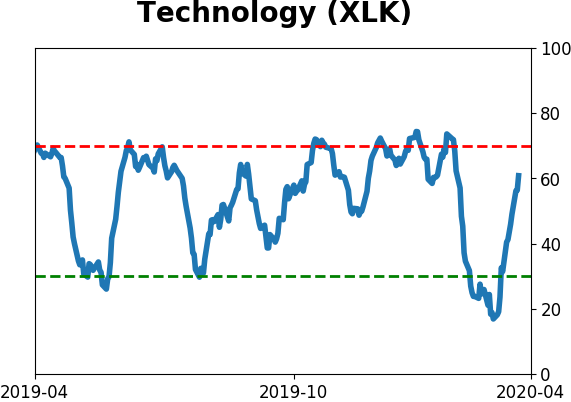
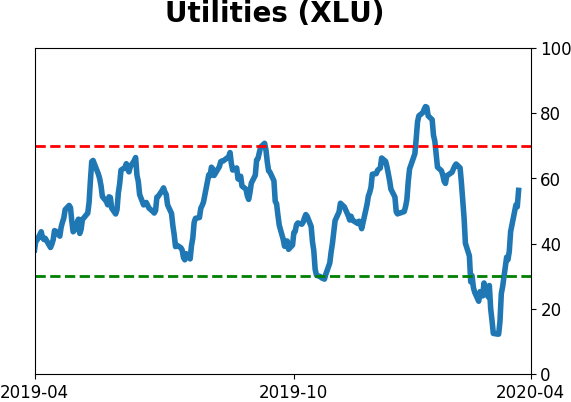
Sector ETF's - 10-Day Moving Average
|
|
|
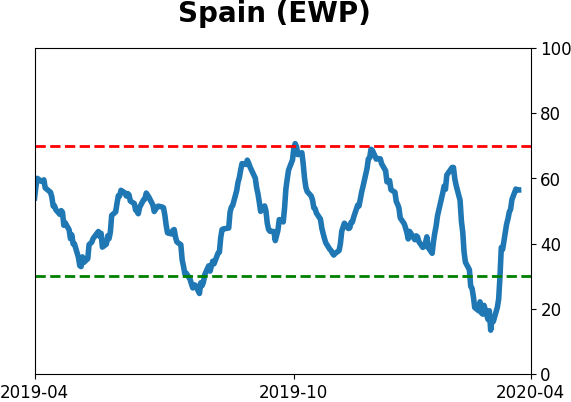
Country ETF's - 10-Day Moving Average
|
|
|
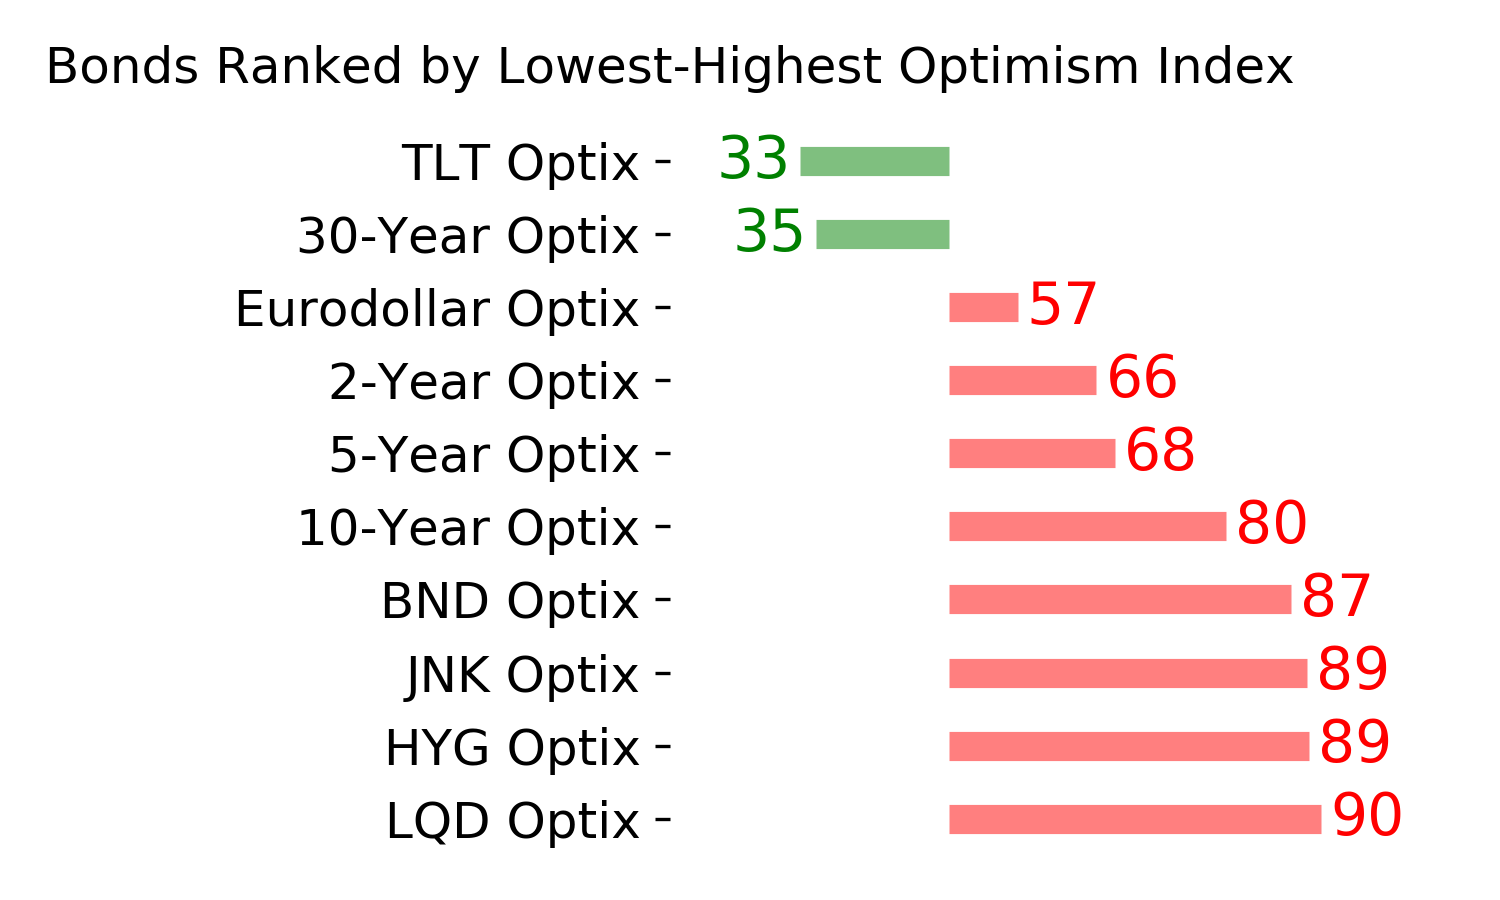
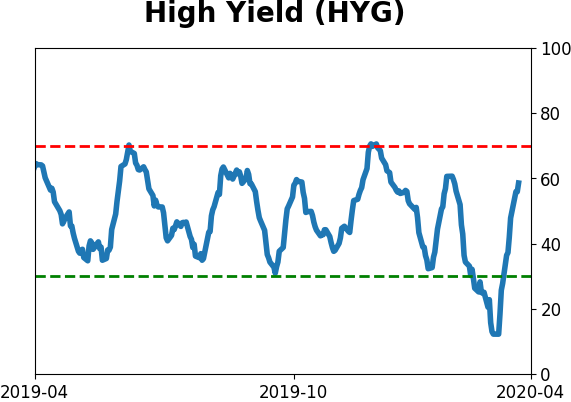
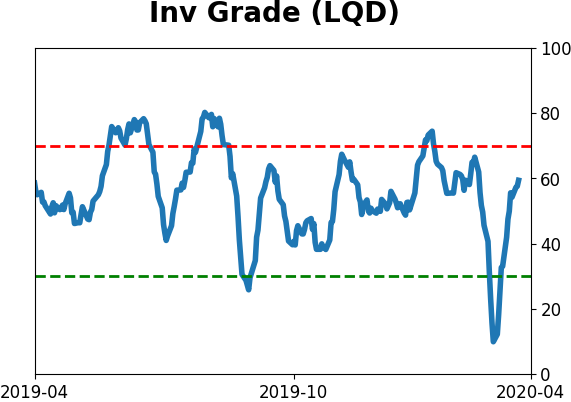
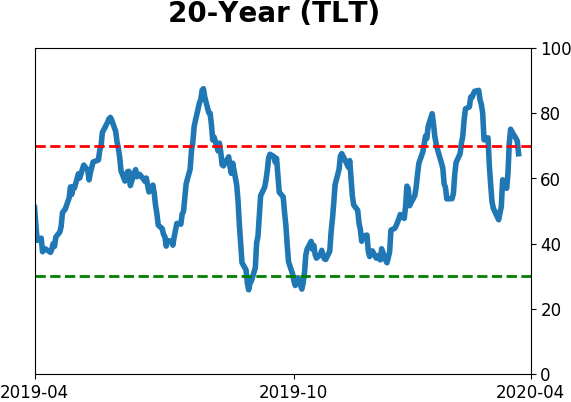
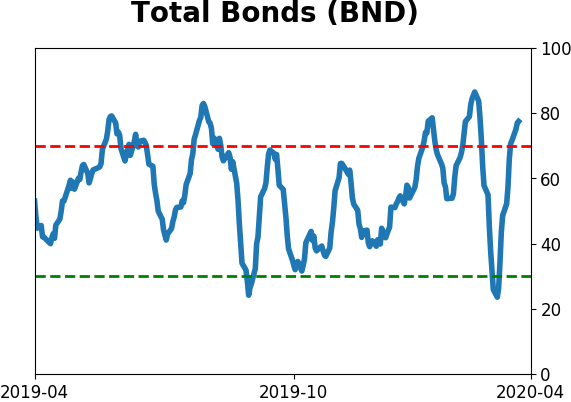
Bond ETF's - 10-Day Moving Average
|
|
|
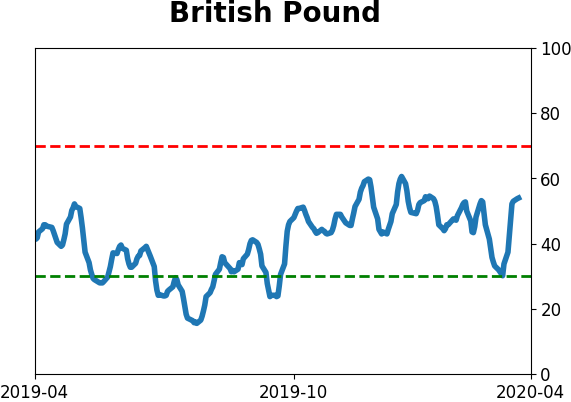
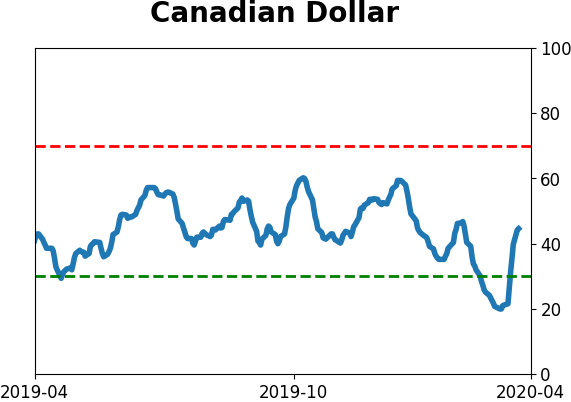
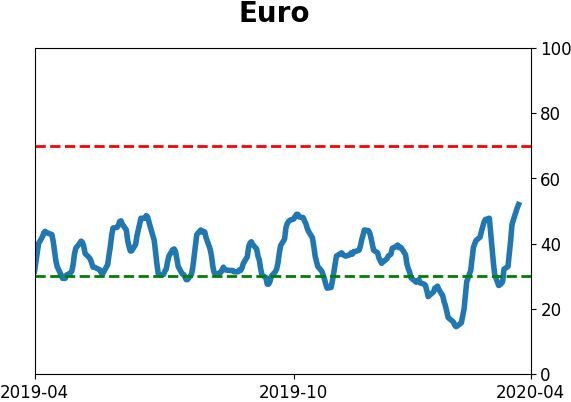
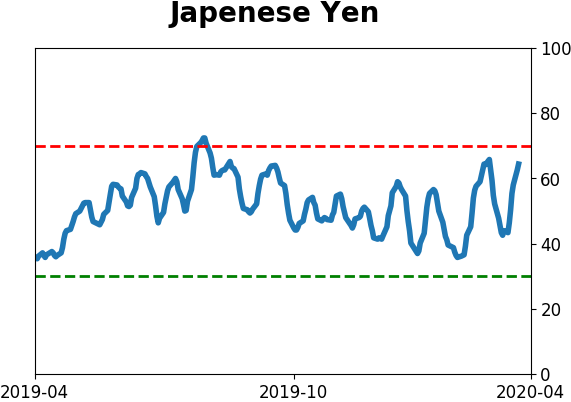
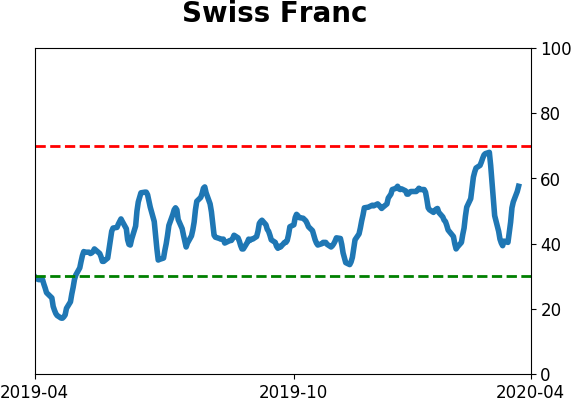
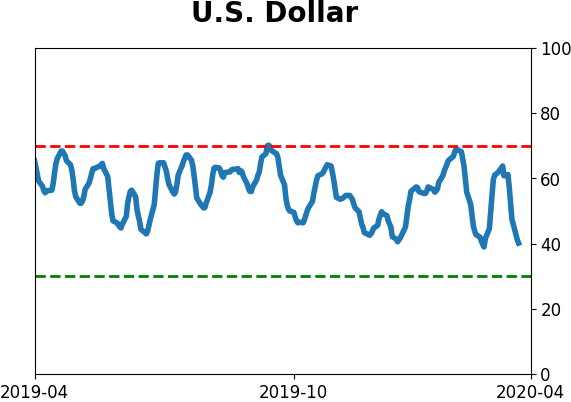
Currency ETF's - 5-Day Moving Average
|
|
|
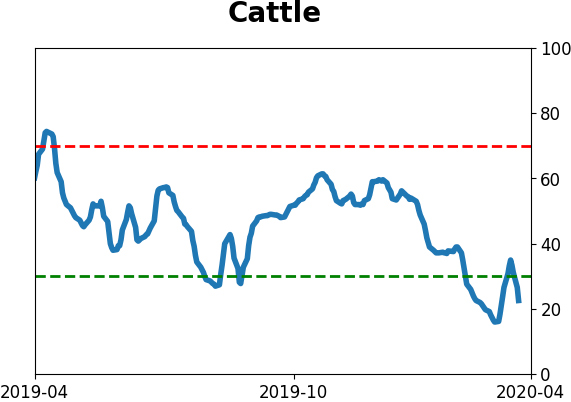
Commodity ETF's - 5-Day Moving Average
|
|