Headlines
|
|
It's the retracement that counts:
Buyers have continued to follow through, pushing stocks past the threshold that stops most bear market rallies. Through 11 trading days after the low, the S&P 500 has retraced more than 40% of its decline. In the past, rallies that went past this point were sustainable. The intraday reversal was not a good reason to sell.
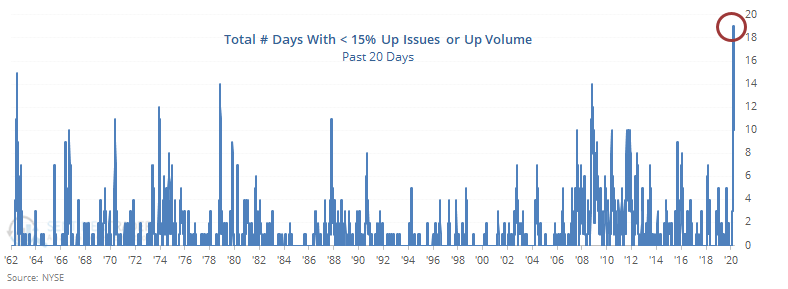
Buying interest has been historic:
In the past month, stocks have seen almost half the days enjoy some sort of buying thrust. The days have been skewed with extremely heavy activity in issues rising on the day. This comes after a surge in selling pressure, witnessed only a few times in 60 years.
|
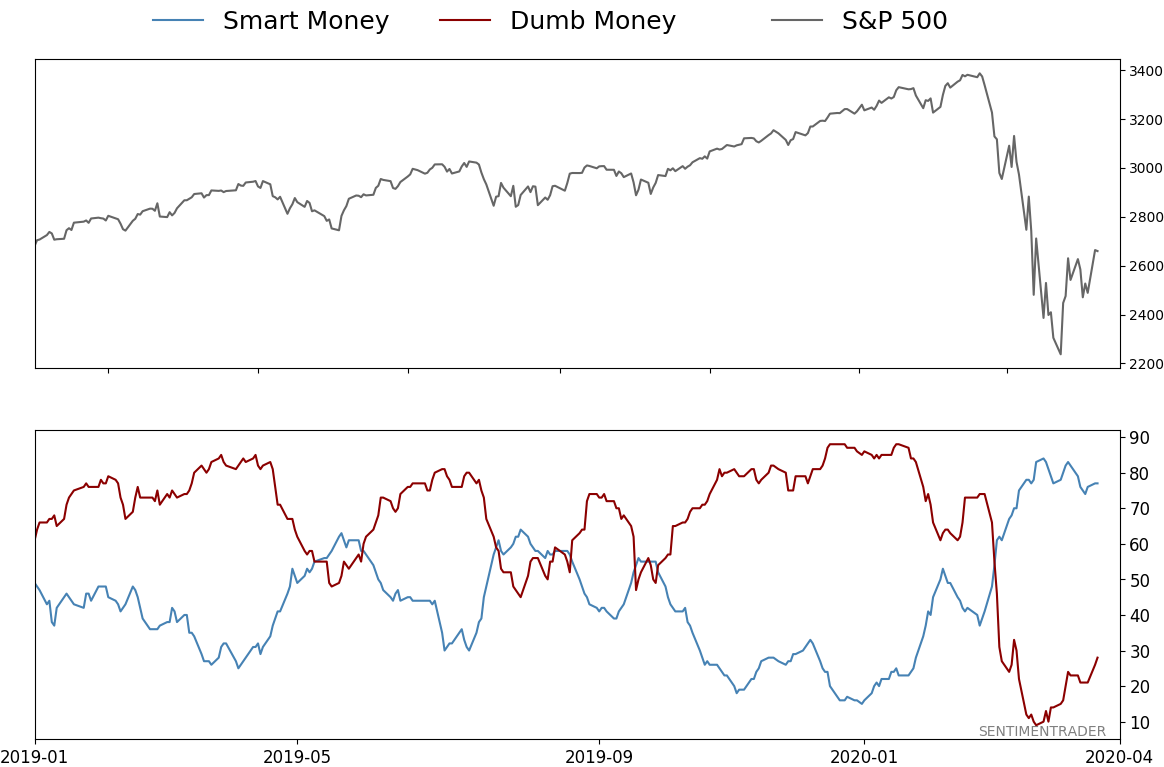
Smart / Dumb Money Confidence
|
Smart Money Confidence: 77%
Dumb Money Confidence: 28%
|
|
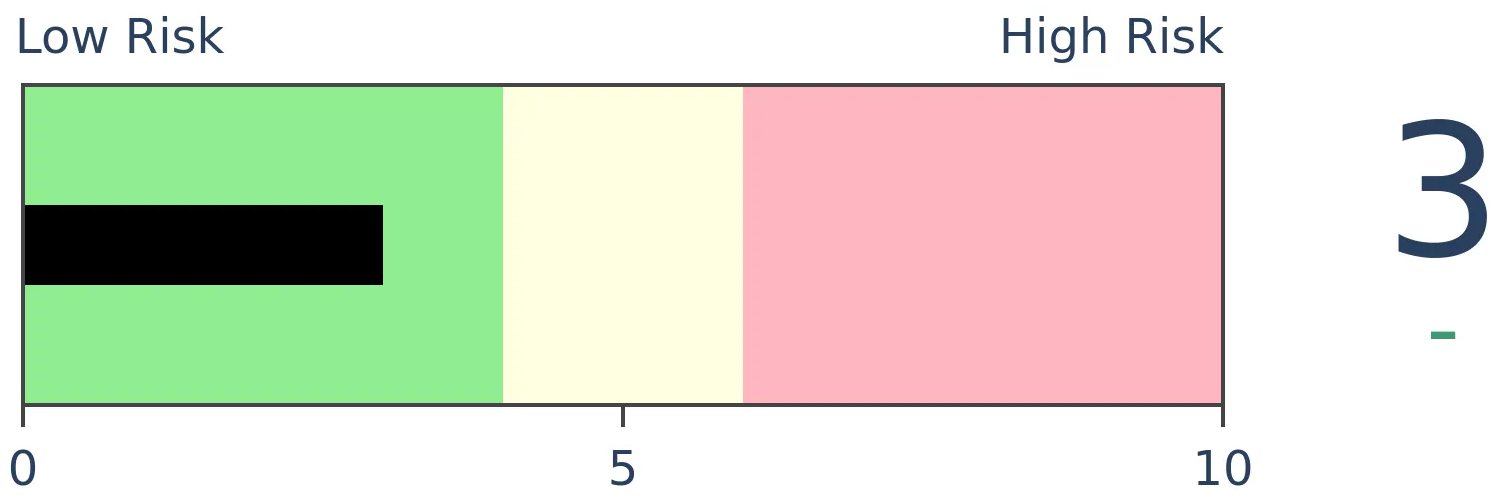
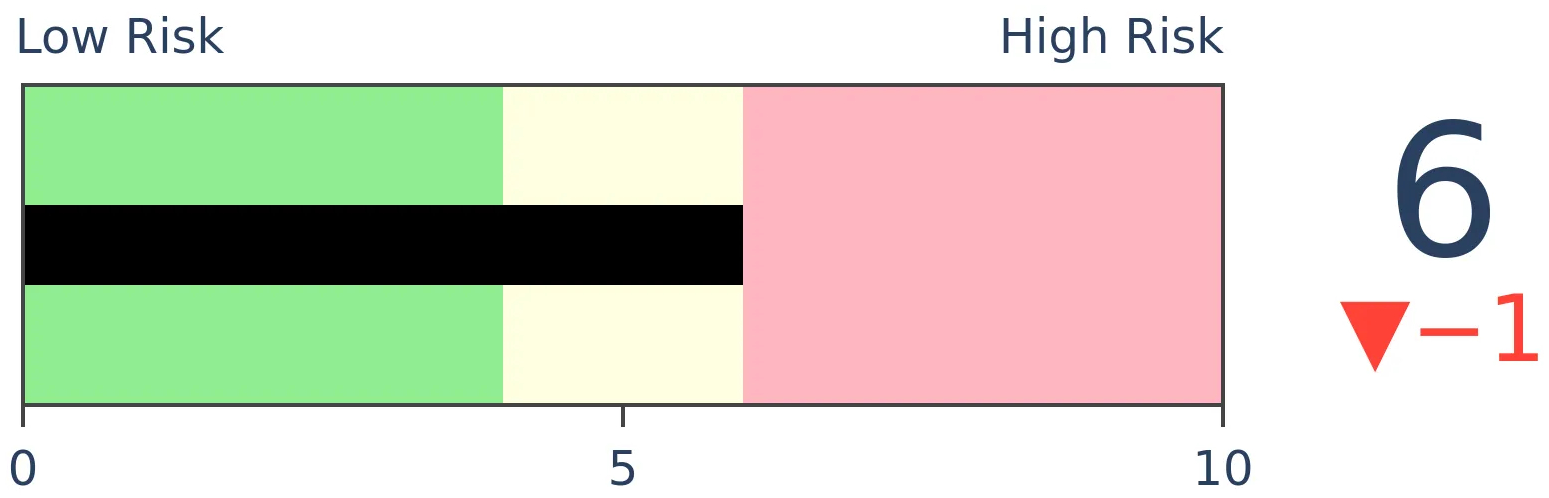
Risk Levels
Stocks Short-Term

|
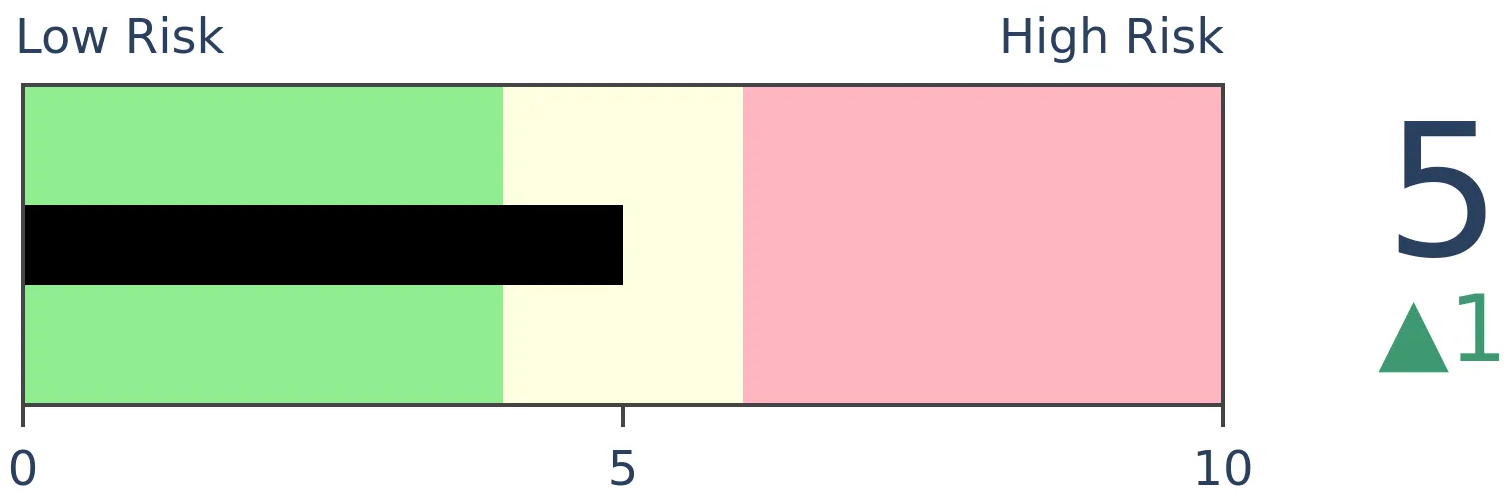
Stocks Medium-Term
|
|
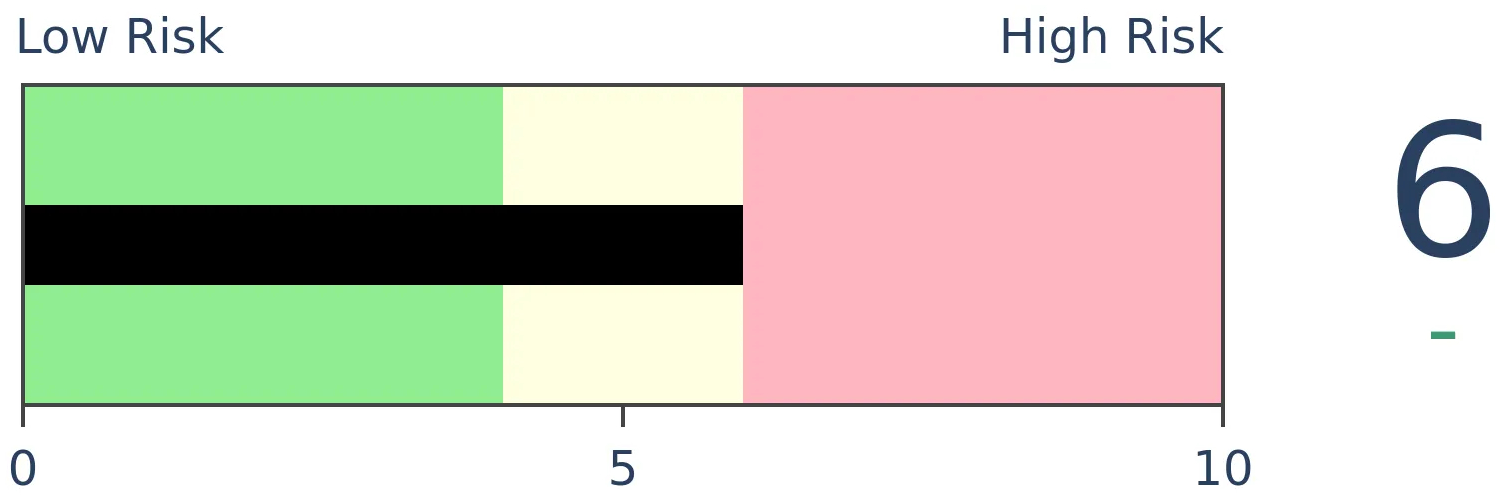
Bonds
|
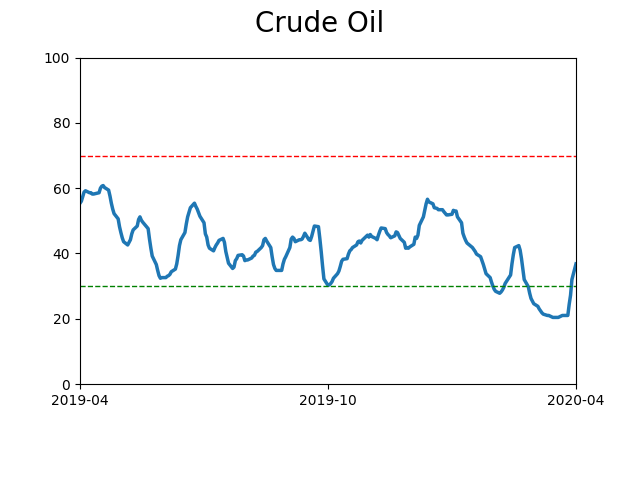
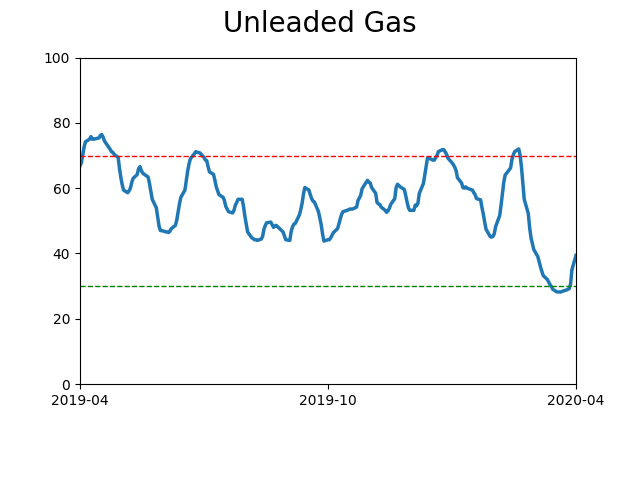
Crude Oil
|
|
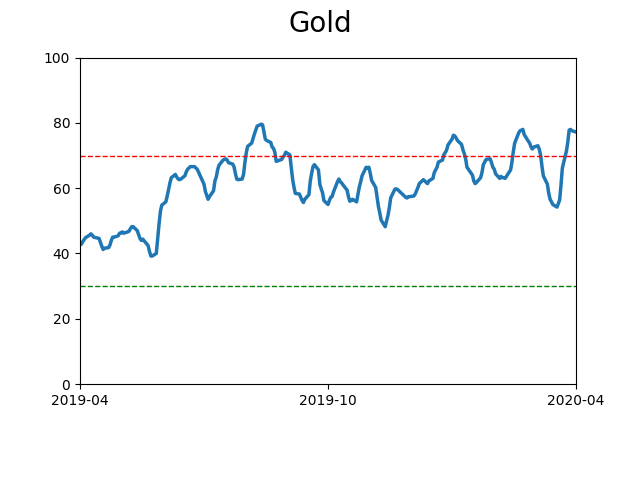
Gold
|
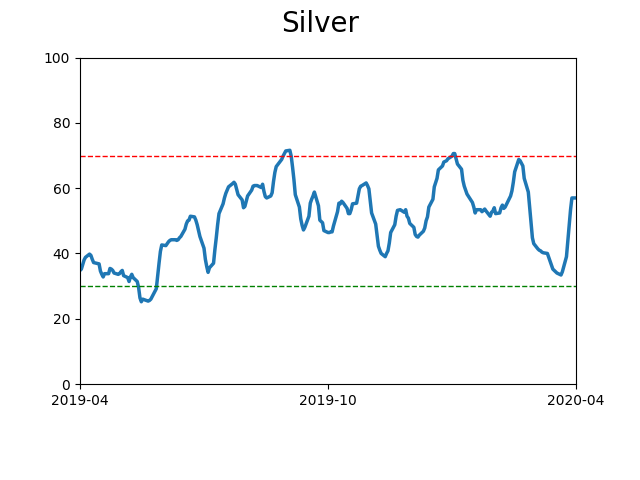
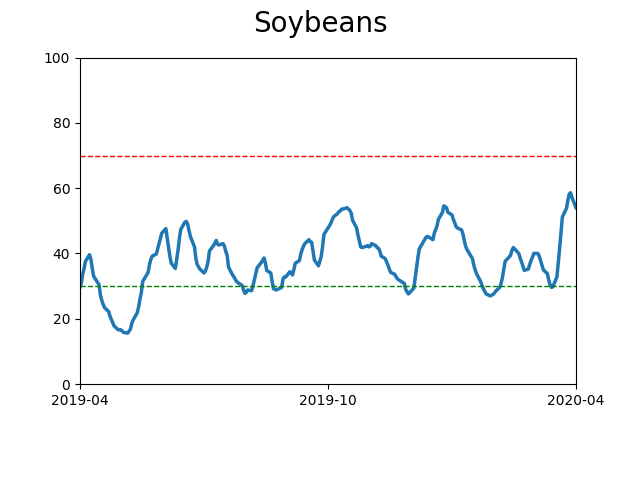
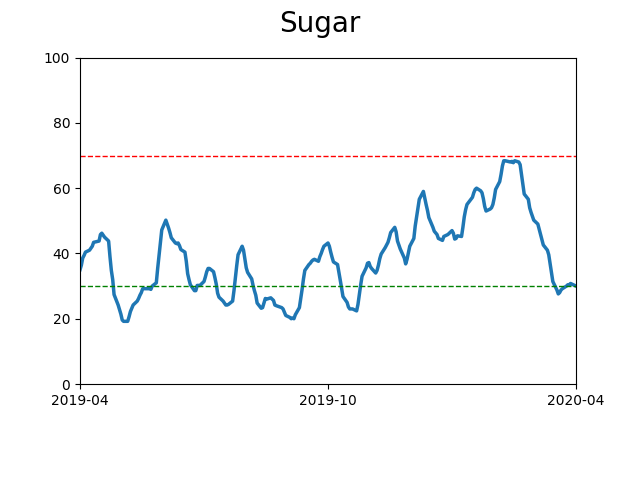
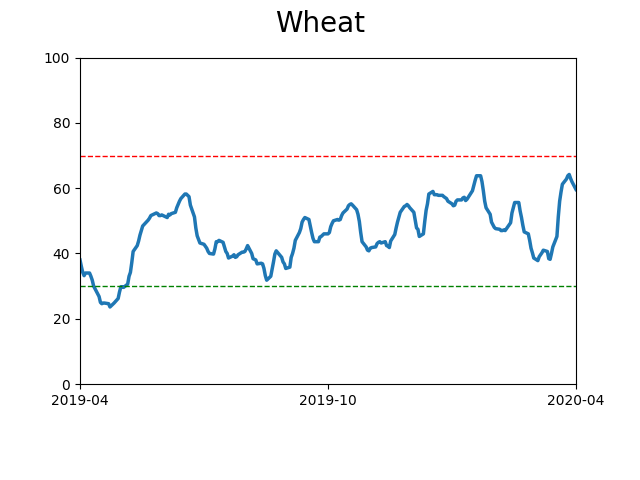
Agriculture

|
|
Research
BOTTOM LINE
Buyers have continued to follow through, pushing stocks past the threshold that stops most bear market rallies. Through 11 trading days after the low, the S&P 500 has retraced more than 40% of its decline. In the past, rallies that went past this point were sustainable. The intraday reversal was not a good reason to sell.
FORECAST / TIMEFRAME
SPY -- Up, Long-Term
|
One of the most popular knocks about the rally over the past couple of weeks is that it's "Just another bear market rally." There was an avalanche of notes about how the biggest rallies occur in bear markets. That's a given because volatility is higher during downtrends.
But since late March, we've touched a couple of times on the idea that this time is different. It wasn't just a 20% rally (or whatever), because that's not what matters. What matters is how much of the decline is made up during the rally.
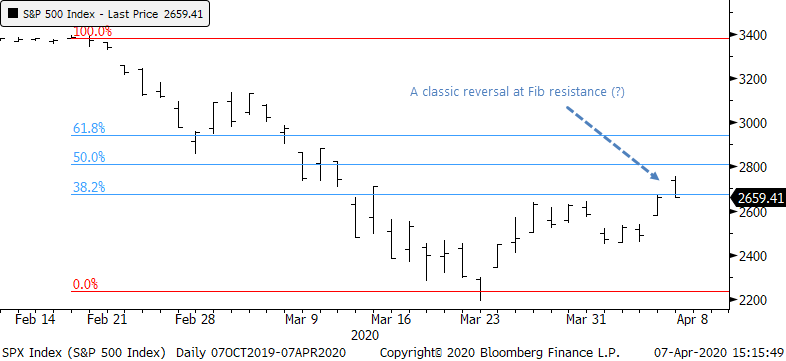
And this has been the most impressive recovery in history, even after Tuesday's intraday reversal. Classic technicians will be all over the idea that stocks suffered an intraday reversal at the "classic" 38.2% Fibonacci resistance level.
While it's common knowledge that stocks enjoyed multiple large rallies during prior bear markets, at no point during the rallies in the 1930s or 2008 did stocks manage to claw back as much of the losses as quickly as they've done this time. That's the kind of thing that can really help sentiment - if stocks rally 20% but that only claws back 20% of the drop, then it's not going to have much of an impact.
The S&P 500 bottomed 11 days ago. In that short span, it's retraced nearly 37% of its decline. Below, we can see every date since 1928 when the S&P fell to at least a 52-week low, then retraced at least a third of its decline after 11 days.
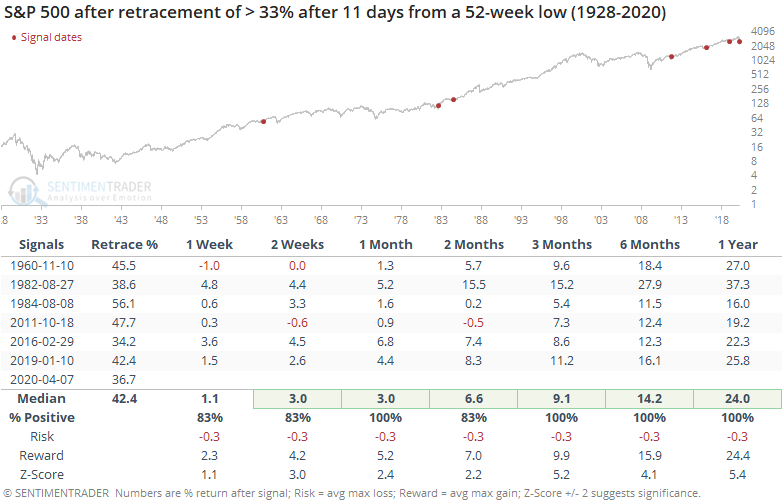
The impressive thing about this table is that none of them proved to be "Just a bear market rally." Compare that to times when stocks rallied for 11 days, sometimes for large gains, but didn't manage to retrace even 10% of the decline.
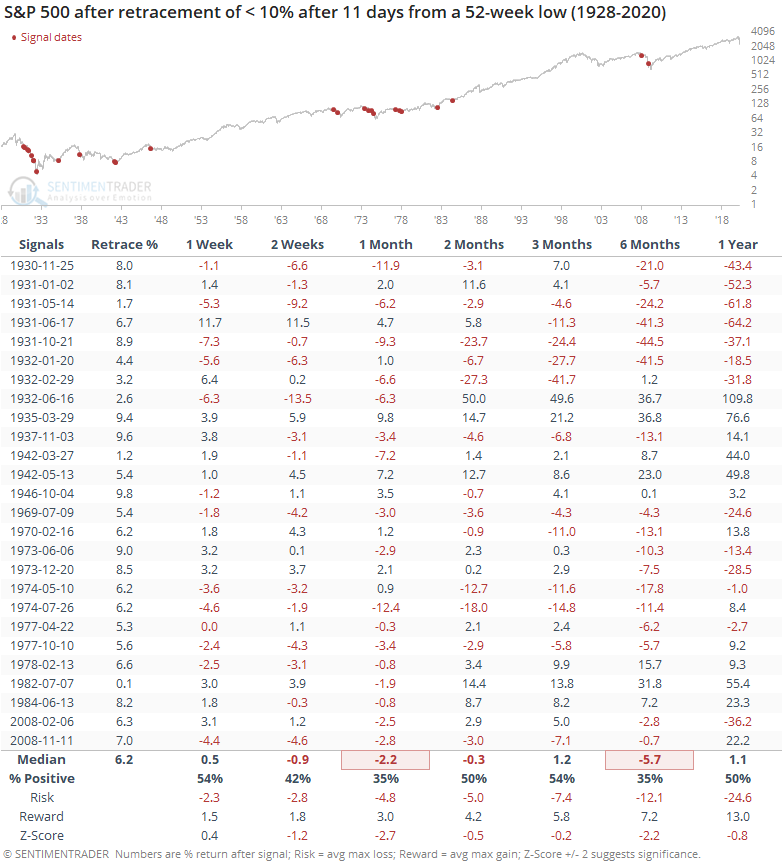
Some of these ended up being true bottoms, but most of the time, they ended up leading to lower lows. This is further confirmation of the idea that it's the retracement of a decline that can shift sentiment in a sustainable way, not just big gains.
Before the intraday reversal on Tuesday, the S&P was on track for an even more impressive retracement, obviously.
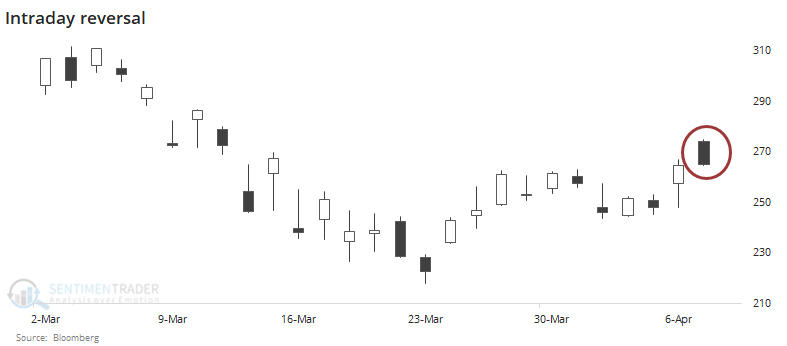
That selling pressure looks nasty on a chart, but does it matter? Below, we can see every time in the history of SPY when it:
- Was trading below its 200-day average
- Gapped up at least 2% at the open
- Rallied to at least a 10-day high
- Reversed enough to close in the bottom 30% of its intraday range.
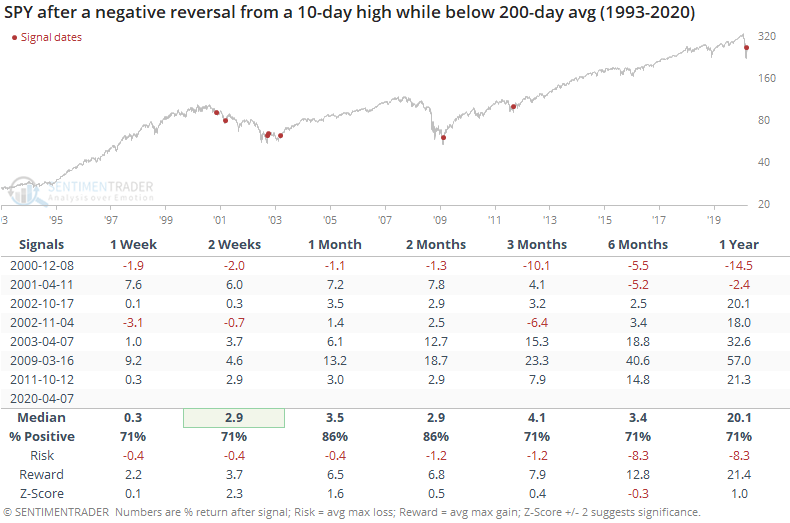
Like we see so often with chart patterns that look obvious, the actual outcome is a lot different than most expect. It seems like it should be a negative, but it has not been a reliable reason to sell.
BOTTOM LINE
In the past month, stocks have seen almost half the days enjoy some sort of buying thrust. The days have been skewed with extremely heavy activity in issues rising on the day. This comes after a surge in selling pressure, witnessed only a few times in 60 years.
FORECAST / TIMEFRAME
SPY -- Up, Long-Term
|
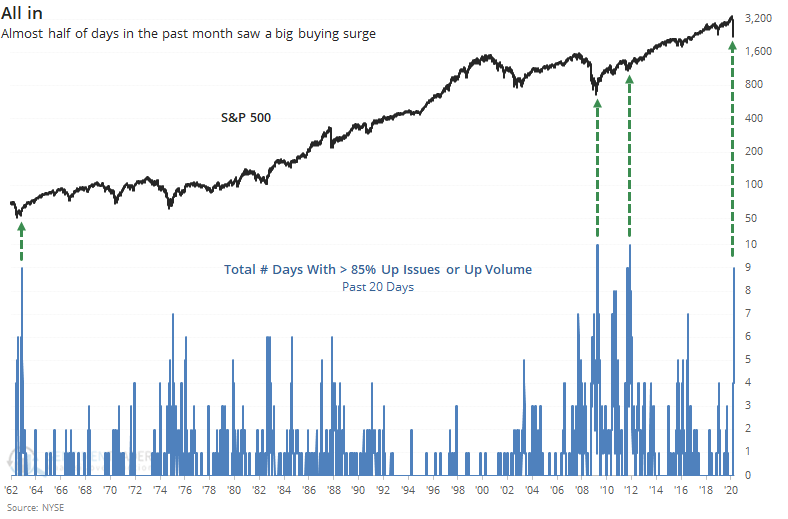
Over the past month, there have been a large number of sessions that have seen impressive buying pressure. Whether what we've seen constitutes a breadth thrust is open to interpretation, but Monday's session added to the idea that we have.
During the past 20 sessions, almost half of them have seen the NYSE Up Issues or Up Volume ratios surge above 85%. If both occur on the same day, both are counted because that's an especially strong signal.
There haven't been many stretches in the past 60 years with such heavy and concentrated buying pressure. This is being calculated before the close on Tuesday, but it's on track to trigger again and would push the current thrust to at least a tie for the most all-time.
The sample size is tiny, but 3 of the 4 saw some give-back over the next week or so, then resumed the upward surge.
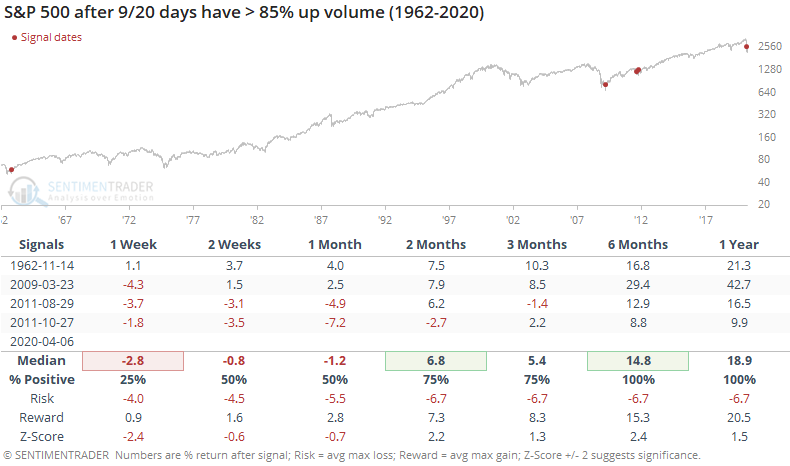
Of course, there have also been a large number of days with extremely heavy selling pressure. A record number, actually.
The key is that these heavy buying days have triggered after the surge of heavy selling days already peaked. If we look for times when there were lesser extremes, but with a surge in selling pressure days followed by a surge in buying pressure, then we get the following.
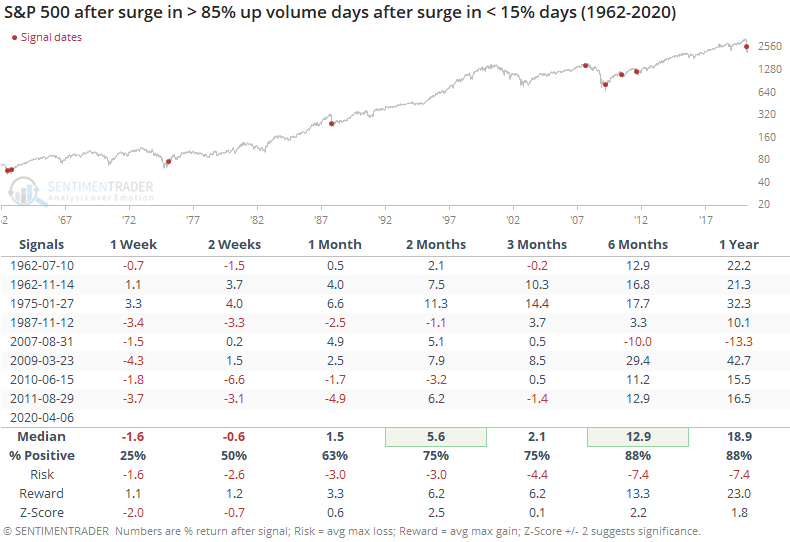
By definition, the table above shows returns after there had already been a surge in buying pressure and a rebound in stocks. Even so, forward returns ere very positive after the first week or two of volatility. The only real failure was in August 2007, which still showed medium-term returns, and that was one of the weaker thrusts in the whole table.
On March 25 and again March 26, we looked at the importance of the historic buying pressure flooding into stocks. It might not meet the definition of a "buying thrust" but those definitions assume that there are rules when it comes to technical or fundamental analysis. There are not. When we consider the implications of what happened, and the context in which it happened, it bodes well for future returns.
Active Studies
| Time Frame | Bullish | Bearish | | Short-Term | 0 | 0 | | Medium-Term | 11 | 0 | | Long-Term | 27 | 3 |
|
Indicators at Extremes
Portfolio
| Position | Weight % | Added / Reduced | Date | | Stocks | 73.2 | Added 31.3% | 2020-03-17 | | Bonds | 0.0 | Reduced 6.7% | 2020-02-28 | | Commodities | 5.5 | Added 2.4%
| 2020-02-28 | | Precious Metals | 0.0 | Reduced 3.6% | 2020-02-28 | | Special Situations | 0.0 | Reduced 31.9% | 2020-03-17 | | Cash | 21.3 | | |
|
Updates (Changes made today are underlined)
In the first months of the year, we saw manic trading activity. From big jumps in specific stocks to historic highs in retail trading activity to record highs in household confidence to almost unbelievable confidence among options traders. All of that has come amid a market where the average stock can’t keep up with their indexes. There were signs of waning momentum in stocks underlying the major averages, which started triggering technical warning signs in late January. The kinds of extremes we saw in December and January typically take months to wear away, but the type of selling we’ve seen over the past month has gone a long way toward getting there. When we place the kind of moves we saw into March 23 into the context of coming off an all-time high, there has been a high probability of a multi-month rebound. The volatility we’ve seen lately is extremely compelling from a medium-term point of view. Virtually everything we’ve looked at suggests a strong probability of gains over the next several months, even within the context of a potential bear market, and even from what had been higher prices. After stocks bottomed on the 23rd, they enjoyed a historic buying thrust. While other signs are mixed at best that panic is subsiding, that thrust is one of the most encouraging sign we've seen in years. There is often a test of a panic low in the weeks after an initial recovery, but that thrust we saw, combined with the larger-than-usual retracement, have me less convinced a test is necessary. For now, I see no overwhelming reason to add or reduce exposure.
RETURN YTD: -14.2% 2019: 12.6%, 2018: 0.6%, 2017: 3.8%, 2016: 17.1%, 2015: 9.2%, 2014: 14.5%, 2013: 2.2%, 2012: 10.8%, 2011: 16.5%, 2010: 15.3%, 2009: 23.9%, 2008: 16.2%, 2007: 7.8%
|
|
Phase Table
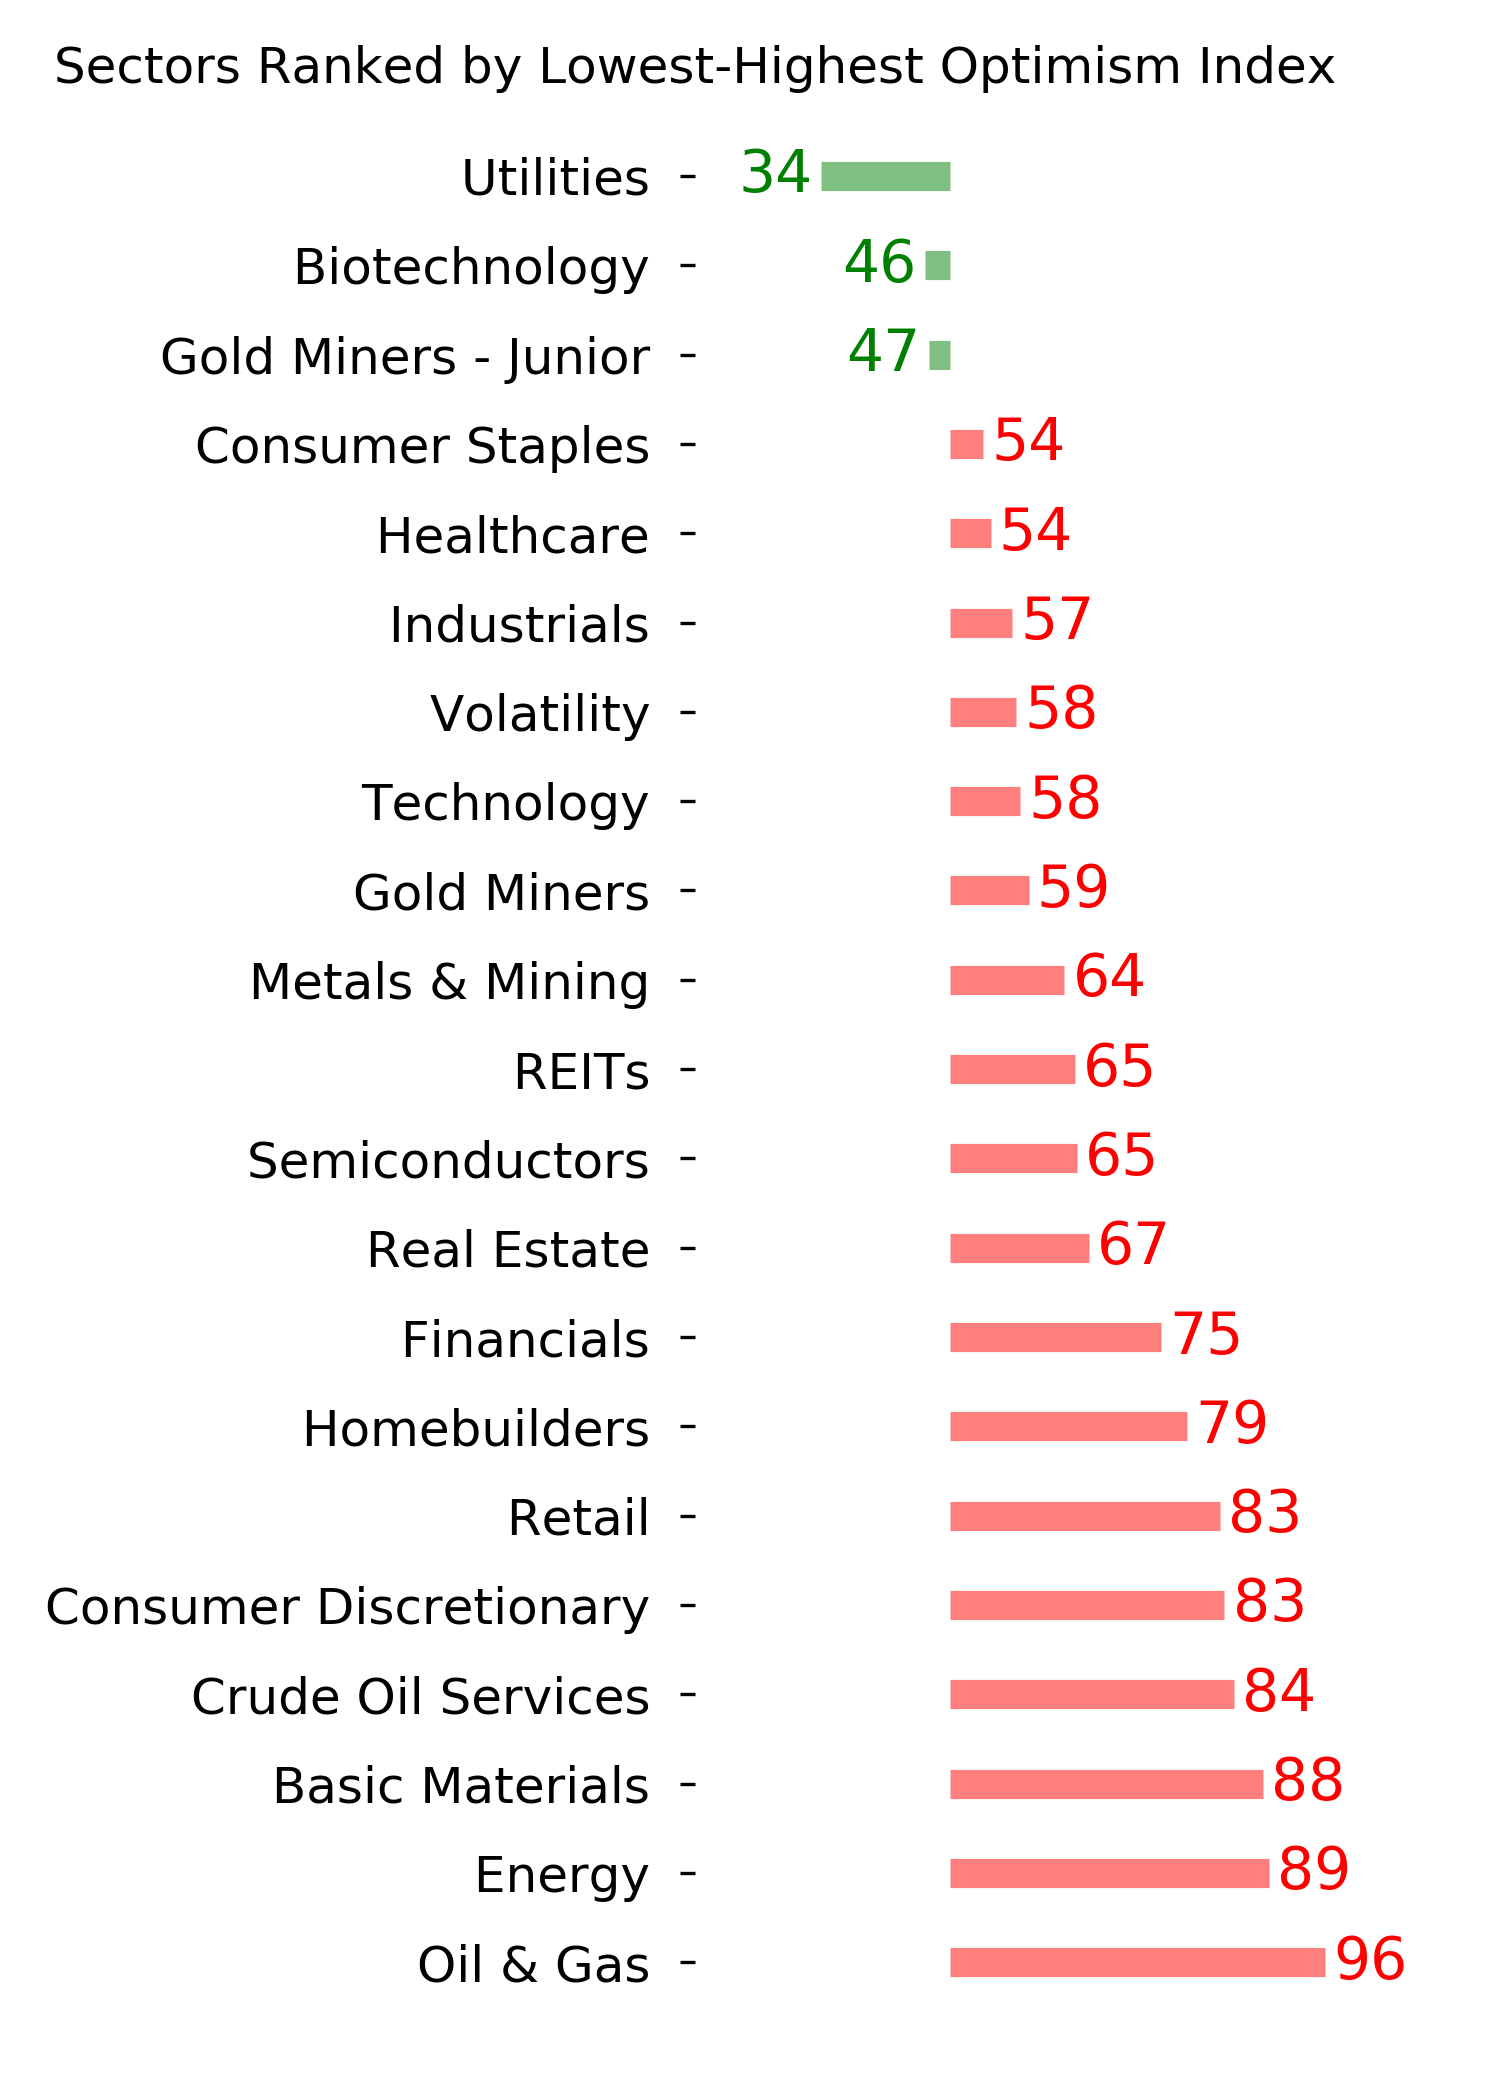
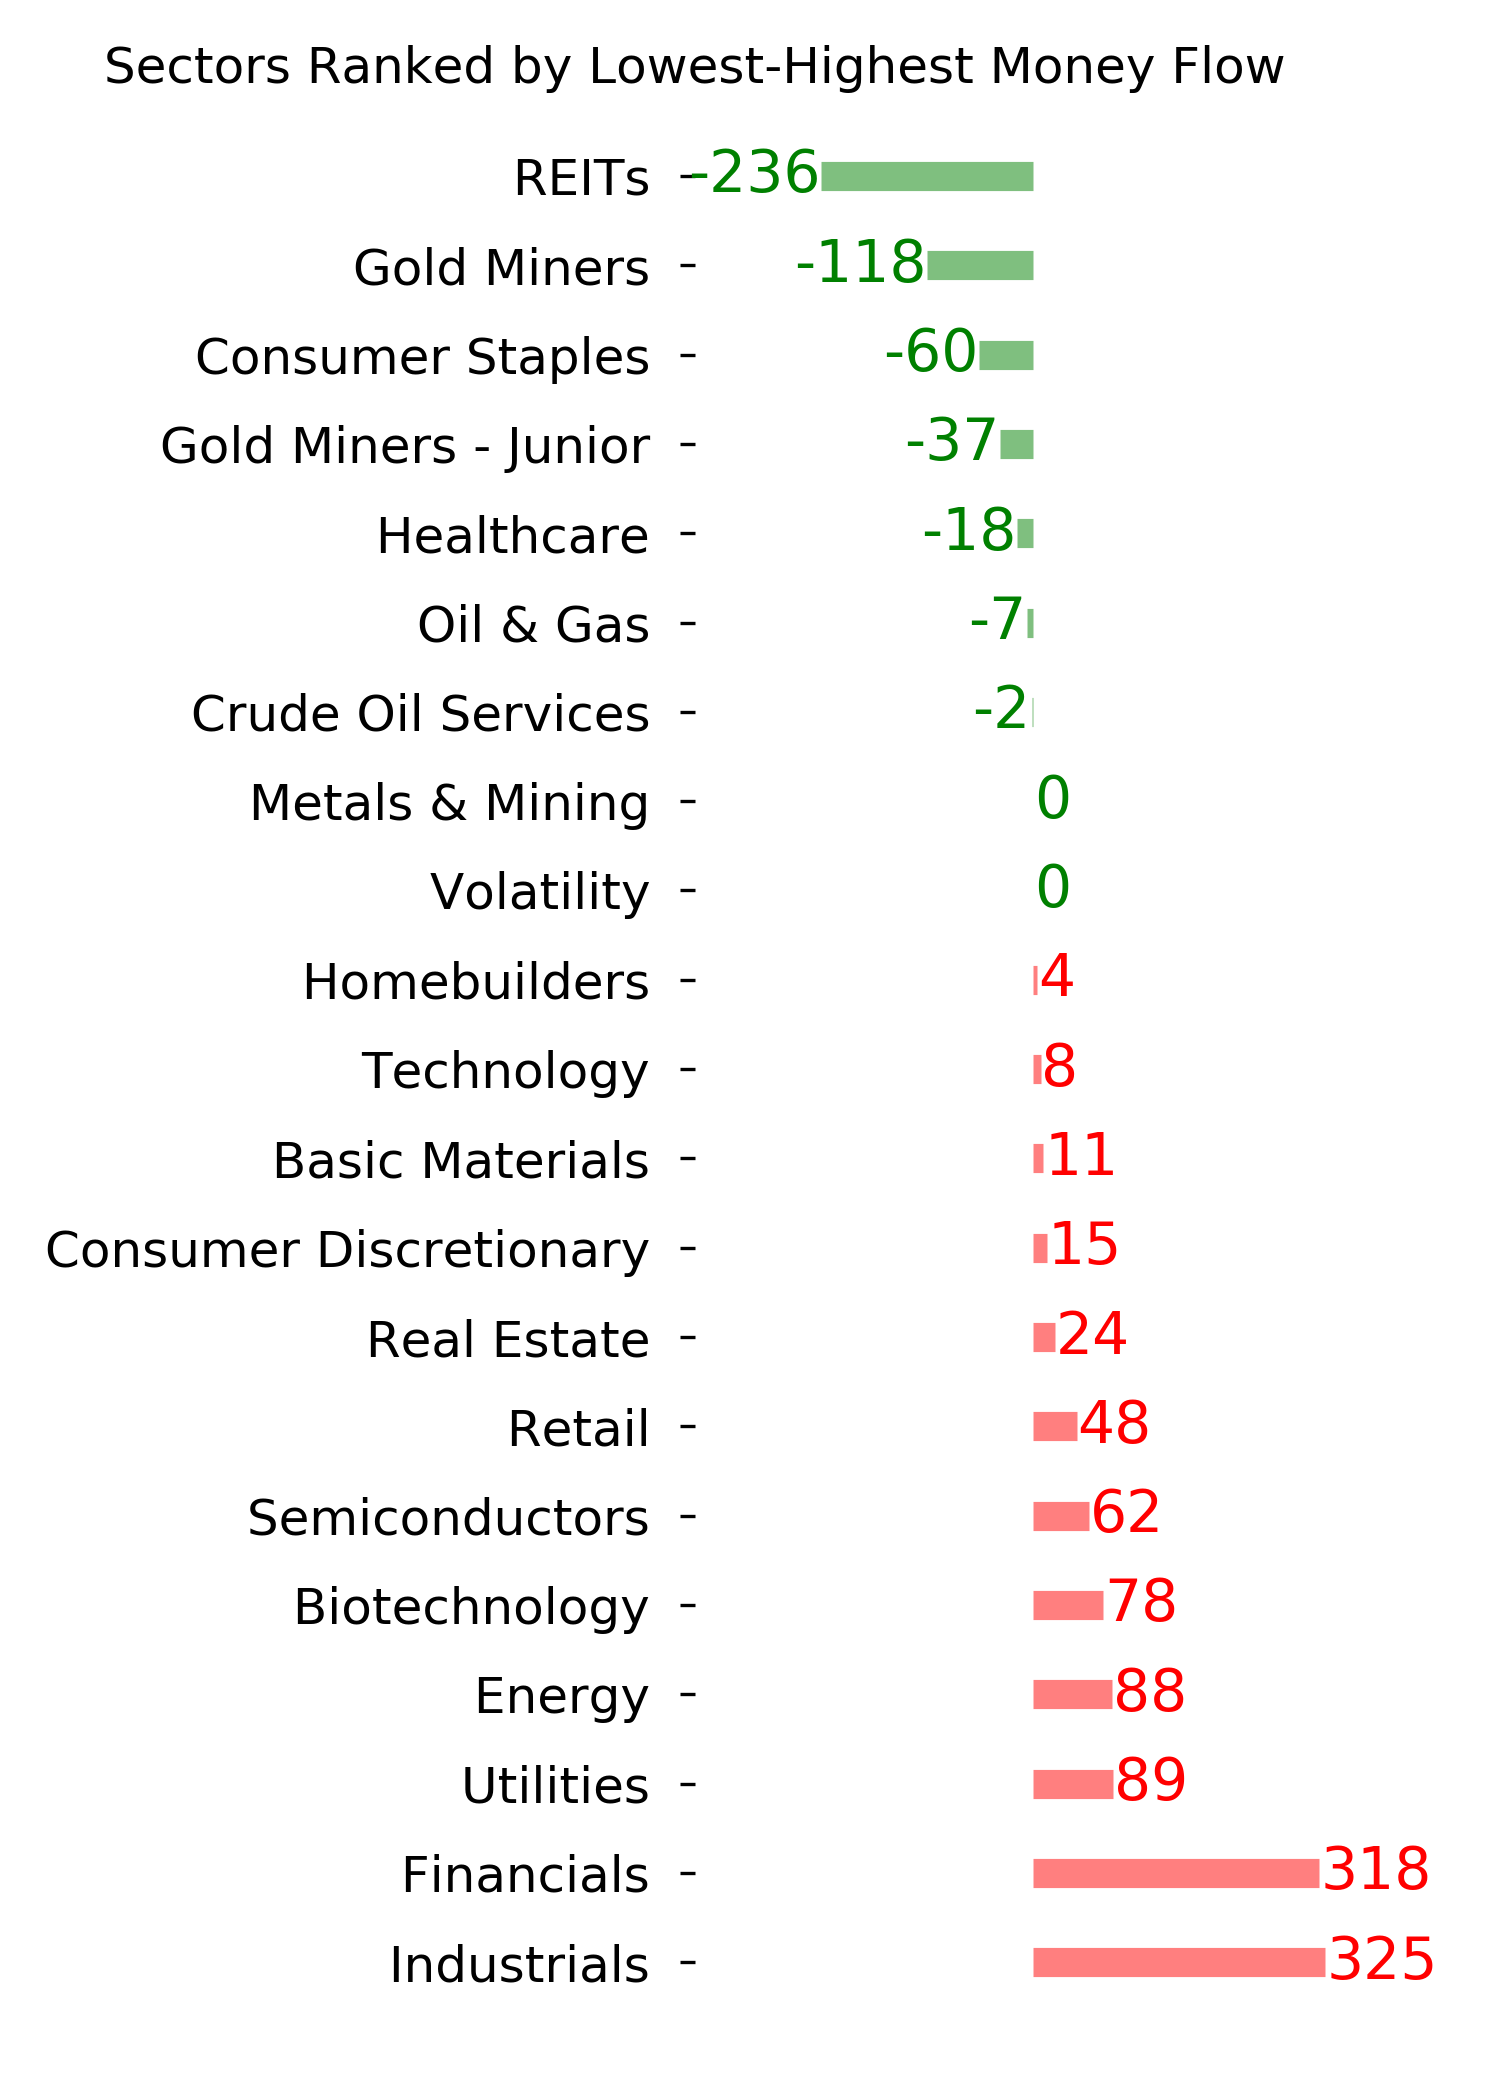
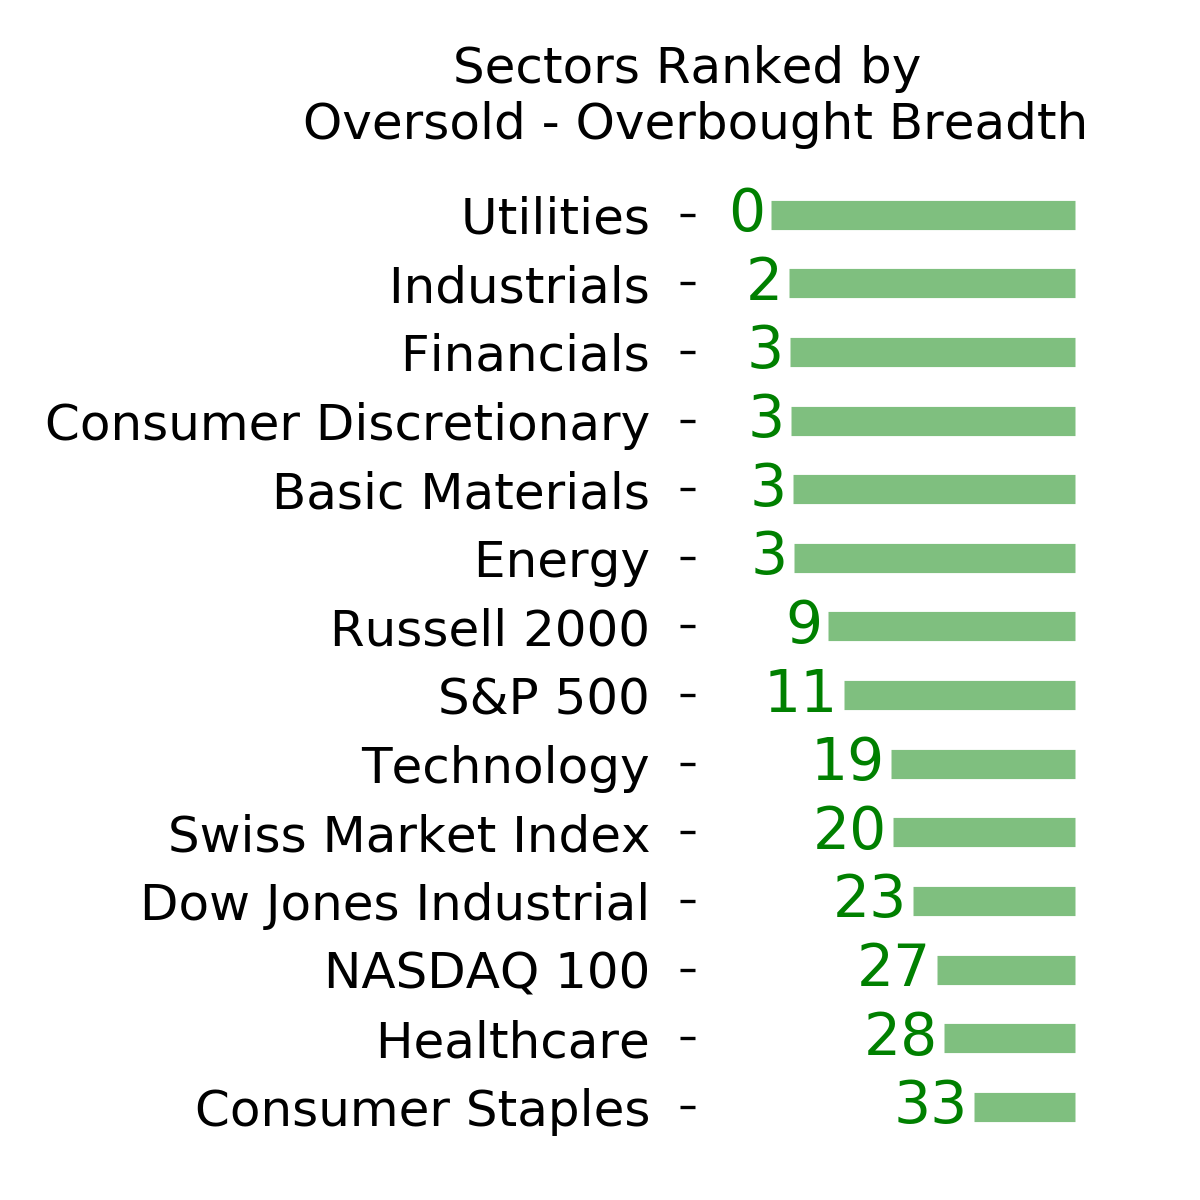
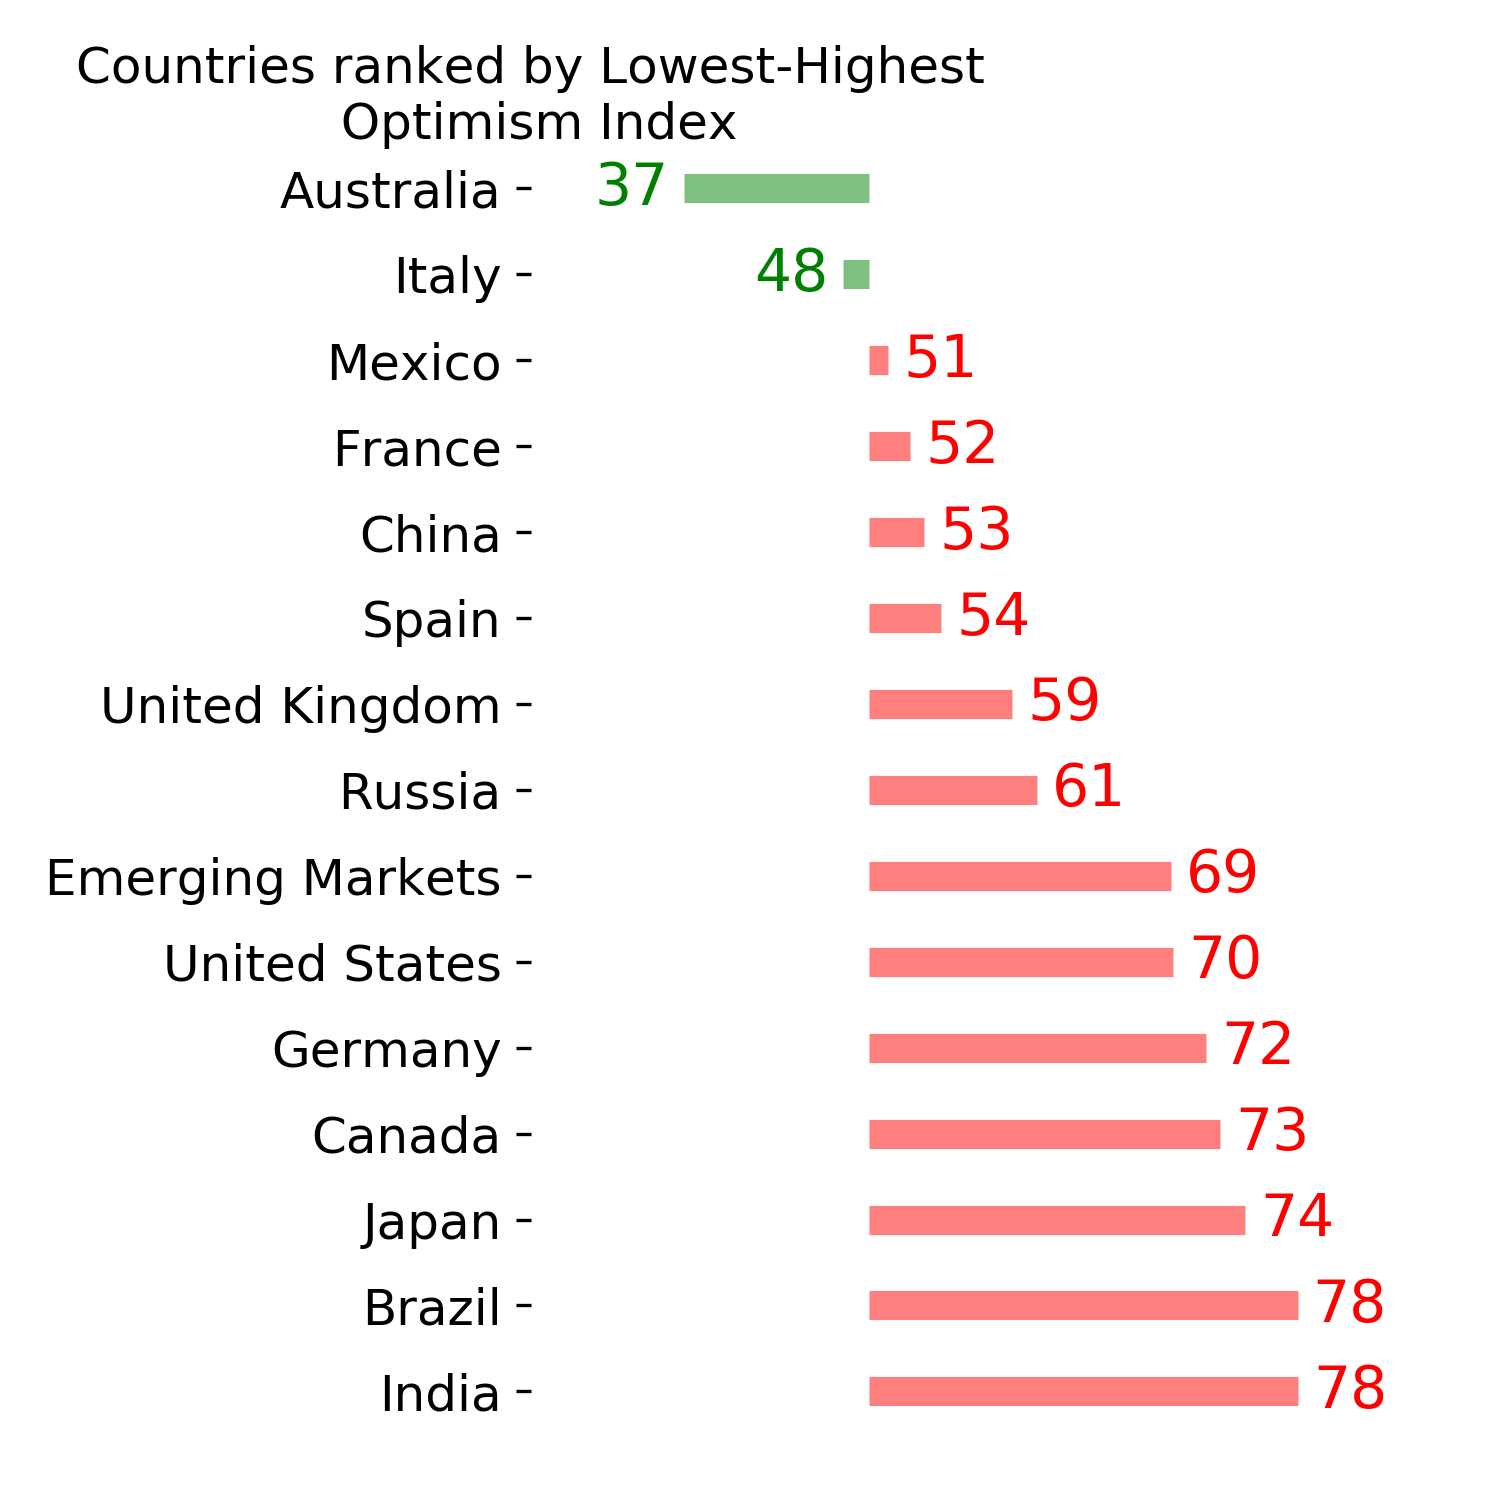
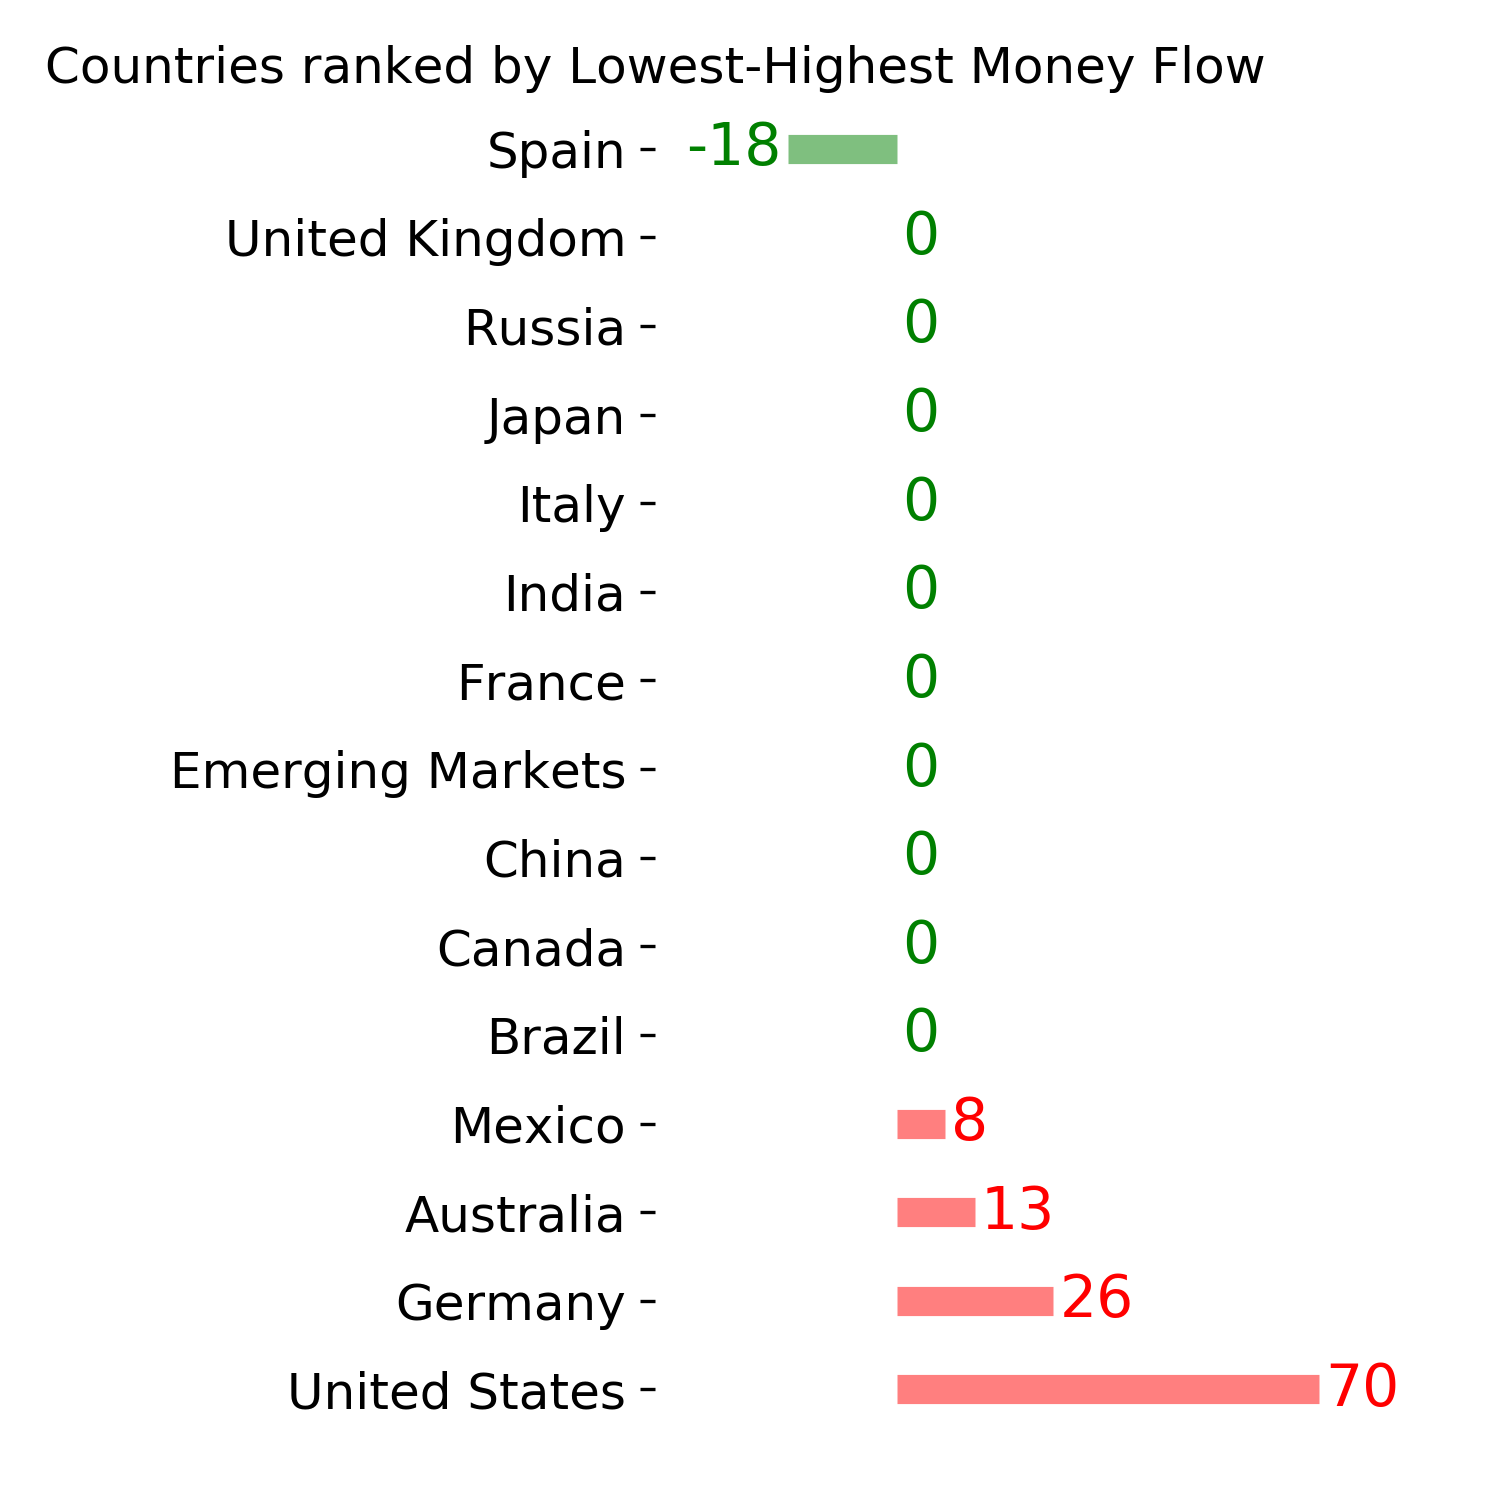
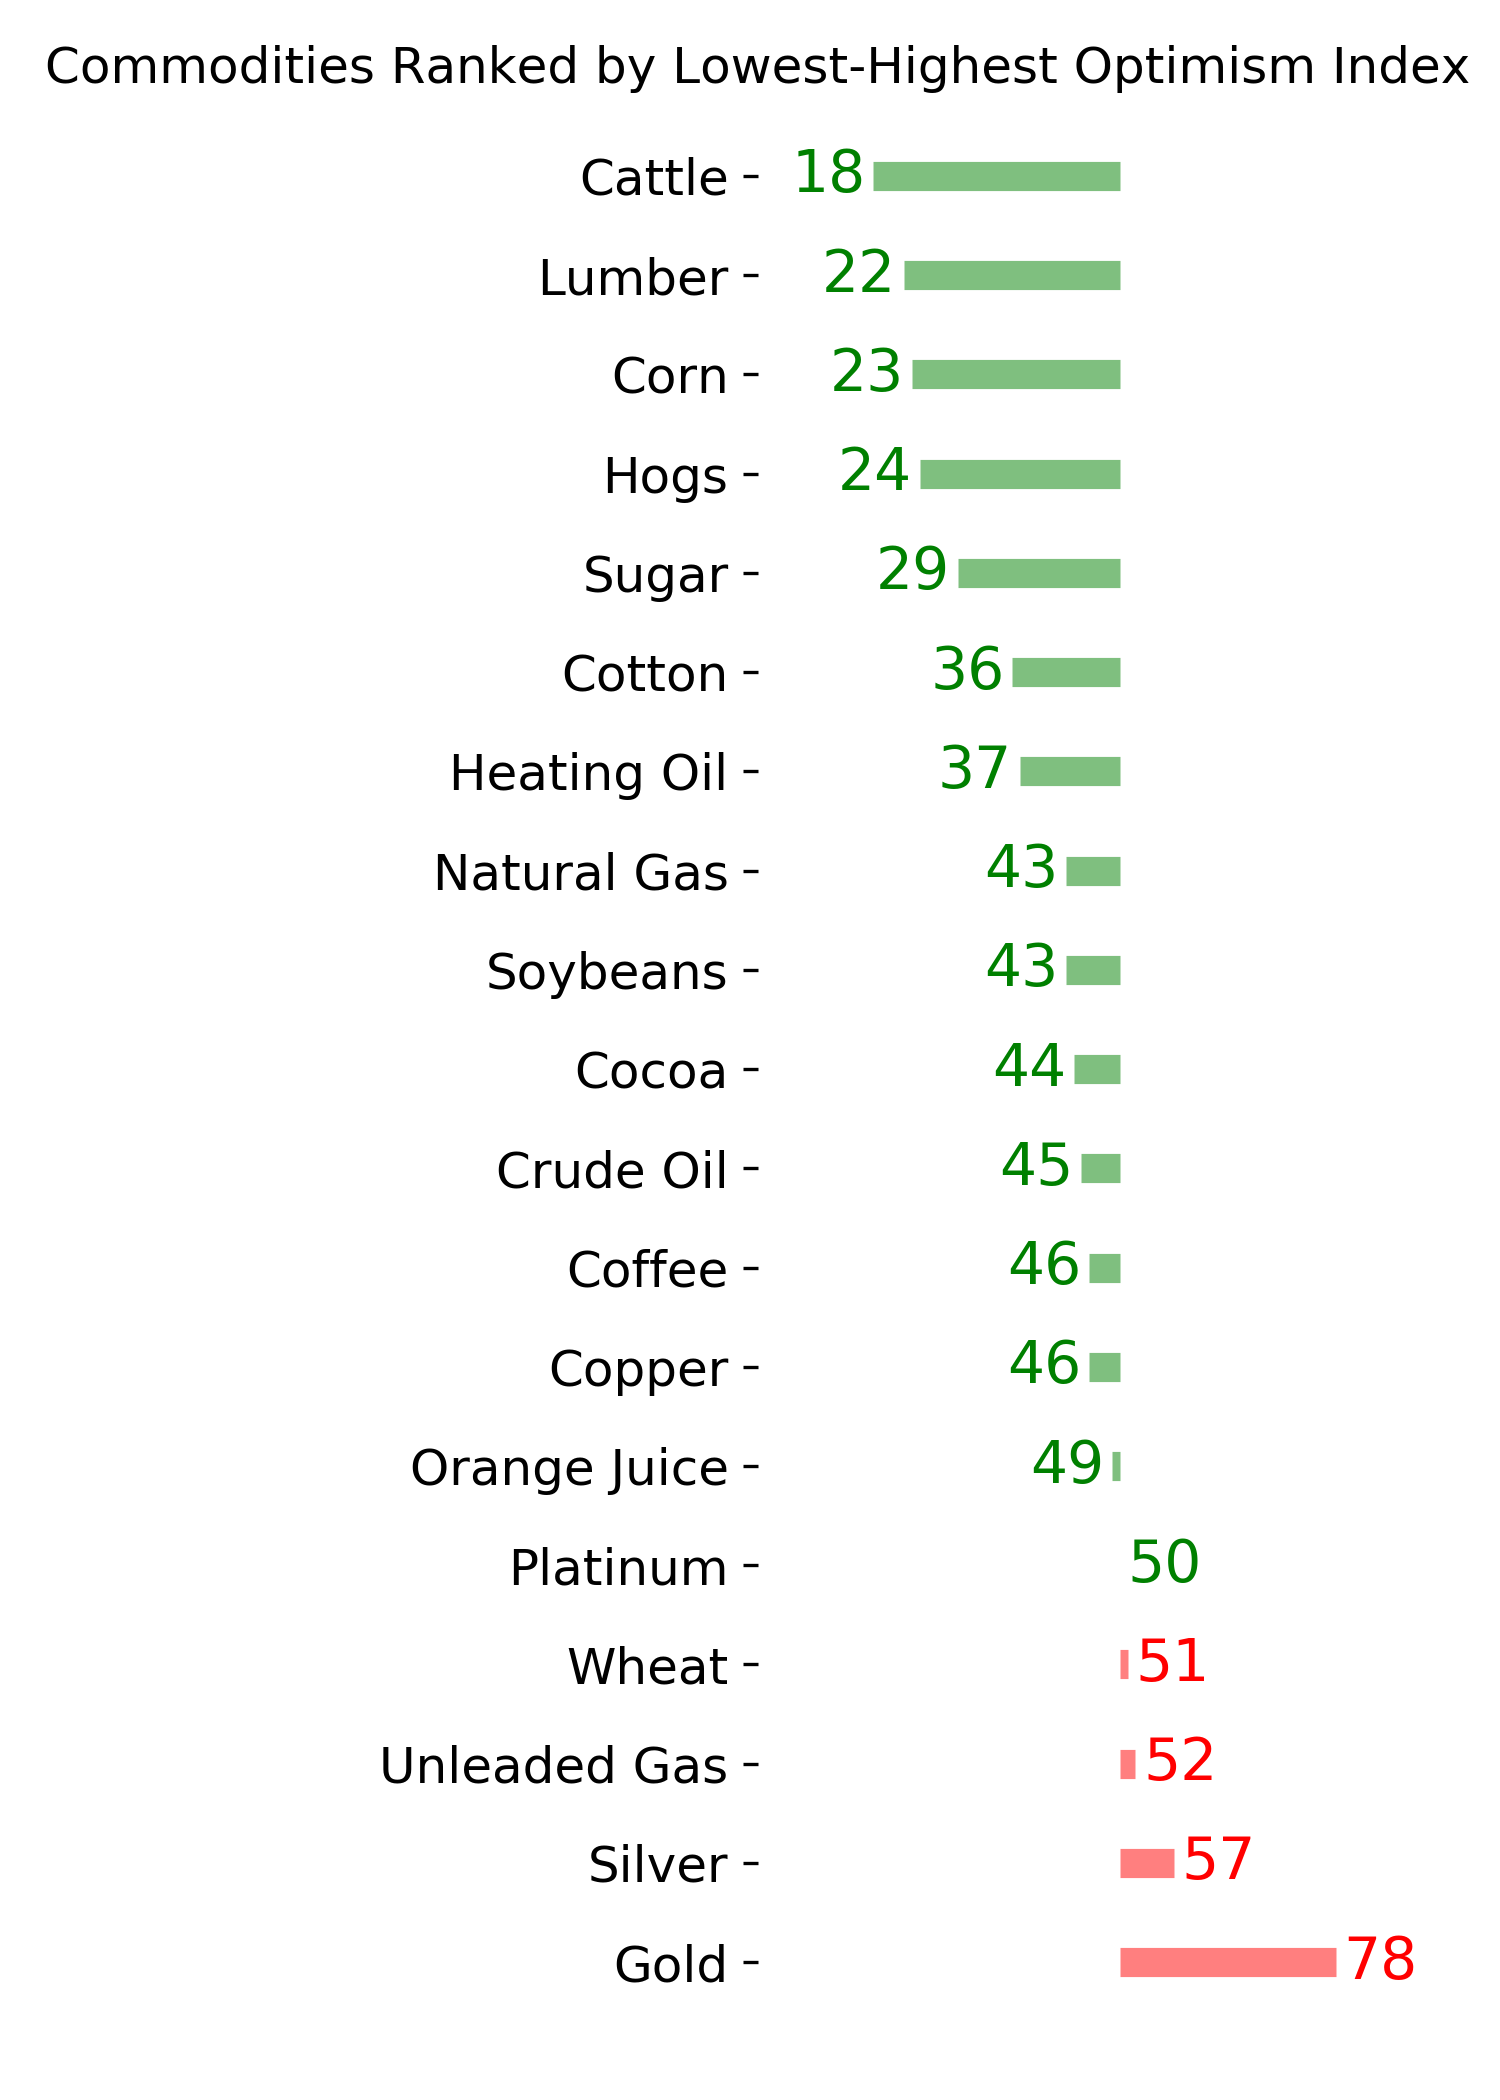
Ranks
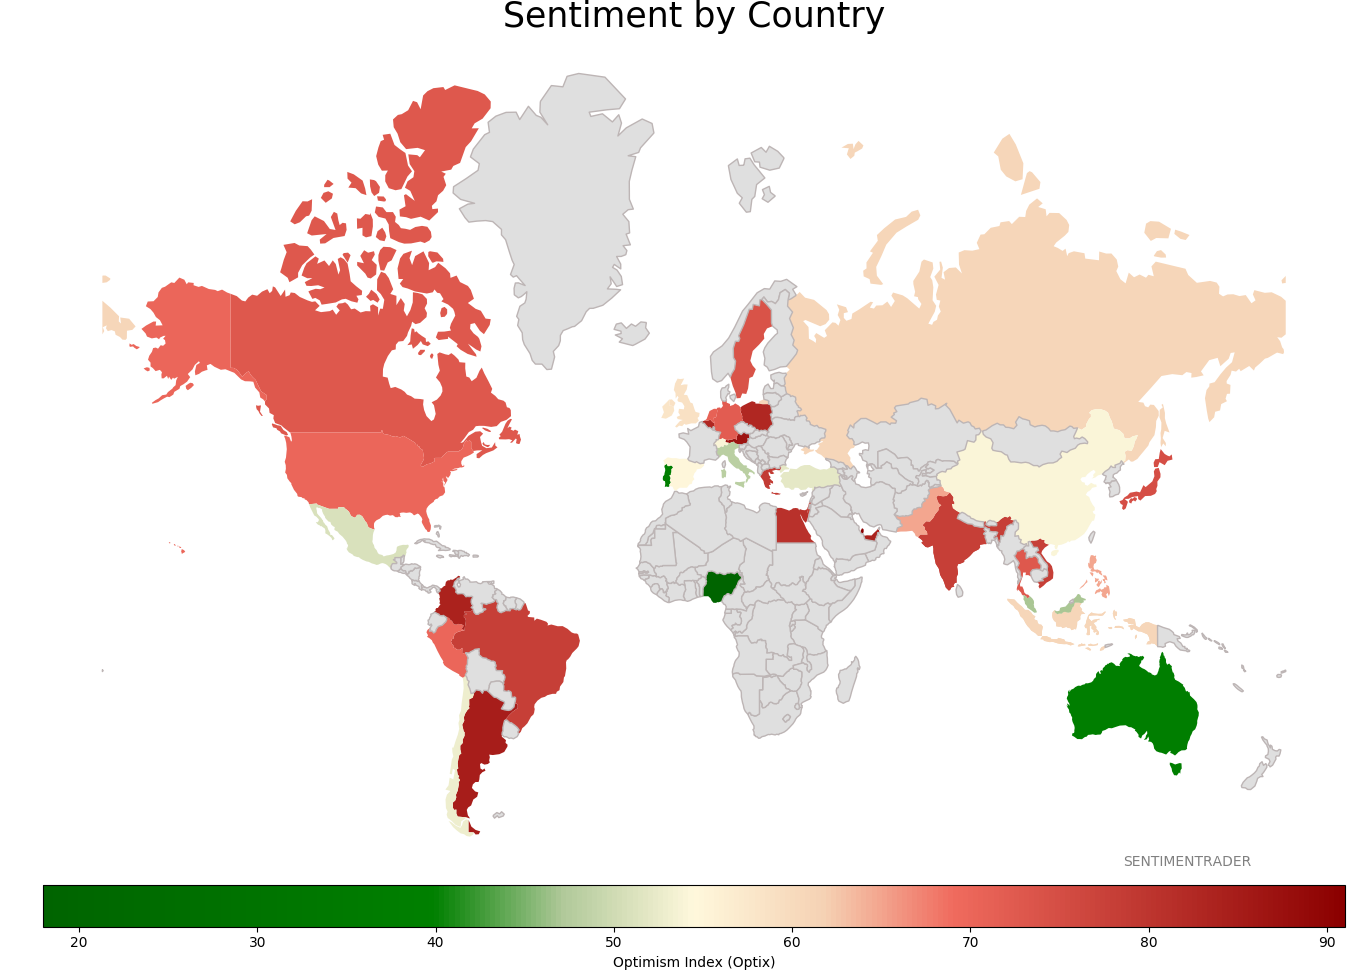
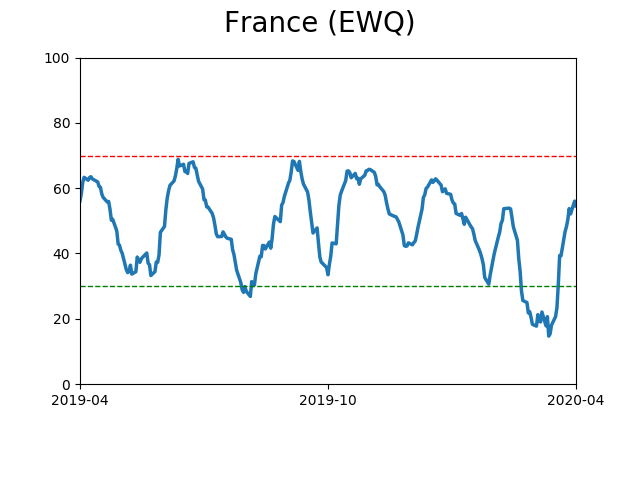
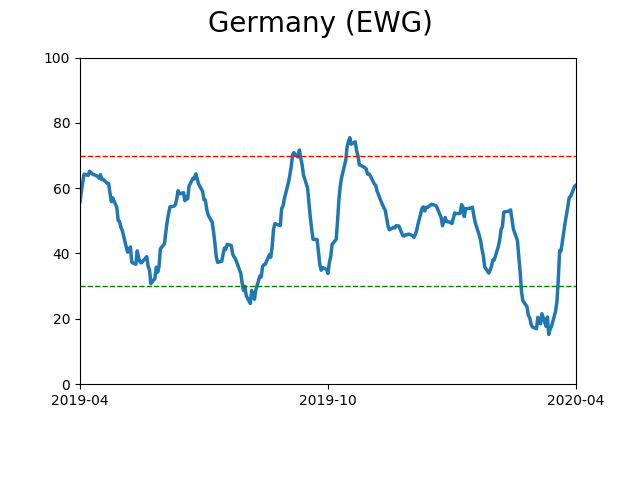
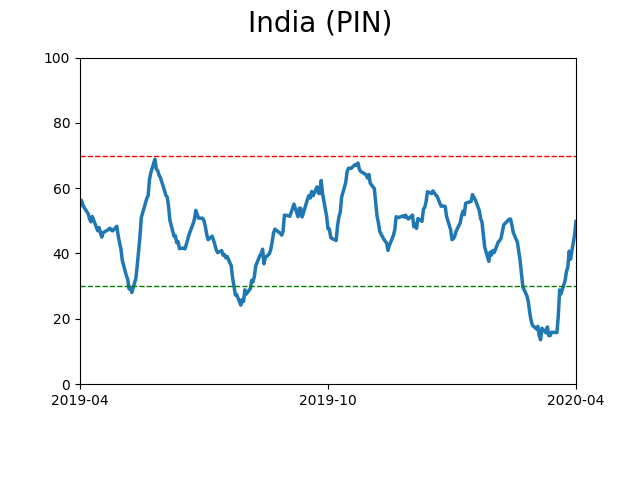
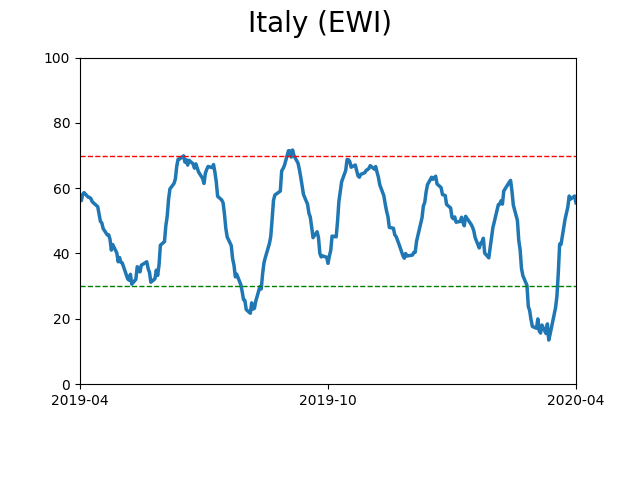
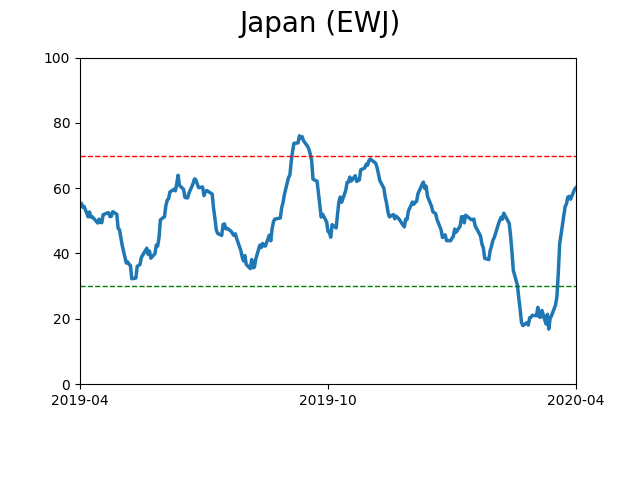
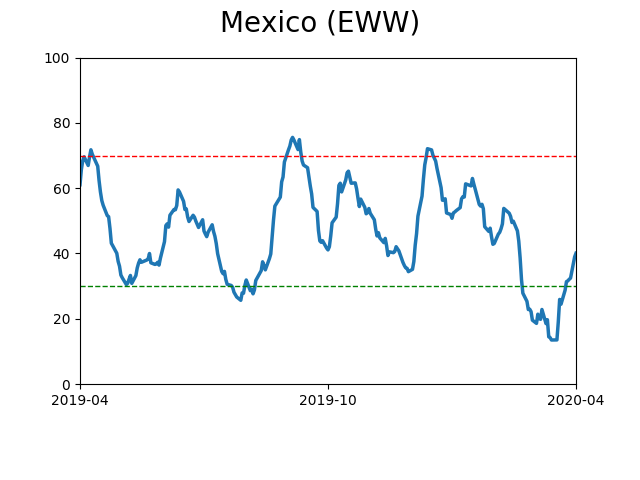
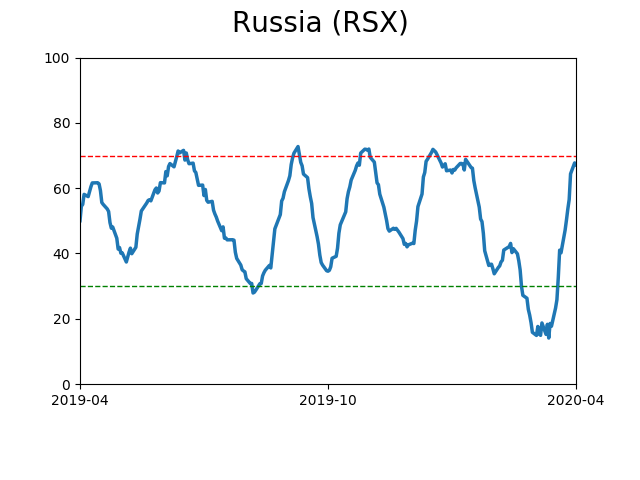
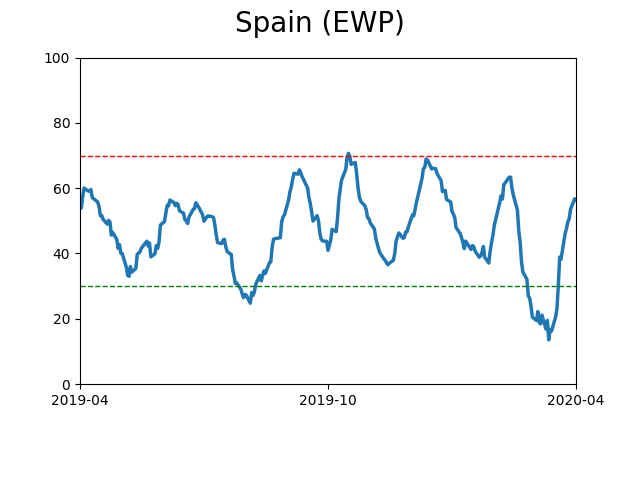
Sentiment Around The World
Optimism Index Thumbnails
|
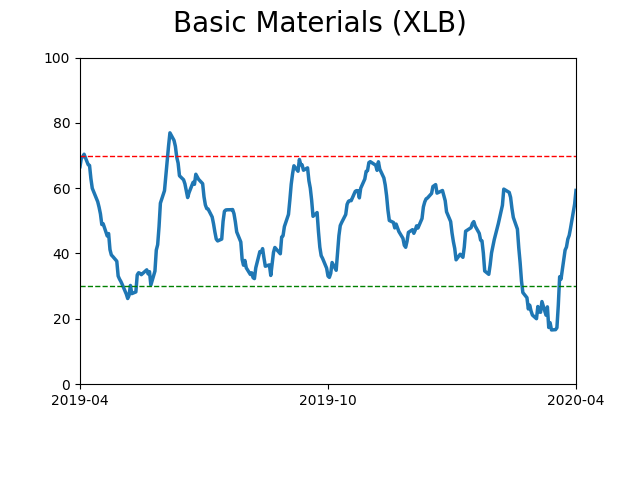
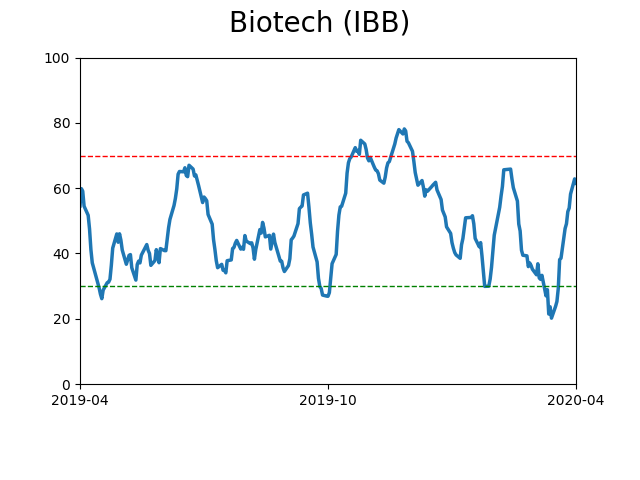
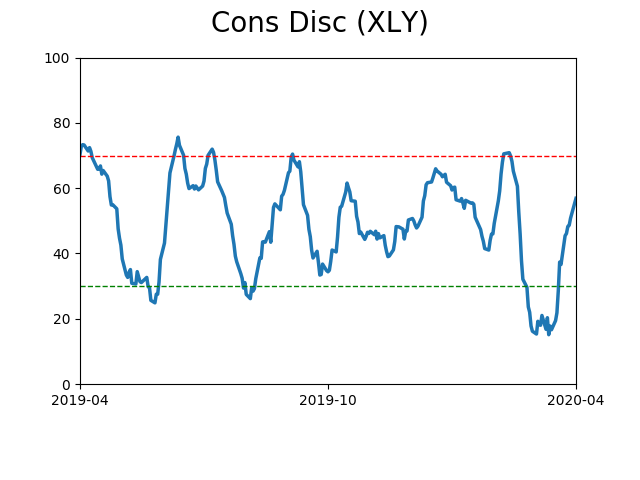
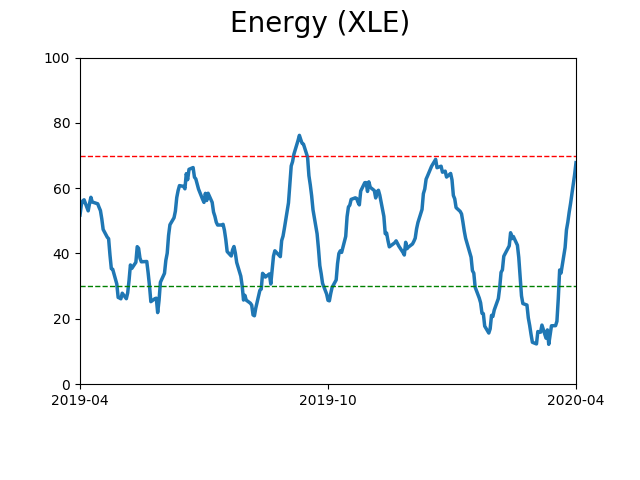
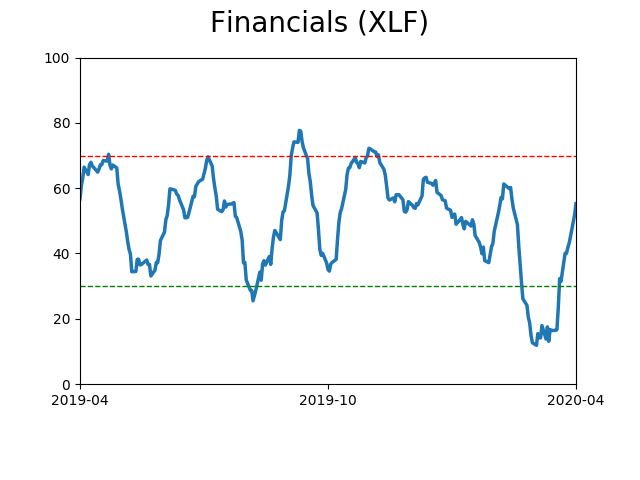
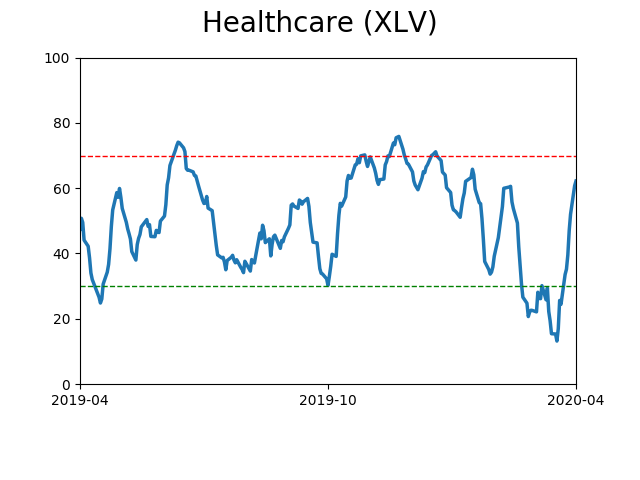
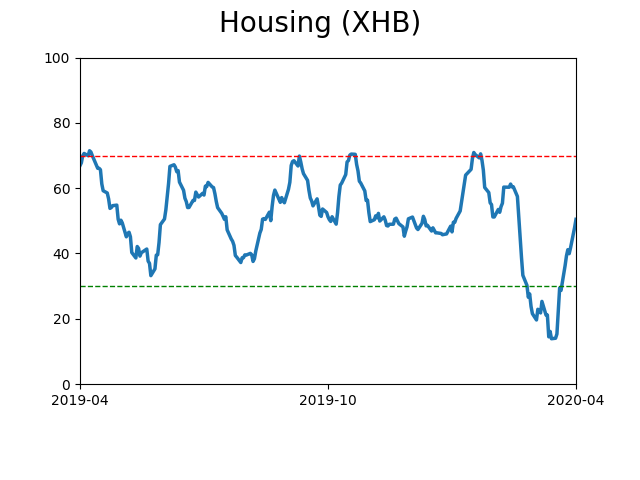
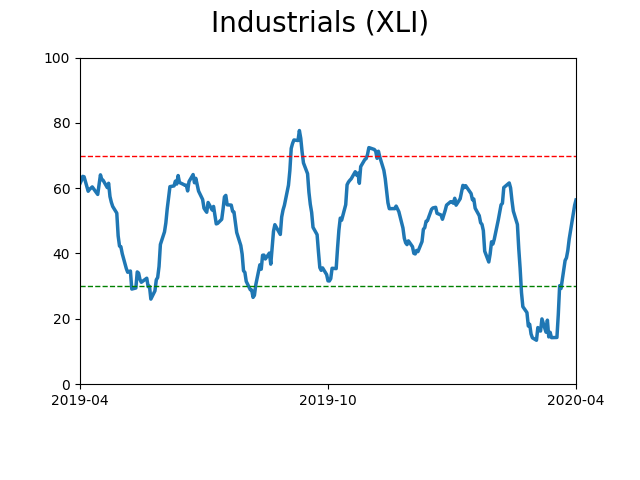
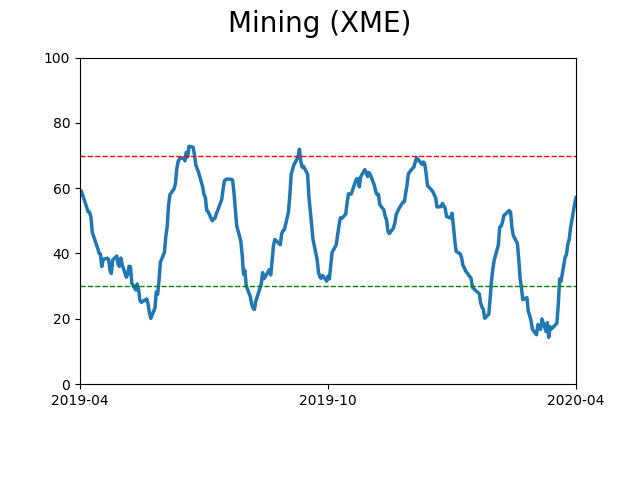
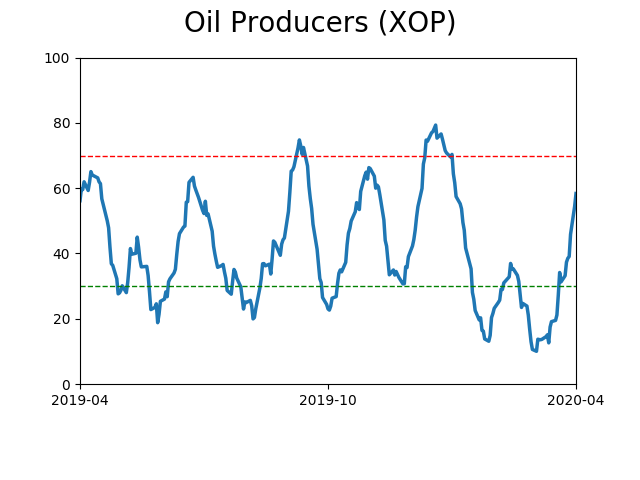
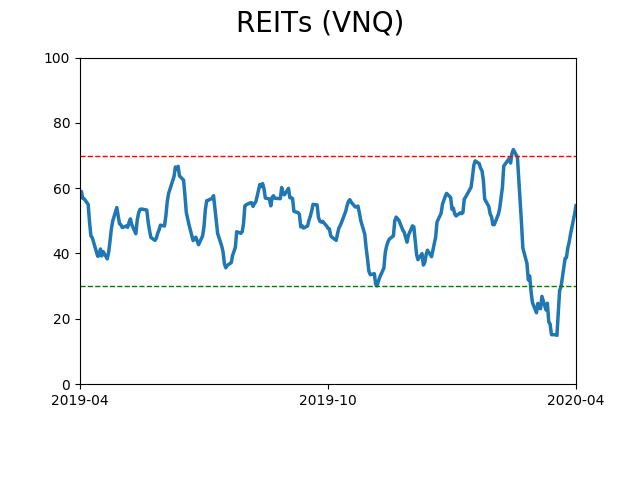
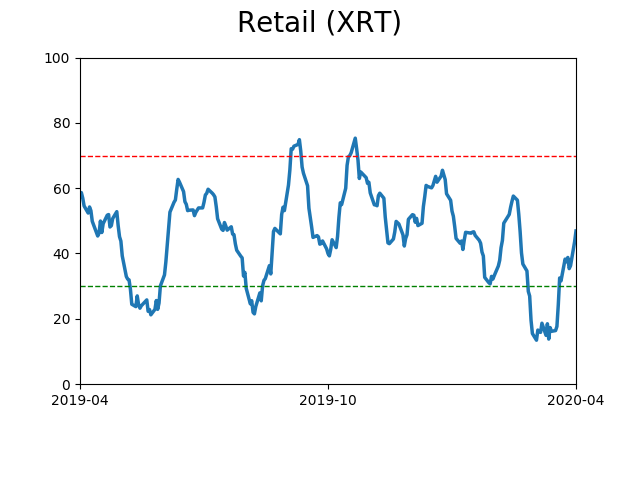
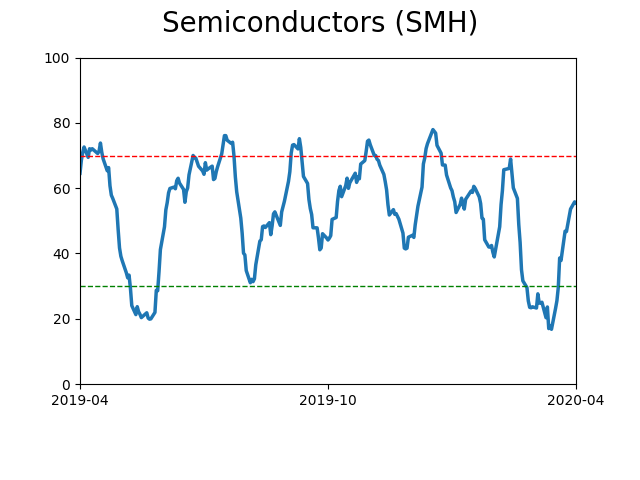
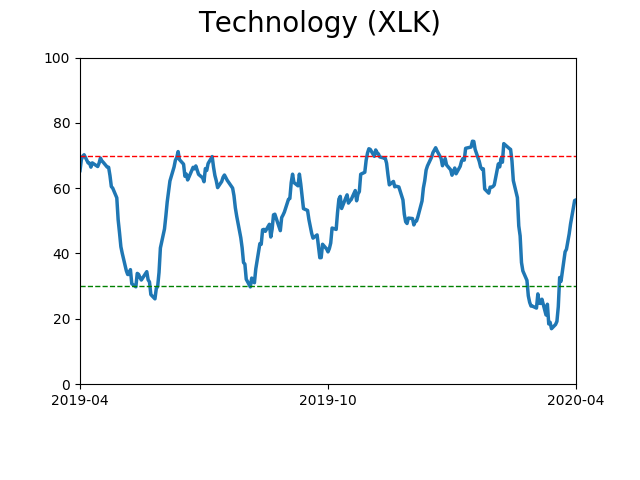
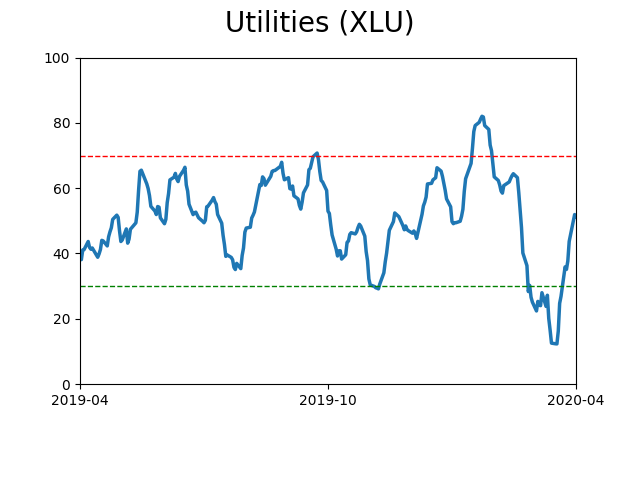
Sector ETF's - 10-Day Moving Average
|
|
|
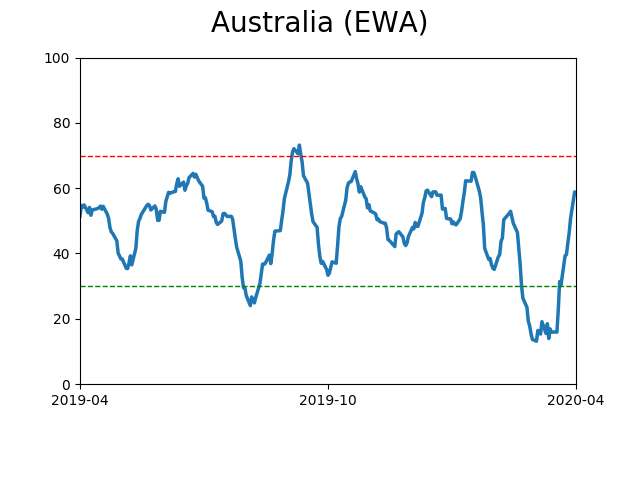
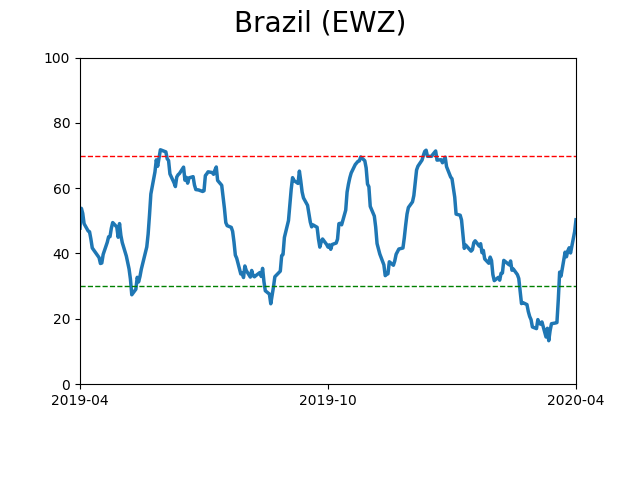
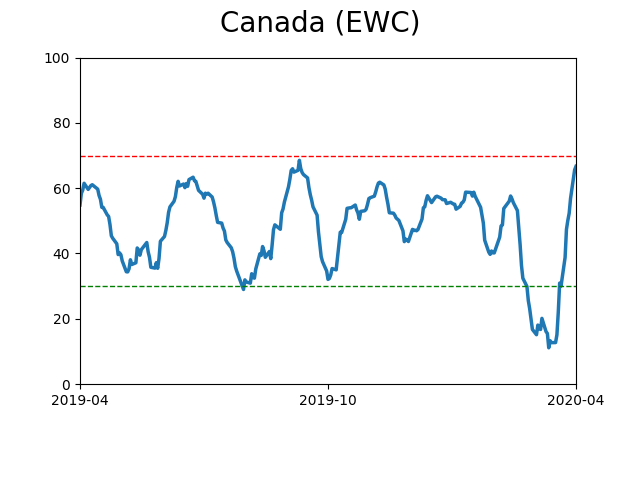
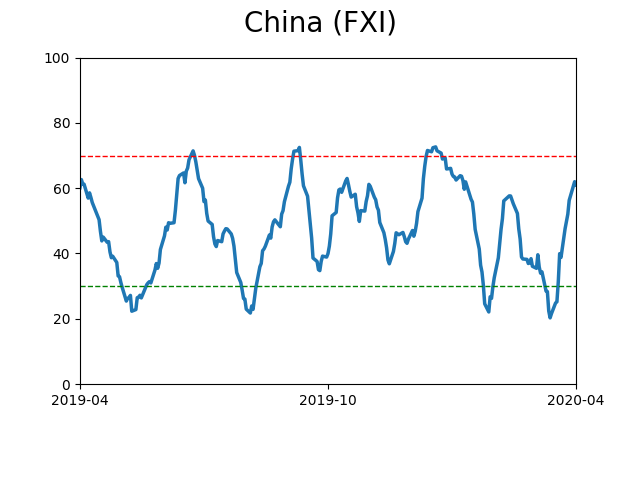
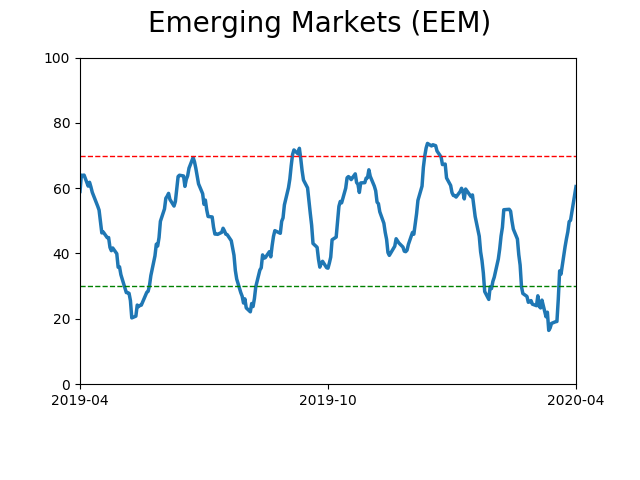
Country ETF's - 10-Day Moving Average
|
|
|
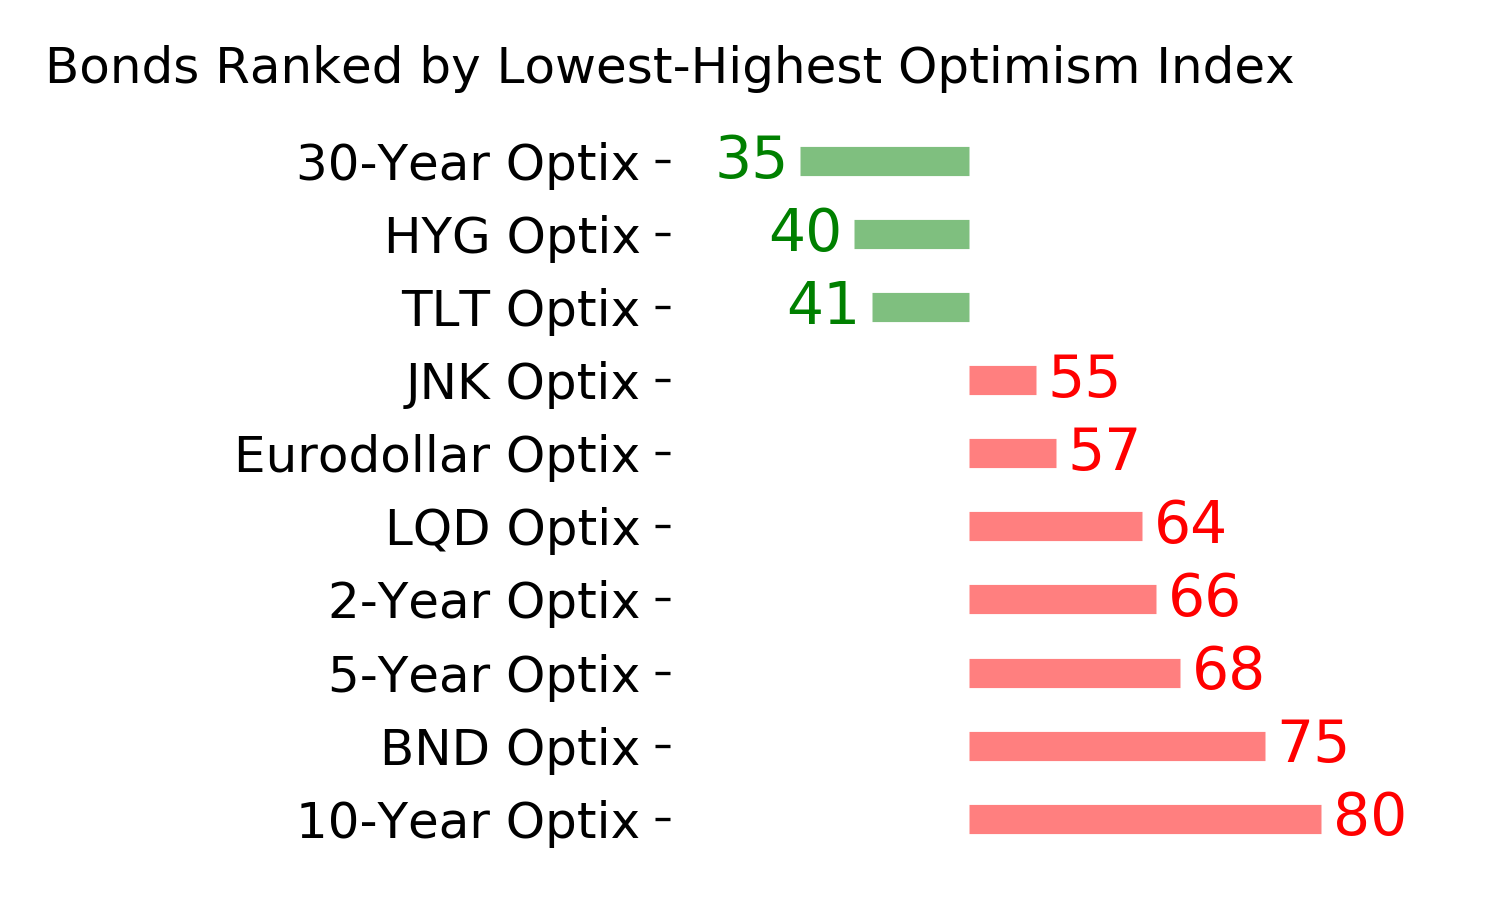
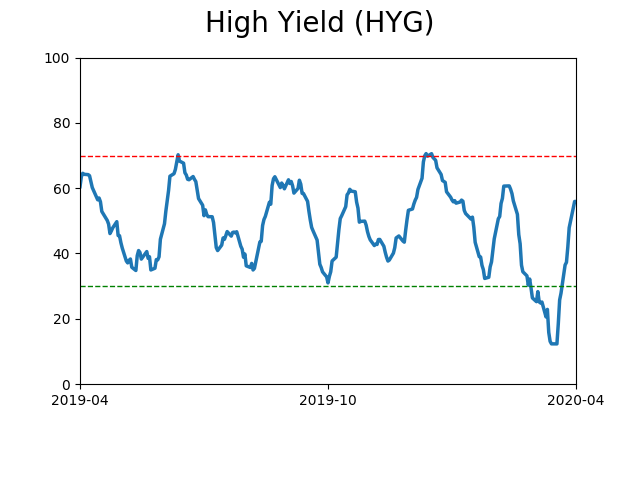
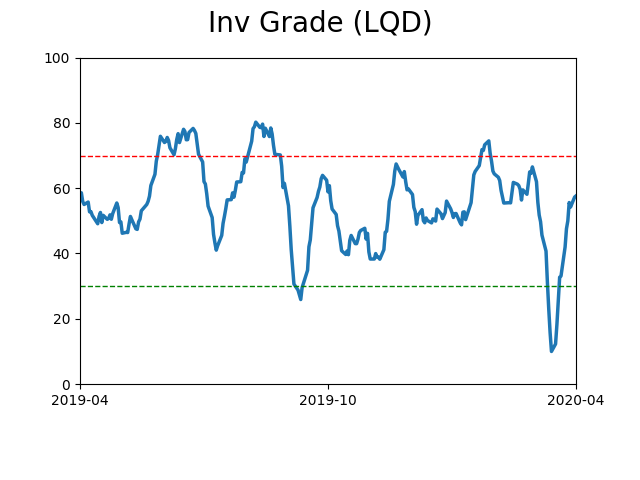
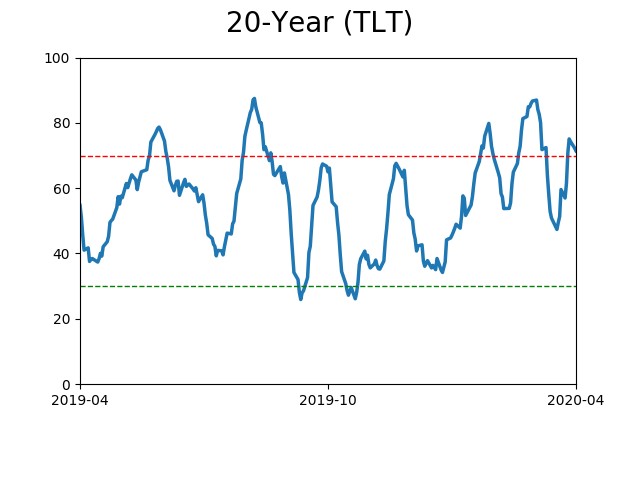
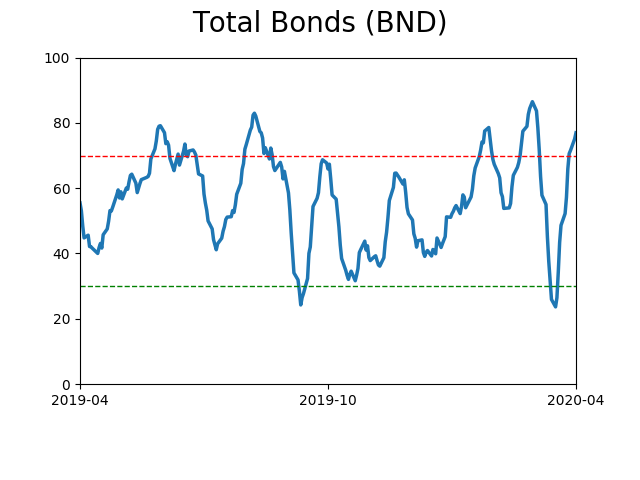
Bond ETF's - 10-Day Moving Average
|
|
|
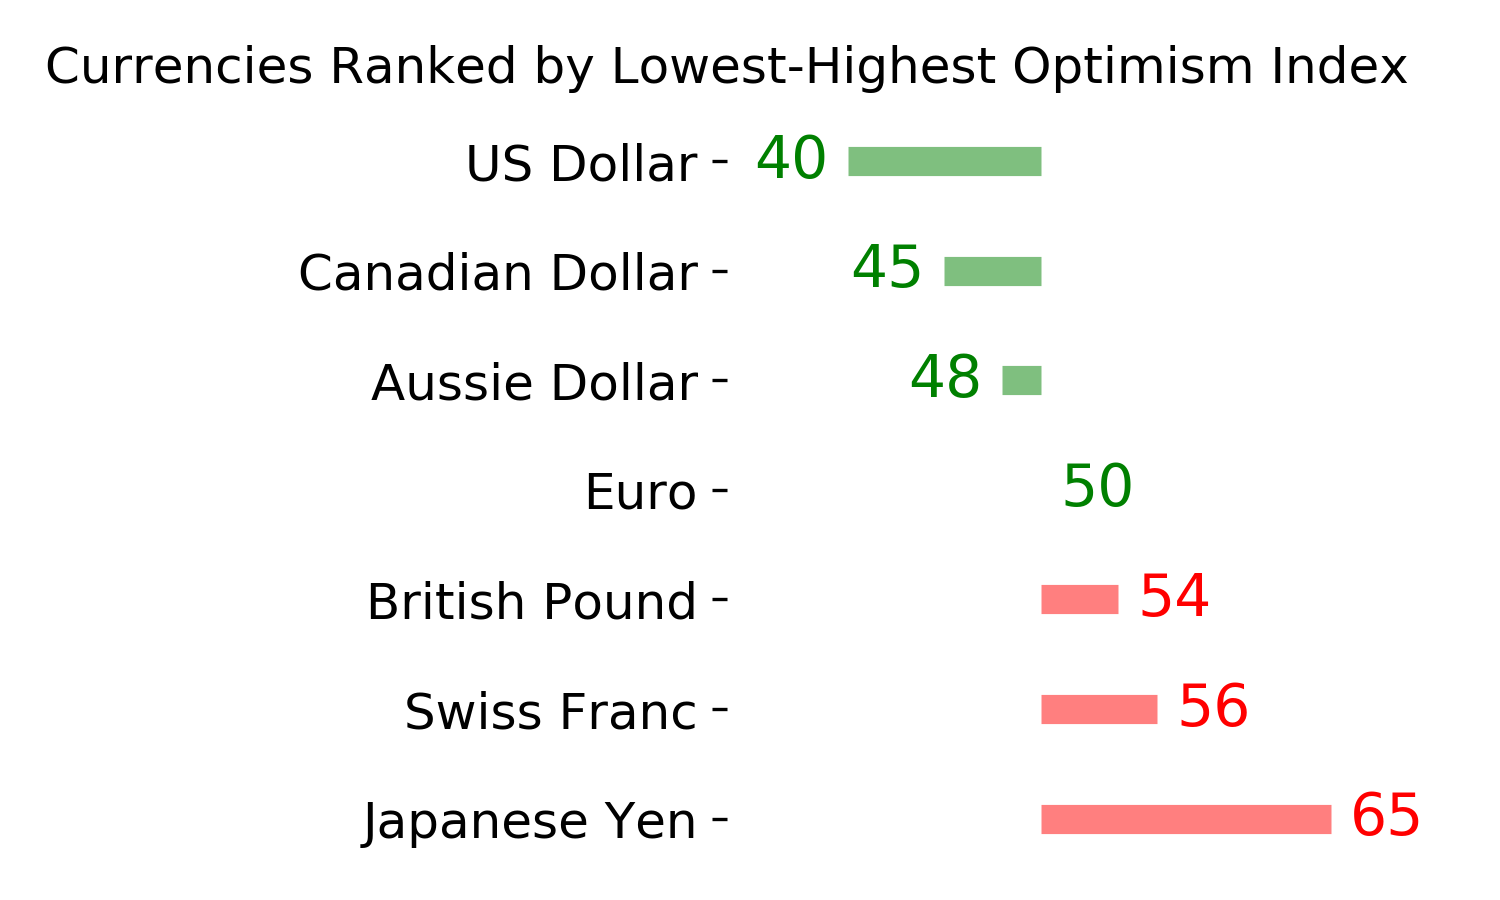
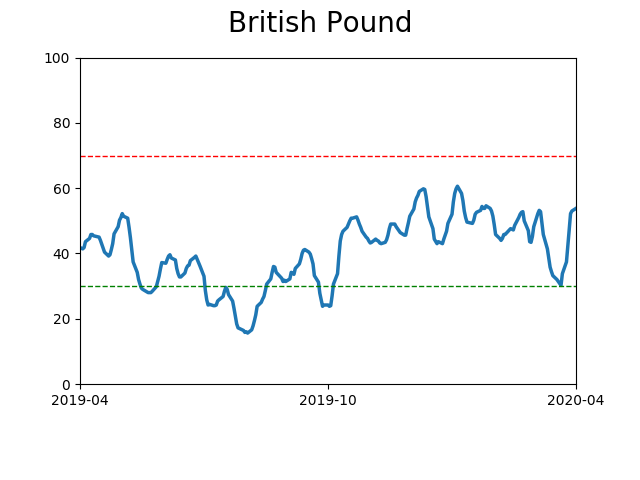
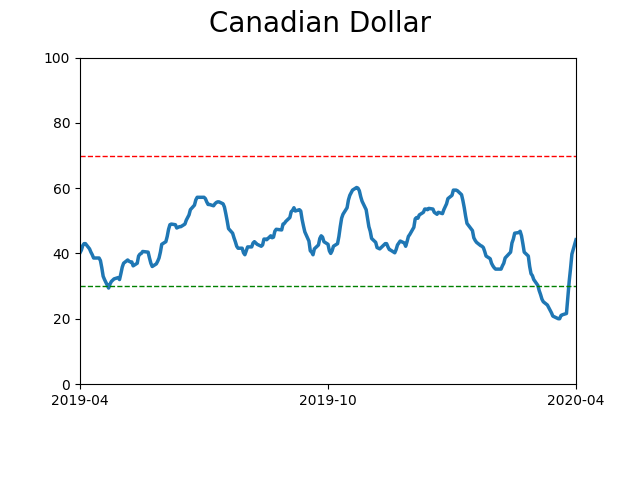
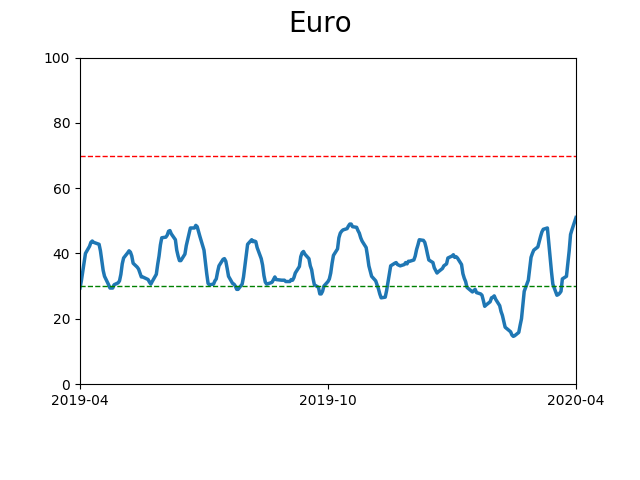
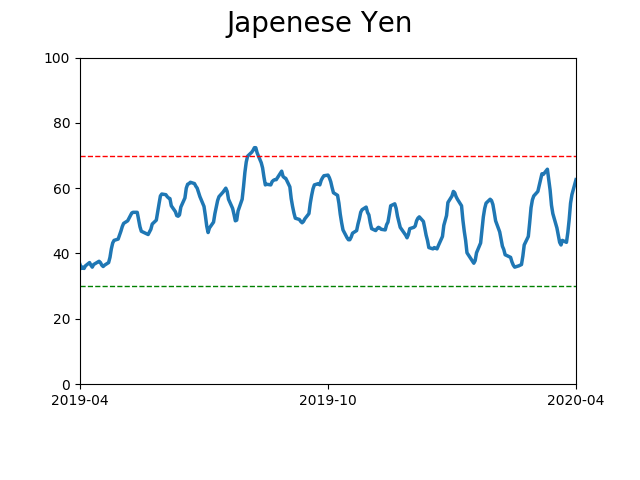
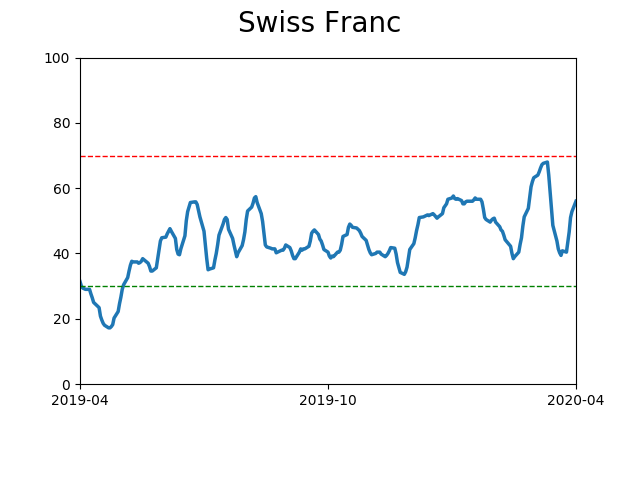
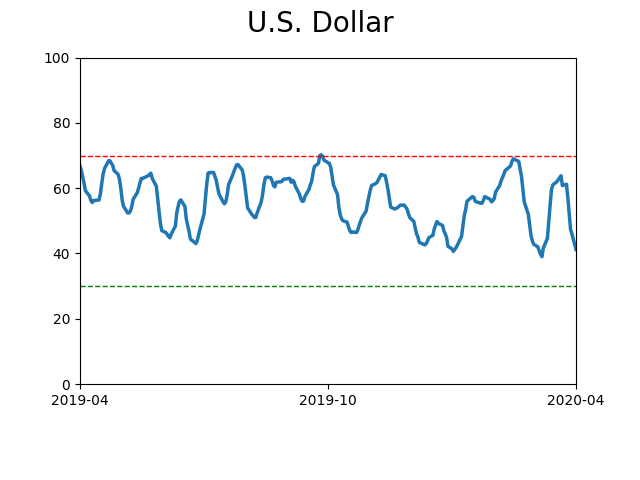
Currency ETF's - 5-Day Moving Average
|
|
|
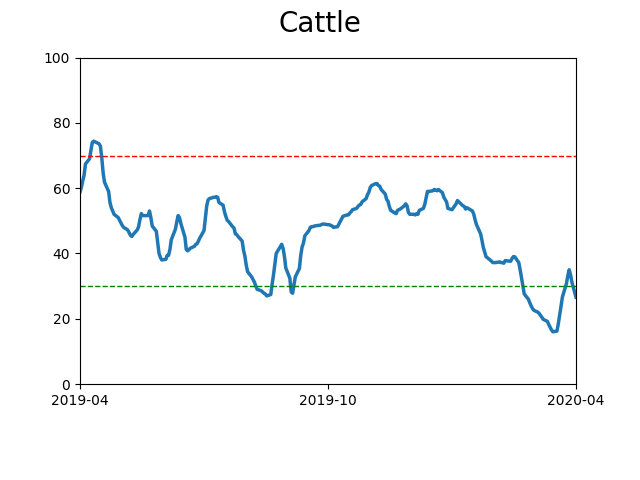
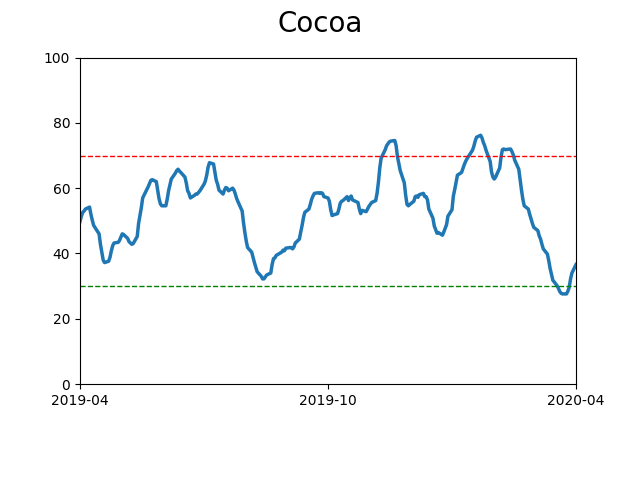
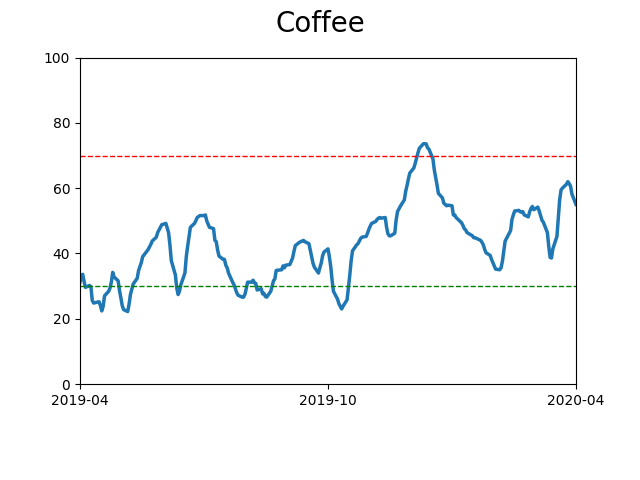
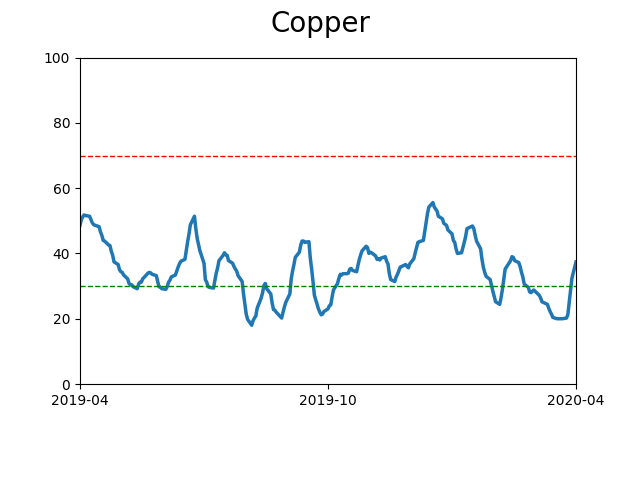
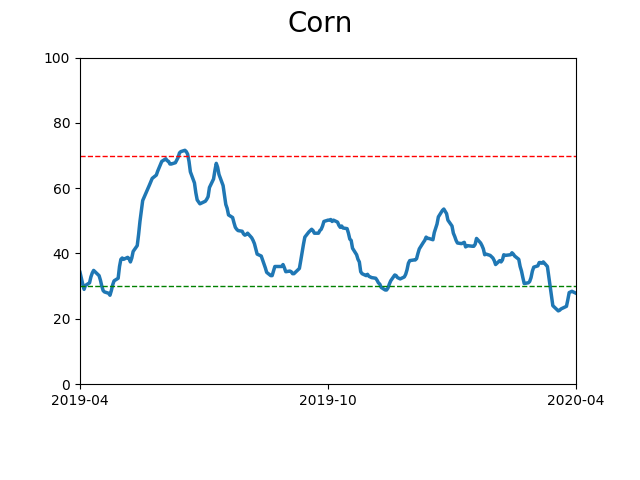
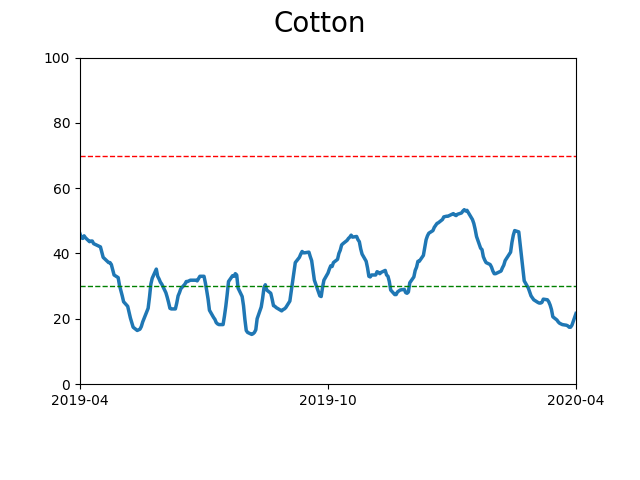
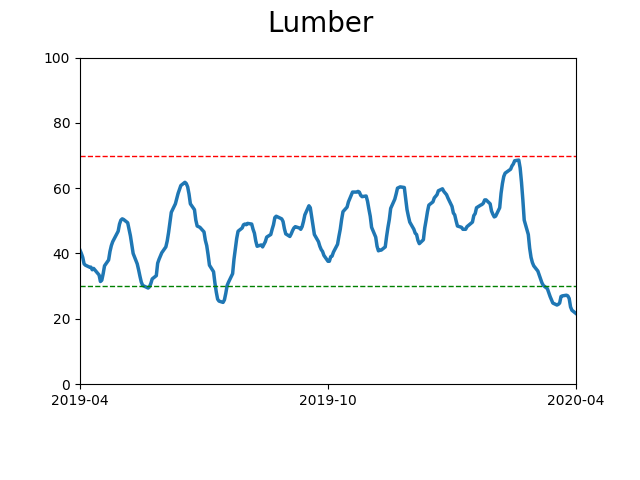
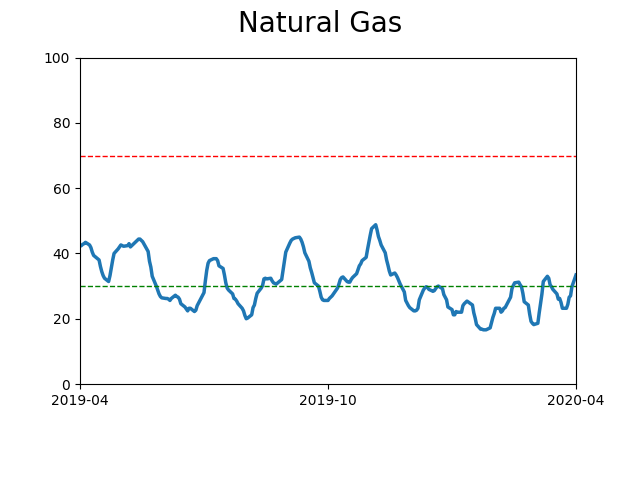
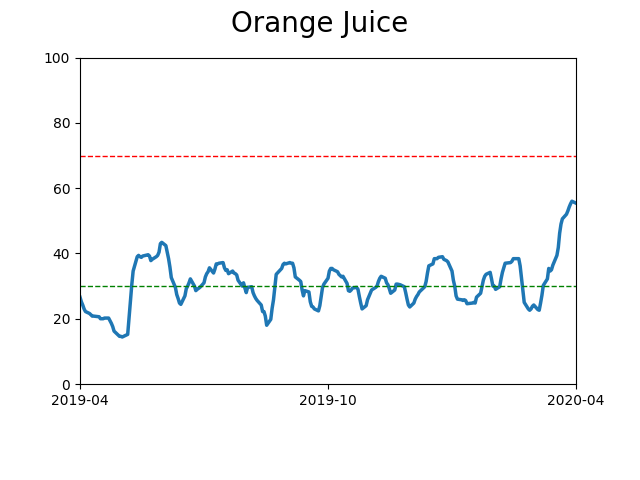
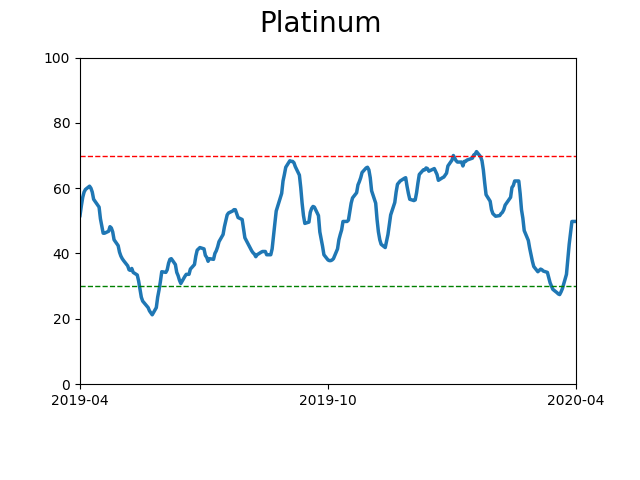
Commodity ETF's - 5-Day Moving Average
|
|