Headlines
|
|
Did mom and pop really leave?:
The smallest of options traders have pulled back somewhat on their aggressive activity in the options market. But that just means they're a bit less speculative than they were in January. They continue to behave in ways that exceed almost all other speculative phases in the past 20 years.
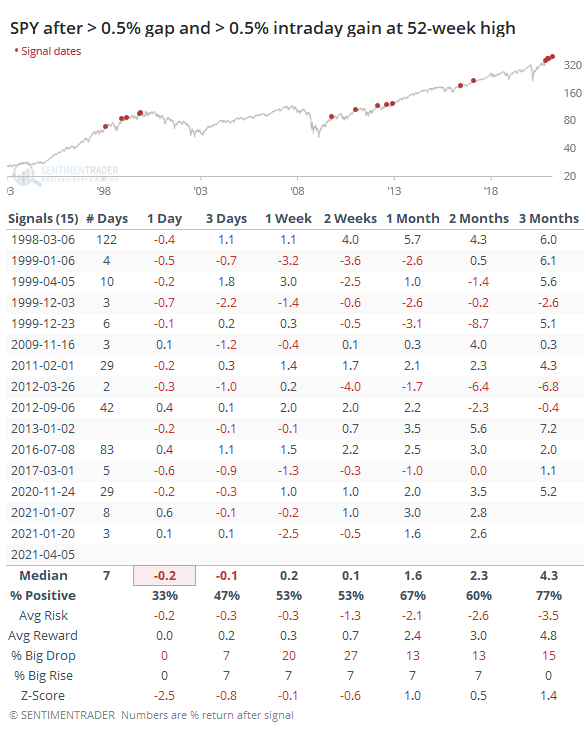
Gap and go: Traders came back from the long weekend with a vengeance, pushing stocks up handily at the open and not letting up. This is one of the few times that SPY's low was at least 0.5% above its prior close, while adding at least another 0.5% from open to close. Of the other times it's shot higher like this, only one ended up being a true gap-and-go. The others took a median of 7 trading days before falling back below the prior day's close (Friday's close in the current case).
Bottom Line:
See the Outlook & Allocations page for more details on these summaries STOCKS: Weak sell
The extreme speculation registered in January and February is starting to get wrung out. Internal dynamics have mostly held up, so a return to neutral sentiment conditions would improve the forward risk/reward profile substantially. We're still a ways off from that. BONDS: Weak buy
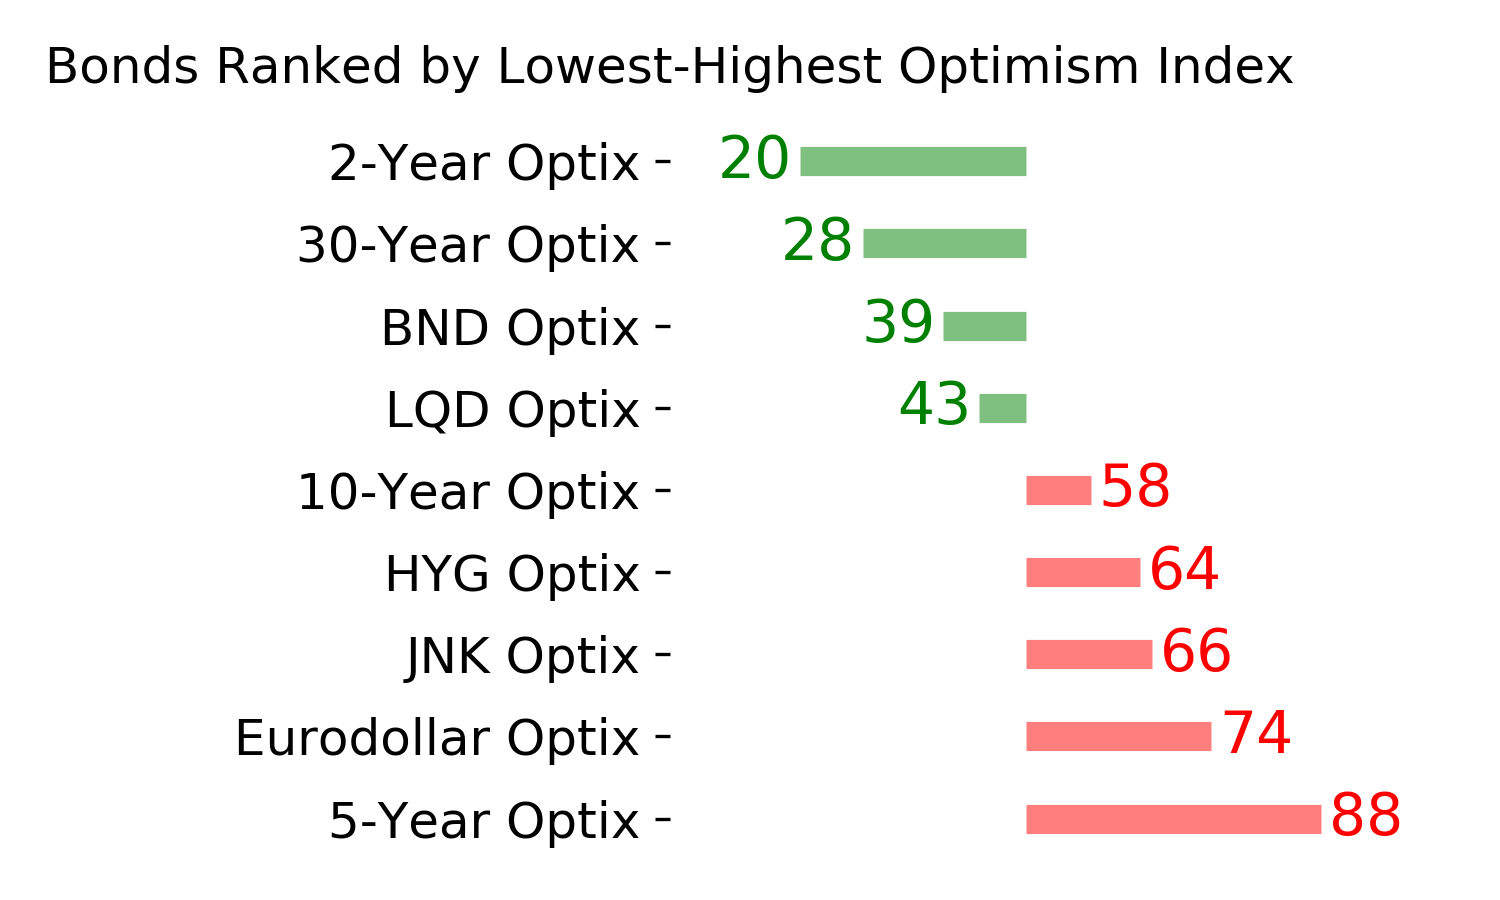
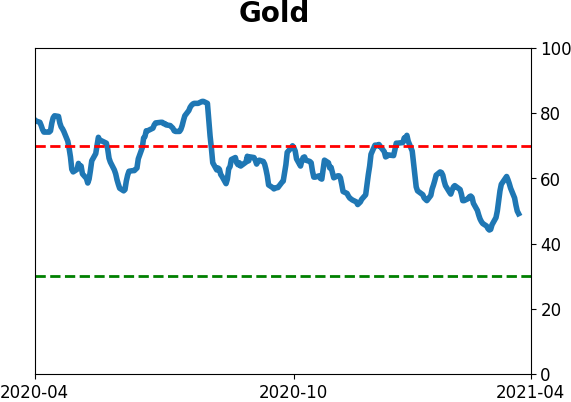
Various parts of the market have been hit in recent weeks, with mild oversold conditions. The Bond Optimism Index is now about as low as it gets during healthy bond market environments. Fixed income isn't responding well, so that needs to be monitored in case it's transitioning to a longer-term negative market environment. GOLD: Weak buy
A dollar trying to rebound from a severe short position has weighed on gold and miners. The types of signals they've given in recent weeks, within the context of their recent surge, have usually resulted in higher prices over a medium- to long-term time frame. Like bonds, gold and miners aren't responding very well, and this needs to be monitored.
|
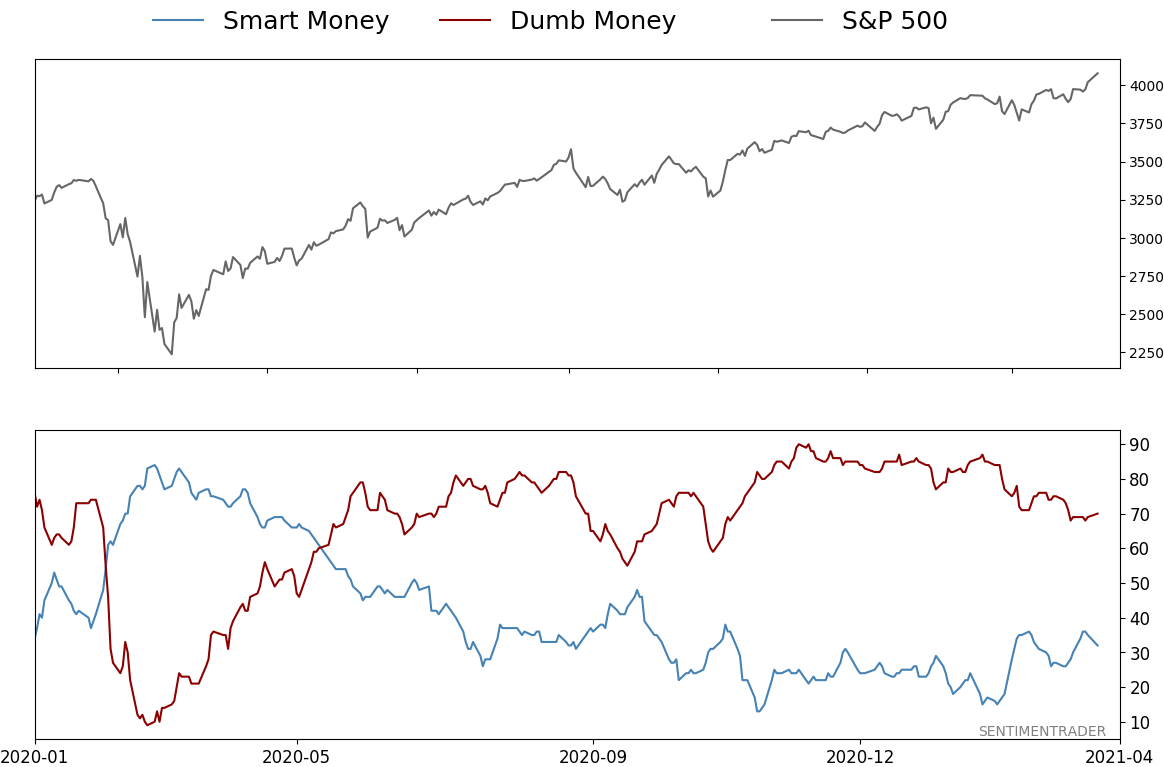
Smart / Dumb Money Confidence
|
Smart Money Confidence: 32%
Dumb Money Confidence: 70%
|
|
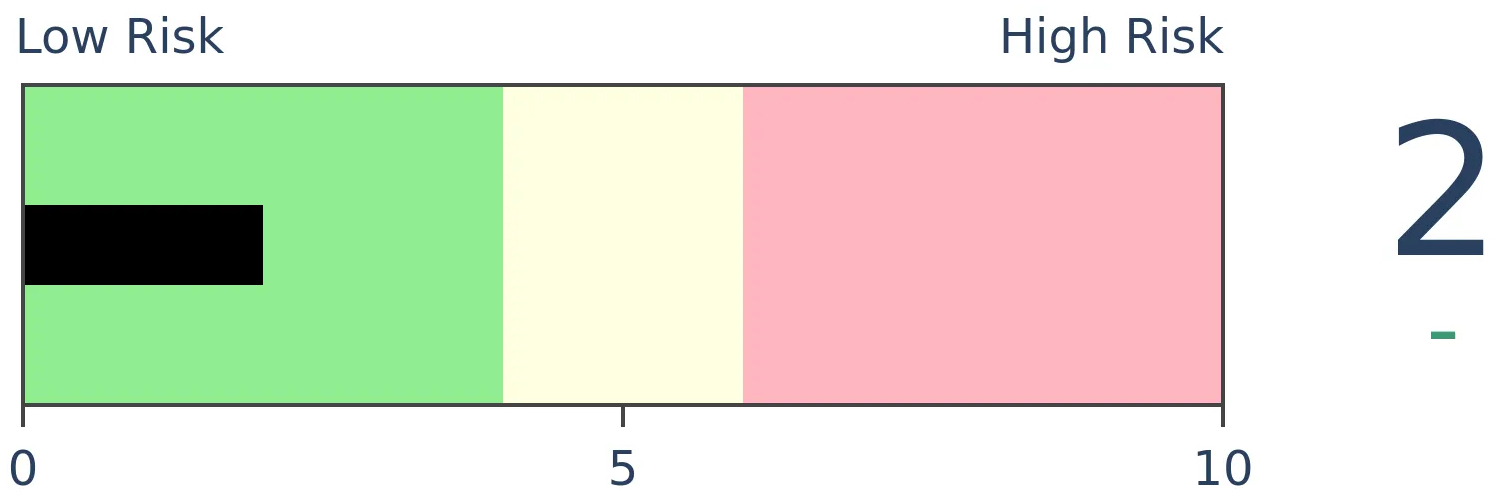
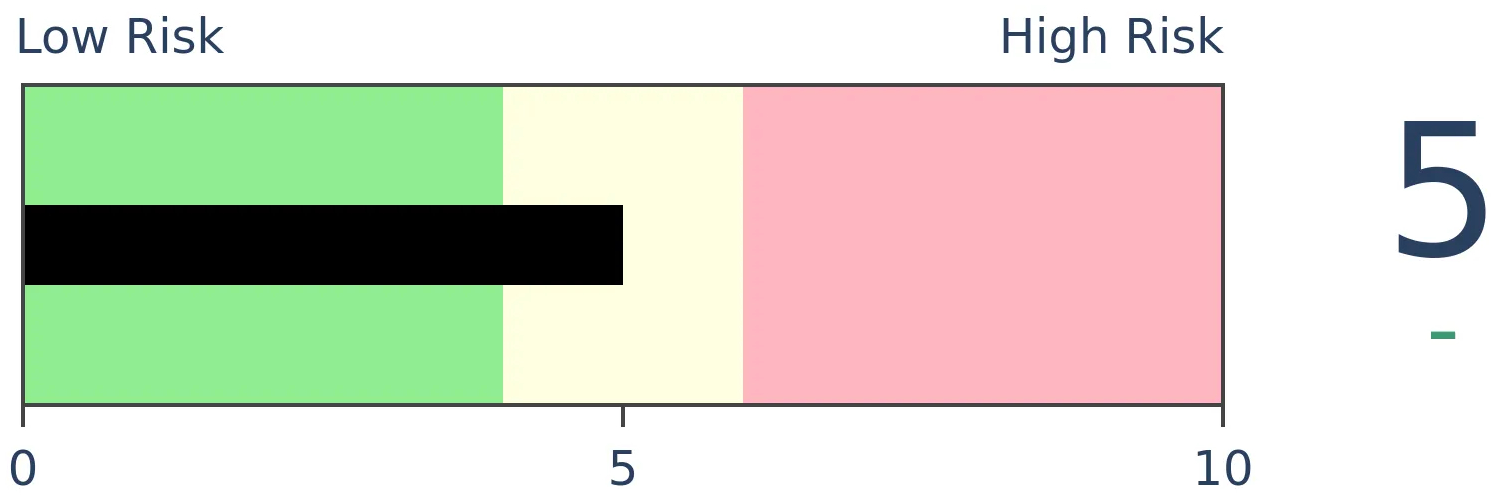
Risk Levels
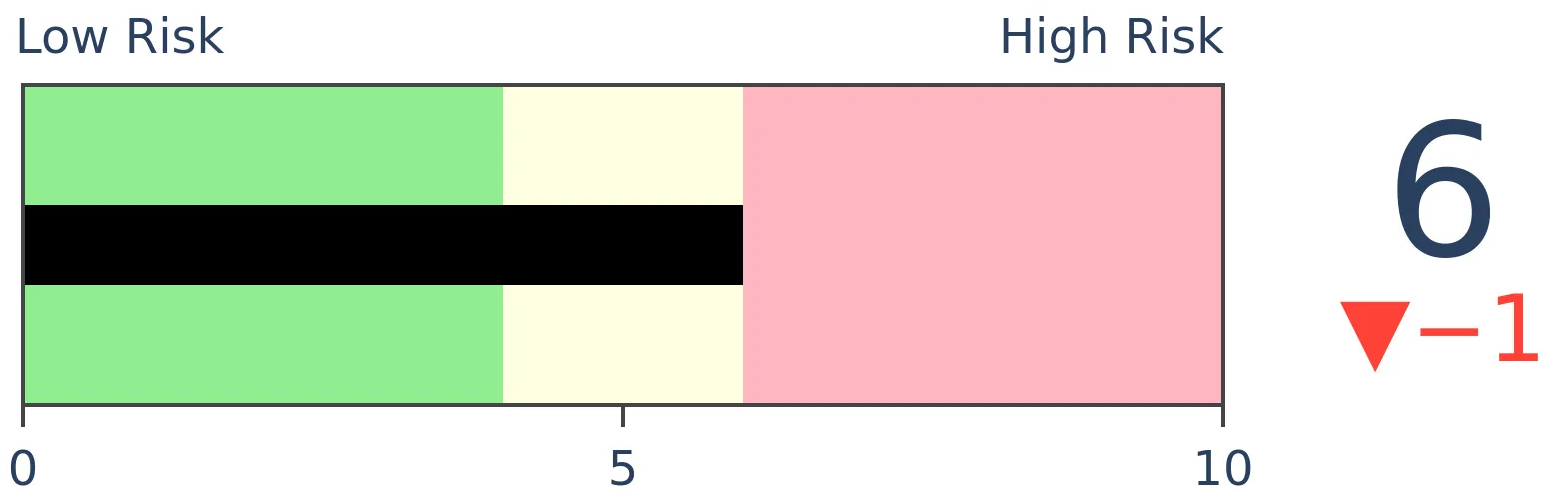
Stocks Short-Term
|
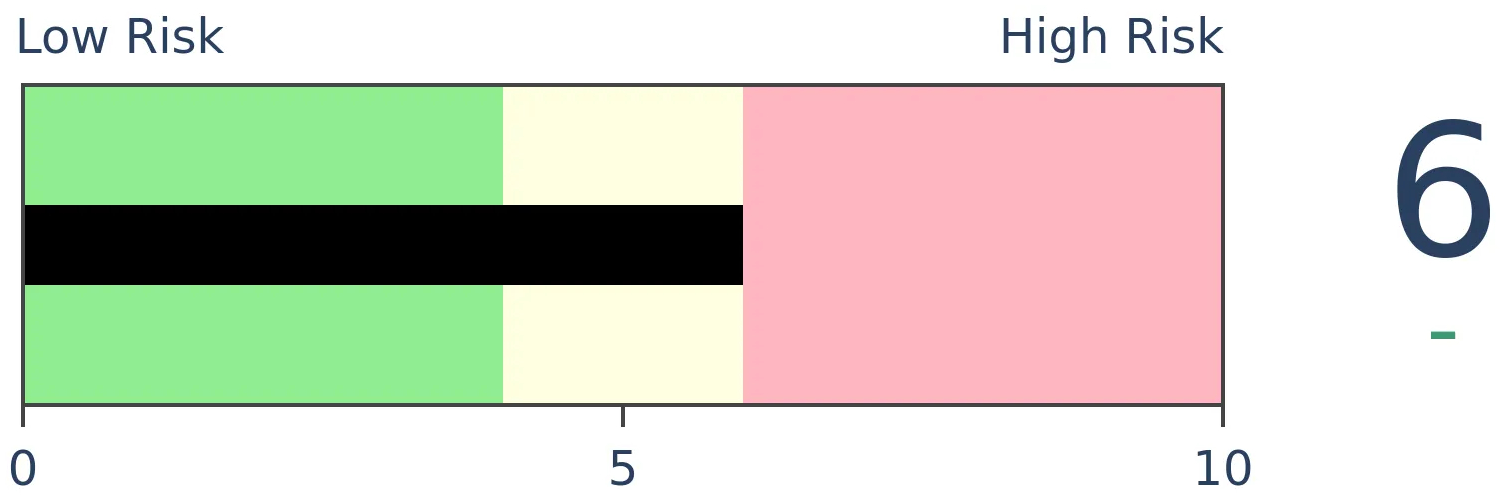
Stocks Medium-Term
|
|
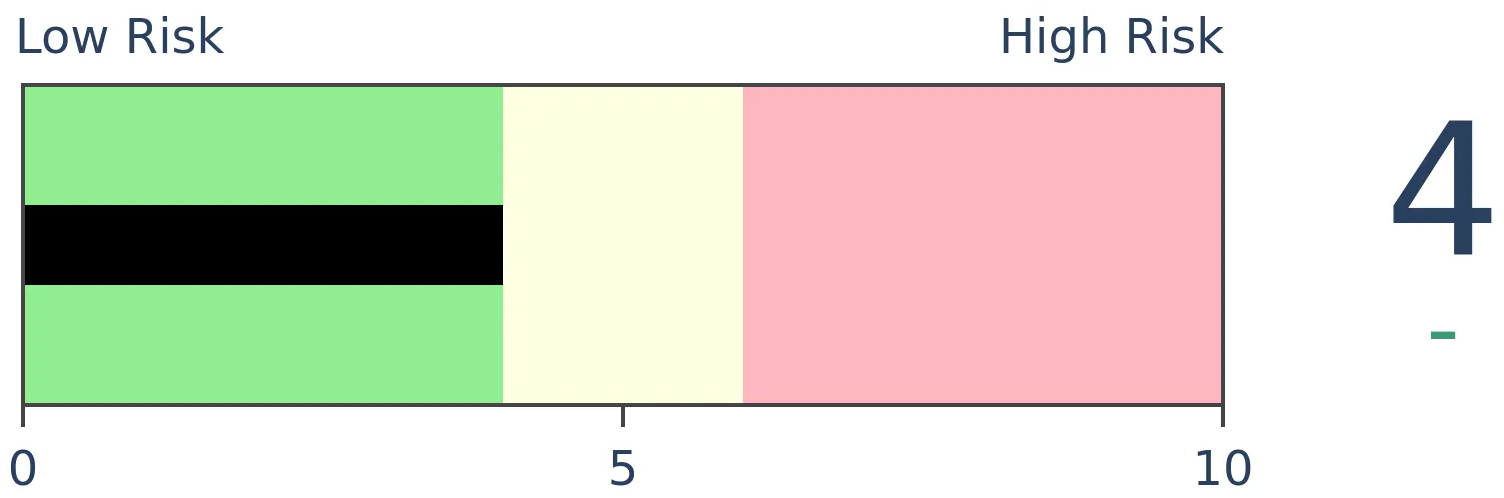
Bonds
|
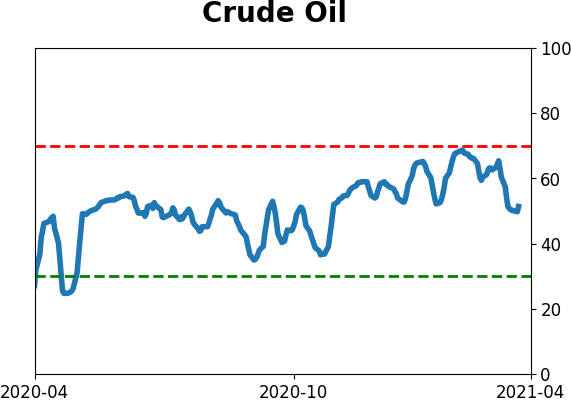
Crude Oil
|
|
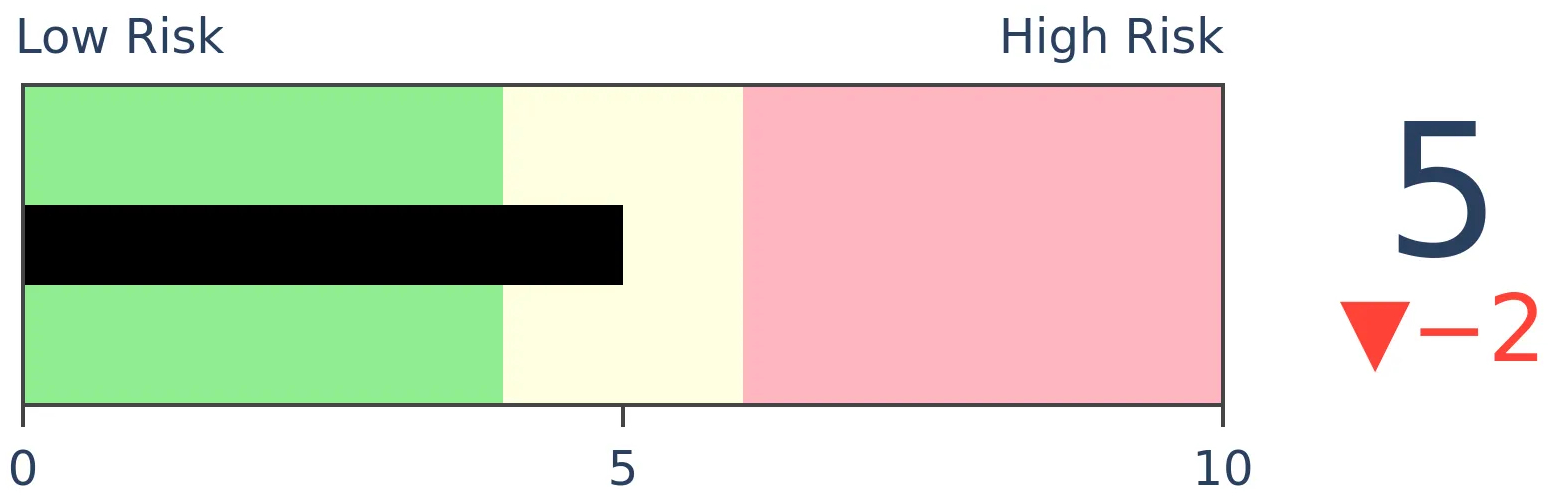
Gold
|
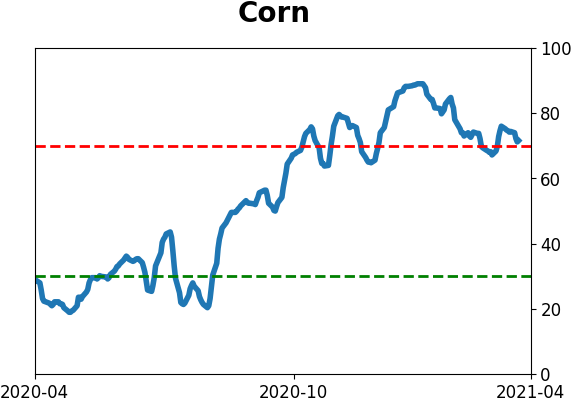
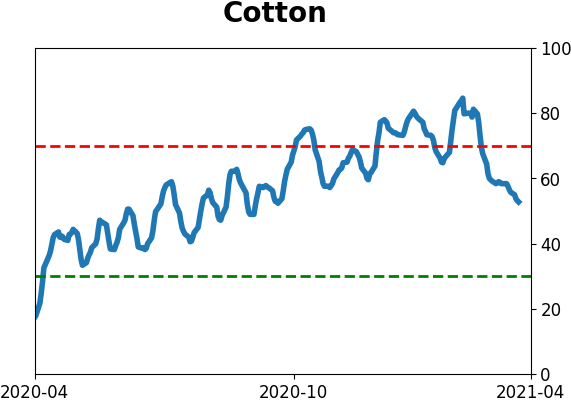
Agriculture
|
|
Research
BOTTOM LINE
The smallest of options traders have pulled back somewhat on their aggressive activity in the options market. But that just means they're a bit less speculative than they were in January. They continue to behave in ways that exceed almost all other speculative phases in the past 20 years.
FORECAST / TIMEFRAME
None
|
There seems to be a growing narrative that retail traders have left the market, or at least pulled back greatly, and stocks have held up just fine. The latest stimmy hasn't engaged new investors like the prior rounds did since there's more to do now than sit in the basement and click on tickers that seem to generate profits every day.
It's not really true, and likely to be even less true if stocks continue to surge like they have the past few sessions.
Activity has definitely pulled back from the peak in January when it reached jaw-dropping levels. It almost had to, and a correction in many of the highest-flying names hastened their exit.
But in many respects, small trader behavior is still more aggressive than many of the speculative fervors that popped up over the past 20 years, in the most leveraged instruments.
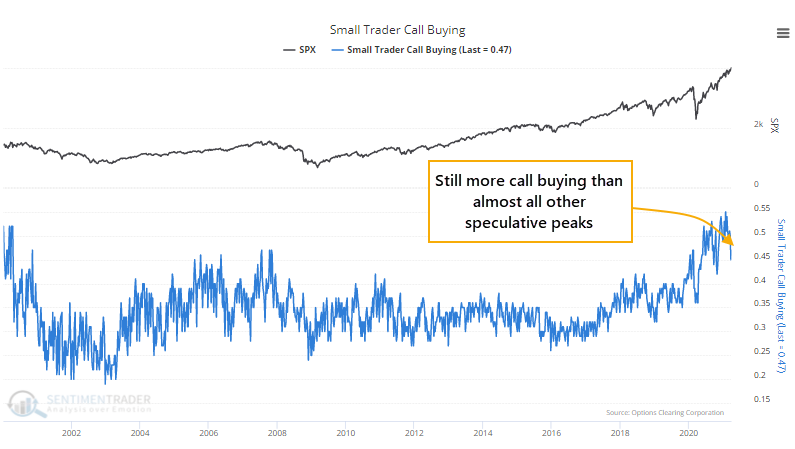
During last week's holiday-shortened stretch, the smallest of traders spent 47% of their volume on speculative call buying. Sure, that's down from 55% in January but it's still higher than any other pre-2020 week in 20 years other than (barely) the peak in 2000.
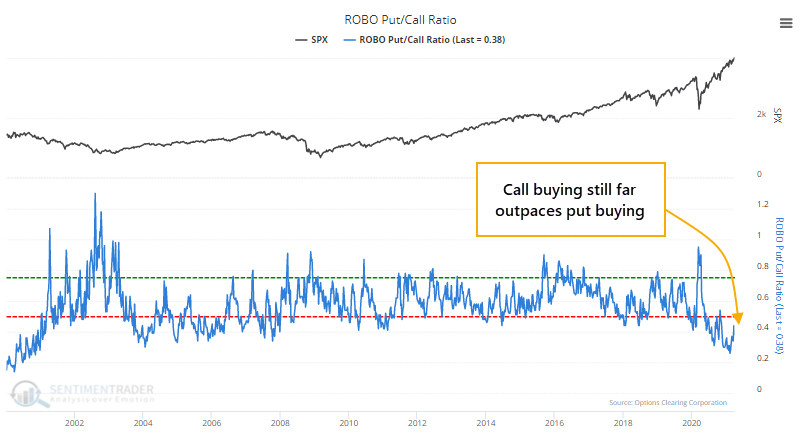
It's not like they suddenly bought a bunch of protective puts as an offset. The ROBO Put/Call Ratio dropped last week and remains mired among the lowest readings in history.
Okay, so maybe they started moving to some less offensive strategies like selling calls? No, not at all. The Option Speculation Index, but looking at only the activity of the smallest traders, rose last week. Looking only at trades for 10 contracts or fewer, there were 59% more bullish options strategies executed than bearish ones.
Prior to the last 6 months, the only weeks that showed more aggressive small-trader behavior were during the peak of the bubble in 2000, again in October 2007, and for a few weeks in January-February 2020.
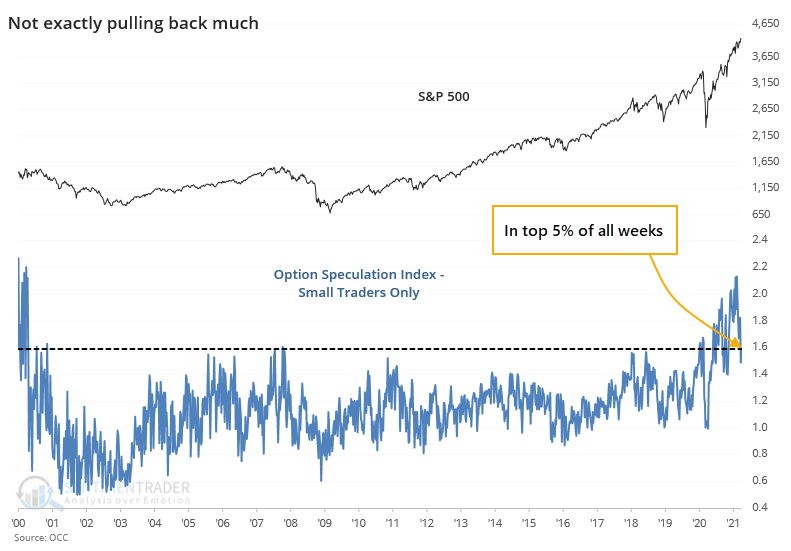
If we look at the total number of speculative call options they bought minus protective put options, expressed as a percentage of NYSE volume, then we can see that it continues to far surpass other speculative peaks, more than double what was seen even in the year 2000.
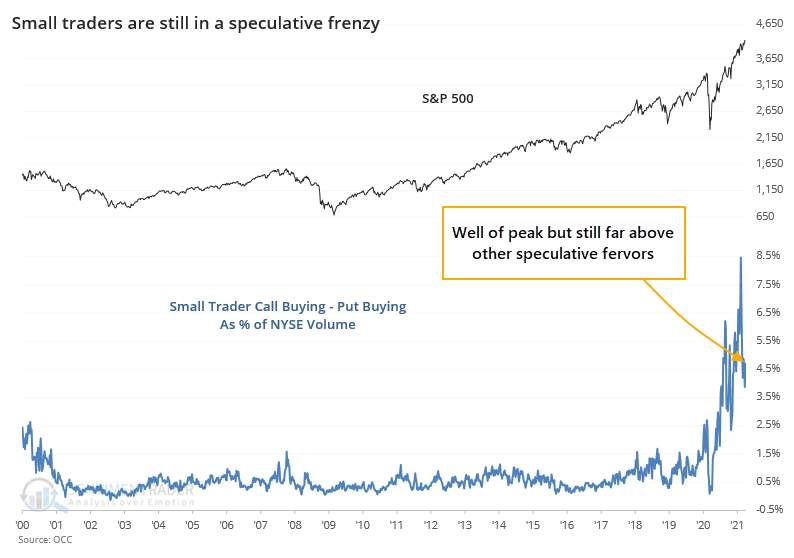
This looks troubling, but it's looked this way for months and yet the S&P 500 just closed at a record high. There has been more churn in many of the most-exposed names, so a rotation to more defensive positioning after the latest surge in speculative activity was beneficial. It just seems premature to declare that "the market" has emerged victorious from a vicious bout of speculative fervor. It has diminished somewhat, no doubt. But it's still raging to a degree unlike almost any other in a generation.
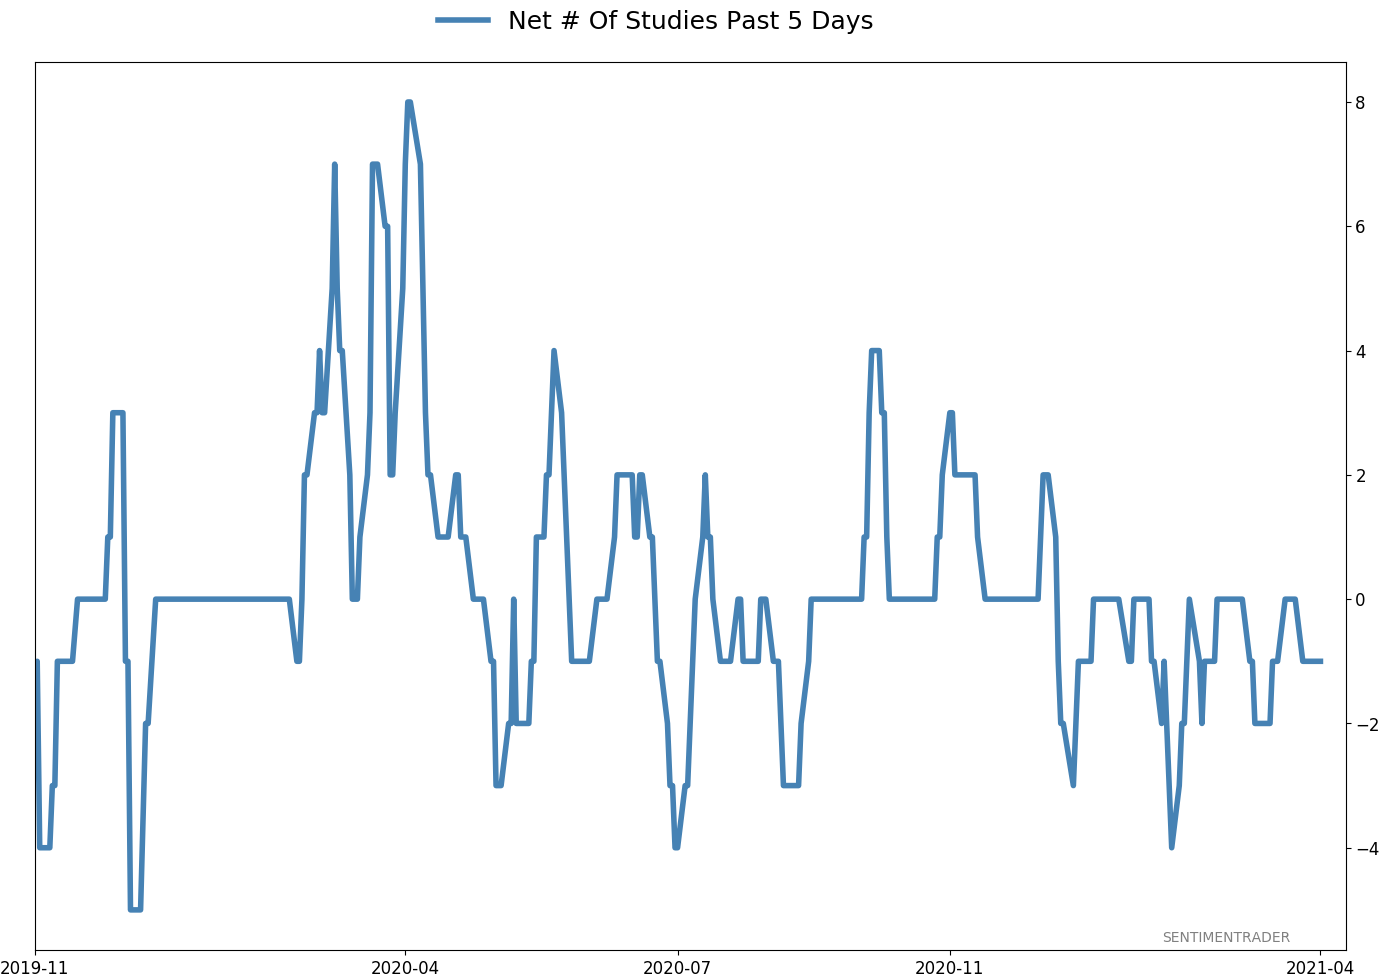
Active Studies
| Time Frame | Bullish | Bearish | | Short-Term | 0 | 0 | | Medium-Term | 0 | 10 | | Long-Term | 11 | 4 |
|
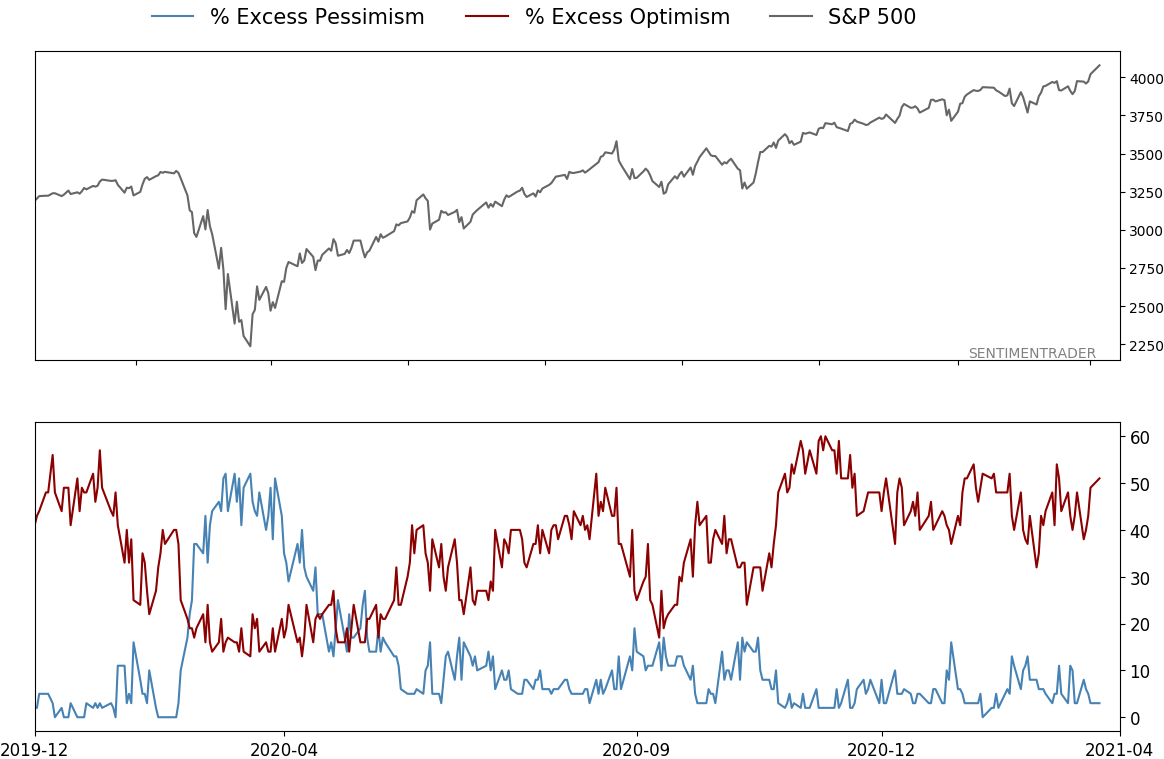
Indicators at Extremes
Portfolio
| Position | Description | Weight % | Added / Reduced | Date | | Stocks | RSP | 4.9 | Reduced 4% | 2021-02-09 | | Bonds | 30.0% BND, 8.8% SCHP | 38.8 | Added 15.1% | 2021-02-18 | | Commodities | GCC | 2.3 | Reduced 2.1%
| 2020-09-04 | | Precious Metals | GDX | 9.0 | Added 0.1% | 2021-02-18 | | Special Situations | 7.3% XLE, 4.8% PSCE | 12.1 | Reduced 5.6% | 2021-02-18 | | Cash | | 32.8 | | |
|
Updates (Changes made today are underlined)
With a market that has seen the kinds of broad participation and big breath thrusts like we did in the fall, it's hard to become too negative. Those kinds of conditions have consistently preceded higher returns over the next 6-12 months. It's the interim that's more of an issue. Even conditions like that haven't prevented some shorter-term pullbacks. And when we combine an environment where speculation is rampant and recent days have seen an increase in cracks under the surface of the indexes, it's enough to become more defensive over a short- to medium-term time frame. We still don't have much confirmation from the price action in the indexes, so those who are more conservative would likely wait before increasing cash levels. I've decreased risk exposure a bit more, mainly in terms of energy stocks and the ANGL fund, while adding more to the broader bond market. RETURN YTD: 6.4% 2020: 8.1%, 2019: 12.6%, 2018: 0.6%, 2017: 3.8%, 2016: 17.1%, 2015: 9.2%, 2014: 14.5%, 2013: 2.2%, 2012: 10.8%, 2011: 16.5%, 2010: 15.3%, 2009: 23.9%, 2008: 16.2%, 2007: 7.8%
|
|
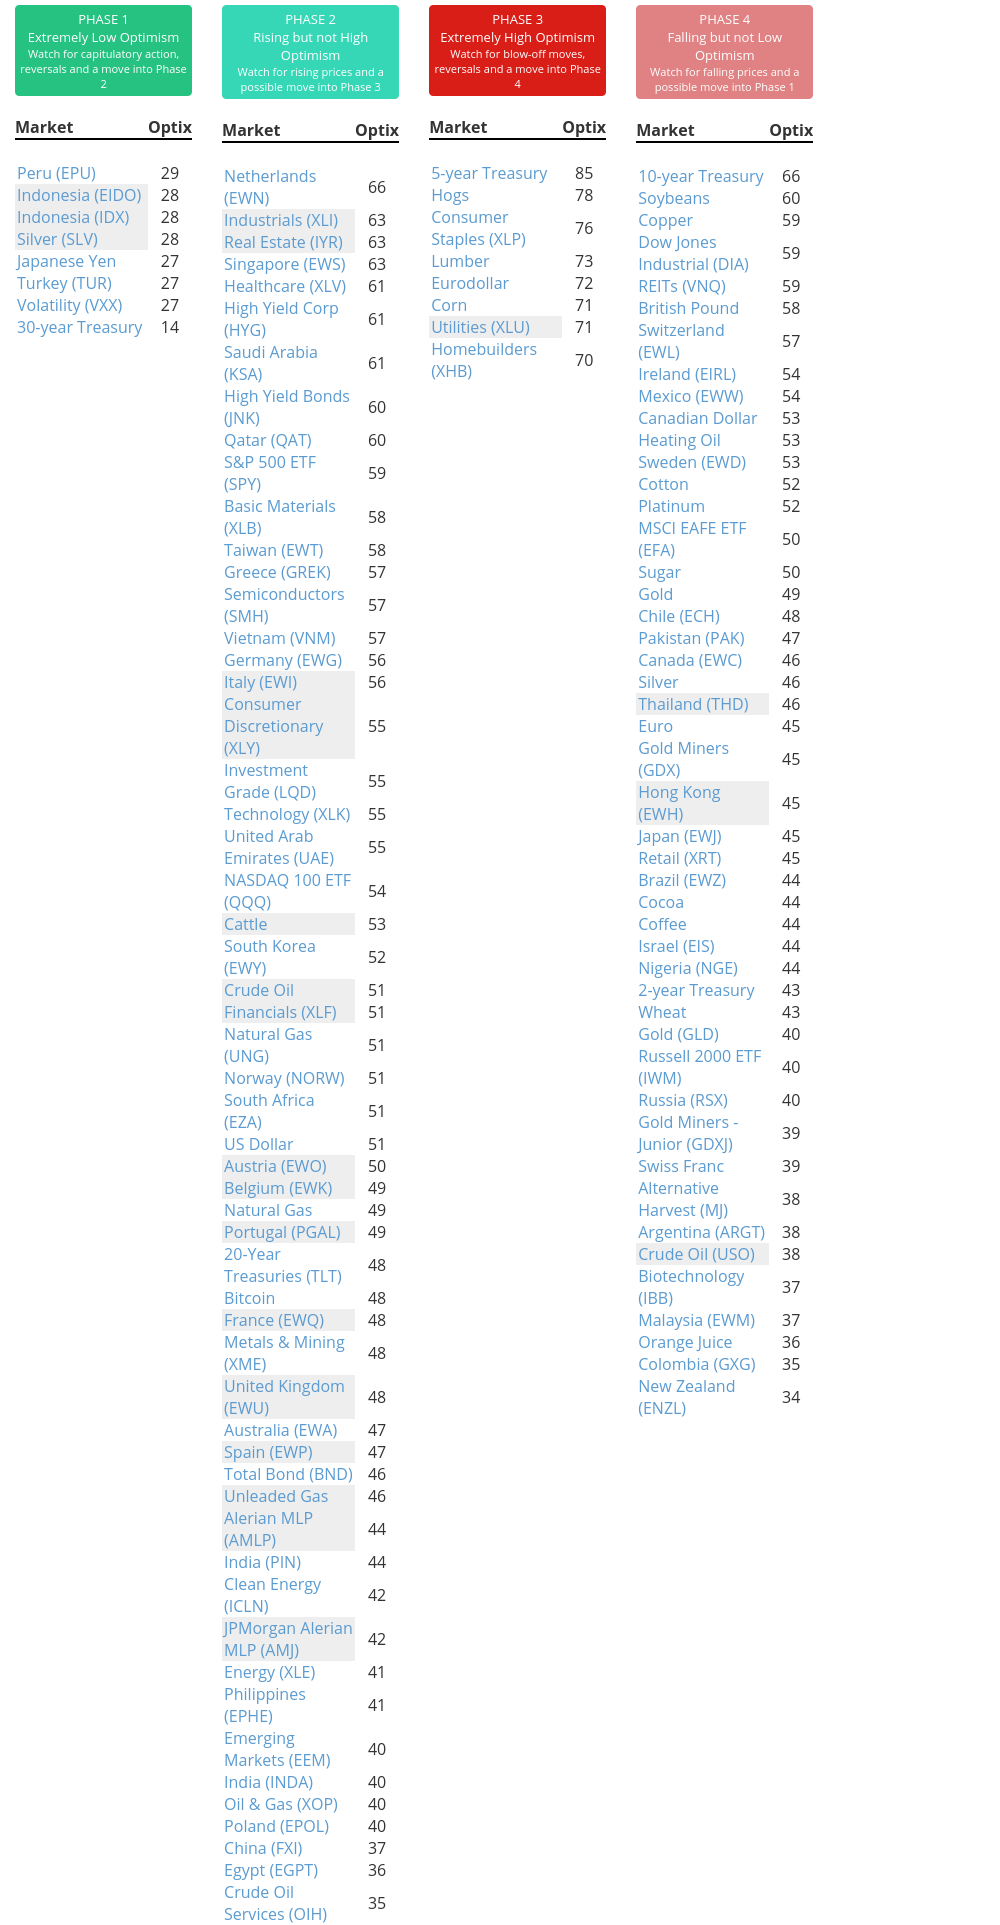
Phase Table
Ranks
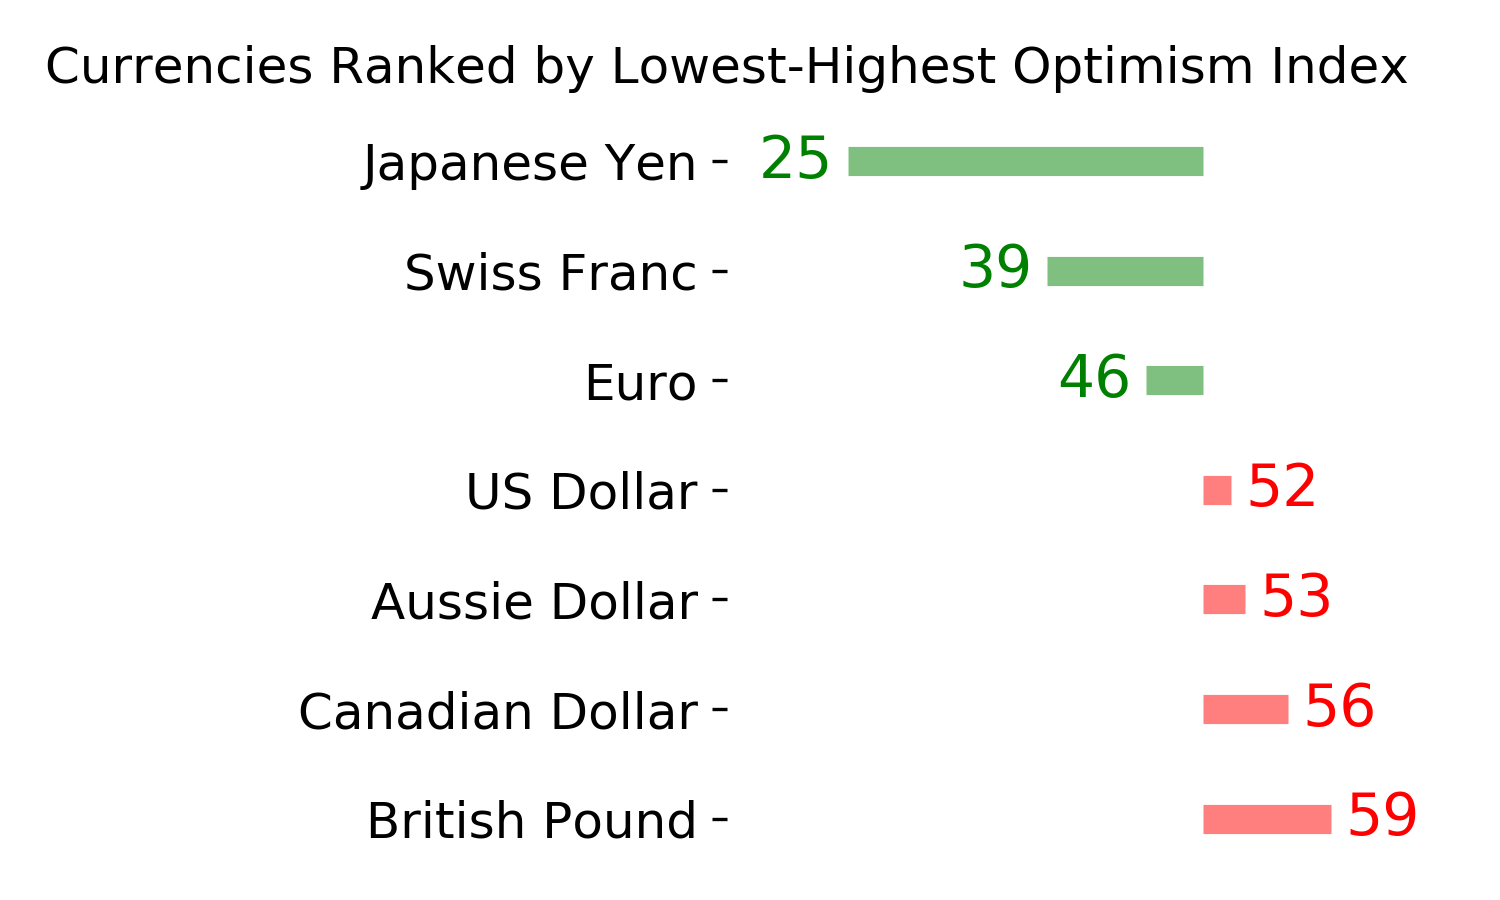
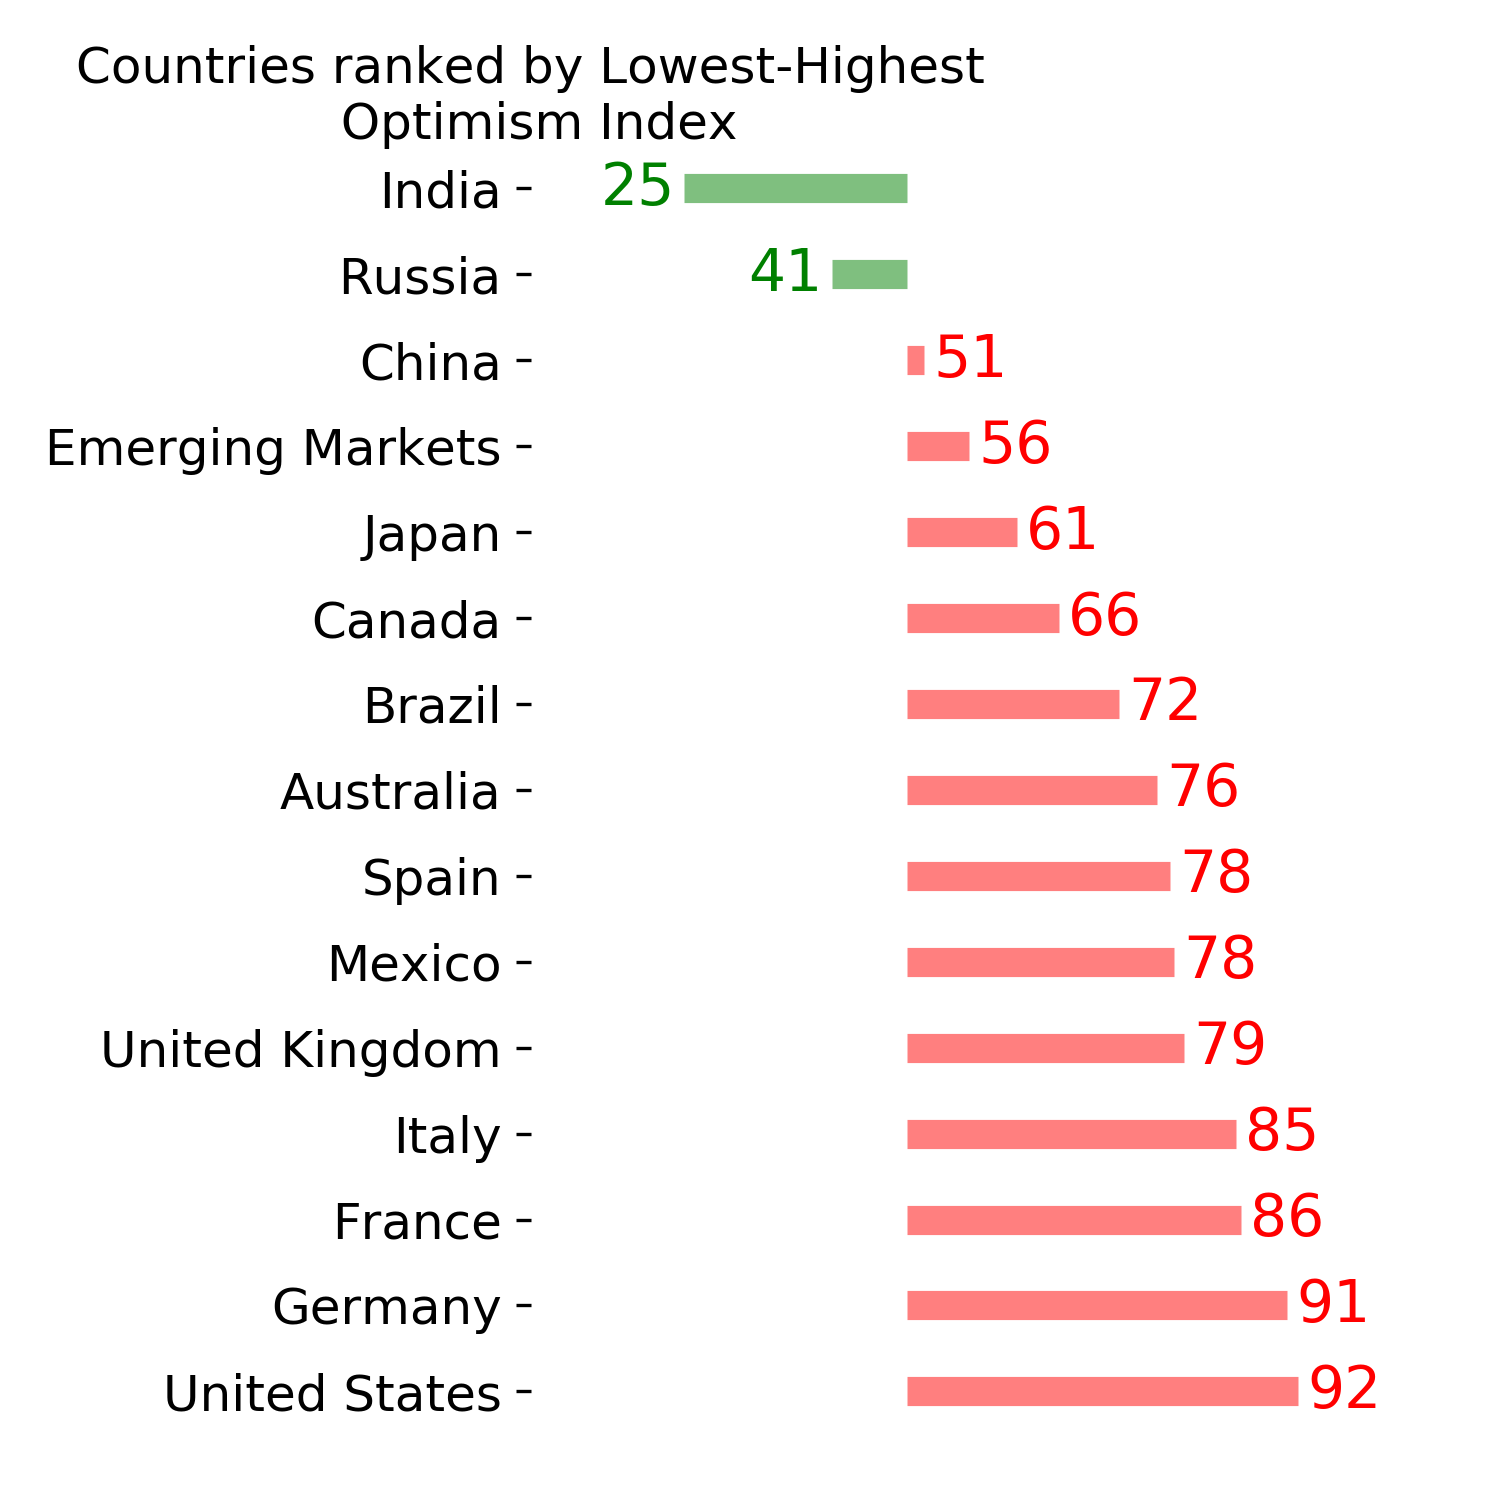
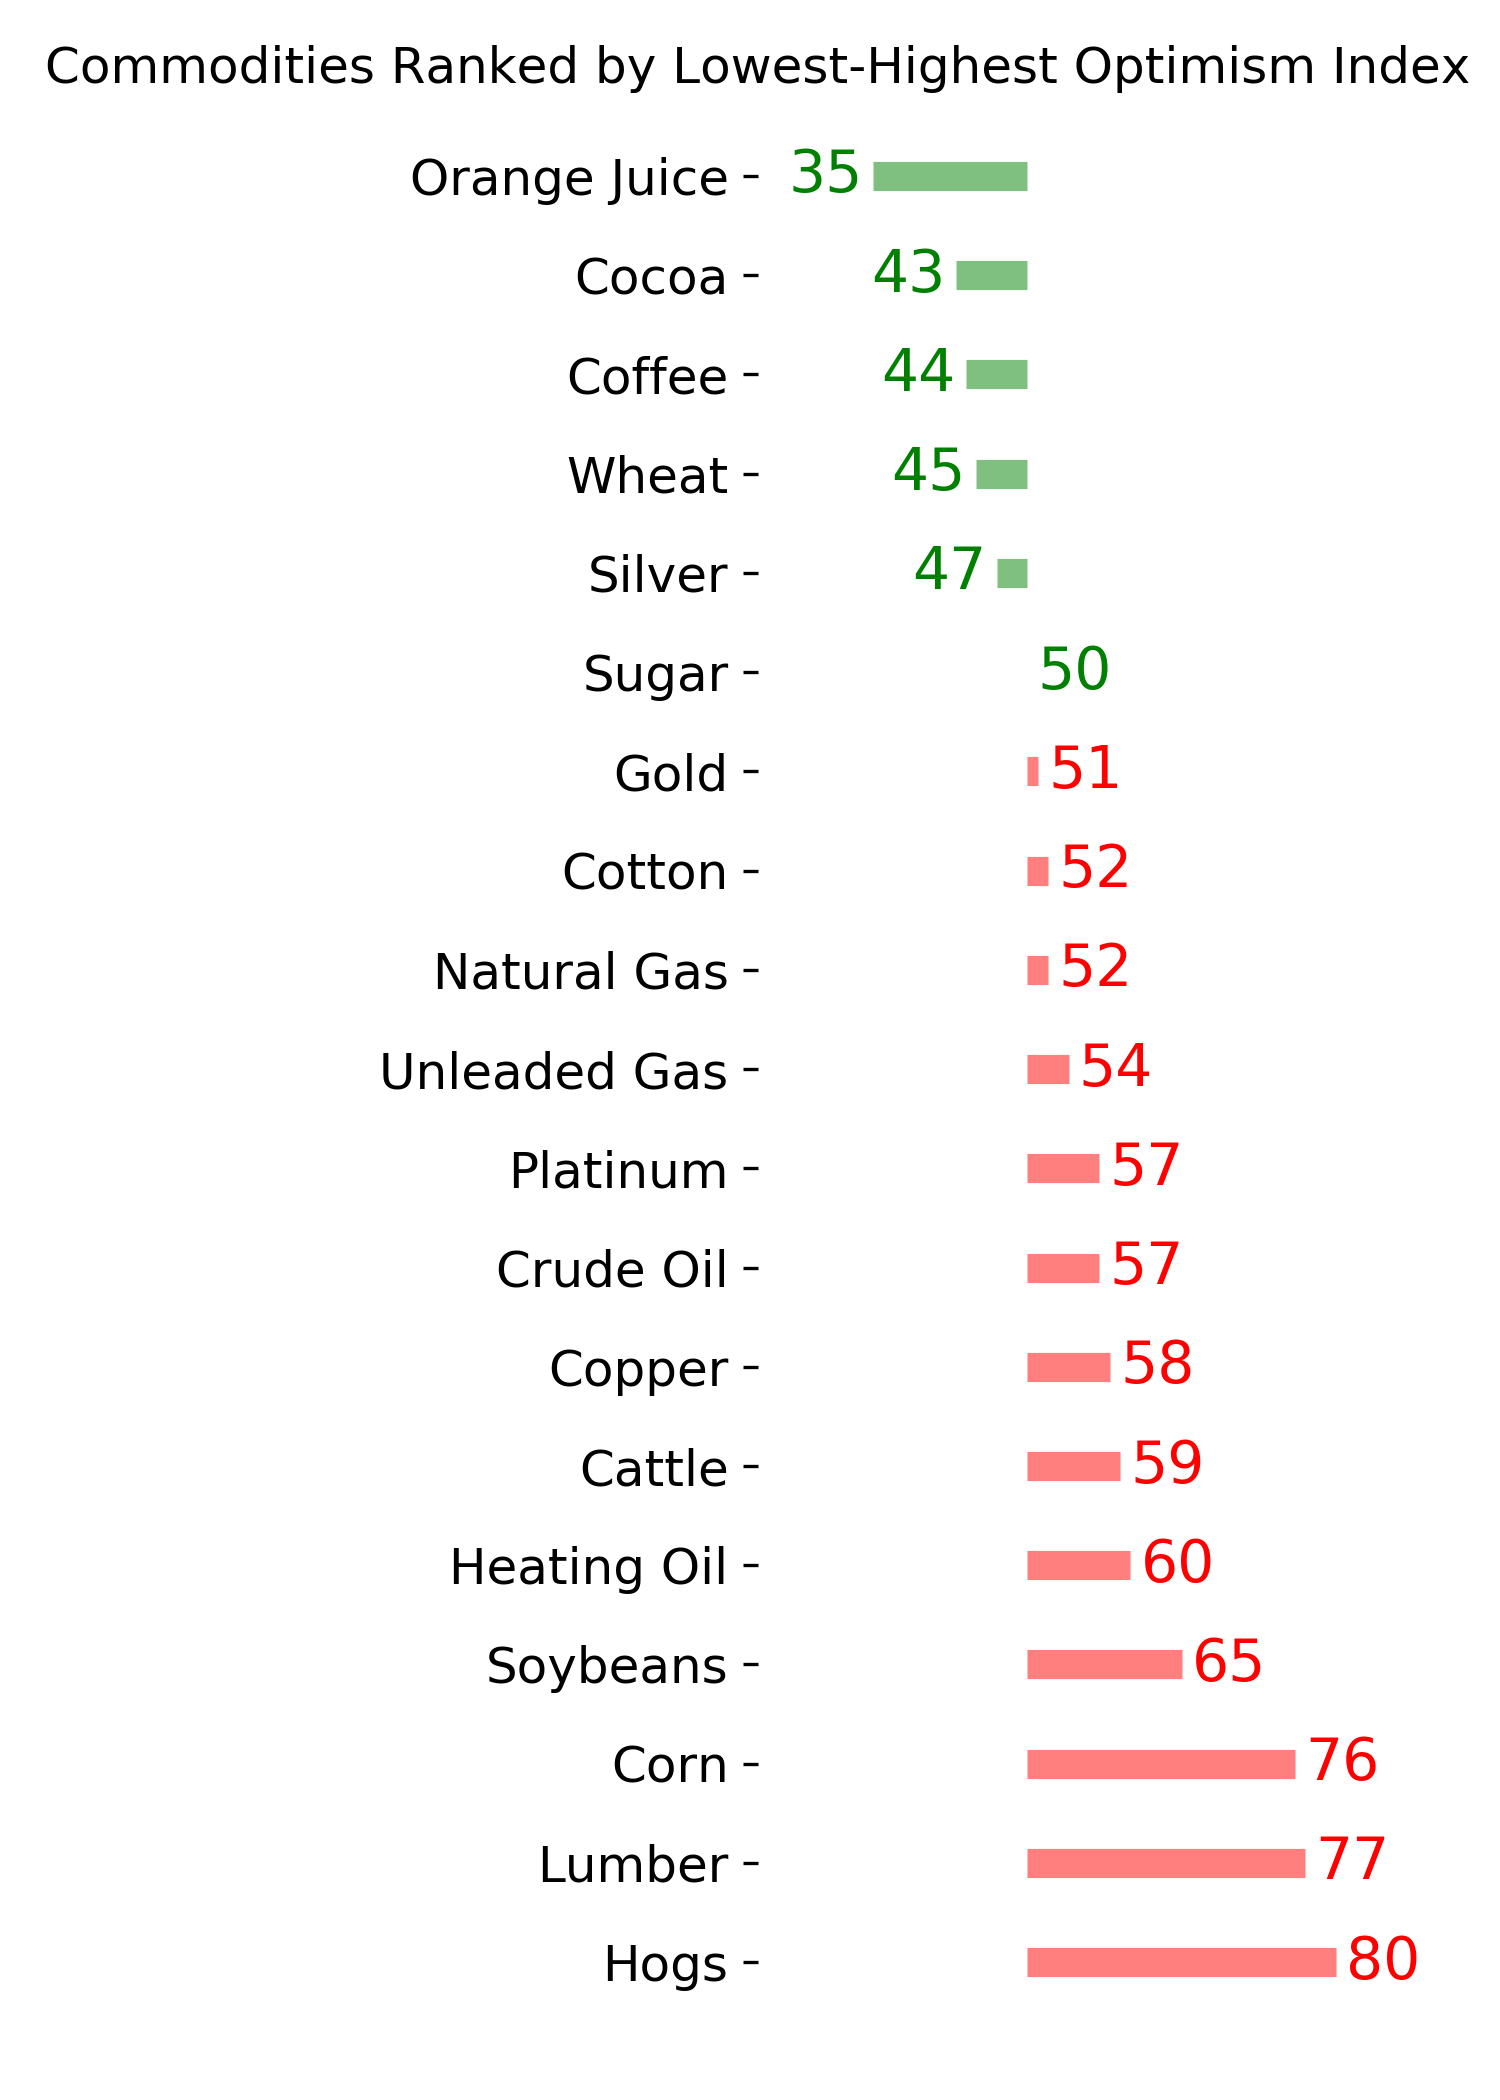
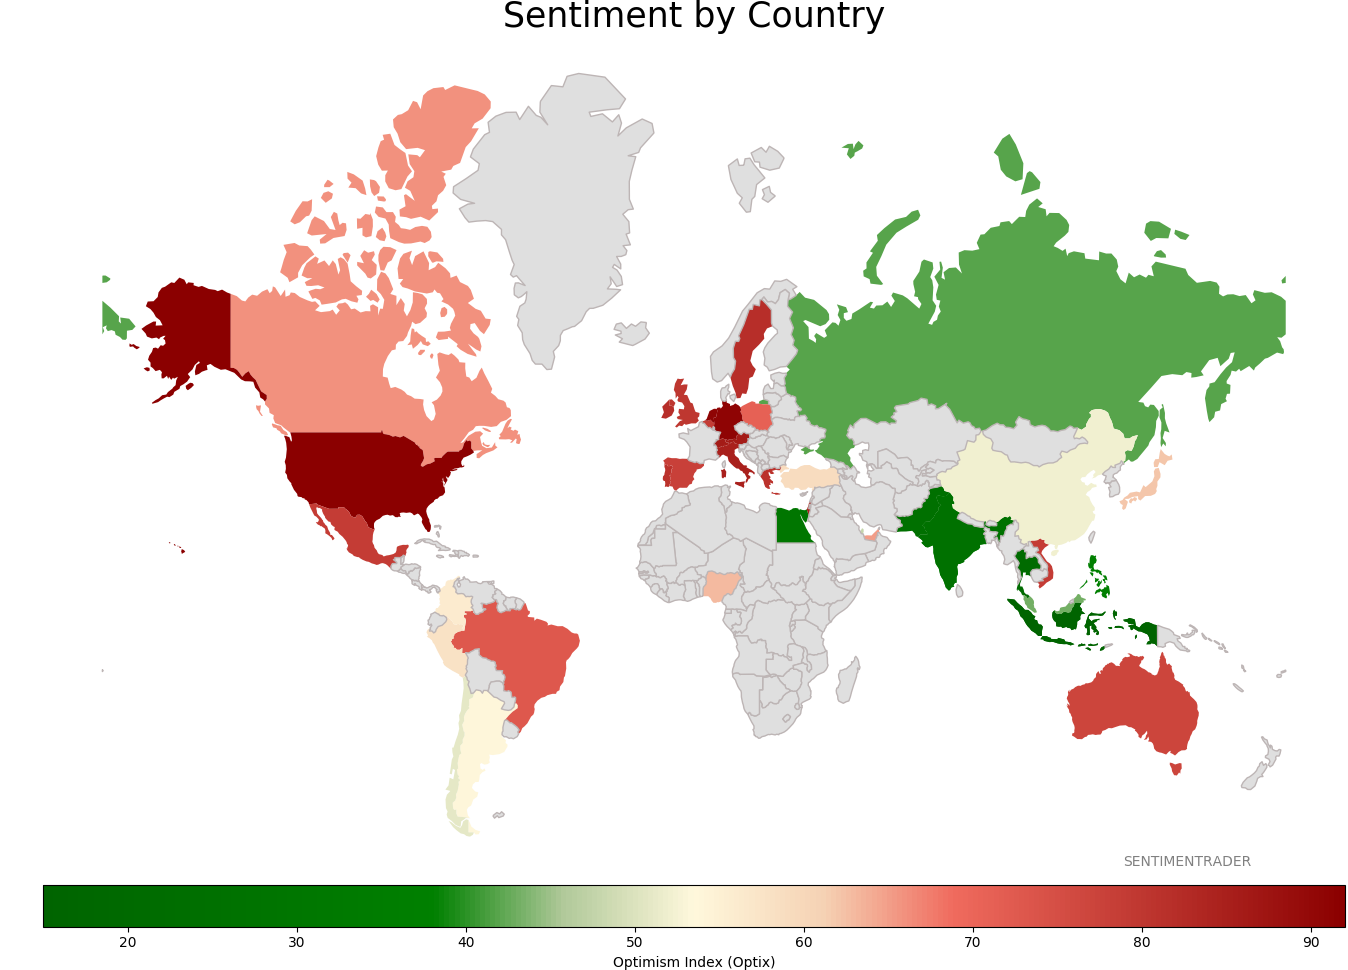
Sentiment Around The World
Optimism Index Thumbnails
|
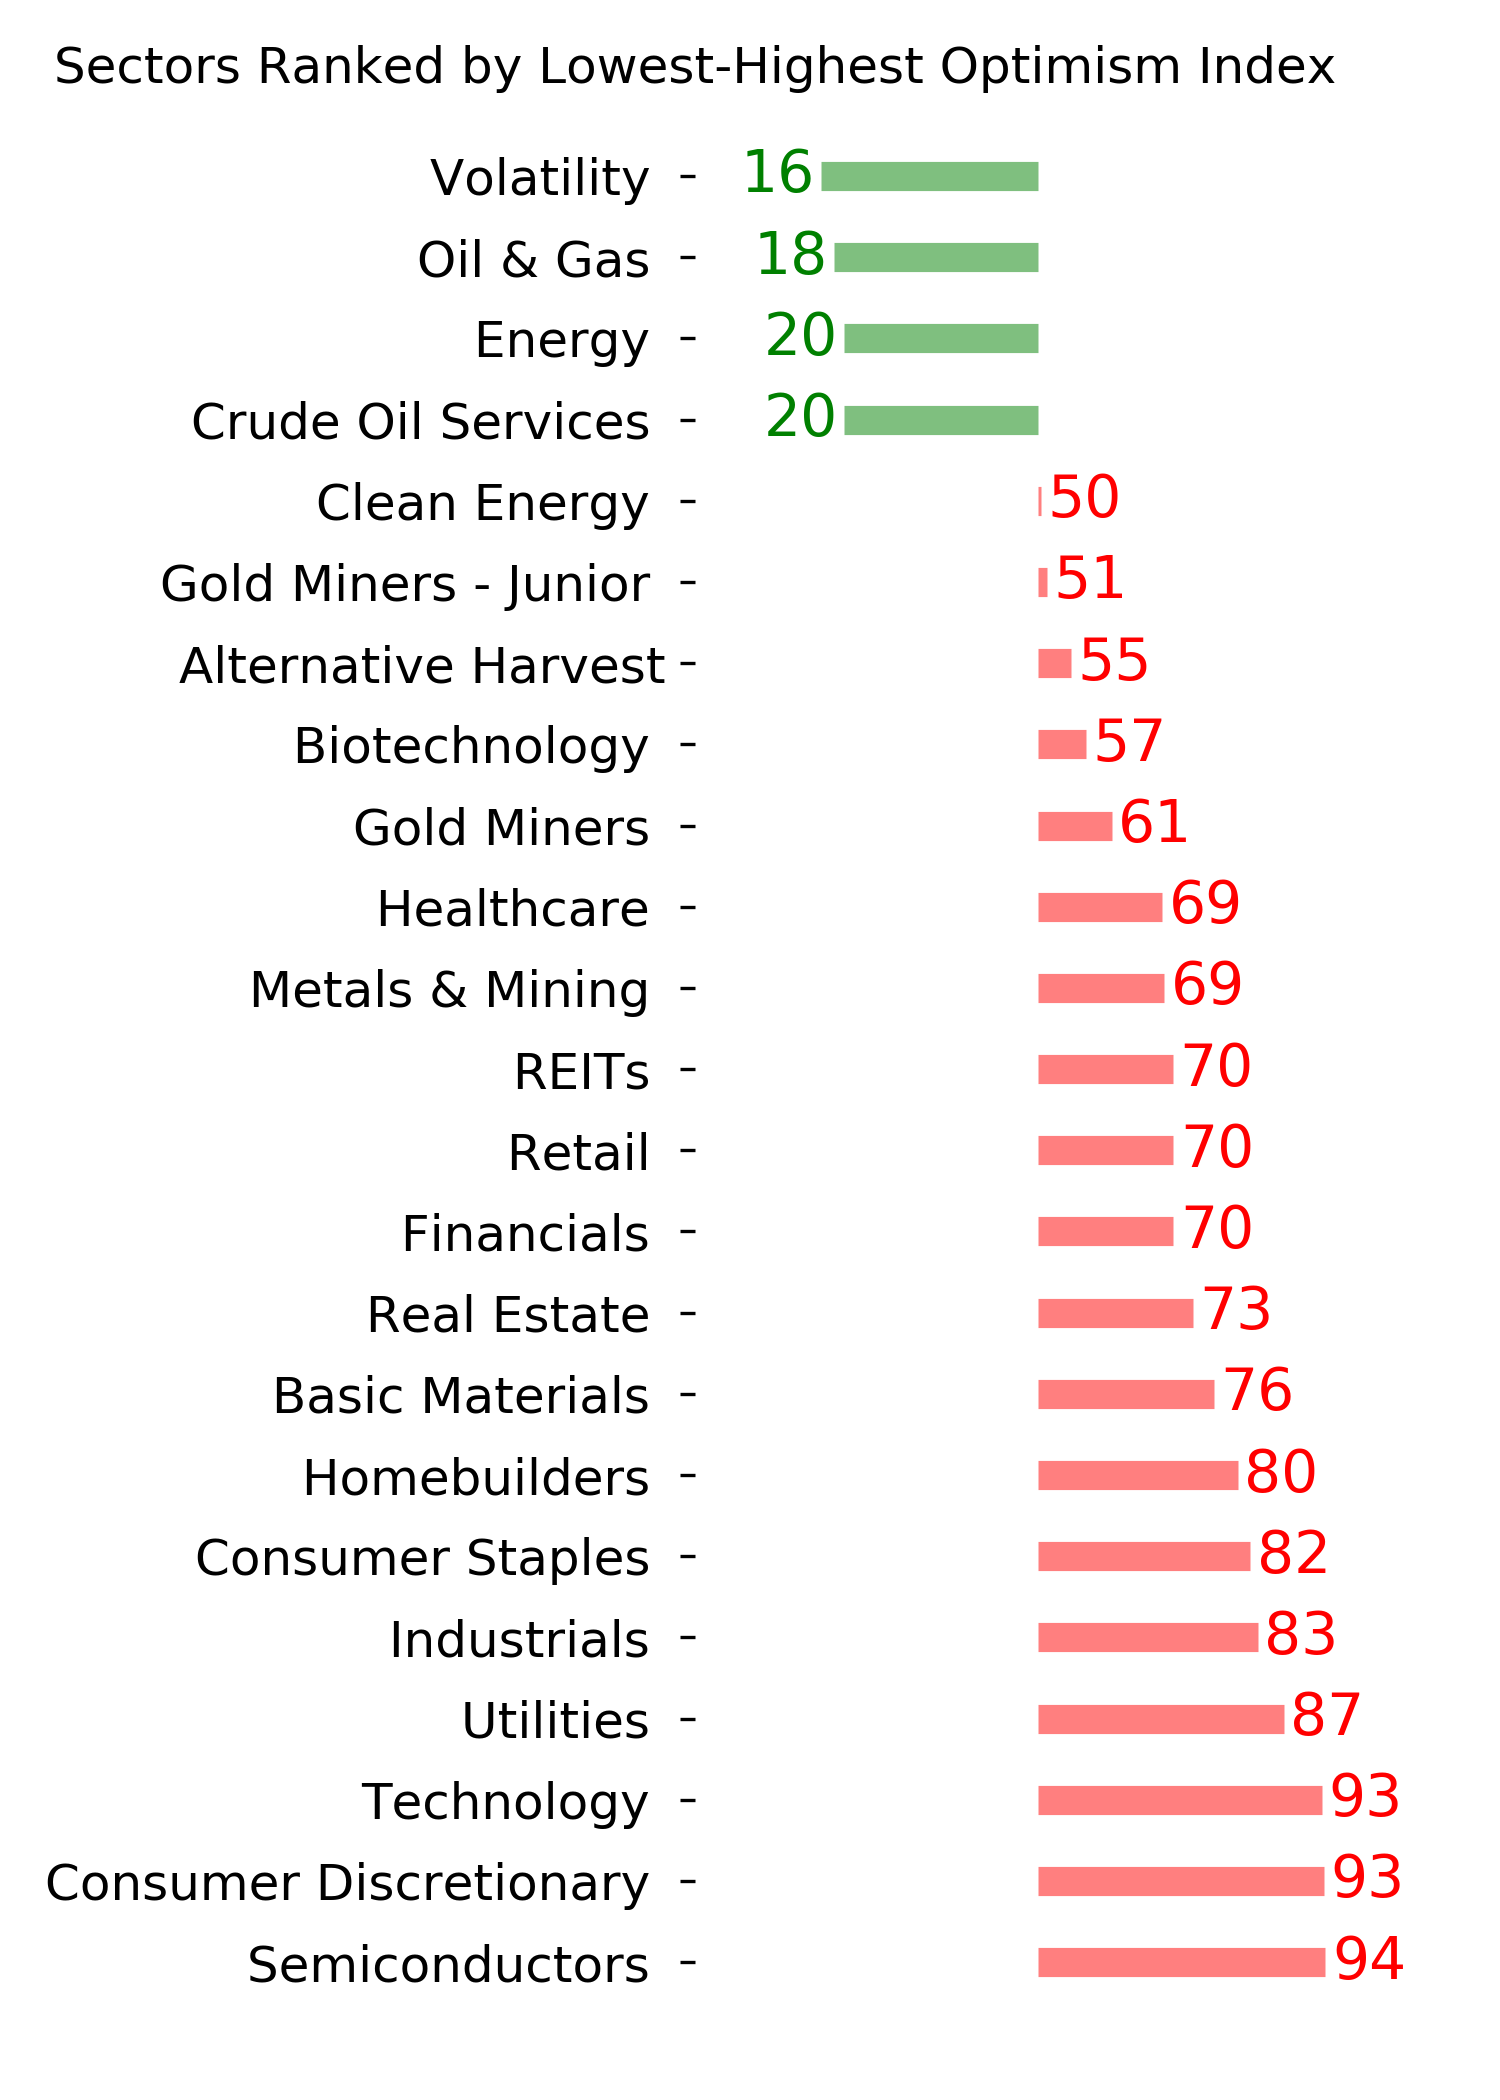
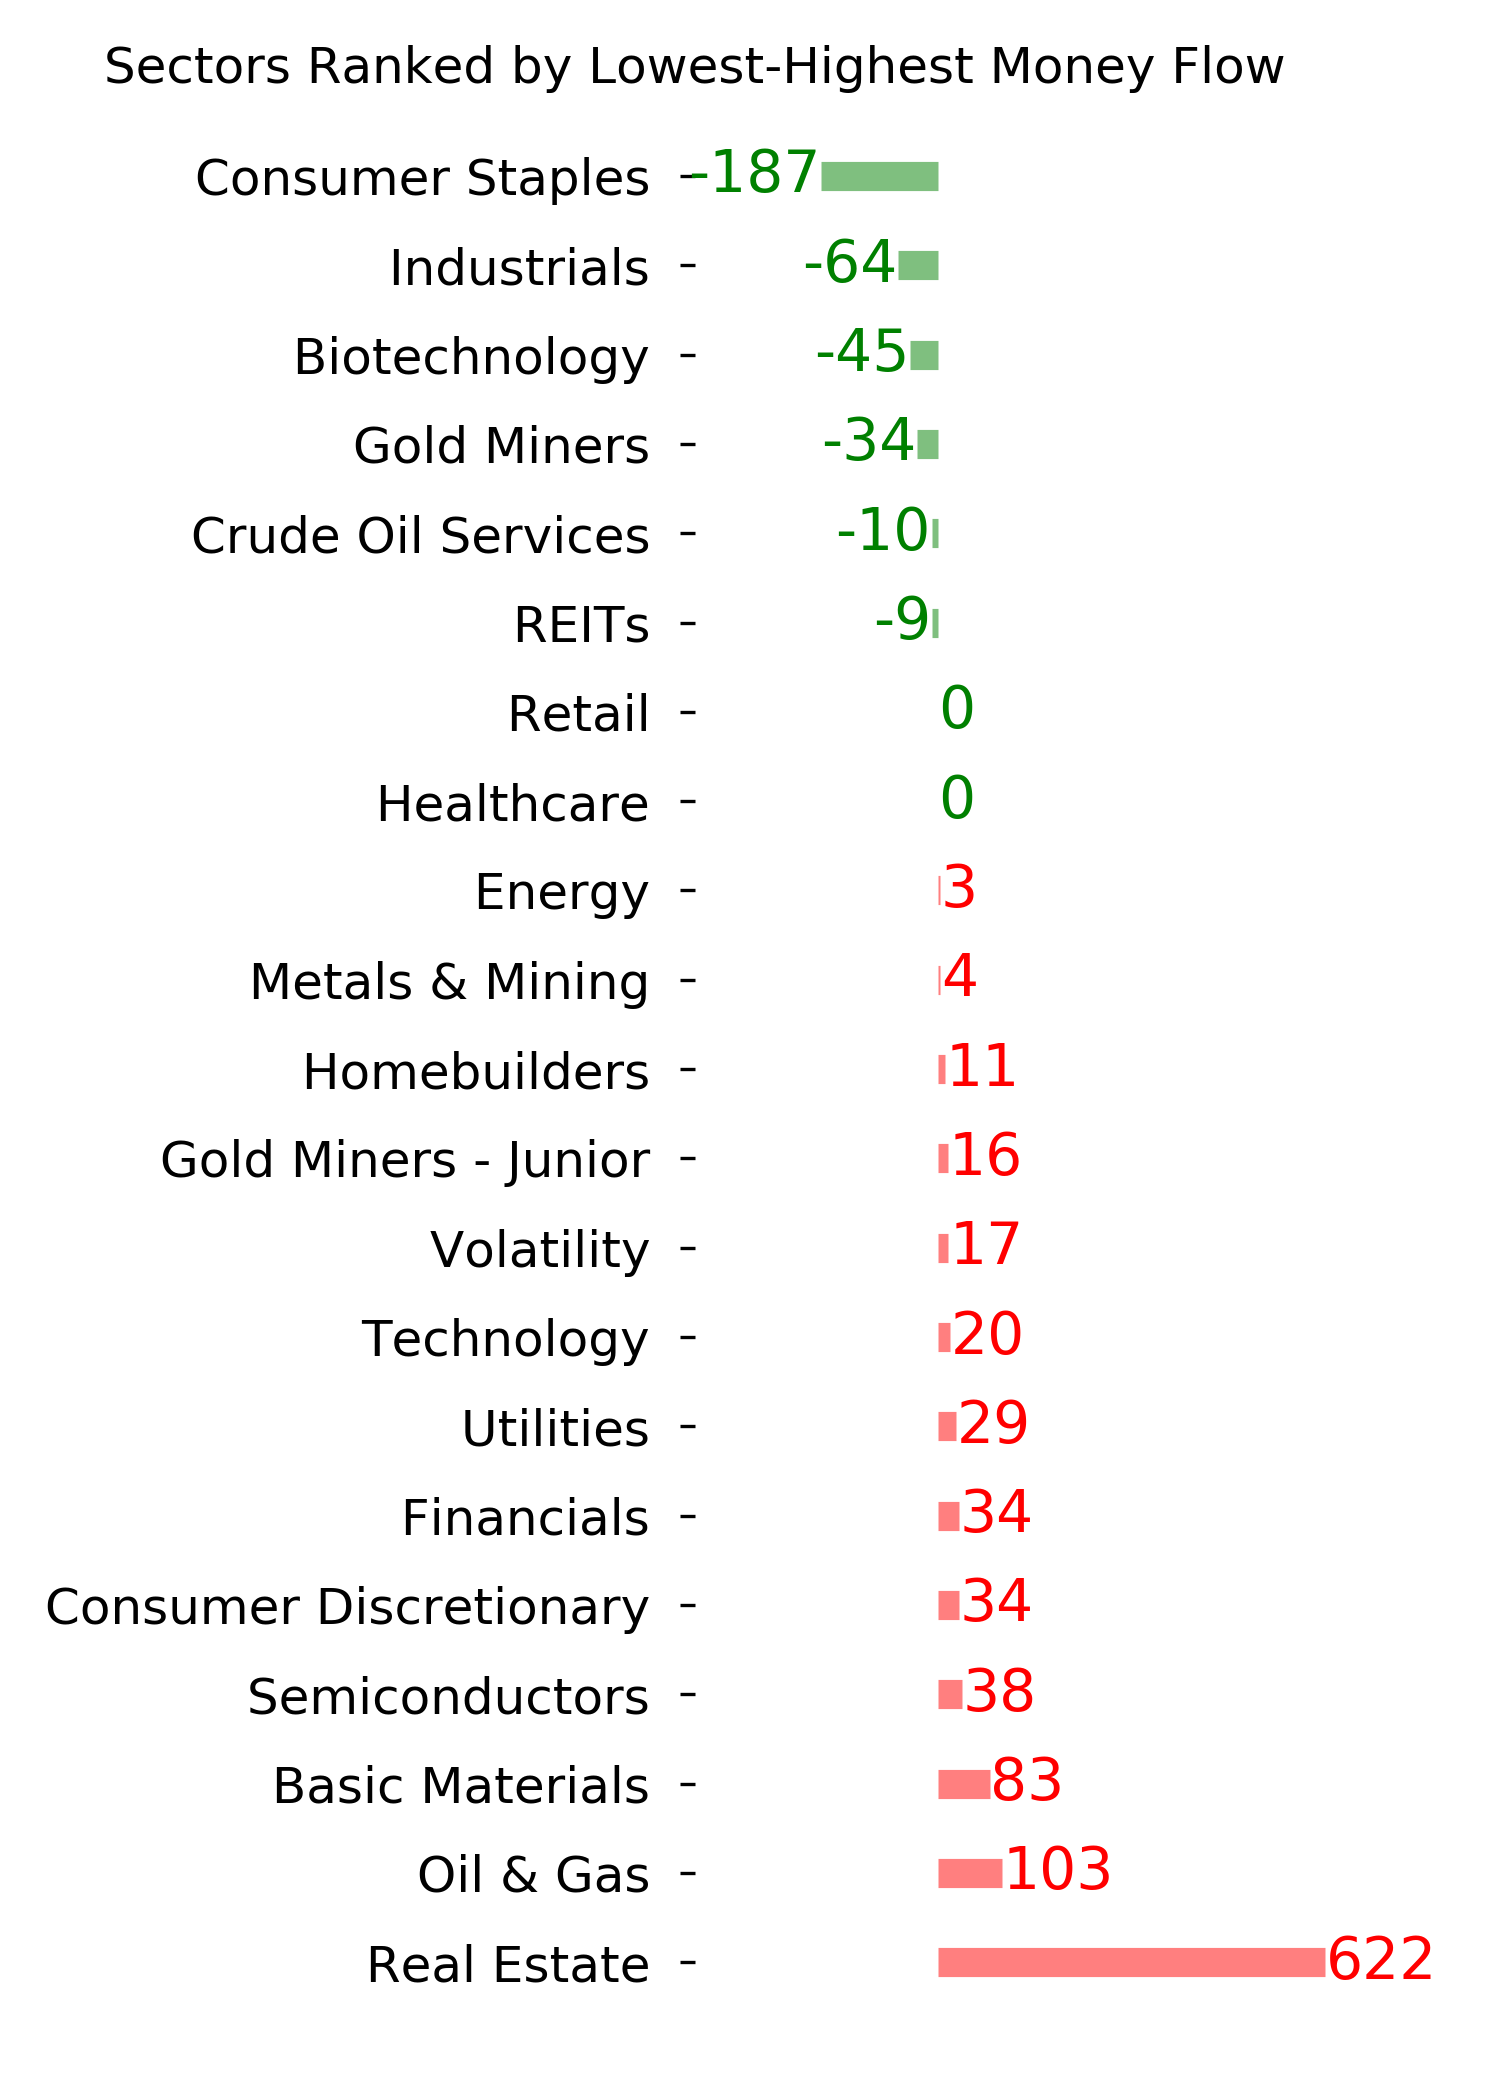
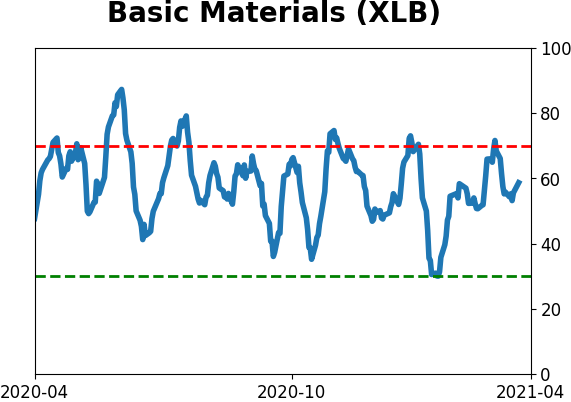
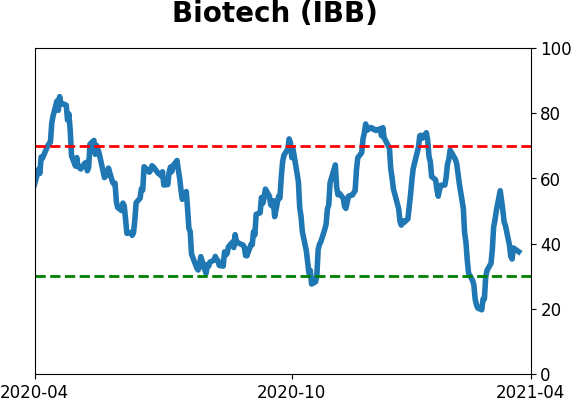
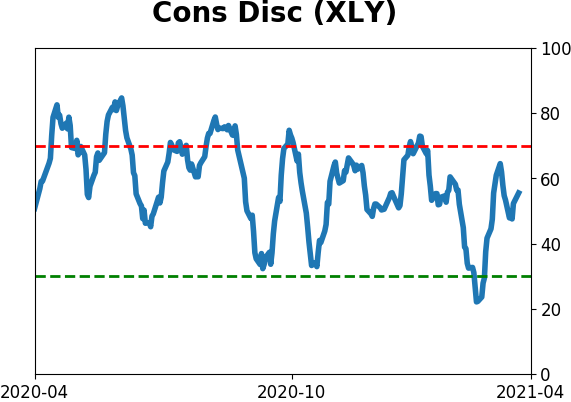
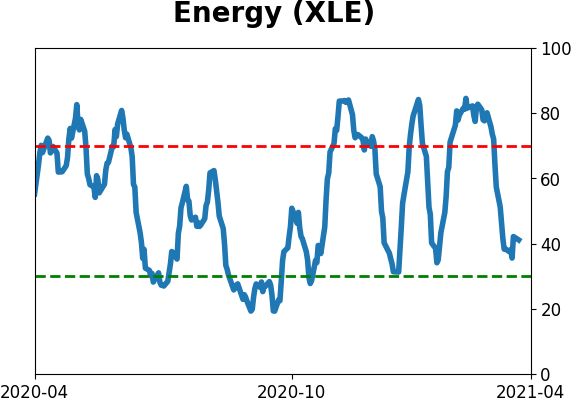
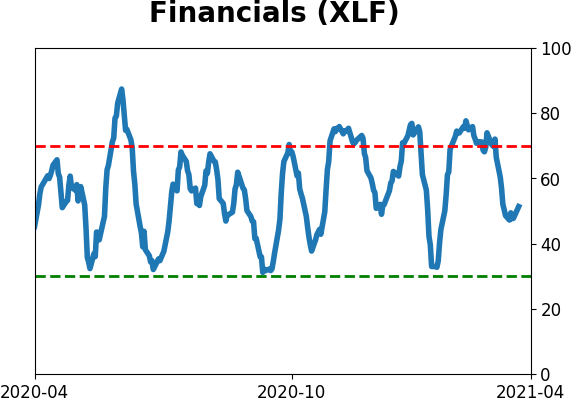
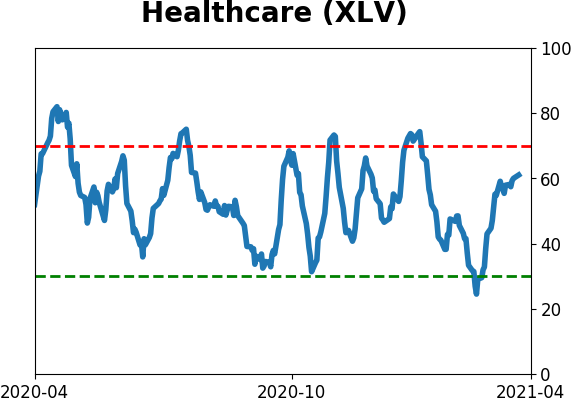
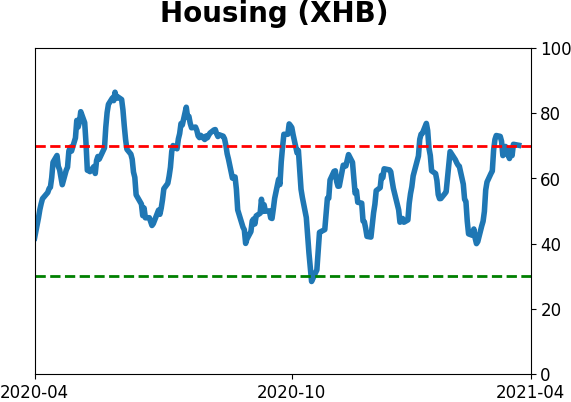
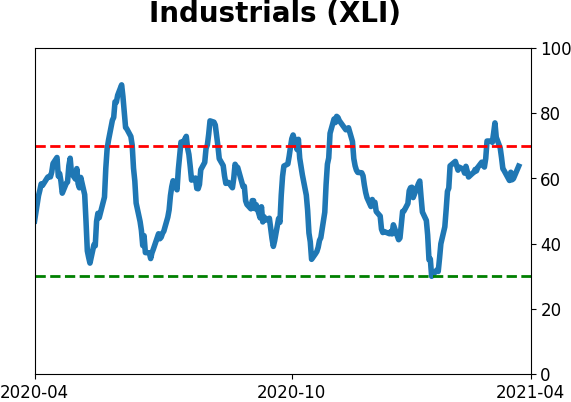
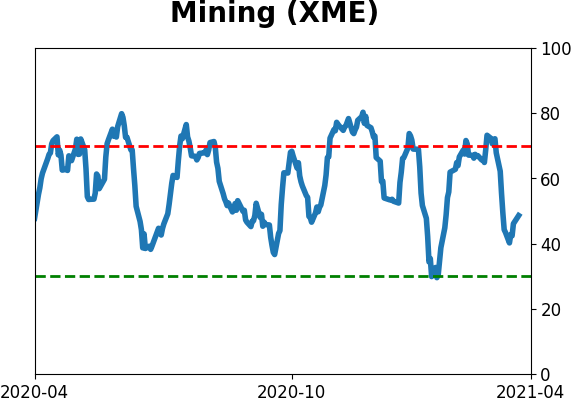
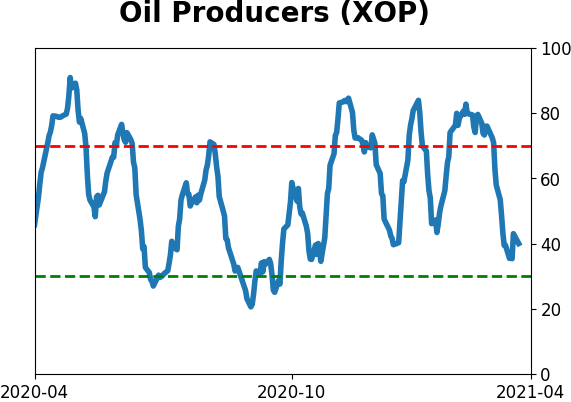
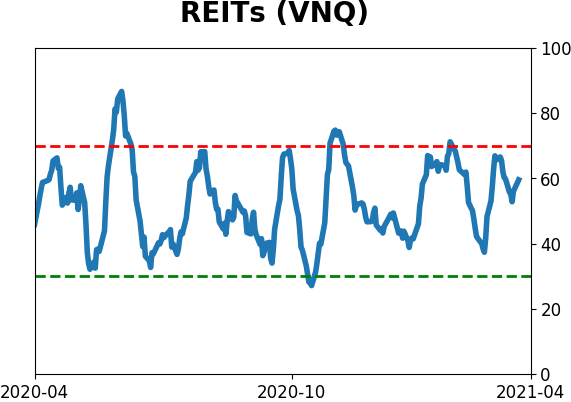
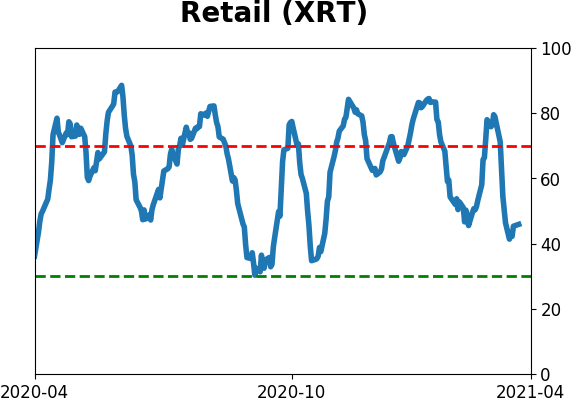
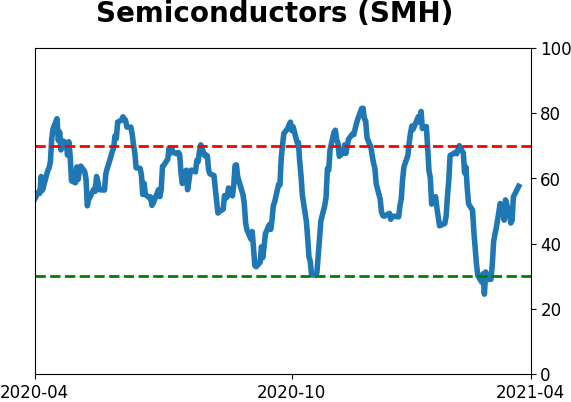
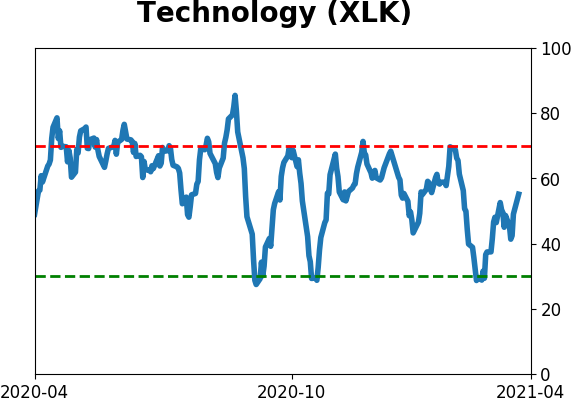
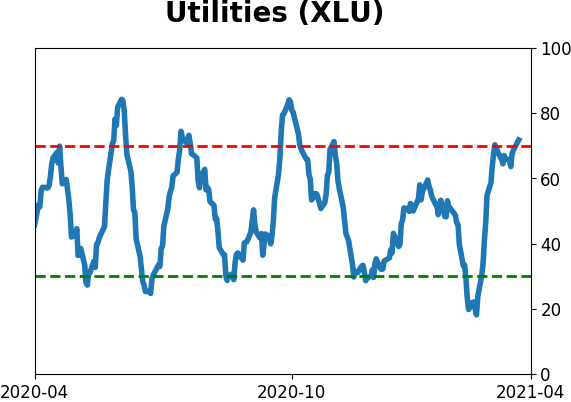
Sector ETF's - 10-Day Moving Average
|
|
|
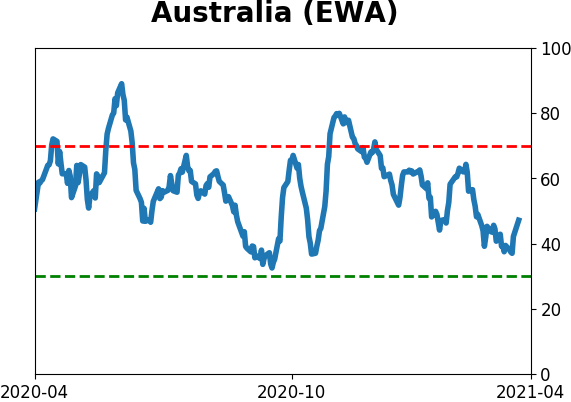
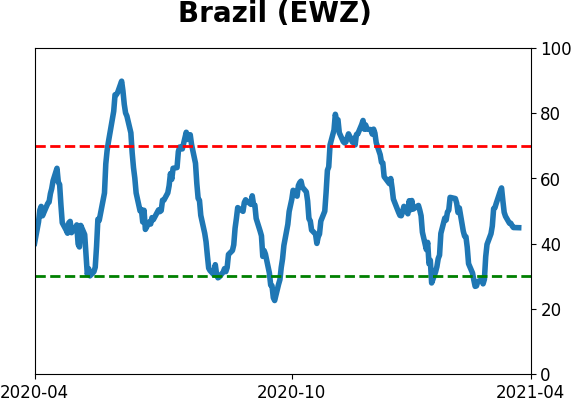
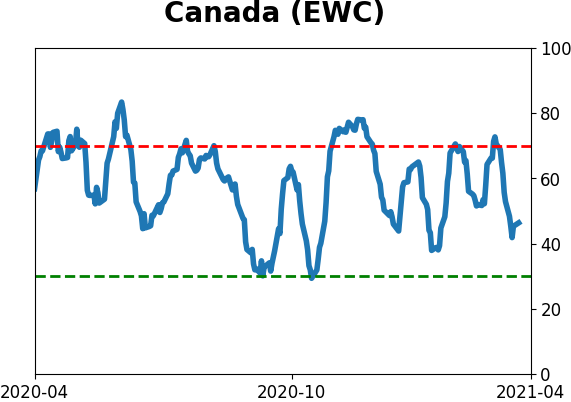
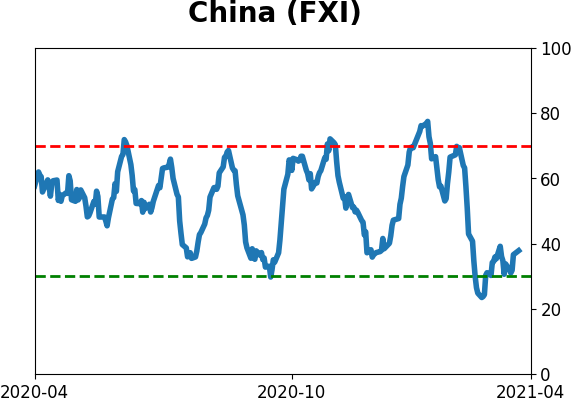
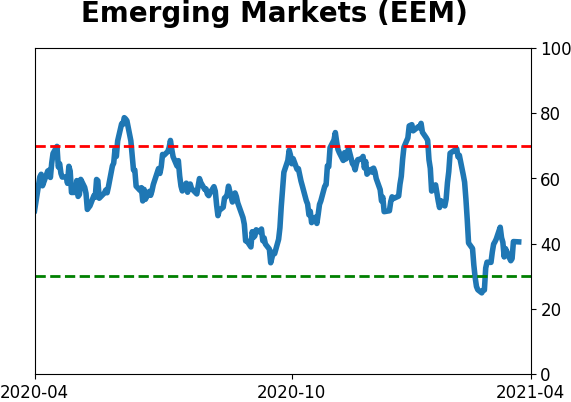
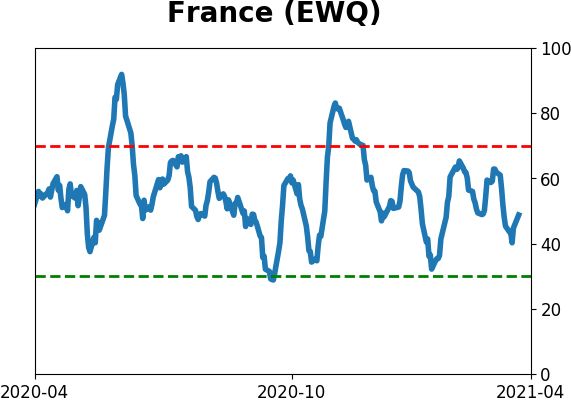
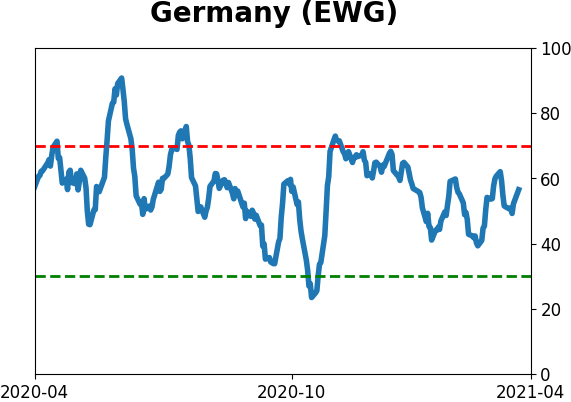
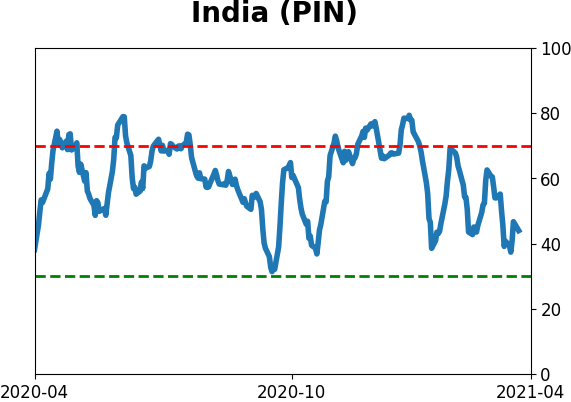
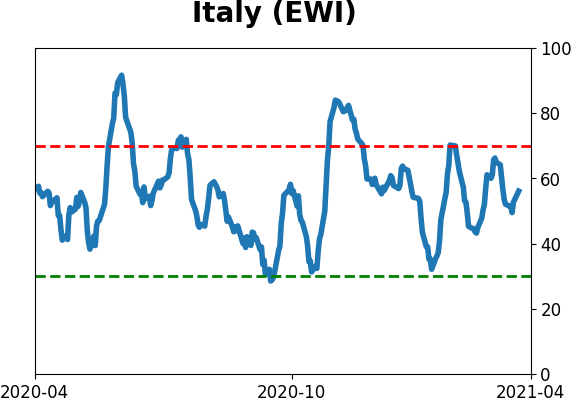
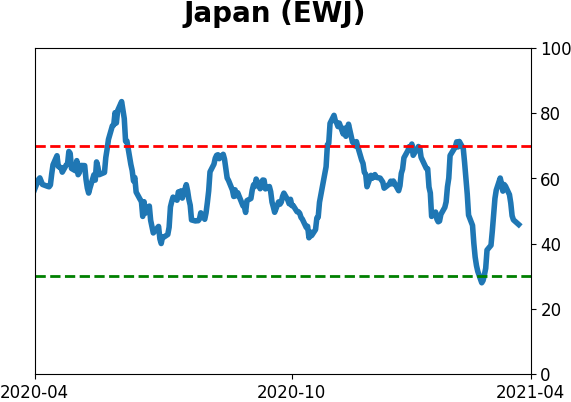
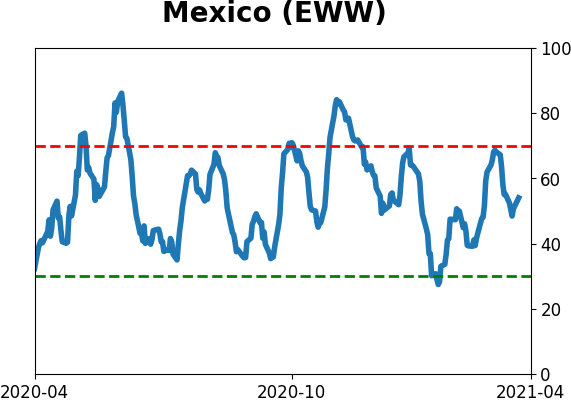
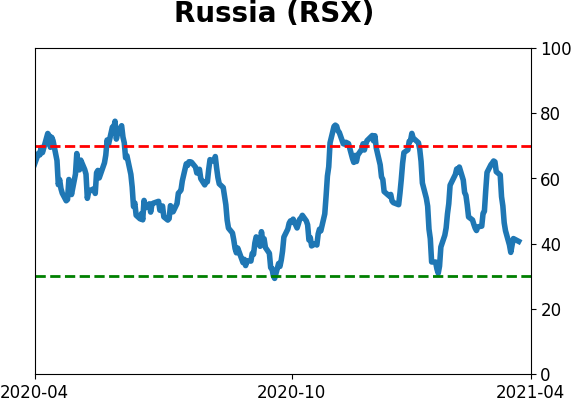
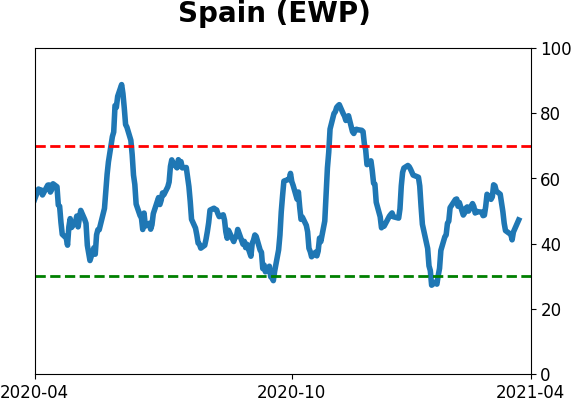
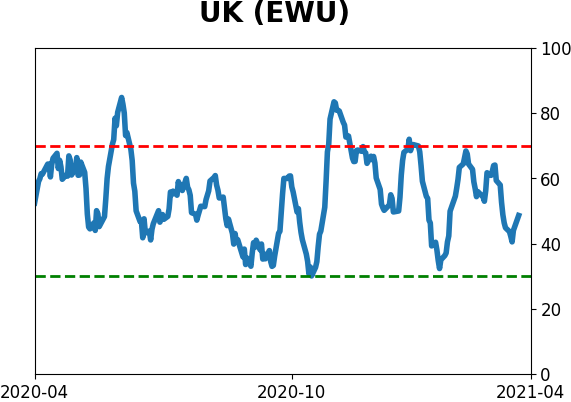
Country ETF's - 10-Day Moving Average
|
|
|
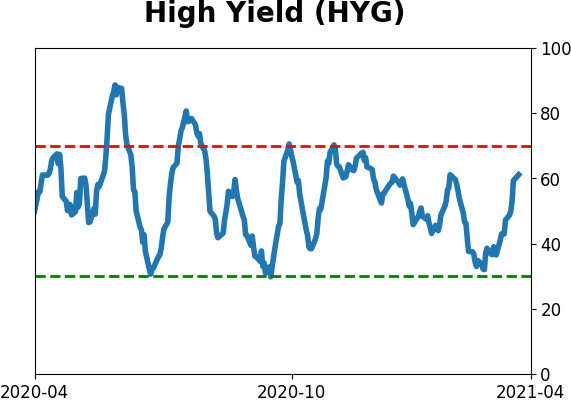
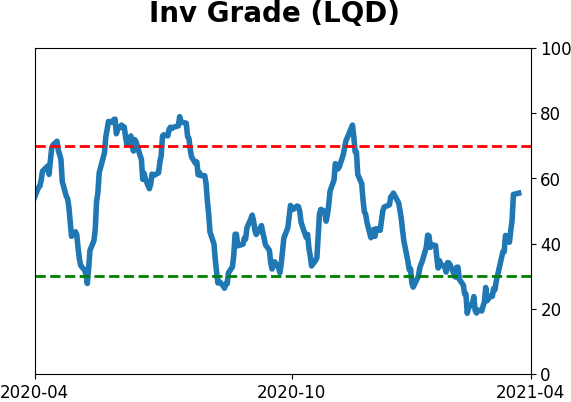
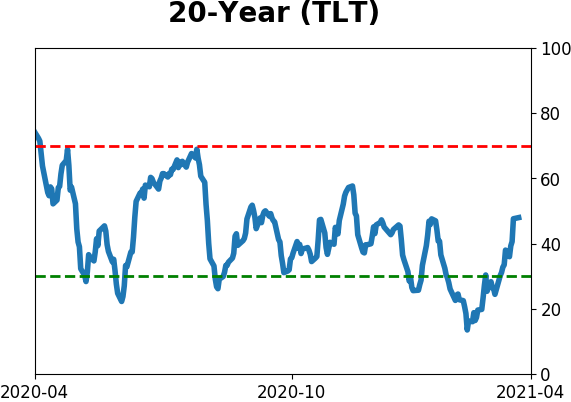
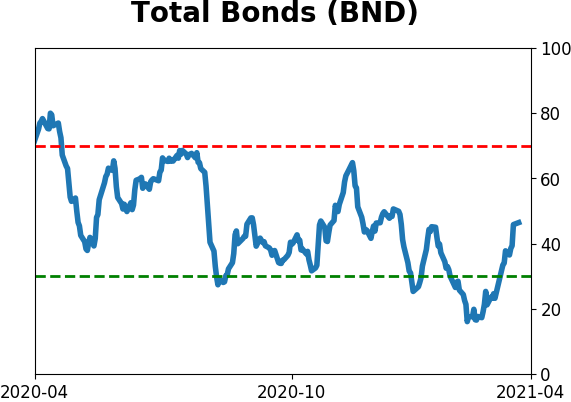
Bond ETF's - 10-Day Moving Average
|
|
|
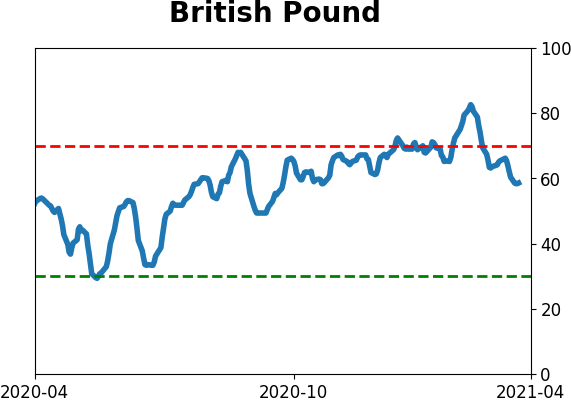
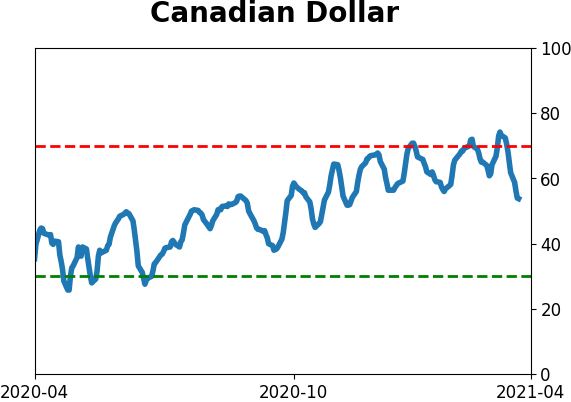
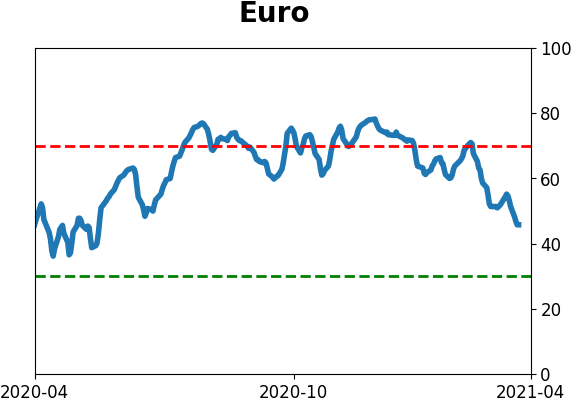
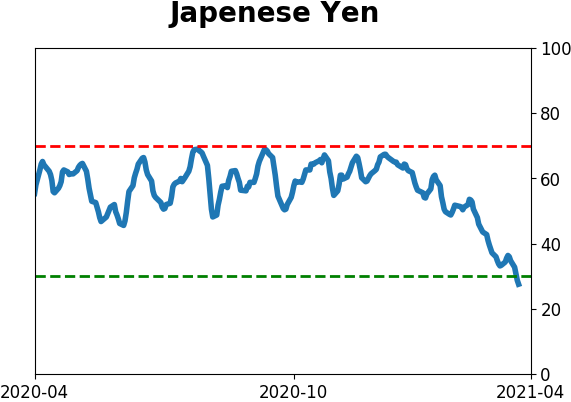
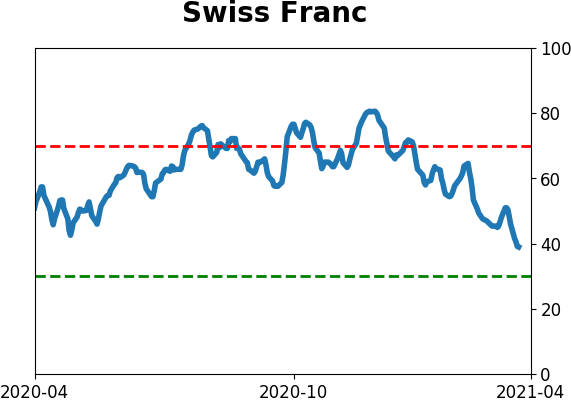
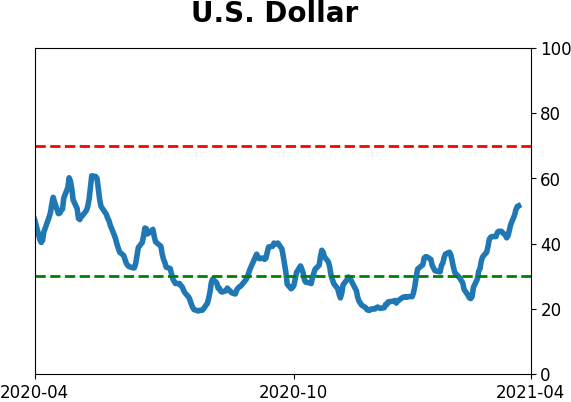
Currency ETF's - 5-Day Moving Average
|
|
|
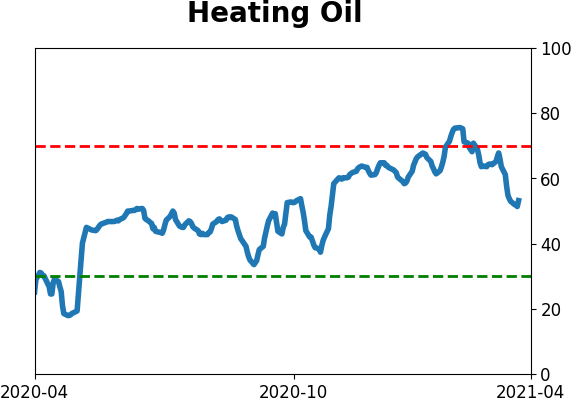
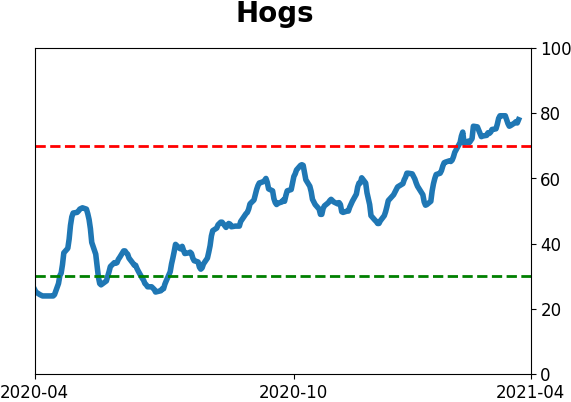
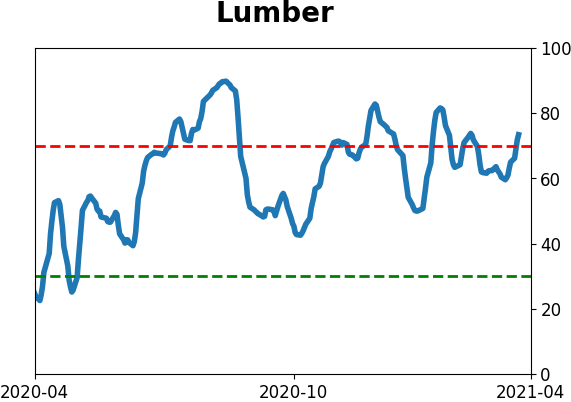
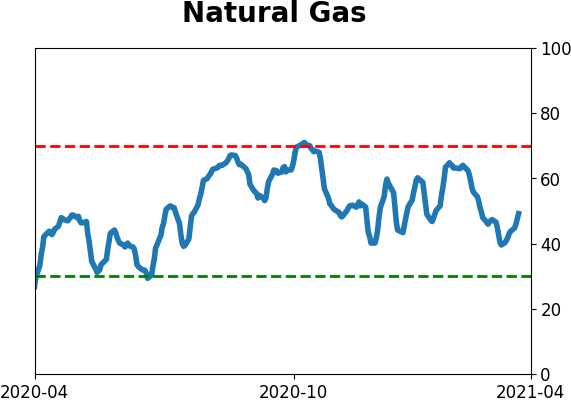
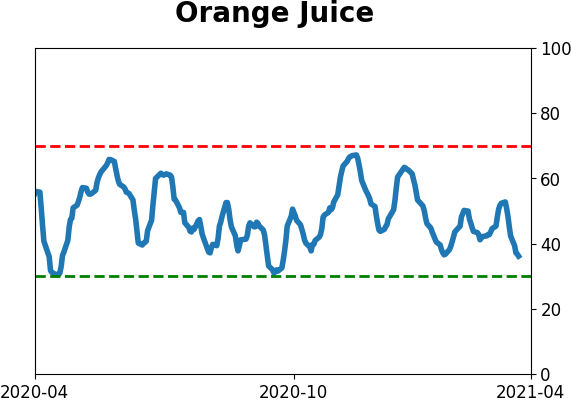
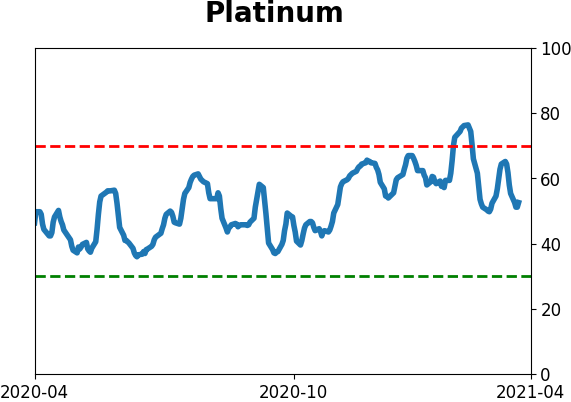
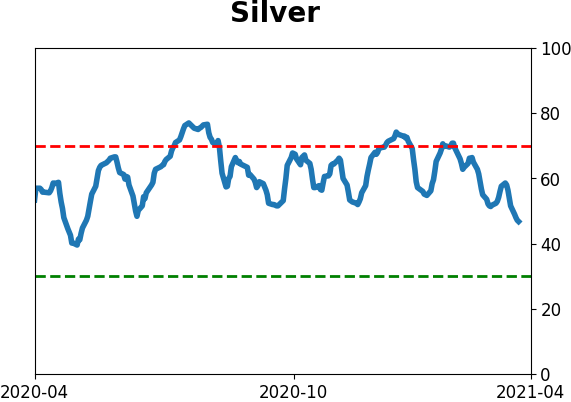
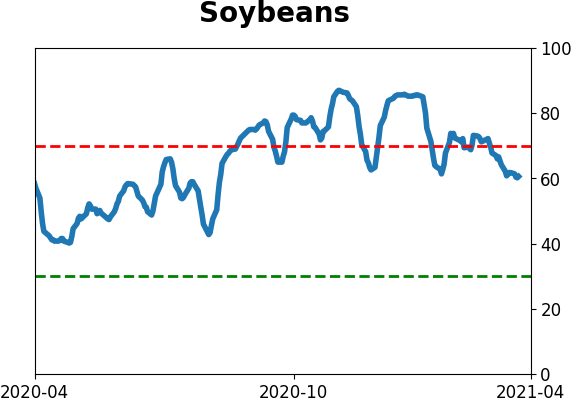
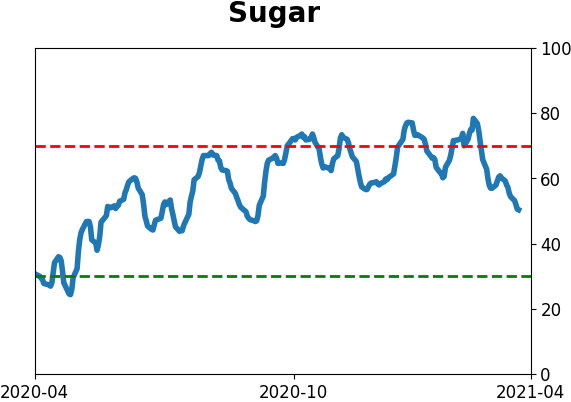
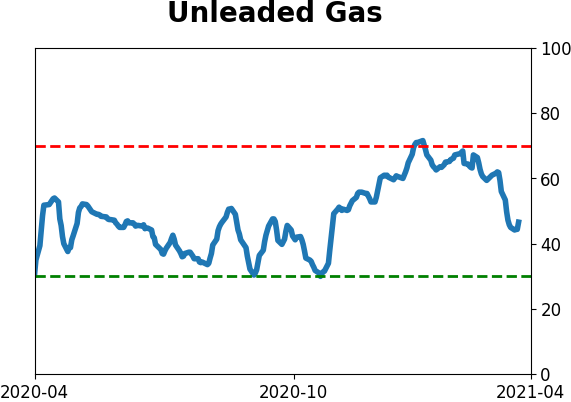
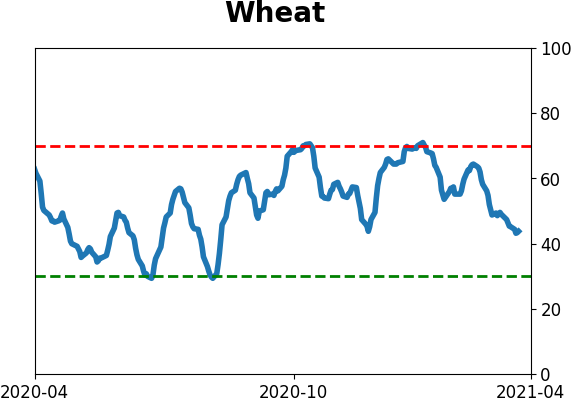
Commodity ETF's - 5-Day Moving Average
|
|