Headlines
|
|
A near-record percentage of consumers expect stocks to rise:
Two years ago, the average U.S. consumer expected stocks to keep dropping. That pessimism was the worst in a decade, but now it has rebounded to the most optimistic in years, with a net 20% expecting stocks to rise. That is not necessarily a good contrary indicator, however, especially on the heels of what we saw in 2022.
|
Smart / Dumb Money Confidence
|
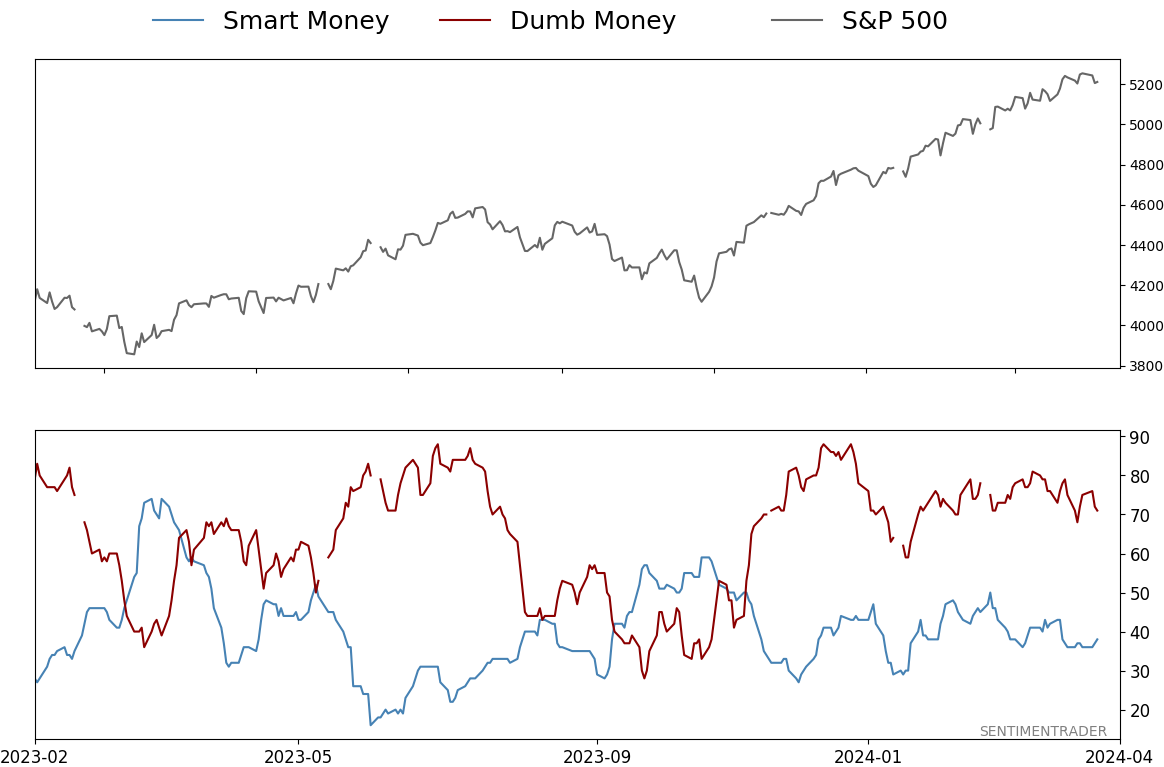
Smart Money Confidence: 38%
Dumb Money Confidence: 71%
|
|
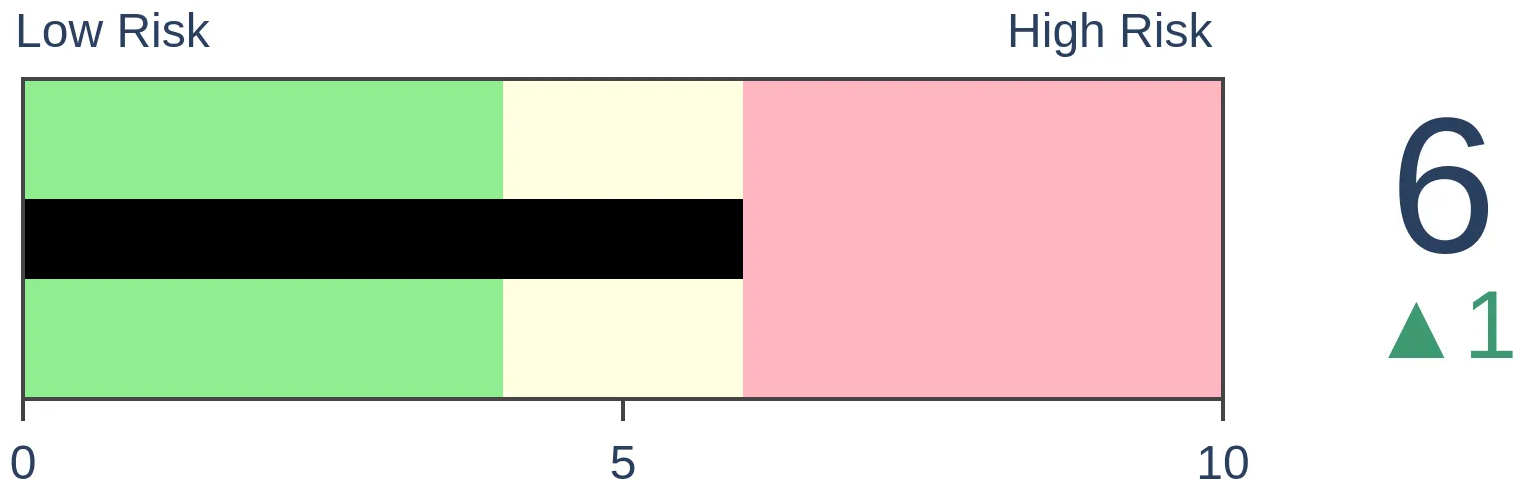
Risk Levels
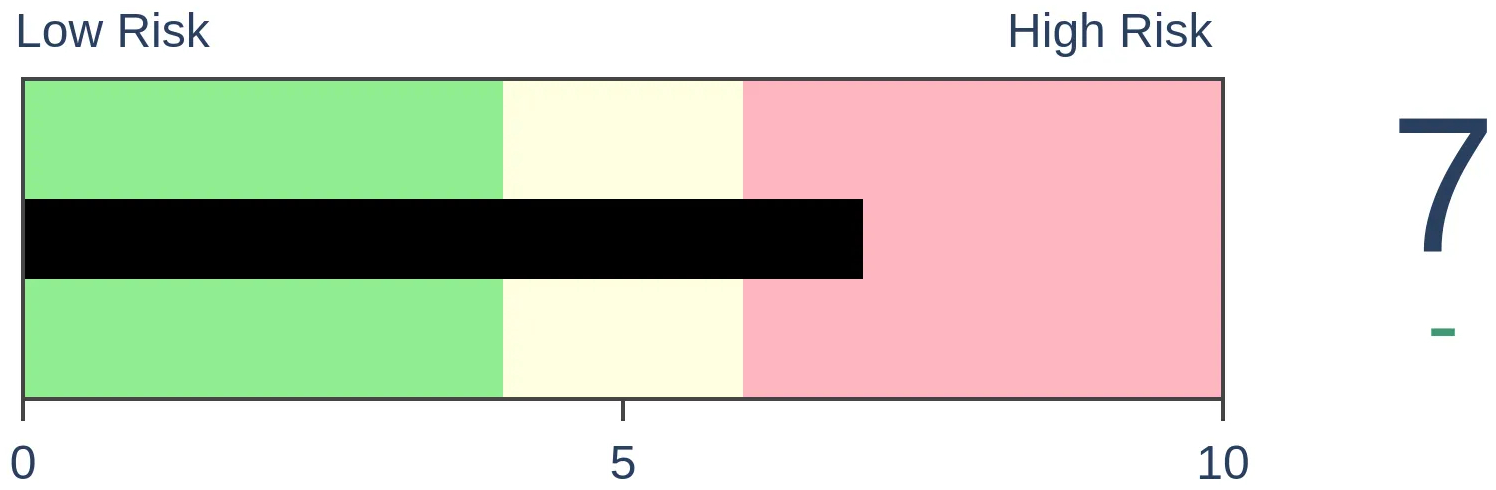
Stocks Short-Term
|
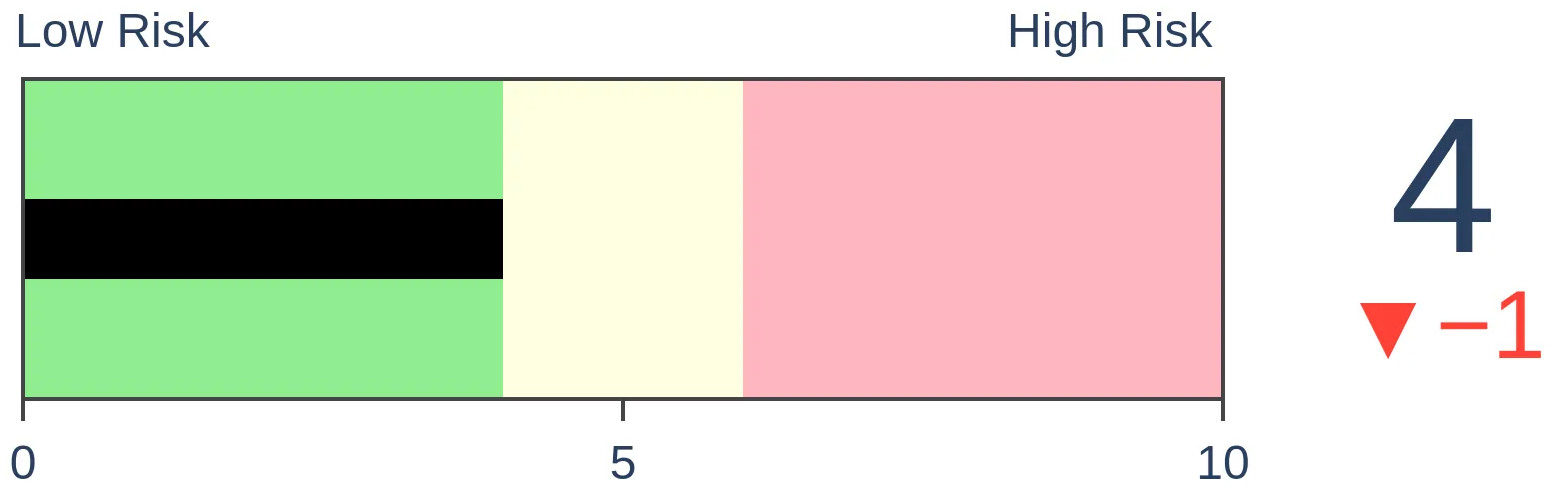
Stocks Medium-Term
|
|
Bonds
|
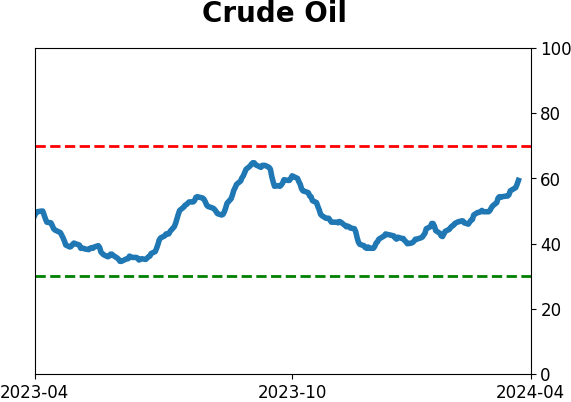
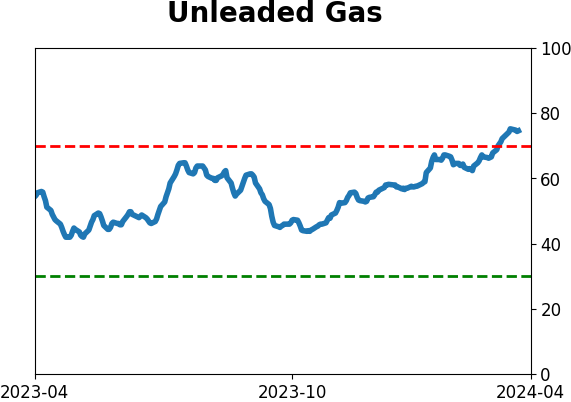
Crude Oil

|
|
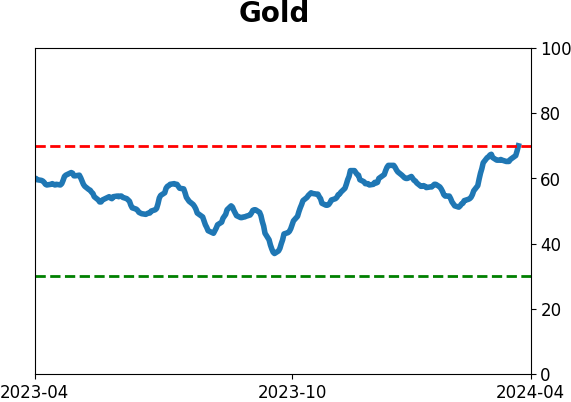
Gold

|
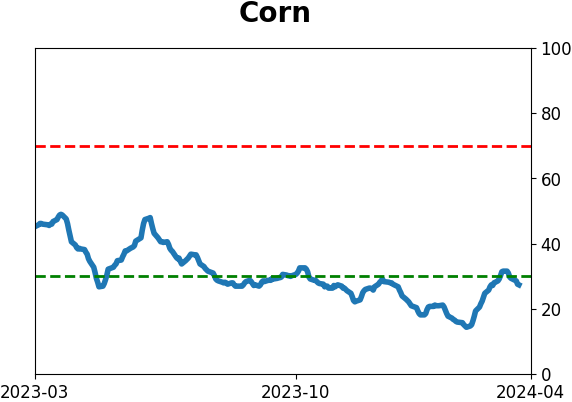
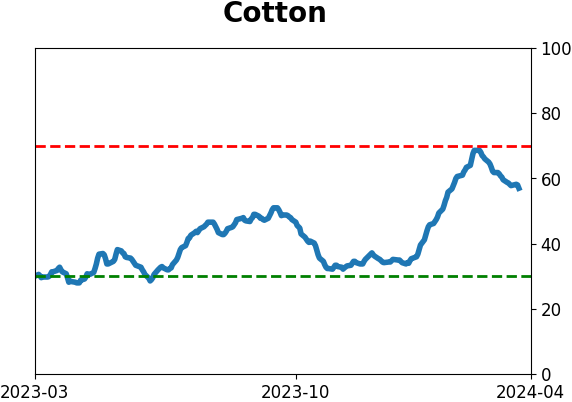
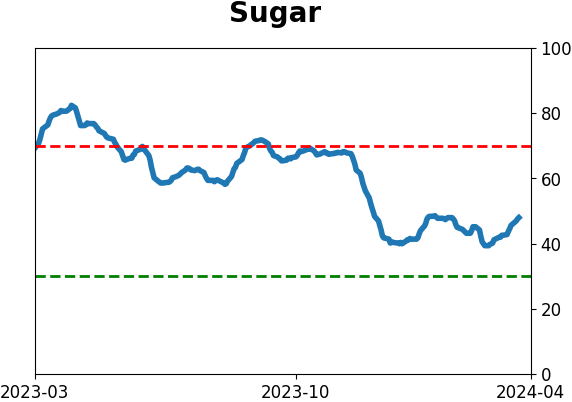
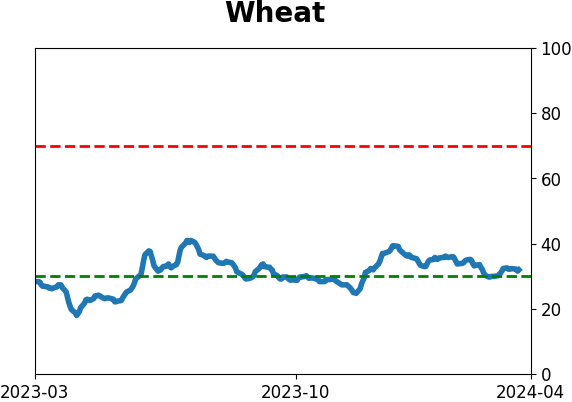
Agriculture
|
|
Research
By Jason Goepfert
BOTTOM LINE
Two years ago, the average U.S. consumer expected stocks to keep dropping. That pessimism was the worst in a decade, but now it has rebounded to the most optimistic in years, with a net 20% expecting stocks to rise. That is not necessarily a good contrary indicator, however, especially on the heels of what we saw in 2022.
FORECAST / TIMEFRAME
None
|
Key points:
- After a miserable 2022 that triggered a decade-long extreme in pessimism, consumers are feeling optimistic again
- More than a net 20% of consumers are counting on stocks to rally, the highest percentage in years
- When expectations cycle from one extreme to the other, the S&P 500 has a record of large and sustained gains
Consumers are optimistic about stocks again
During some of the worst pessimism in the summer of 2022, we looked at consumers' plunging confidence in a stock market rally. While future returns were positive, a less risky approach to using the data would be to wait until expectations recovered some. That September, Jay noted that expectations were, indeed, recovering, which was a consistently positive signal. As it was again.
Now, consumer expectations have rebounded in a huge way.
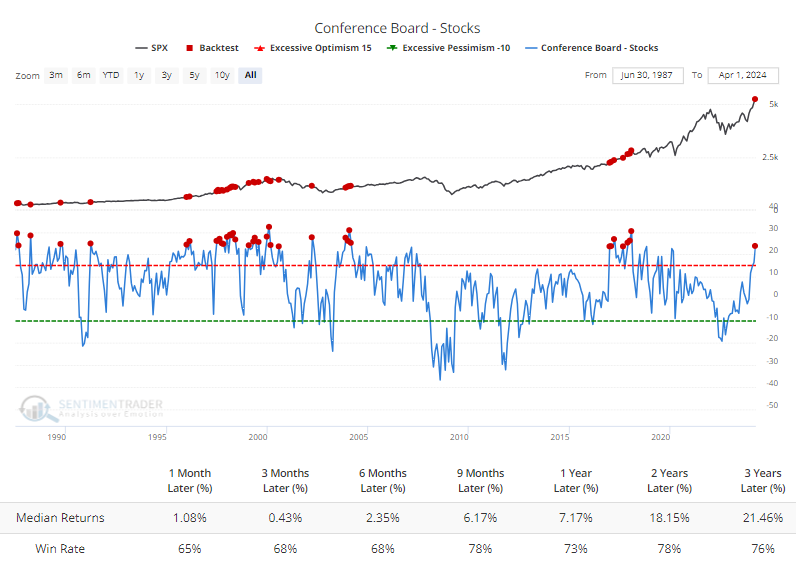
The percentage of consumers expecting stocks to rise has jumped to the 2nd-highest in history. The net percentage (bulls minus bears) has jumped above +20% after plunging below -15% in 2022.
After any month when at least 20% more consumers expected stocks to rise than fall, the S&P 500 performed well. As is true with many sentiment indicators, this was not a successful indicator of market peaks. Over the next 9-36 months, the S&P rallied more than 70% of the time. That's not especially notable other than it's not much worse than random (if at all).
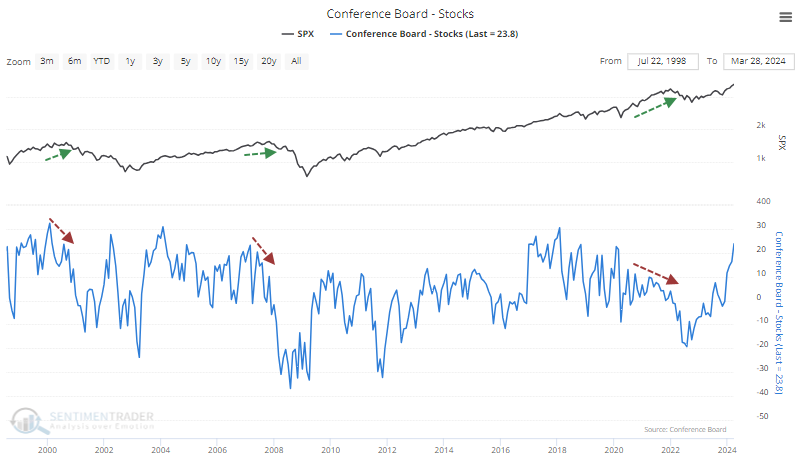
Most peaks are preceded by declining, not rising, confidence. We can see that clearly in the chart below, which highlights this data against the S&P ahead of the worst bear markets of the past 25 years. Each time, consumers' confidence in rising prices was waning as stocks were waxing. There is no divergence now since expectations are still rising.
Sentiment cycles preceded massive gains
Using version 2.0 of the Backtest Engine, we can look for other times when consumers' net expectation of a rising stock market cycled from less than -15% to greater than +20%. There were only three other instances, so the usual caveat of tiny sample sizes applies. Still, we can see from the returns after each signal that they were consistent and robust.
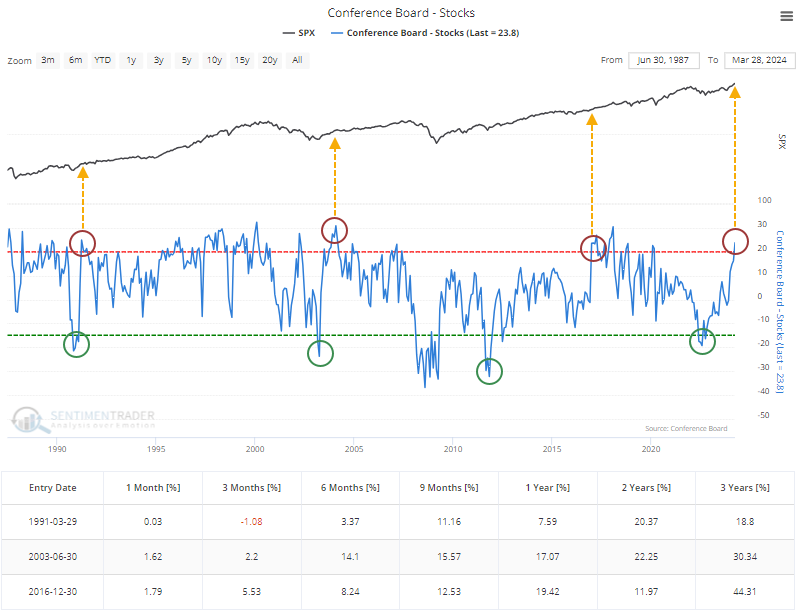
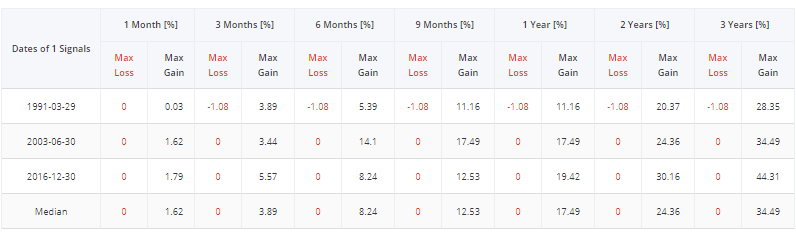
In the results from the test, you can click the new tab for maximum losses and gains across each time frame. Again, the results were consistent: losses were minimal (using monthly closes), while gains were remarkable.
Testing the indicator
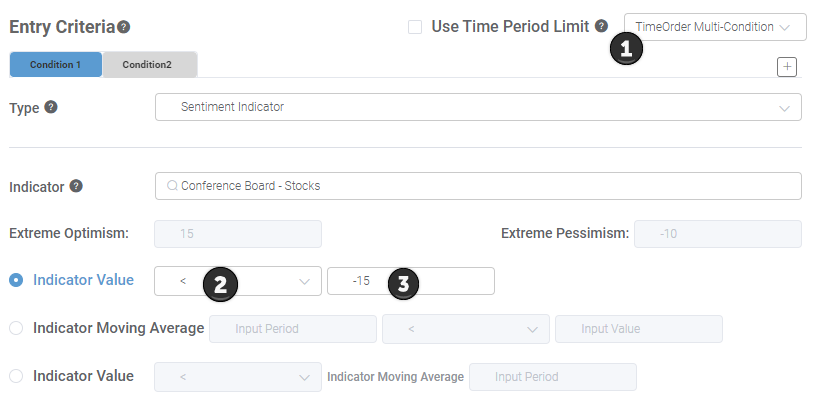
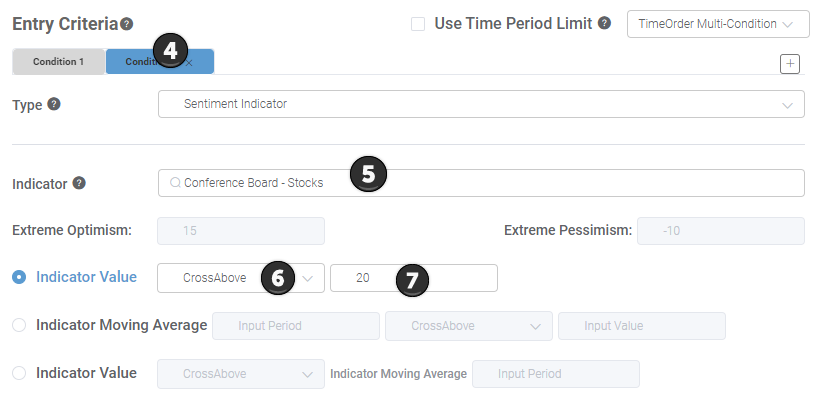
To run the test, click the "With Backtest Engine v2.0" button after loading the indicator chart. When that loads, scroll down to the Entry Criteria section and select 1) TimeOrder Multi-Condition, then 2) change the Indicator Value to < and 3) -15. That will set up the first condition - the net percentage of consumers expecting stocks to rise being less than -15%.
After that, 4) click the Condition 2 tab, 5) type "Conference Board - Stocks" in the Indicator field, then 6) select CrossAbove, and 7) type 20. That will tell the Backtest Engine to check any date when consumers' expectations cycled from less than -15% to greater than +20%.
Click the "Run Backtest" button, and you should get the same results as above. Because the engine is quite flexible, you can then go back and change the symbol to check performance for the Dow Industrials, Russell 2000, or almost any other symbol in the database.
What the research tells us...
Divergences do not necessarily mean market peaks, but most market peaks are accompanied by divergences. We do not have that now in pretty much any technical respect, including sentiment. That's true whether it measures sentiment among investors or general consumers.
After a historically miserable year in 2022 and a rebound year in 2023, sentiment has mostly erased the despondency we witnessed two years ago. But unlike bouts of extreme pessimism, bouts of extreme optimism tend to be drawn-out affairs, and stocks typically don't peak until that enthusiasm wanes for weeks or even months on end. We don't see many (if any) examples of that behavior, which suggests a lower probability that we're on the cusp of a sustained drawdown.
Indicators at Extremes
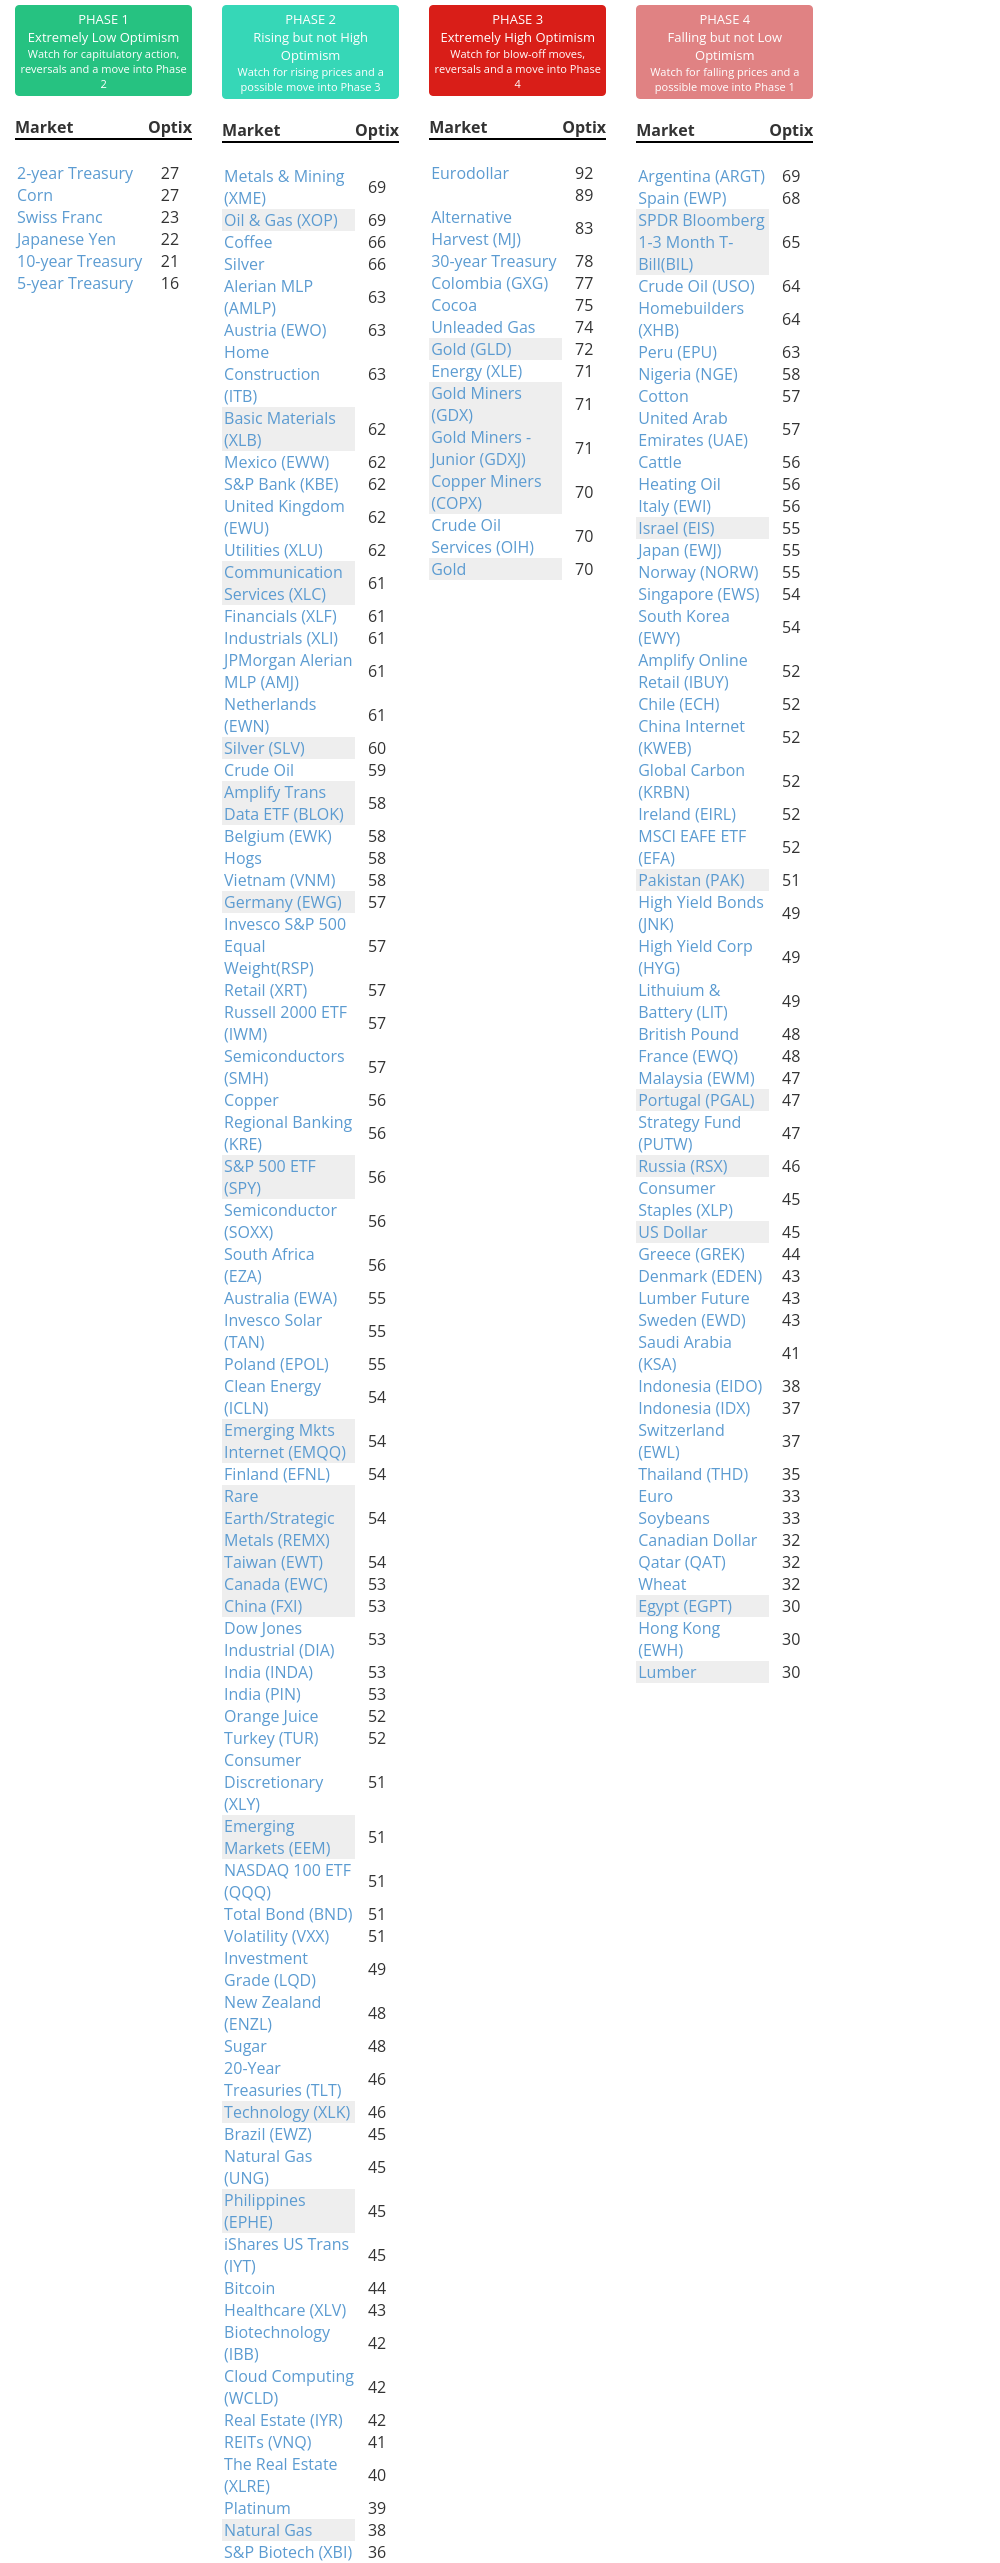
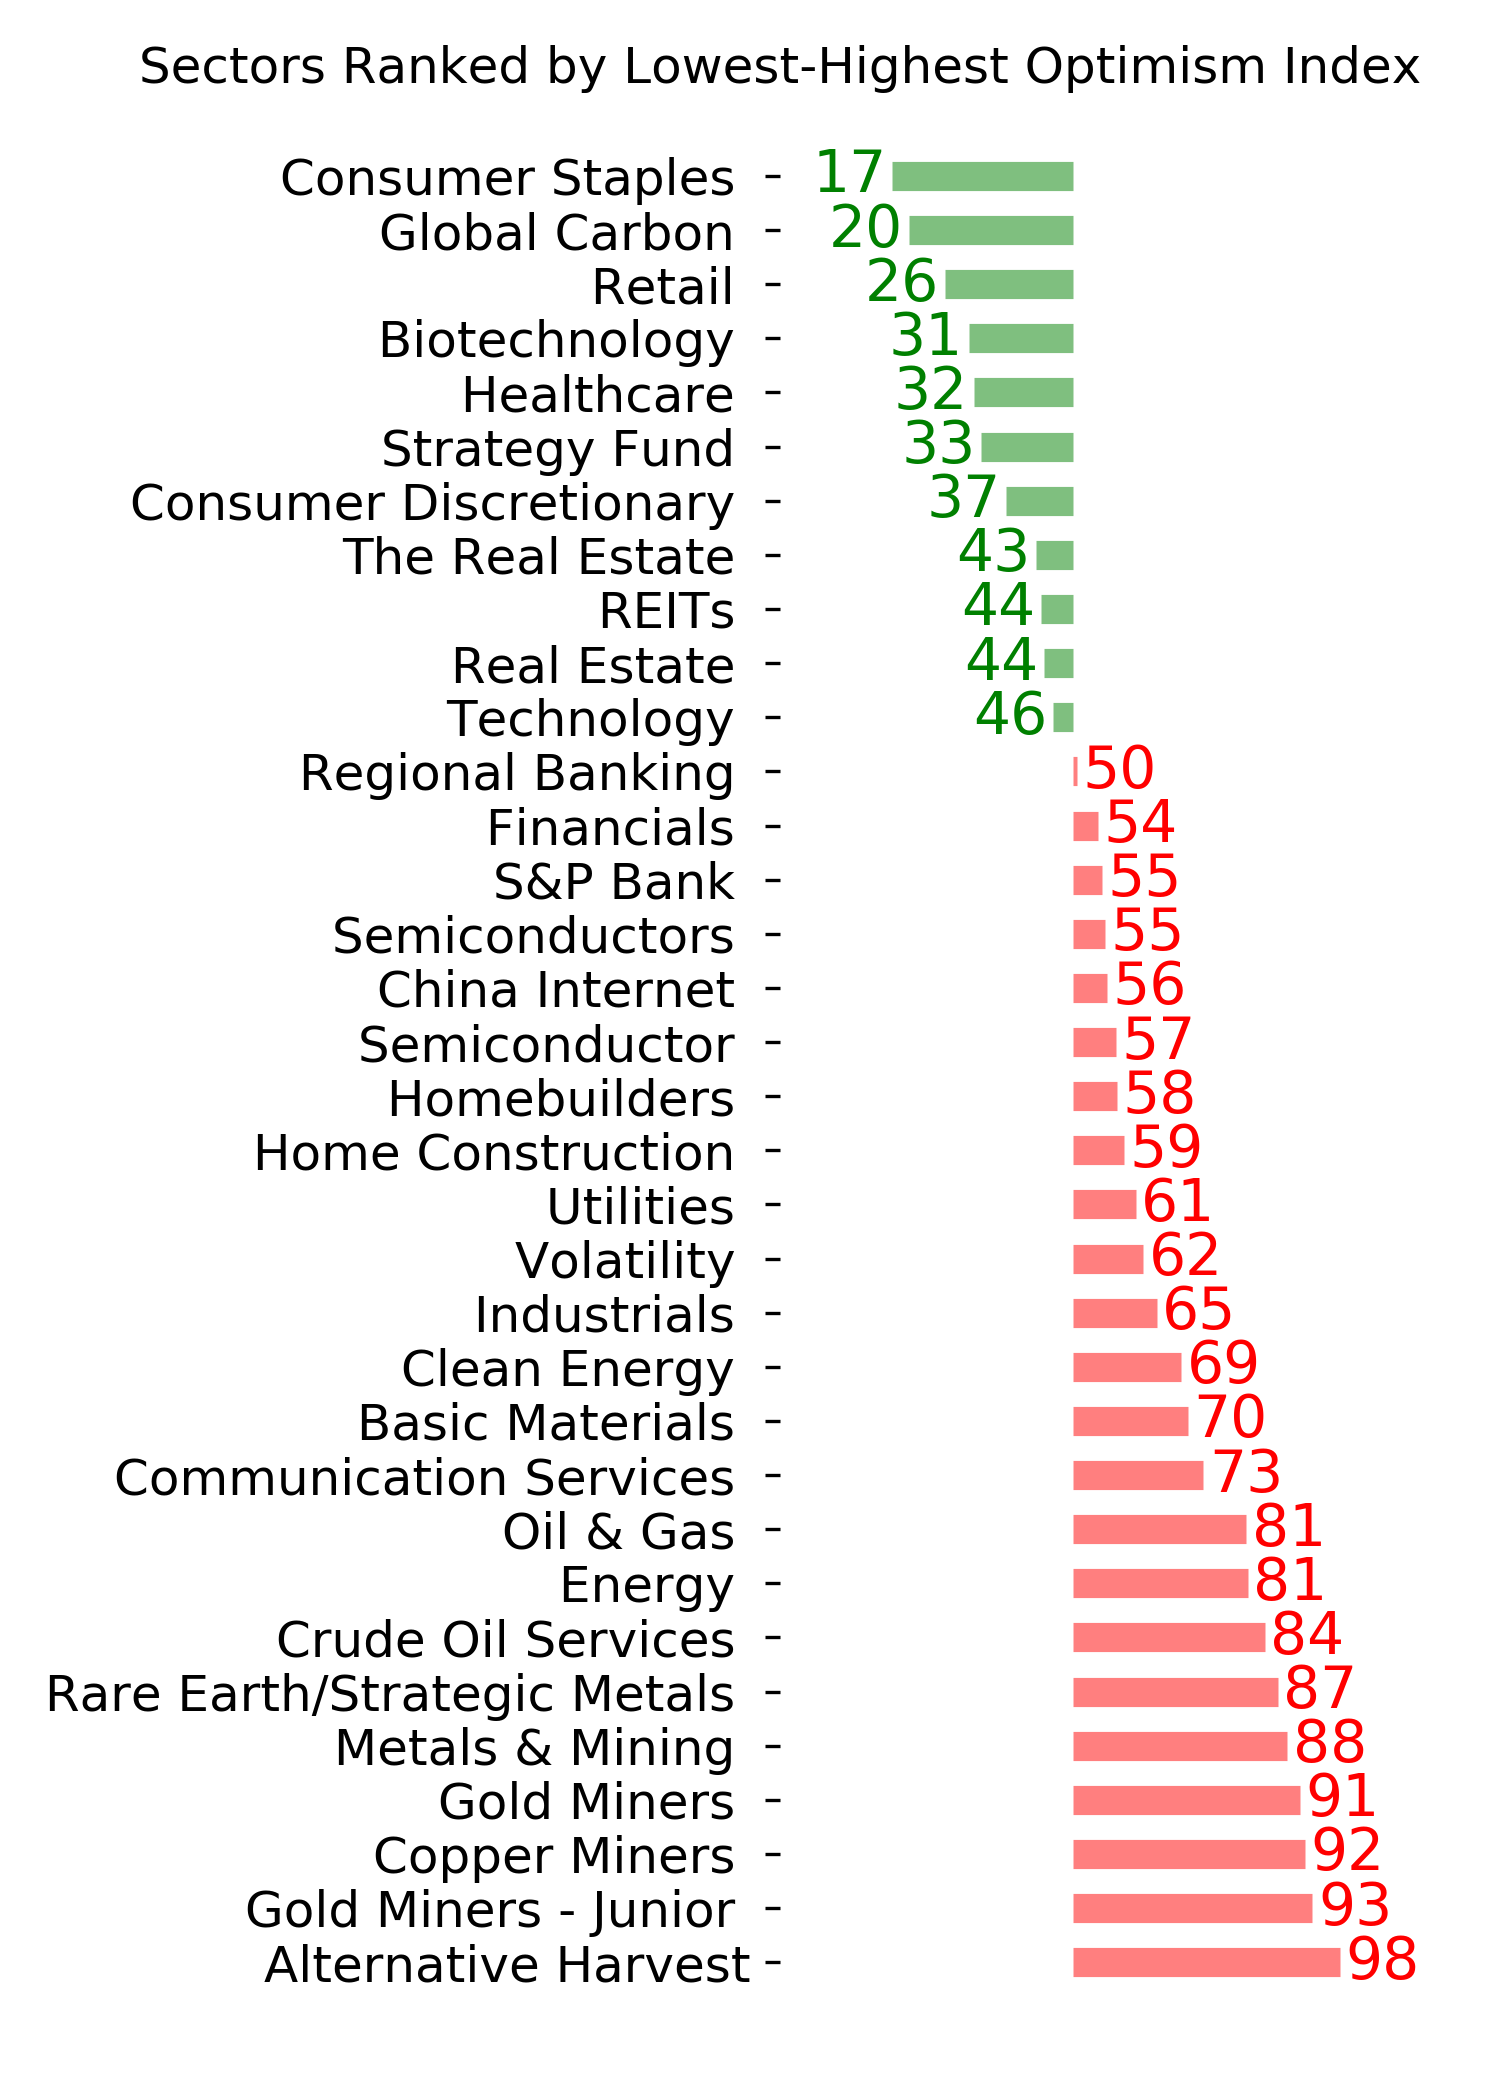
Phase Table
Ranks
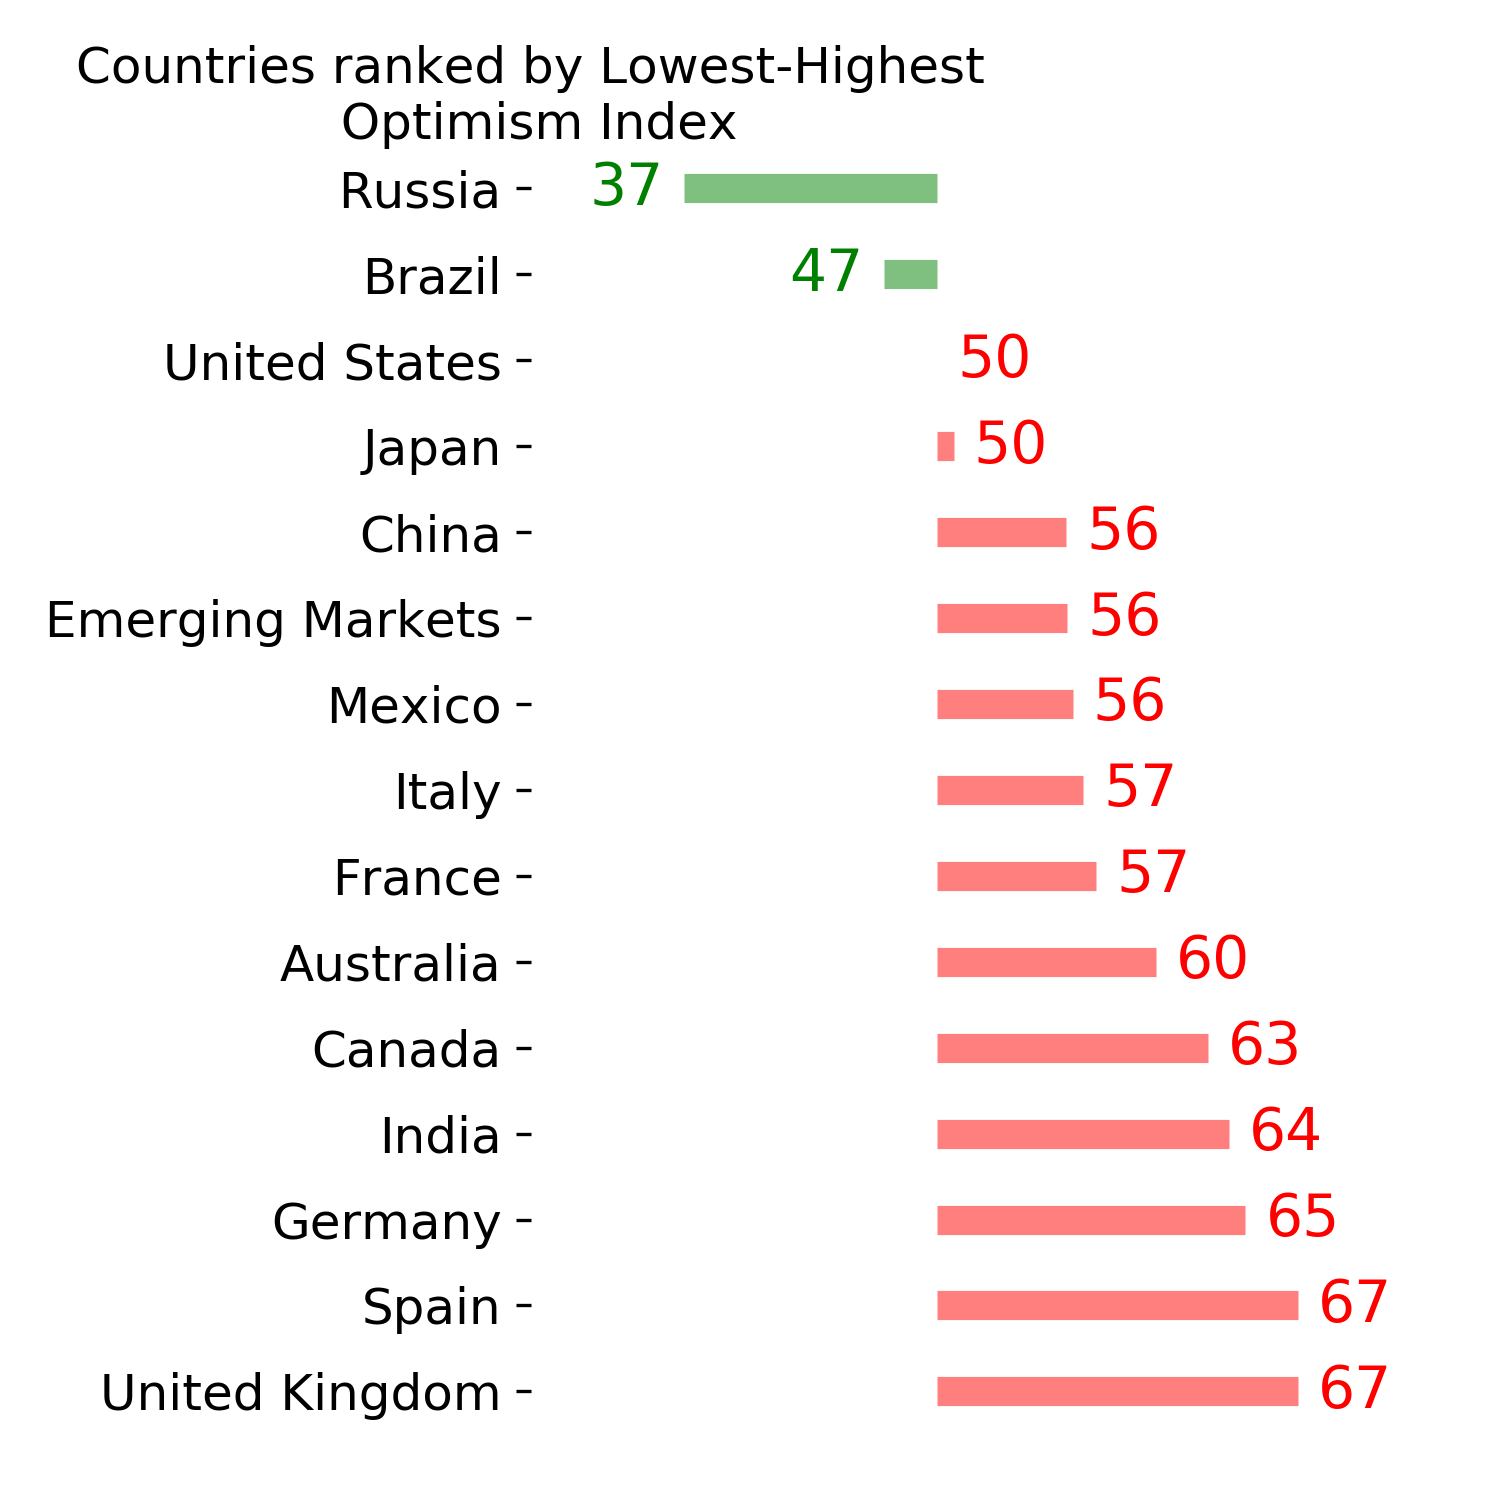
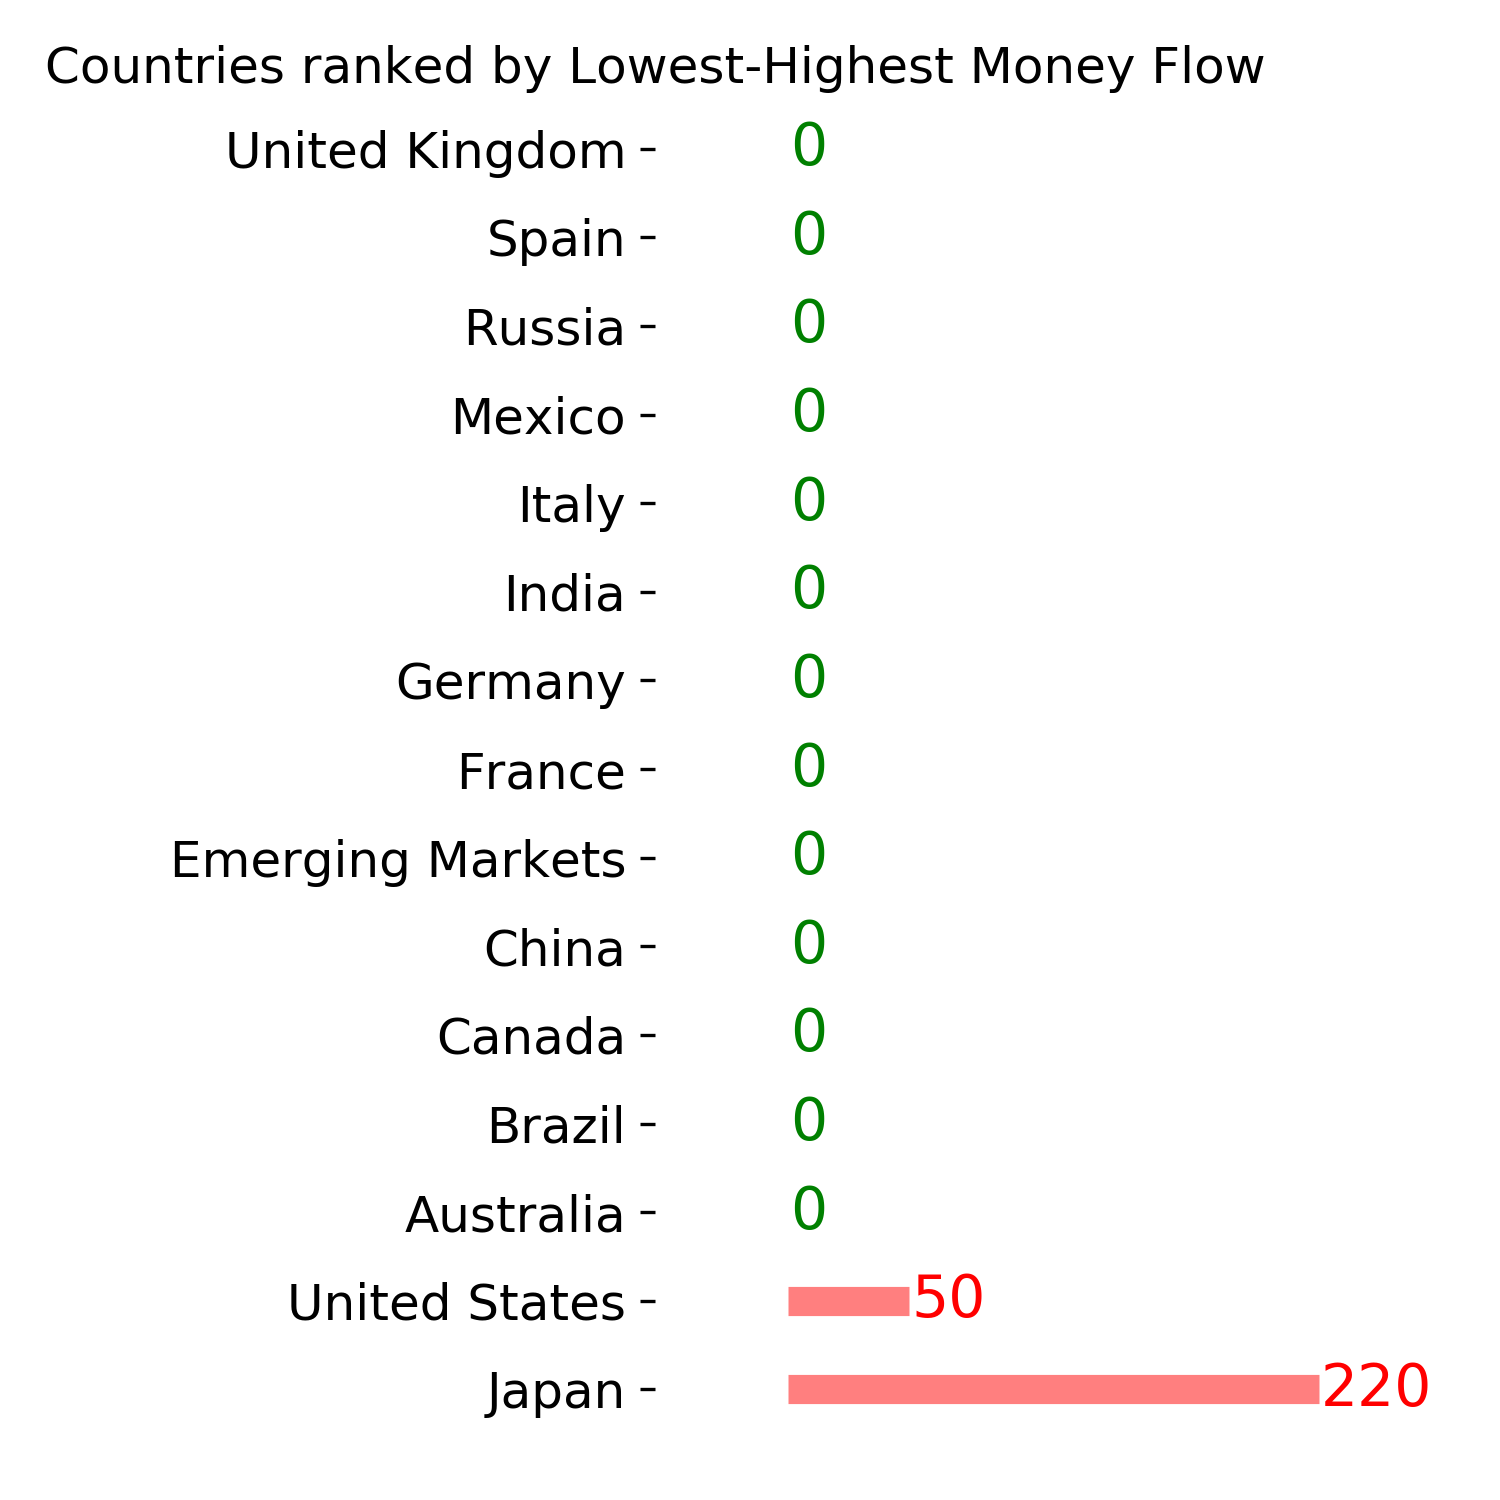
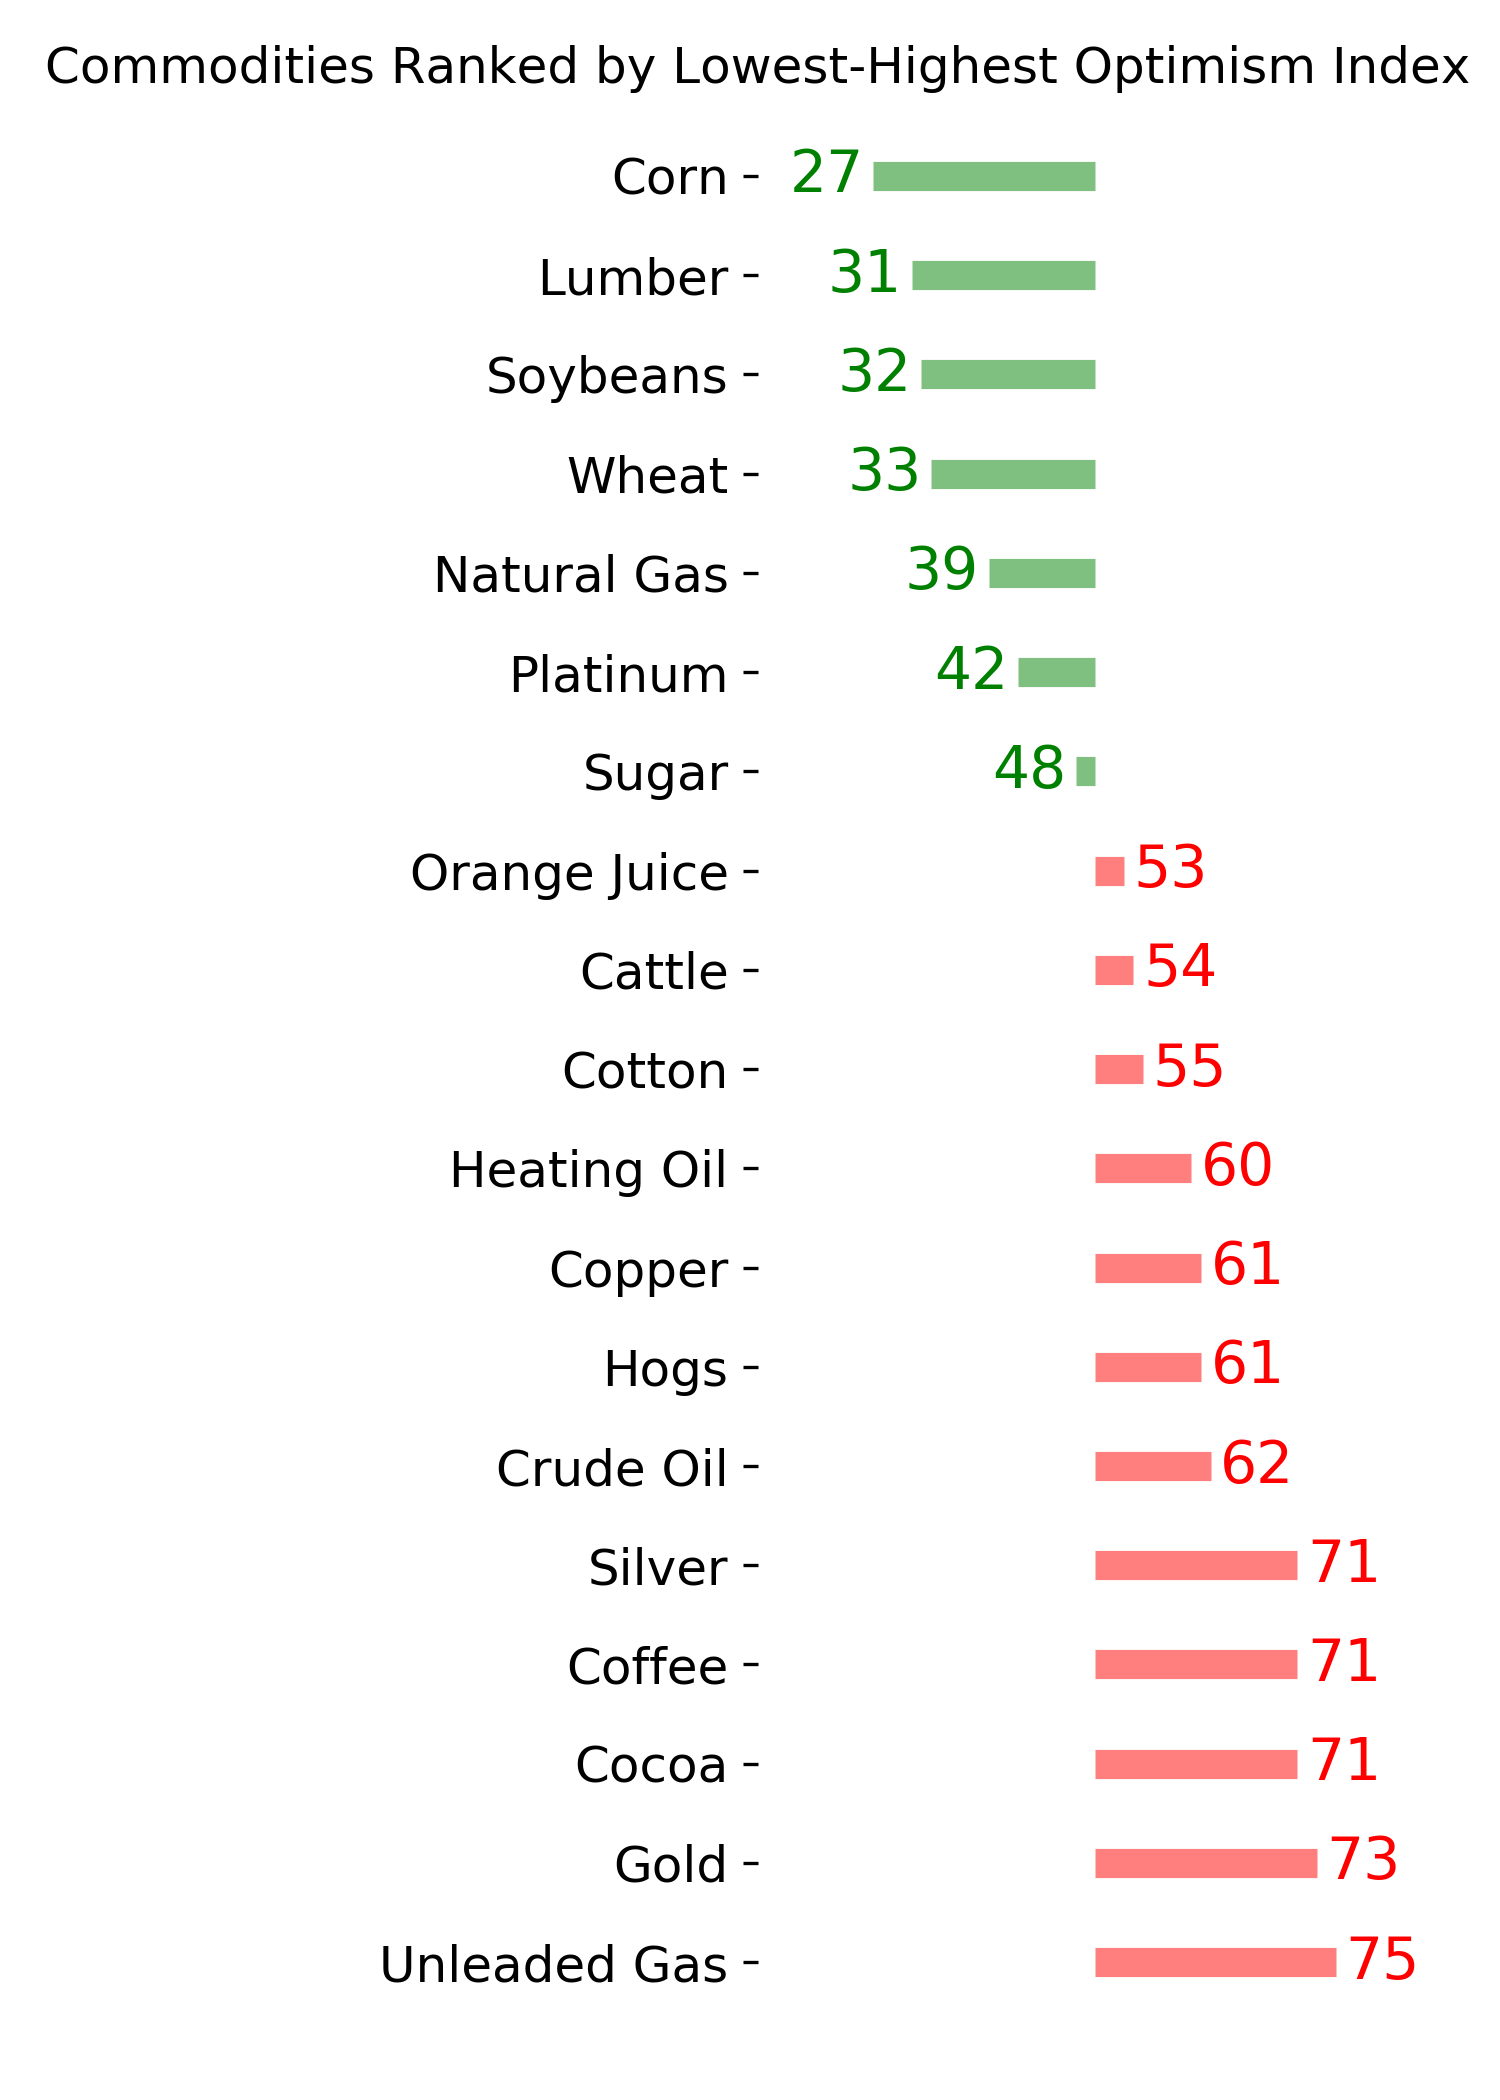
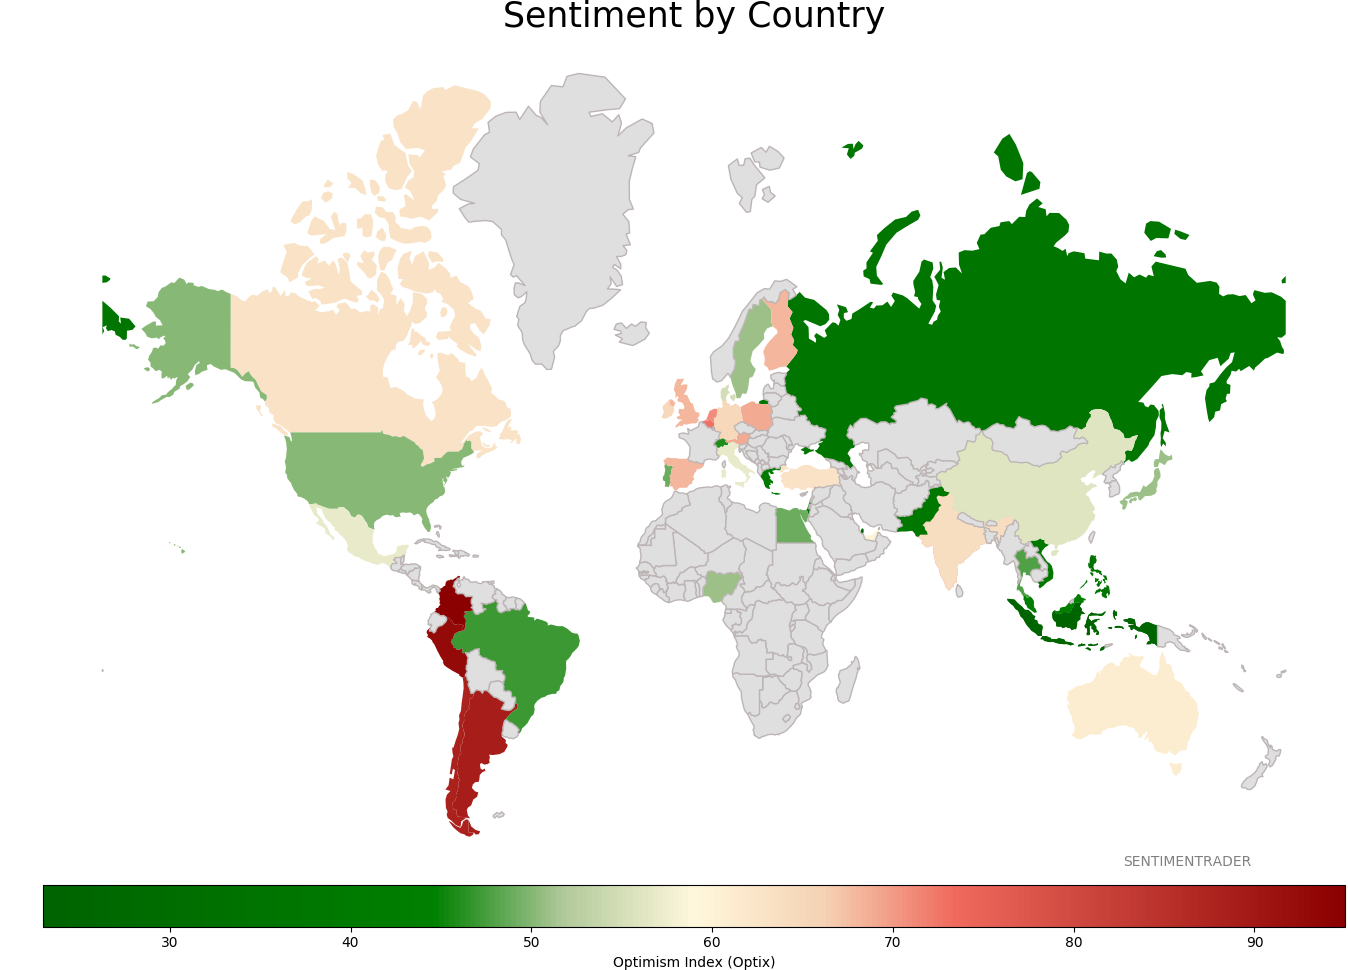
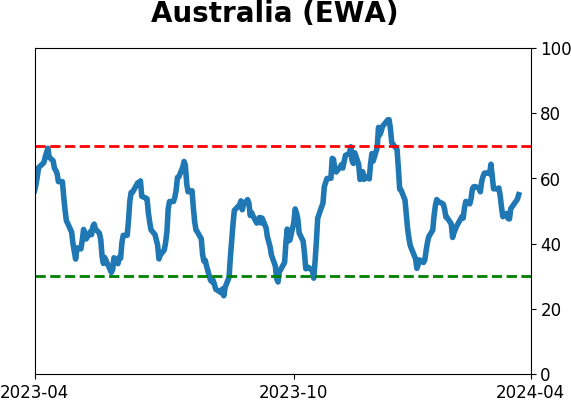
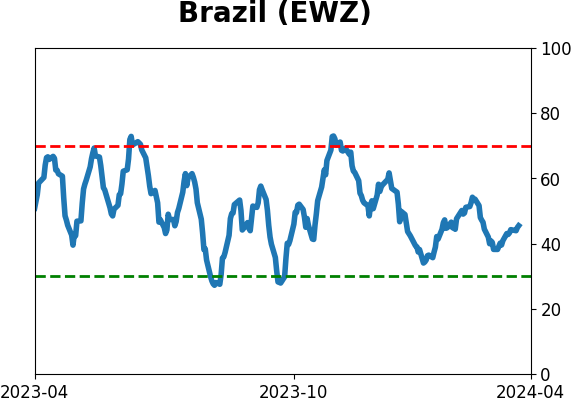
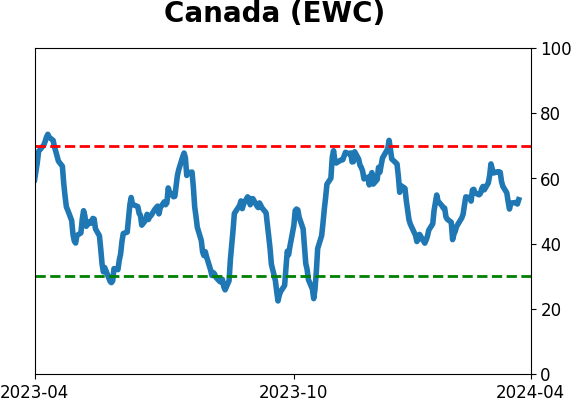
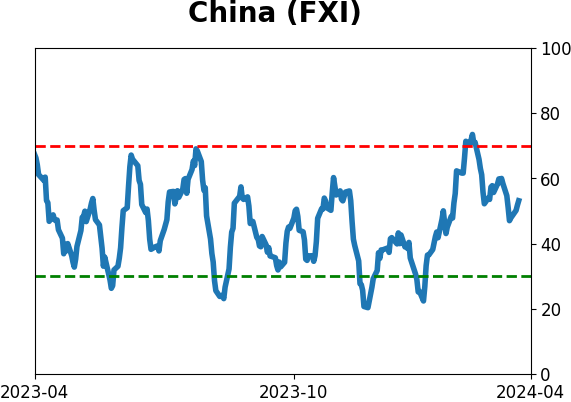
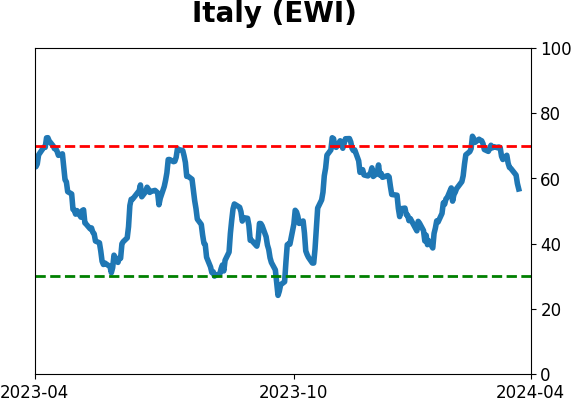
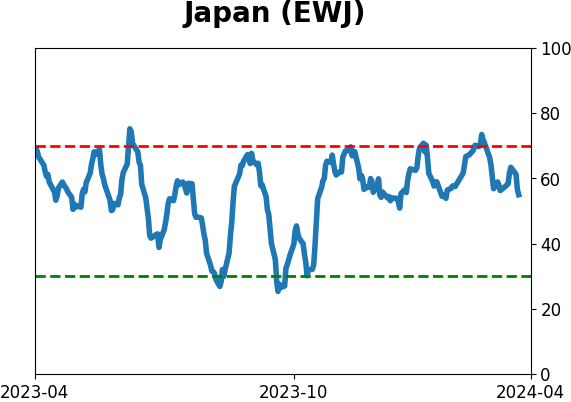
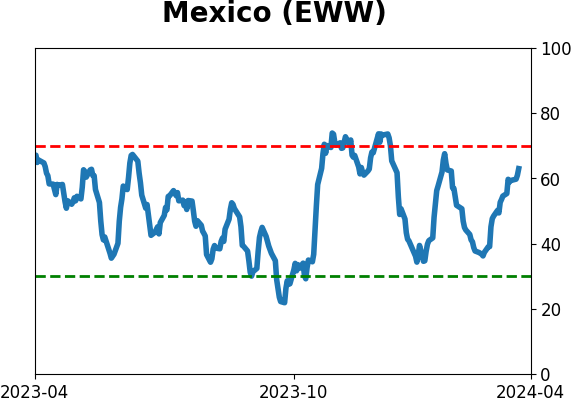
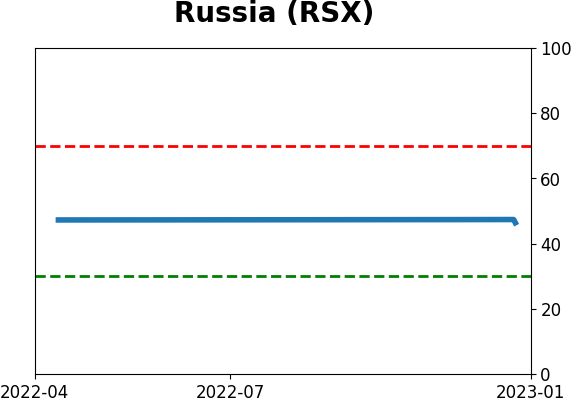
Sentiment Around The World
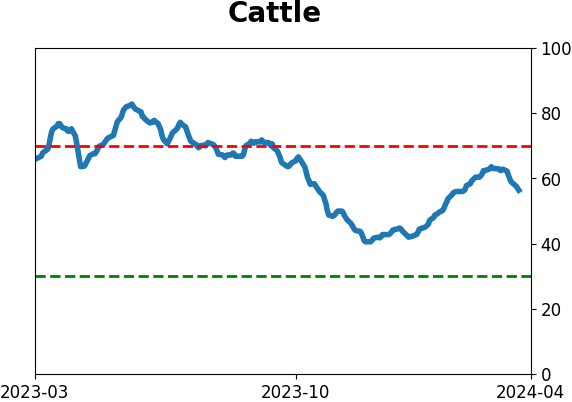
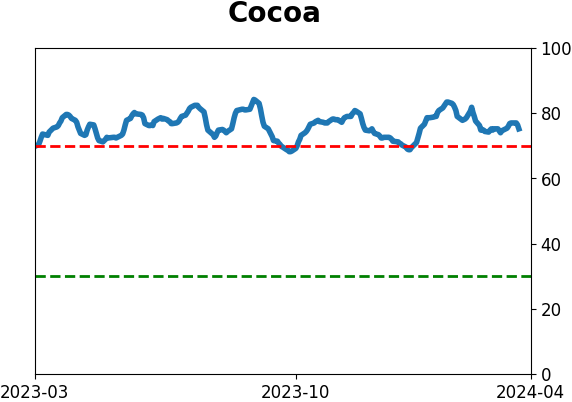
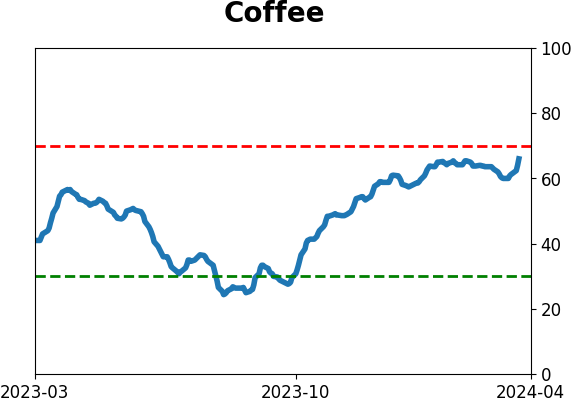
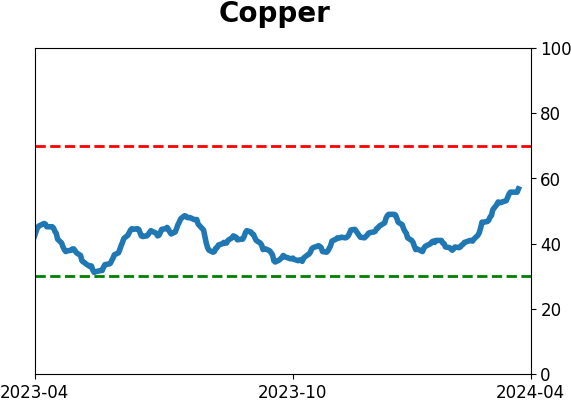
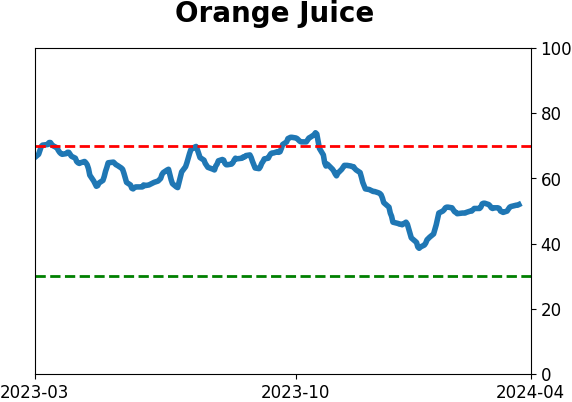
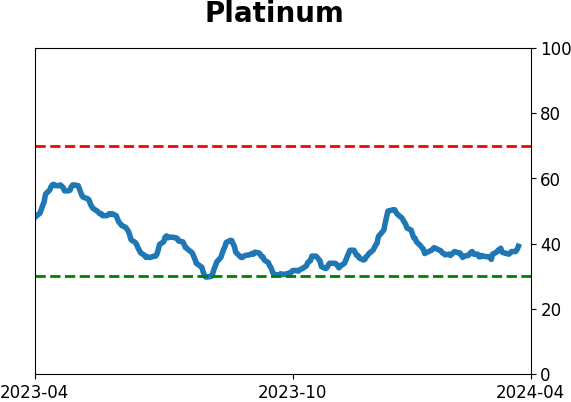
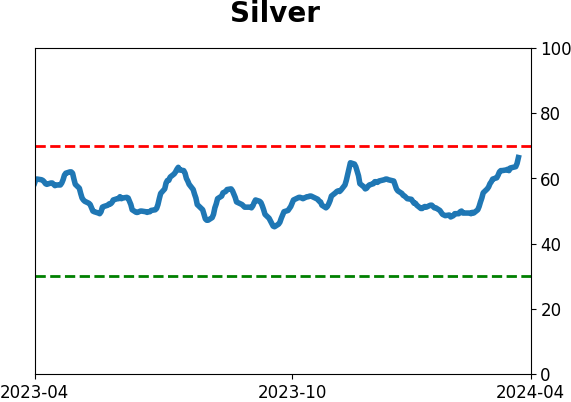
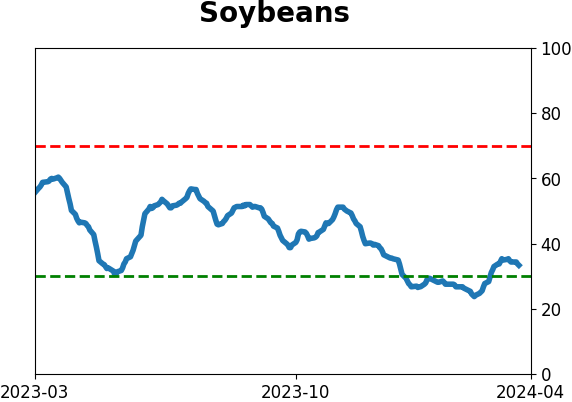
Optimism Index Thumbnails
|
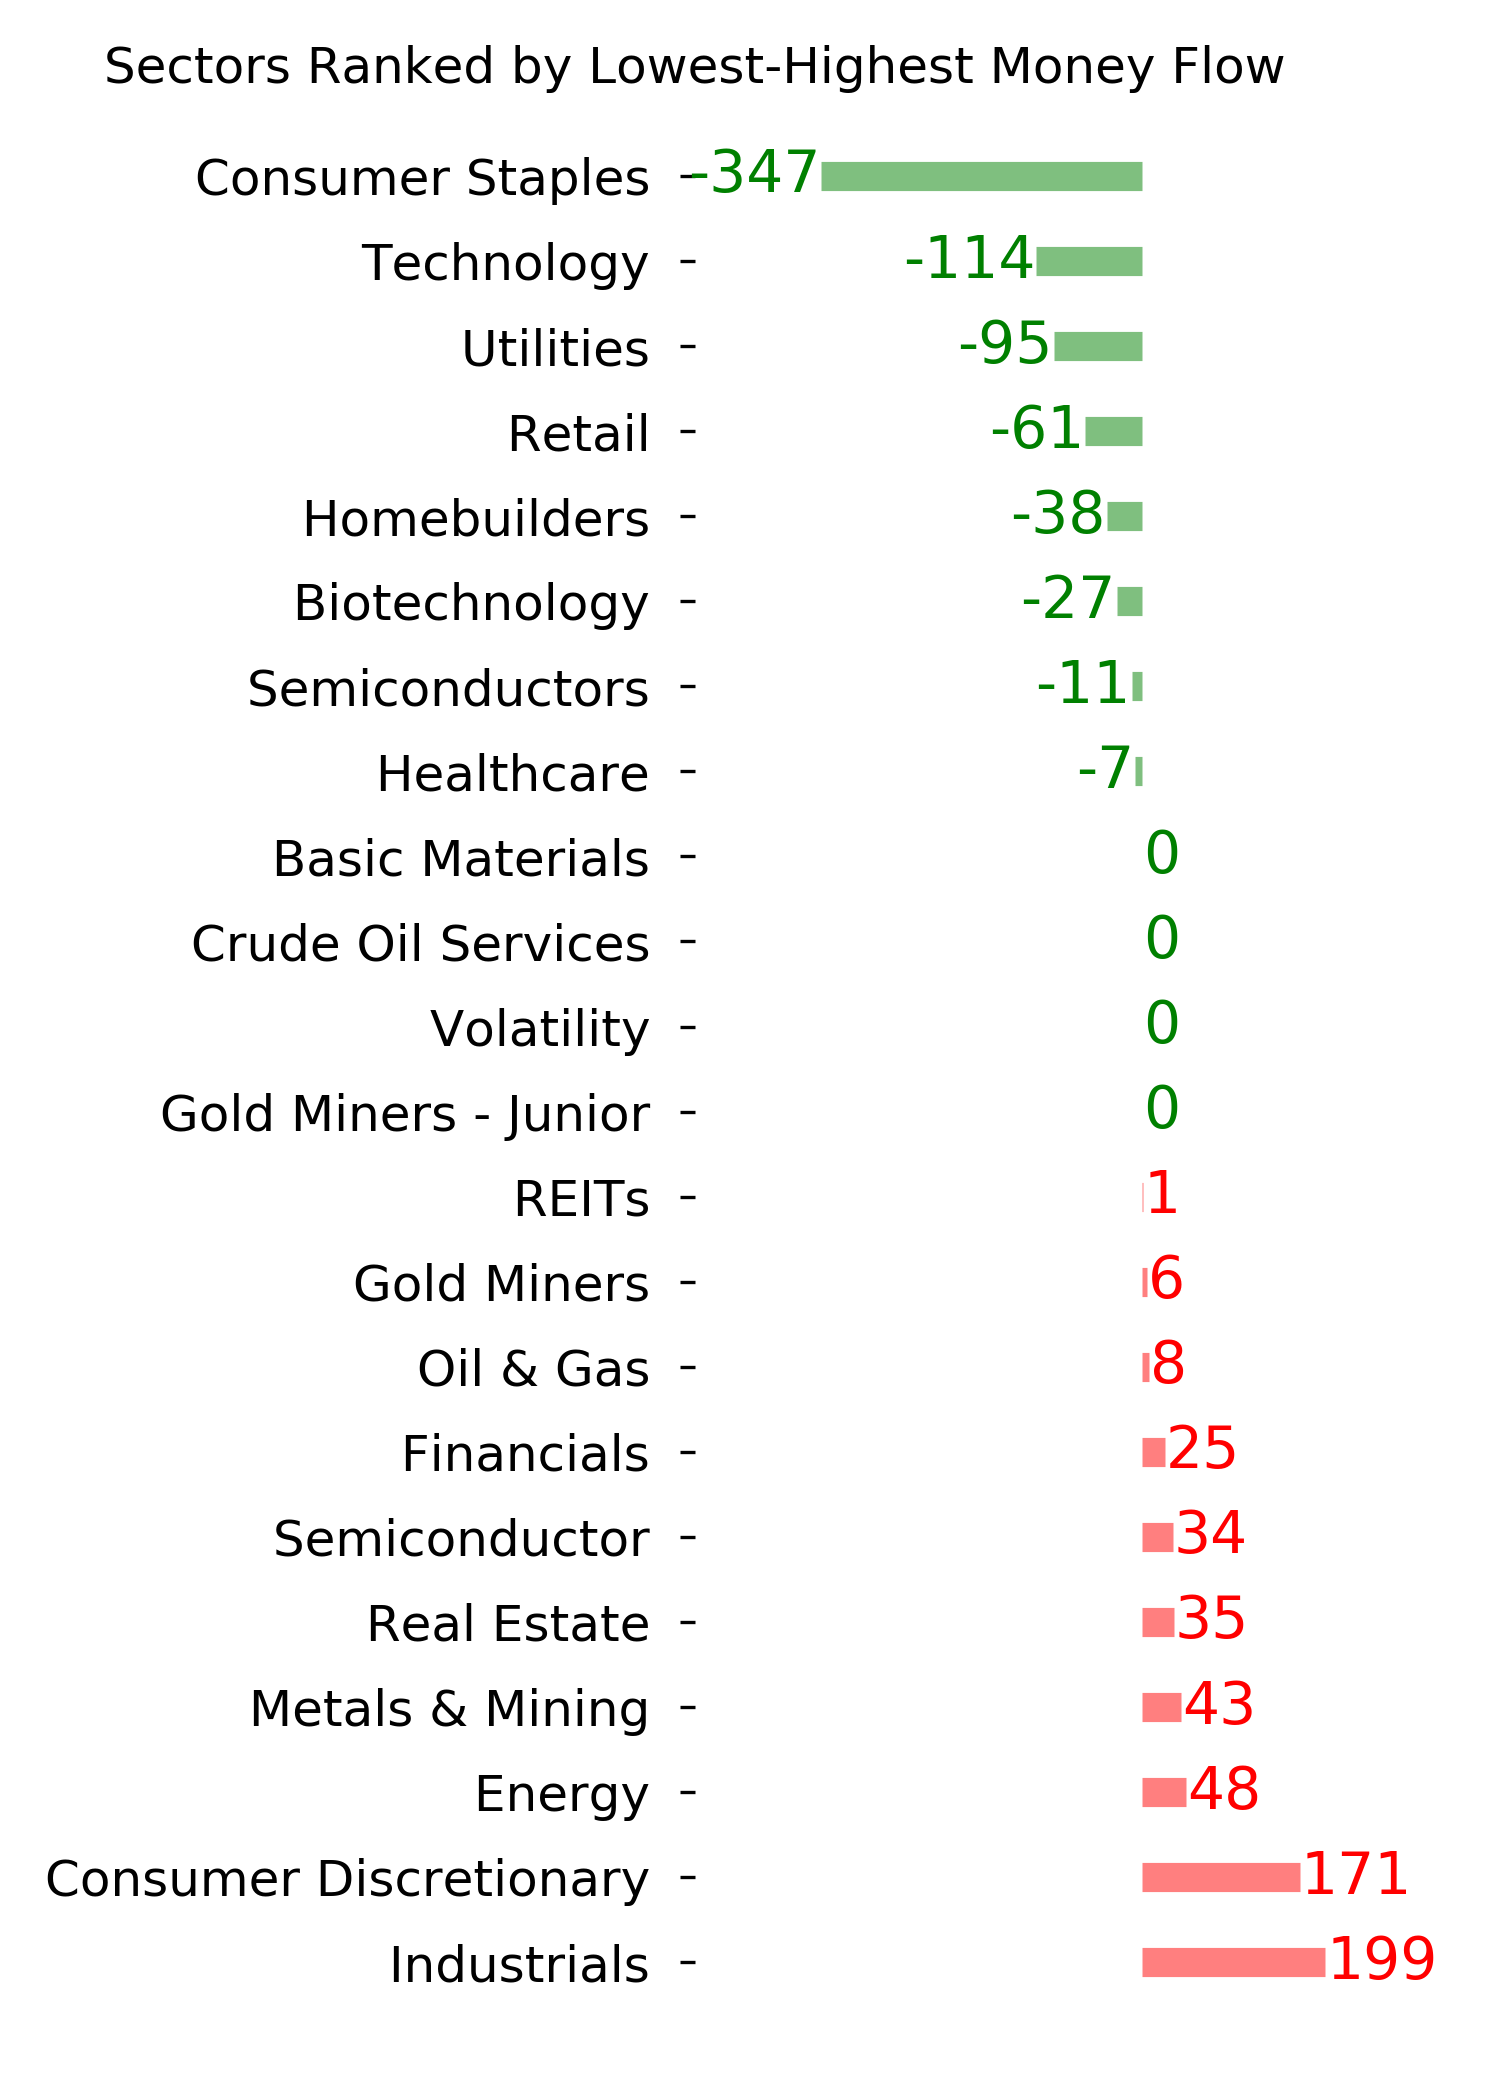
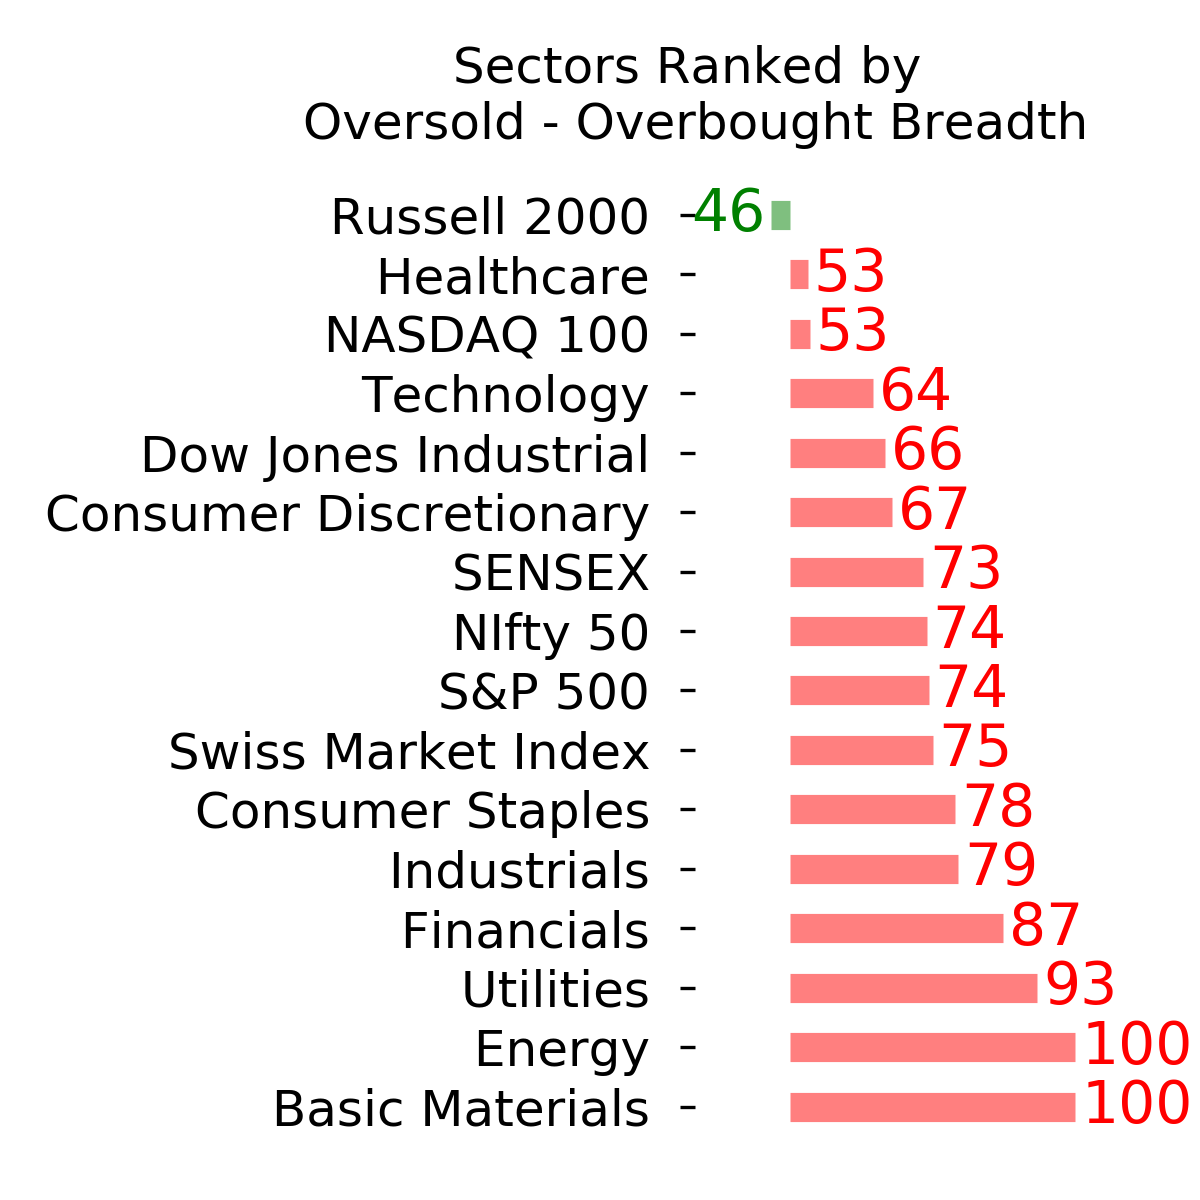
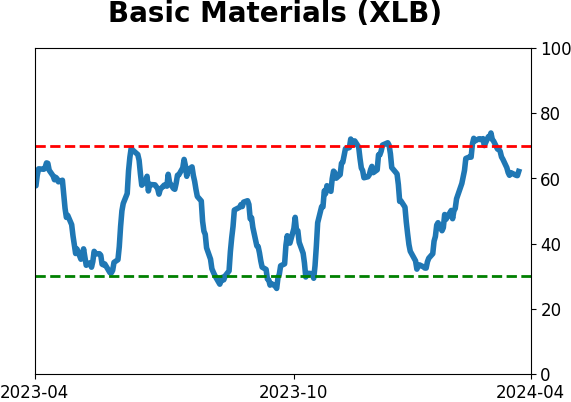
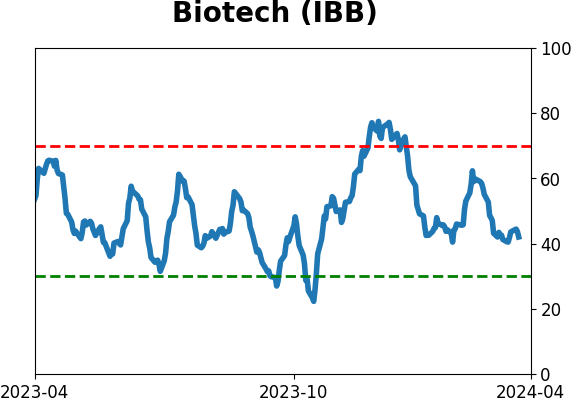
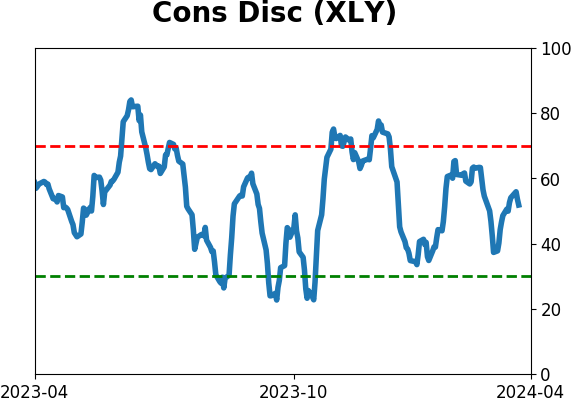
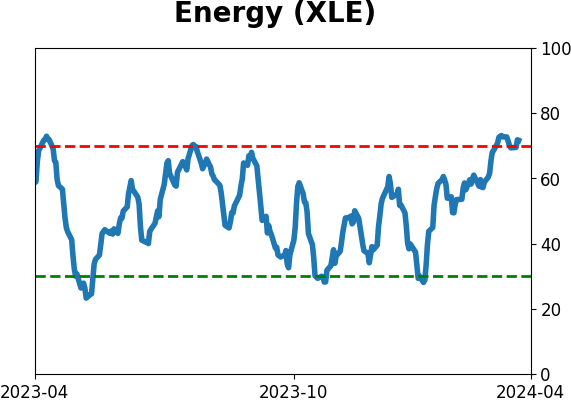
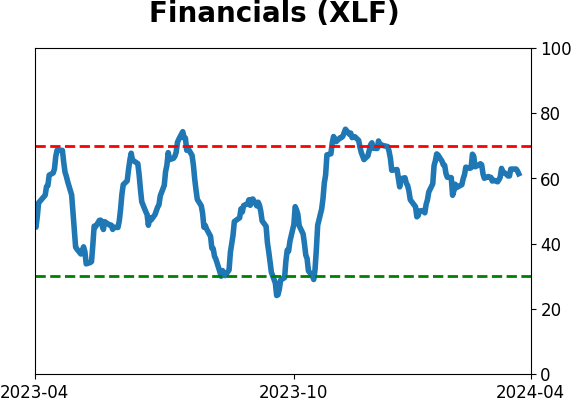
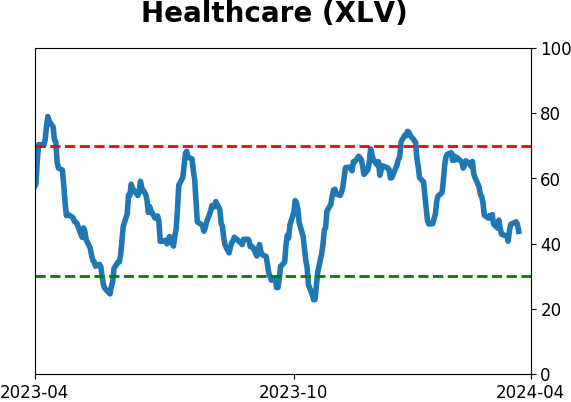
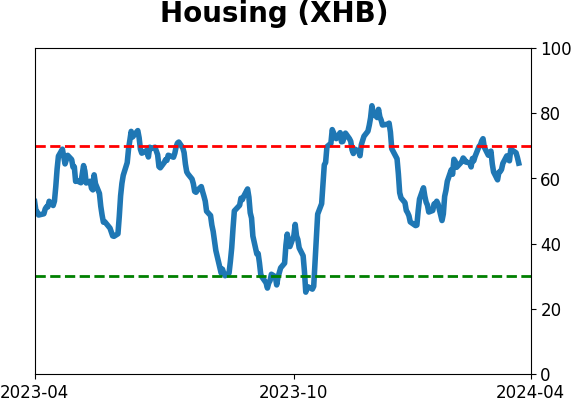
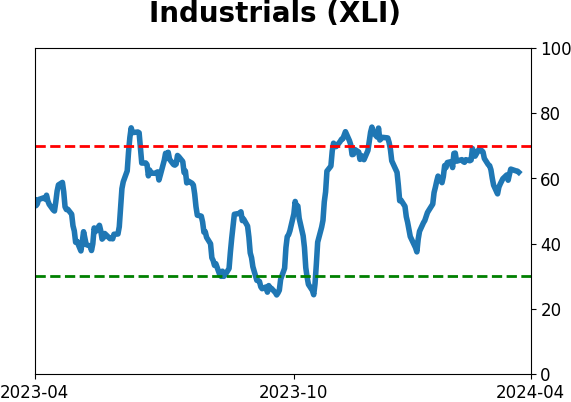
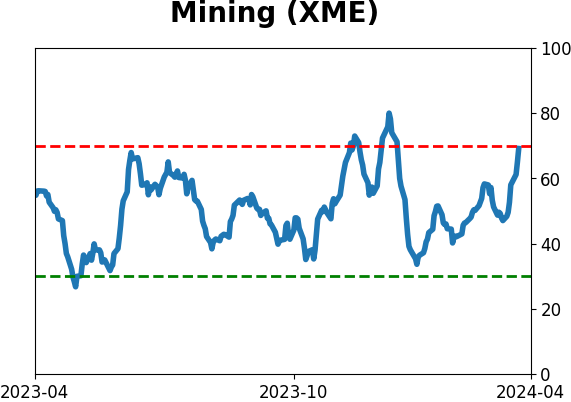
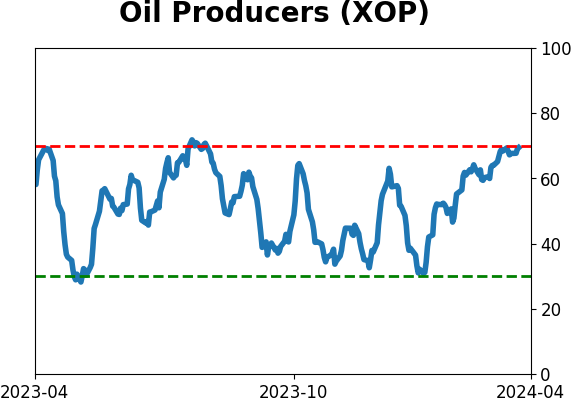
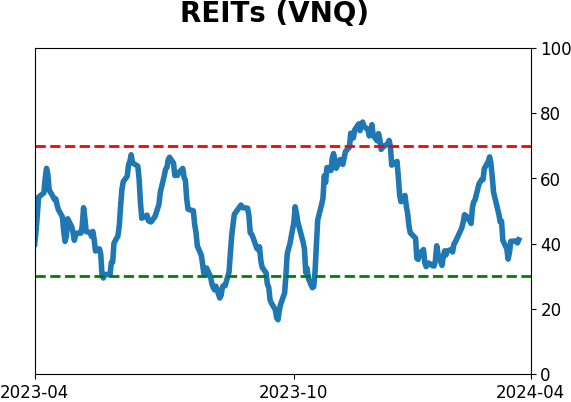
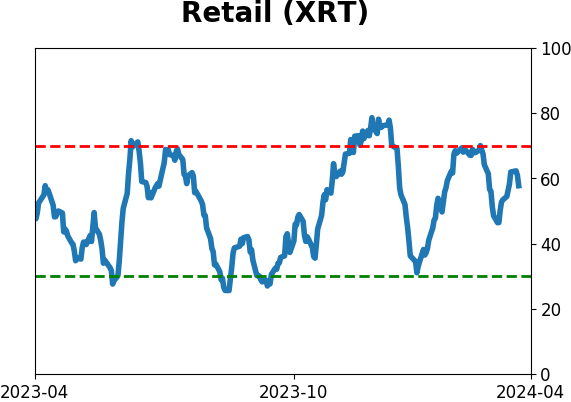
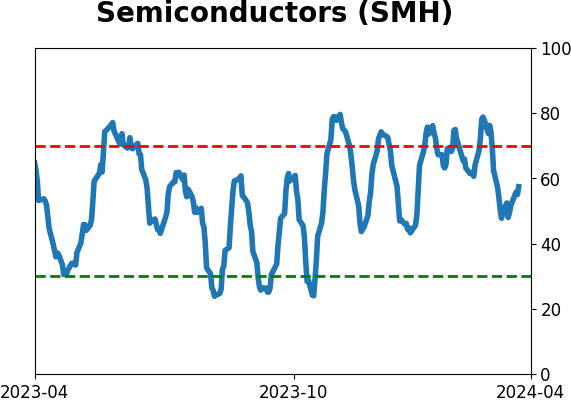
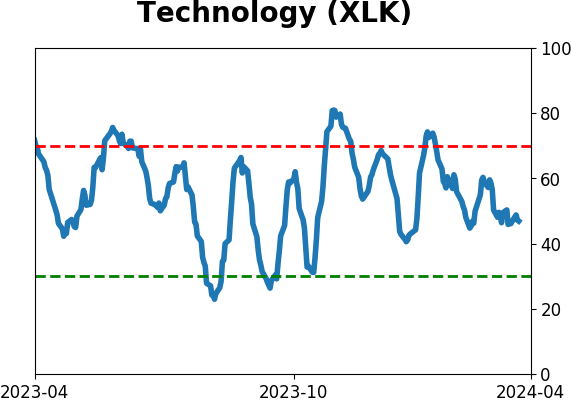
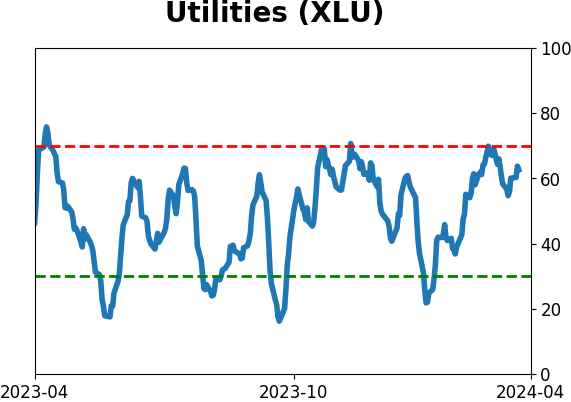
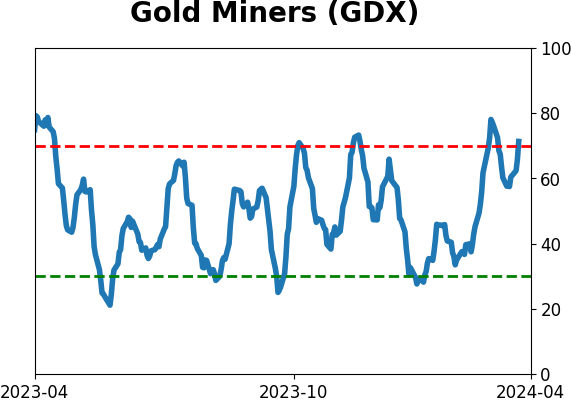
Sector ETF's - 10-Day Moving Average
|
|
|
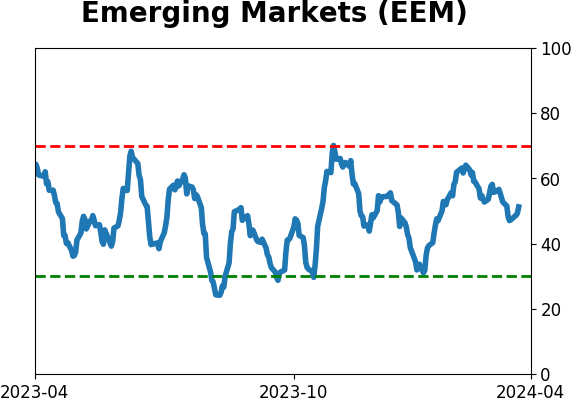
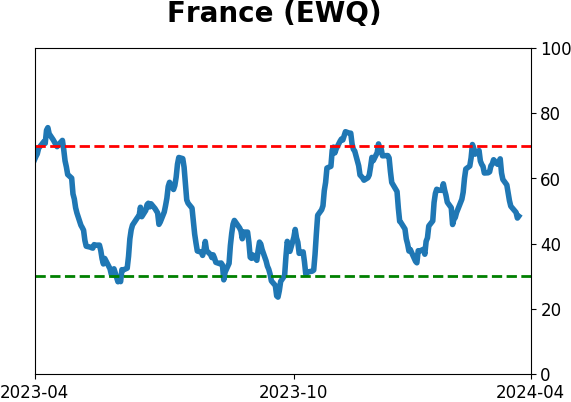
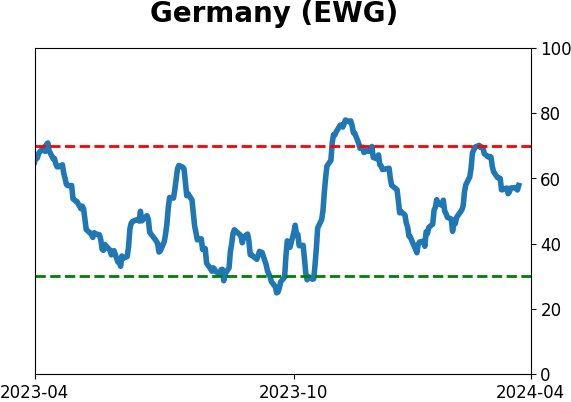
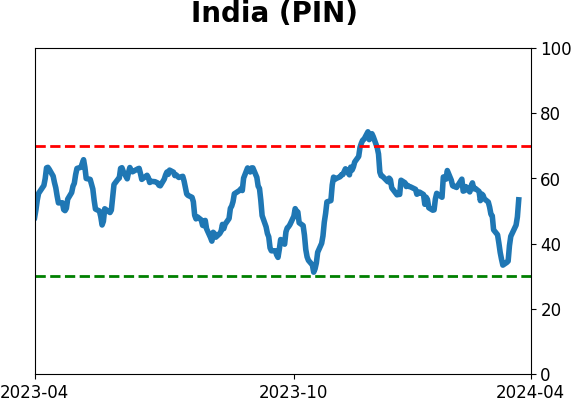
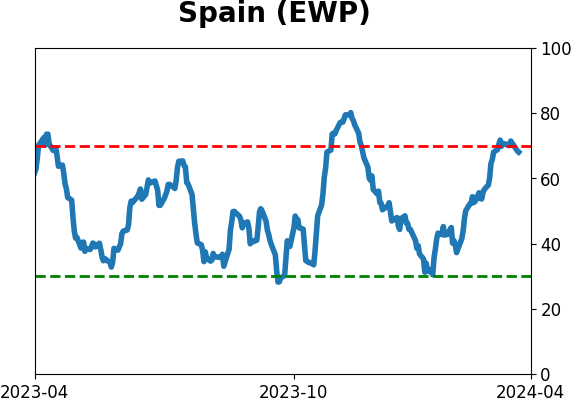
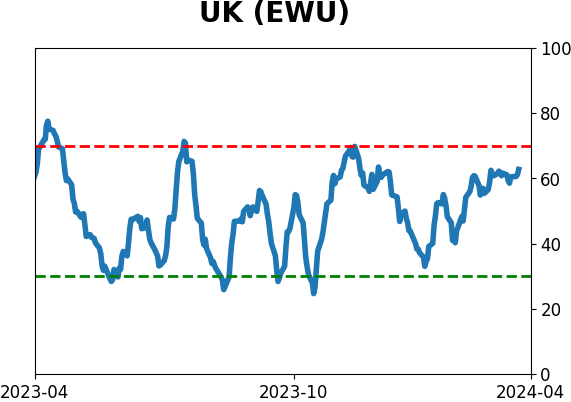
Country ETF's - 10-Day Moving Average
|
|
|
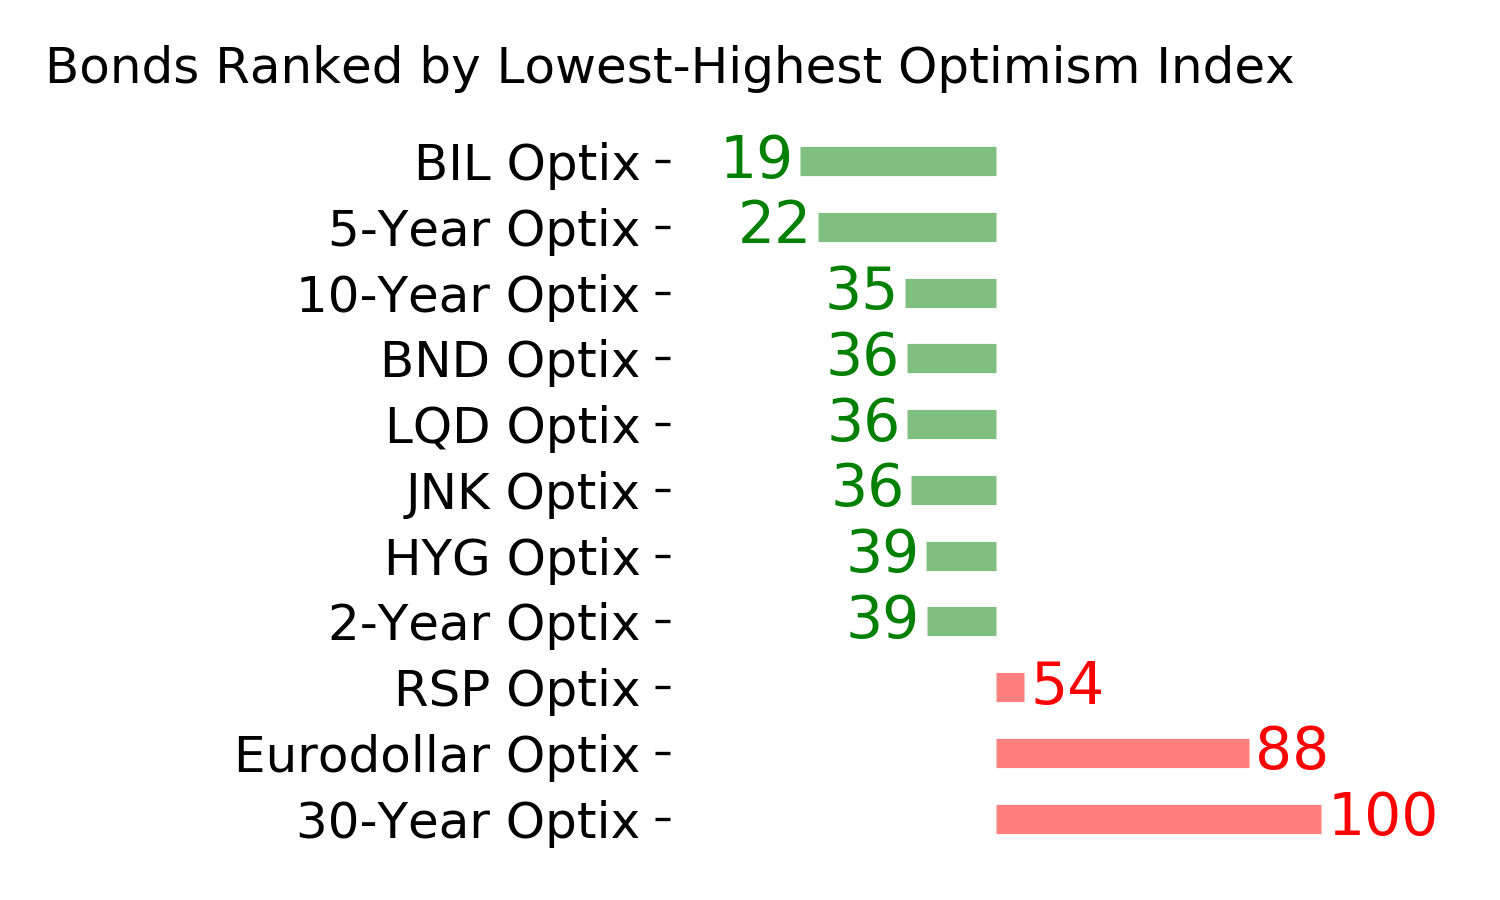
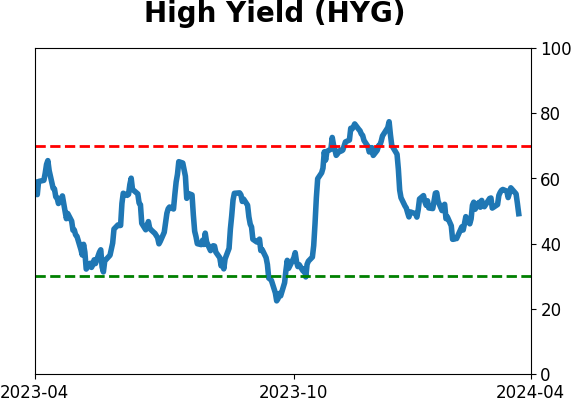
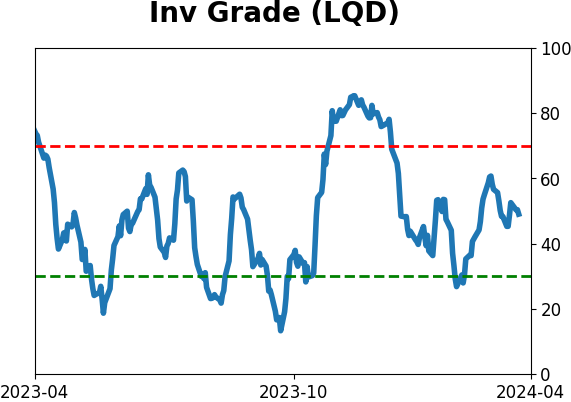
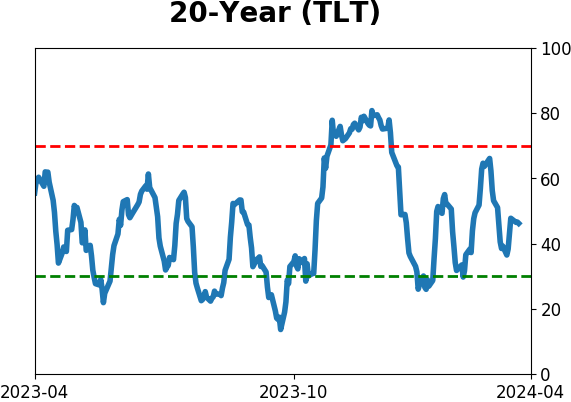
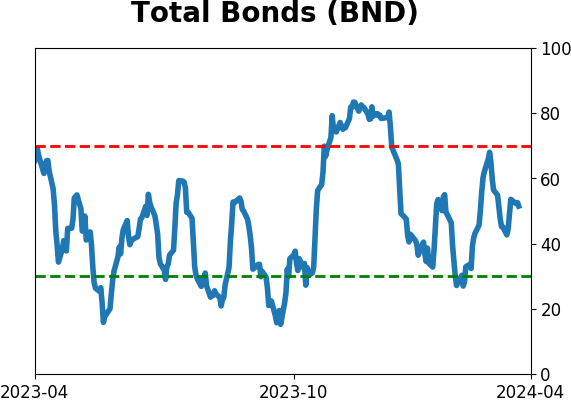
Bond ETF's - 10-Day Moving Average
|
|
|
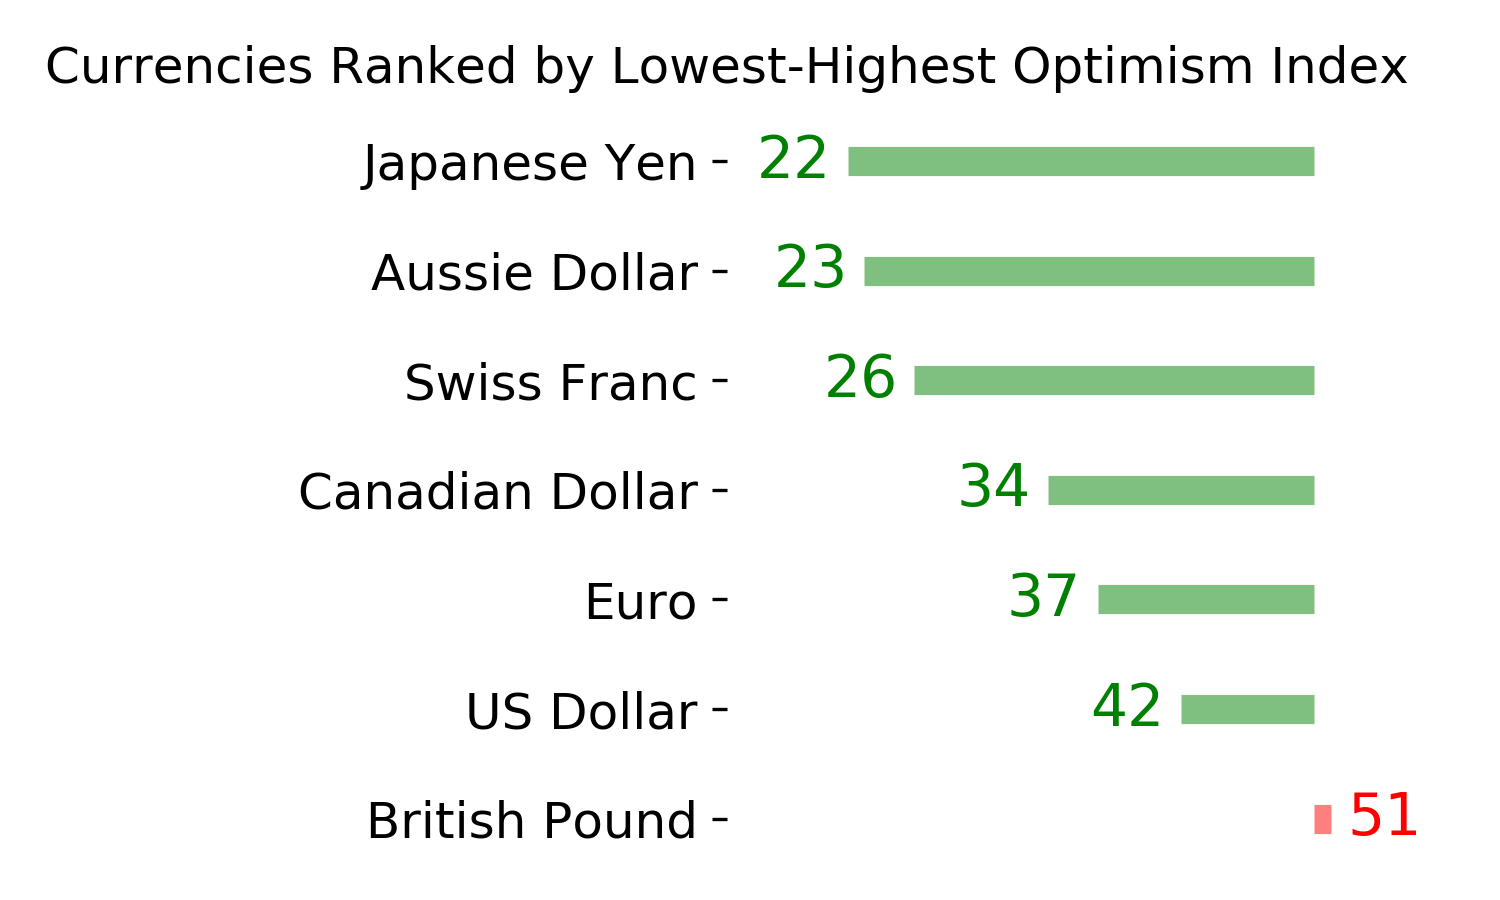
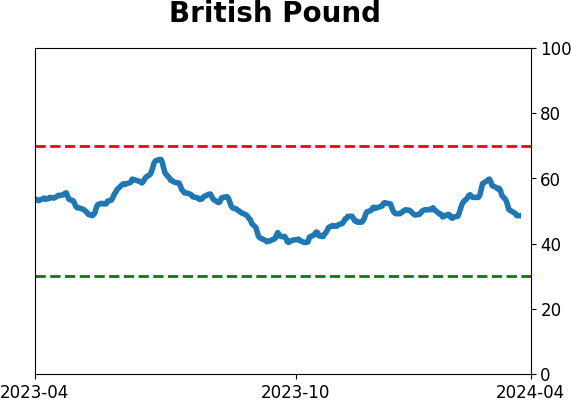
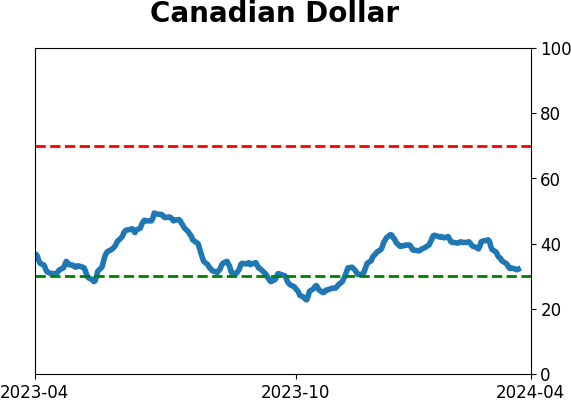
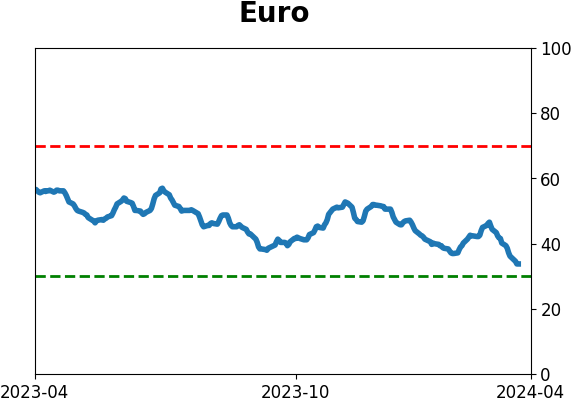
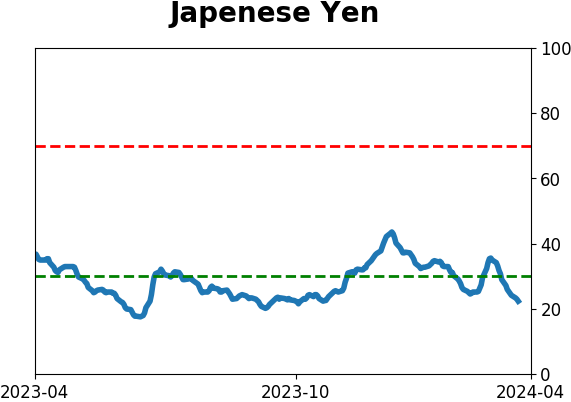
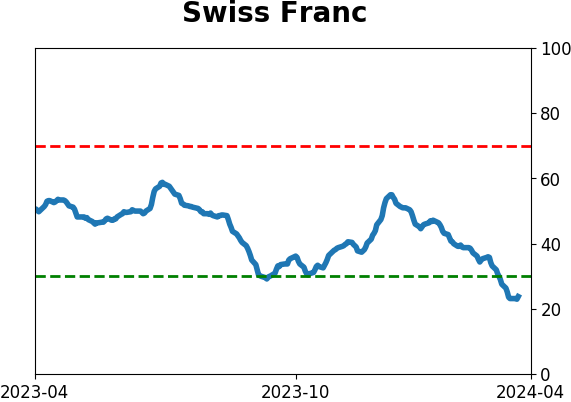
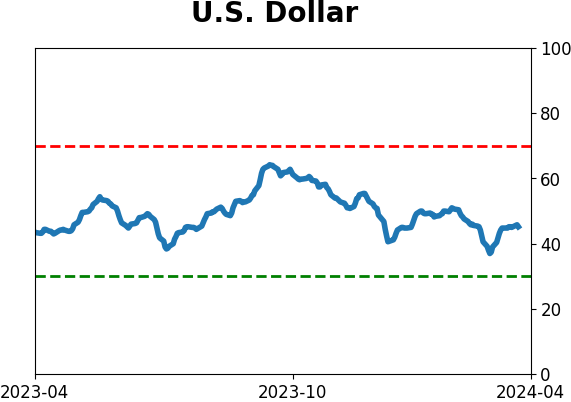
Currency ETF's - 5-Day Moving Average
|
|
|
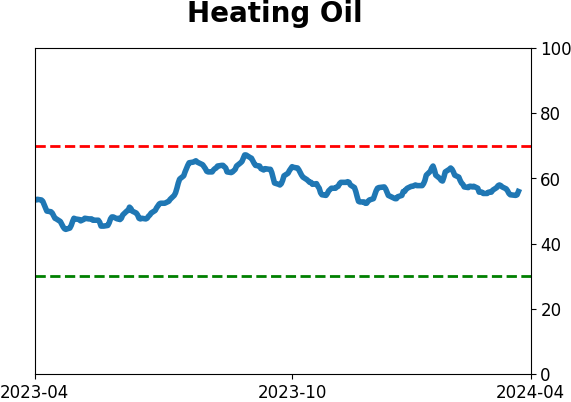
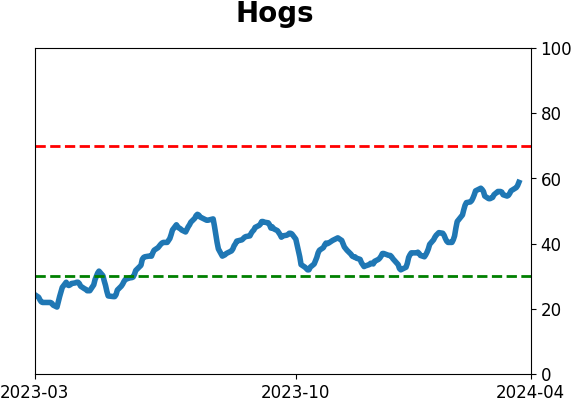
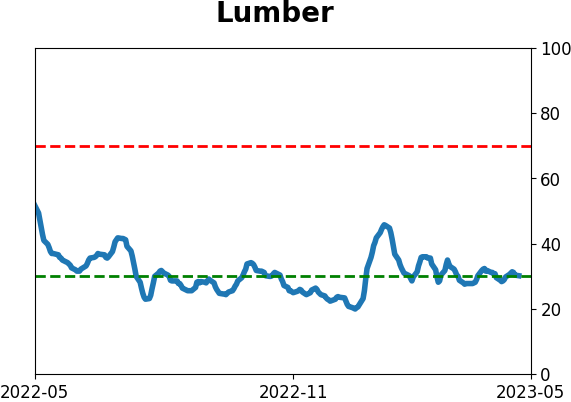
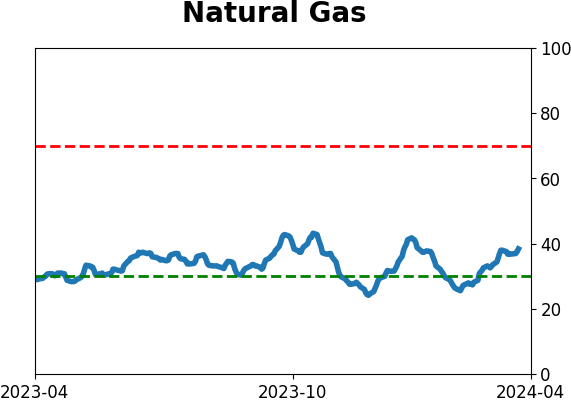
Commodity ETF's - 5-Day Moving Average
|
|