Products
SentimenTrader Trading Tools
‍
Backtest Engine
My Trading Toolkit
Correlation Analysis
Seasonality
Market Prediction
Indicators & Data API
‍
Proprietary Indicators & Charts
Market Data API
Strategies & Scanner
‍
50+ Trading Strategies
Smart Stock Scanner
Smart Option Scanner
Research Reports
‍
Research Solutions
Reports Library
Free Resources
Simple Backtest Calculator
Simple Seasonality Calculator
The Kelly Criterion Calculator
Sentiment Geo Map
Public Research Reports
Education
Sentiment Indicators
Technical Indicators
Pricing
Company
About
In the News
Testimonials
Client Success Stories
Contact
Log inLoginSign up
< BACK TO ALL REPORTS

Investor confidence flashes two favorable signals

Jay Kaeppel
2022-09-06
Changes in investor sentiment are often met with disbelief when they fly in the face of current price action. But they serve as important alerts that price trends can change quickly and that investors must be prepared to change with them. Two Conference Board sentiment indicators just flashed favorable signals.

Key points:

  • Consumer confidence toward stocks is rebounding, flashing a buy signal
  • The rebound comes as a 10-month average of their attitude toward fell to a historically low level
  • The S&P 500 and Nasdaq 100 have shown gains in the months following similar behavior

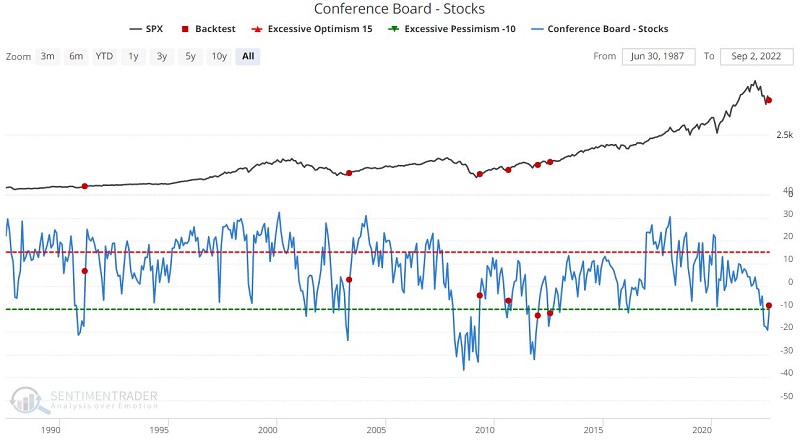
The average consumer is a little less bearish on stocks 

Consumers are finally starting to warm up to the stock market.

According to a monthly survey from the Conference Board, the net percentage of consumers expecting stocks to increase versus decrease rebounded from the worst level in a decade. When this reverses from a low level, it suggests that bearish sentiment is reversing and better days may be ahead for stocks.

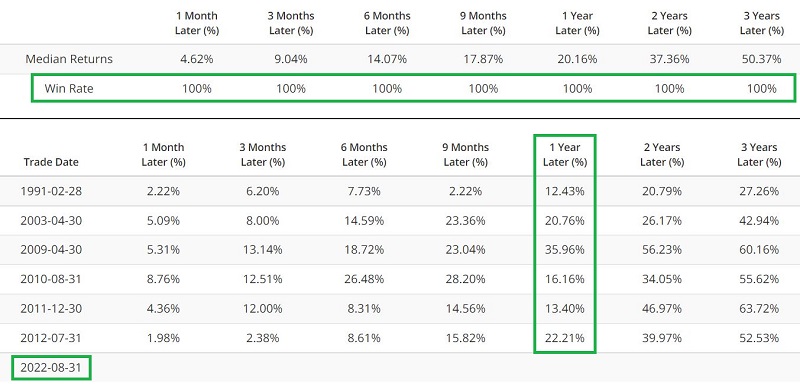
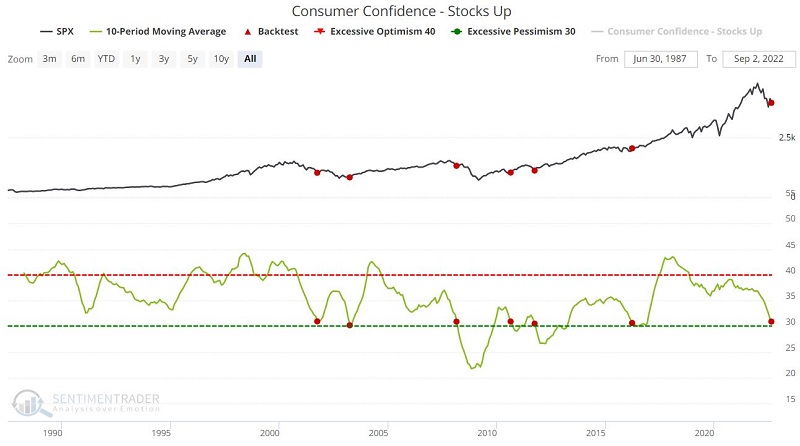
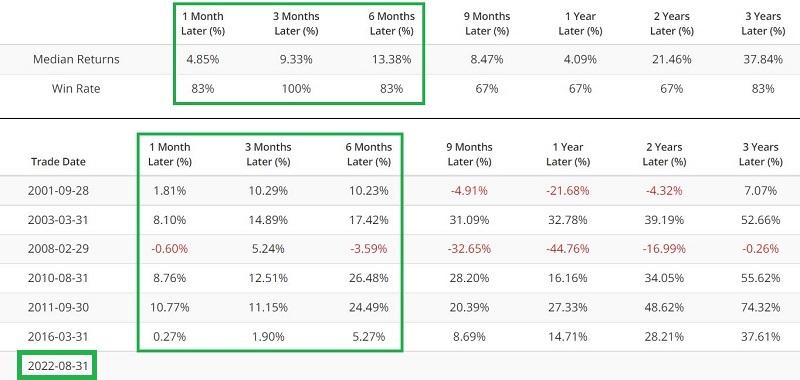
The chart below displays those times when this spread crossed above -13.3%, and the table shows S&P 500 performance following those signals. While past performance doesn't guarantee future results, the S&P showed a positive return every time across every time frame. The latest signal was triggered at the end of August.

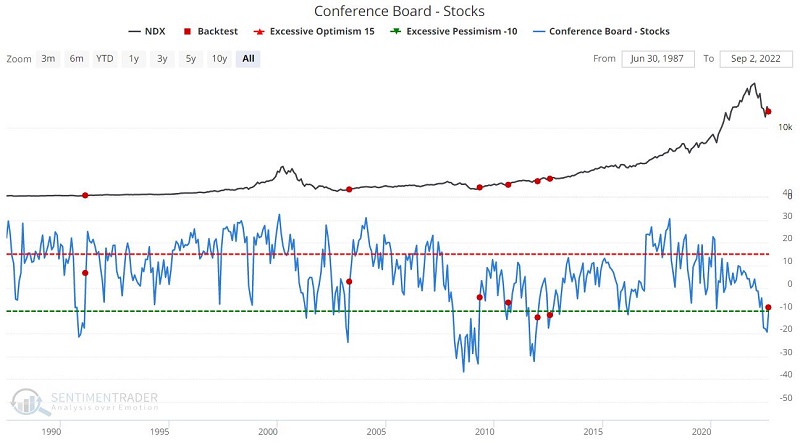
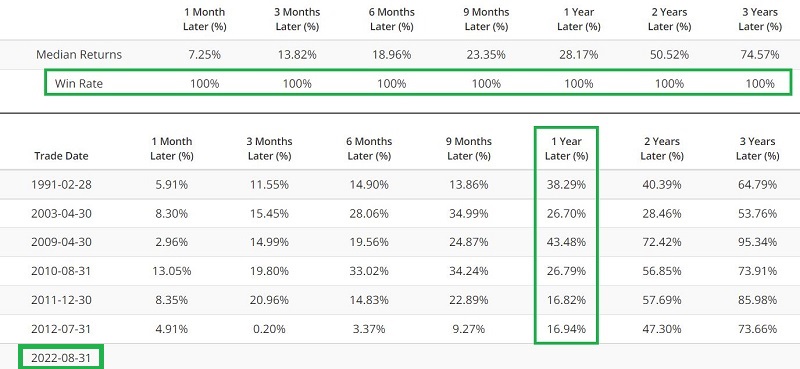
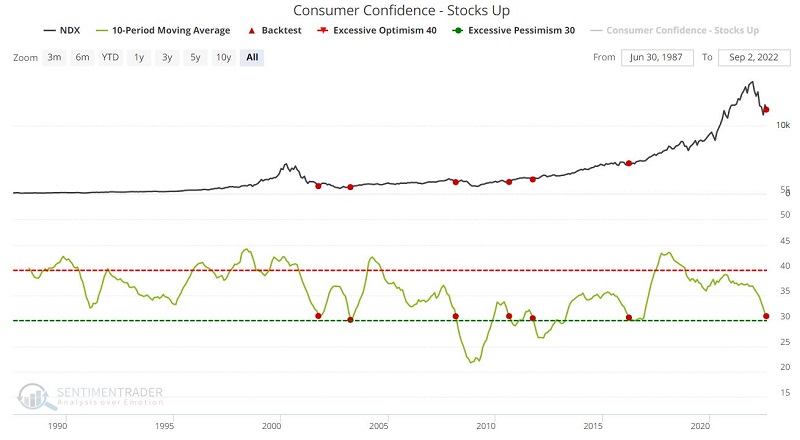
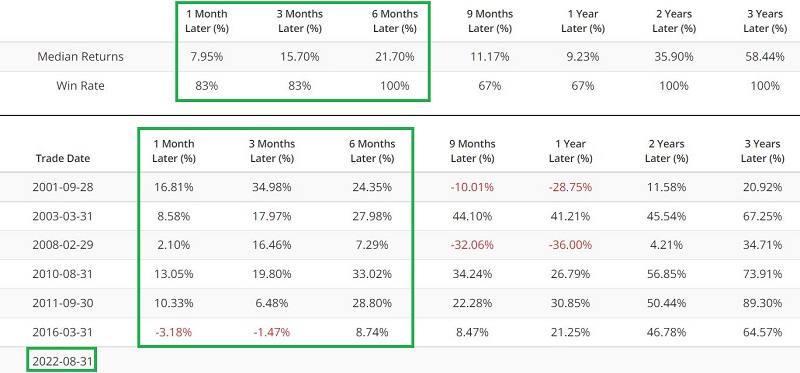
The results were even more robust when we look at the Nasdaq 100 (NDX) instead of the S&P 500. Performance for the NDX following this signal appears in the chart and table below. Again, positive returns across every time frame, with an impressive average.

A long-term average of bulls has dropped to an extreme

While the net percentage of bulls minus bears finally turned higher last month, a long-term average of the percentage of bulls has drifted to a historically low level. 

The chart below shows when the 10-month moving average for this indicator crossed below 31, and the table displays S&P 500 performance following those signals. While it occurred relatively early in the 2001 and 2008 bear markets, shorter-term returns were mostly positive.

Once again, the results were even more robust when we look at the Nasdaq 100 instead of the S&P 500. Performance for the NDX following this signal appears in the chart and table below.

What the research tells us…

The signals above have a strong history of foreshadowing favorable stock market action. In the face of a persistent market decline, it is easy to dismiss them. The best way to use these indicators is as part of a weight-of-the-evidence approach rather than as a standalone model. Given the recent signals detailed above, investors should be watching closely for any bullish confirmation - ideally involving price reversing higher without taking out the June 2022 lows.

PRODUCTS
SentimenTrader
Trading Tools
Indicators & Data API
‍
Strategies & Scanner
‍
Research Reports
FREE
RESOUrCES
Simple Backtest
Calculator
Simple Seasonality
Calculator
The Kelly Criterion
Calculator
Sentiment Geo Map
‍
Public Research Reports
‍
Education
Sentiment Indicators
‍
Technical Indicators
‍
Pricing
Bundle pricing
‍
FAQ
‍
Announcements
‍
COMPANY
‍
About
‍
In the News
‍
Testimonials
‍
Client Success Stories
CONTACT
‍
General Inquiries
‍
Media Inquiries
‍
Financial Professionals Inquiries
‍
© 2026 Sundial Capital Research Inc. All rights reserved.
Setsail Marketing
TermsPrivacyAffiliate Program
Risk Disclosure: The information and tools provided are for research and analytical purposes only and are not intended as investment advice. Market analysis involves uncertainty, and outcomes may differ from expectations. Users should conduct their own due diligence and consider their individual circumstances before making any financial decisions. Past performance is not necessarily indicative of future results.

Hypothetical Performance Disclosure: Hypothetical performance results have many inherent limitations, some of which are described below. No representation is being made that any account will or is likely to achieve profits or losses similar to those shown; in fact, there are frequently sharp differences between hypothetical performance results and the actual results subsequently achieved by any particular trading program. One of the limitations of hypothetical performance results is that they are generally prepared with the benefit of hindsight. In addition, hypothetical trading does not involve financial risk, and no hypothetical trading record can completely account for the impact of financial risk of actual trading. for example, the ability to withstand losses or to adhere to a particular trading program in spite of trading losses are material points which can also adversely affect actual trading results. There are numerous other factors related to the markets in general or to the implementation of any specific trading program which cannot be fully accounted for in the preparation of hypothetical performance results and all which can adversely affect trading results.

Testimonial Disclosure: Testimonials appearing on this website may not be representative of other clients or customers and is not a guarantee of future performance or success.