Headlines
|
|
Smart money insiders buy stocks and futures:
Insiders have picked up their pace of buying their own company stock, and "smart money" hedgers have finally stepped up their buying of equity index futures.
Volatility flip:
Implied volatility in the Nasdaq 100 has been lower than for the S&P 500 for three straight weeks. This is highly unusual, since big tech stocks tend to be more volatile than the broader market. Over these weeks, there has been a record spread between the VXN and the VIX.
Putting the "rat" in rating:
Ratings agencies have been busy downgrading the debt of S&P 500 companies in recent days. The past month has seen a record number of downgrades, something the agencies are loathe to do, and which they delay as long as possible. The peak has usually come as price declines have run their course.
|
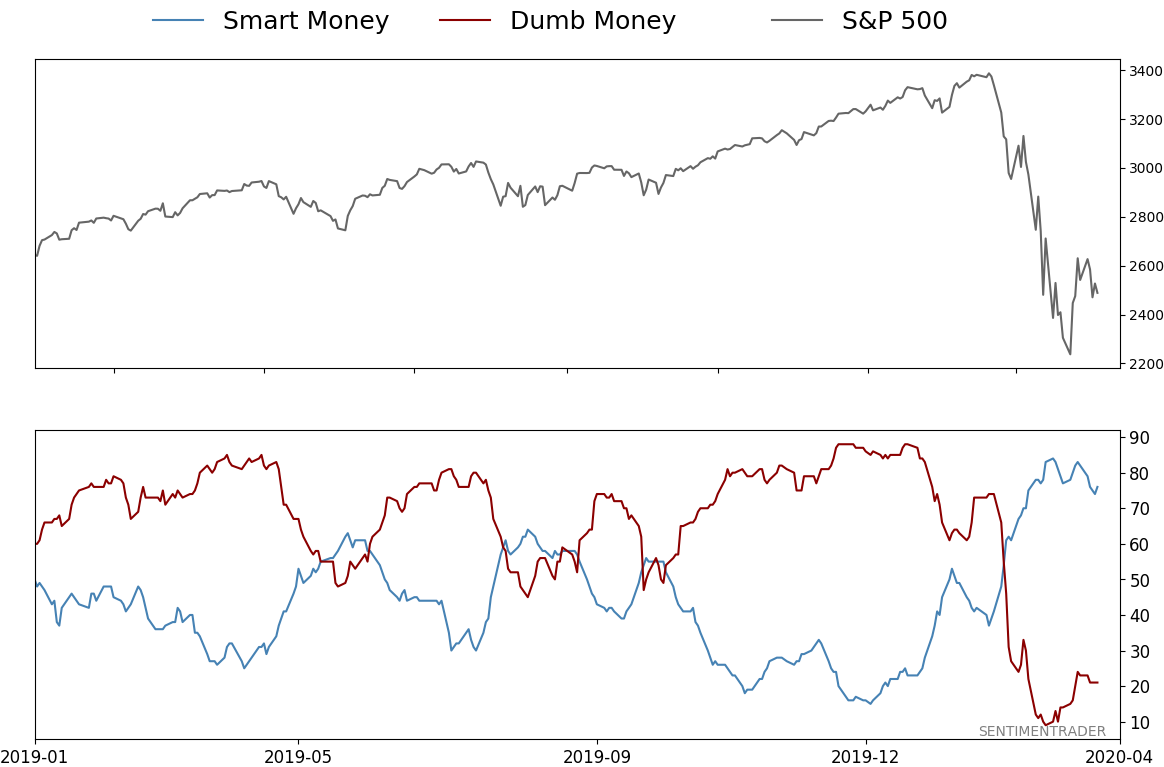
Smart / Dumb Money Confidence
|
Smart Money Confidence: 76%
Dumb Money Confidence: 21%
|
|
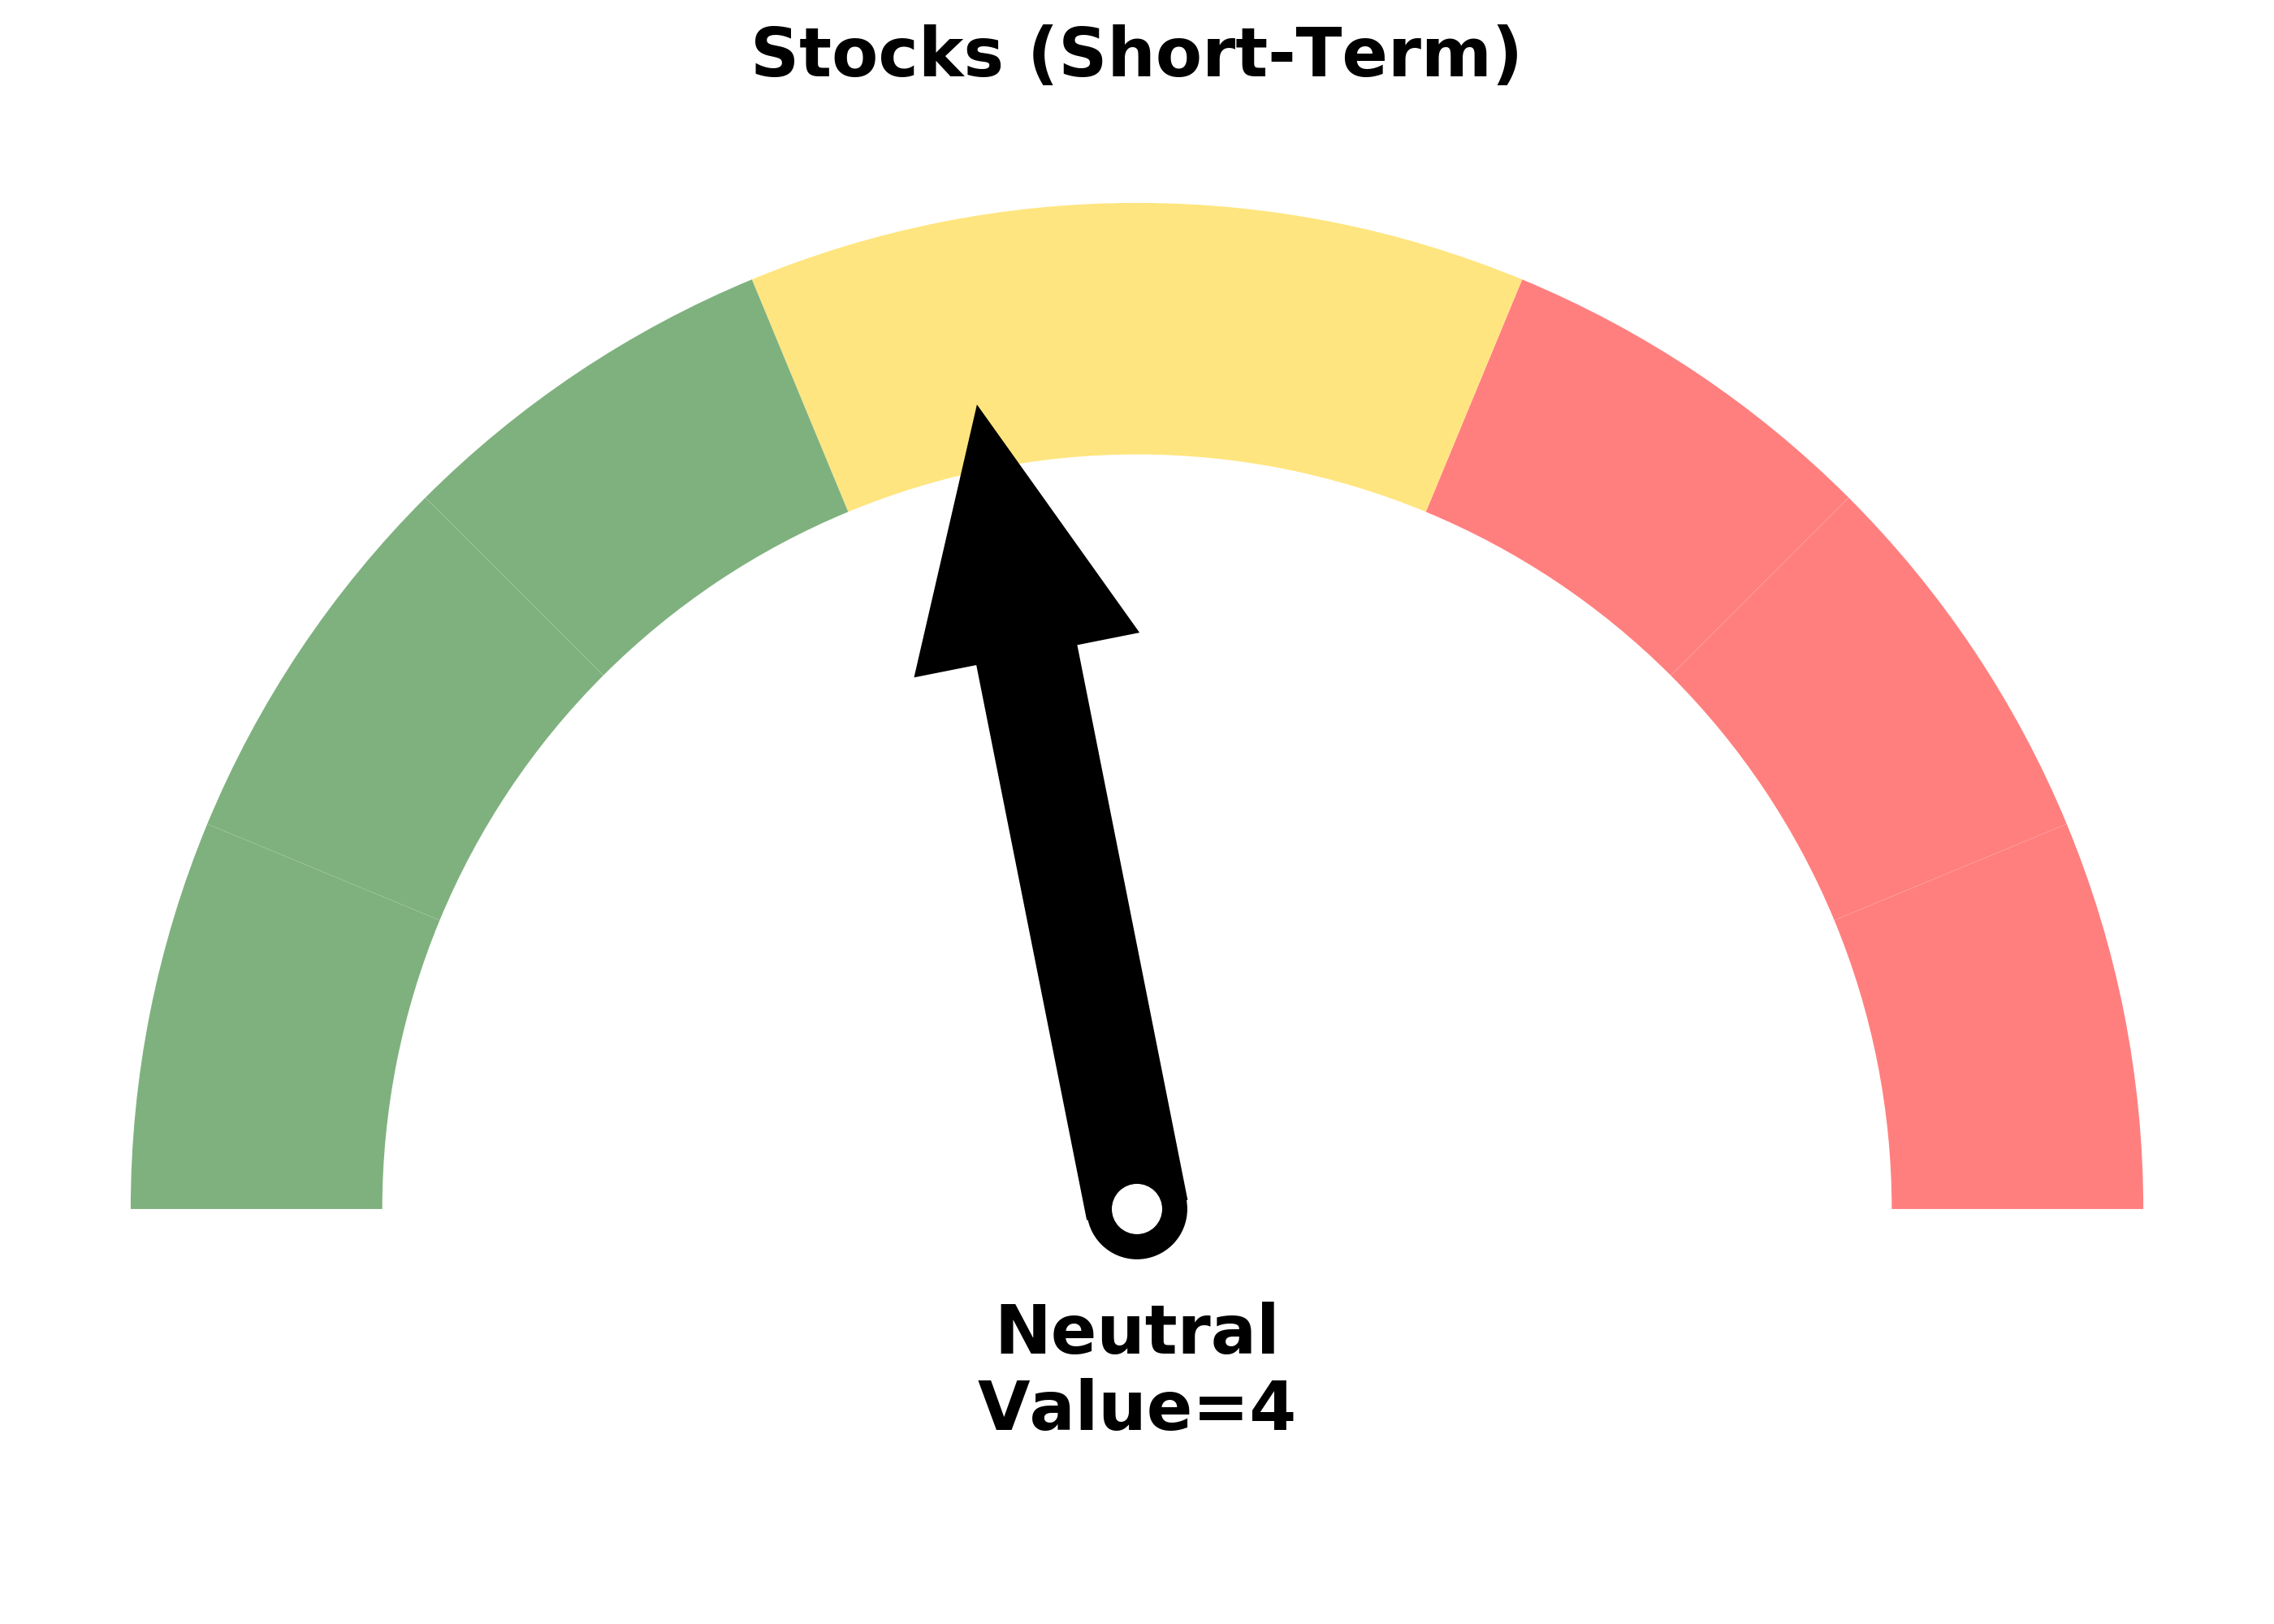
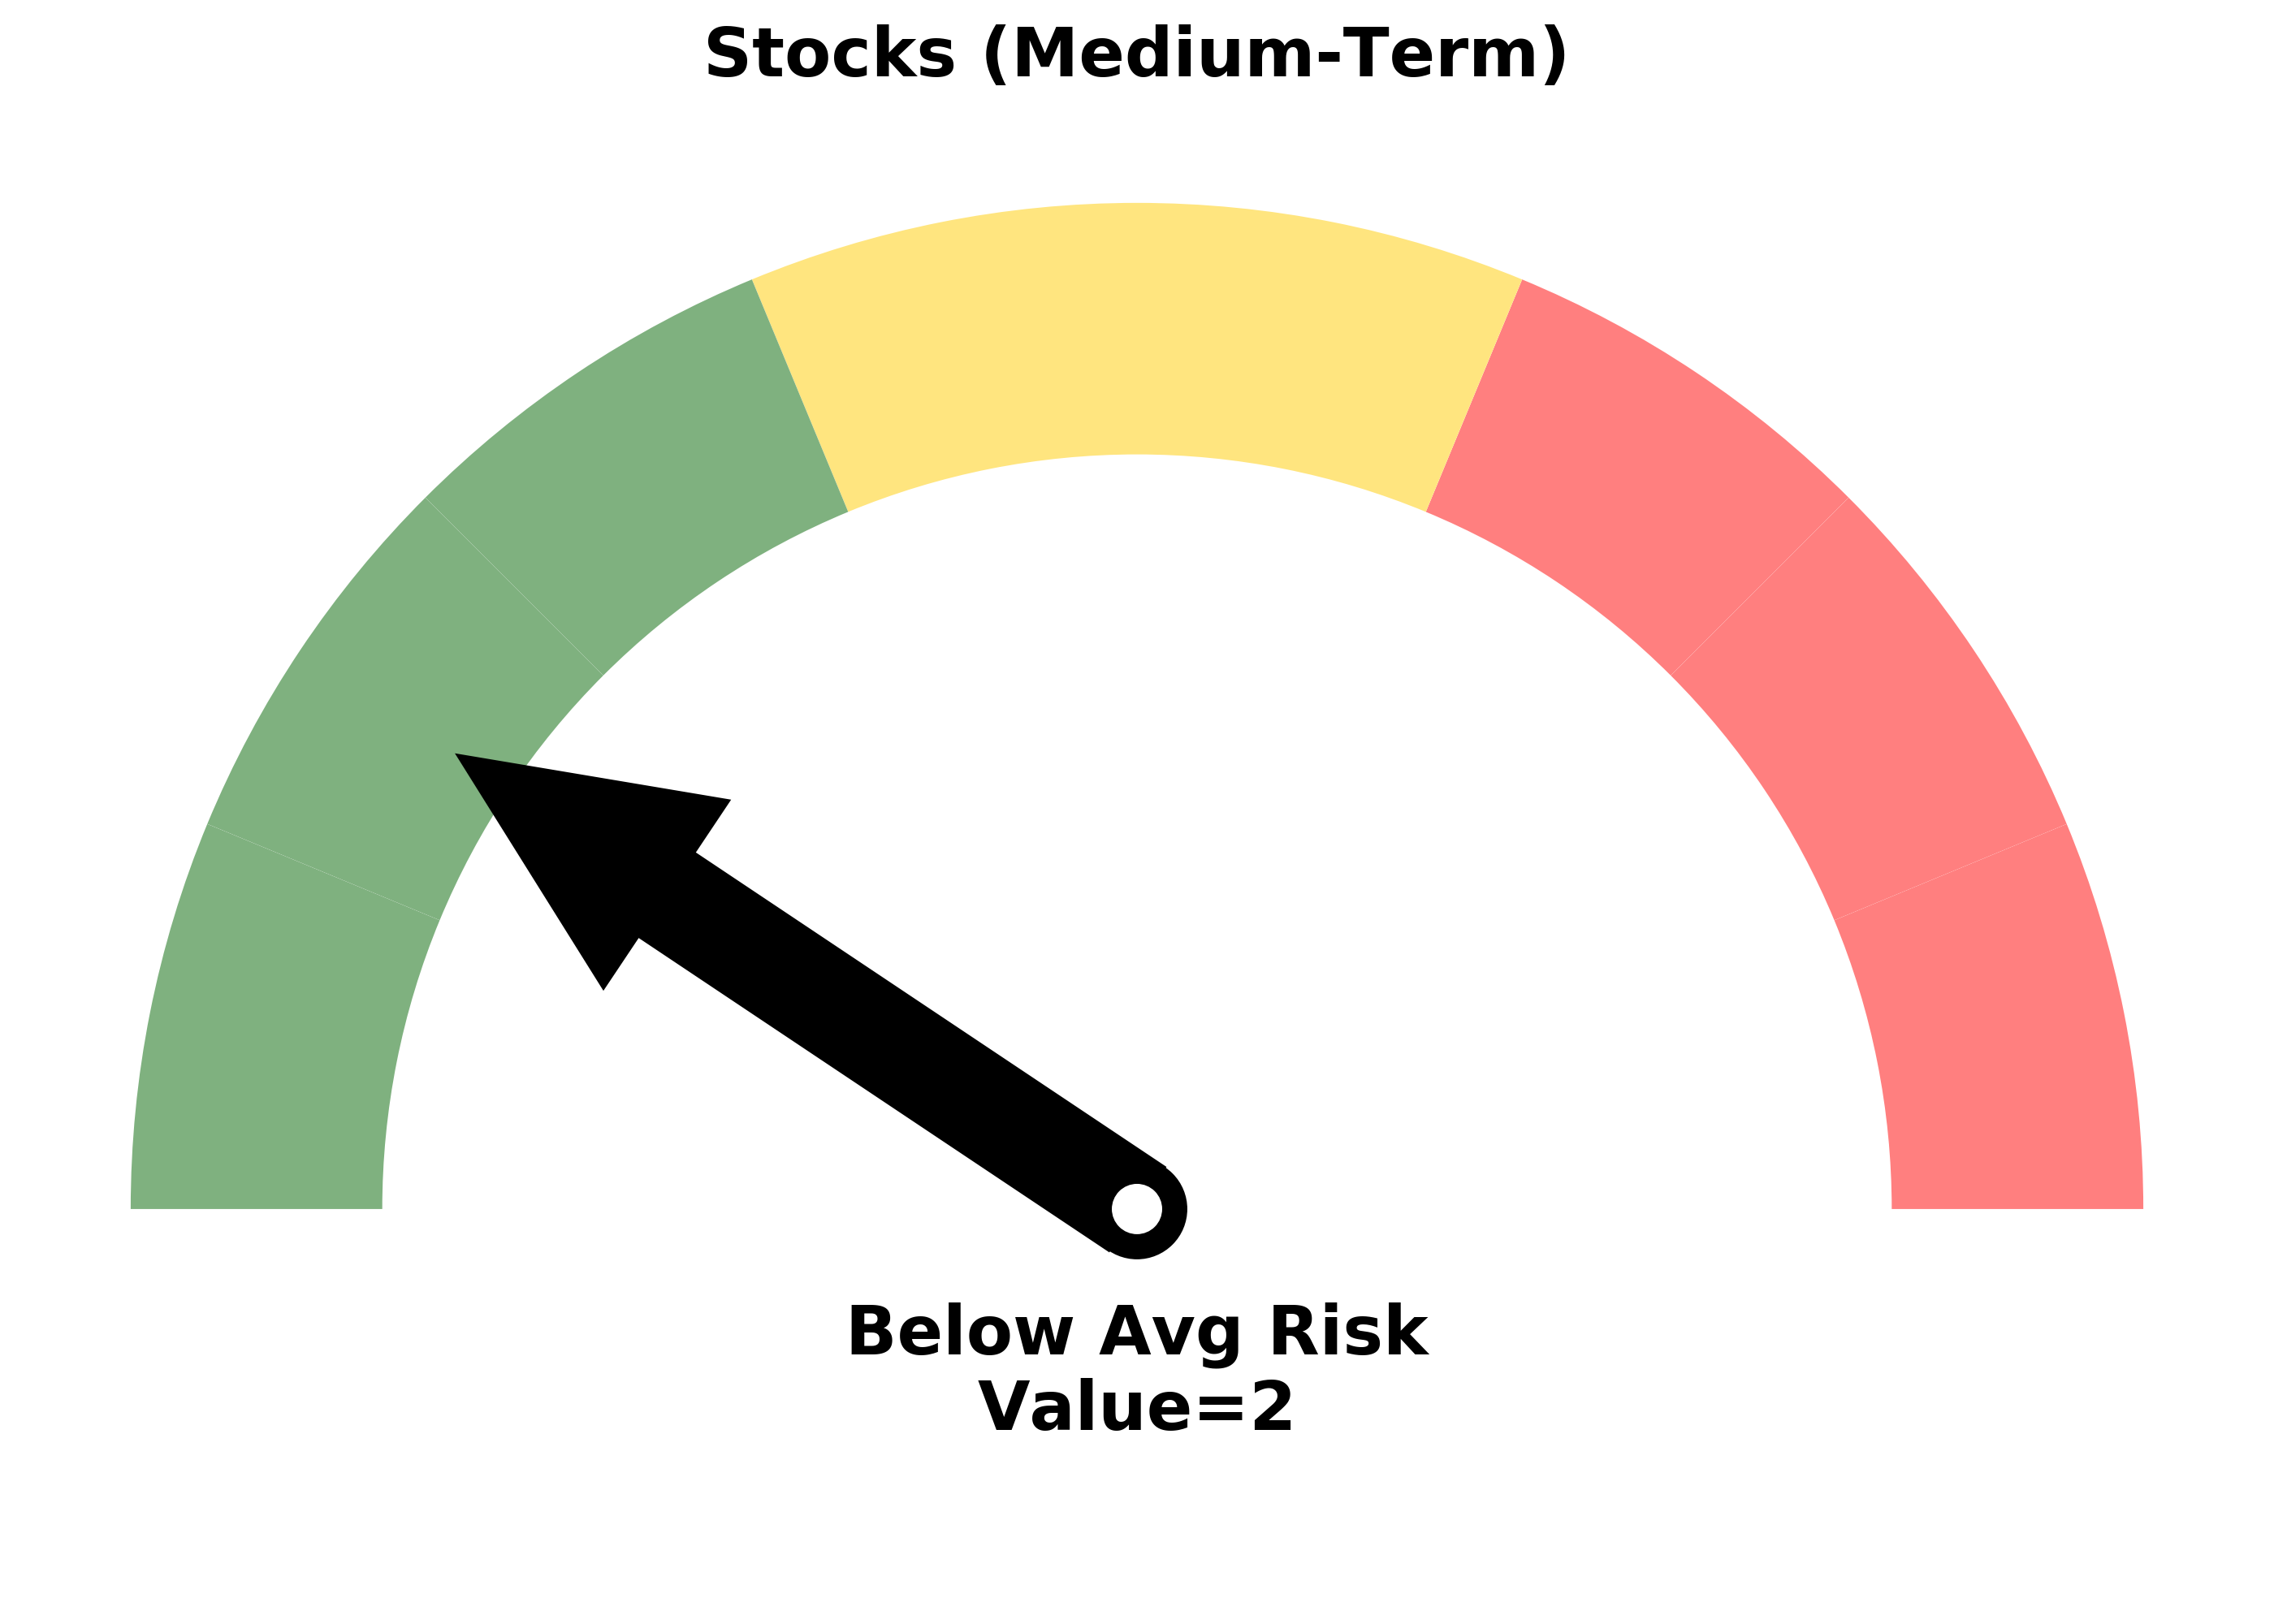
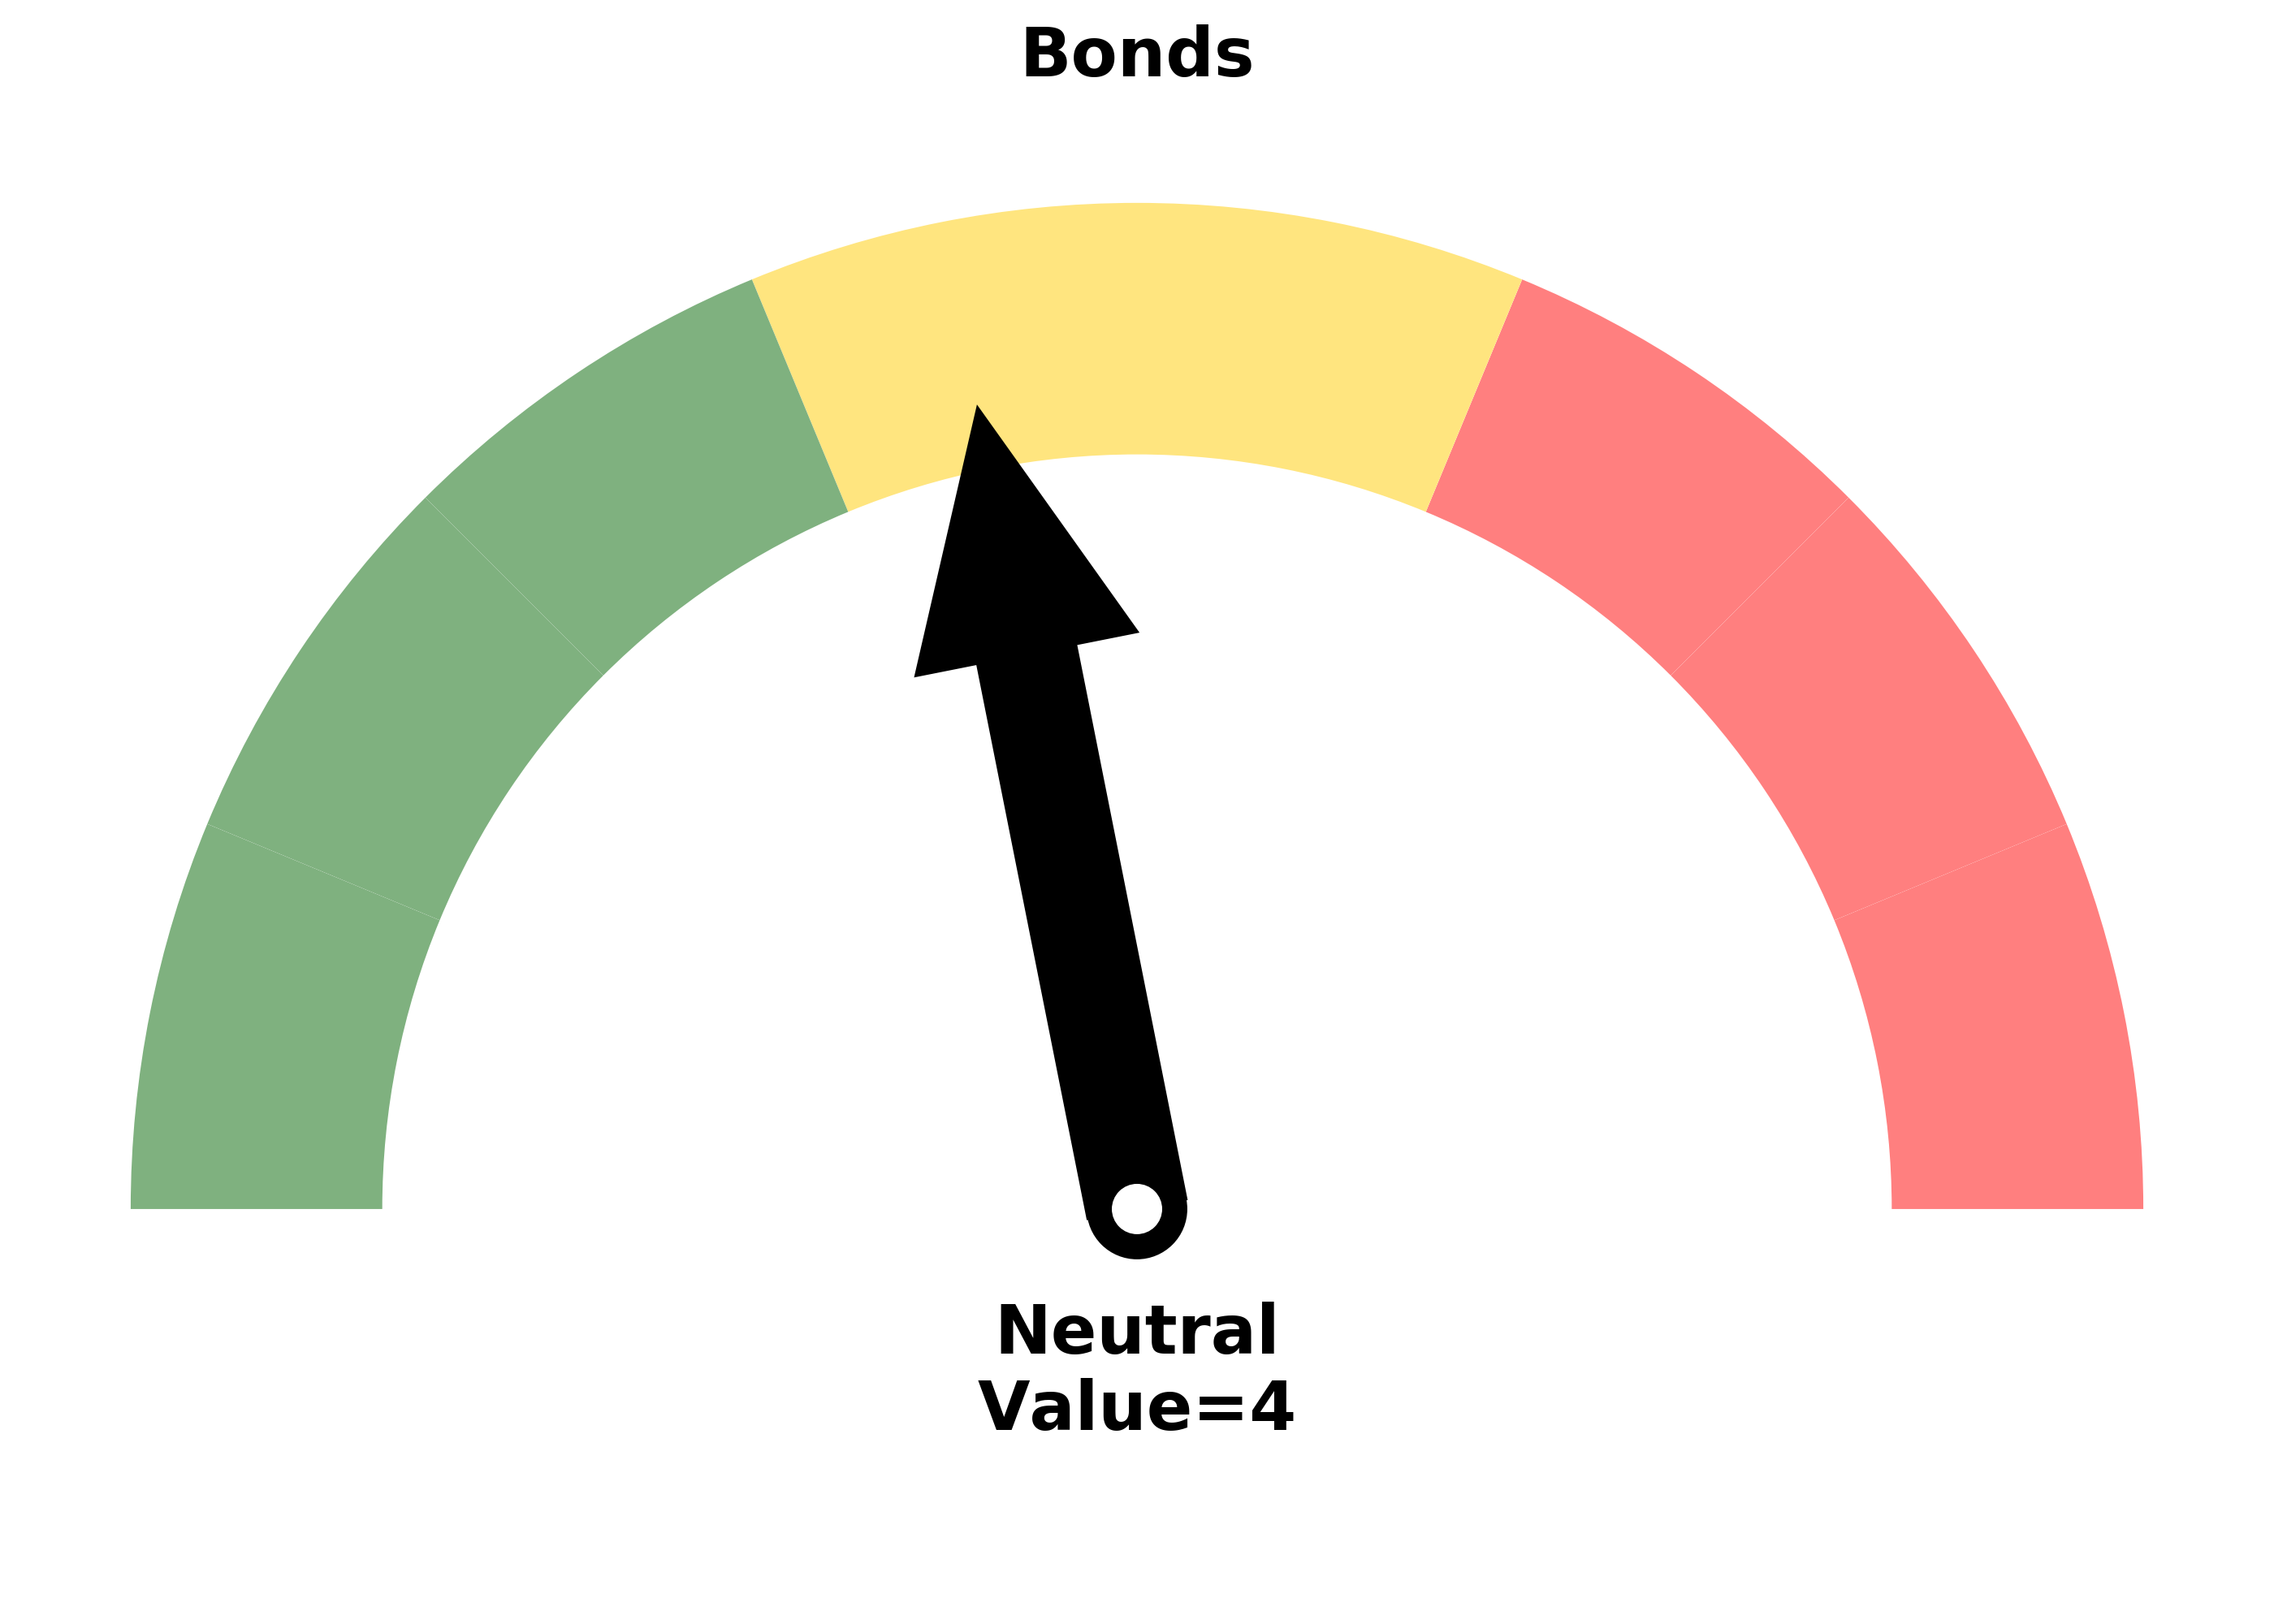
Risk Levels
Research
BOTTOM LINE
Insiders have picked up their pace of buying their own company stock, and "smart money" hedgers have finally stepped up their buying of equity index futures.
FORECAST / TIMEFRAME
SPY -- Up, Long-Term
|
The latest Commitments of Traders report showed that "smart money" hedgers have finally started doing some buying in stocks. Most other bond and commodity contracts saw minor retreats from extremes.
The 3-Year Min/Max Screen shows new multi-year highs in hedger positions in the Dow also the Hedgers Combo indicator. Their aggregate position in the major equity index contracts was more than $10 billion long as of Tuesday.
Over the past decade, it's been rare to see them this aggressive. Each instance led to dramatically higher prices for the S&P 500 according to the Backtest Engine.
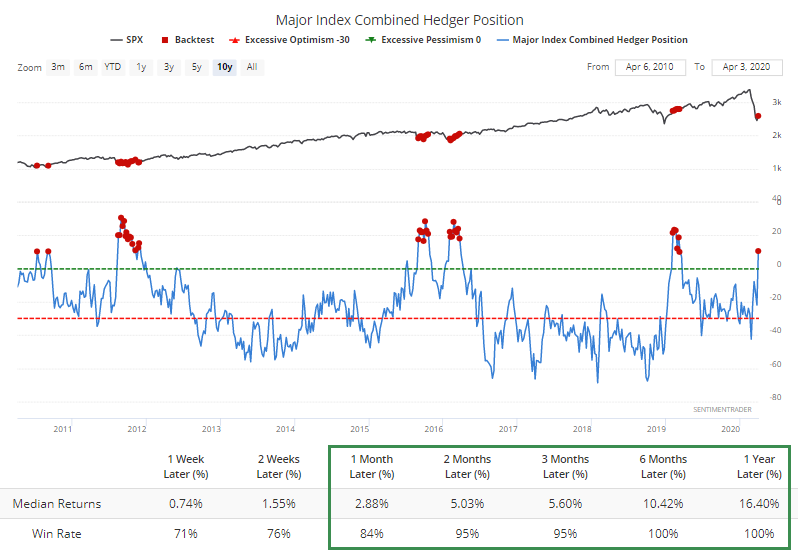
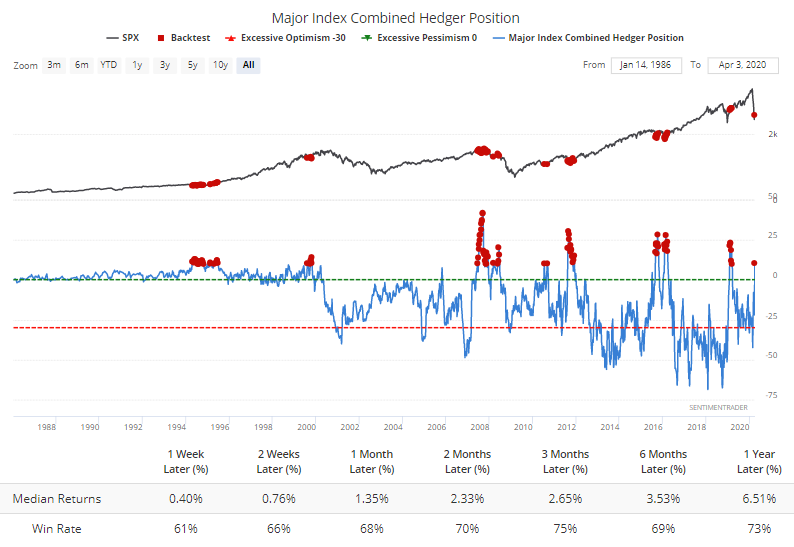
Granted, the past decade was dominated by bull market(s), and it's hard to make the case we're in the same environment. Going back further, this data didn't do as well. It seems as though something changed along with the 2008 financial crisis in how traders used these futures contracts.
It's also worth mentioning that over the past few weeks, corporate insiders have picked up their pace of buying. On a seasonally-adjusted basis, they're longer than they've been at most other points in the past decade.
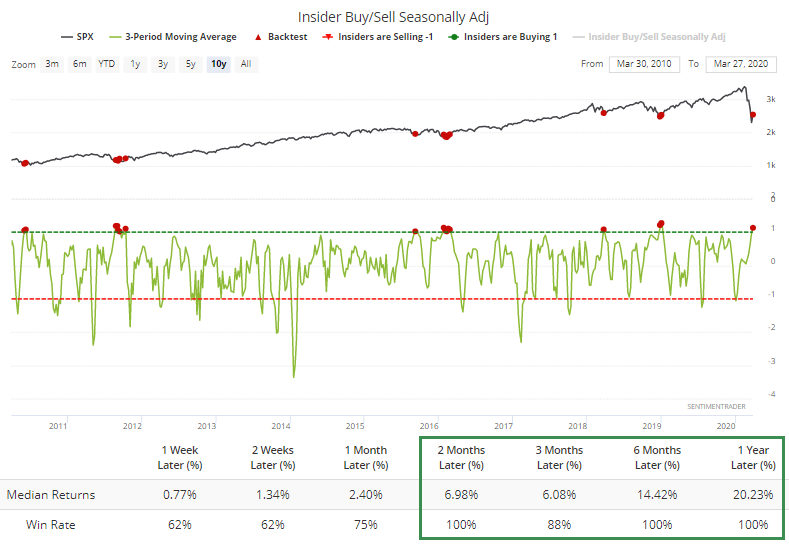
Again, bouts of insider optimism during a roaring bull market is often different than during a prolonged bear market, and when we include dates from 2008, returns deteriorated.
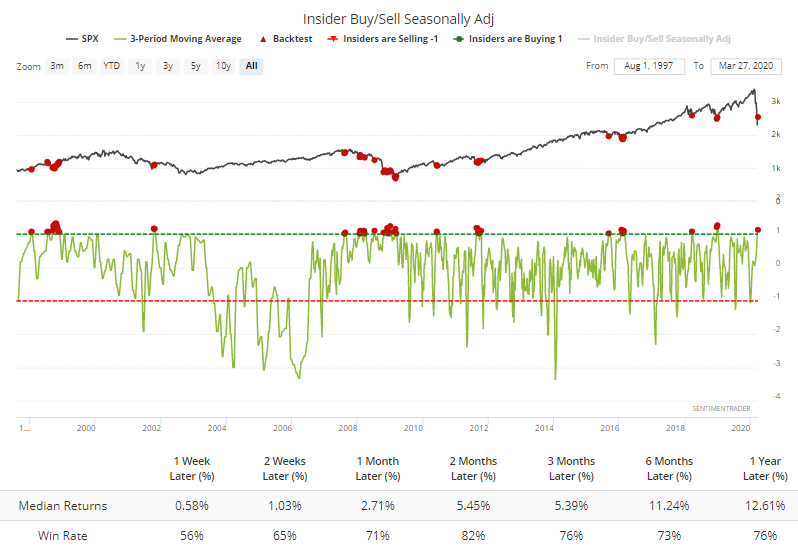
There's enough here to consider insider positions a positive. We just can't assume it's a pound-the-table buy signal like most of the other points over the past decade when trends were clearly more favorable.
BOTTOM LINE
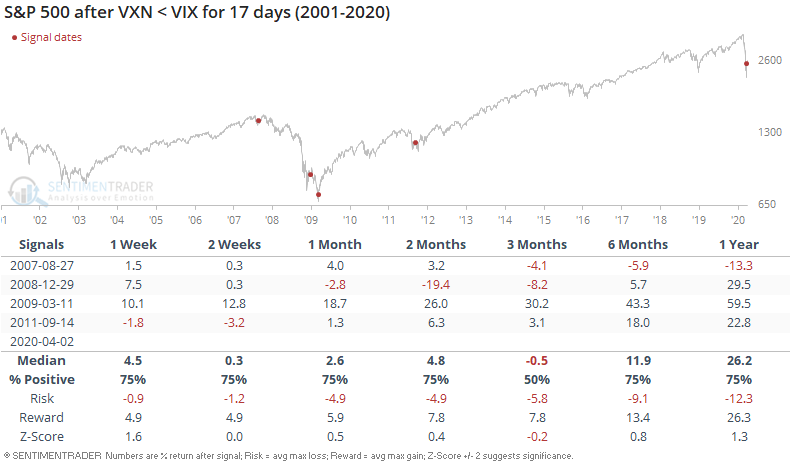
Implied volatility in the Nasdaq 100 has been lower than for the S&P 500 for three straight weeks. This is highly unusual, since big tech stocks tend to be more volatile than the broader market. Over these weeks, there has been a record spread between the VXN and the VIX.
FORECAST / TIMEFRAME
QQQ -- Up, Medium-Term
|
It's a volatile market, and not just in the typical ways.
Traders usually price in bigger moves in higher-beta stocks, because by their very nature they move up and down more than the broader market. But an interesting thing has been happening over the past few weeks. As noted by the Wall Street Journal, options traders are pricing in smaller moves in the tech-laden Nasdaq 100 (NDX) than for the S&P 500 (SPX).
Volatility in the NDX has historically been higher than the SPX, both because there are fewer stocks in the index and the big tech firms that make up the NDX just tend to move around a lot more due to the nature of their businesses. But because some of these firms have benefited from the stay-at-home orders, tech stocks have held up relatively well, and traders have been pricing in smaller moves.
As a result, implied volatility for the Nasdaq 100, the VXN, has been below that for the S&P 500, the VIX, for the past 3 weeks. This is highly unusual.
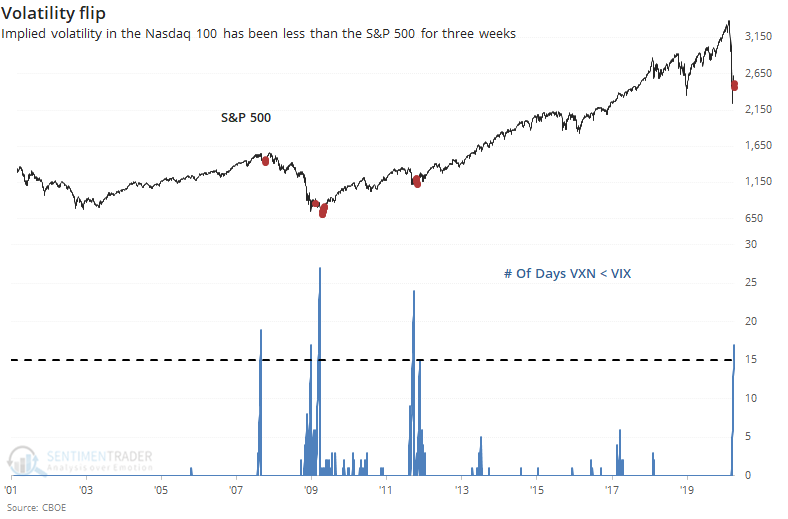
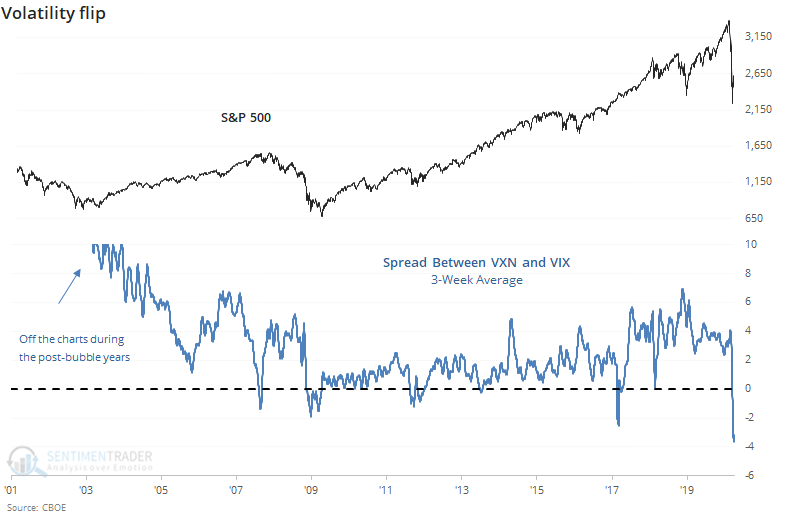
The spread between them is at a record.
By the time the spread between the two implied volatility gauges had been negative for this many days, the S&P rebounded quickly three times (then failed twice) and sold off quickly once then rallied strongly.
The Nasdaq 100 fared better.
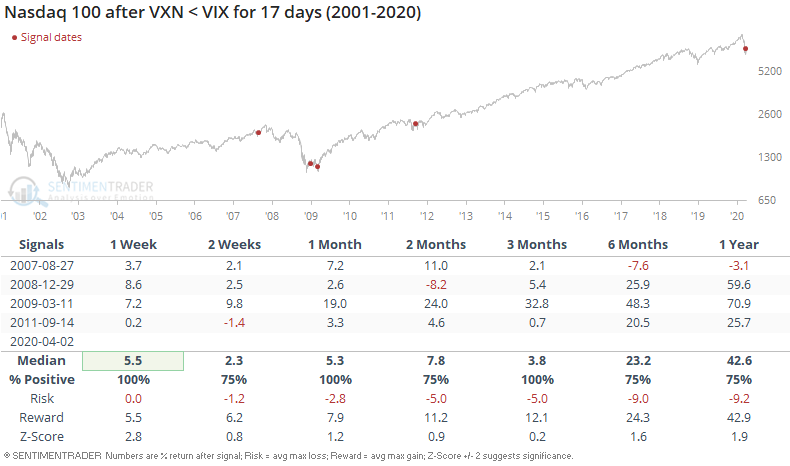
Even though the ratio of the Nasdaq 100 to S&P 500 has gone parabolic, these implied volatility flips tended to lead to even more out-performance in the NDX vs SPX.

This should be a good sign for stocks in general, and tech in particular.
BOTTOM LINE
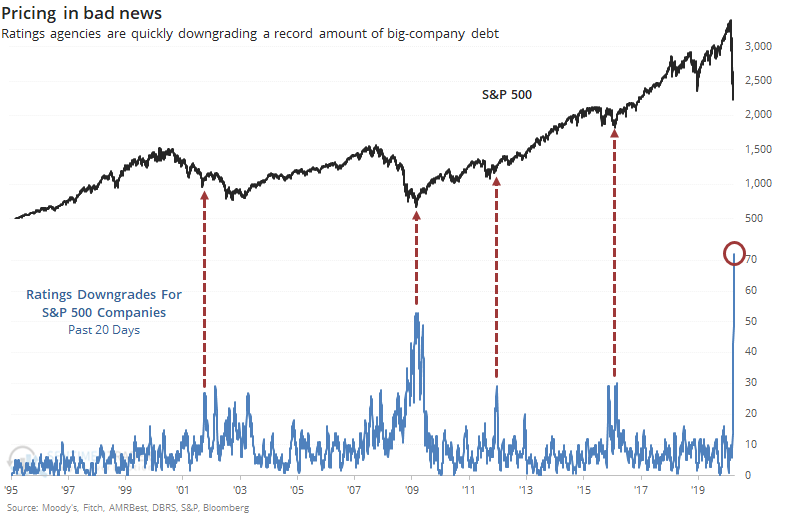
Ratings agencies have been busy downgrading the debt of S&P 500 companies in recent days. The past month has seen a record number of downgrades, something the agencies are loathe to do, and which they delay as long as possible. The peak has usually come as price declines have run their course.
FORECAST / TIMEFRAME
SPY -- Up, Long-Term
|
By the time the ratings agencies react, you know it's bad.
Many times over the past 20 years, we've looked at ratings agencies and their very strong, very consistent tendency to be behind the curve. Their primary interests do not lie with the investors they purport to help. Their underlying incentive is to maintain their revenue streams, which they do by waiting until the last possible moment to downgrade any issuer's debt, so they can stay in their good graces and win future business. Cynical, but true.
This is particularly evident with the largest companies, like those in the S&P 500. Any ratings agency is loathe to downgrade the debt of a major issuer, since they are the ones most likely to generate the best business in the future.
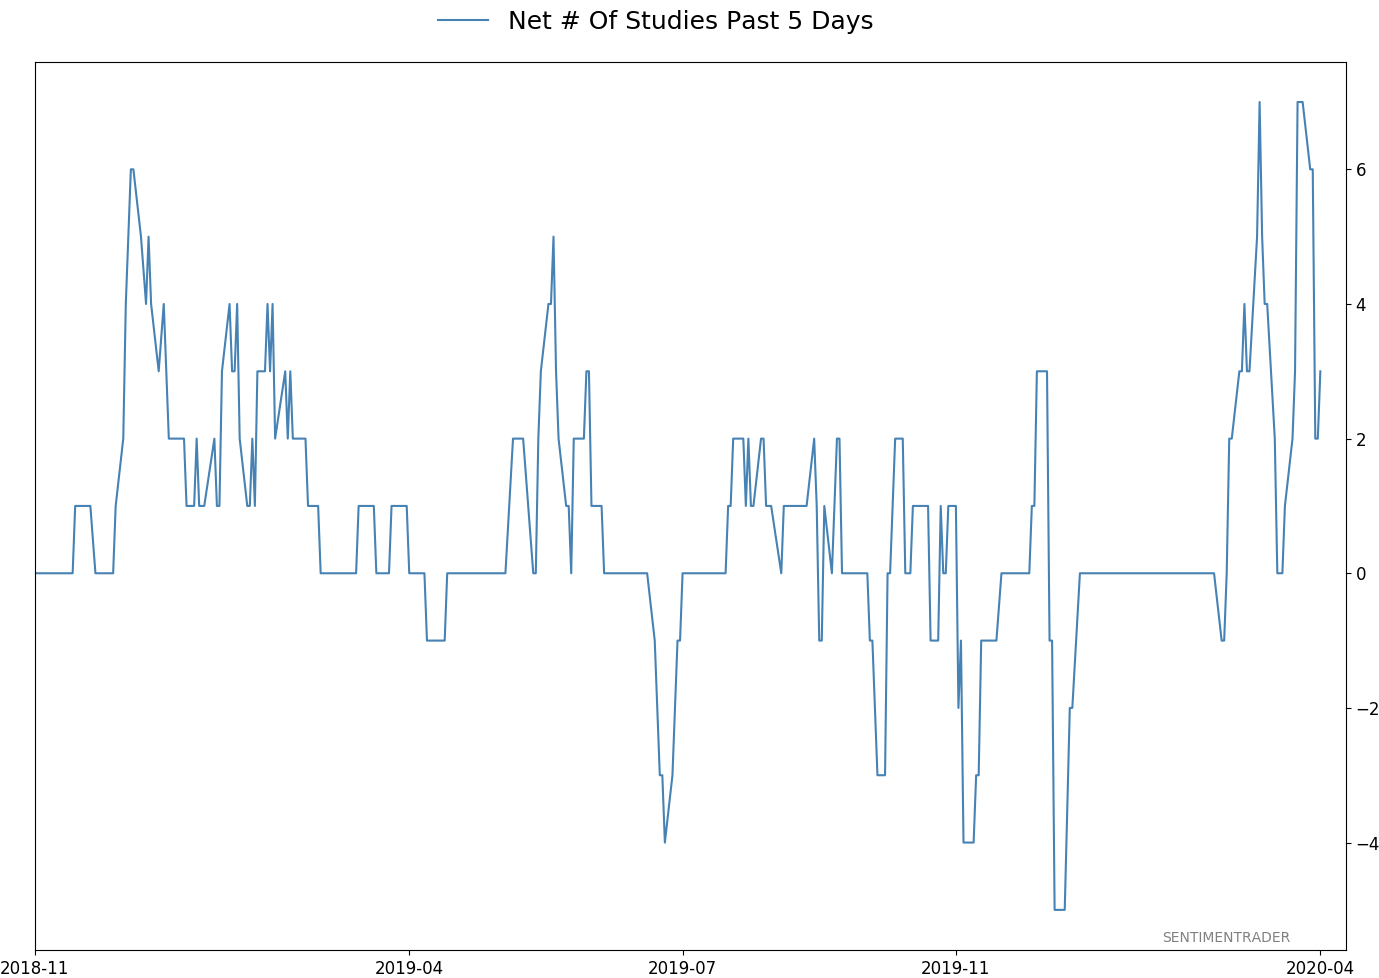
The unprecedented shutdown of American business has changed that. Over the past month, ratings agencies have downgraded a record amount of debt on firms within the S&P 500.
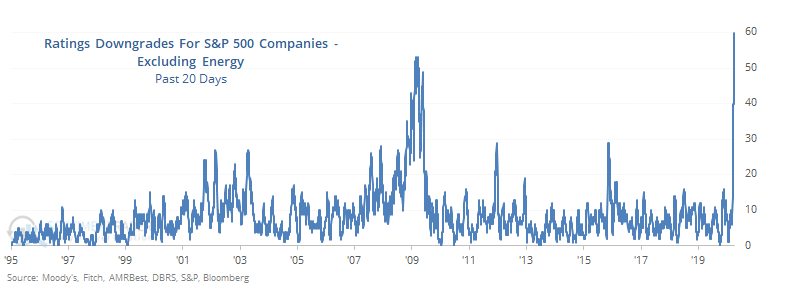
We already saw that a lot of energy companies are being downgraded, so maybe that skews the results. But in just the few few days, agencies have downgraded Harley-Davidson, Marriott, Carnival, Darden Restaurants, Kohls, Macy's...and the list goes on.
If we sum up the downgrades and exclude anything to do with oil or energy, they're still at a record high.
There is no question that the global slump is severe. Maybe the worst in generations depending on how long this lasts, the projections for which seem to change daily.
One thing that doesn't change, though, is that people (and companies) respond to incentives. The incentive for ratings agencies is to prolong the pain of a client downgrade for as long as possible, so by the time a large number of those companies have been downgraded, most of the declines have already run their course. That would be a hopeful sign now.
Active Studies
| Time Frame | Bullish | Bearish | | Short-Term | 0 | 2 | | Medium-Term | 18 | 14 | | Long-Term | 34 | 4 |
|
Indicators at Extremes
Portfolio
| Position | Weight % | Added / Reduced | Date | | Stocks | 73.2 | Added 31.3% | 2020-03-17 | | Bonds | 0.0 | Reduced 6.7% | 2020-02-28 | | Commodities | 5.5 | Added 2.4%
| 2020-02-28 | | Precious Metals | 0.0 | Reduced 3.6% | 2020-02-28 | | Special Situations | 0.0 | Reduced 31.9% | 2020-03-17 | | Cash | 21.3 | | |
|
Updates (Changes made today are underlined)
In the first months of the year, we saw manic trading activity. From big jumps in specific stocks to historic highs in retail trading activity to record highs in household confidence to almost unbelievable confidence among options traders. All of that has come amid a market where the average stock can’t keep up with their indexes. There were signs of waning momentum in stocks underlying the major averages, which started triggering technical warning signs in late January. The kinds of extremes we saw in December and January typically take months to wear away, but the type of selling we’ve seen over the past month has gone a long way toward getting there. When we place the kind of moves we saw into March 23 into the context of coming off an all-time high, there has been a high probability of a multi-month rebound. The volatility we’ve seen lately is extremely compelling from a medium-term point of view. Virtually everything we’ve looked at suggests a strong probability of gains over the next several months, even within the context of a potential bear market, and even from what had been higher prices. After stocks bottomed on the 23rd, they enjoyed a historic buying thrust. While other signs are mixed at best that panic is subsiding, that thrust is one of the most encouraging sign we've seen in years. There is often a test of a panic low in the weeks after an initial recovery, but that thrust we saw, combined with the larger-than-usual retracement, have me less convinced a test is necessary. For now, I see no overwhelming reason to add or reduce exposure.
RETURN YTD: -18.3% 2019: 12.6%, 2018: 0.6%, 2017: 3.8%, 2016: 17.1%, 2015: 9.2%, 2014: 14.5%, 2013: 2.2%, 2012: 10.8%, 2011: 16.5%, 2010: 15.3%, 2009: 23.9%, 2008: 16.2%, 2007: 7.8%
|
|
Phase Table
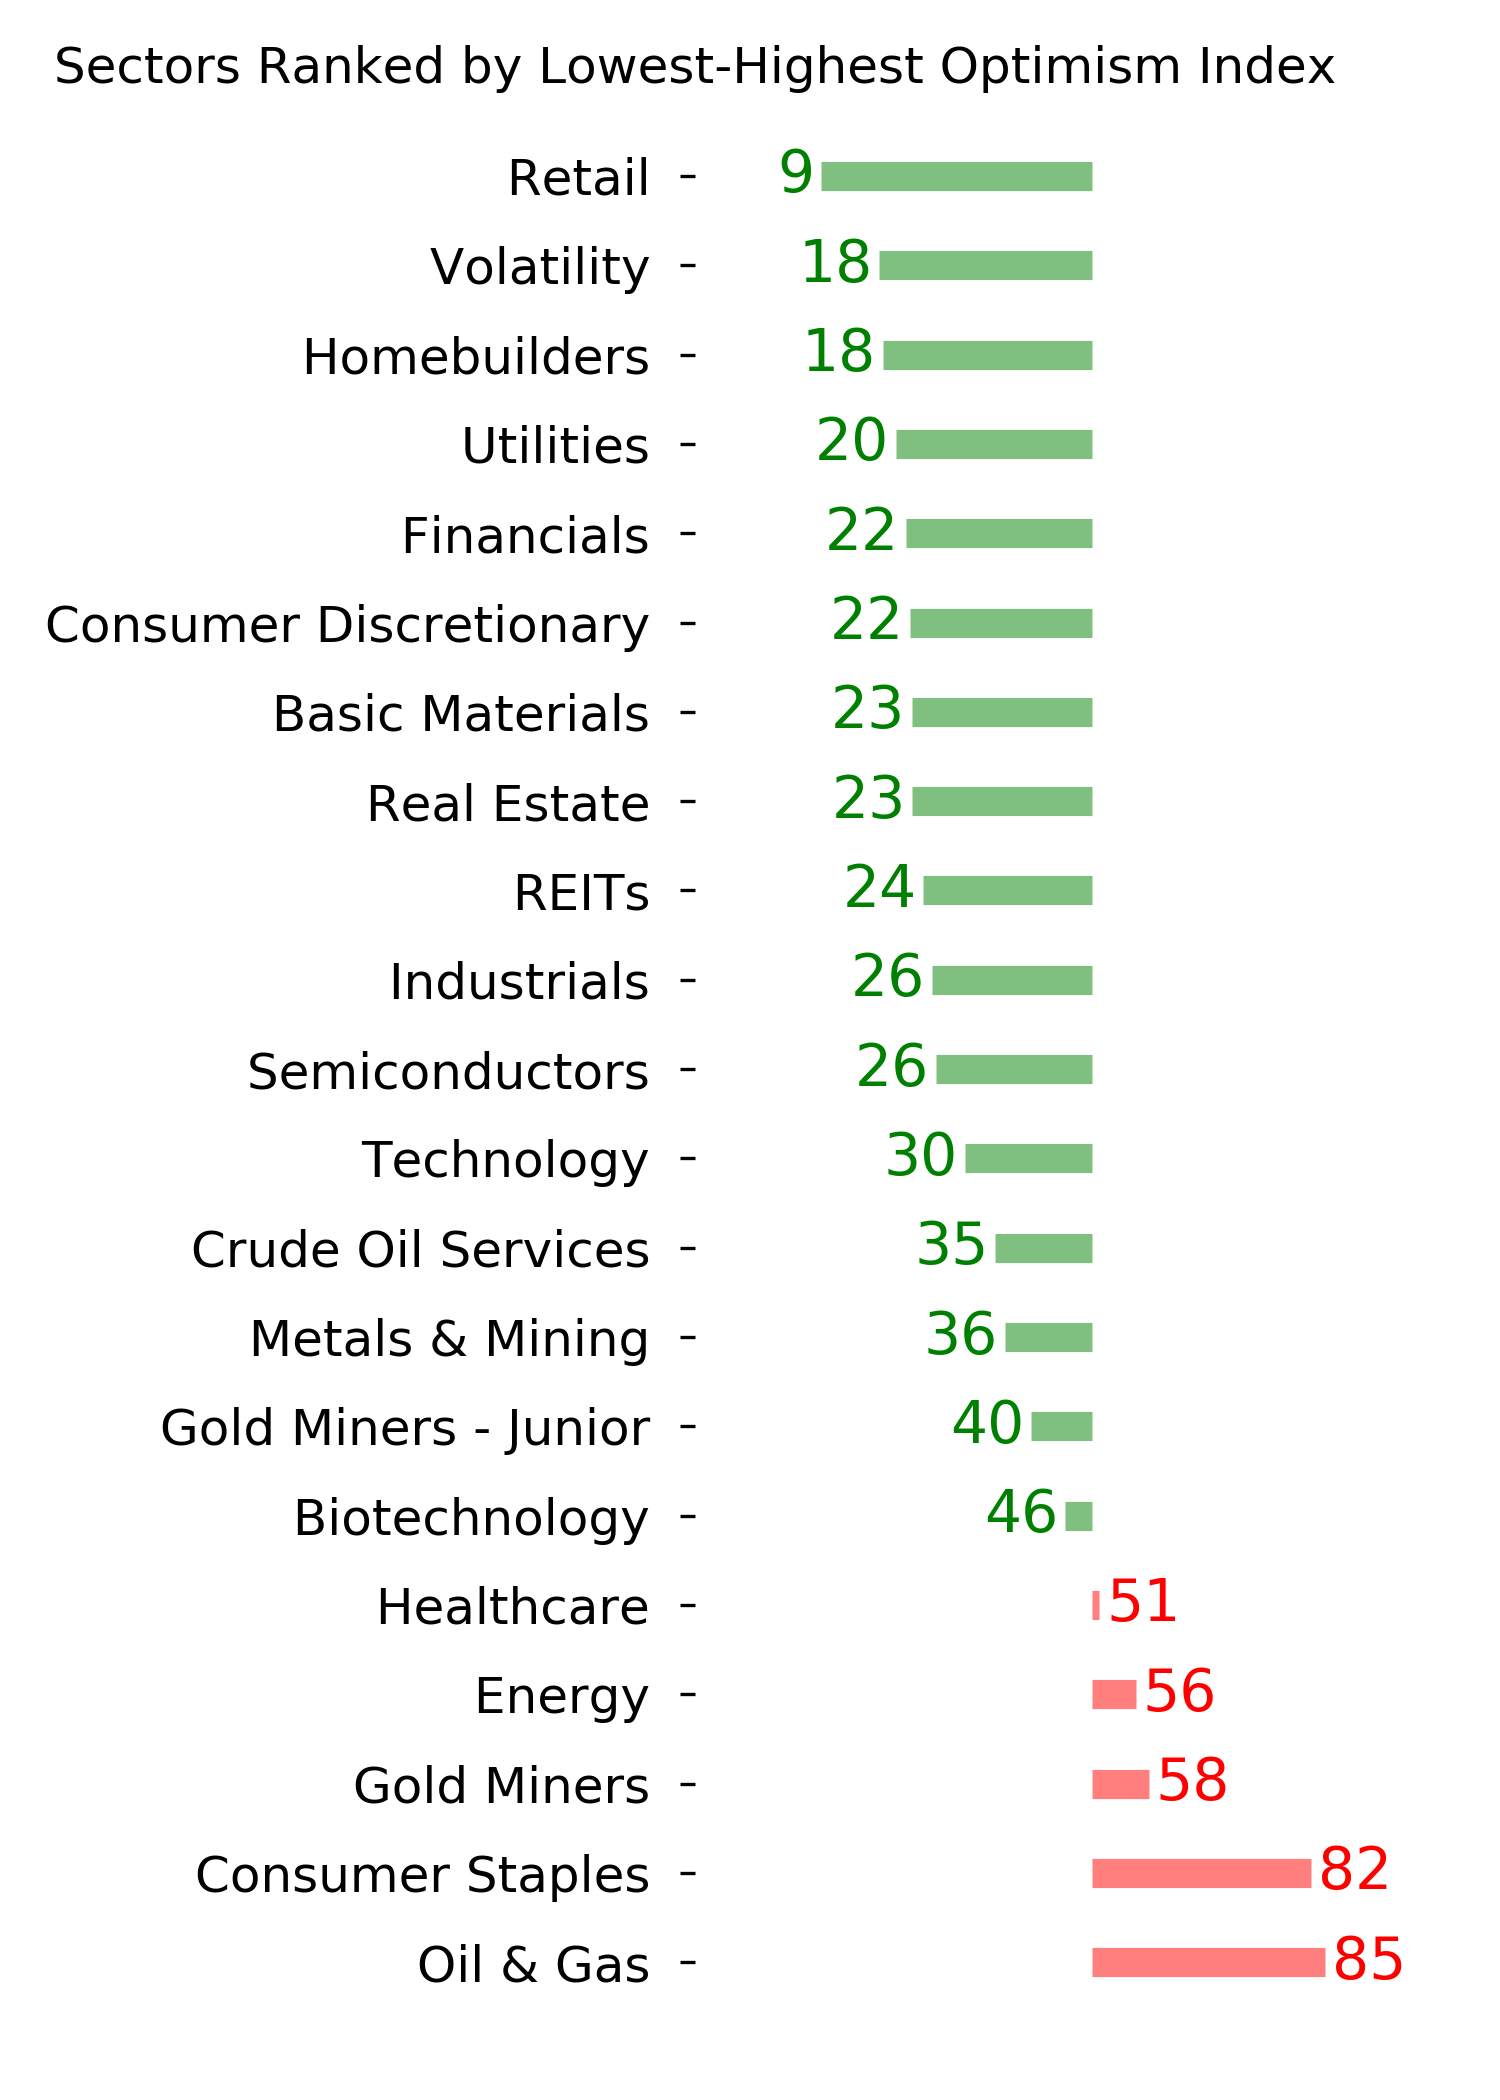
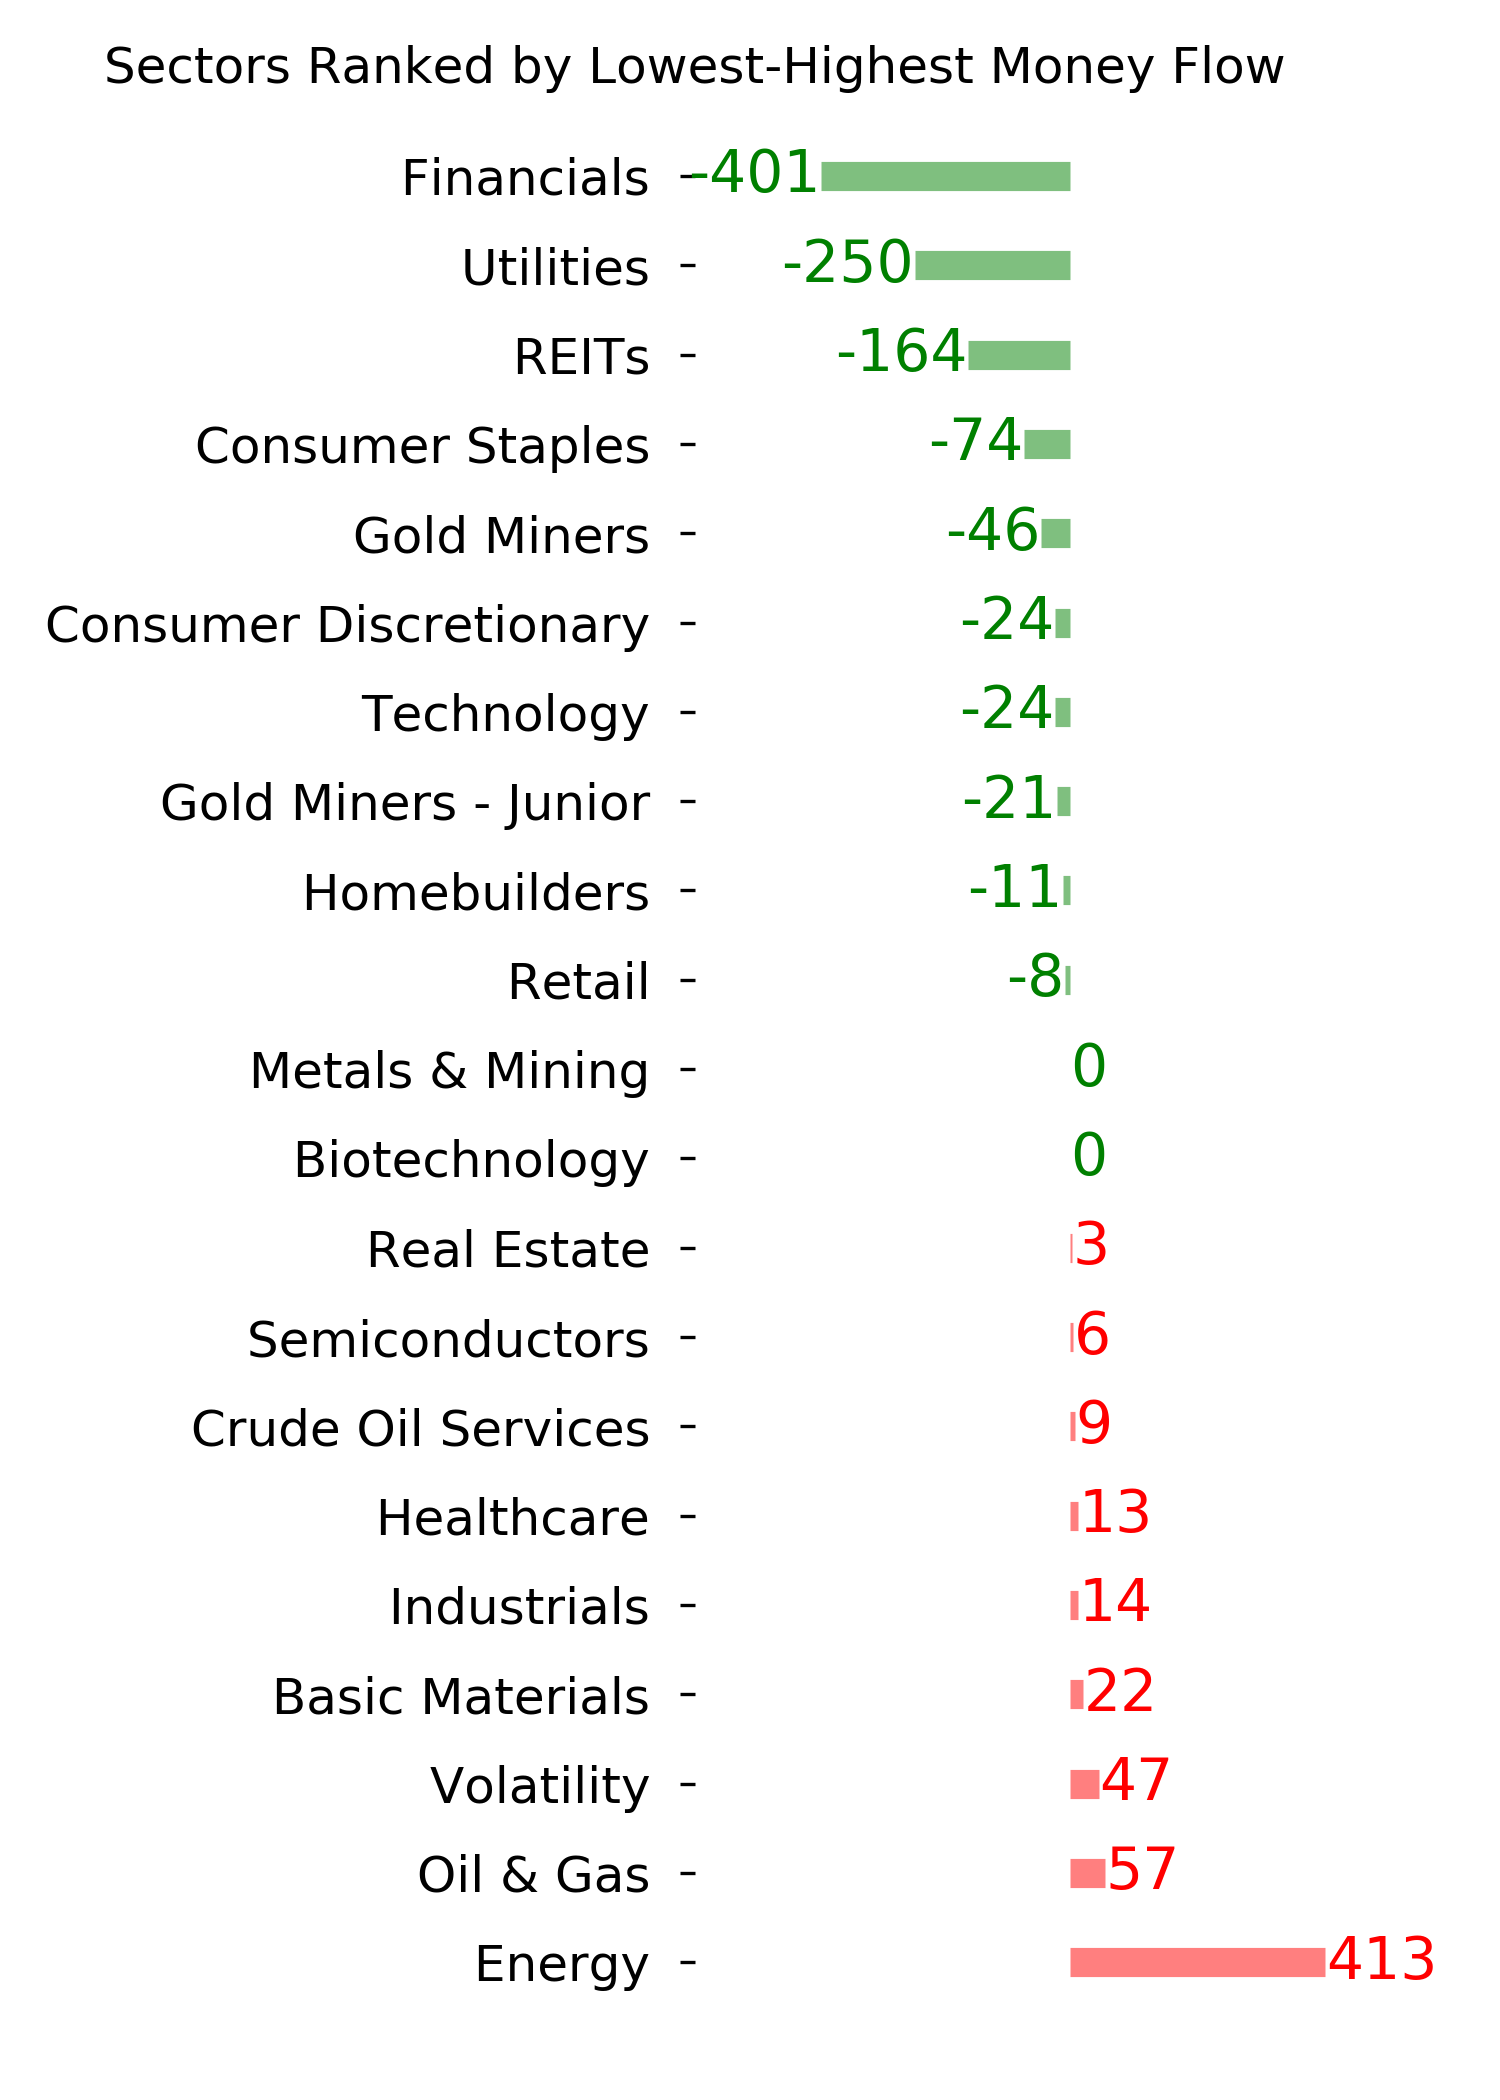
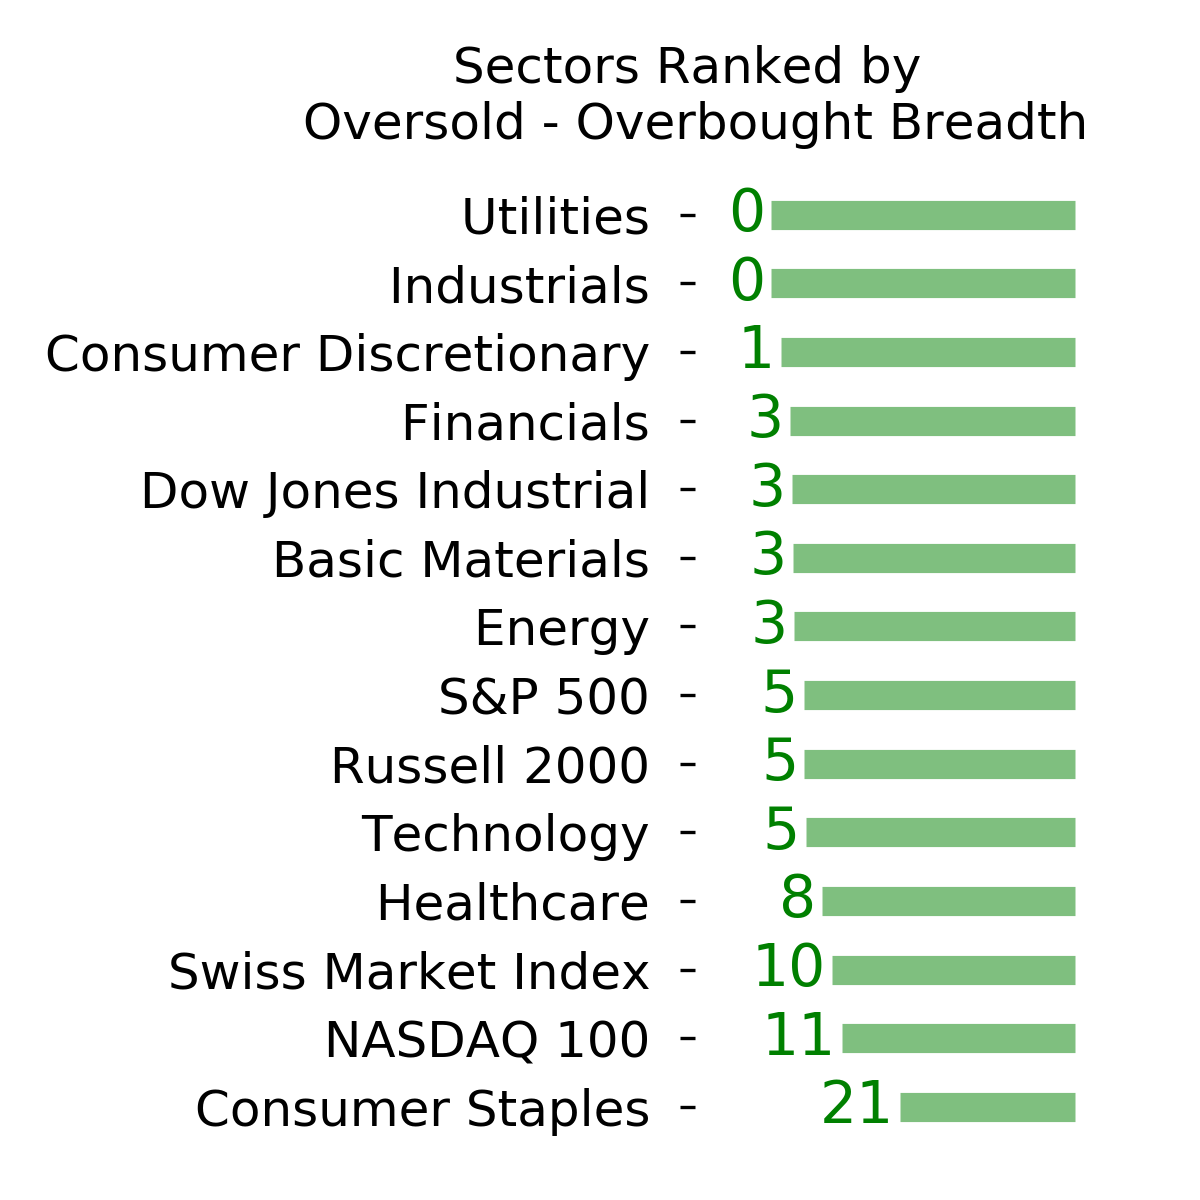
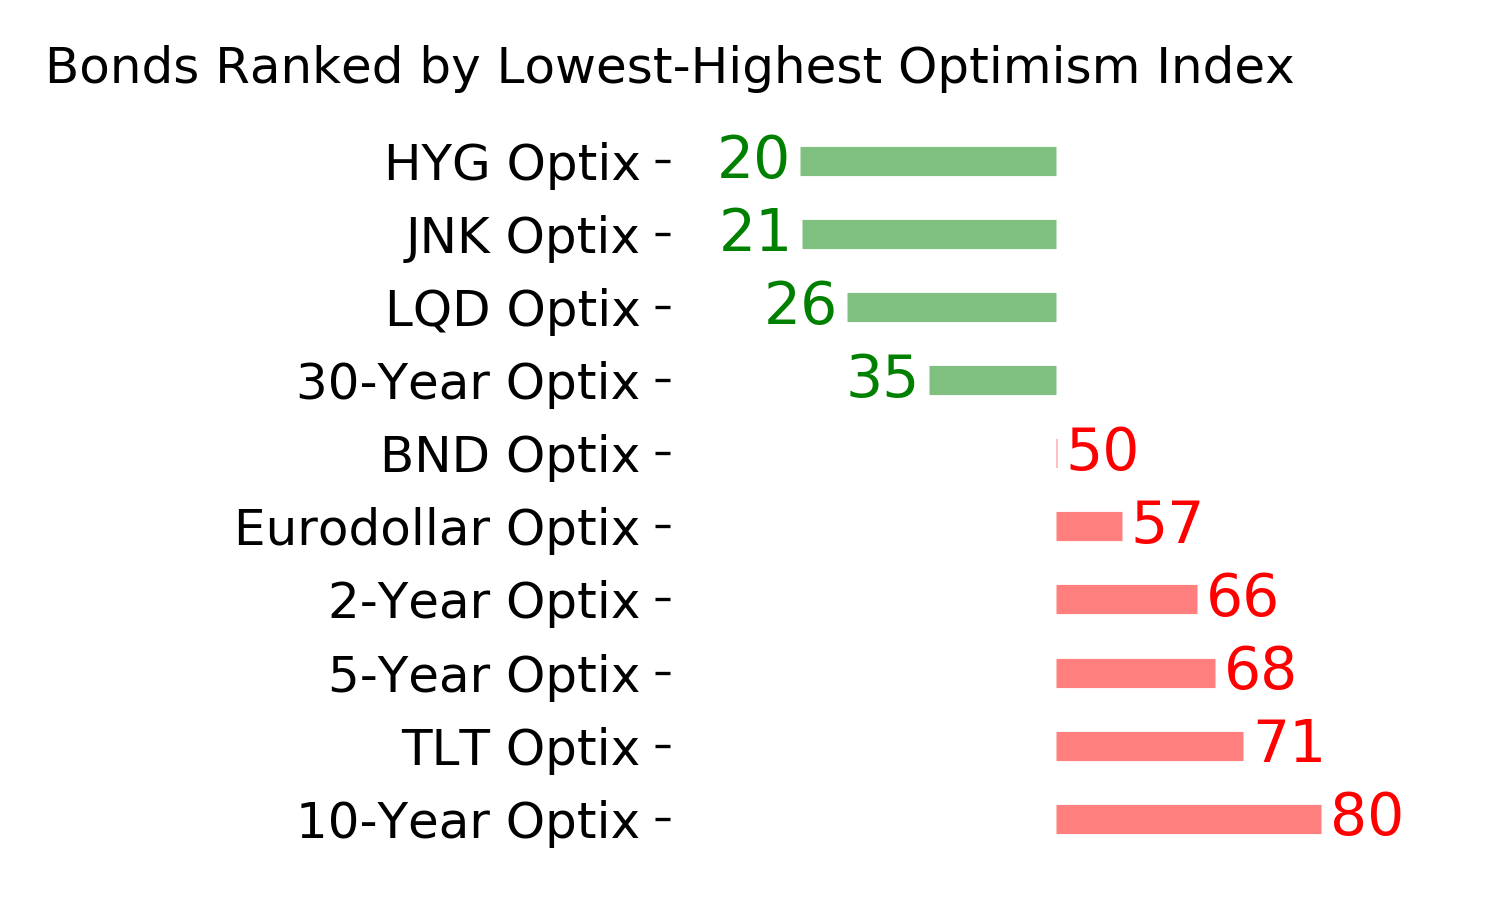
Ranks
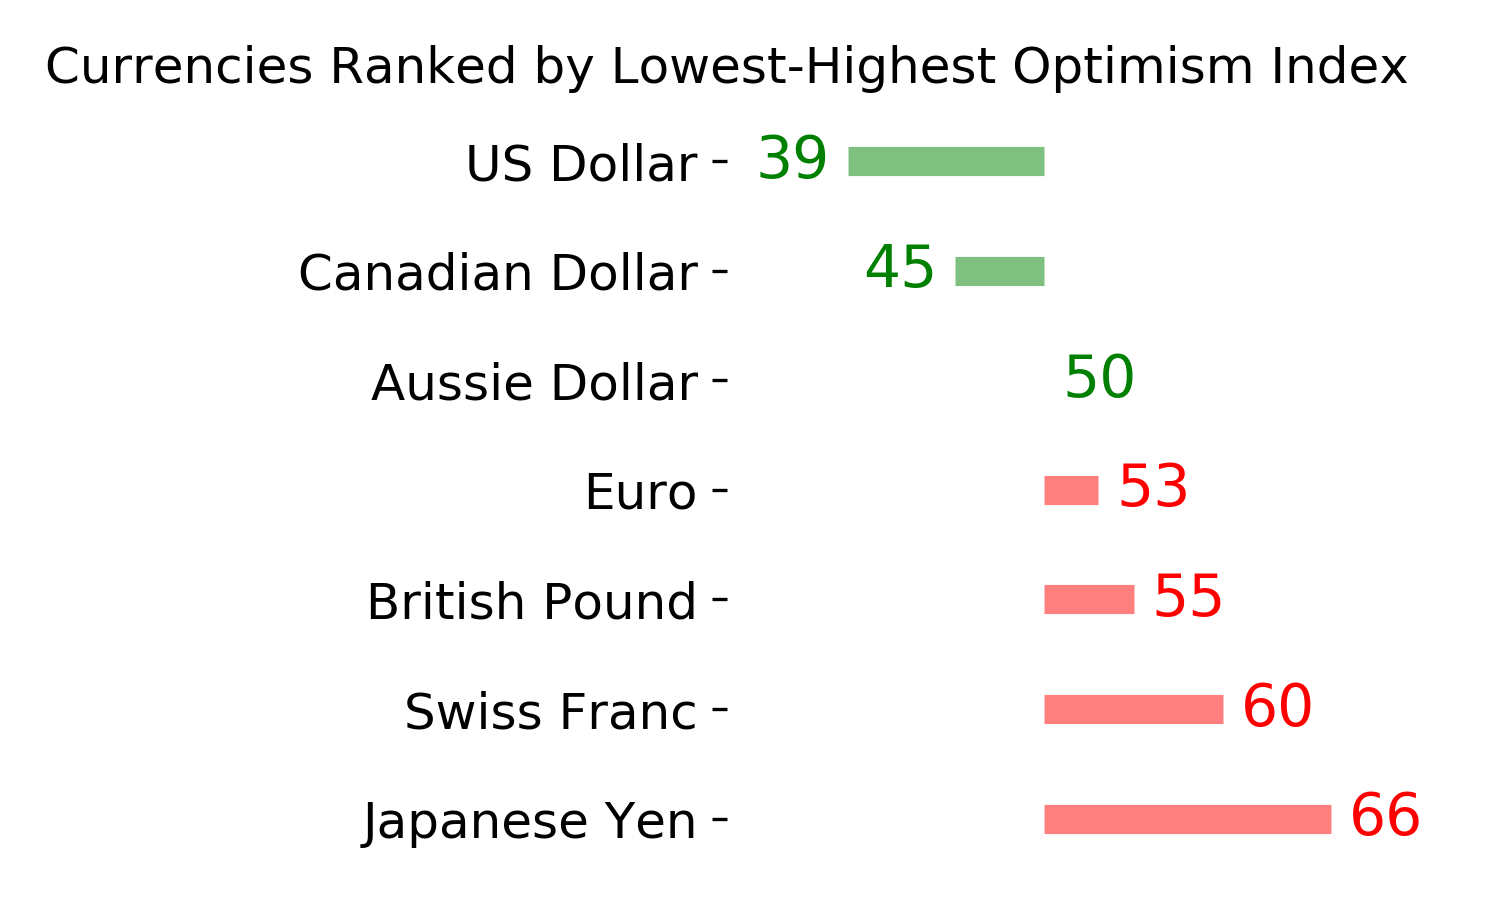
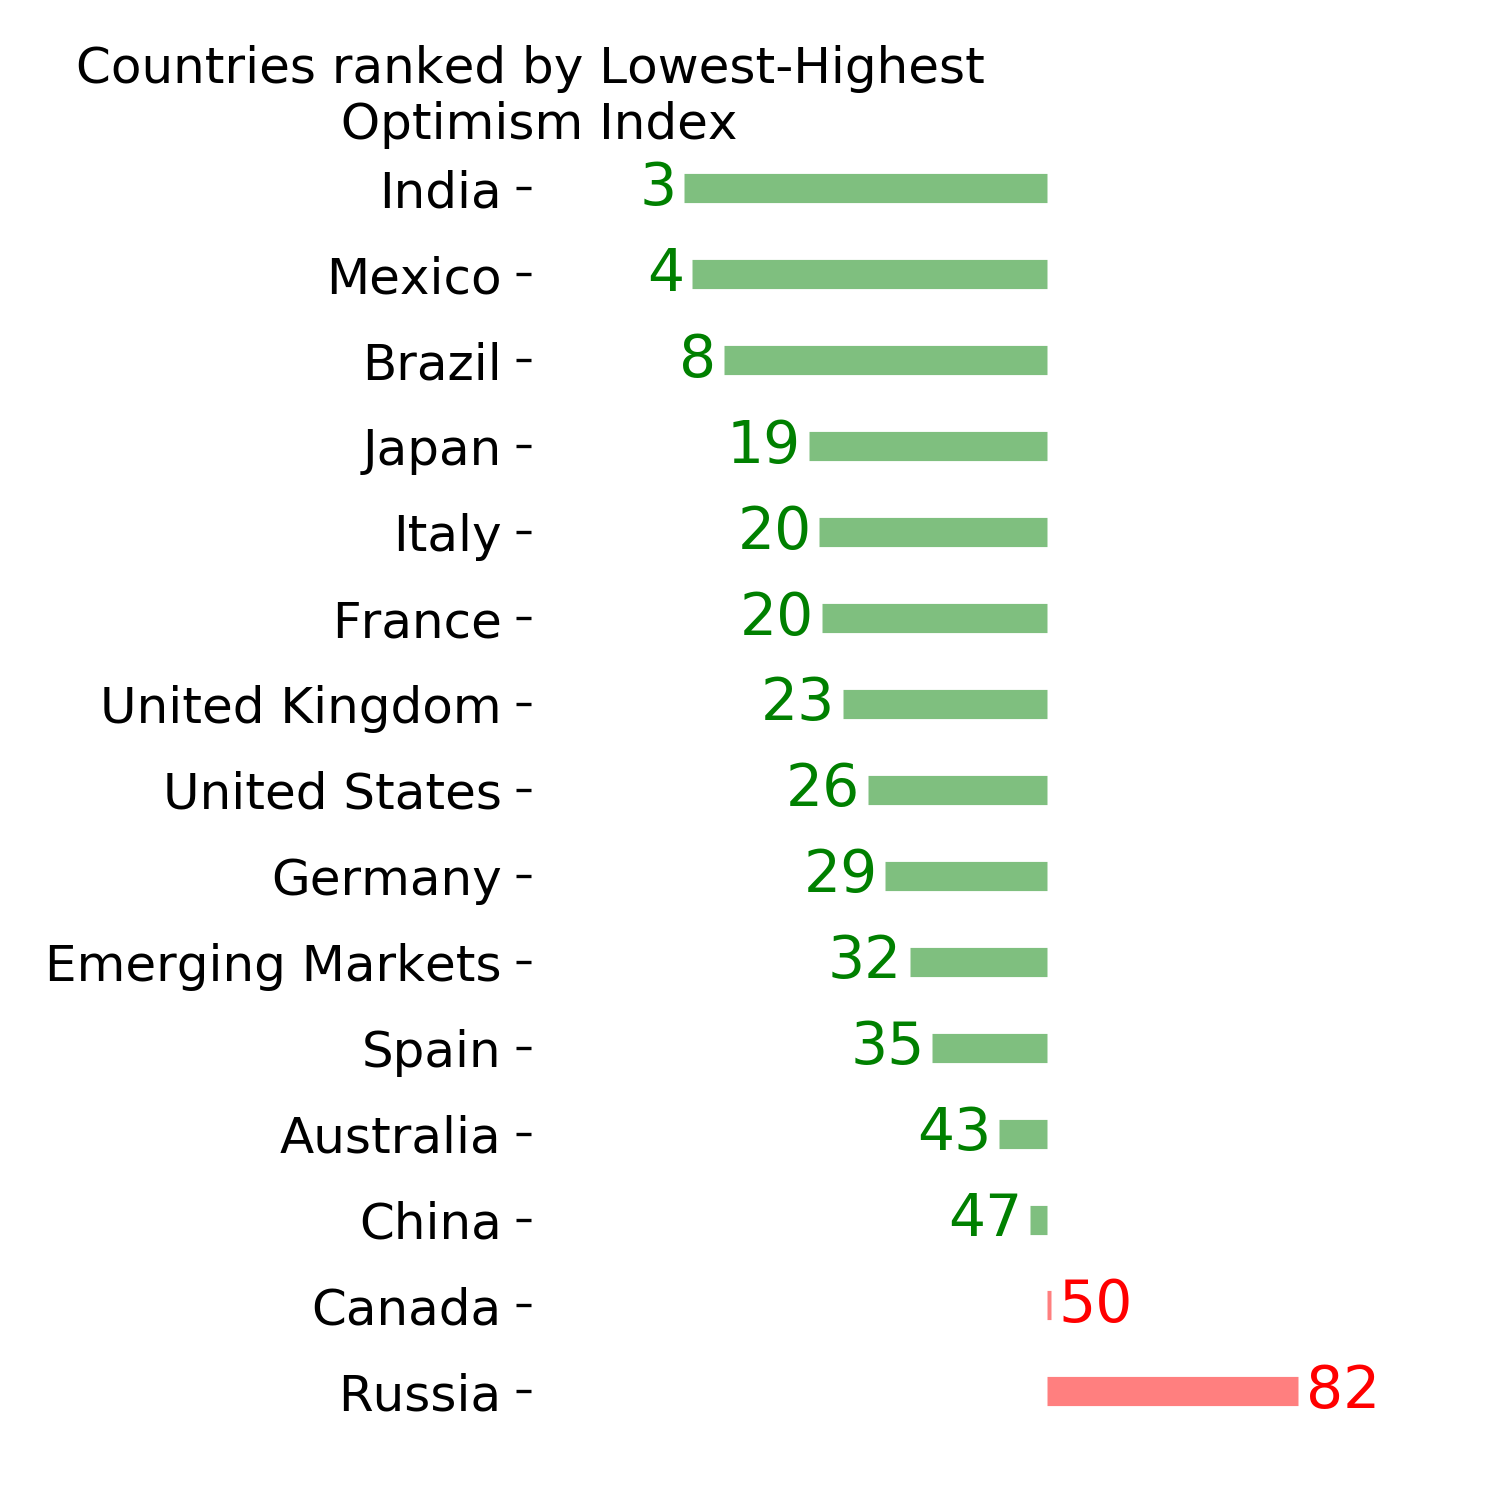
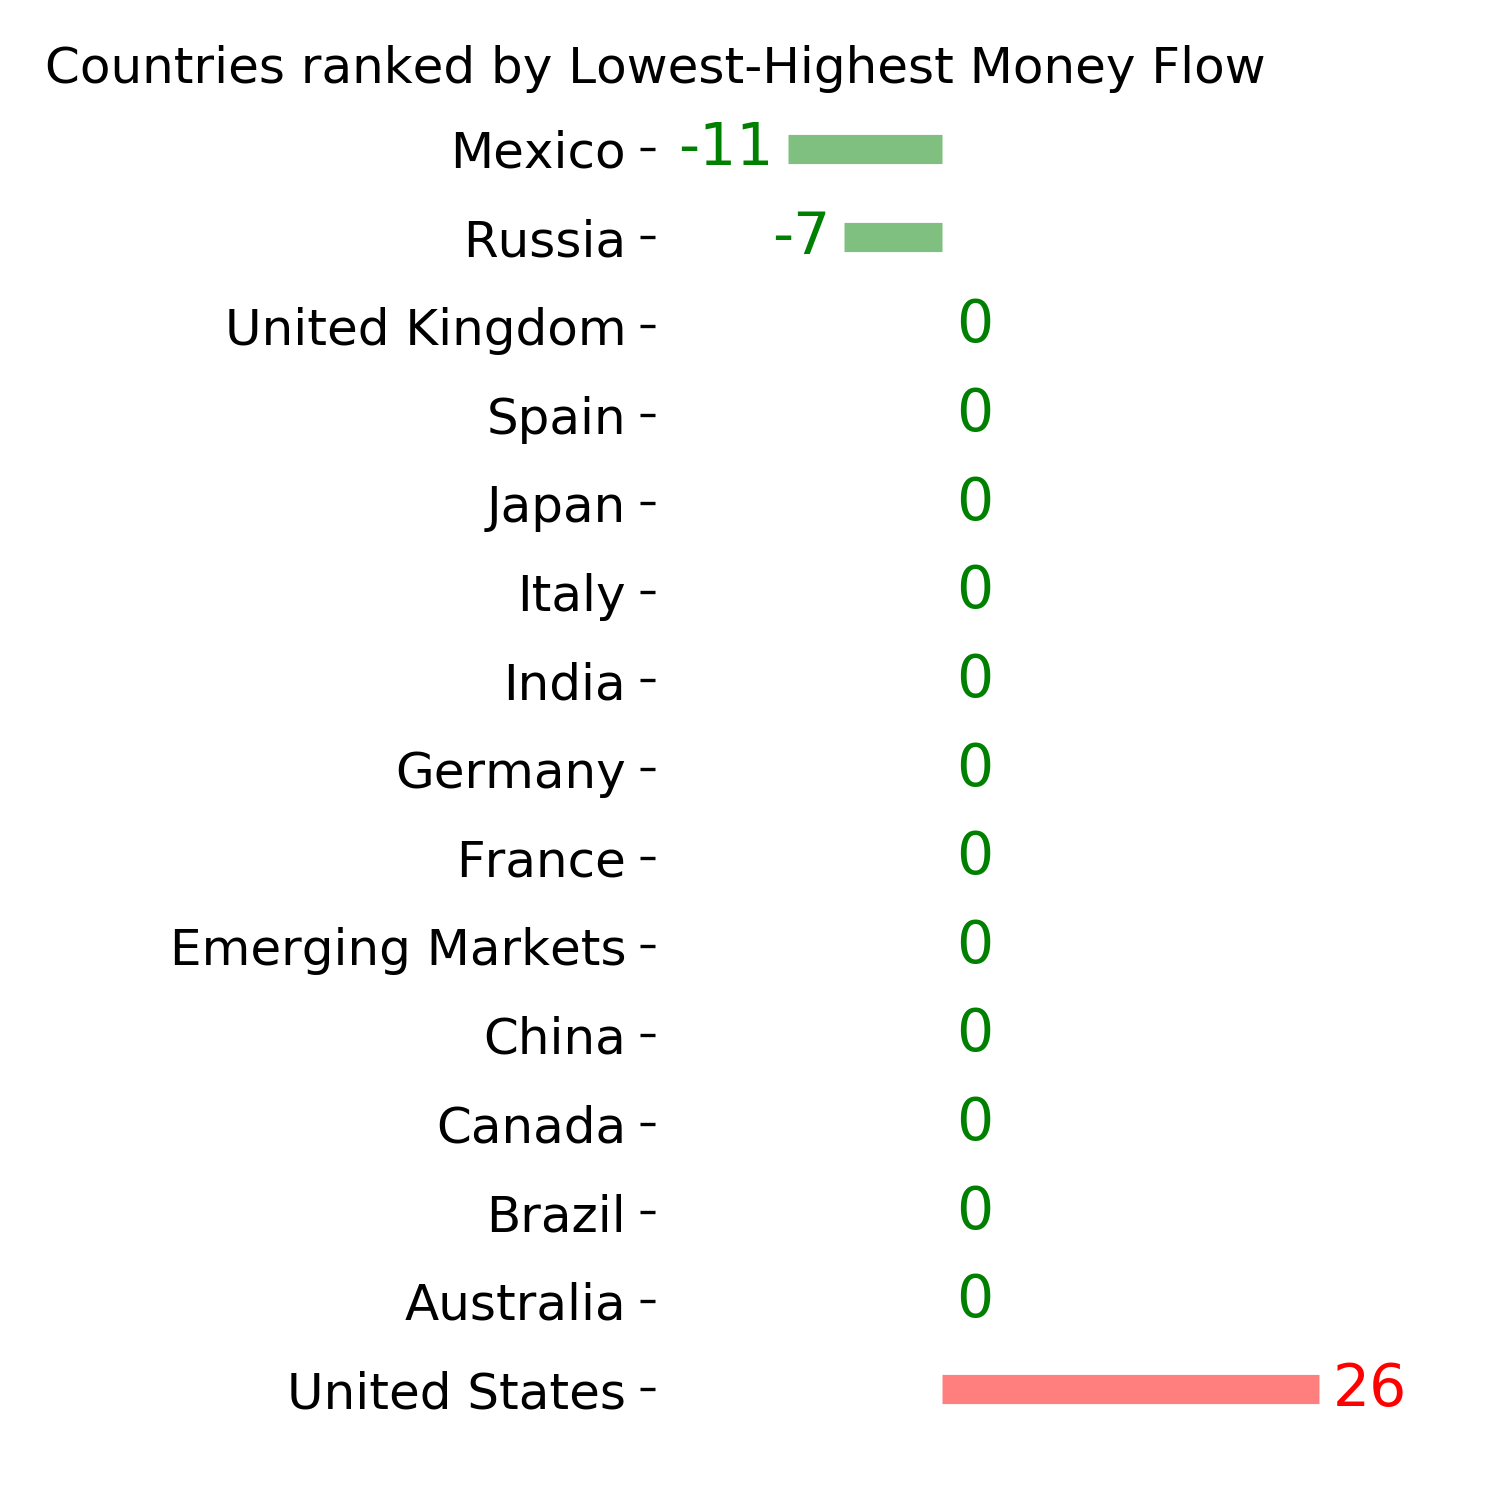
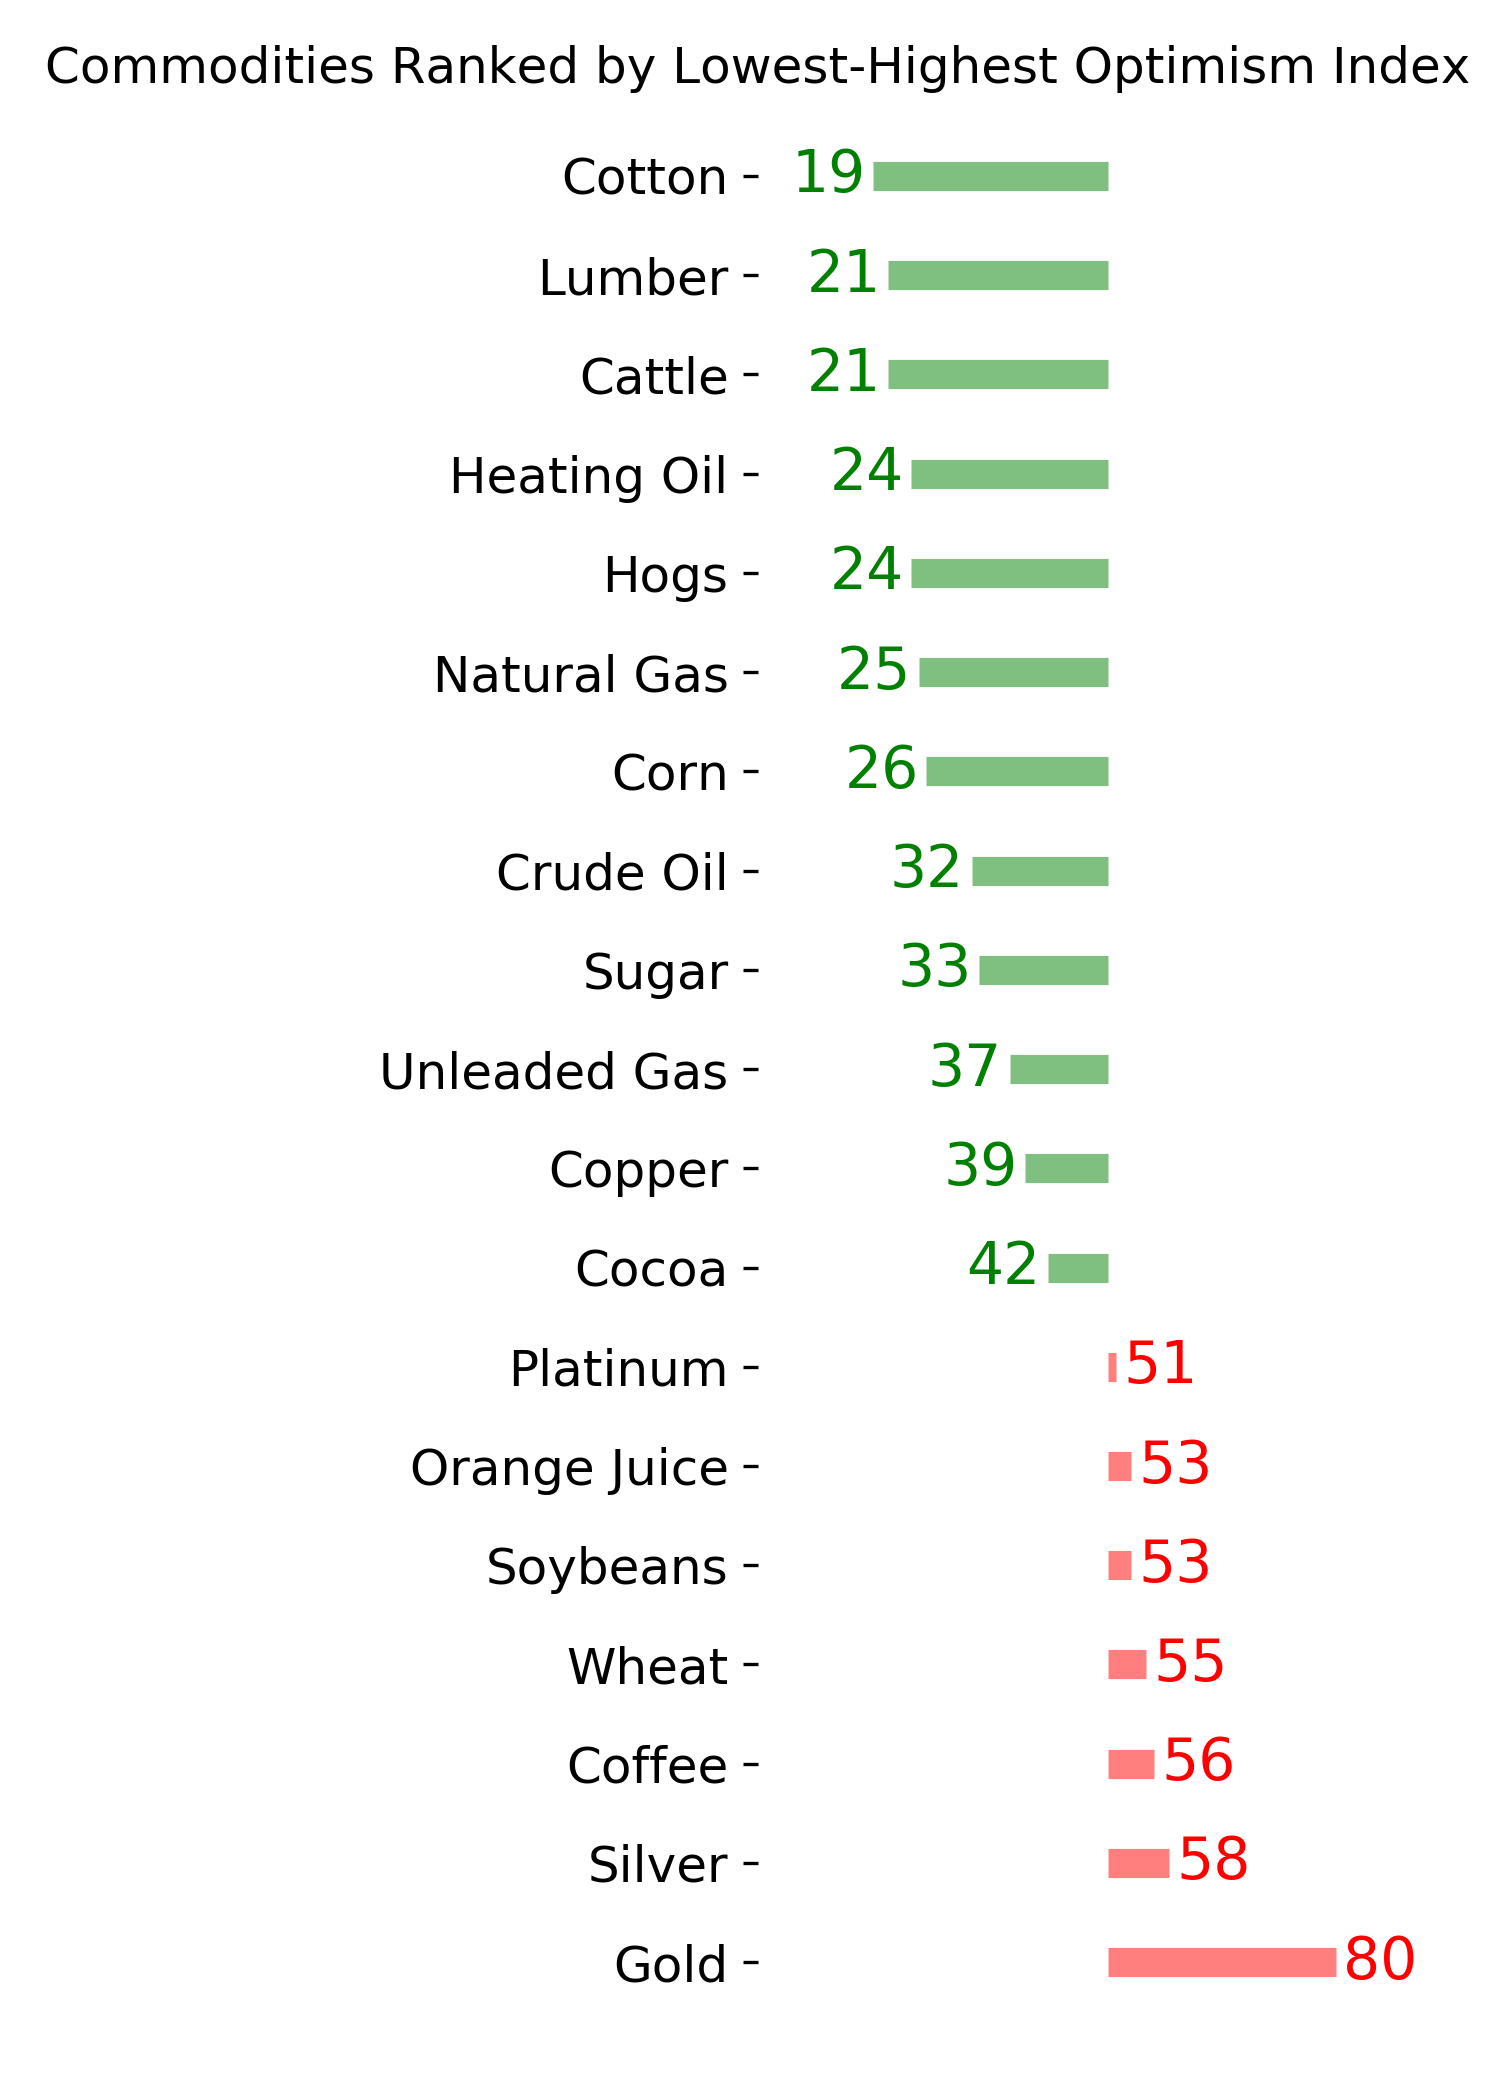
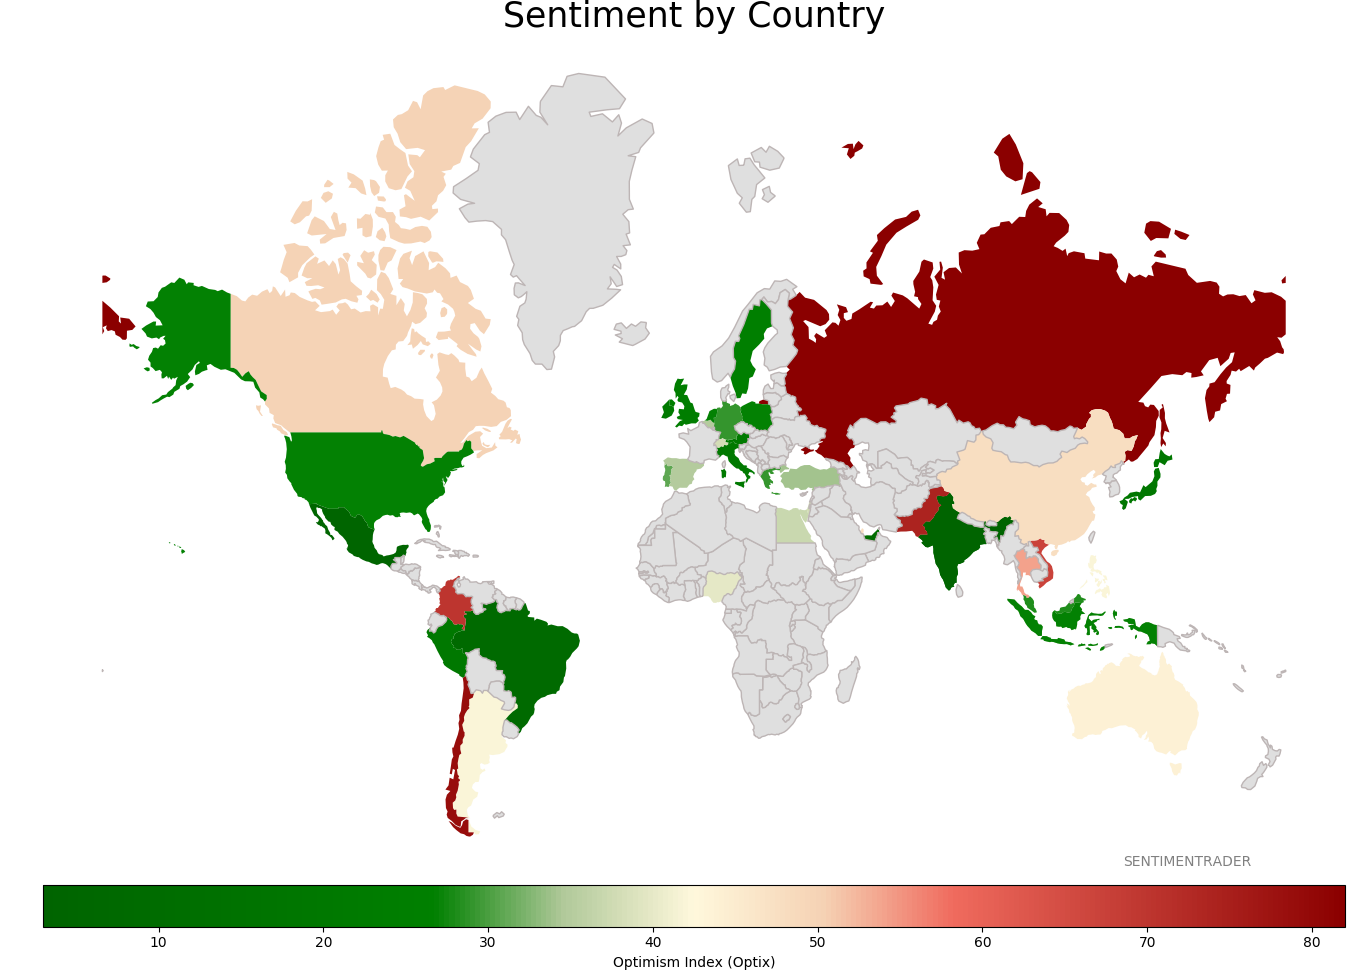
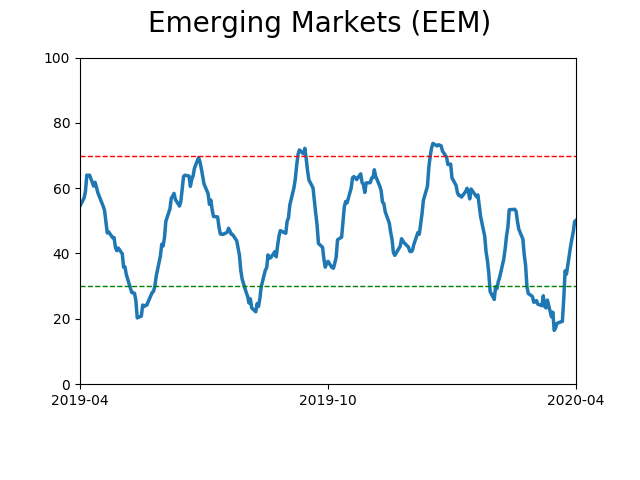
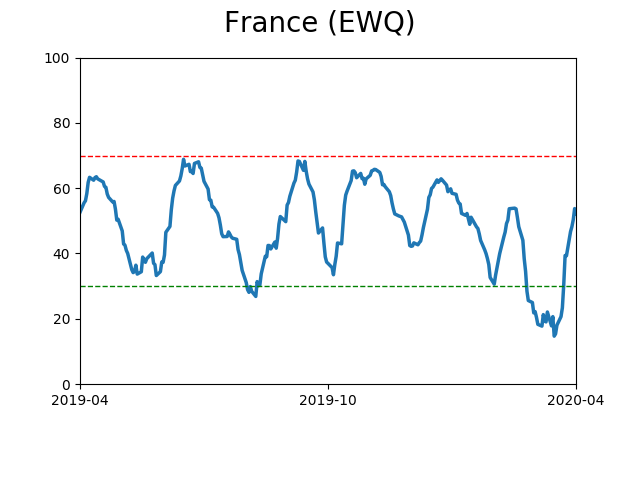
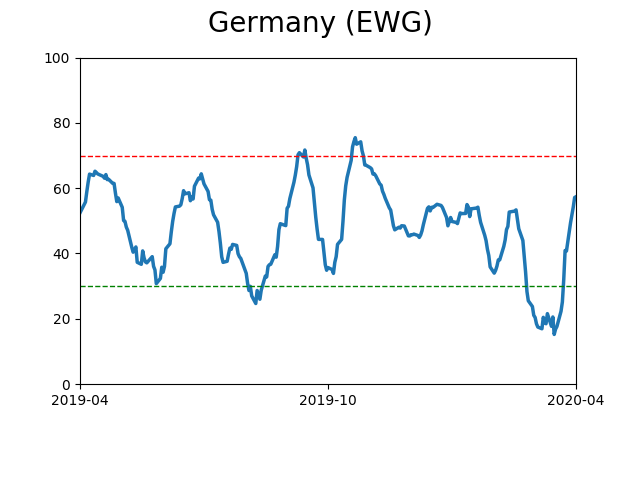
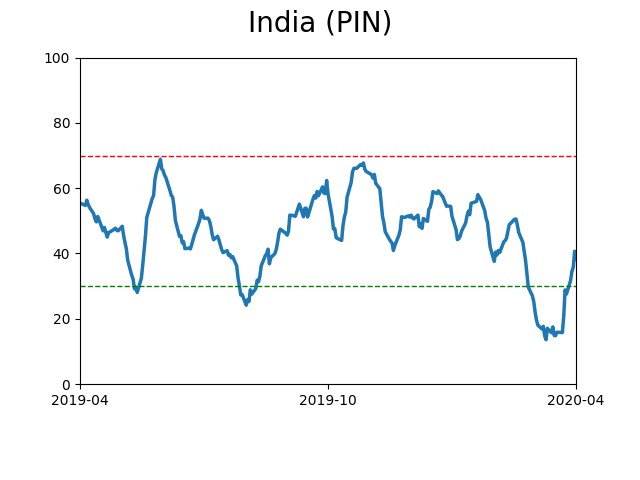
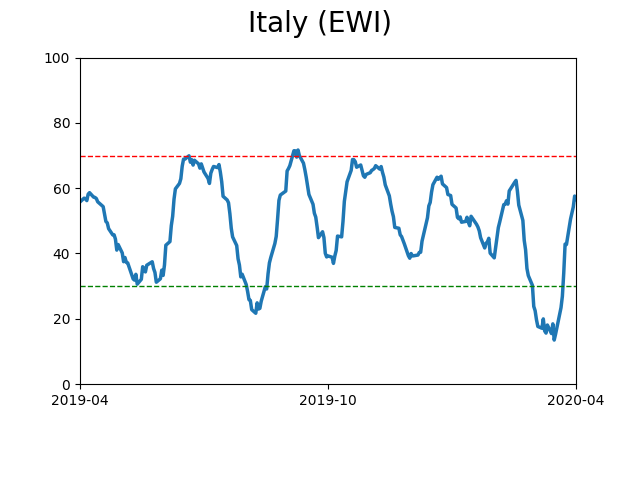
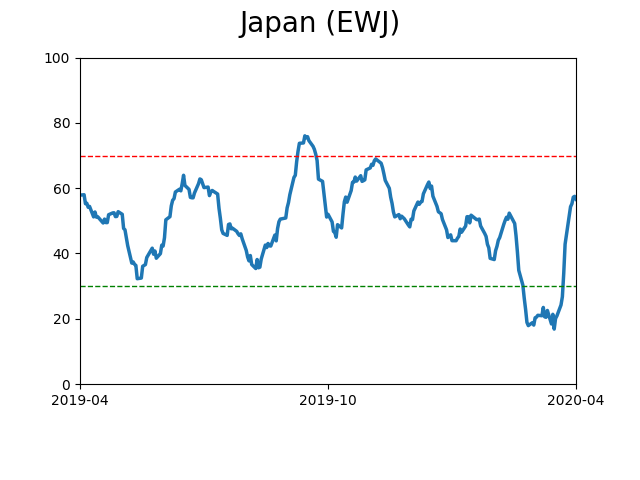
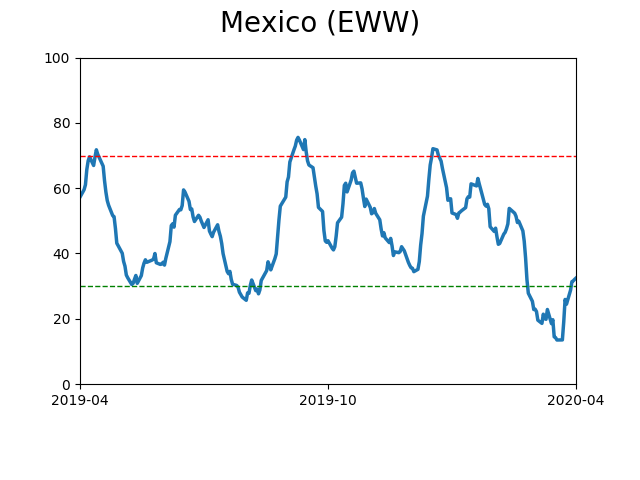
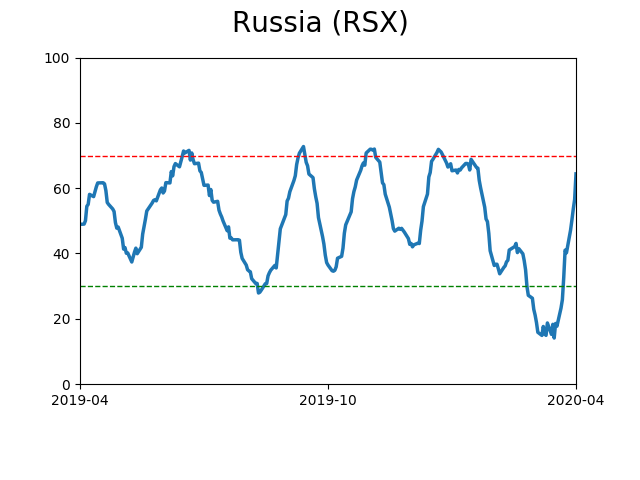
Sentiment Around The World
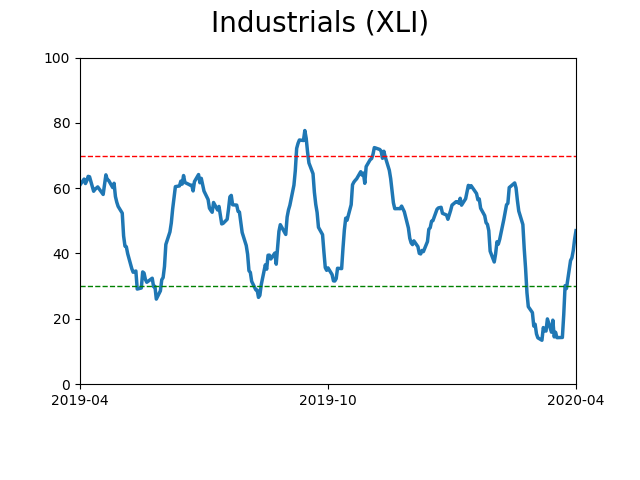
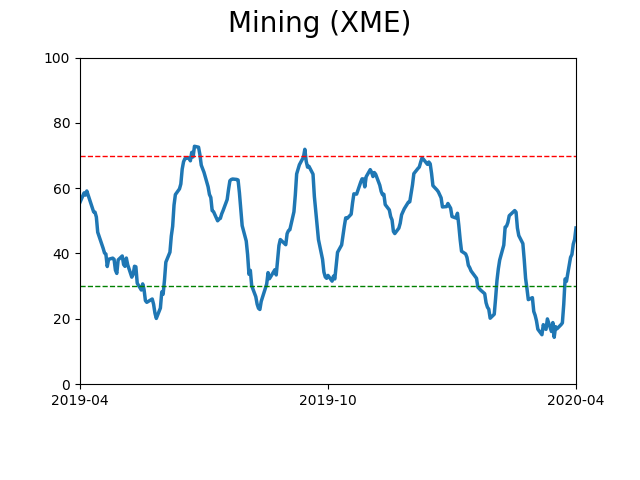
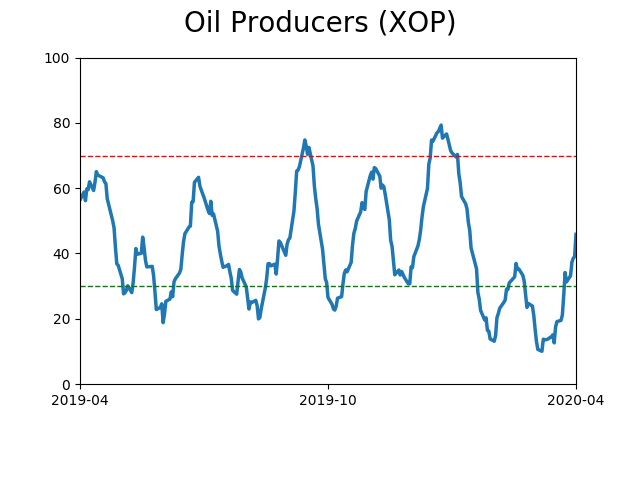
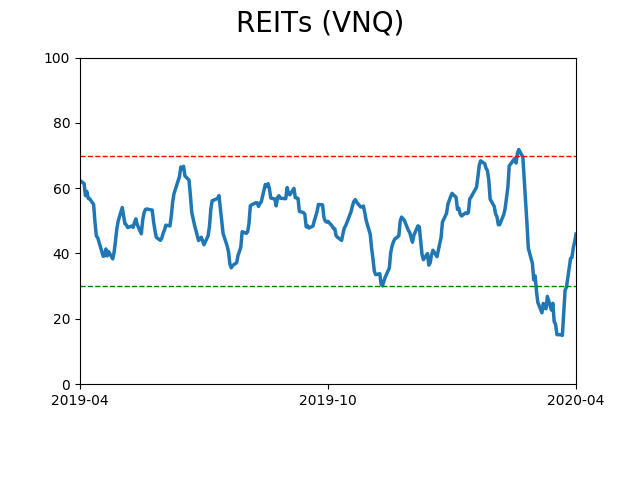
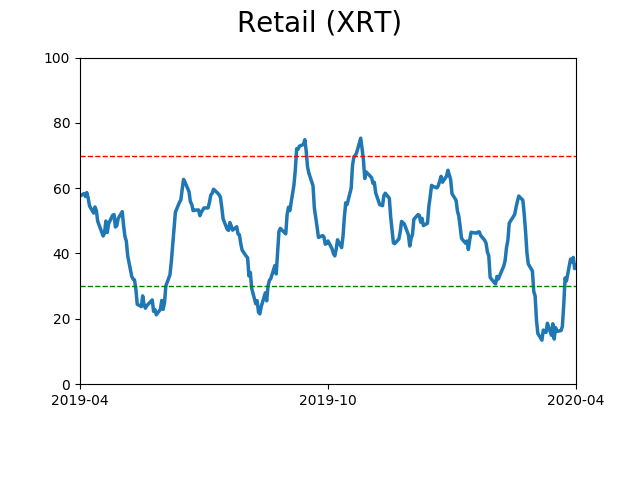
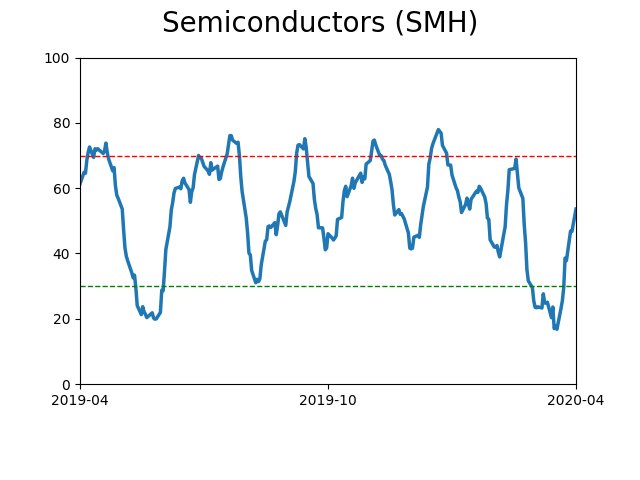
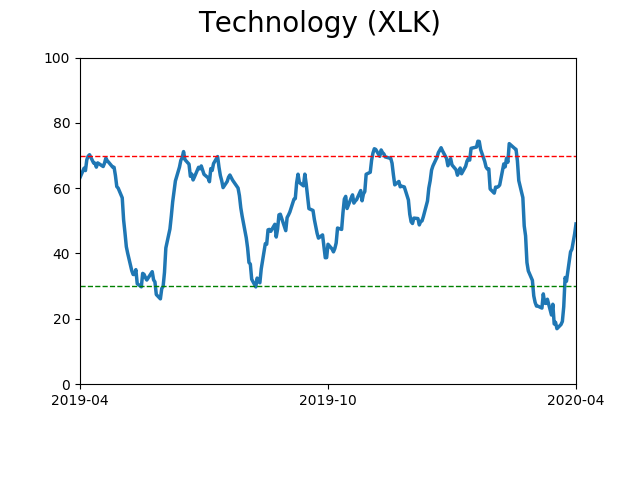
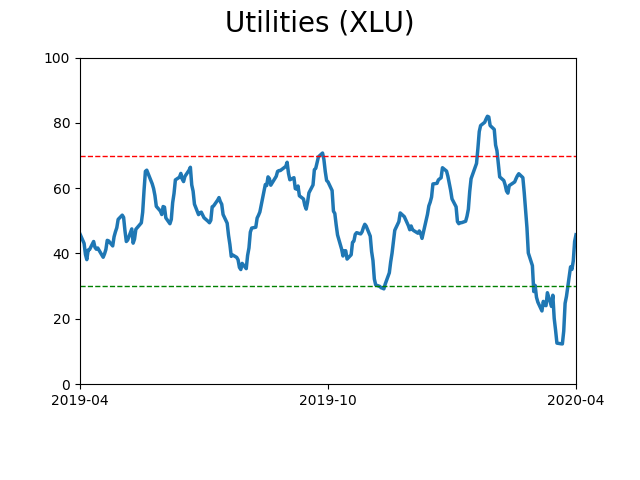
Optimism Index Thumbnails
|
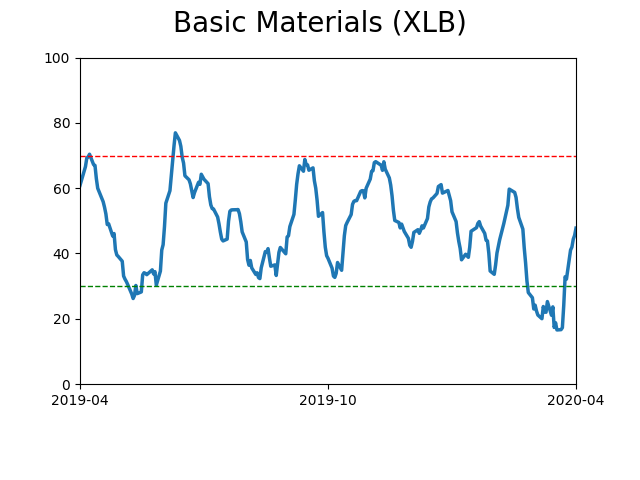
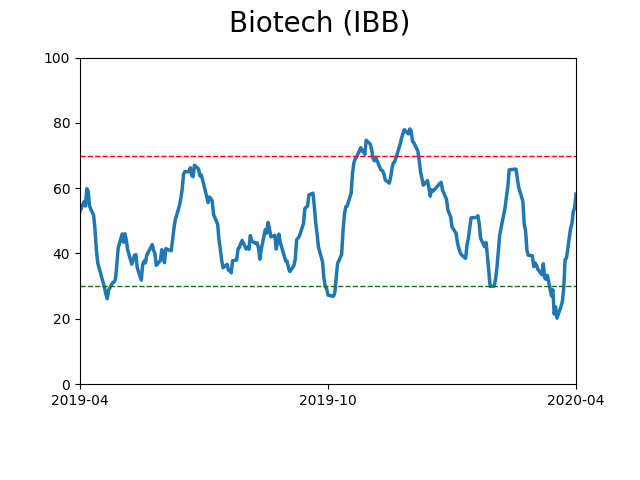
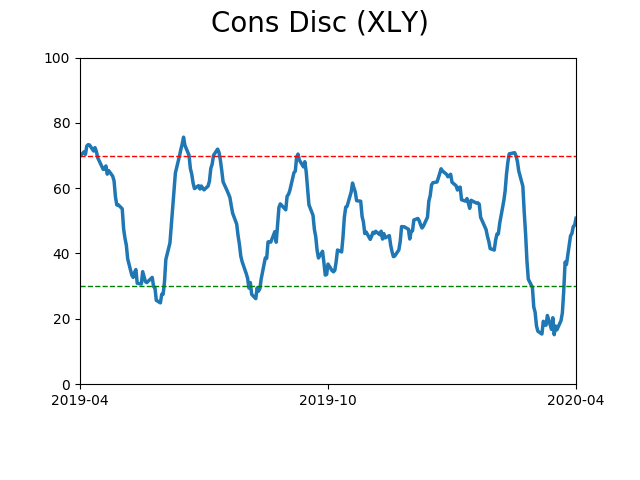
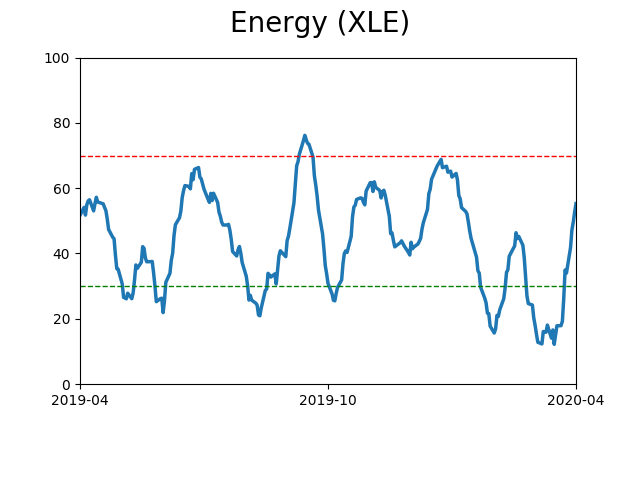
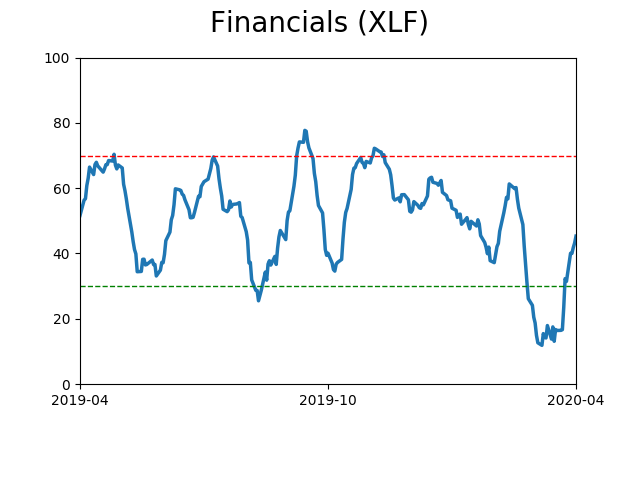
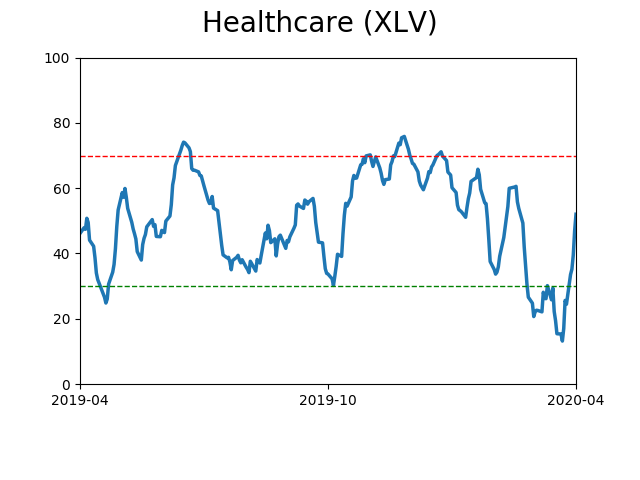
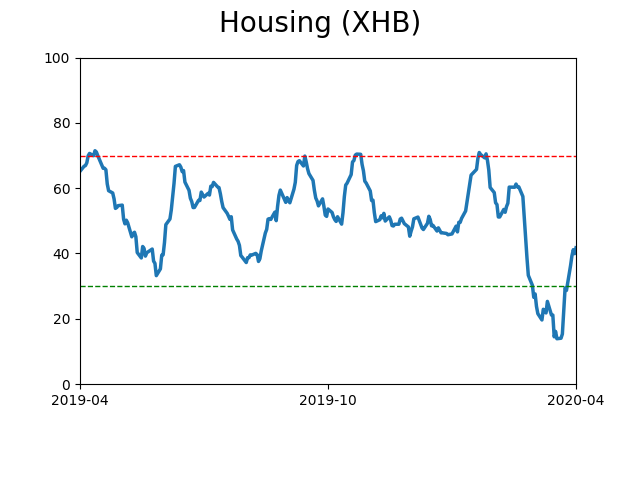
Sector ETF's - 10-Day Moving Average
|
|
|
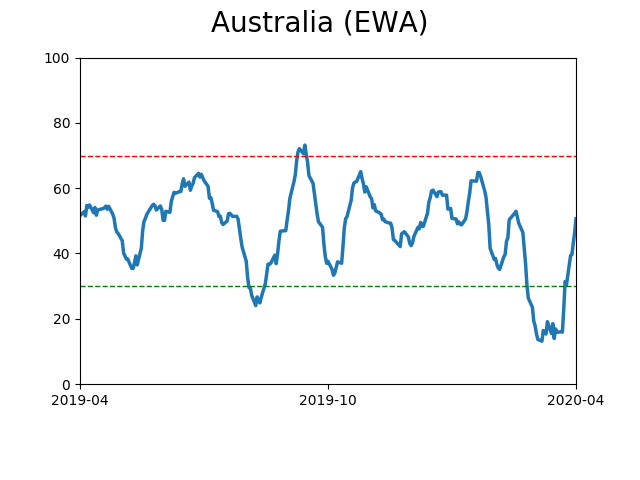
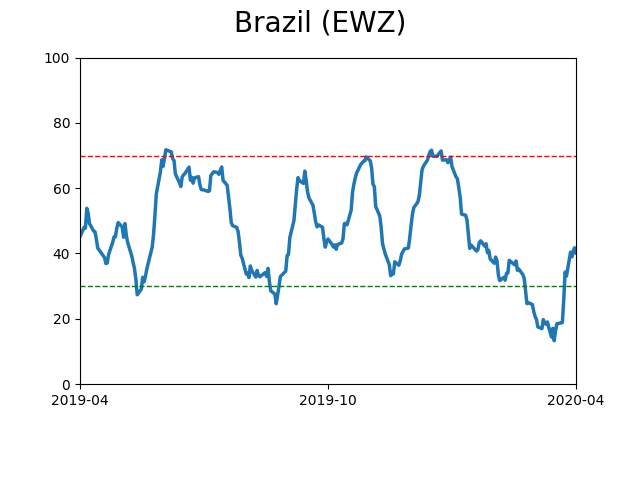
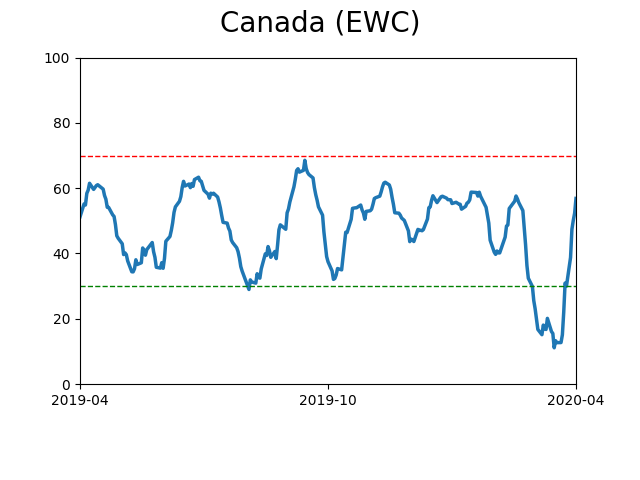
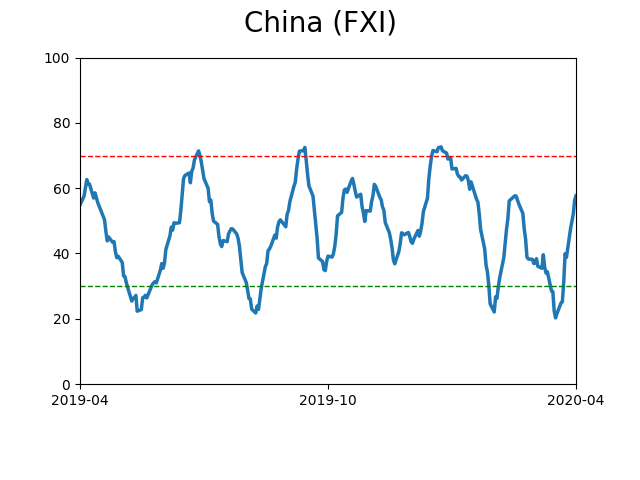
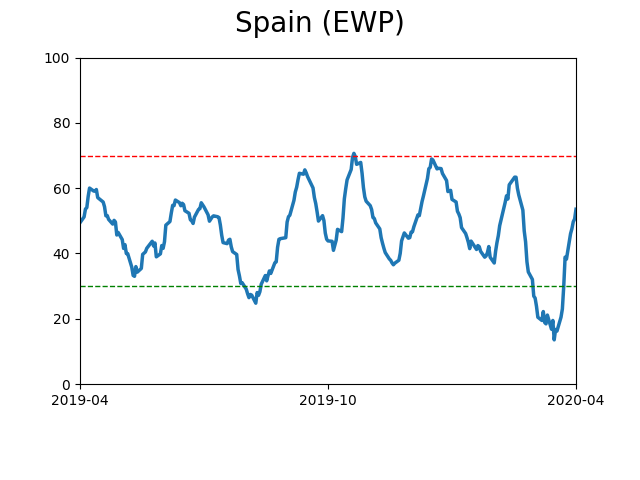
Country ETF's - 10-Day Moving Average
|
|
|
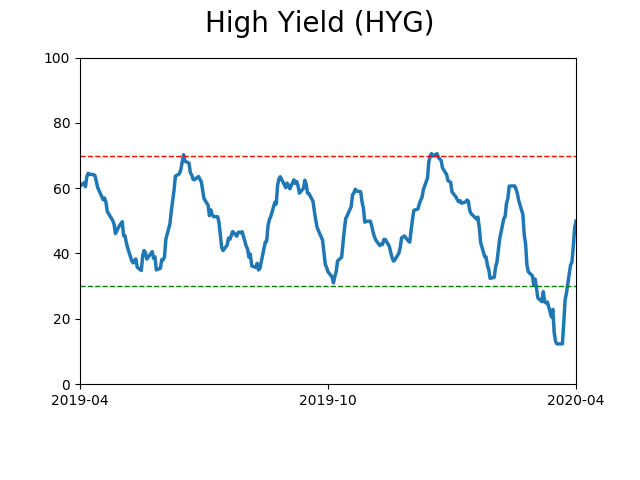
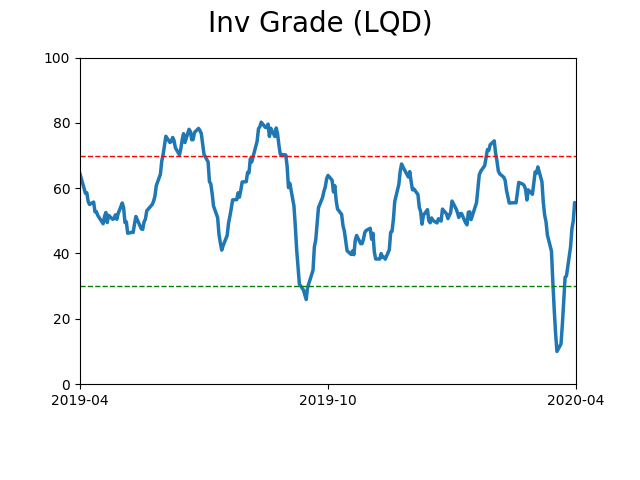
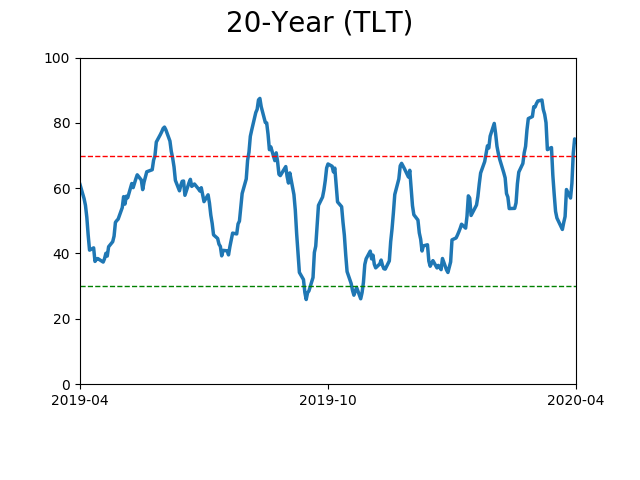
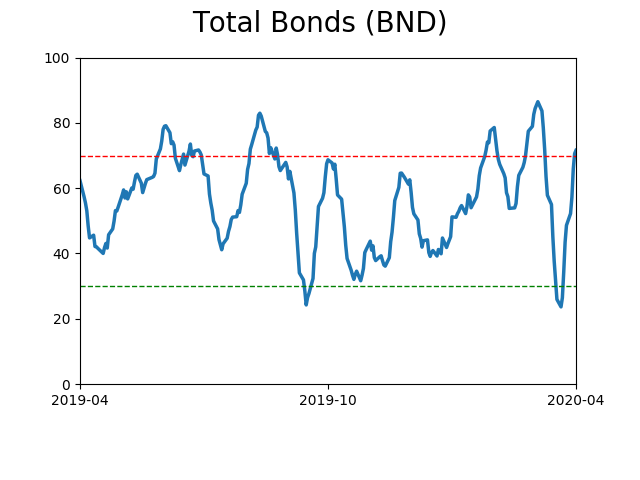
Bond ETF's - 10-Day Moving Average
|
|
|
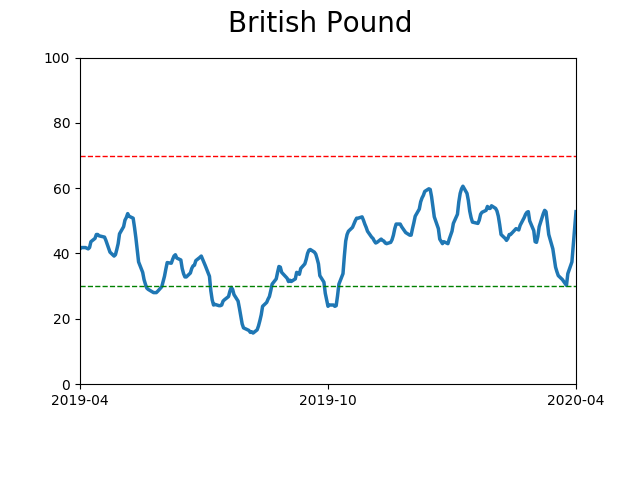
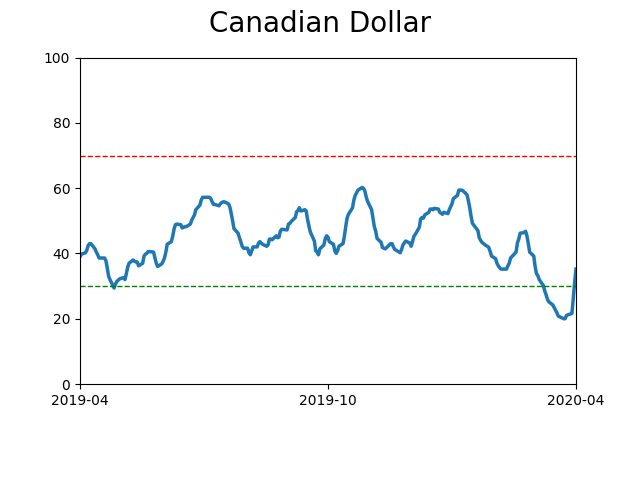
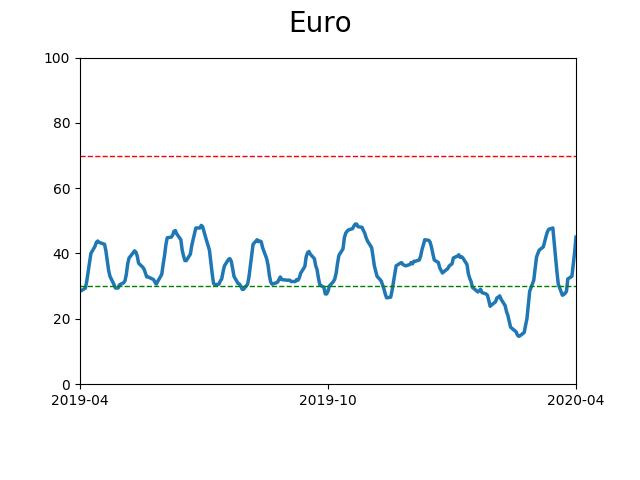
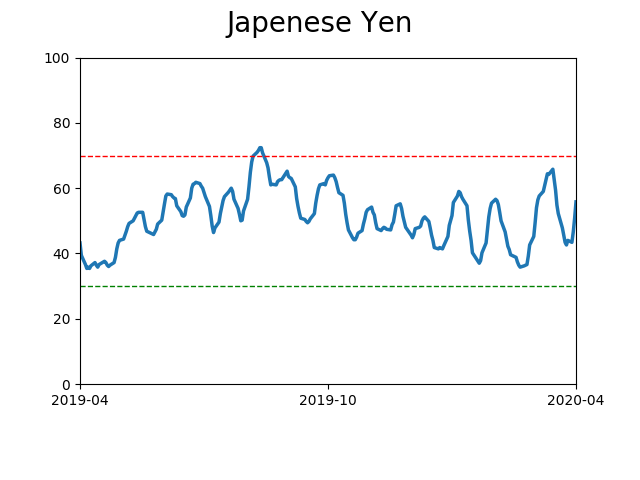
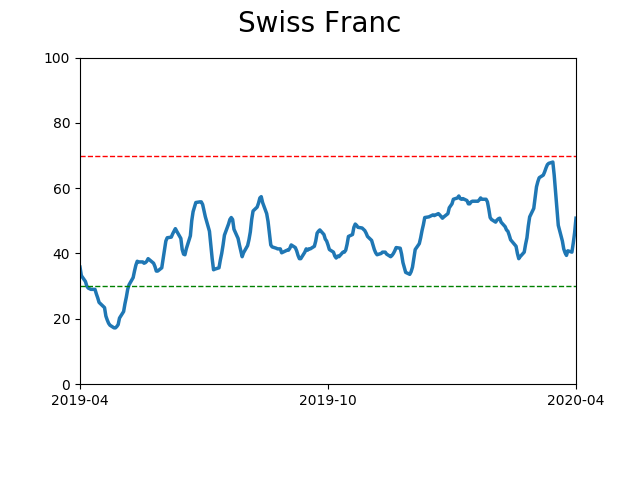
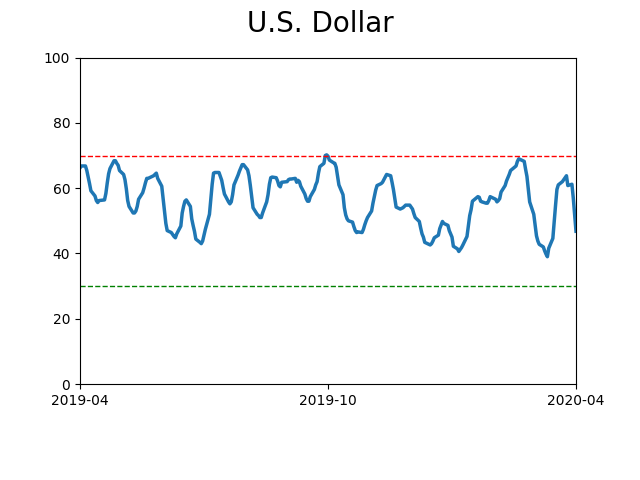
Currency ETF's - 5-Day Moving Average
|
|
|
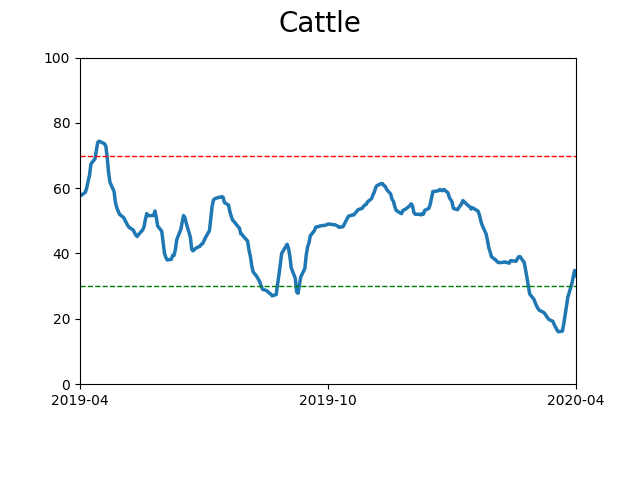
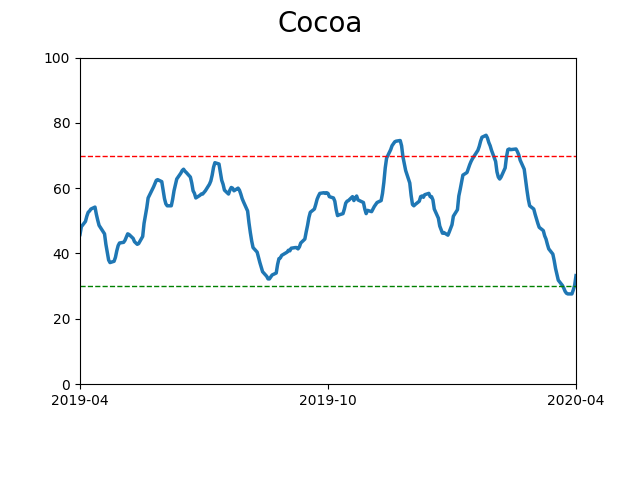
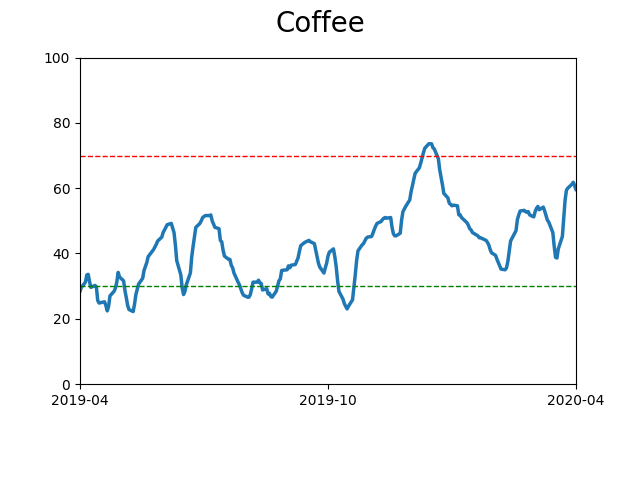
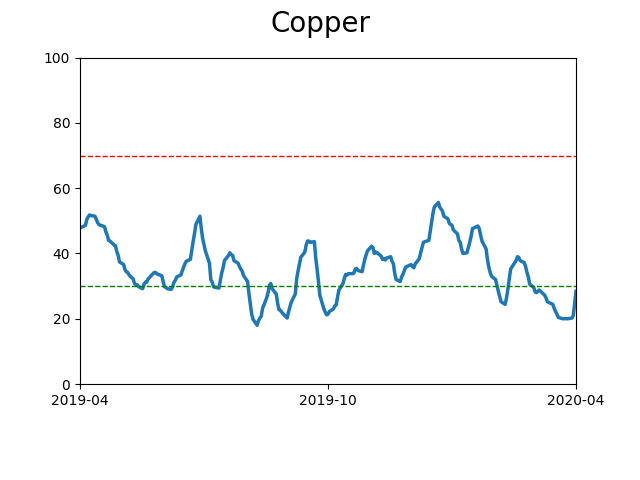
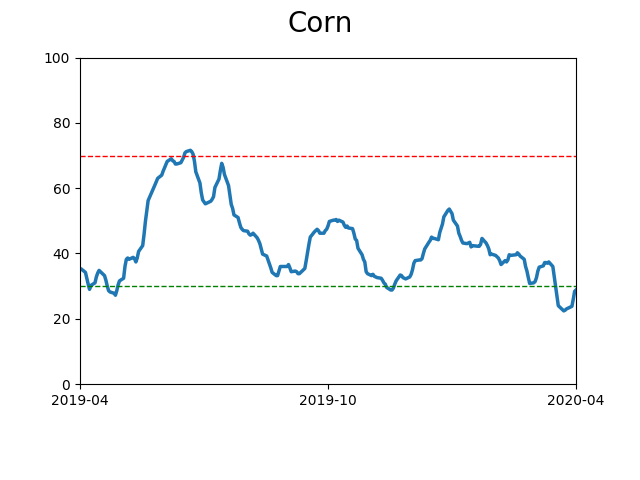
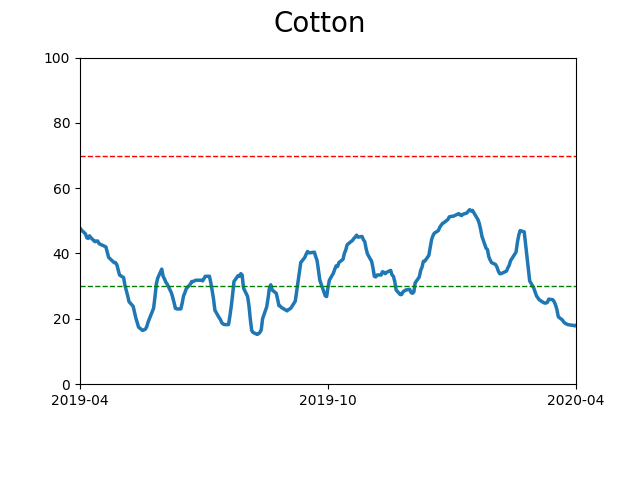
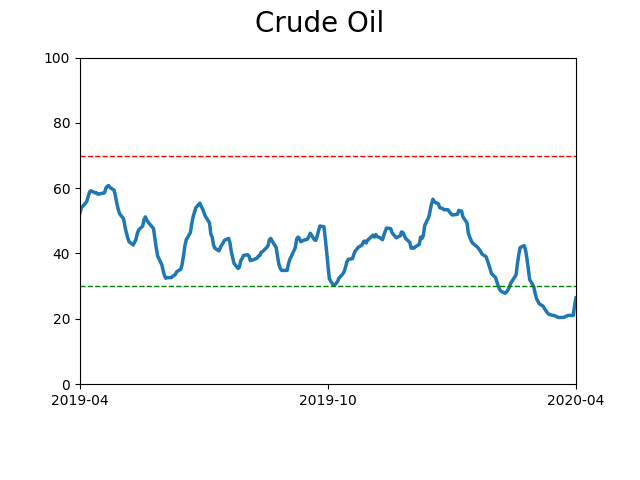
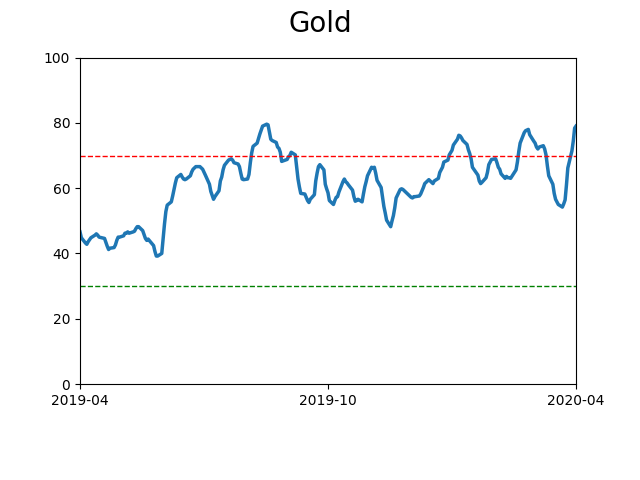
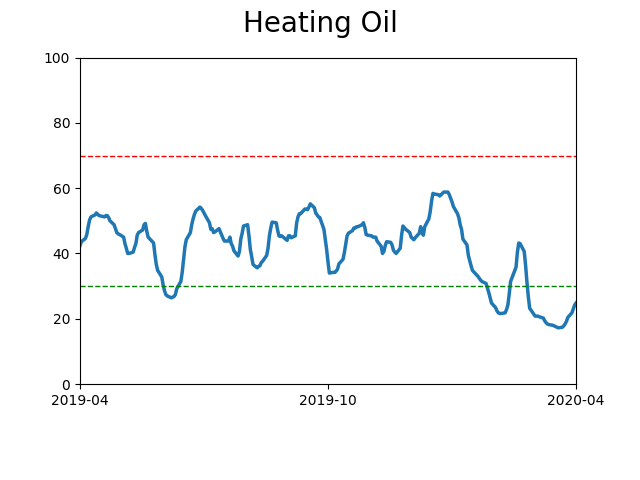
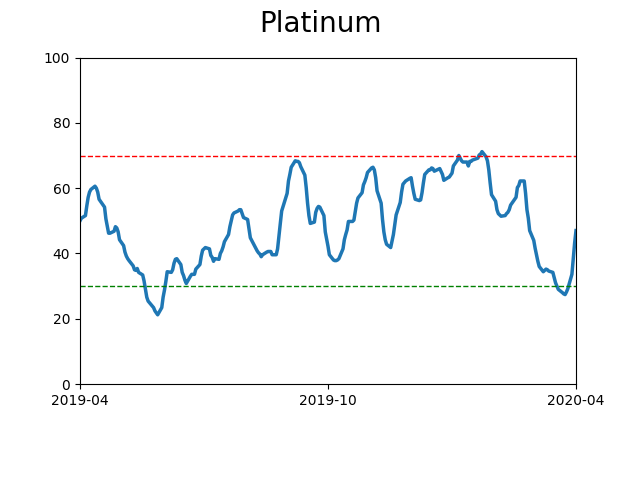
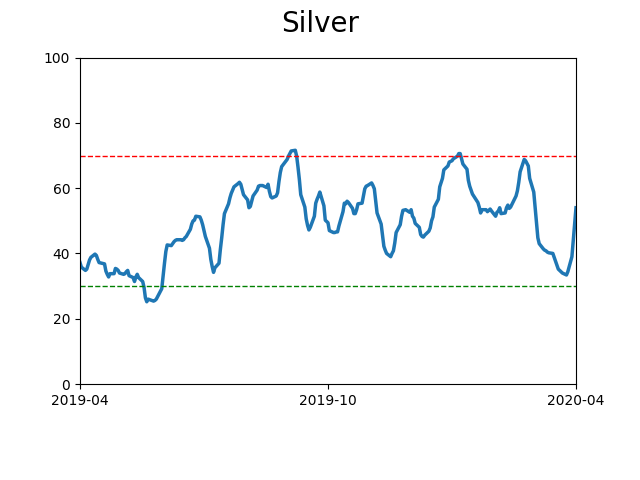
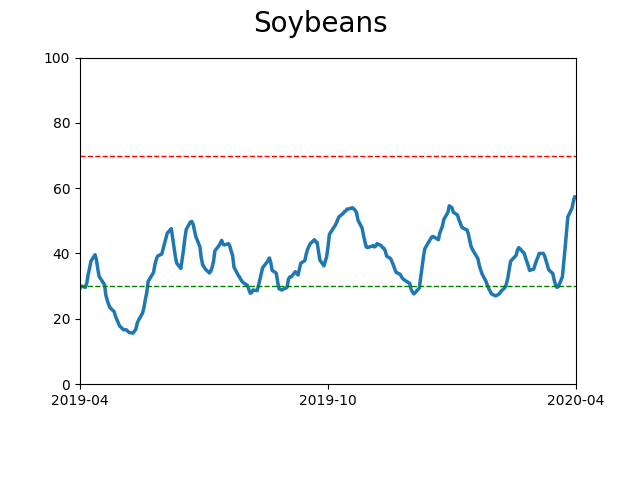
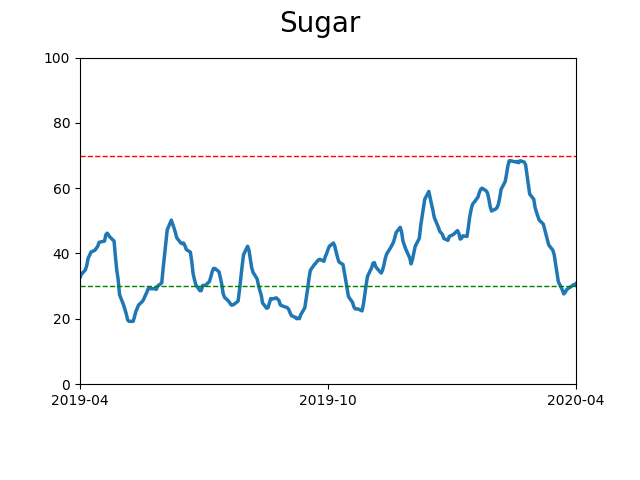
Commodity ETF's - 5-Day Moving Average
|
|