Headlines
|
|
Energy's recovery attempt:
Energy stocks haven't set a lower low for a couple of weeks, staging one of the largest recoveries since 1926. Wall Street hasn't been buying it, as ratings agencies keep downgrading companies in that sector.
A breadth thrust that wasn't:
Last week, buying pressure was overwhelming for 3 sessions. Because it was a short spurt, it wasn't enough to technically trigger a gold standard of a Zweig Breadth Thrust. It just barely missed the cutoff, but when we look at adjusted criteria, that might not matter.
|
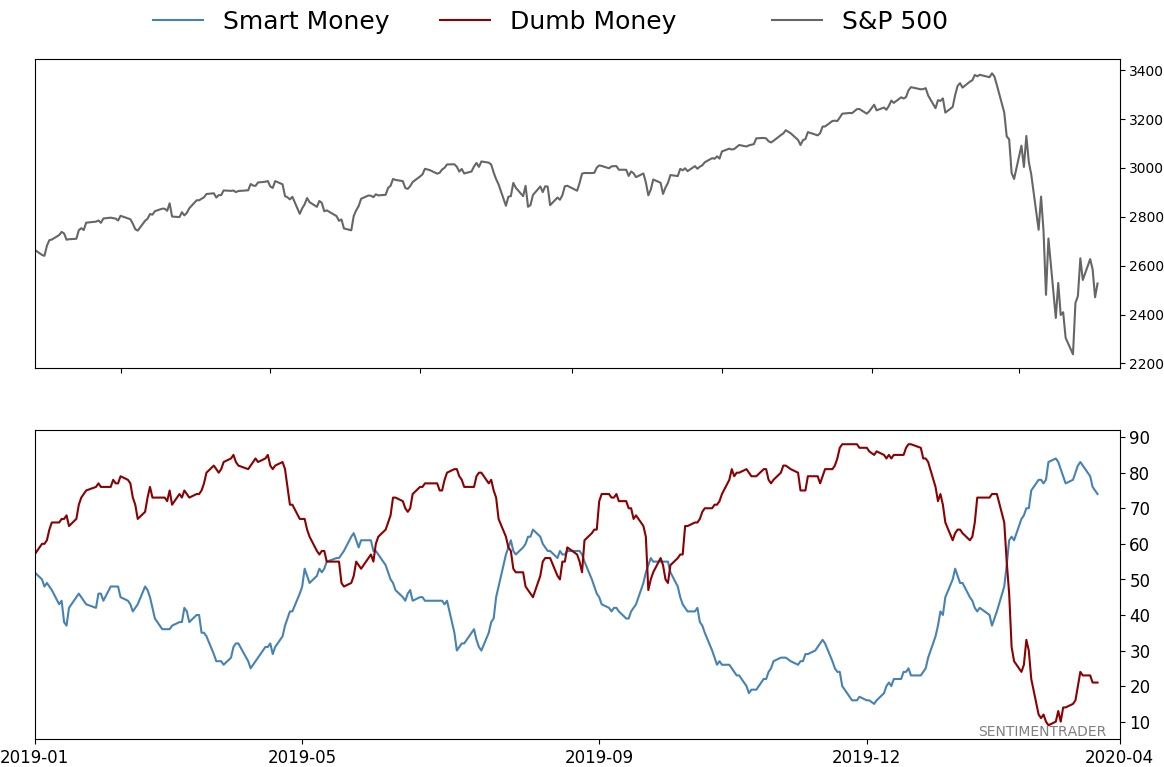
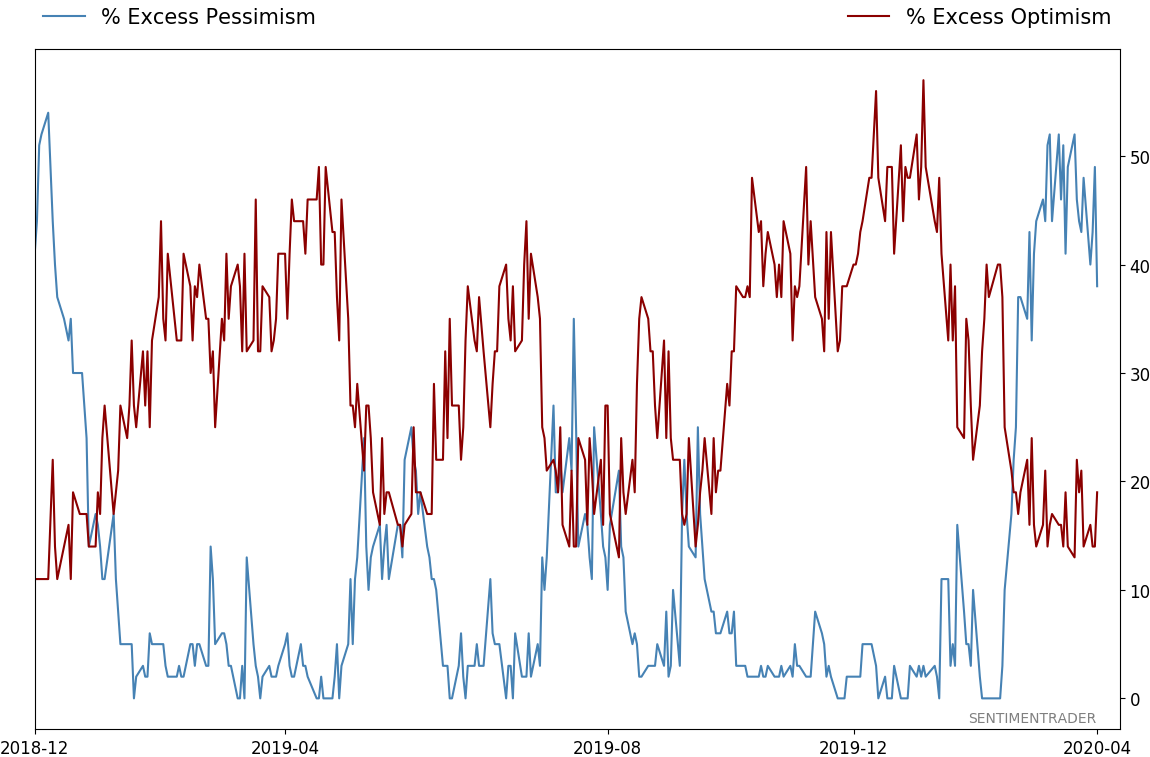
Smart / Dumb Money Confidence
|
Smart Money Confidence: 74%
Dumb Money Confidence: 21%
|
|
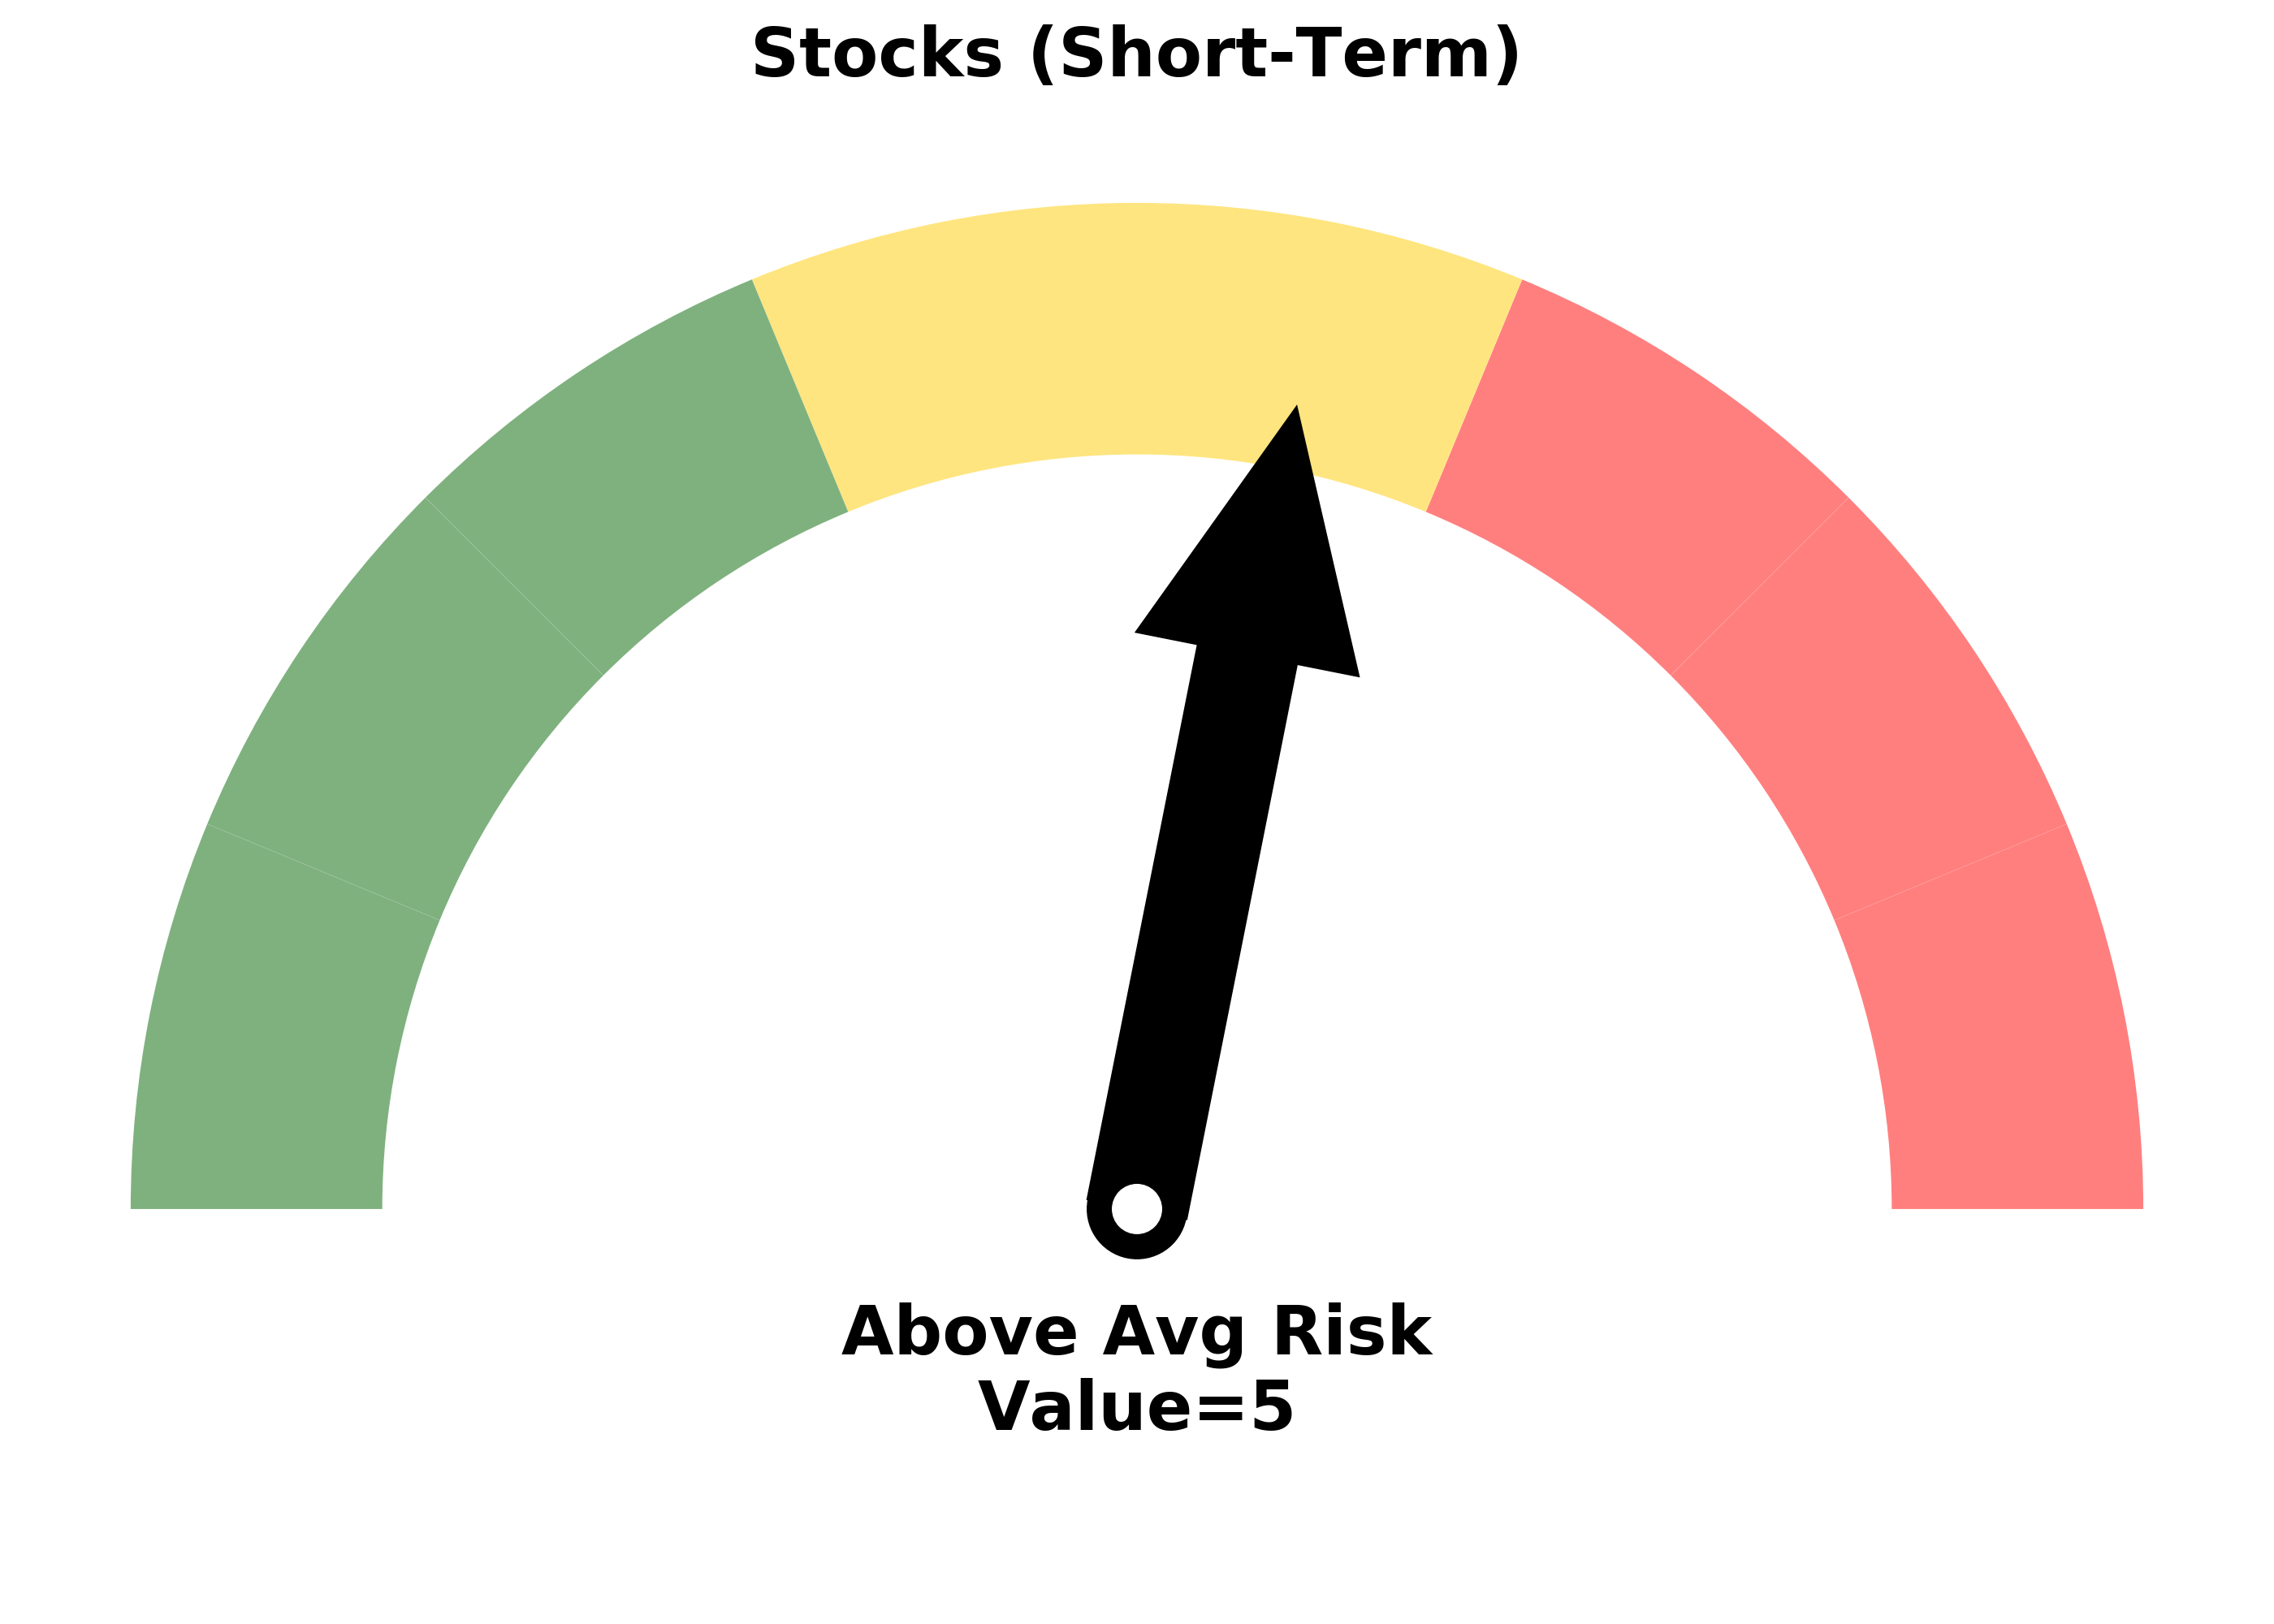
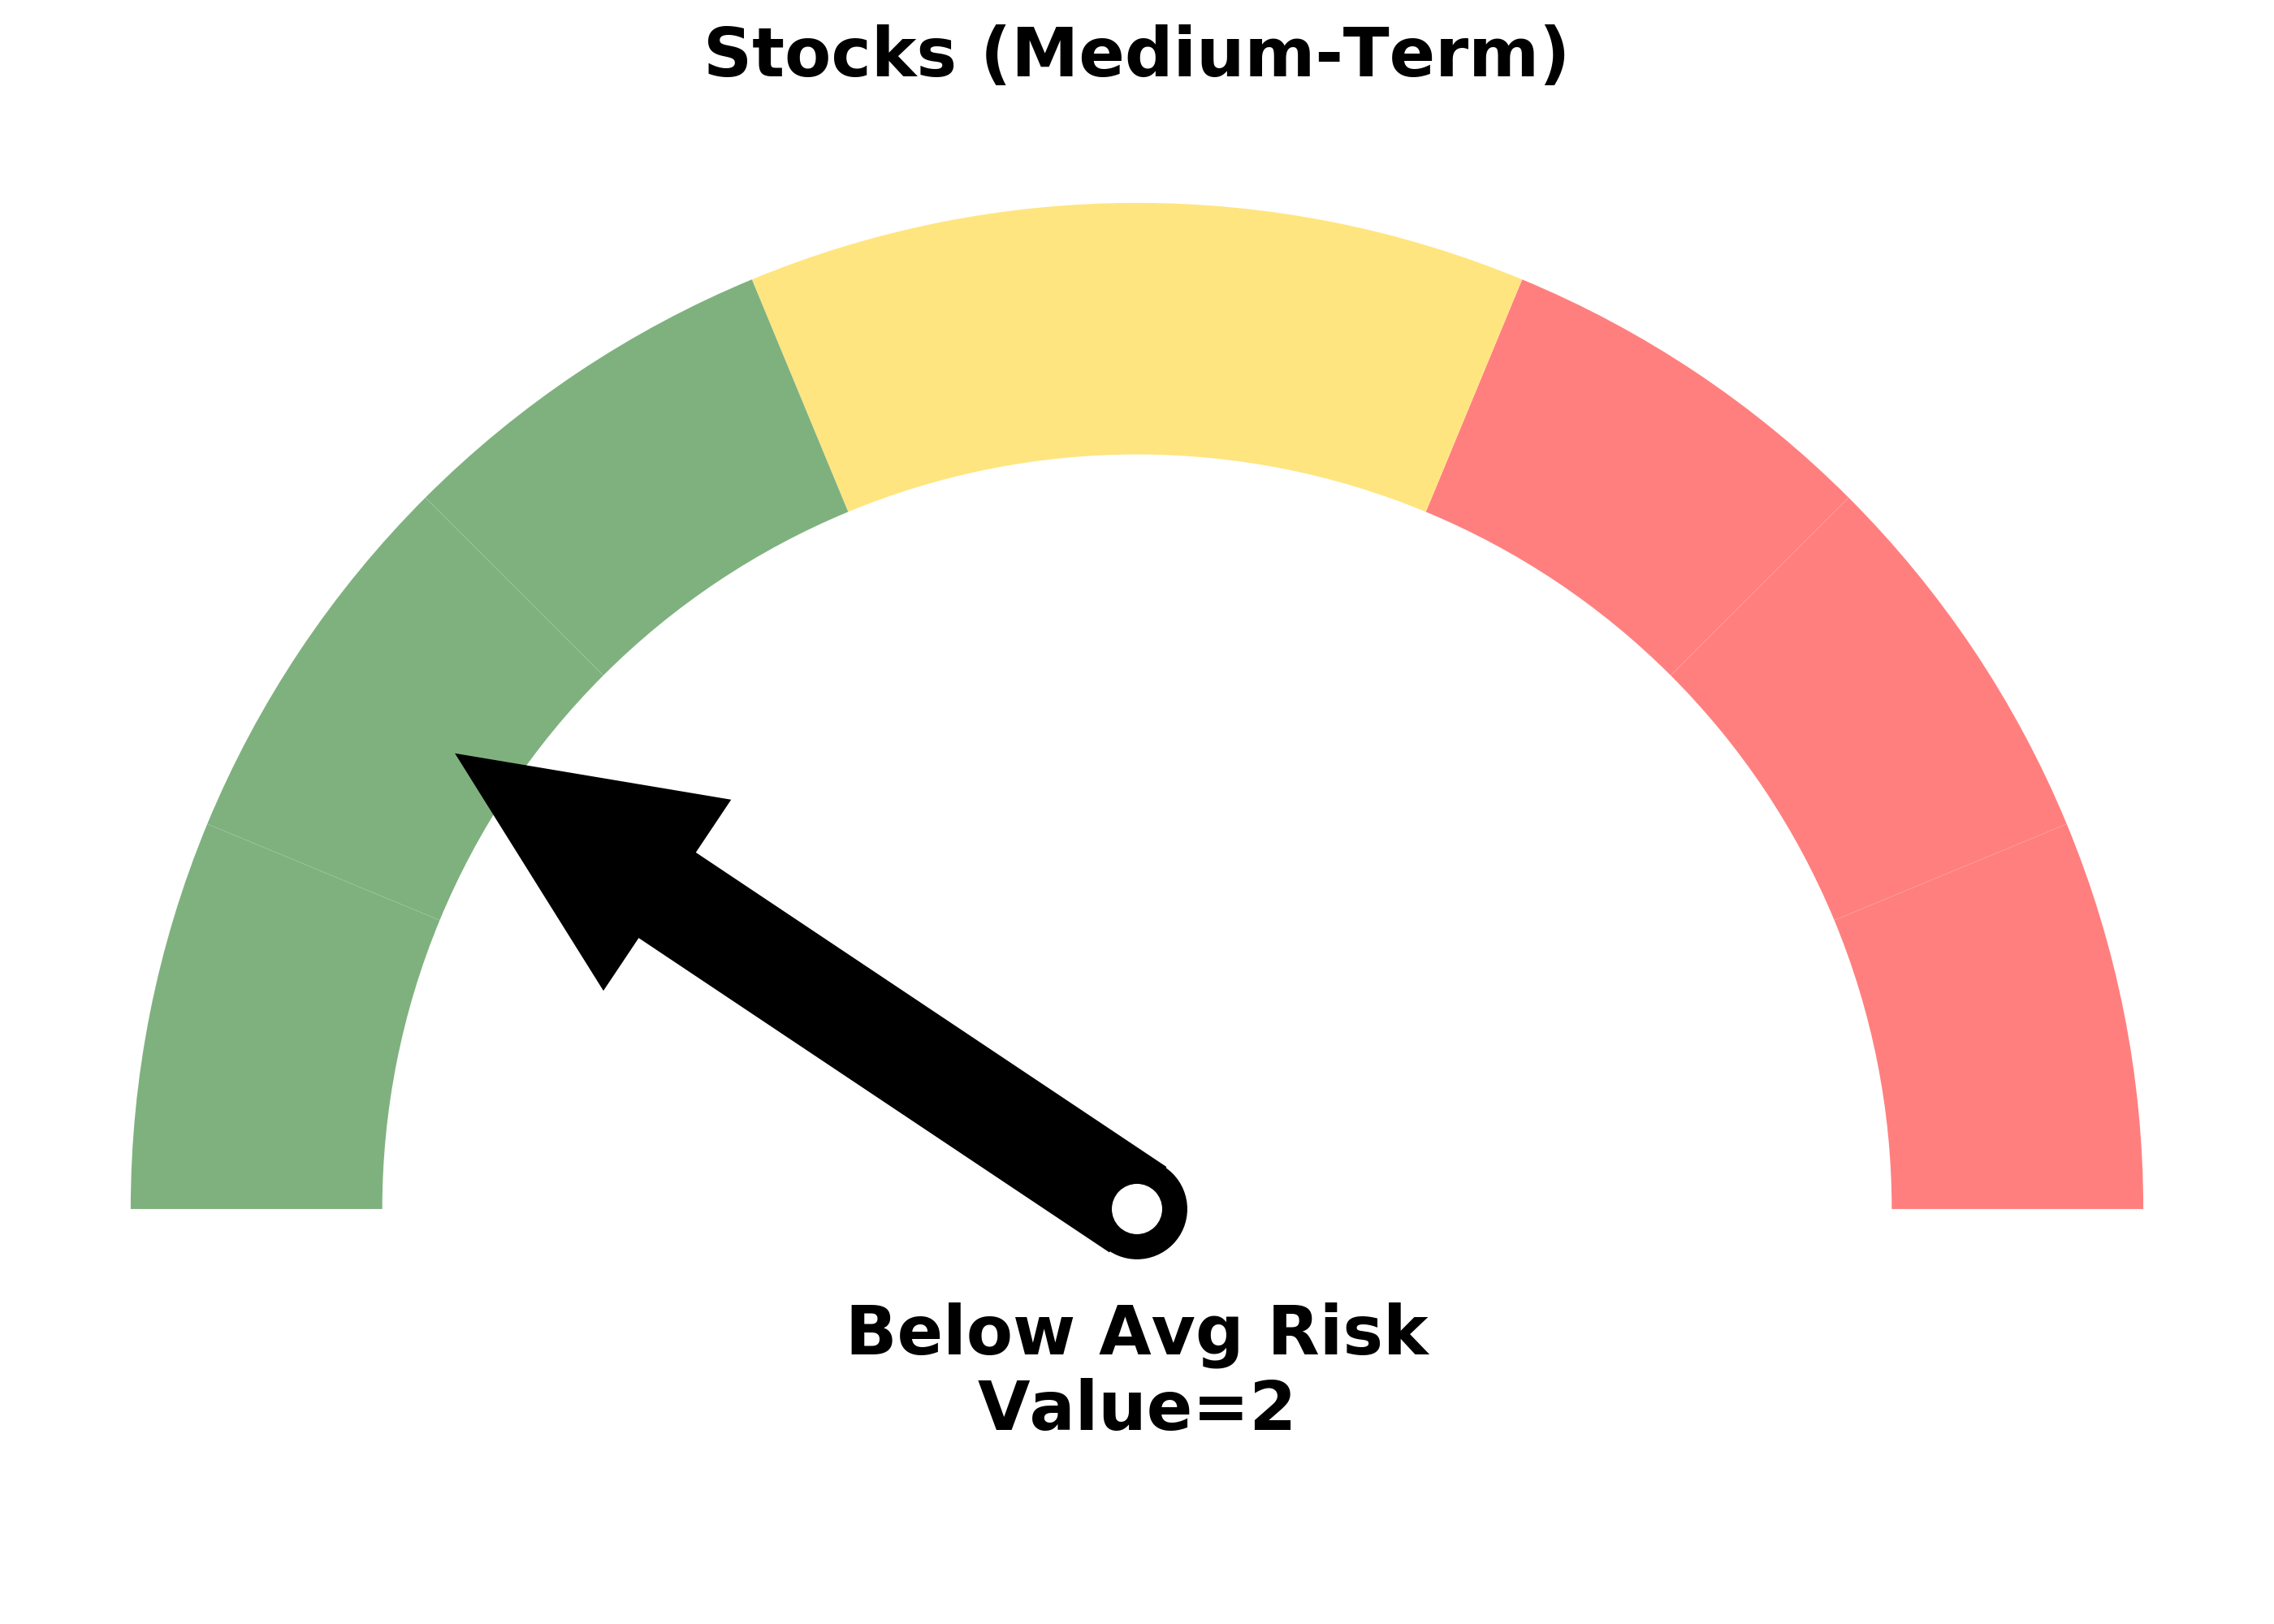
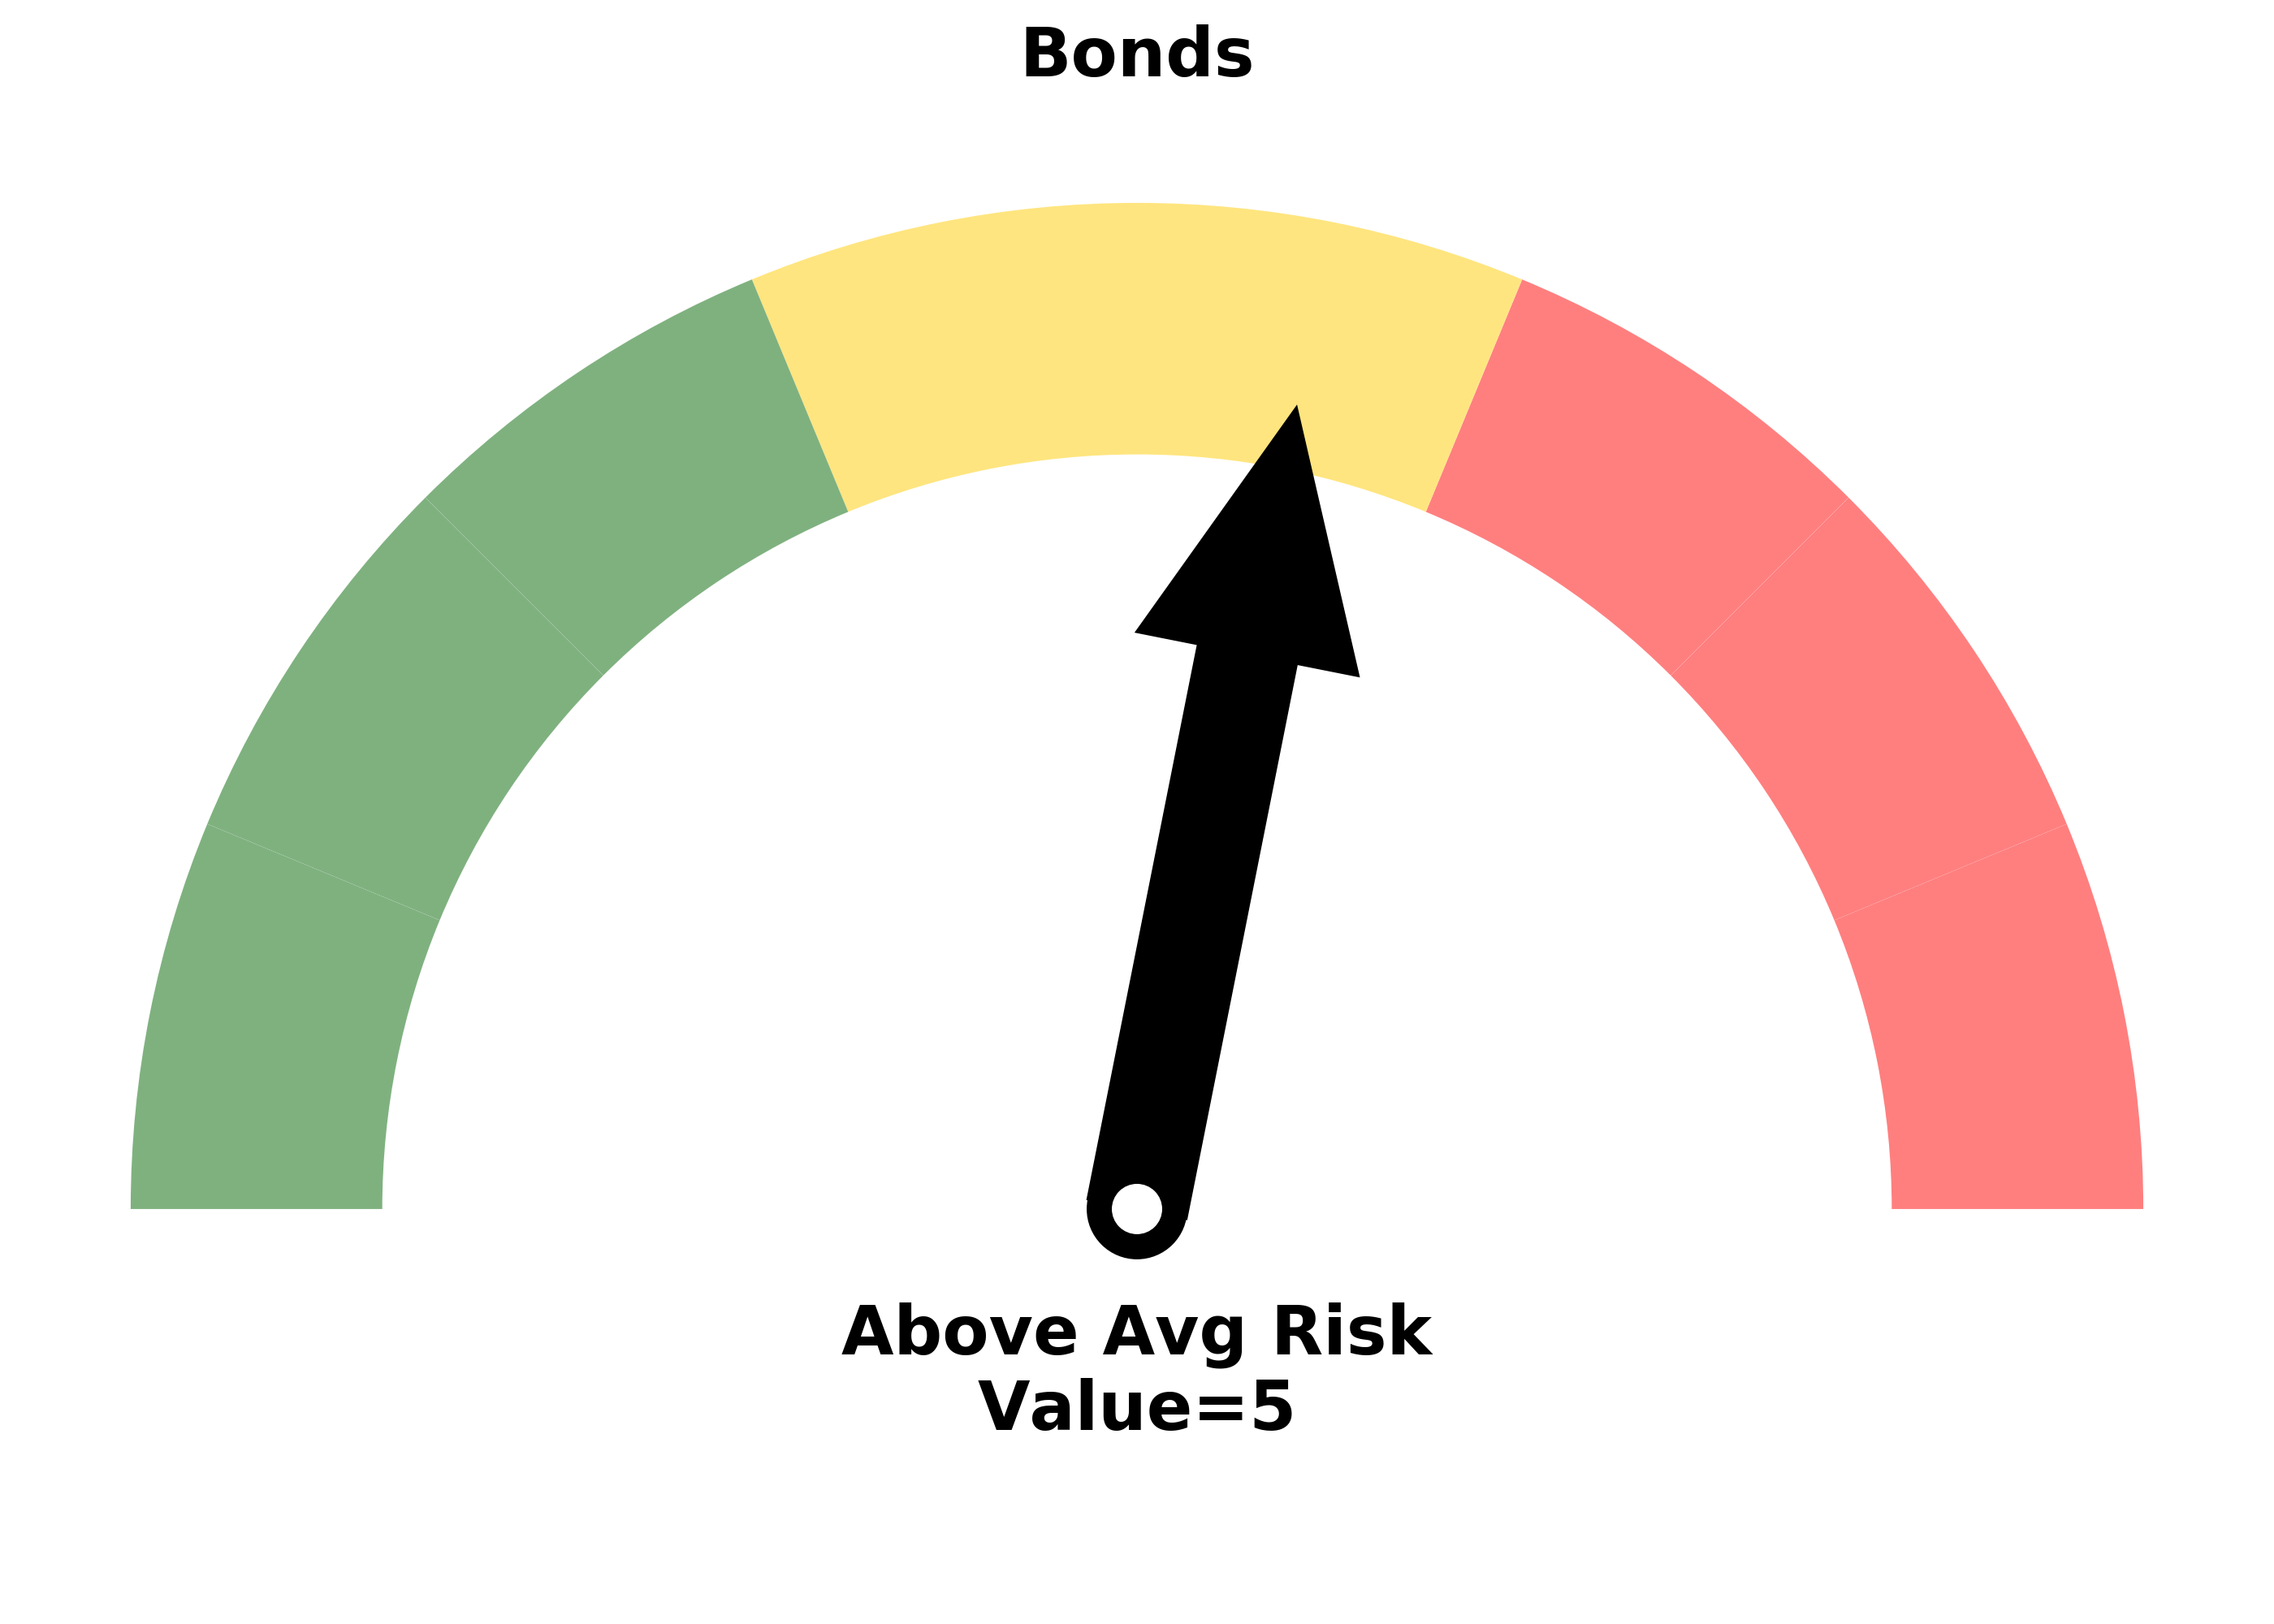
Risk Levels
Research
BOTTOM LINE
Energy stocks haven't set a lower low for a couple of weeks, staging one of the largest recoveries since 1926. Wall Street hasn't been buying it, as ratings agencies keep downgrading companies in that sector.
FORECAST / TIMEFRAME
XLE -- Up, Long-Term
|
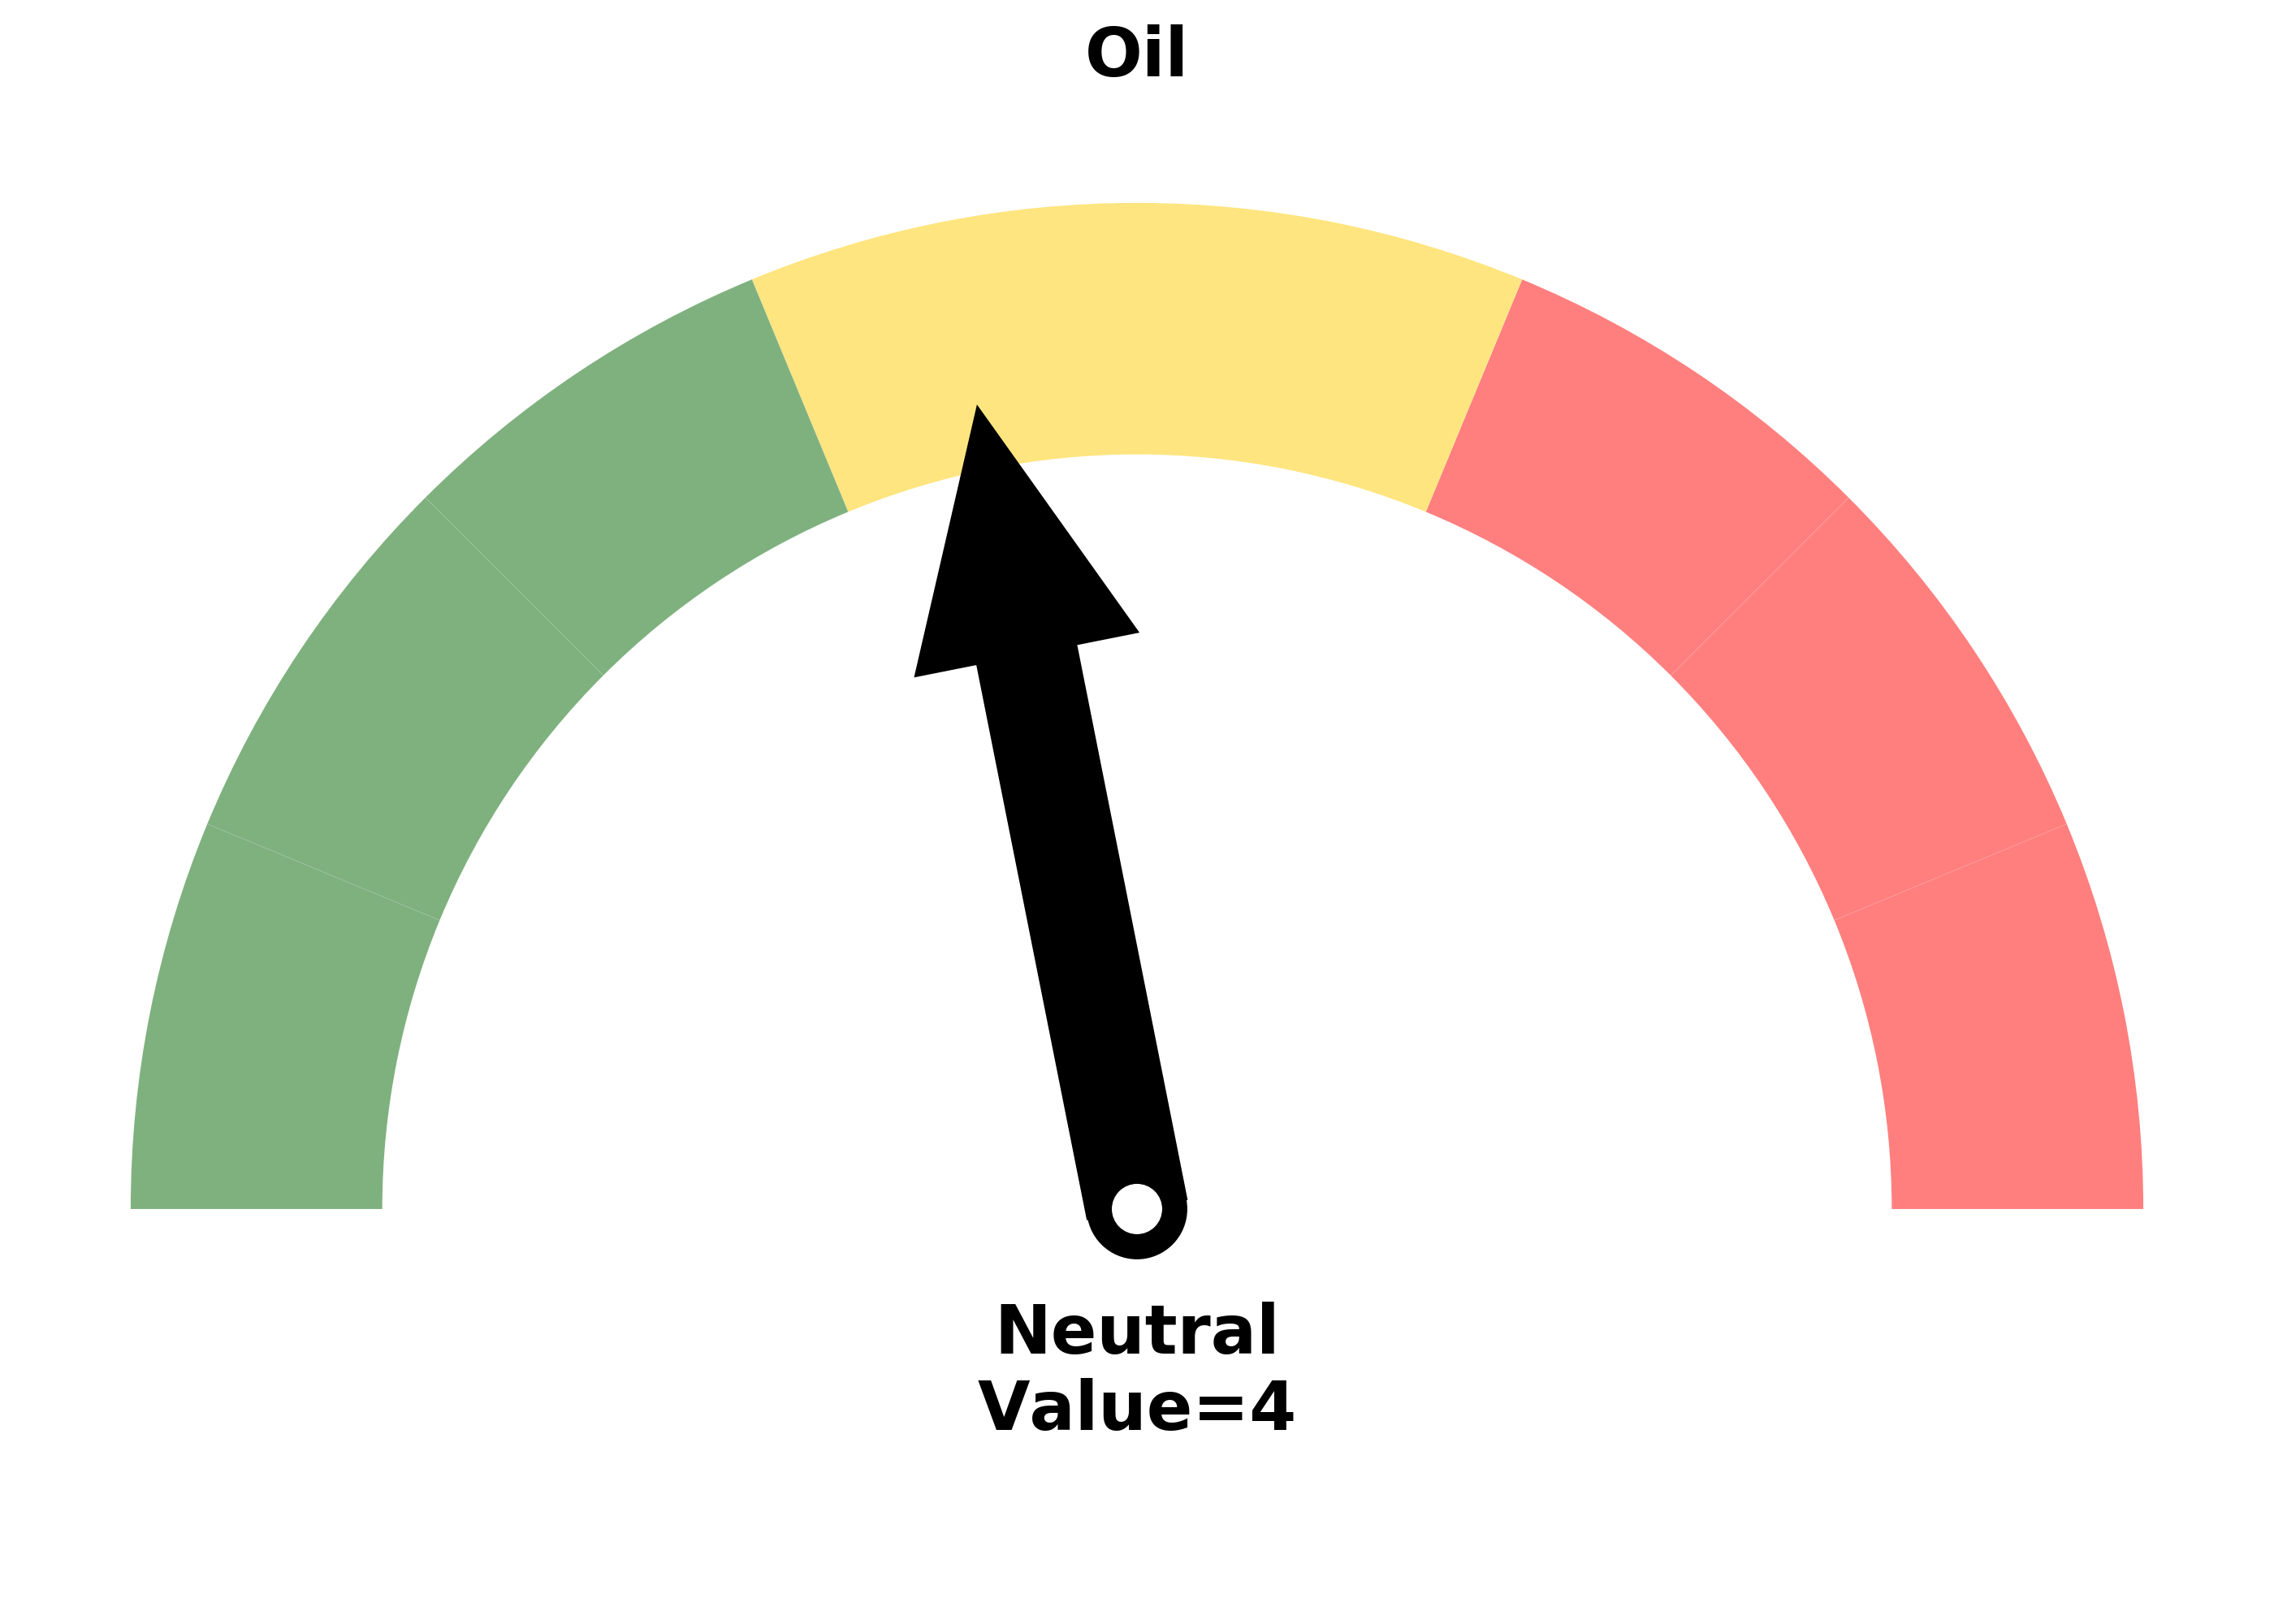
We saw yesterday that sentiment toward oil is horrendous, among the worst ever.
Now that there seems to be some geopolitical cooperation when it comes to the price of the commodity (depending on who's being asked), energy stocks have seen more committed buying interest. Perhaps it's at least a good sign that they have made a lower lower for two weeks.
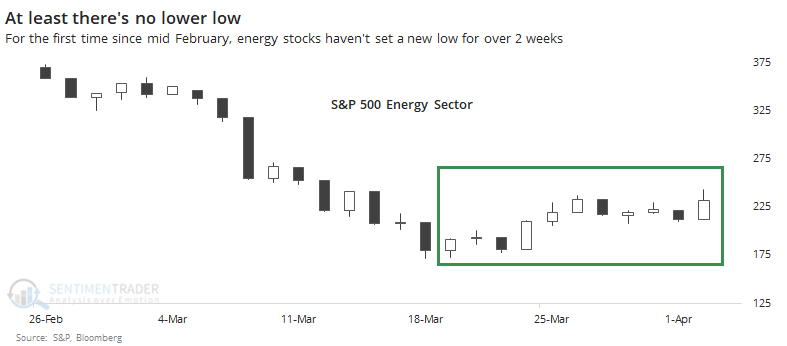
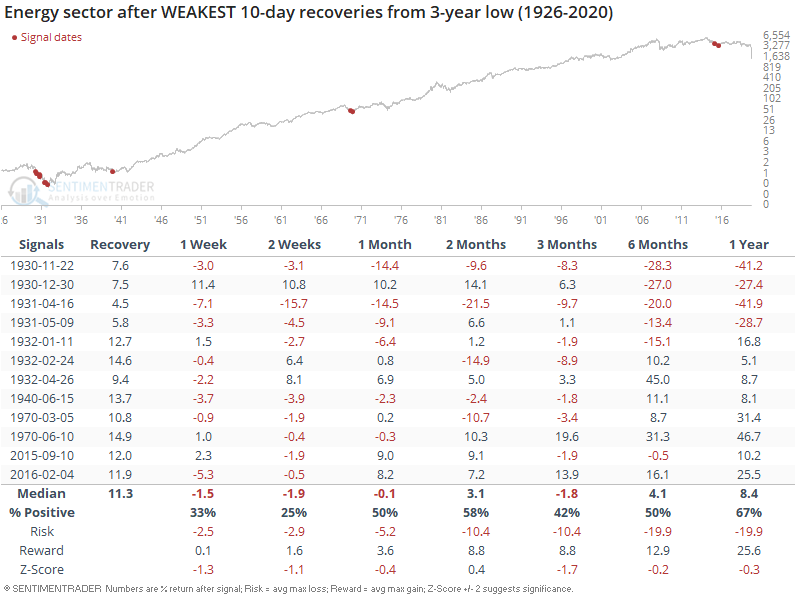
From today's highest price to the low a little over two weeks ago, energy stocks have rebounded more than 30%, qualifying for the strongest push off a low since 1926.
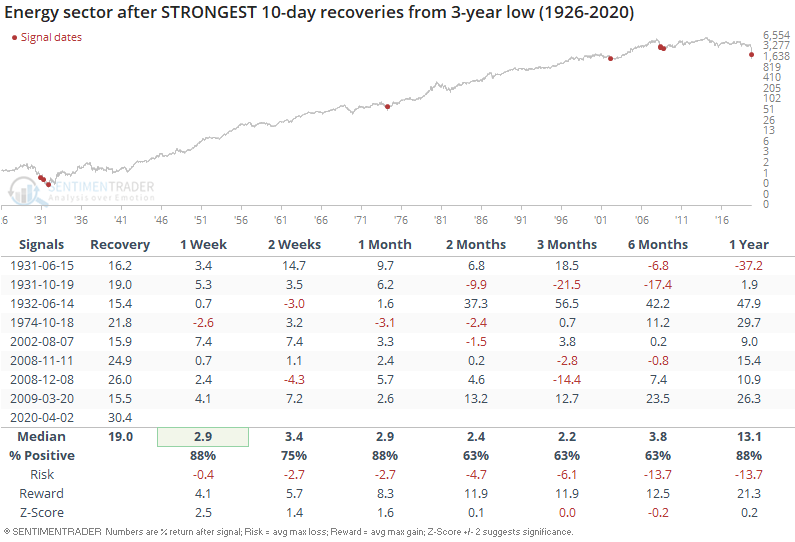
It was not a foolproof sign that a prolonged low was in, with a couple of head-fakes in the 1930s and again in 2008. The others were mostly a sign that sellers were exhausted.
The size of the bounce seemed to make a difference. After the stocks had sunk to a 3-year low then recovered for 10 days but with a weak bounce, there was more of a tendency to see additional losses going forward.
Back in February 2016, we looked at the surge in rating downgrades on Wall Street for stocks in the energy sector. Ratings firms are not exactly known as being forward thinkers when it comes to their public pronouncements, and once again they proved to be woefully behind the curve as the companies surged that year.
They're back at it.
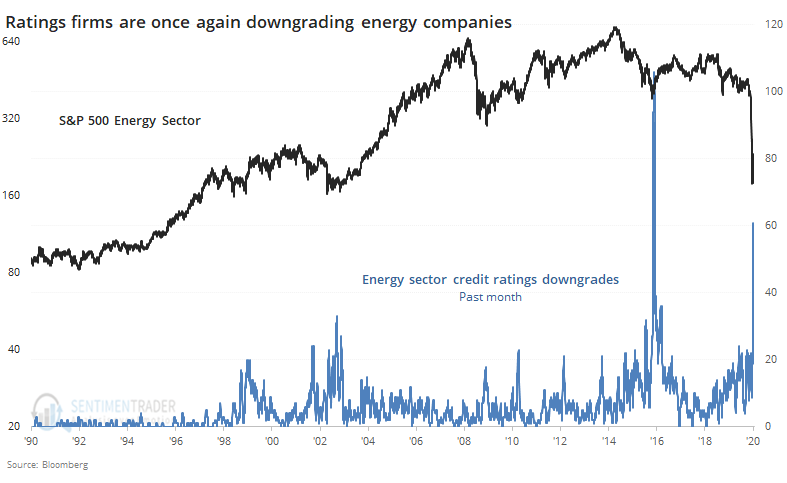
Downgrades haven't yet matched the pace from 2016, but it's changing quickly.
With such negative sentiment and at least the inklings of a sustained recovery, the sector is looking better than it has in months. The plunge in March violated all kinds of historical precedent, which is a worry. As long as it holds above the low of the past week, though, it looks constructive.
BOTTOM LINE
Last week, buying pressure was overwhelming for 3 sessions. Because it was a short spurt, it wasn't enough to technically trigger a gold standard of a Zweig Breadth Thrust. It just barely missed the cutoff, but when we look at adjusted criteria, that might not matter.
FORECAST / TIMEFRAME
None
|
Last week, stocks witnessed one of the most powerful three-day thrusts in history. Probably the most powerful.
There's always a "but," and this time the "but" is that it wasn't actually a breadth thrust. That's based on preconceived notions about what a thrust is. It's assuming there are rules when it comes to these kinds of signals.
The most popular definition of a thrust is the one popularized by Marty Zweig, which looked for the 10-day exponential moving average of the Up Issues Ratio, which needs to cycle from below 40% to above 61.5% within 10 days. Because of a bad day on Friday, it didn't quite trigger.
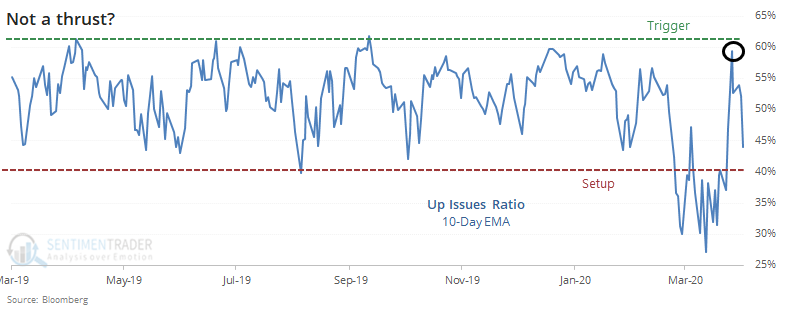
The Zweig thresholds are considered gospel, but nothing like this should be. Why use Up Issues and not Up Volume? Why a 10-day average, and why exponential? Why a 10-day window? Why 40% and not 45%, and why does it have to exceed precisely 61.5%?
If a signal requires such specific criteria, then it's a big clue that it's not very robust. And that's one of the problems with using those criteria - the 61.5% threshold was picked because it excludes some dates which otherwise would have been failures.
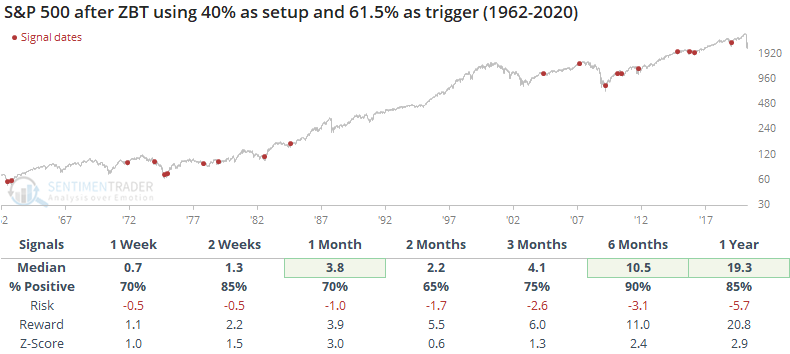
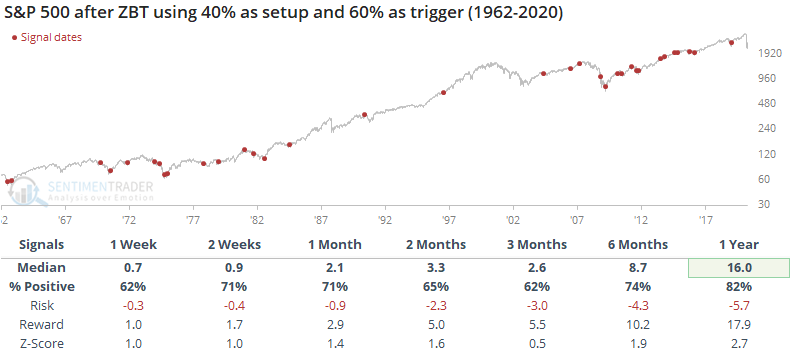
Using the original setup, returns were indeed impressive.
If we adjust the trigger to the round number of 60%, which would make a lot more sense, then the returns deteriorated.
Because of that one bad day, the ZBT didn't technically trigger. Let's see if it matters.
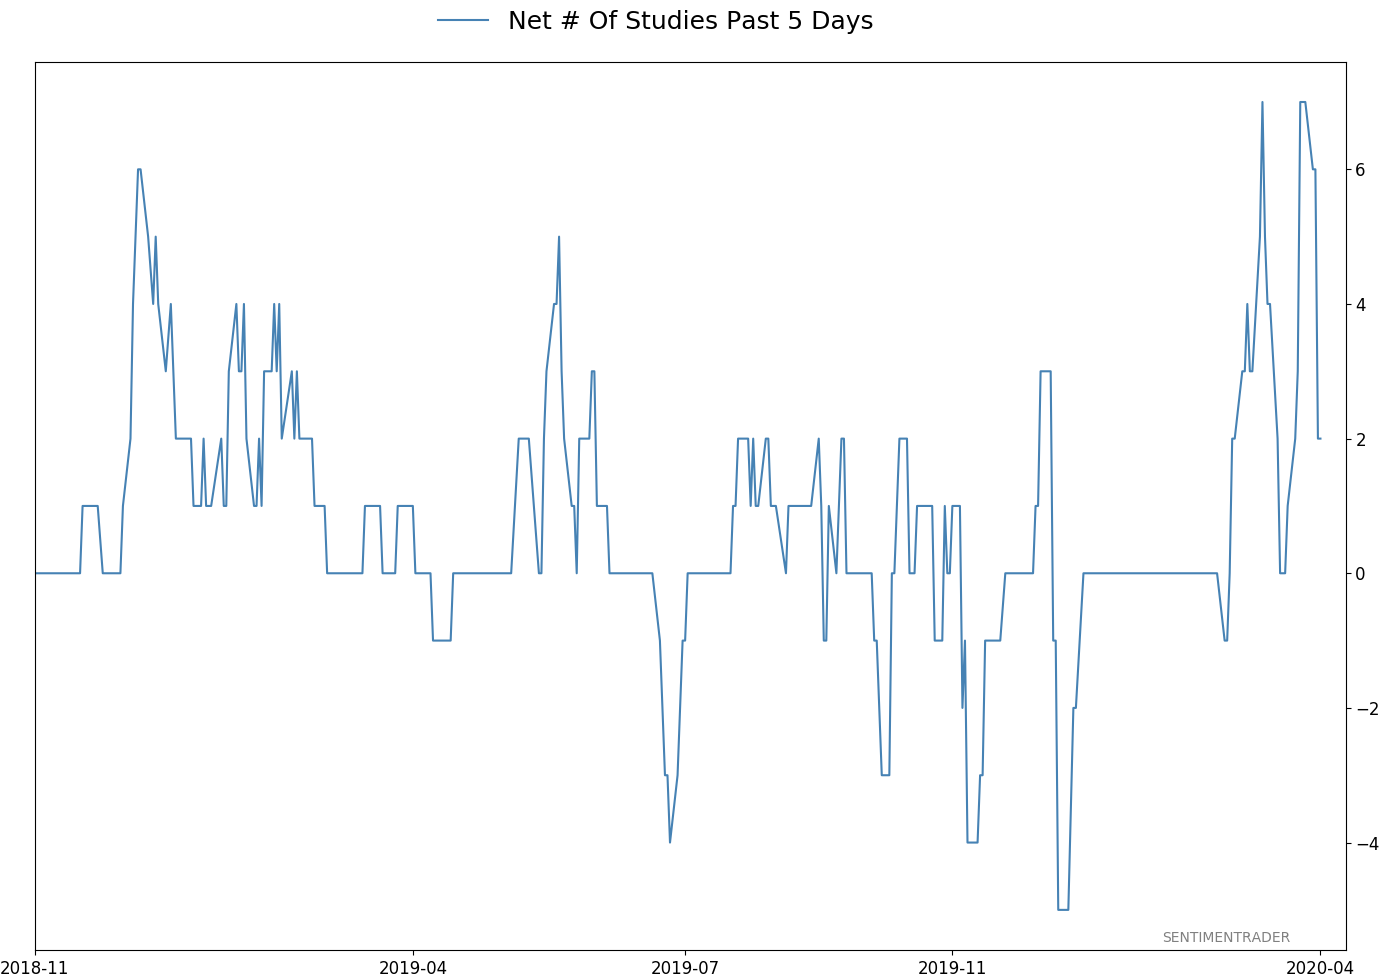
Below, we can see other times that we got an "almost" Zweig Breadth Thrust (ZBT). These are all the same criteria as the original signal, but the trigger is set to 59.3% instead of 61.5%.
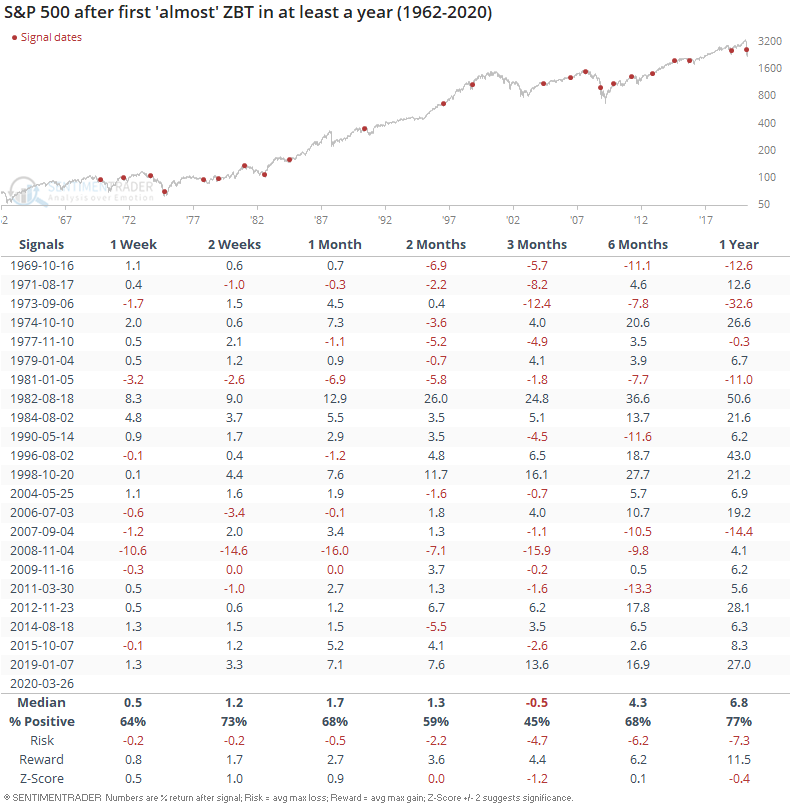
Most of these led to good, but not great, returns. But this is ignoring a potentially important point - it's coming from one of the most severe oversold signals in history.
The setup requires the ratio to drop below 40%, but last month it plunged below 30%. If we look for "almost" thrusts that had a setup below 30%, then the table above would only include two precedents, the ones from August 2011 and January 2019.
To expand the sample size, we'll lower the upper trigger threshold to only 57%.
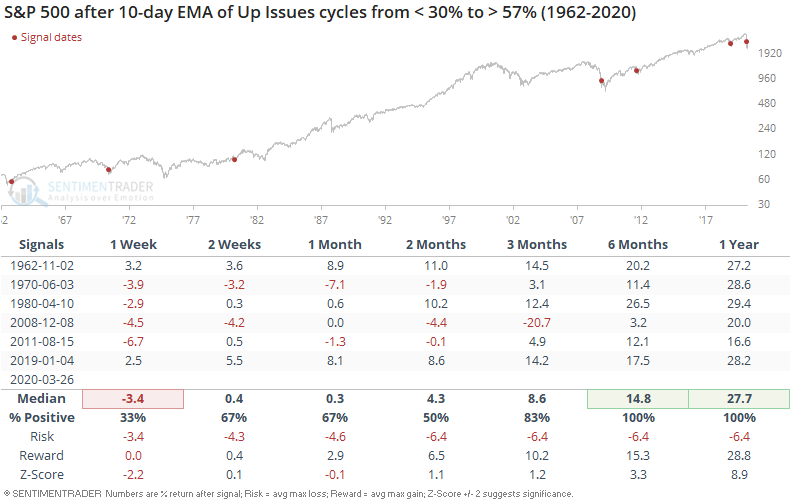
Several of these preceded some wild swings over the next couple of weeks, and the one in December 2008 saw large losses over the next three months, but 6-12 months later they were all solidly positive, all marking important lows.
The concern now is that the weakness on Tuesday cancelled the signal. One of the guidelines is that there can't be a big down day within a certain number of days after the thrust. Using the criteria for the "almost" ZBT signals in the first table, below we see every time it triggered and then there was at least one day with 85% down issues within two weeks.
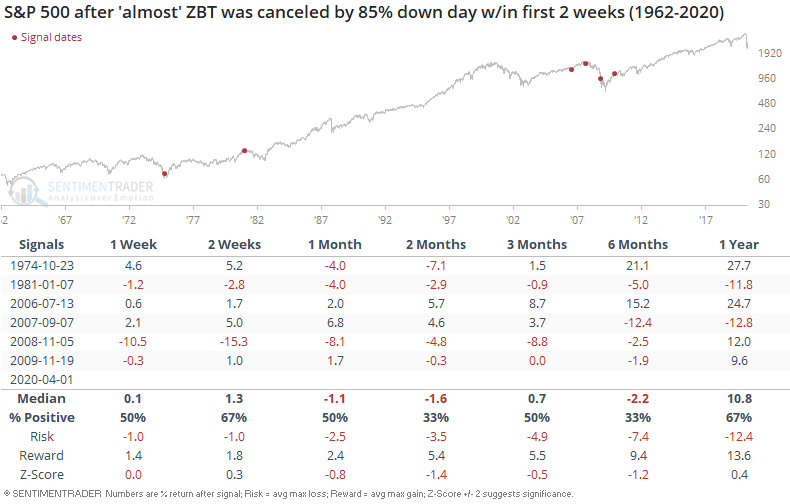
This didn't matter in 1974 (longer-term), 2006, 2007 (for a while), or 2009. It did in 1981 (when stocks were near a high) and 2008. Tough to read anything into all of that.
One of the dangers of looking at stats like this is that it's possible, even easy, to slice and dice them in a way that supports whatever view you want to show. That's why we spend a lot of time looking at different settings to make sure that signals are robust, and hopefully we communicate when they're not. Sometimes, the sample size is just too low and there's not much to do about that other than place less weight on the signal. It's also vitally important to consider the context in which the signals are triggering.
When we consider two facts:
- The past two weeks saw arguably the most oversold condition in 60 years, and
- Then we saw the most impressive 3-day thrust in history
Then the idea that it all doesn't count because a random indicator barely missed a cherry-picked threshold seems narrow-minded. There are definitely reasons to be concerned about this market, but the supposed lack of a breadth thrust is not one really one of them.
Active Studies
| Time Frame | Bullish | Bearish | | Short-Term | 0 | 2 | | Medium-Term | 17 | 14 | | Long-Term | 32 | 4 |
|
Indicators at Extremes
Portfolio
| Position | Weight % | Added / Reduced | Date | | Stocks | 73.2 | Added 31.3% | 2020-03-17 | | Bonds | 0.0 | Reduced 6.7% | 2020-02-28 | | Commodities | 5.5 | Added 2.4%
| 2020-02-28 | | Precious Metals | 0.0 | Reduced 3.6% | 2020-02-28 | | Special Situations | 0.0 | Reduced 31.9% | 2020-03-17 | | Cash | 21.3 | | |
|
Updates (Changes made today are underlined)
In the first months of the year, we saw manic trading activity. From big jumps in specific stocks to historic highs in retail trading activity to record highs in household confidence to almost unbelievable confidence among options traders. All of that has come amid a market where the average stock can’t keep up with their indexes. There were signs of waning momentum in stocks underlying the major averages, which started triggering technical warning signs in late January. The kinds of extremes we saw in December and January typically take months to wear away, but the type of selling we’ve seen over the past month has gone a long way toward getting there. When we place the kind of moves we saw into March 23 into the context of coming off an all-time high, there has been a high probability of a multi-month rebound. The volatility we’ve seen lately is extremely compelling from a medium-term point of view. Virtually everything we’ve looked at suggests a strong probability of gains over the next several months, even within the context of a potential bear market, and even from what had been higher prices. After stocks bottomed on the 23rd, they enjoyed a historic buying thrust. While other signs are mixed at best that panic is subsiding, that thrust is one of the most encouraging sign we've seen in years. There is often a test of a panic low in the weeks after an initial recovery, but that thrust we saw, combined with the larger-than-usual retracement, have me less convinced a test is necessary. For now, I see no overwhelming reason to add or reduce exposure.
RETURN YTD: -17.5% 2019: 12.6%, 2018: 0.6%, 2017: 3.8%, 2016: 17.1%, 2015: 9.2%, 2014: 14.5%, 2013: 2.2%, 2012: 10.8%, 2011: 16.5%, 2010: 15.3%, 2009: 23.9%, 2008: 16.2%, 2007: 7.8%
|
|
Phase Table
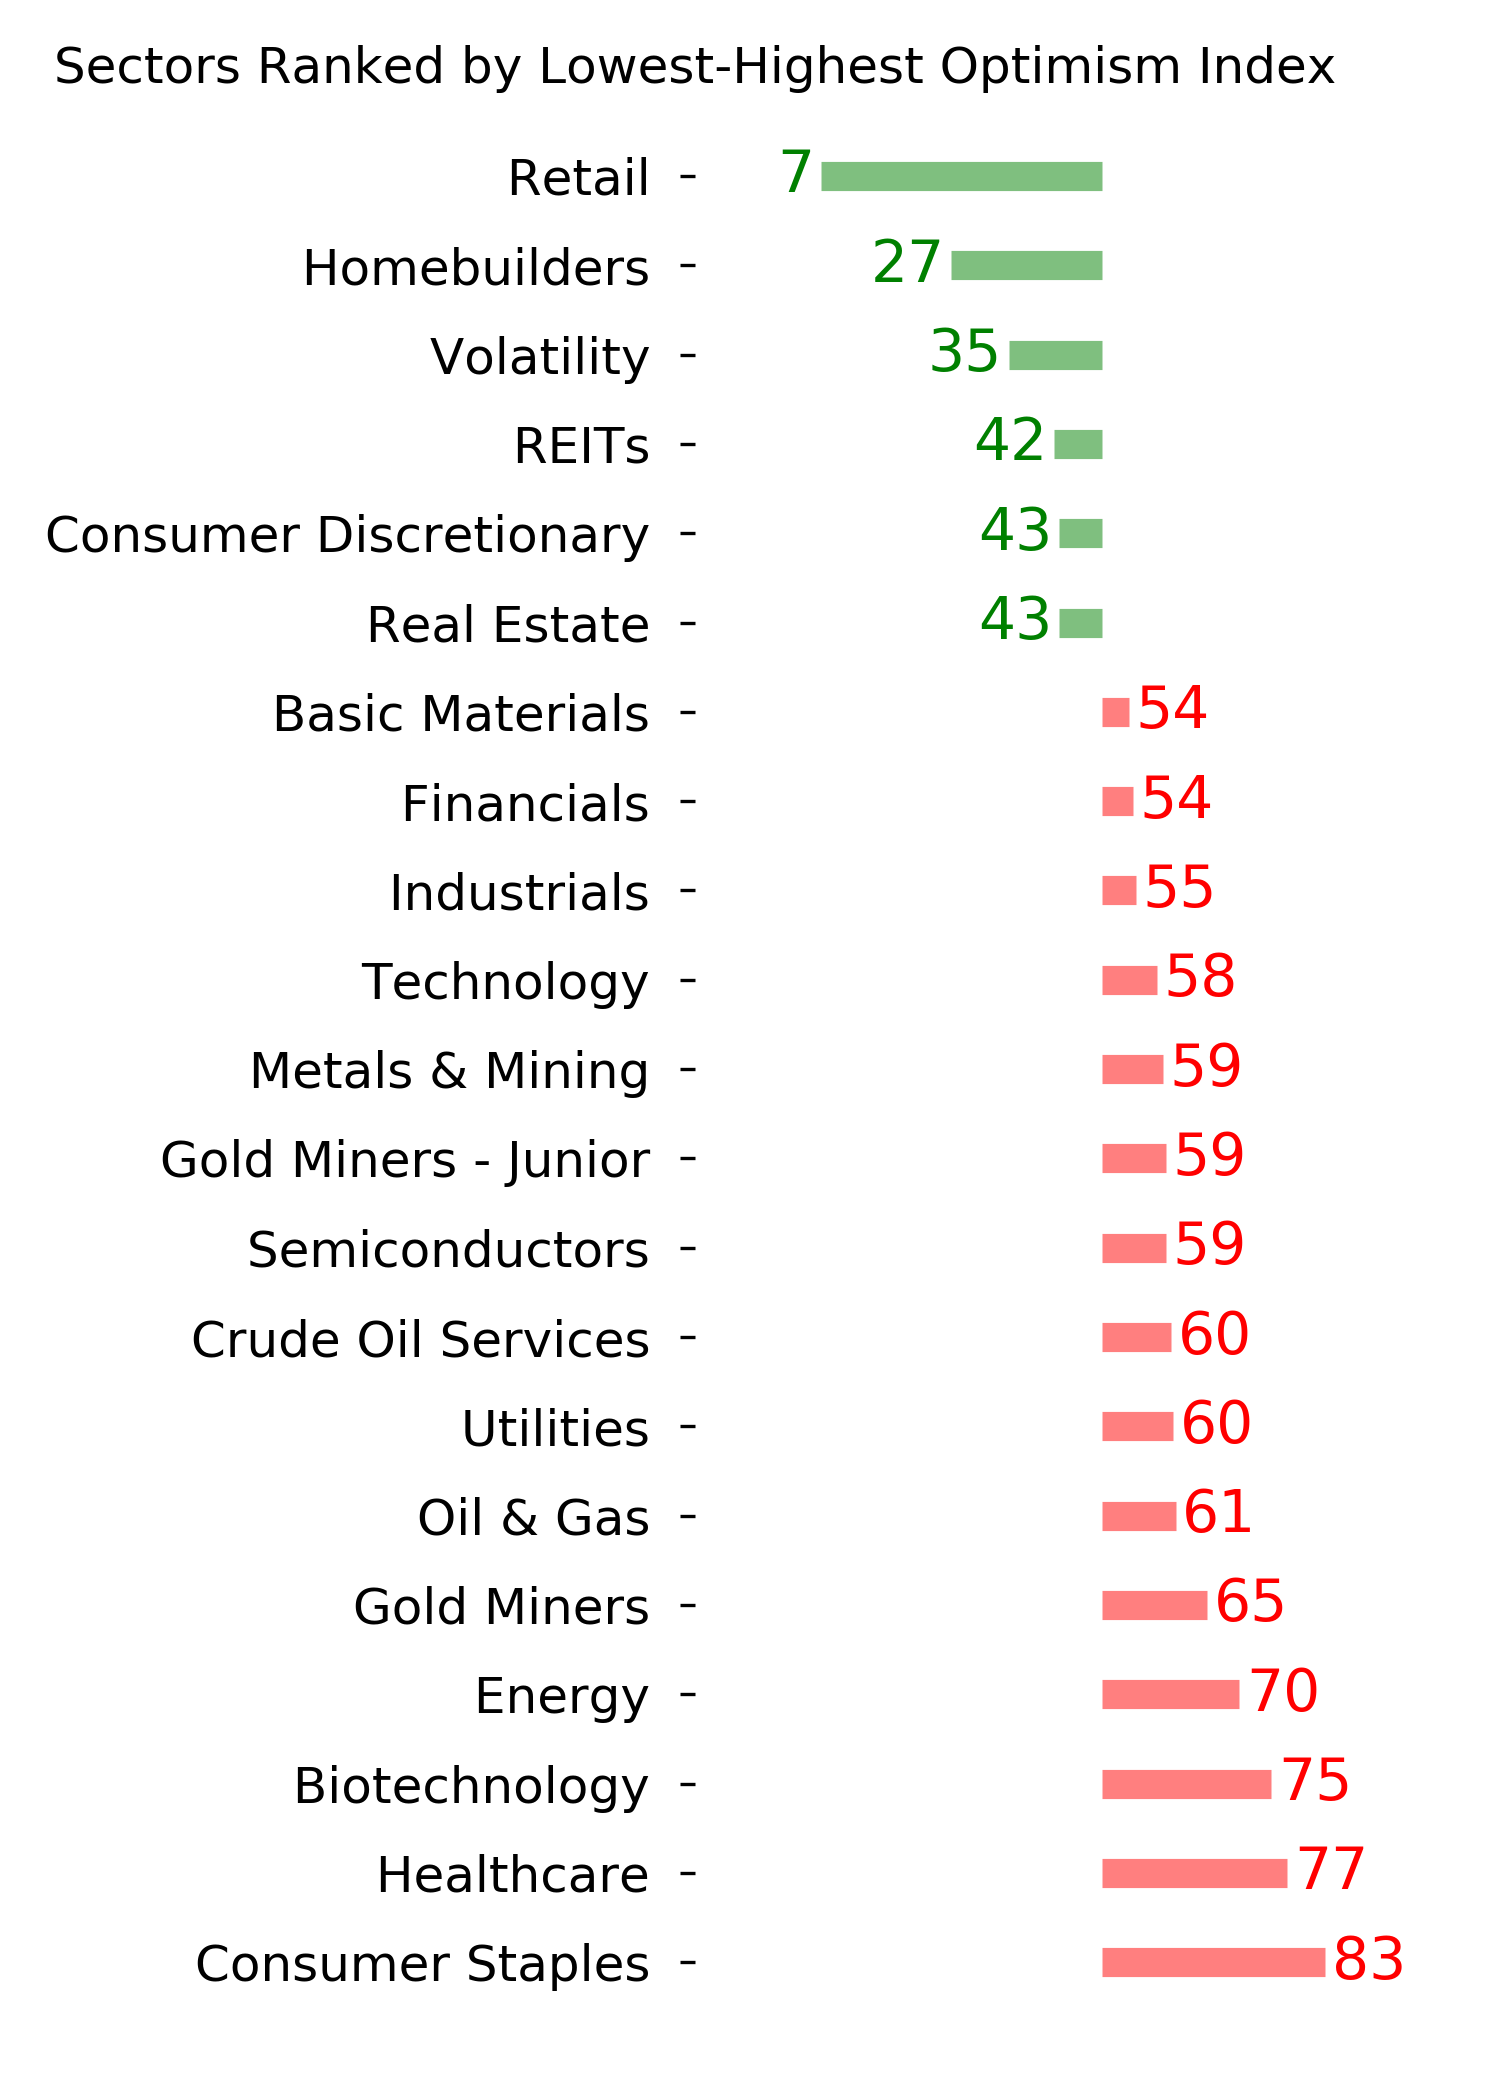
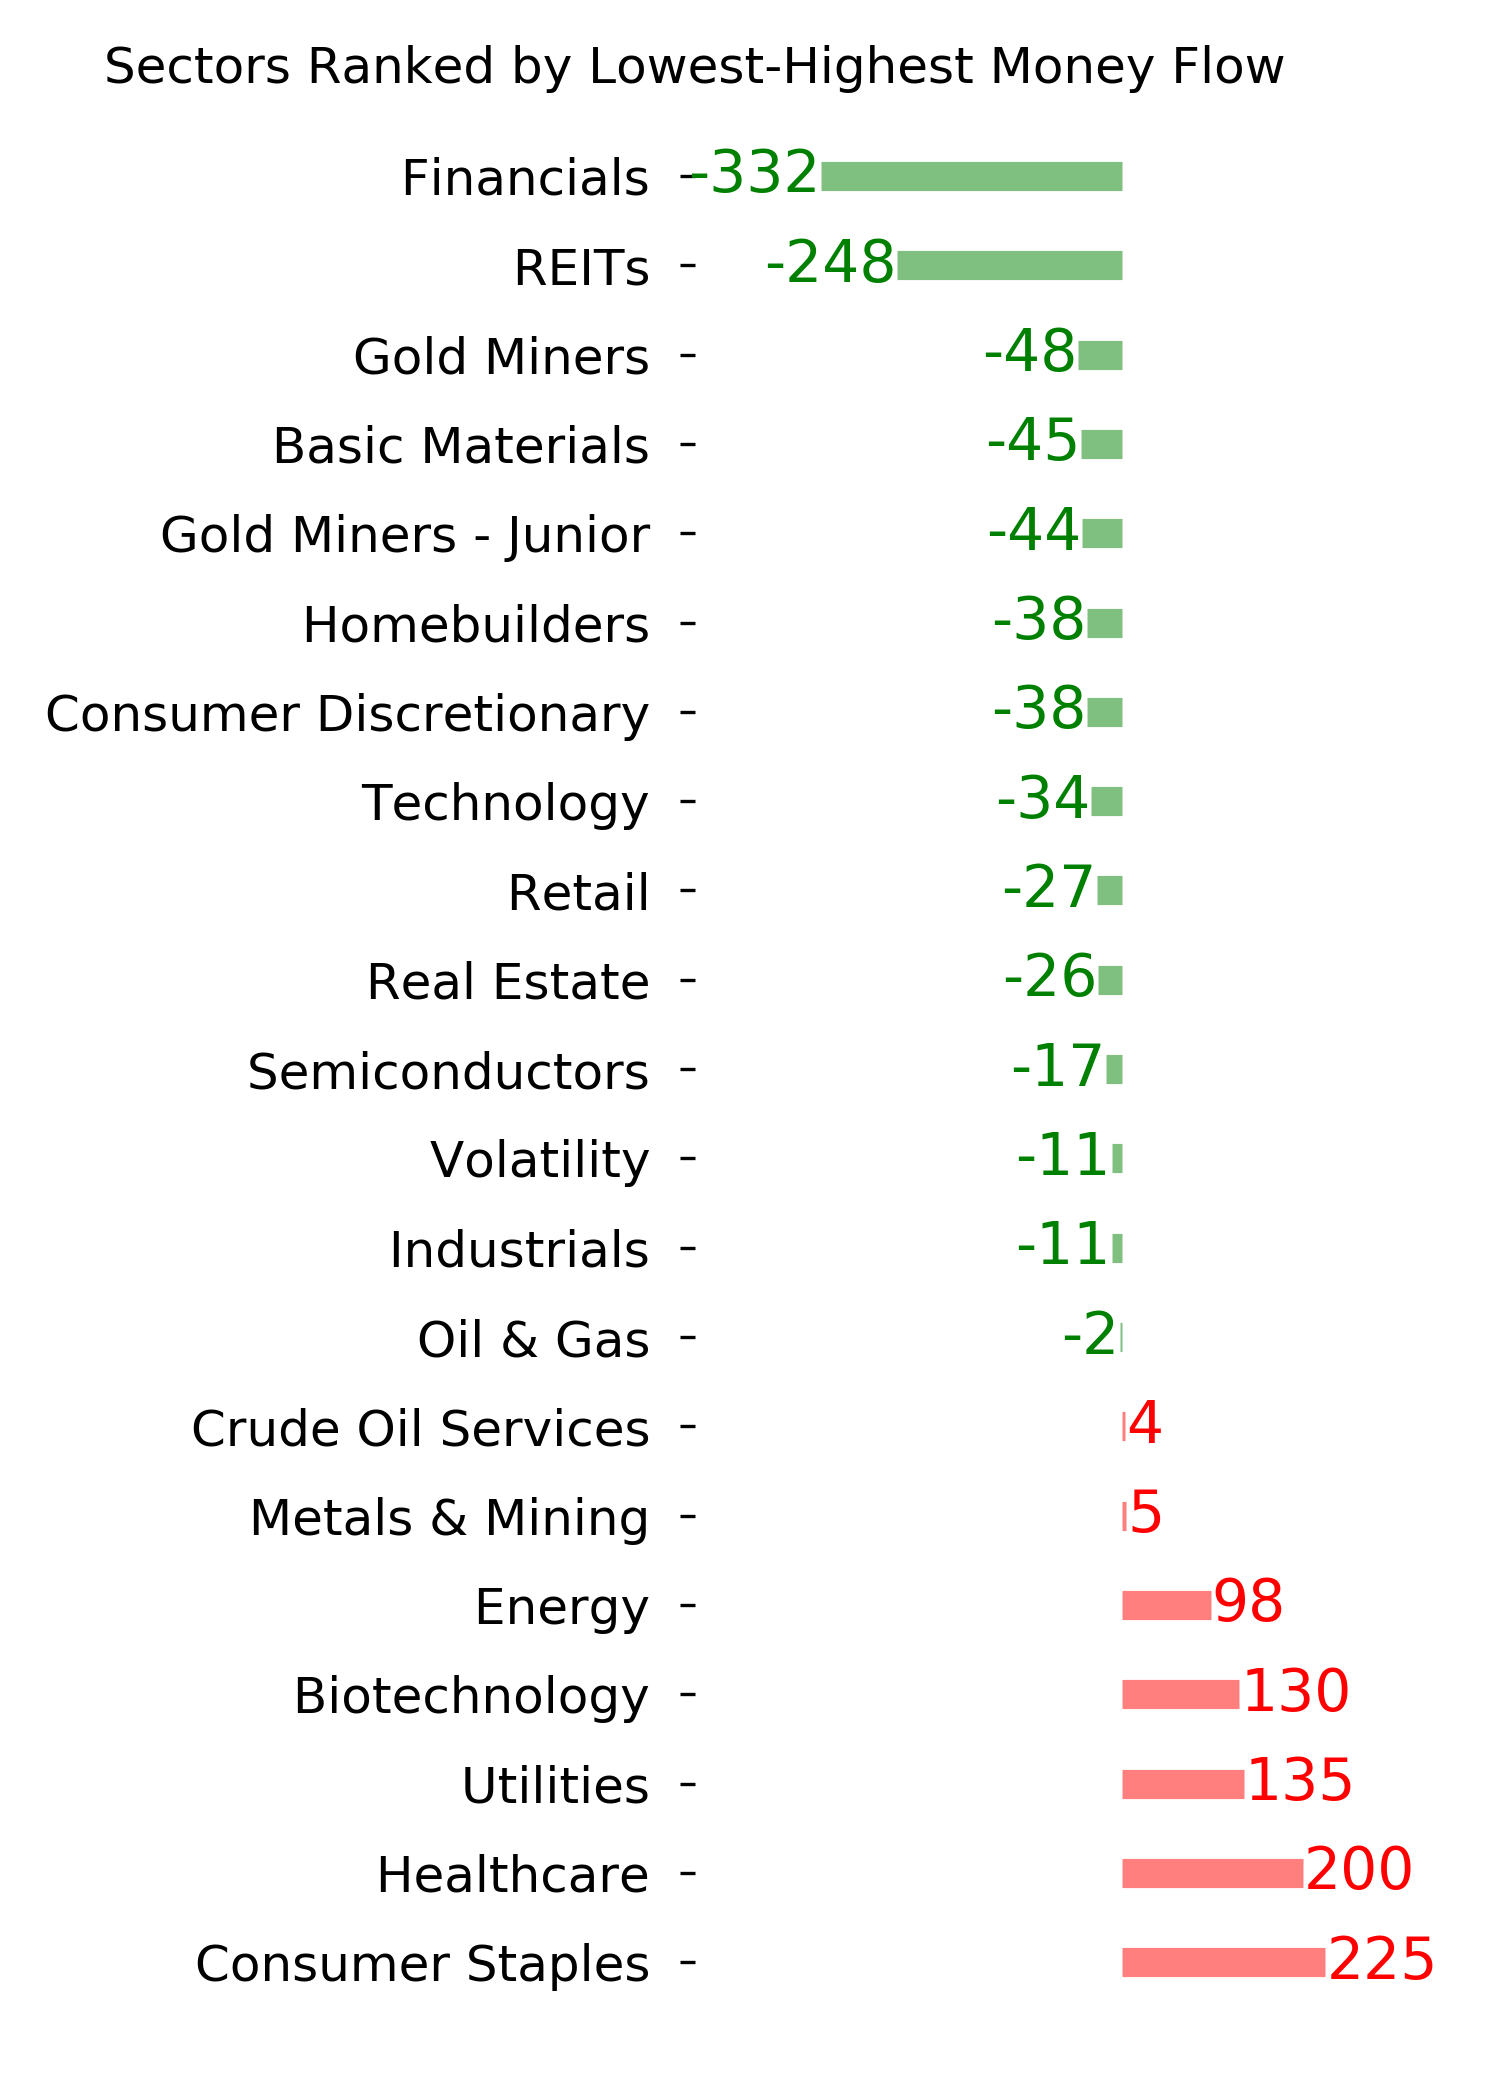
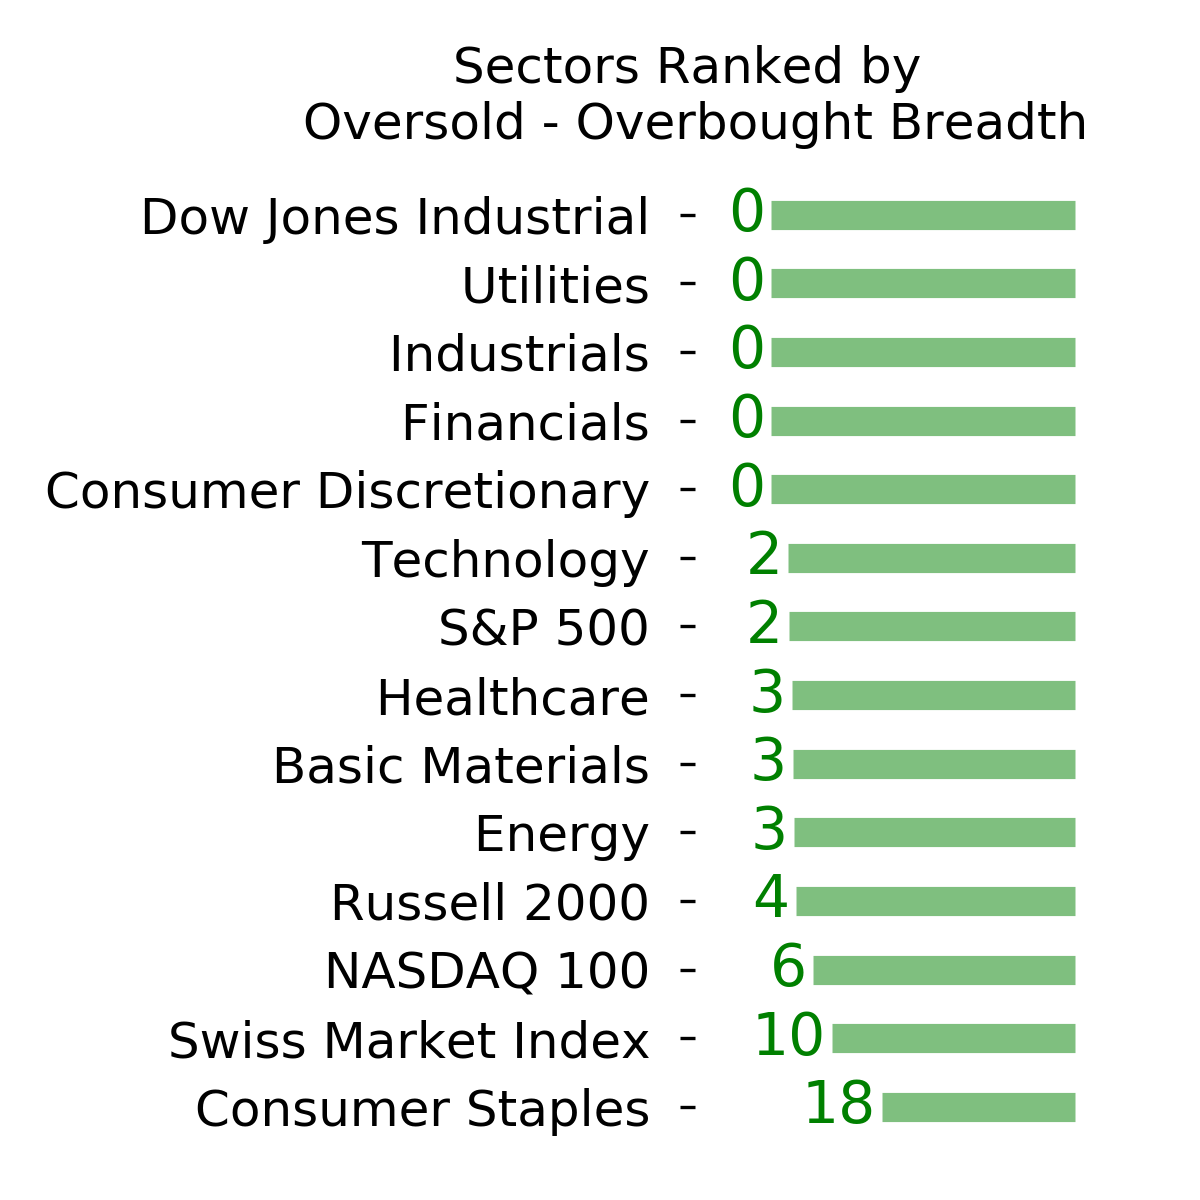
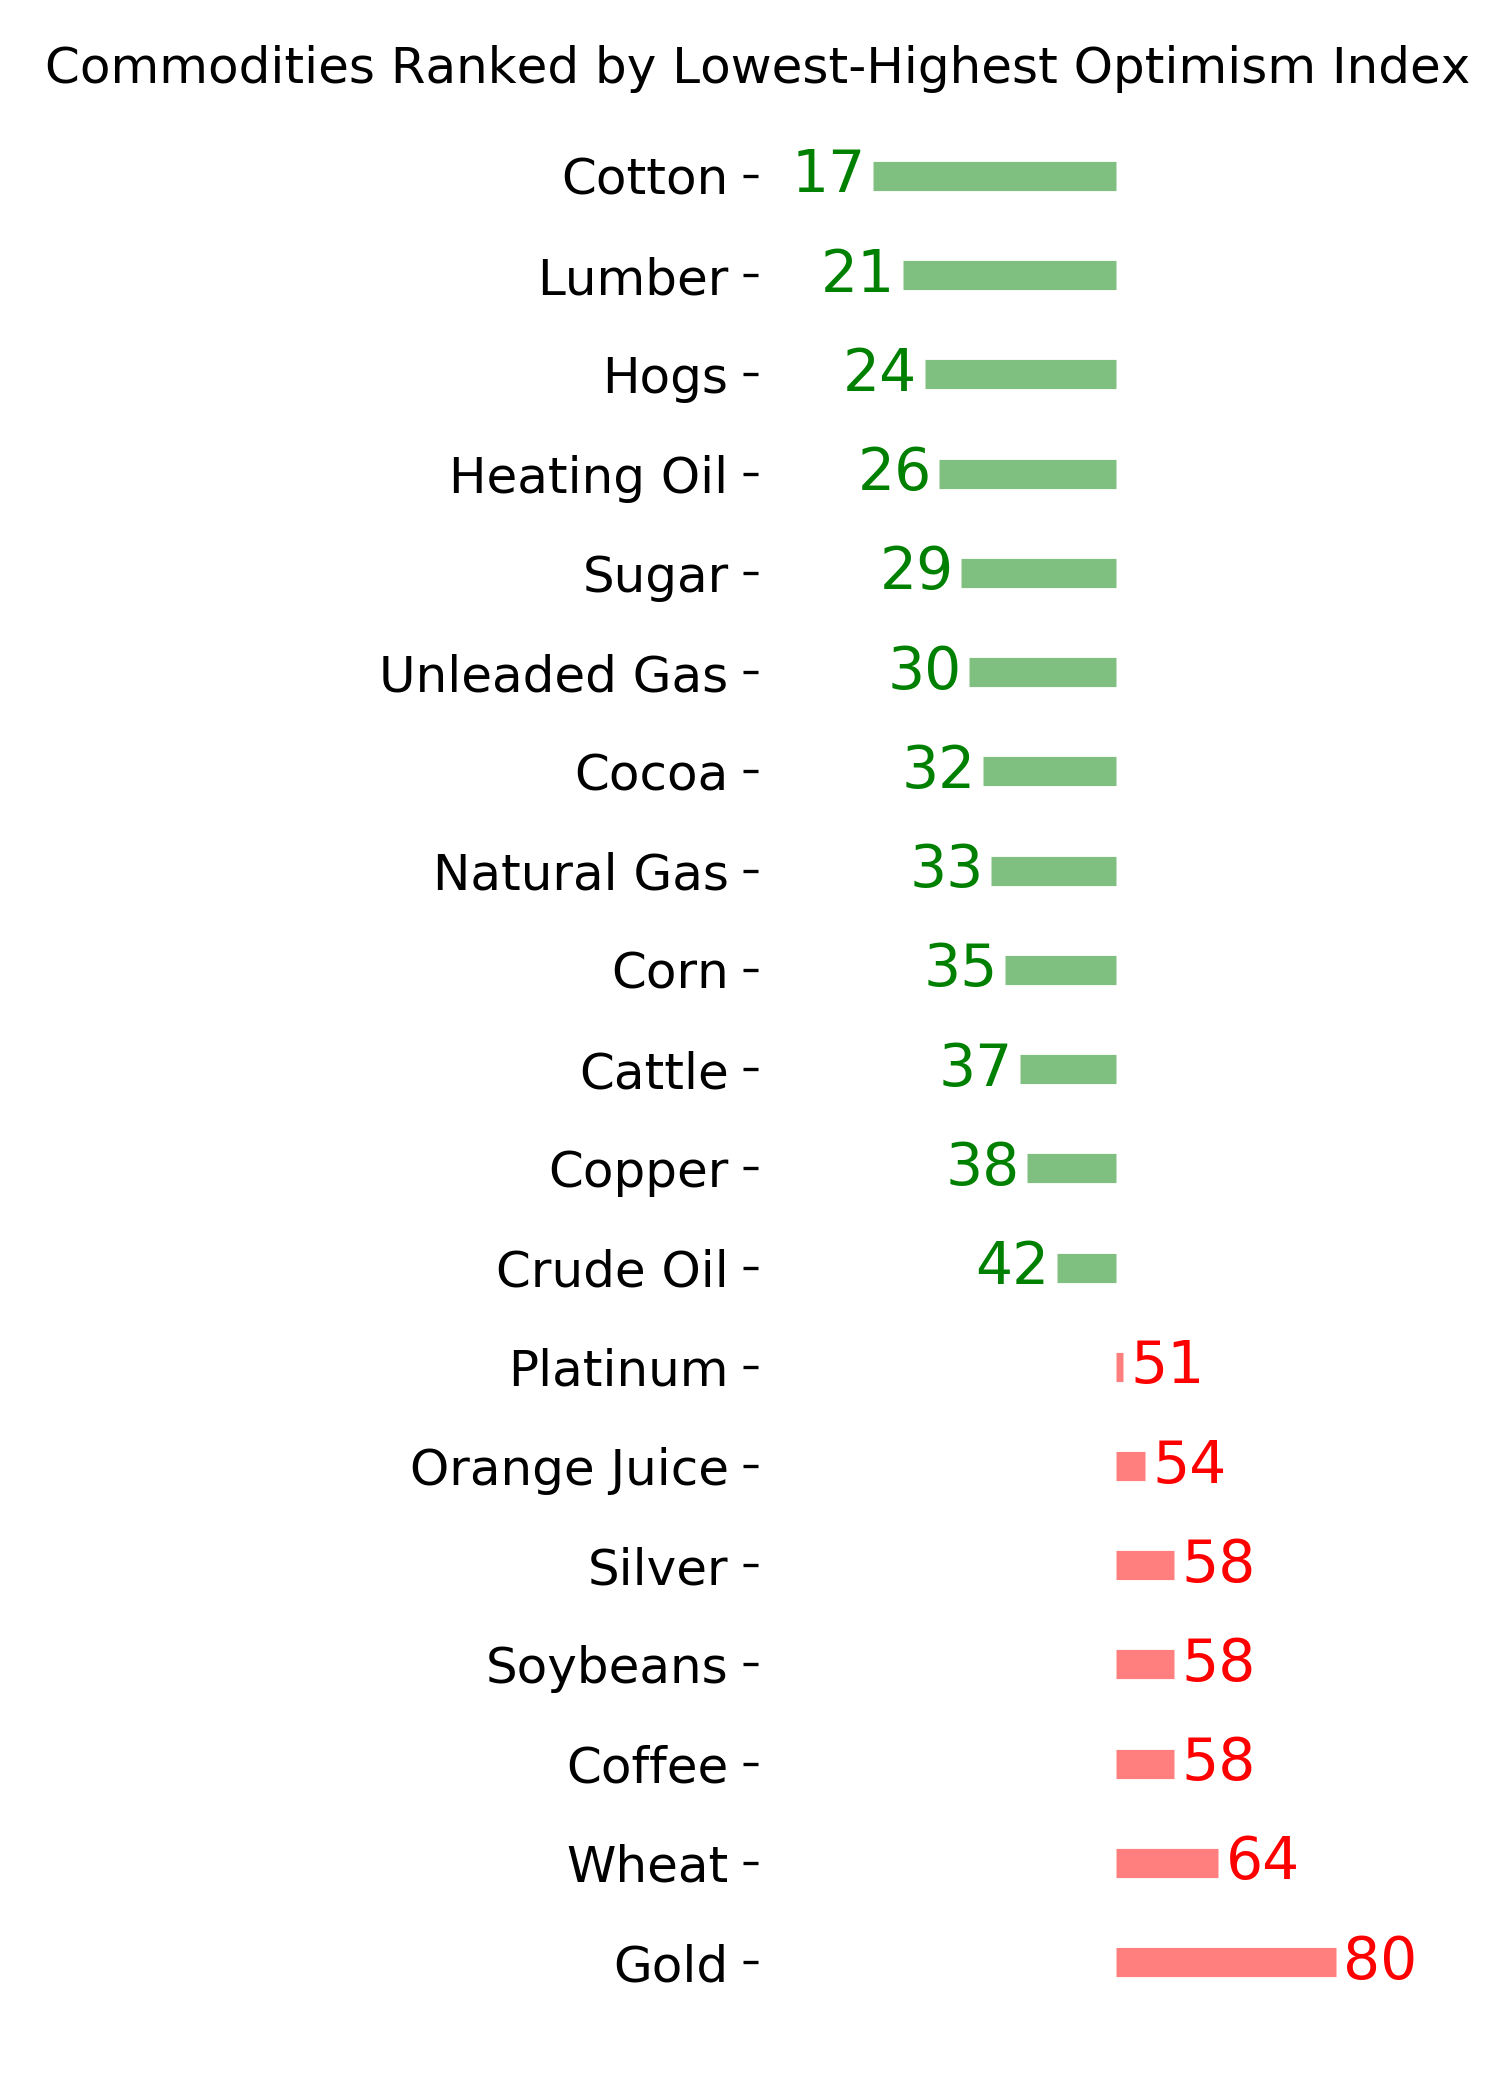
Ranks
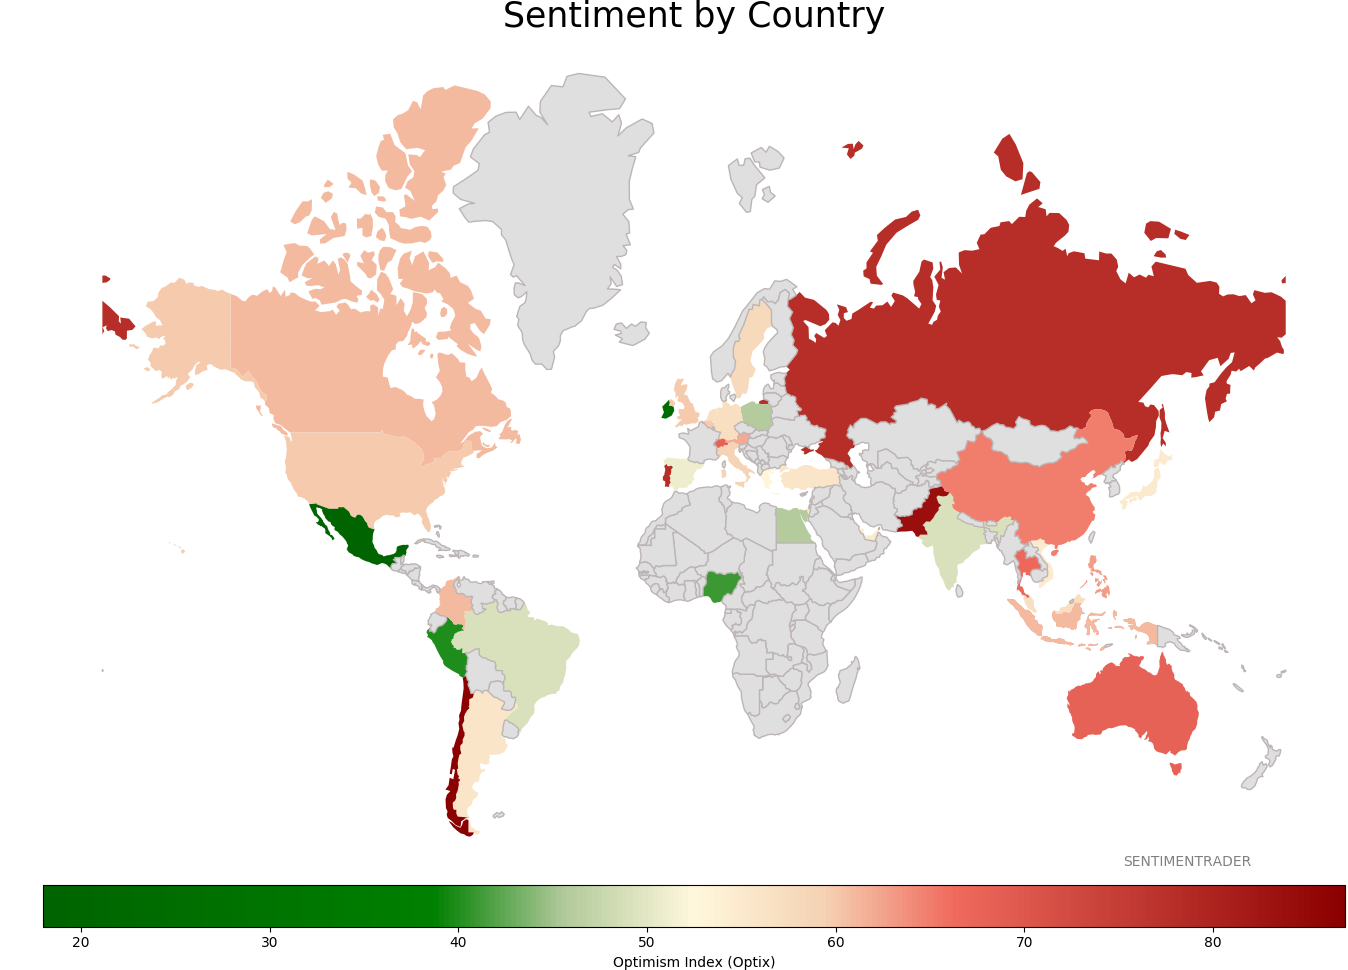
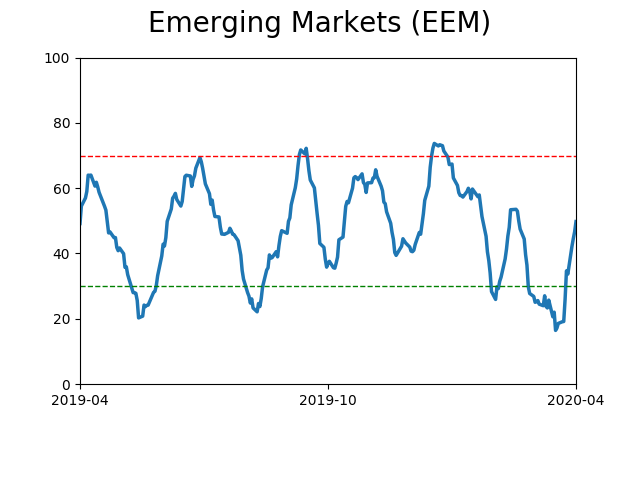
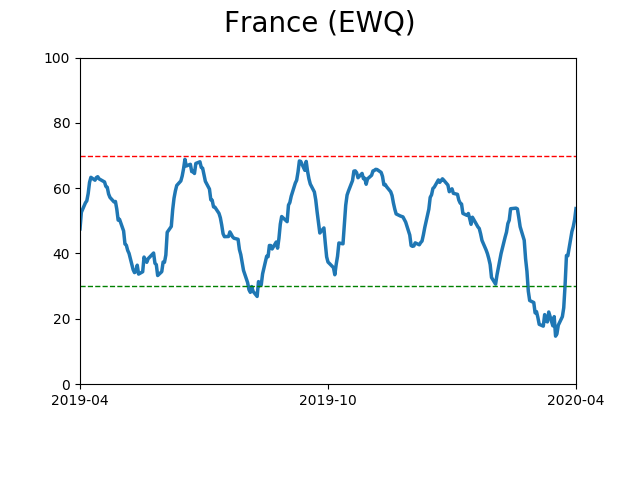
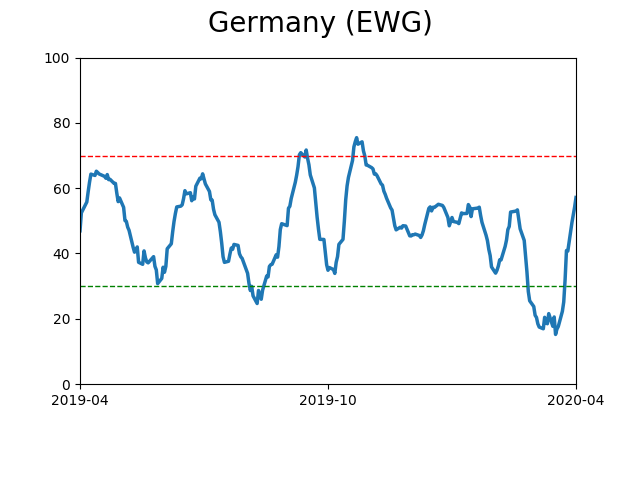
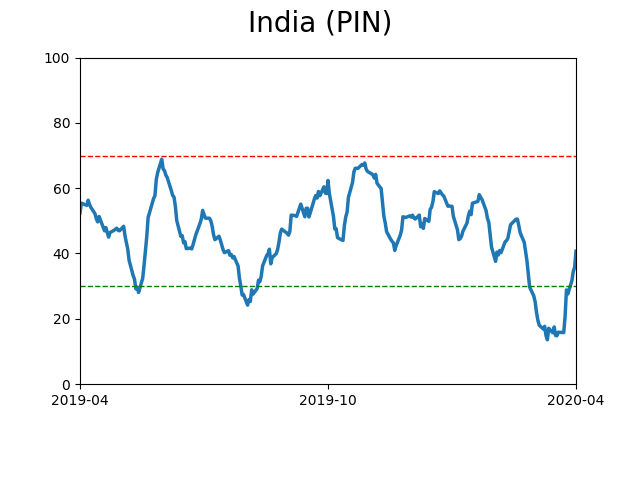
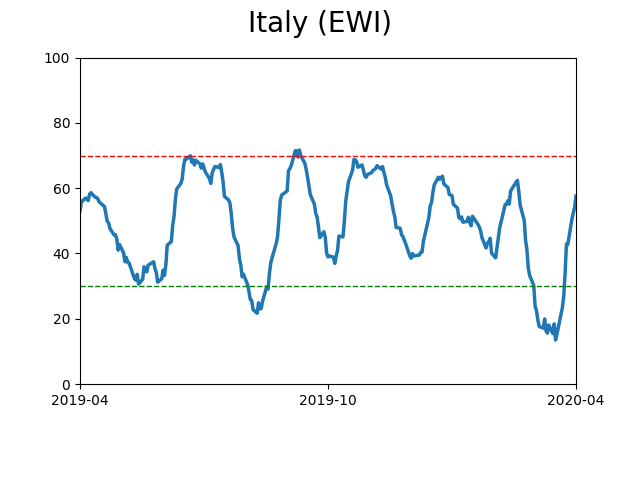
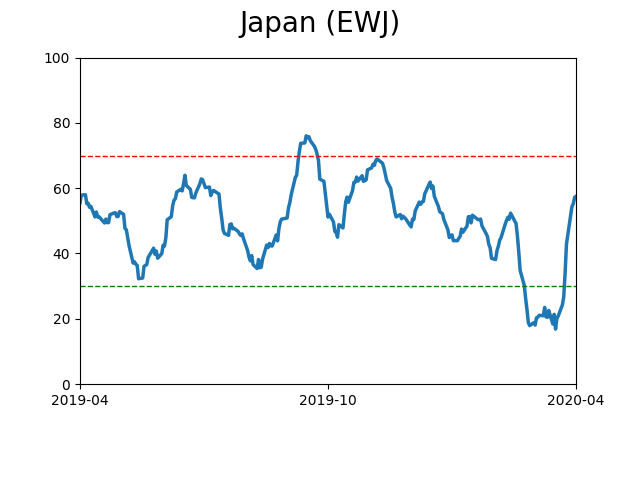
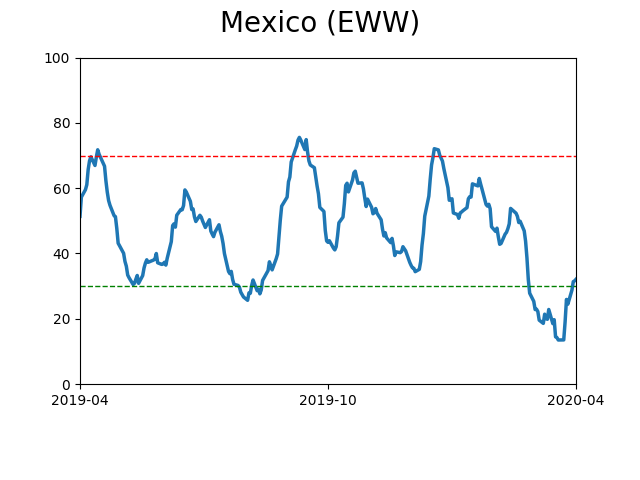
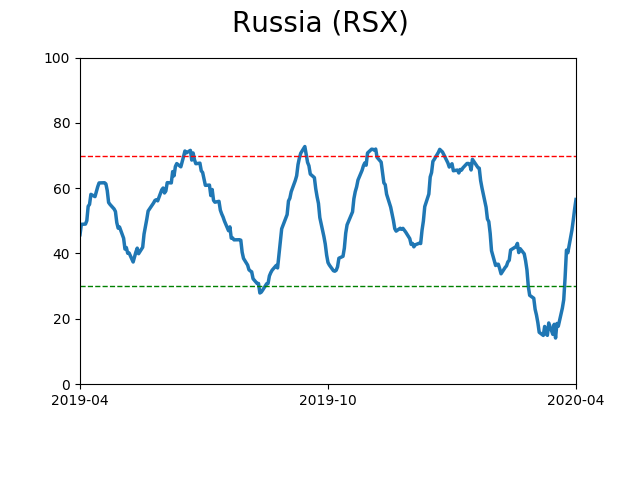
Sentiment Around The World
Optimism Index Thumbnails
|
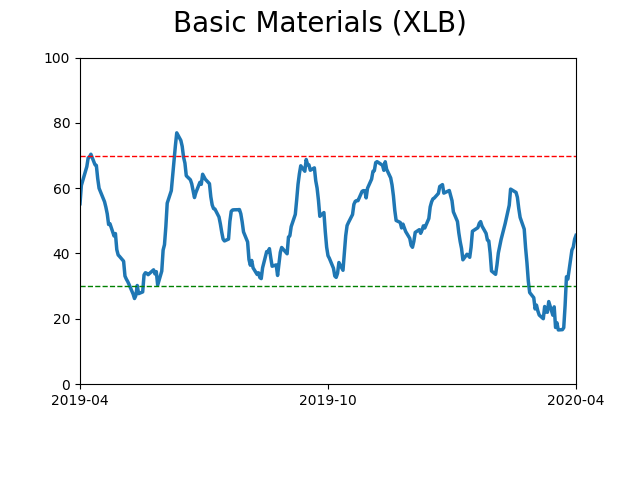
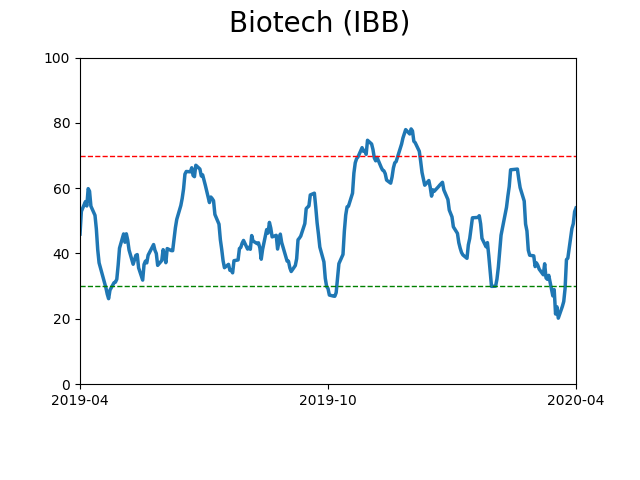
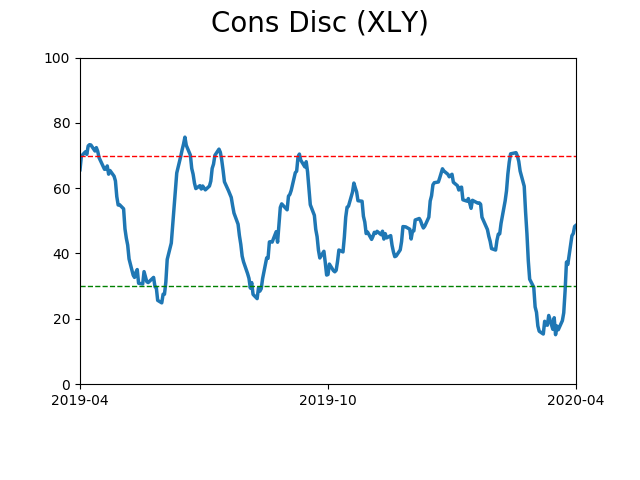
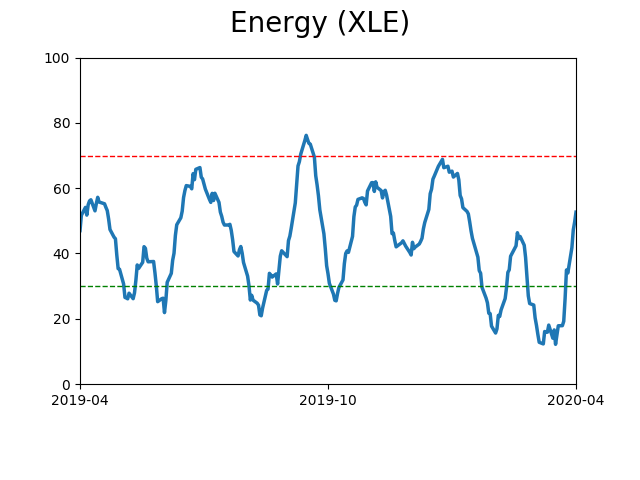
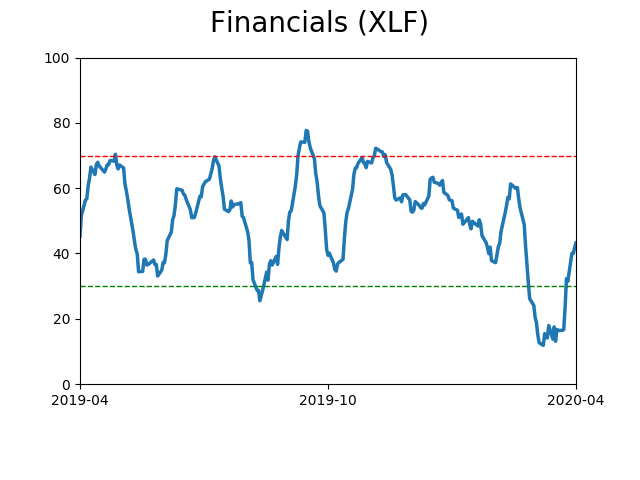
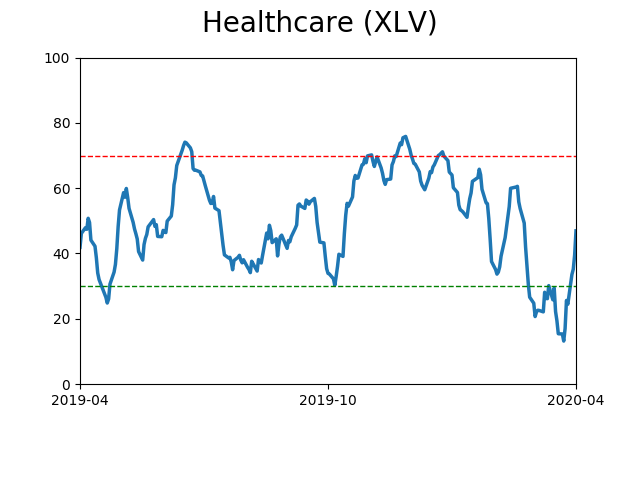
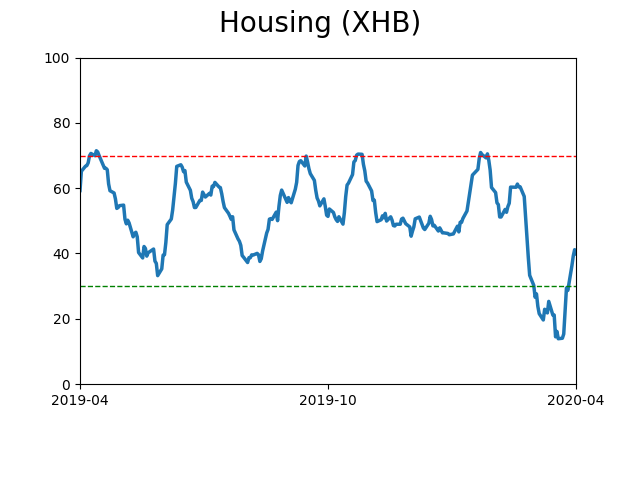
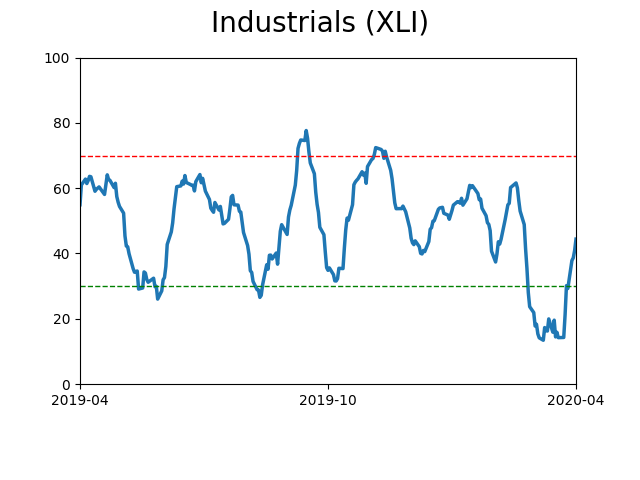
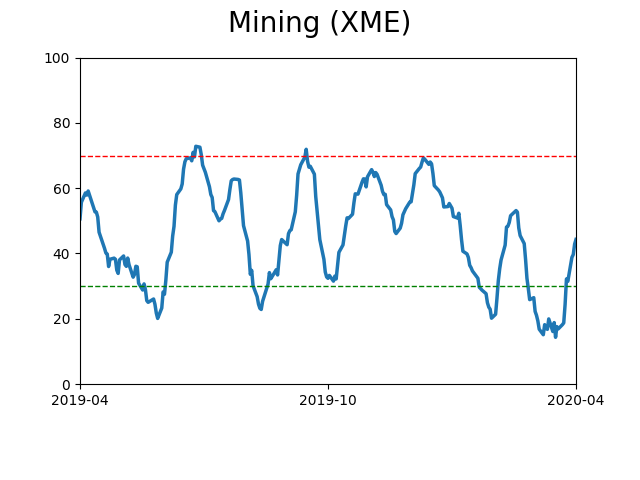
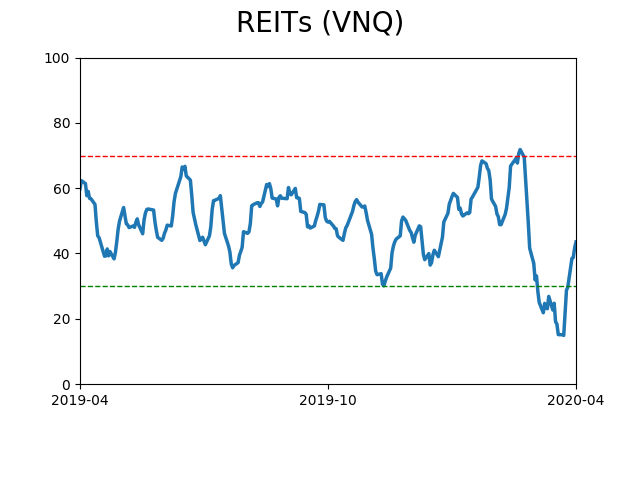
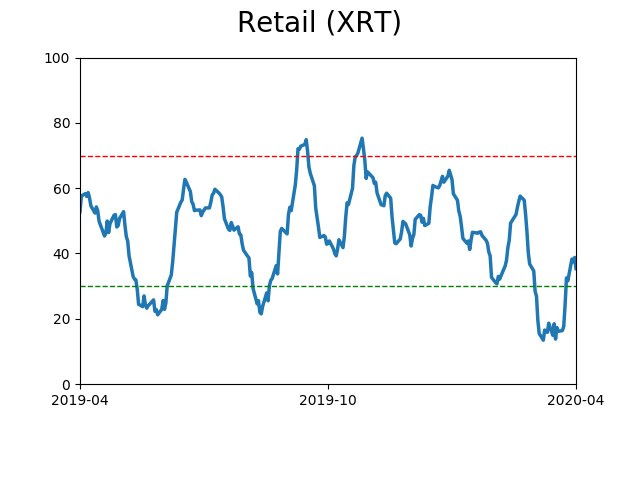
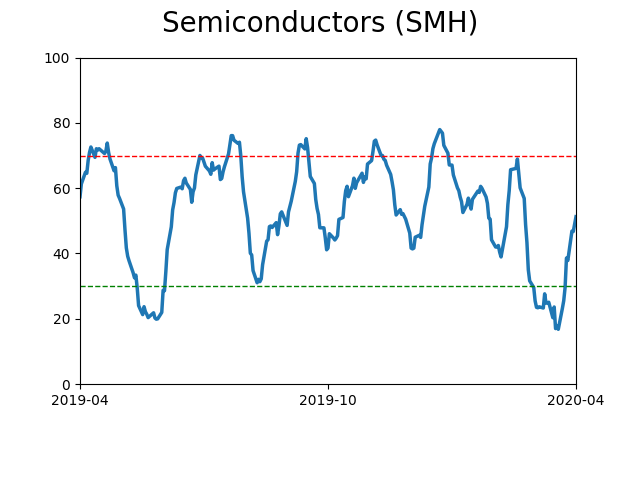
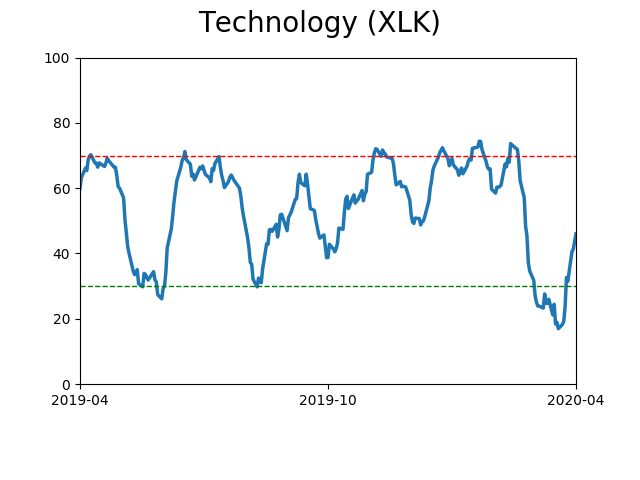
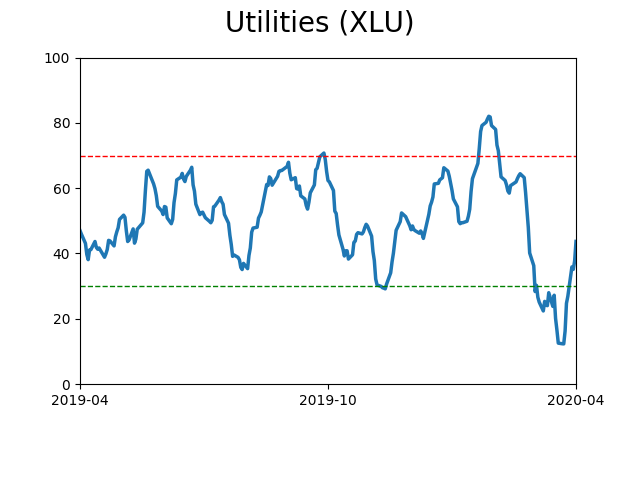
Sector ETF's - 10-Day Moving Average
|
|
|
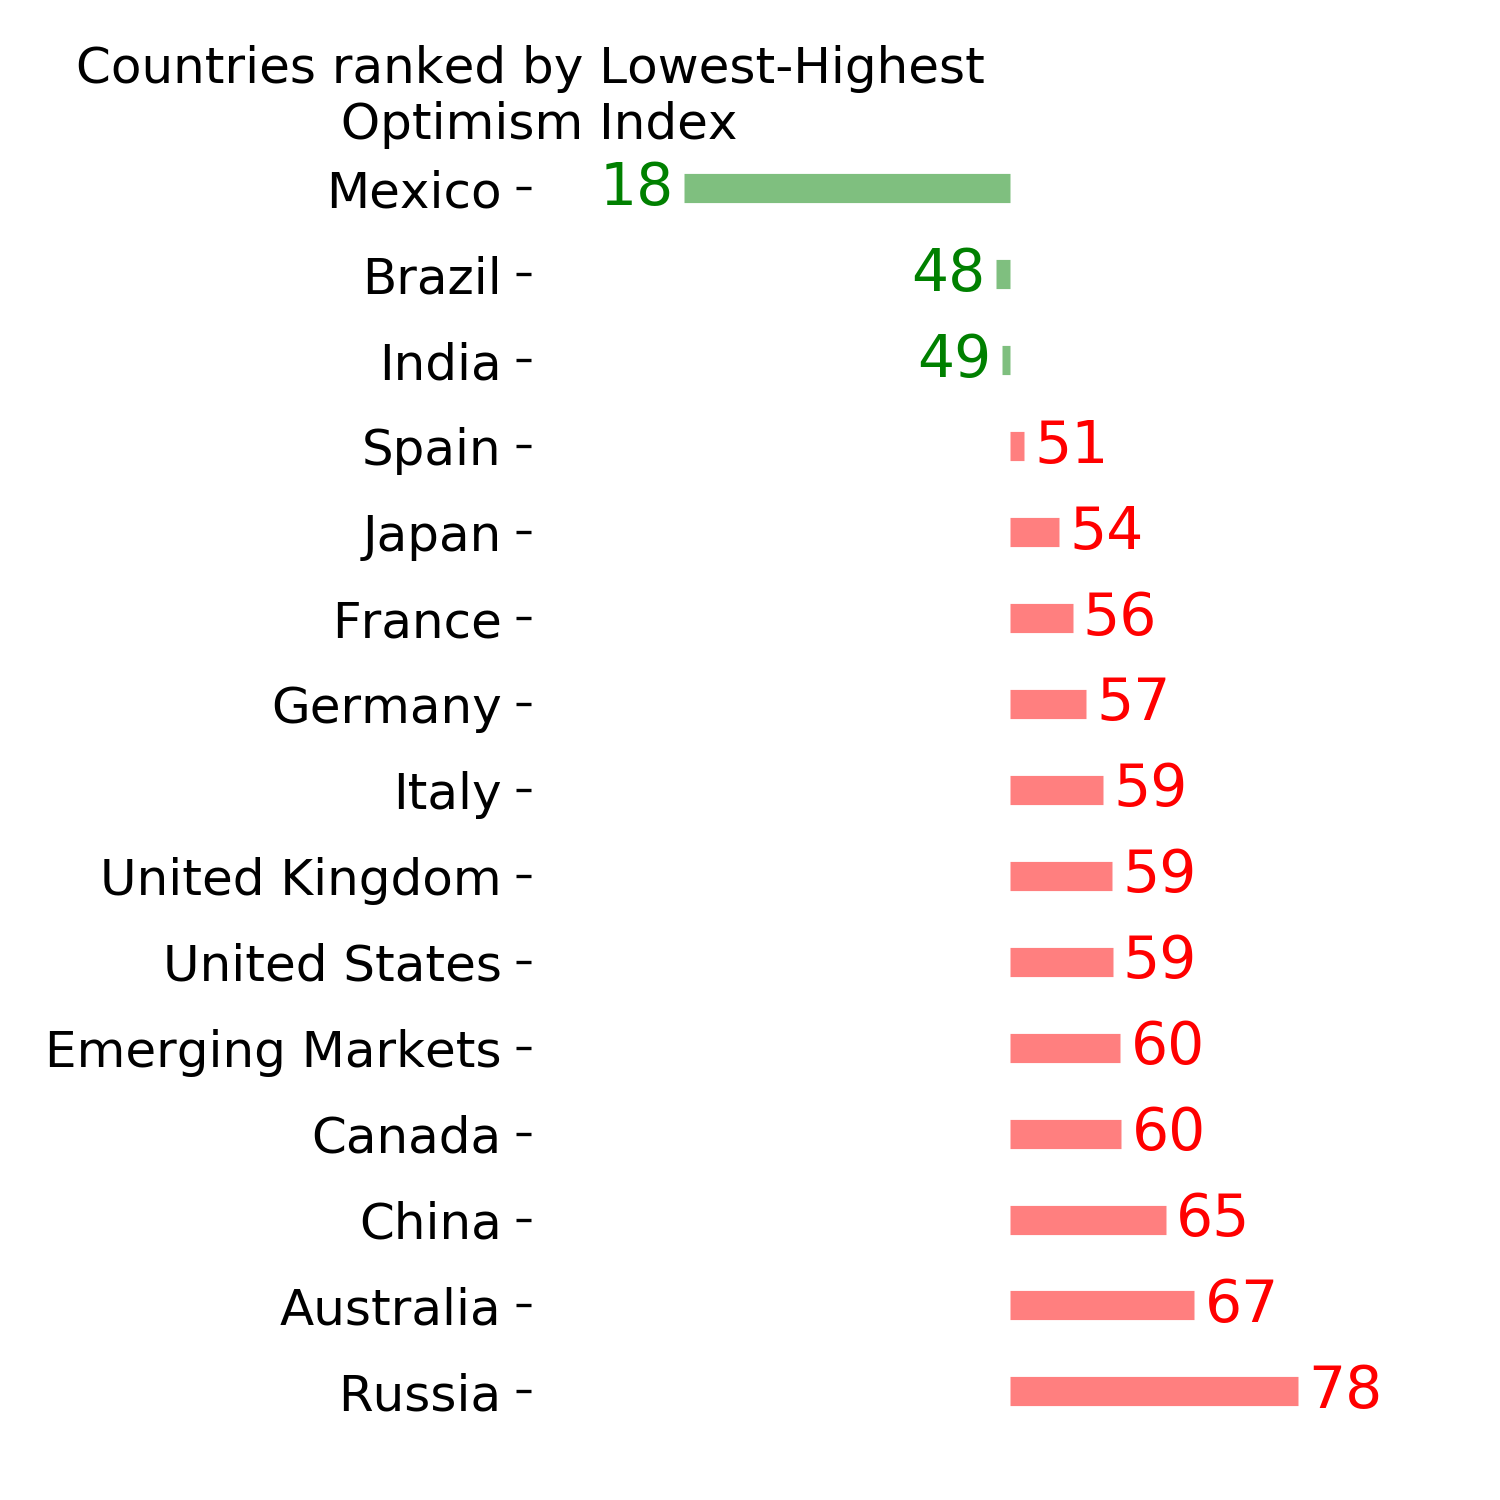
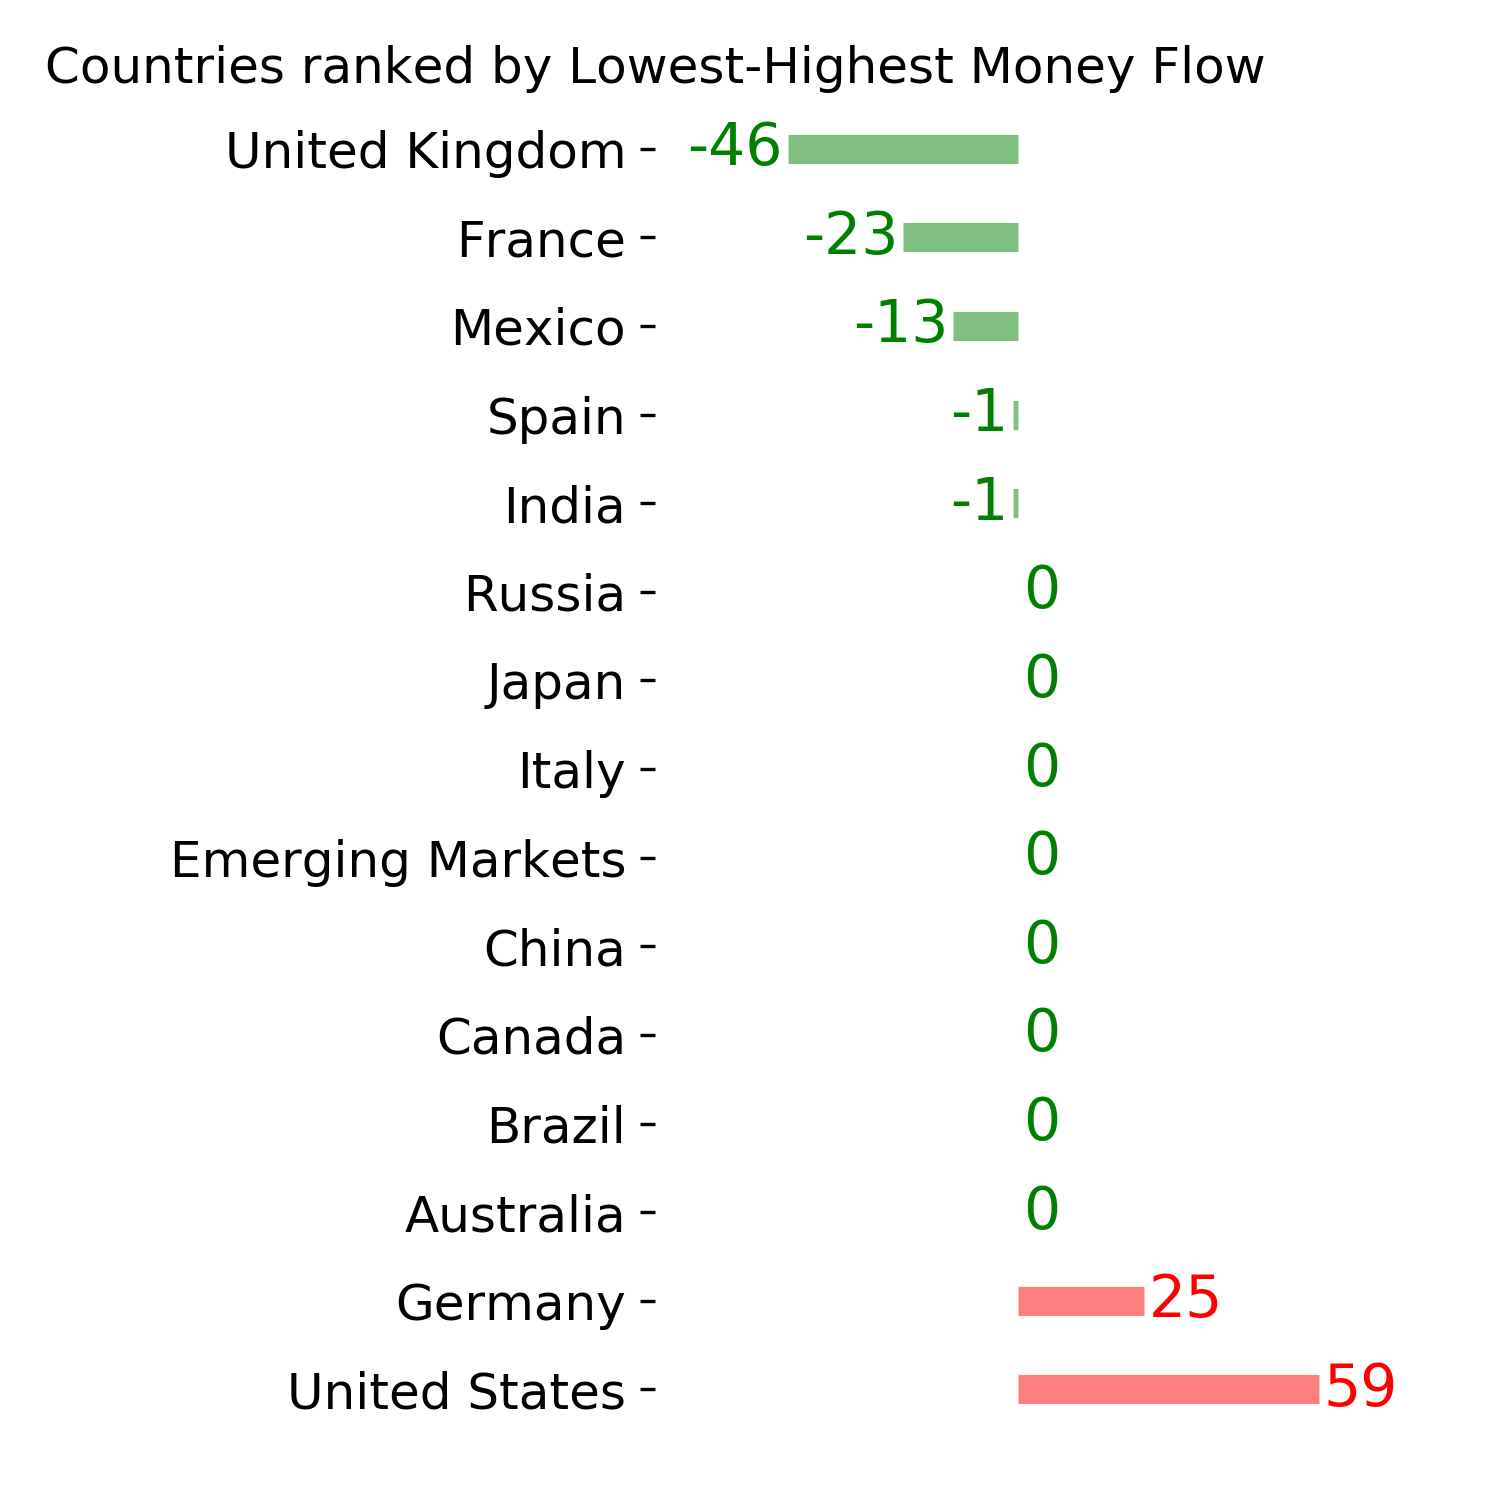
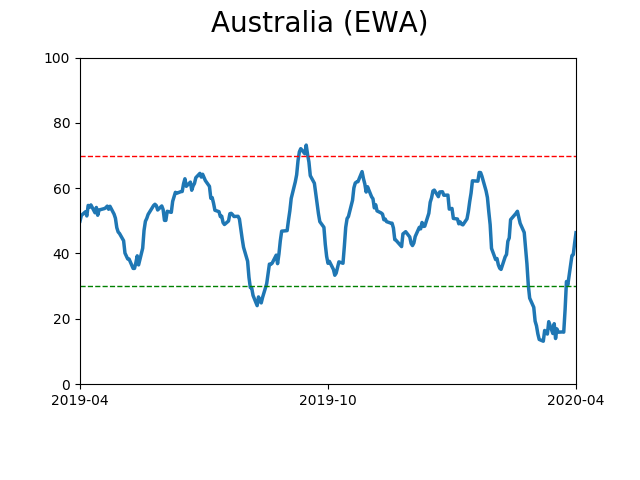
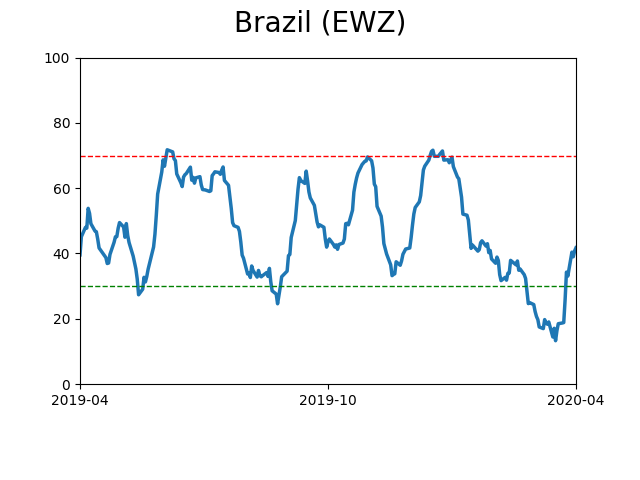
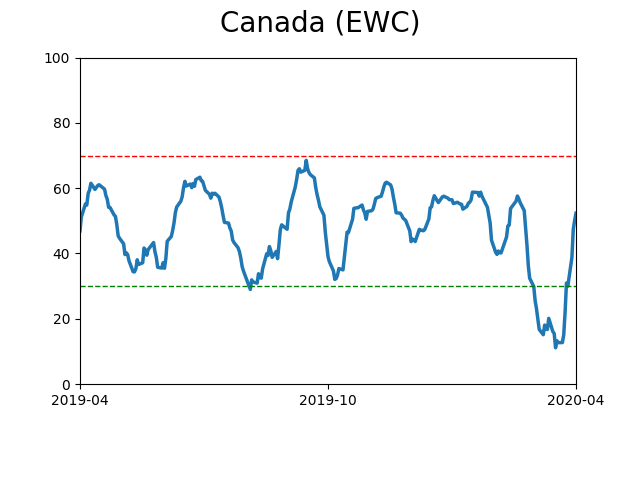
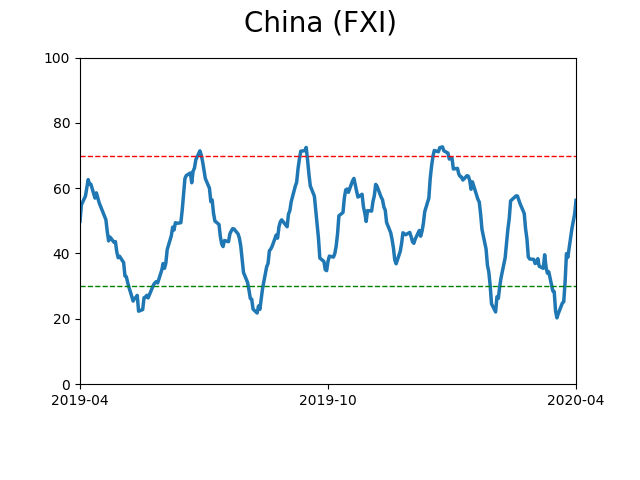
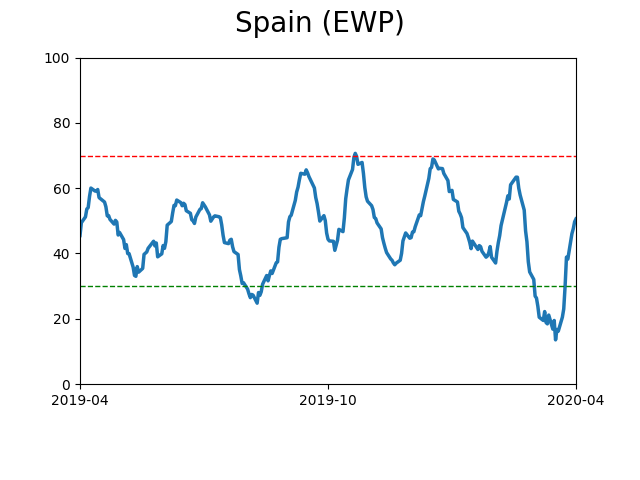
Country ETF's - 10-Day Moving Average
|
|
|
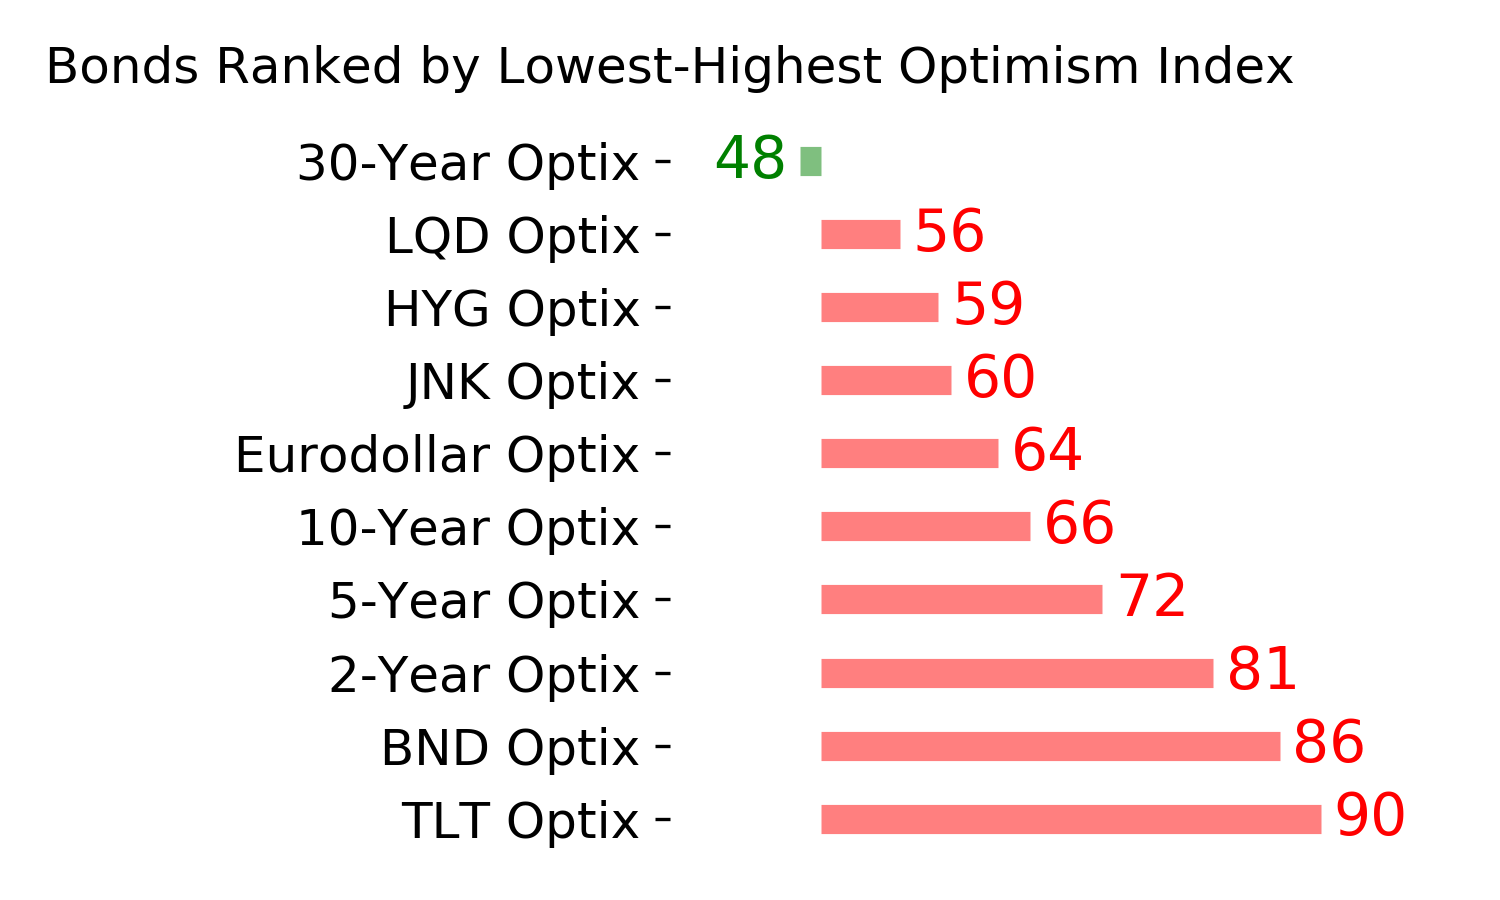
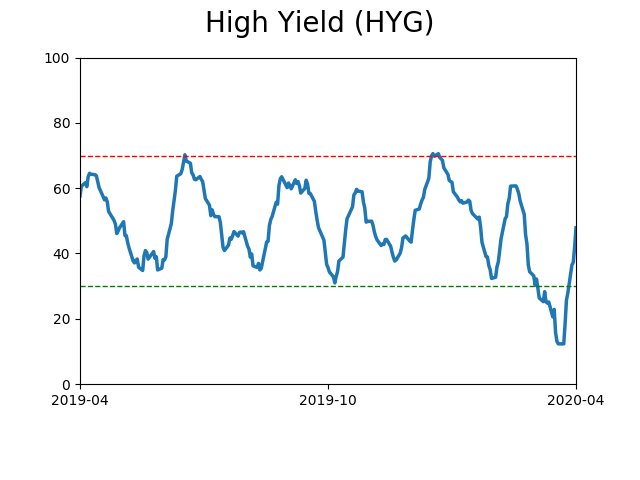
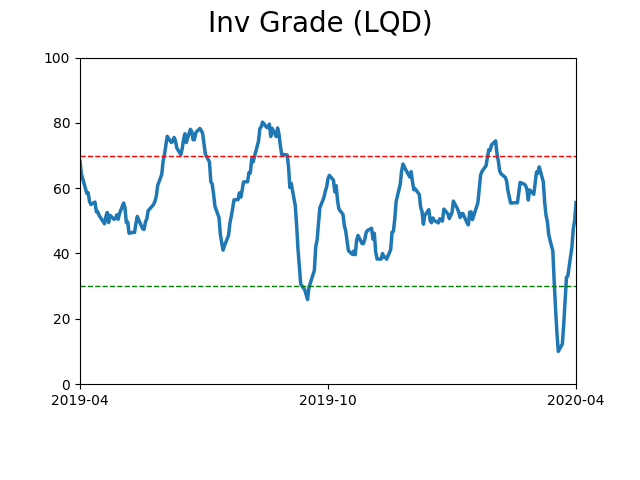
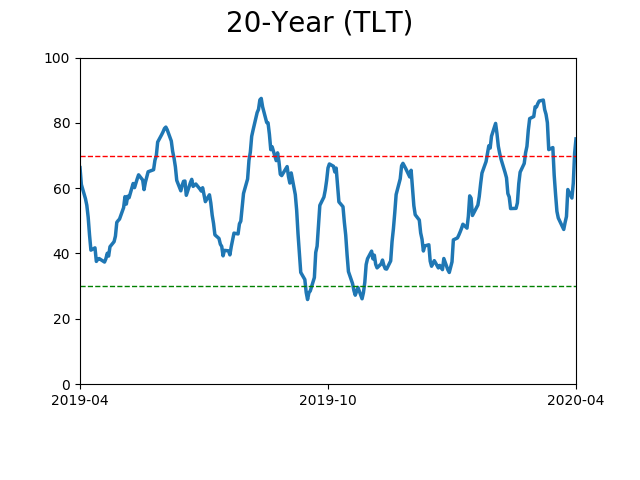
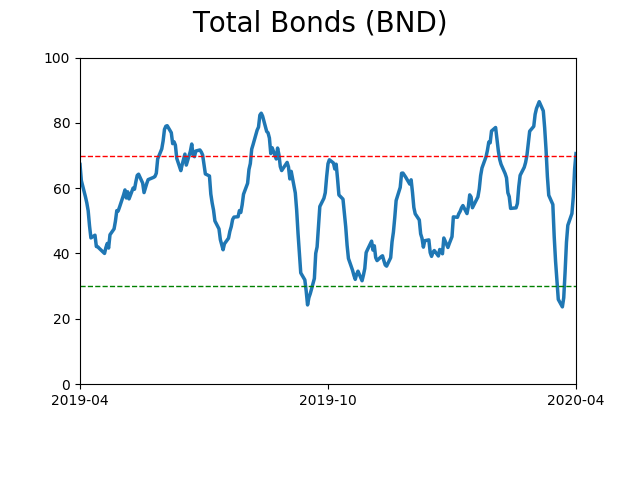
Bond ETF's - 10-Day Moving Average
|
|
|
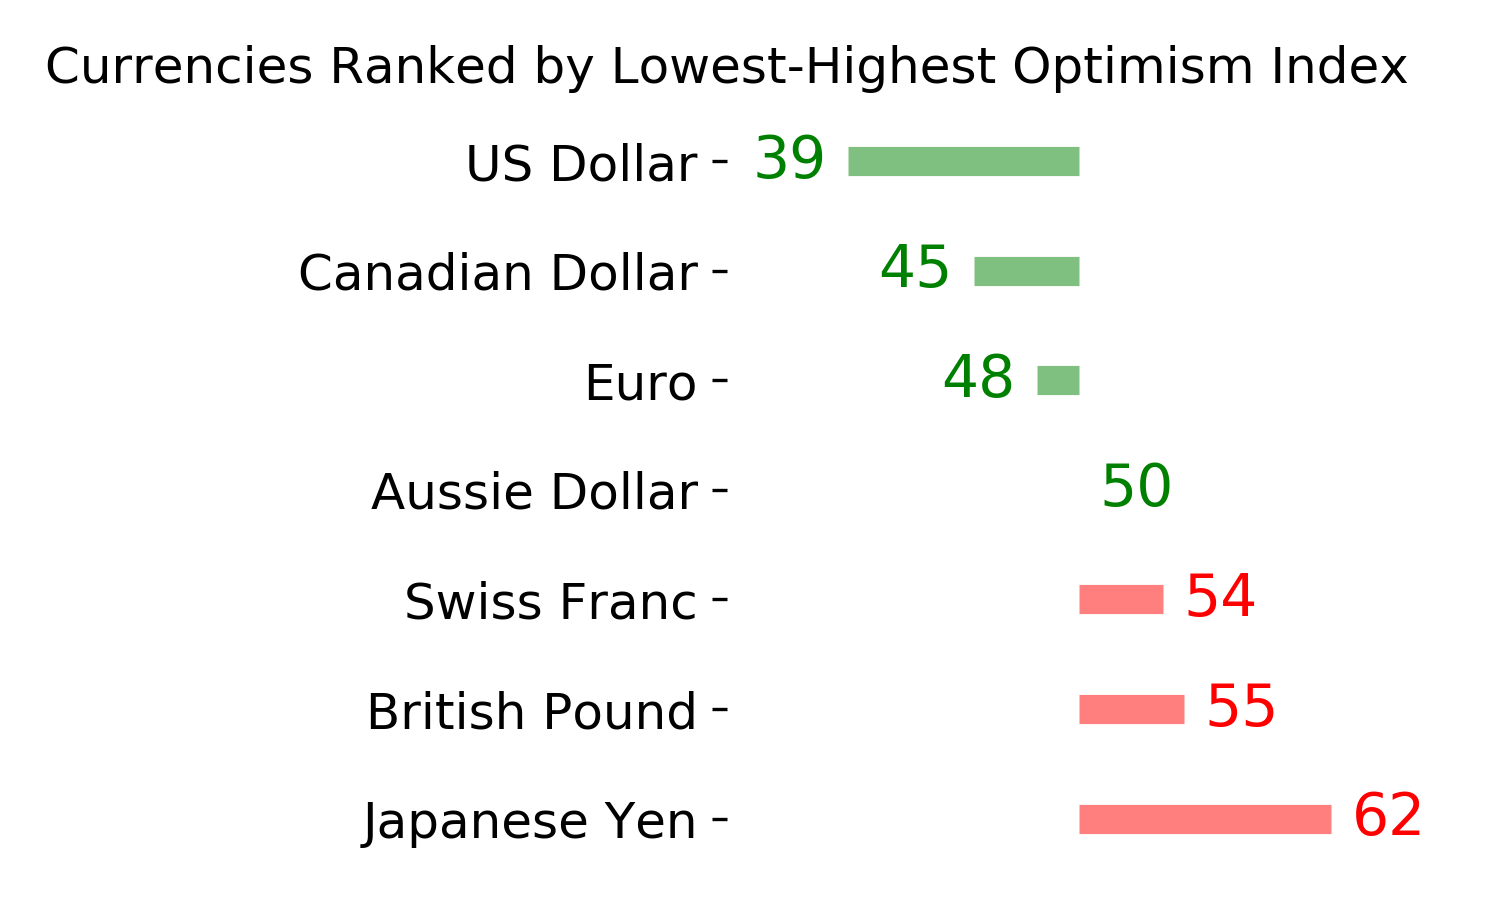
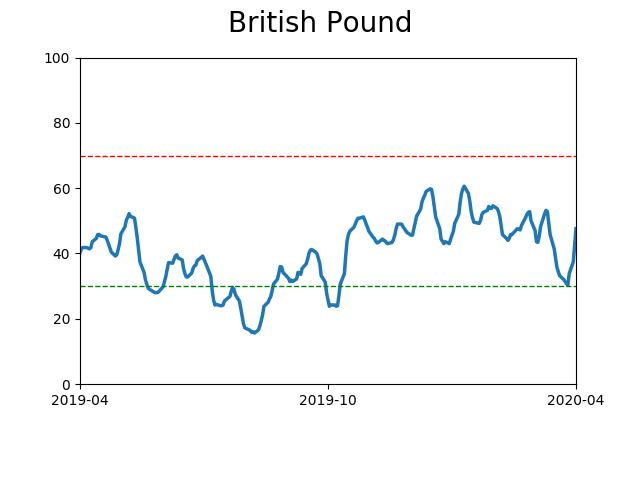
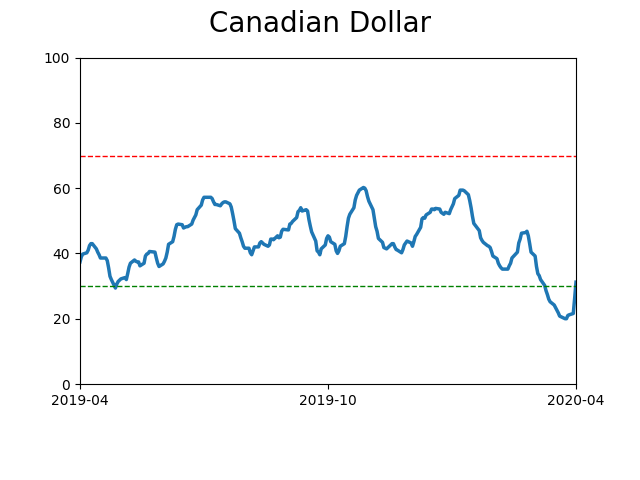
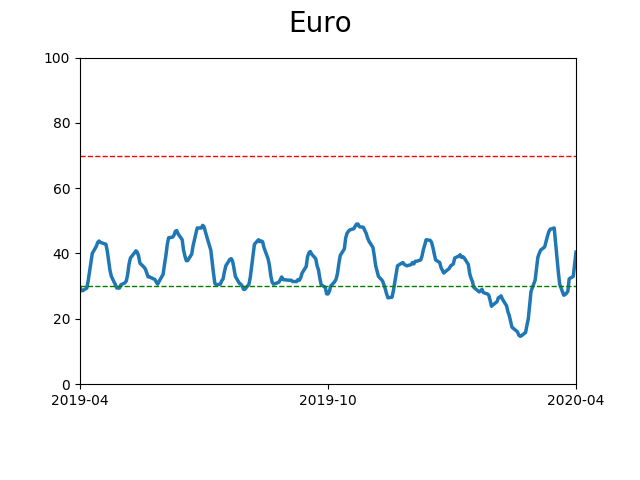
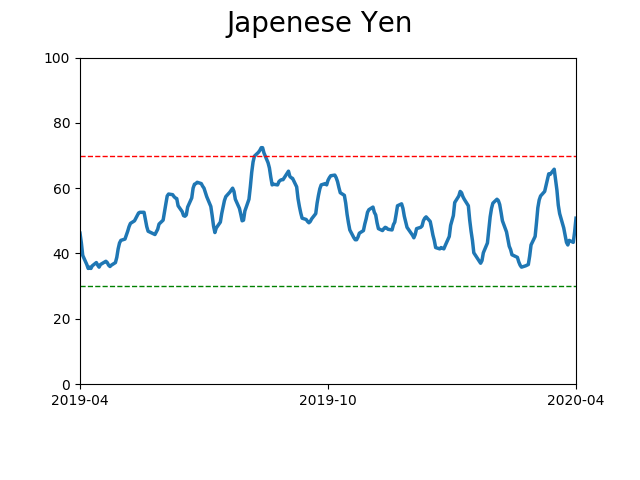
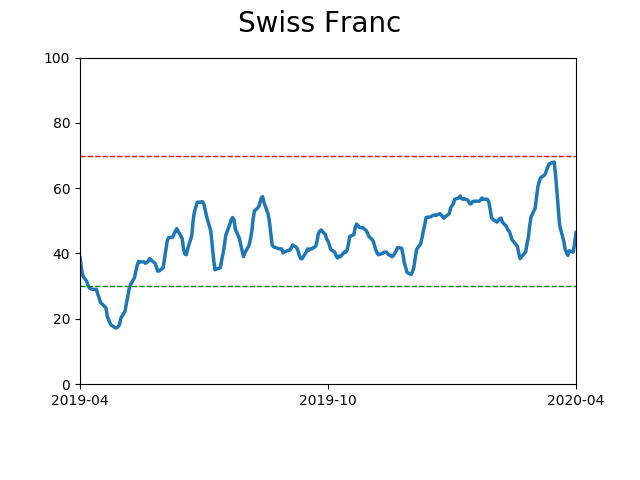
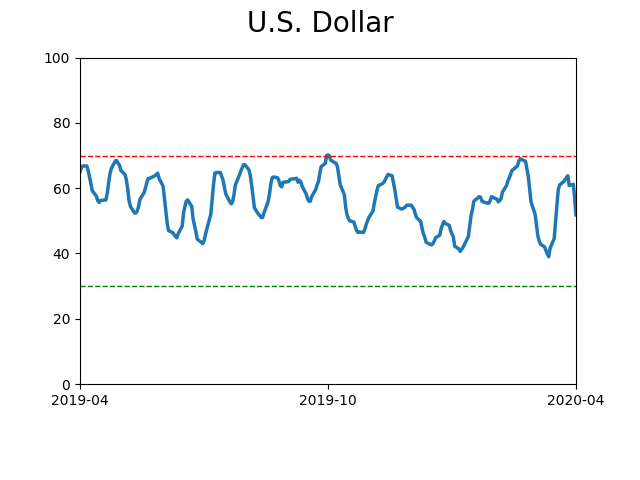
Currency ETF's - 5-Day Moving Average
|
|
|
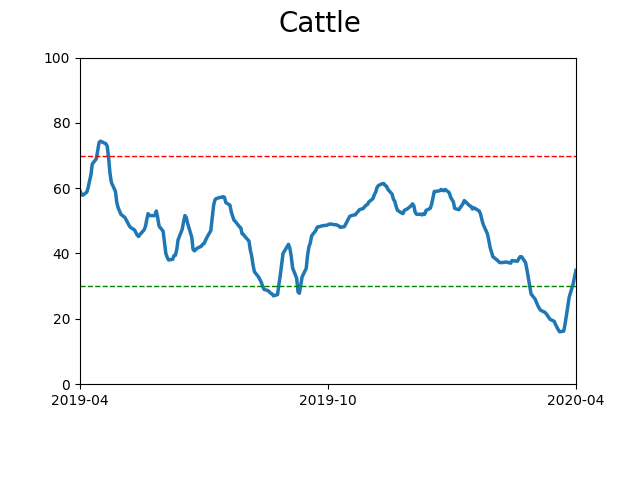
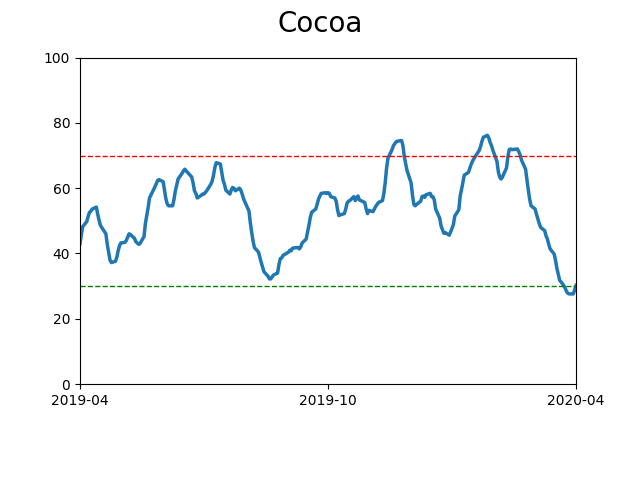
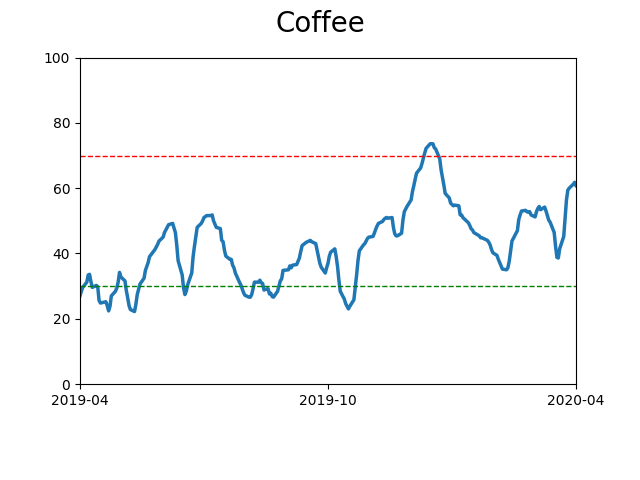
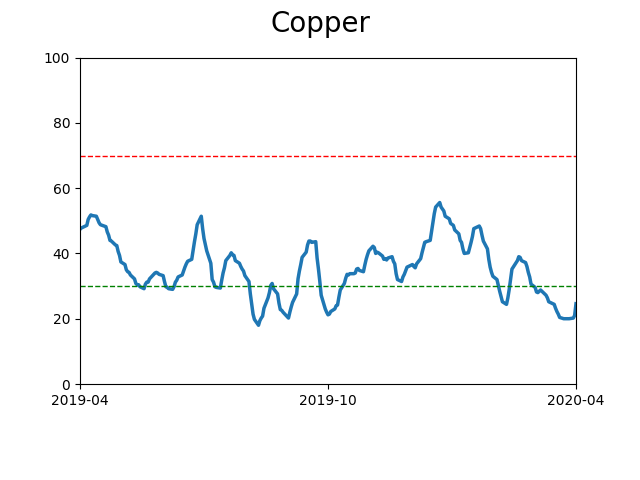
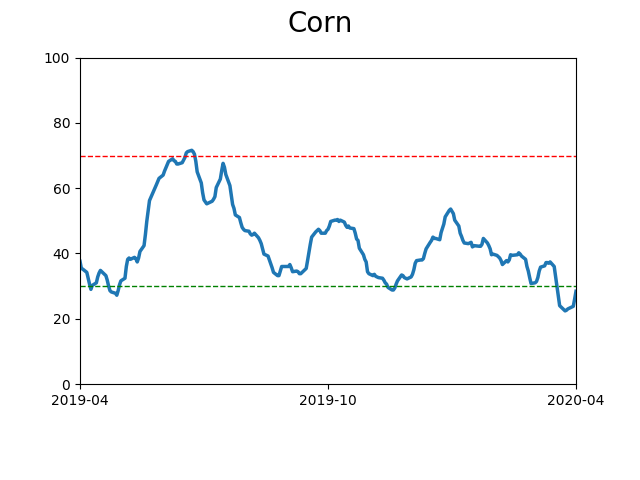
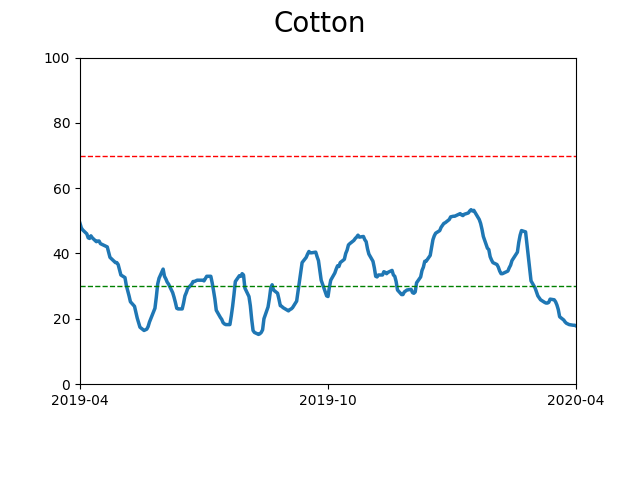
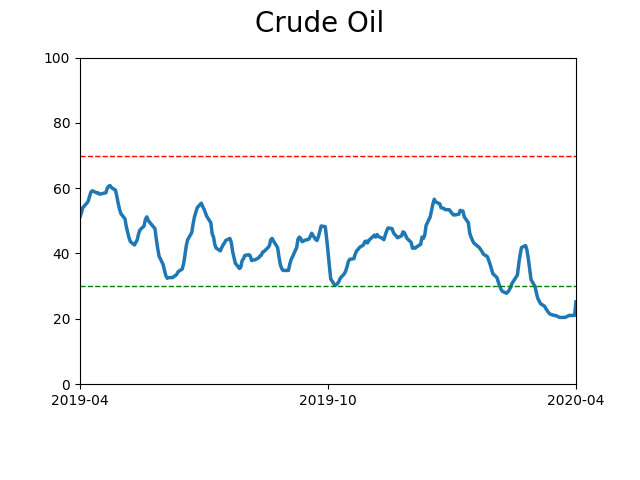
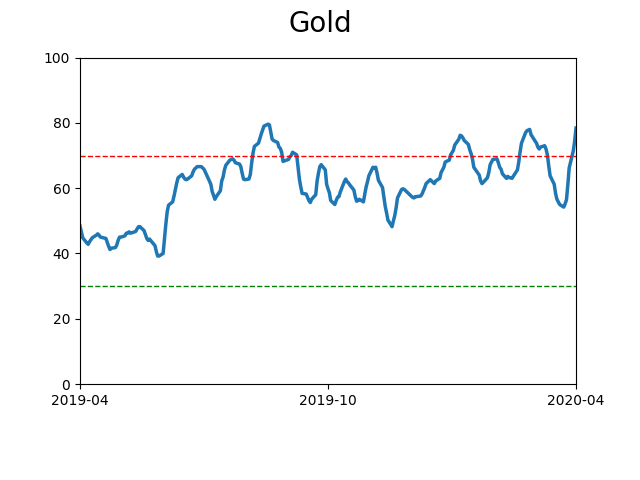
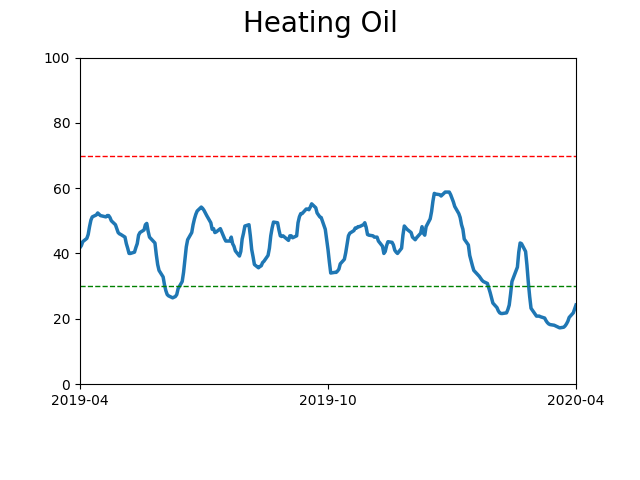
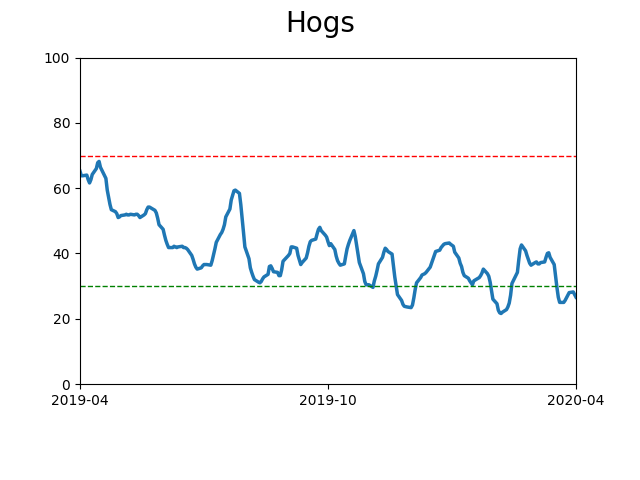
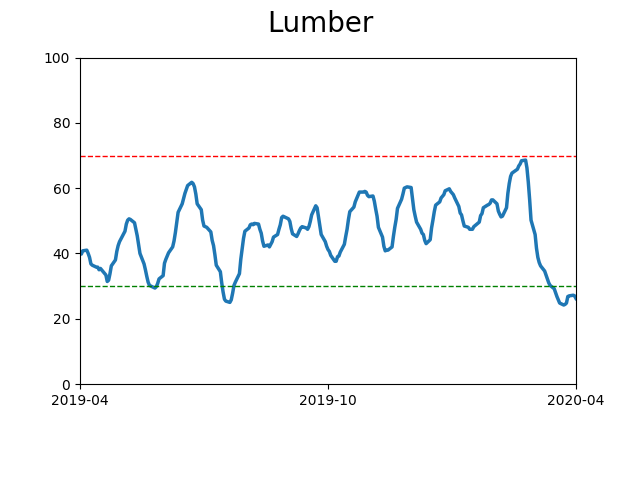
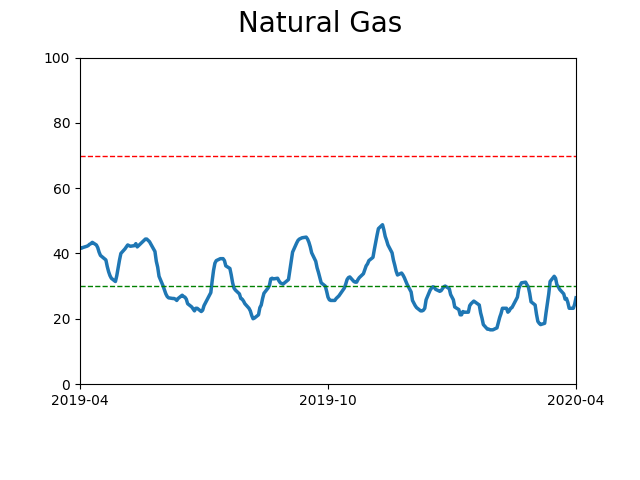
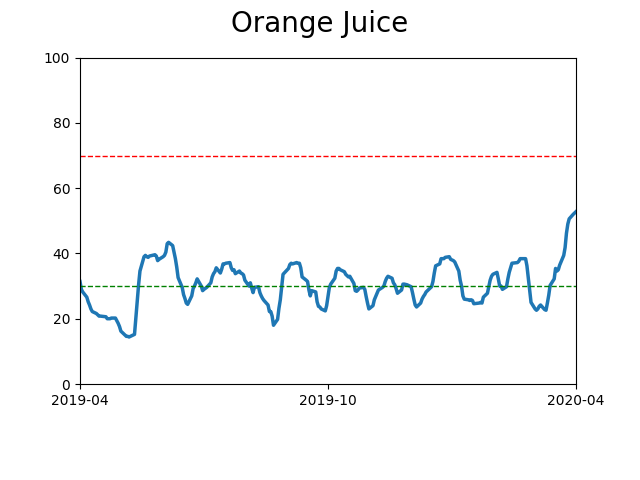
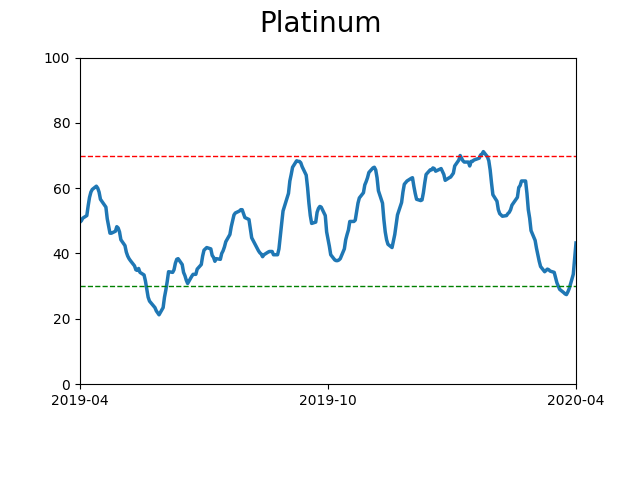
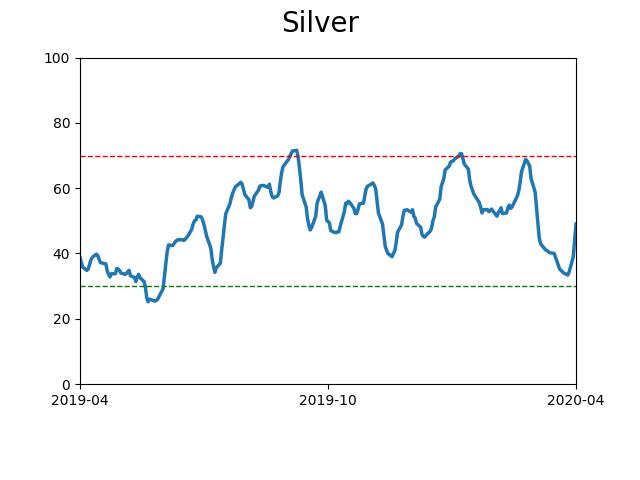
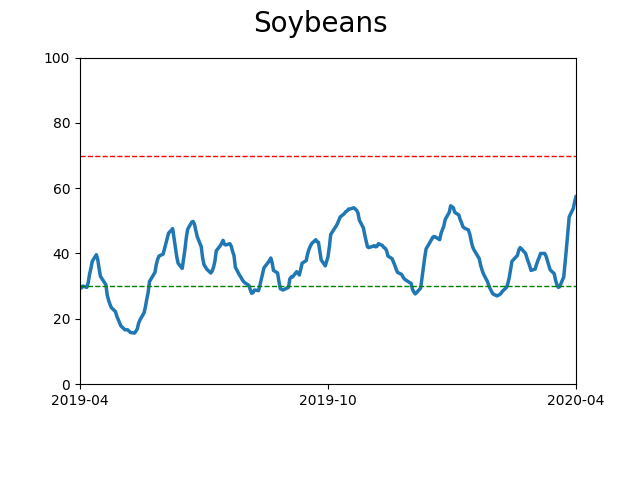
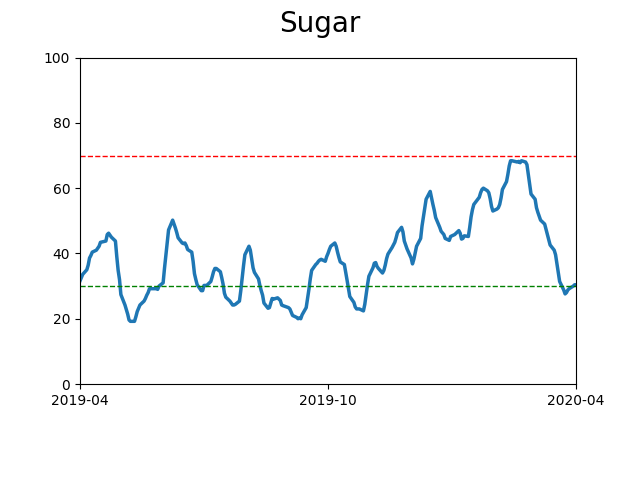
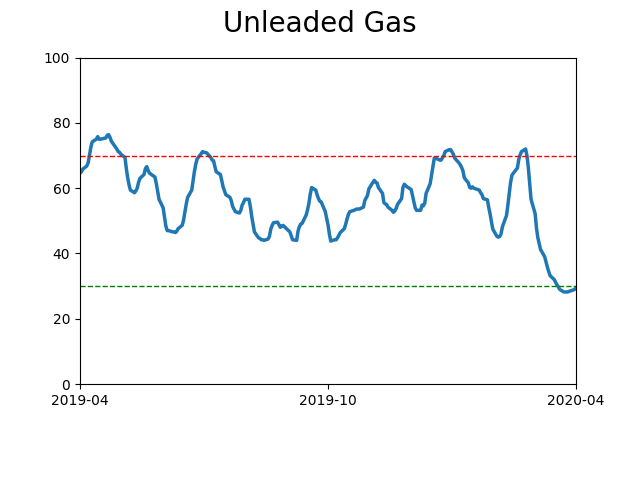
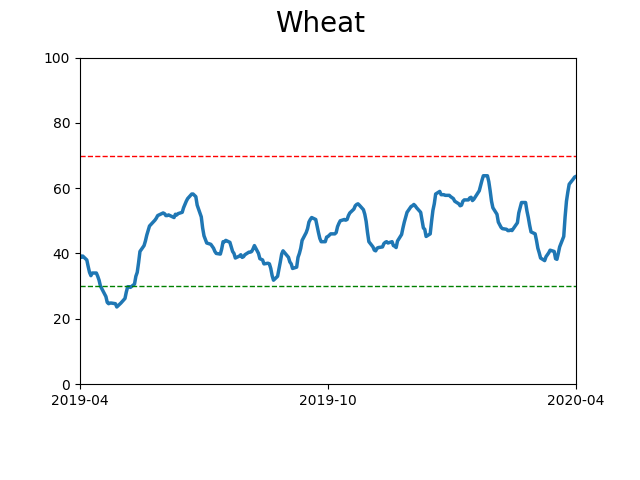
Commodity ETF's - 5-Day Moving Average
|
|