Headlines
|
|
Investors seem hesitant to leverage their investments:
The debt that investors have taken with investments in their brokerage accounts as collateral has grown over the past year. But the growth is well below that in stocks and debt remains more than 20% below its peak. Similar behavior has preceded gains in the S&P over most longer-term time frames, with above average returns.
|
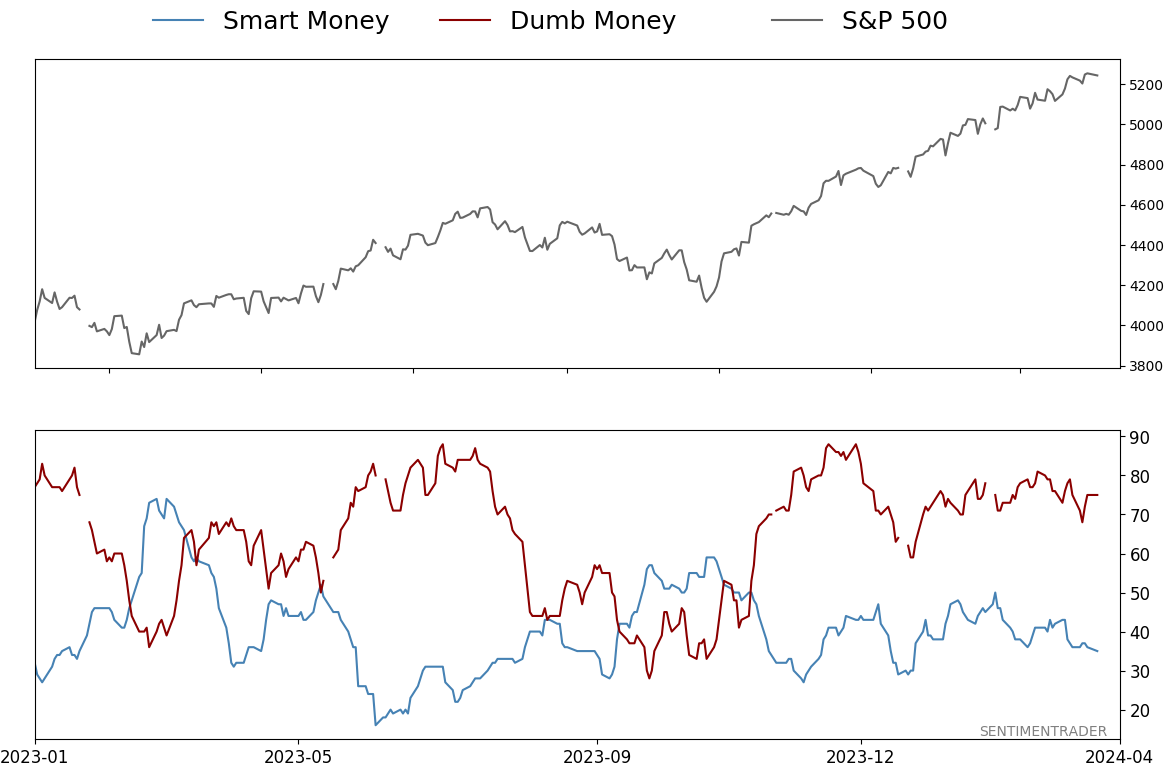
Smart / Dumb Money Confidence
|
Smart Money Confidence: 35%
Dumb Money Confidence: 75%
|
|
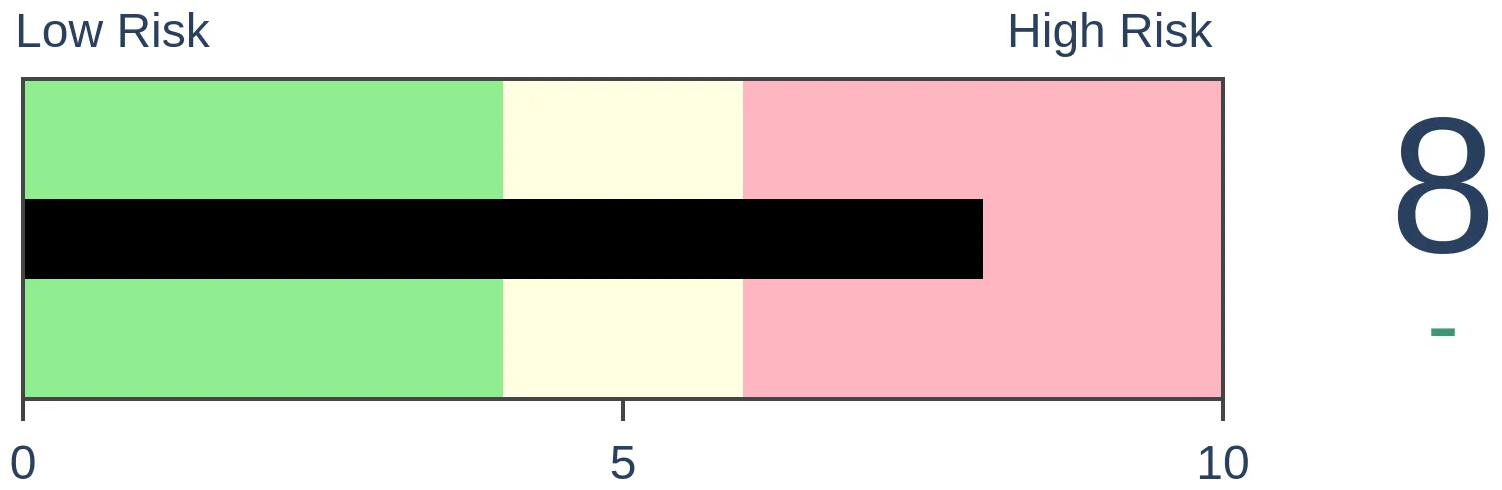
Risk Levels
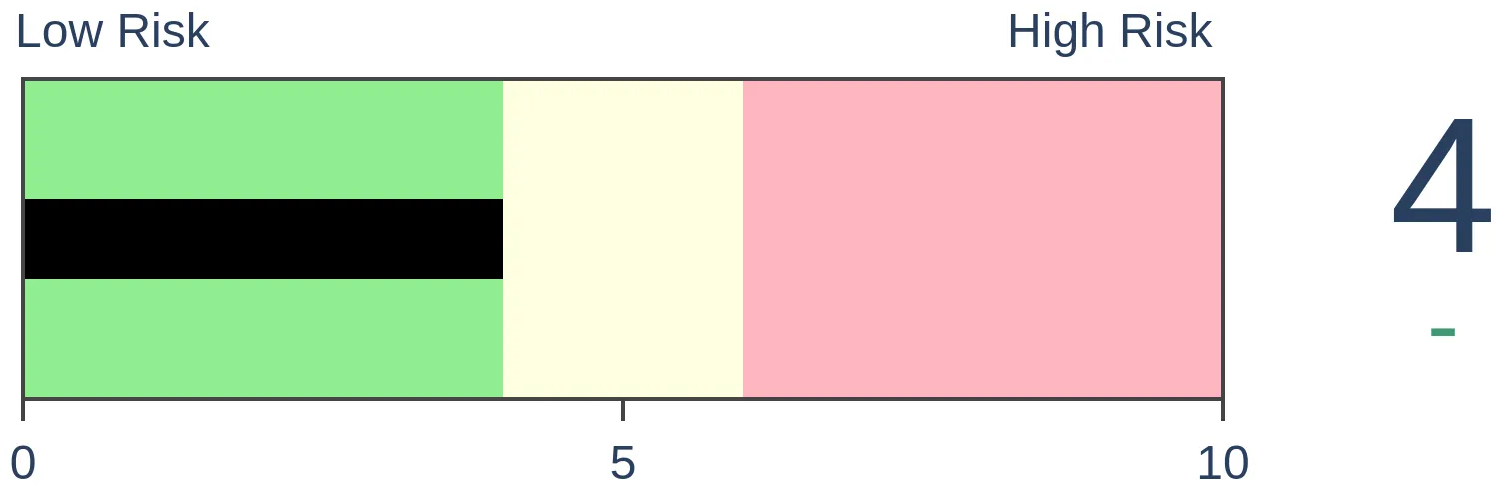
Stocks Short-Term

|
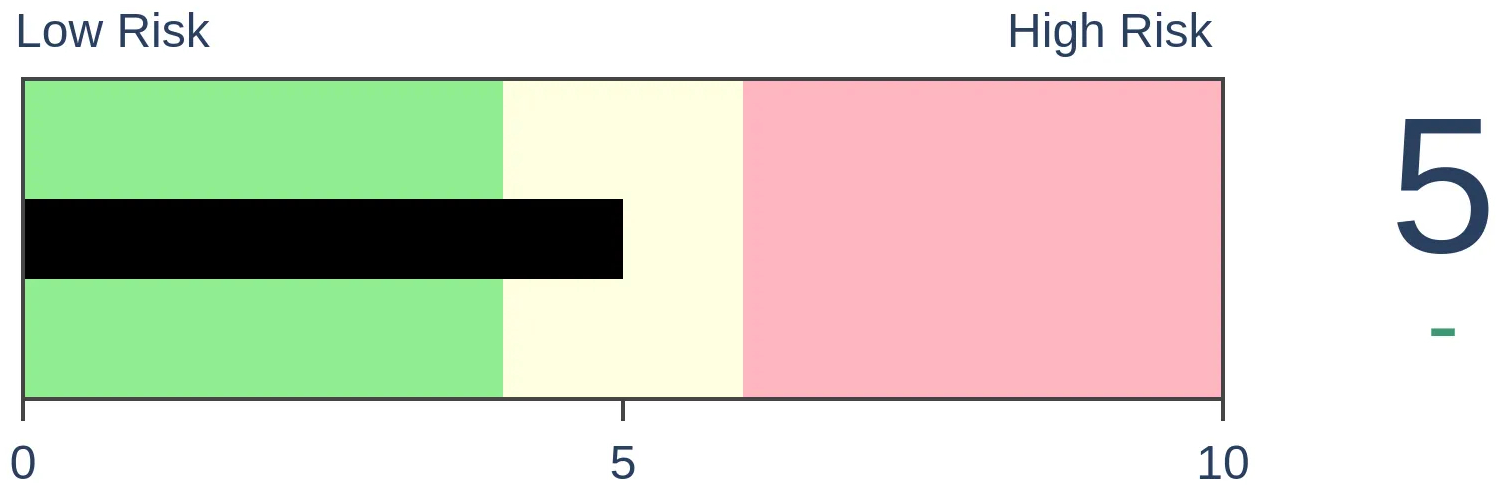
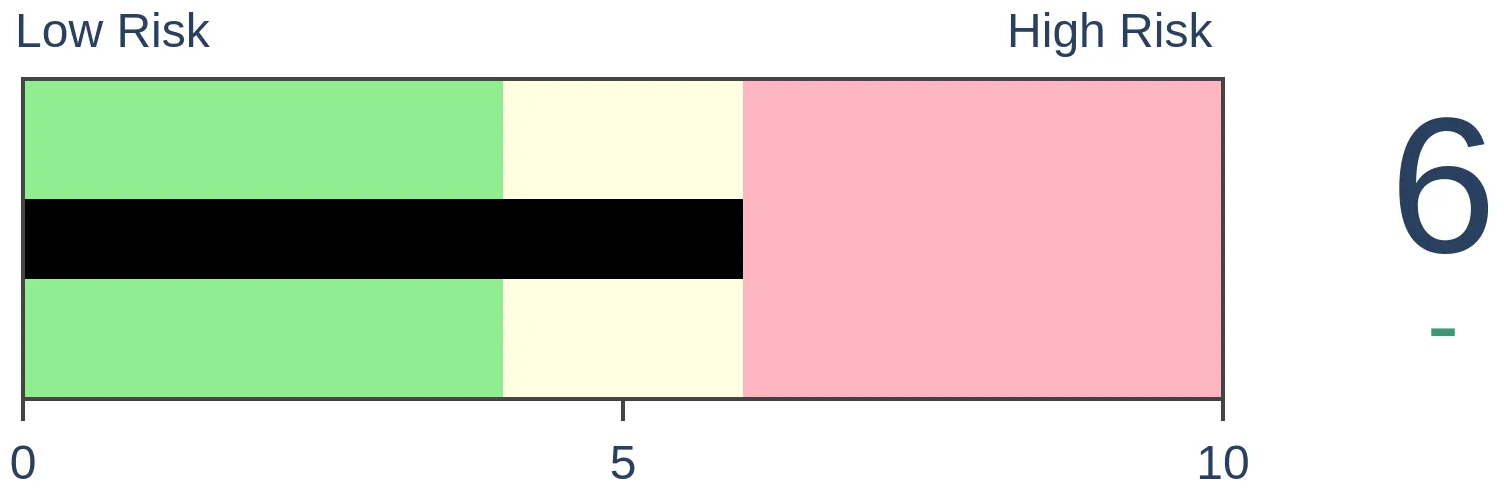
Stocks Medium-Term
|
|
Bonds
|
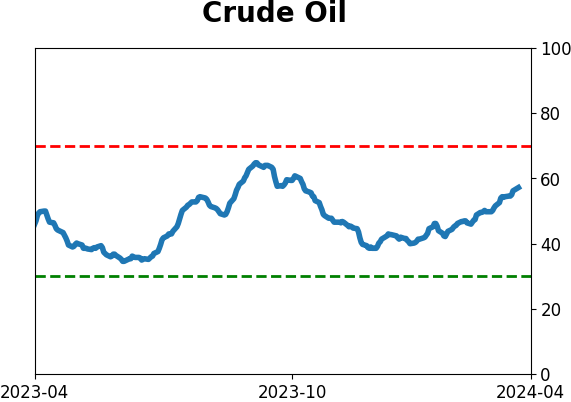
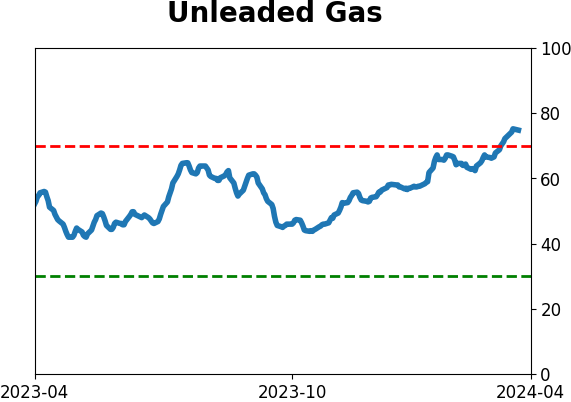
Crude Oil
|
|
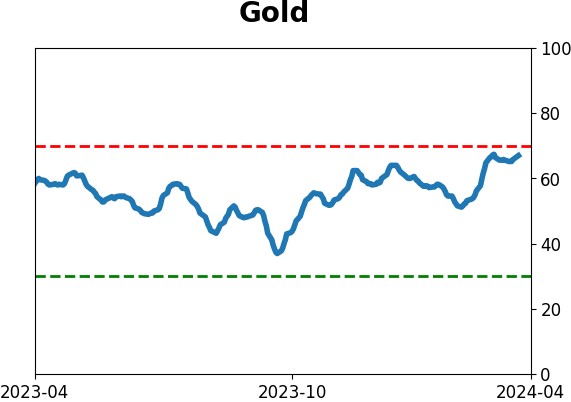
Gold
|
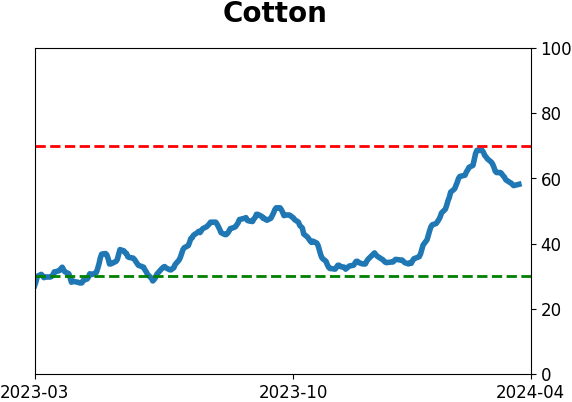
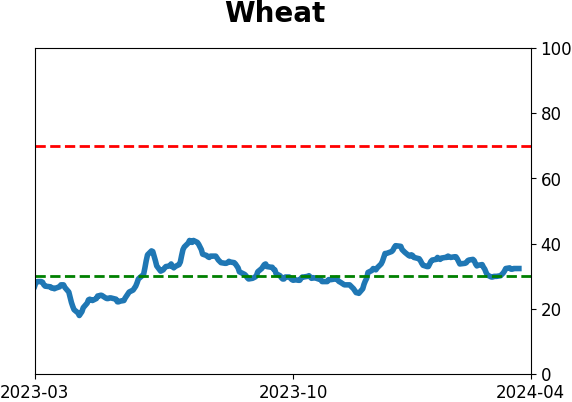
Agriculture

|
|
Research
By Jason Goepfert
BOTTOM LINE
The debt that investors have taken with investments in their brokerage accounts as collateral has grown over the past year. But the growth is well below that in stocks and debt remains more than 20% below its peak. Similar behavior has preceded gains in the S&P over most longer-term time frames, with above average returns.
FORECAST / TIMEFRAME
None
|
Key points:
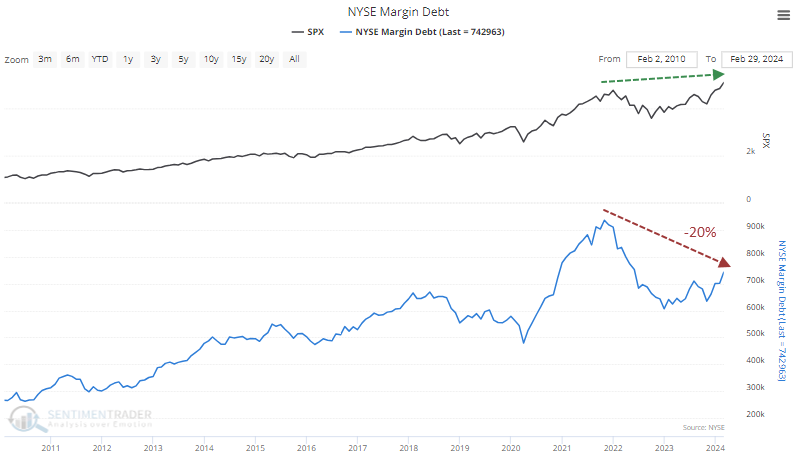
- Margin debt has jumped nearly 20% over the past year after plunging by more than a third
- Even so, it's more than 20% off its high despite the S&P 500 soaring to record highs
- Similar divergences and cycles in margin debt have preceded higher stock prices with consistency
Debt is growing, but not as much as the collateral
Last summer, Dean noted that margin debt was recovering. That was a good sign that investors' risk appetite was returning since they felt more comfortable leveraging their equity holdings. It proved to be a good sign again.
Oddly, it hasn't picked up much despite gangbuster moves in many stocks and indexes. The S&P 500 has reached record highs, yet margin debt is still more than 20% off its own high.
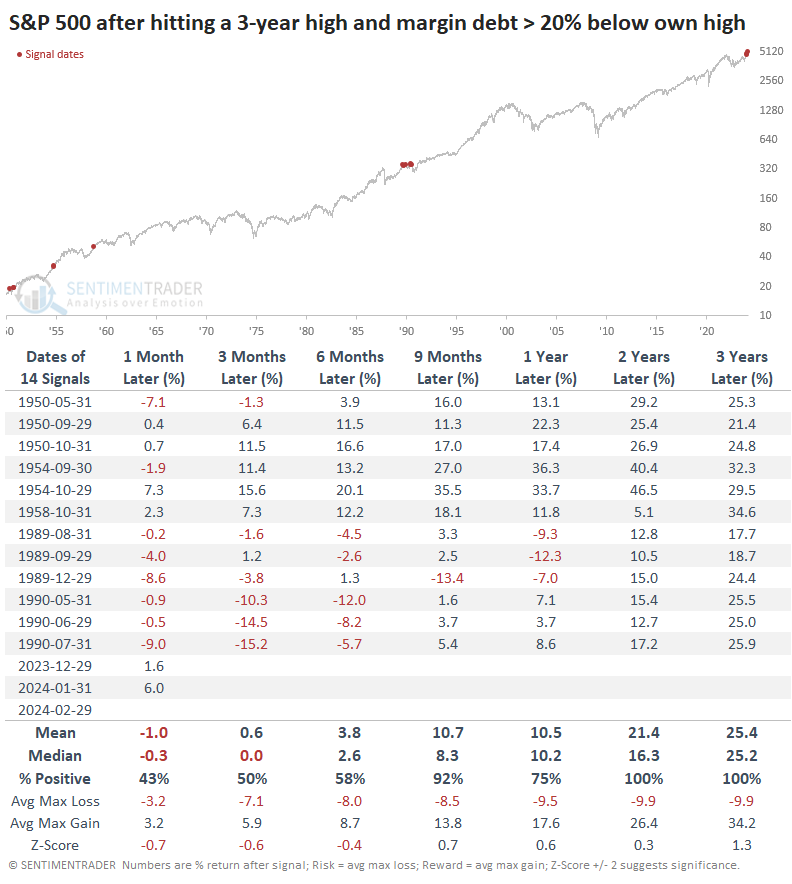
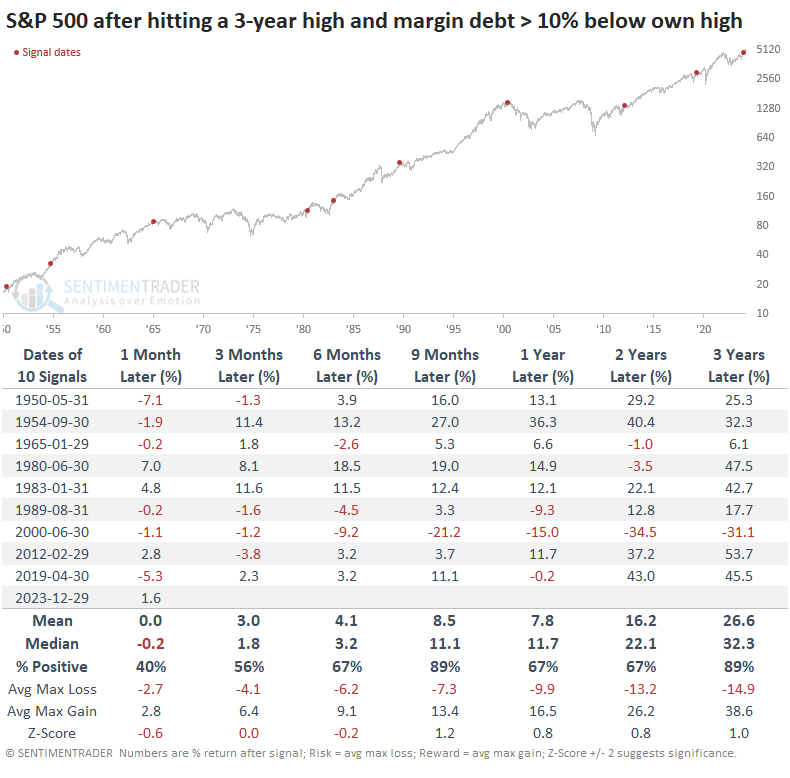
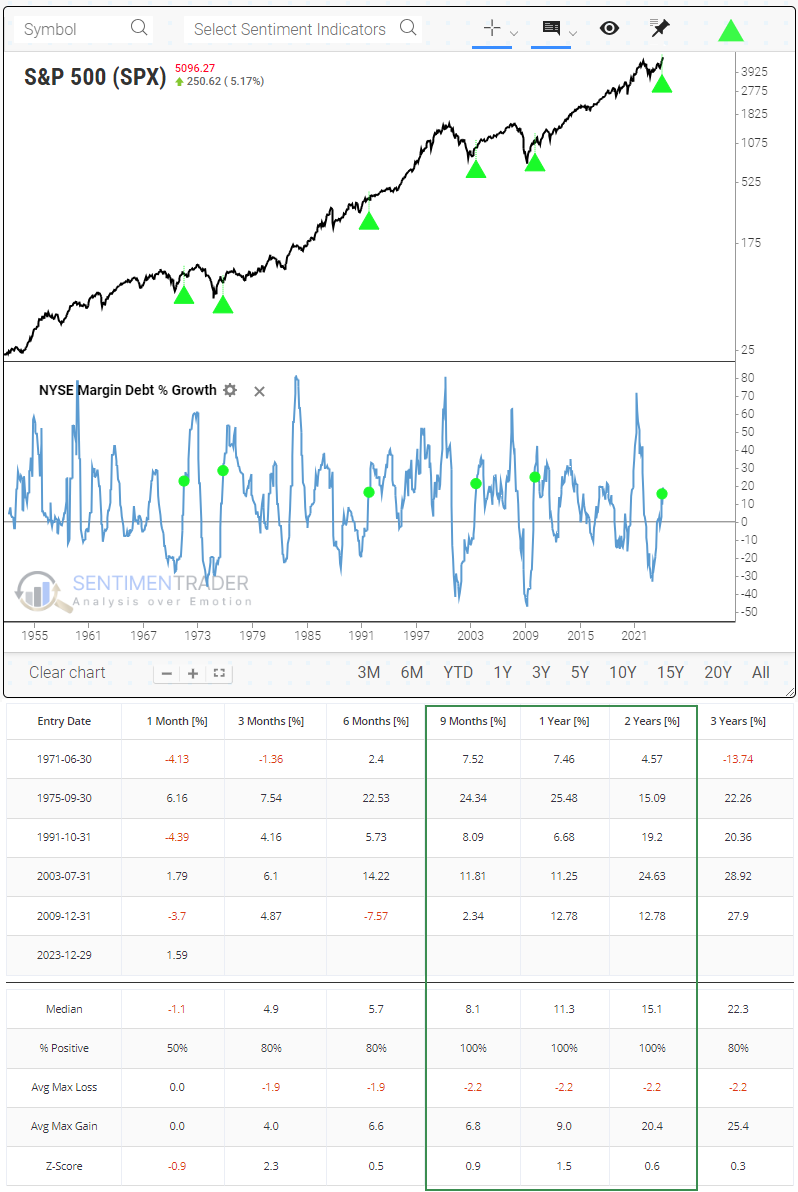
This is not a common situation. The table below shows every month when this was the case since 1950, with long-term returns in the S&P 500.
While 14 months met the criteria, it was concentrated in five distinct periods, including the current one. While the S&P's returns were less than mediocre in the months immediately following these signals, its longer-term returns were above average, especially over the next 2-3 years when there were no losses and a heavily skewed reward-to-risk ratio.
If we lessen the divergence to generate a large sample size, we can look at only the first signal in each period to determine whether these divergences were good signs. The table below looks at the first time in two years when the S&P 500 closed at a 3-year high, but margin debt was at least 10% below its own high.
This triggered near the high in 2000 and before the 1990 recession, which were not good times to be a long-only investor over the following year. However, the others showed gains and overall returns were mostly well above random.
Debt is growing, even if below its prior high
Even though debt is well below its high, it has grown significantly over the past year. The Margin Debt % Growth chart shows that it has jumped 19% over the past year after having plunged by more than a third during 2022.
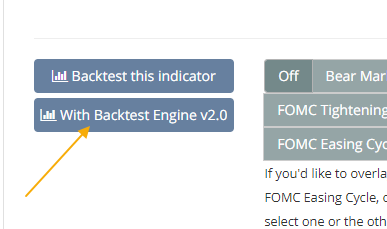
The new backtest engine can tell us whether this was a good sign for stocks. Click the "With Backtest Engine 2.0" button on the chart page.
Once that loads, all that needs to be done is:
1. Change the Entry Criteria to TimeOrder Multi-Condition
2. Change the Indicator Value to <
3. Change the value to -25
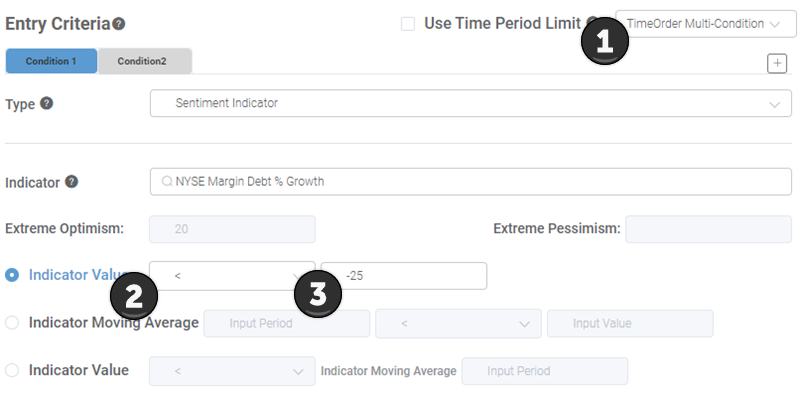
That will tell us what happened to the S&P 500 (the default index) after margin debt dropped at least 25% year-over-year. But we want to see what happened when it did that AND THEN rebounded to at least 15% growth. So...
4. Click the Condition2 tab
5. In the Indicator field, type "margin debt" and select the NYSE Margin Debt % Growth option that pops up
6. Change the Indicator Value to CrossAbove
7. Change the value to 15
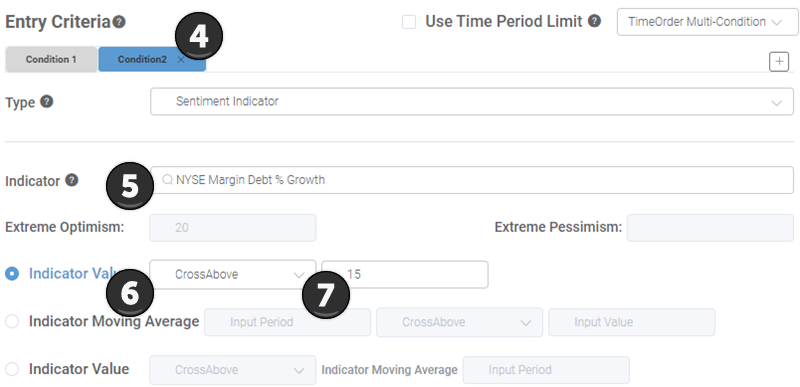
Those criteria will tell us how the S&P 500 performed after margin debt dropped at least 25% year-over-year and then rose at least 15% year-over-year. When you click the Run Backtest button, you should get the following results - the S&P rose over the next 9-24 months all five times there was a similar cycle, with returns that were above random and with low risk relative to reward.
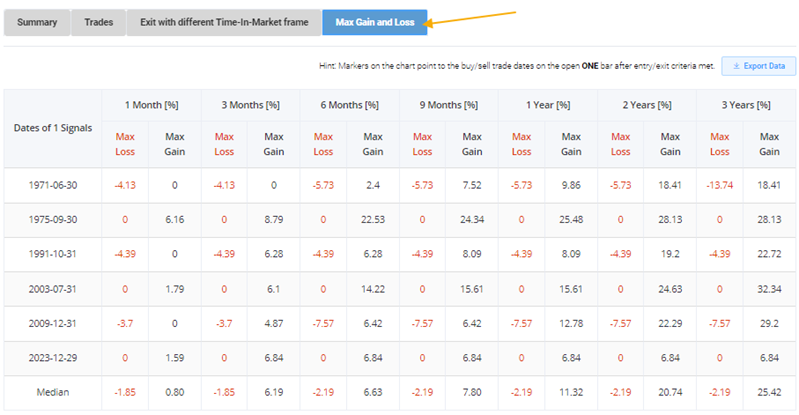
If you click the Max Gain and Loss tab, you can see how much the S&P declined and rose at its lowest and highest point over each time frame. Those losses tended to be minor, while the gains were mostly robust.
What the research tells us...
Investors have become more willing to leverage their investments. They are taking out more debt, with their brokerage account holdings acting as collateral. That's a sign of confidence, but it is well below where it could be, given the gain in stocks over the past year.
Divergences between price action and sentiment aren't always helpful and aren't always negative. With margin debt, it was mostly a positive indication that the animal spirits had further to run. And when debt plunged by more than a quarter and then rebounded by almost as much, it was an excellent sign for stocks over the next year or so. This is one data point that suggests stocks could have further to run.
Indicators at Extremes
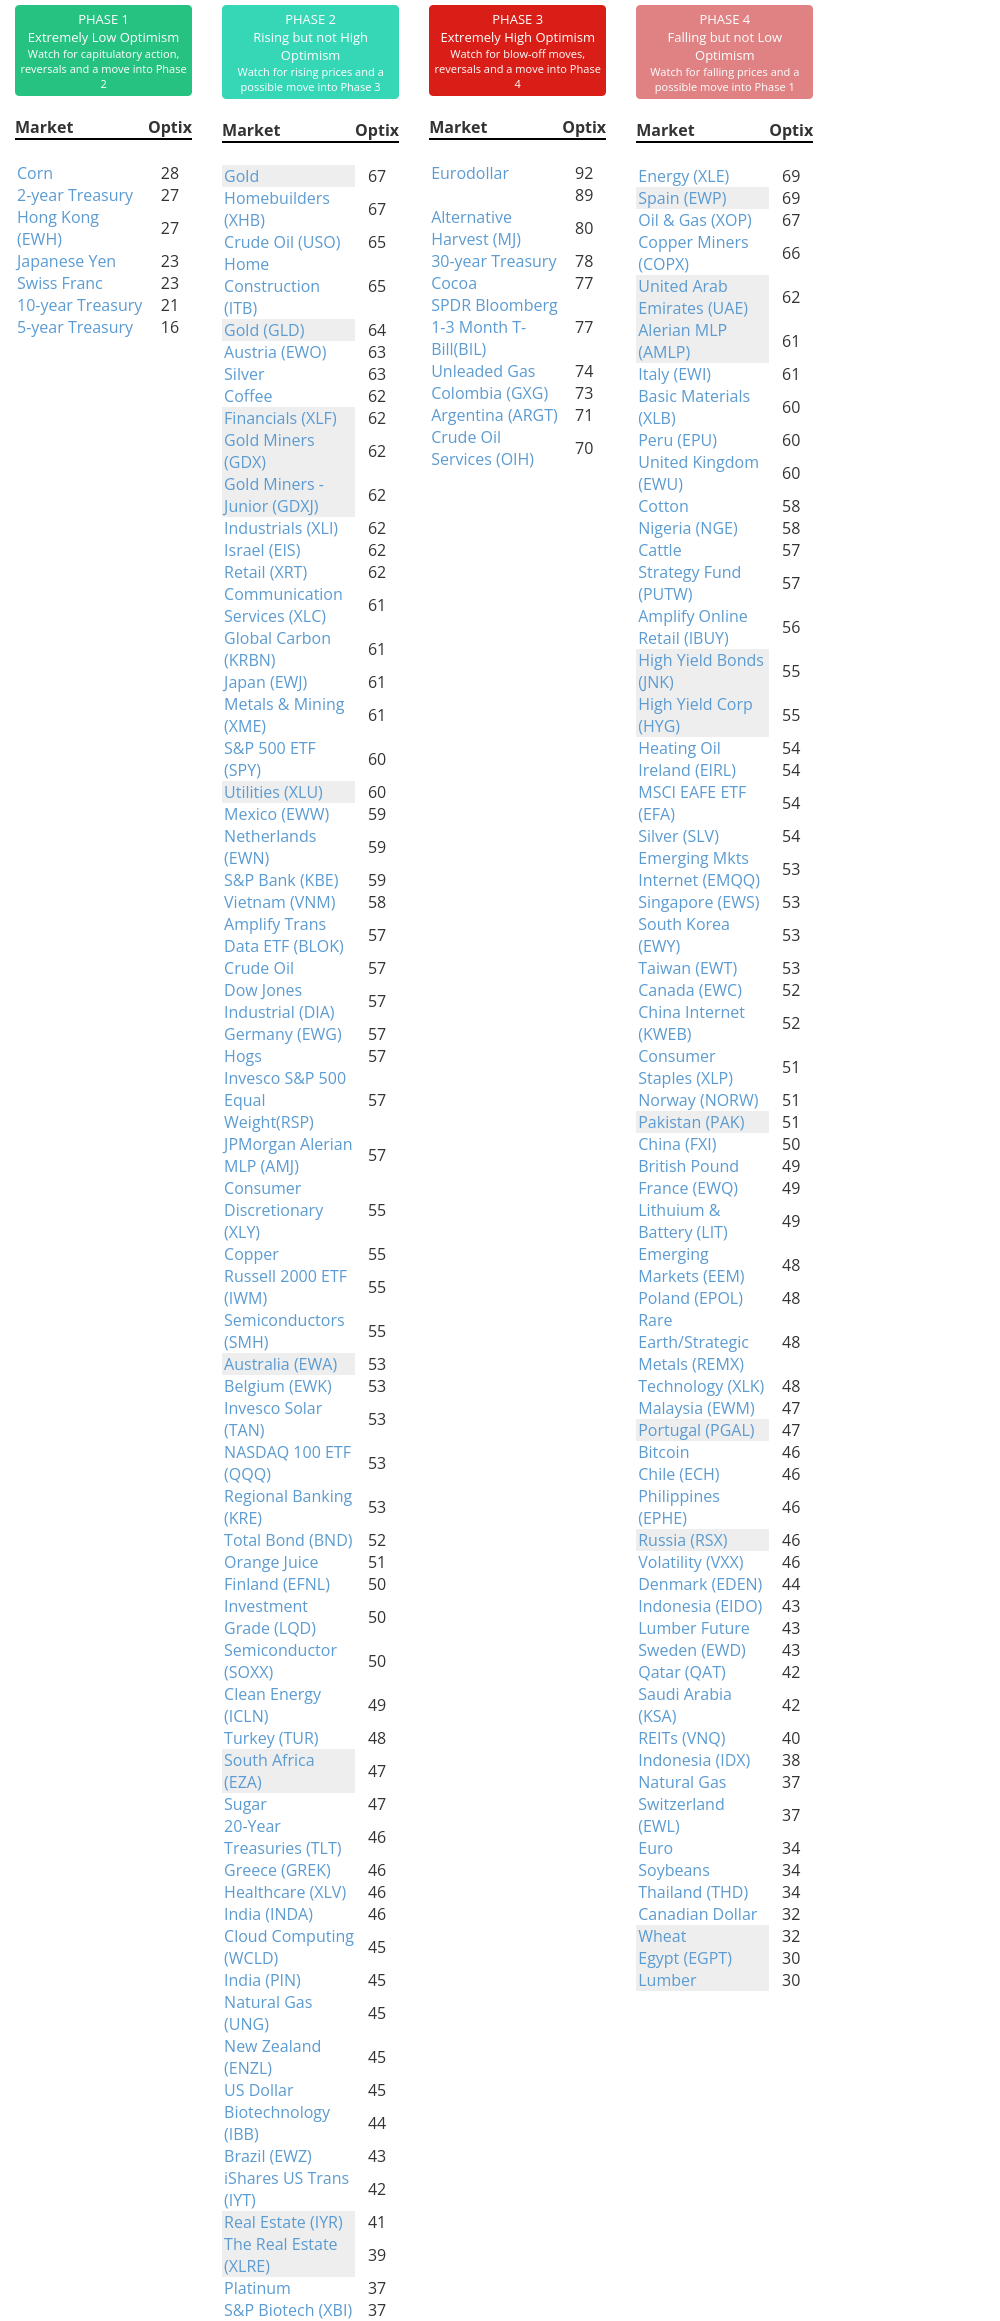
Phase Table
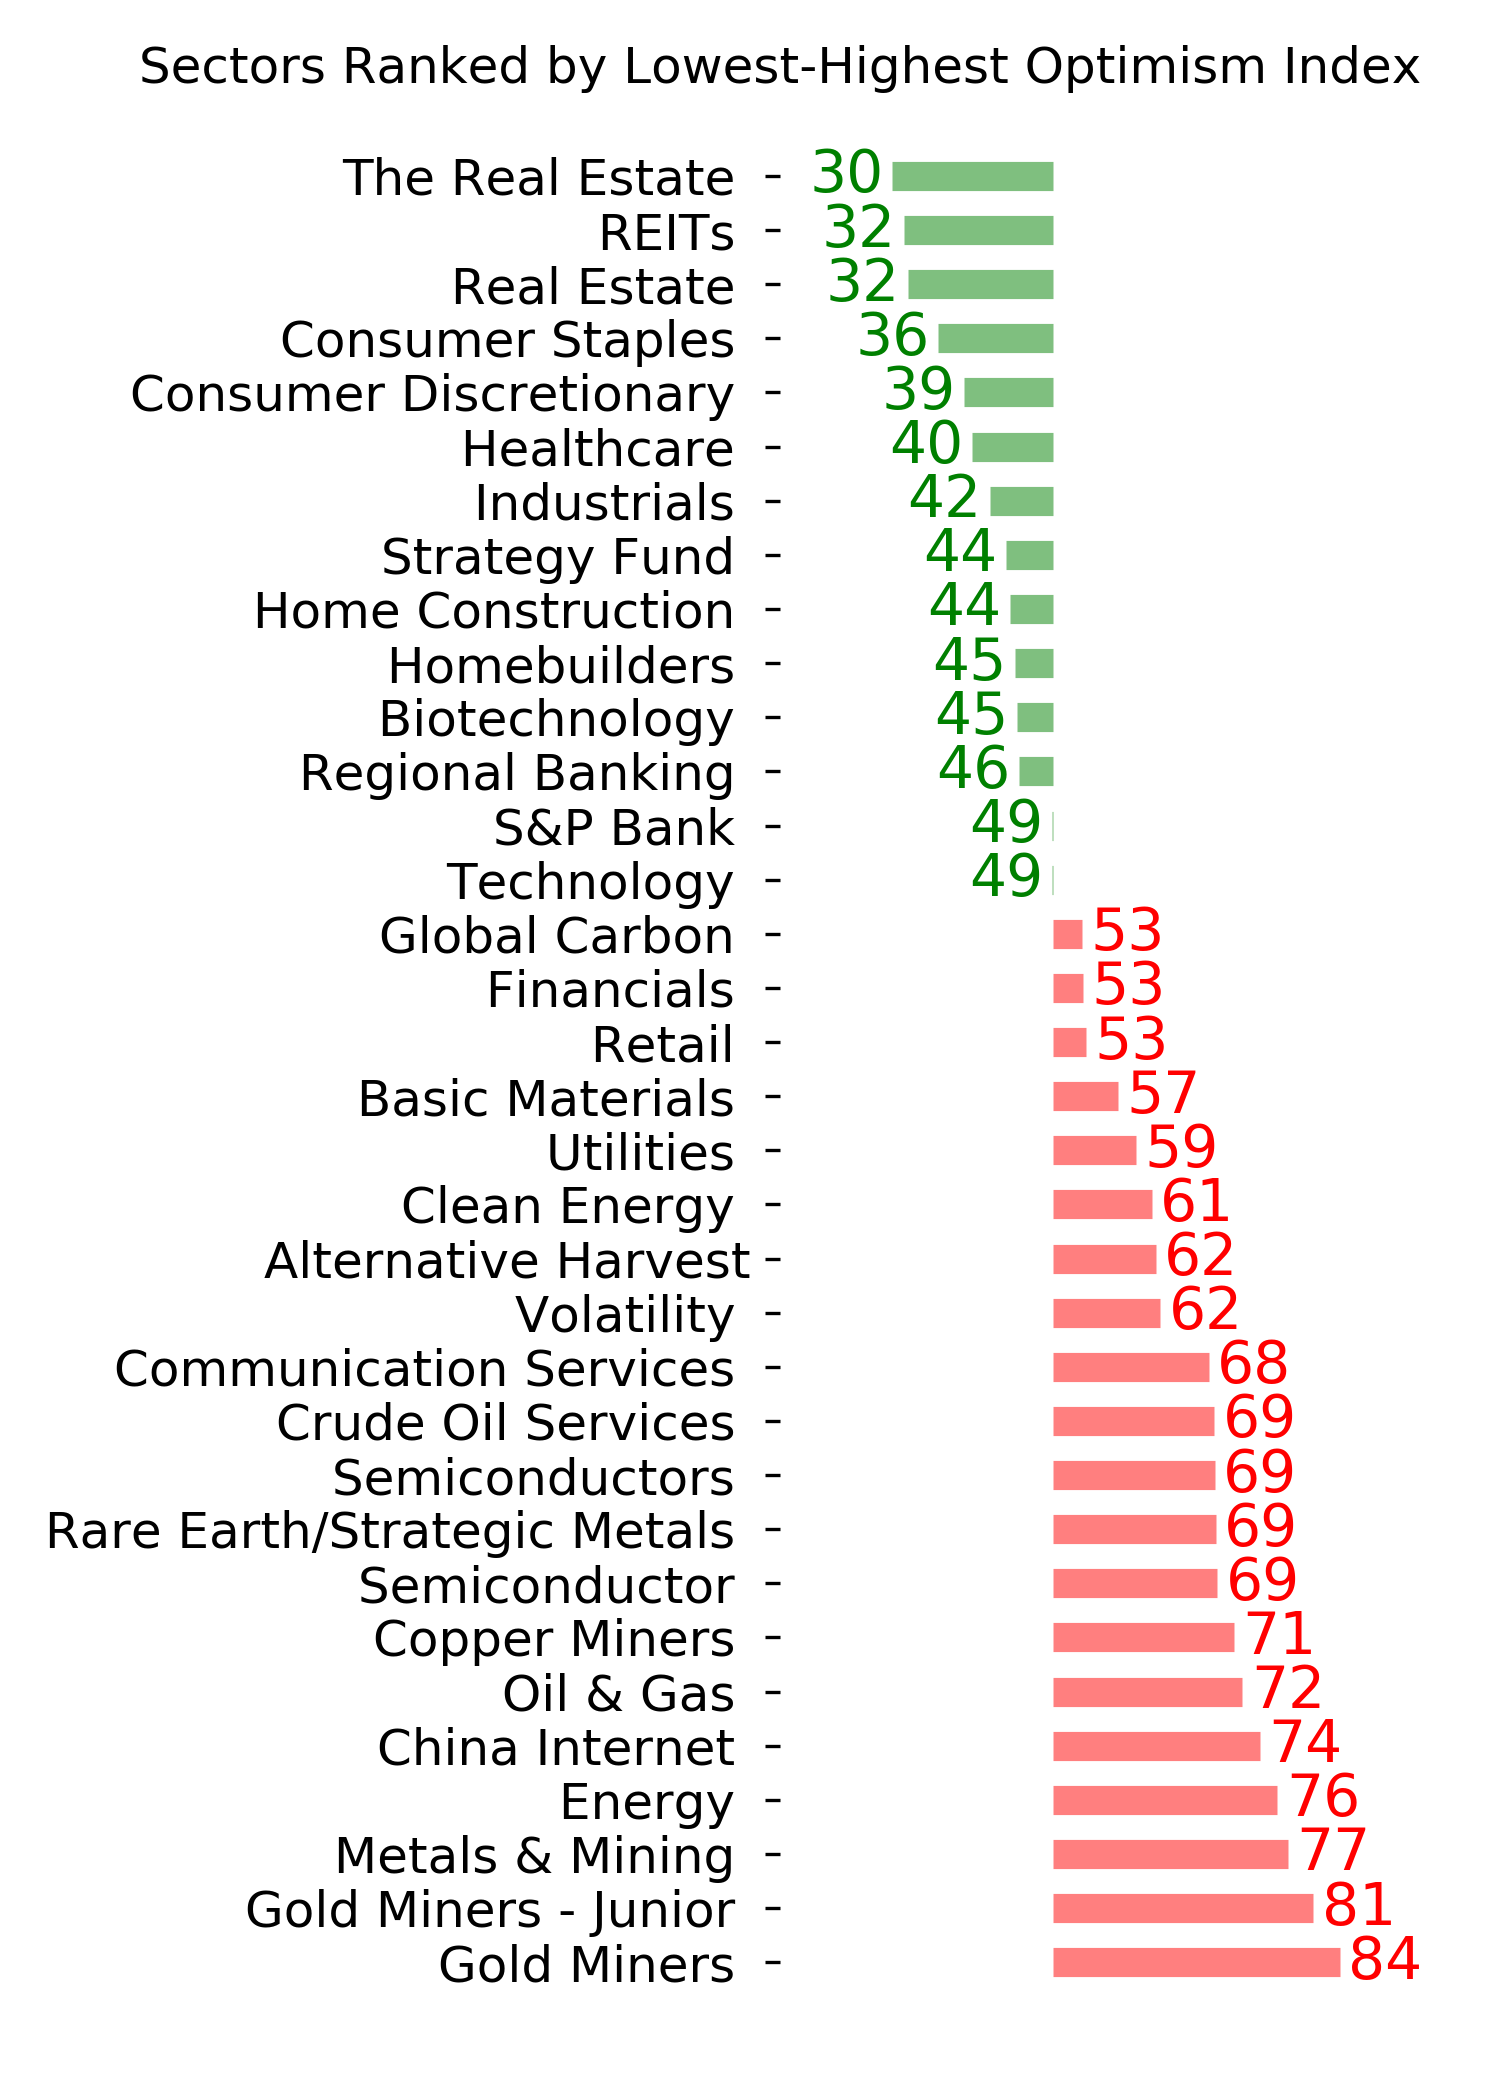
Ranks
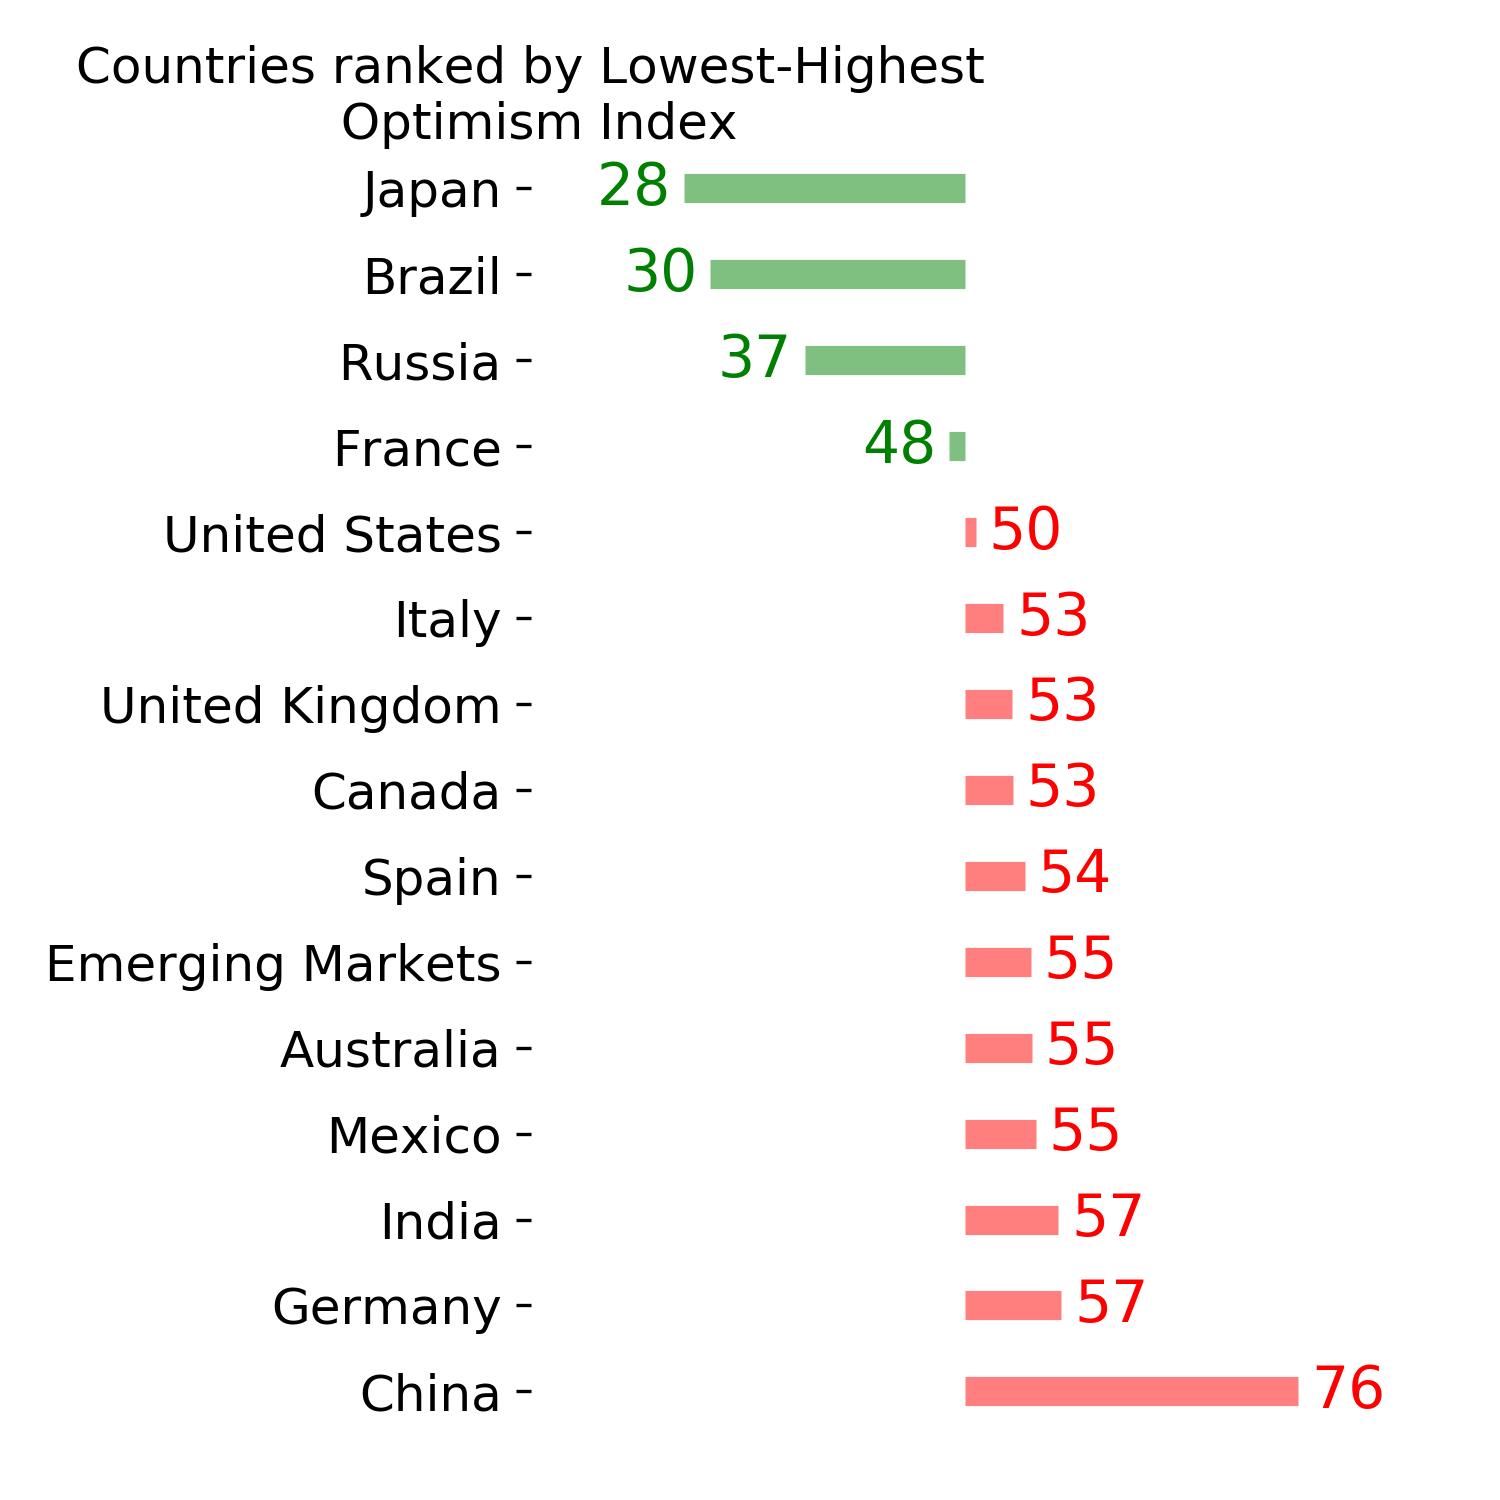
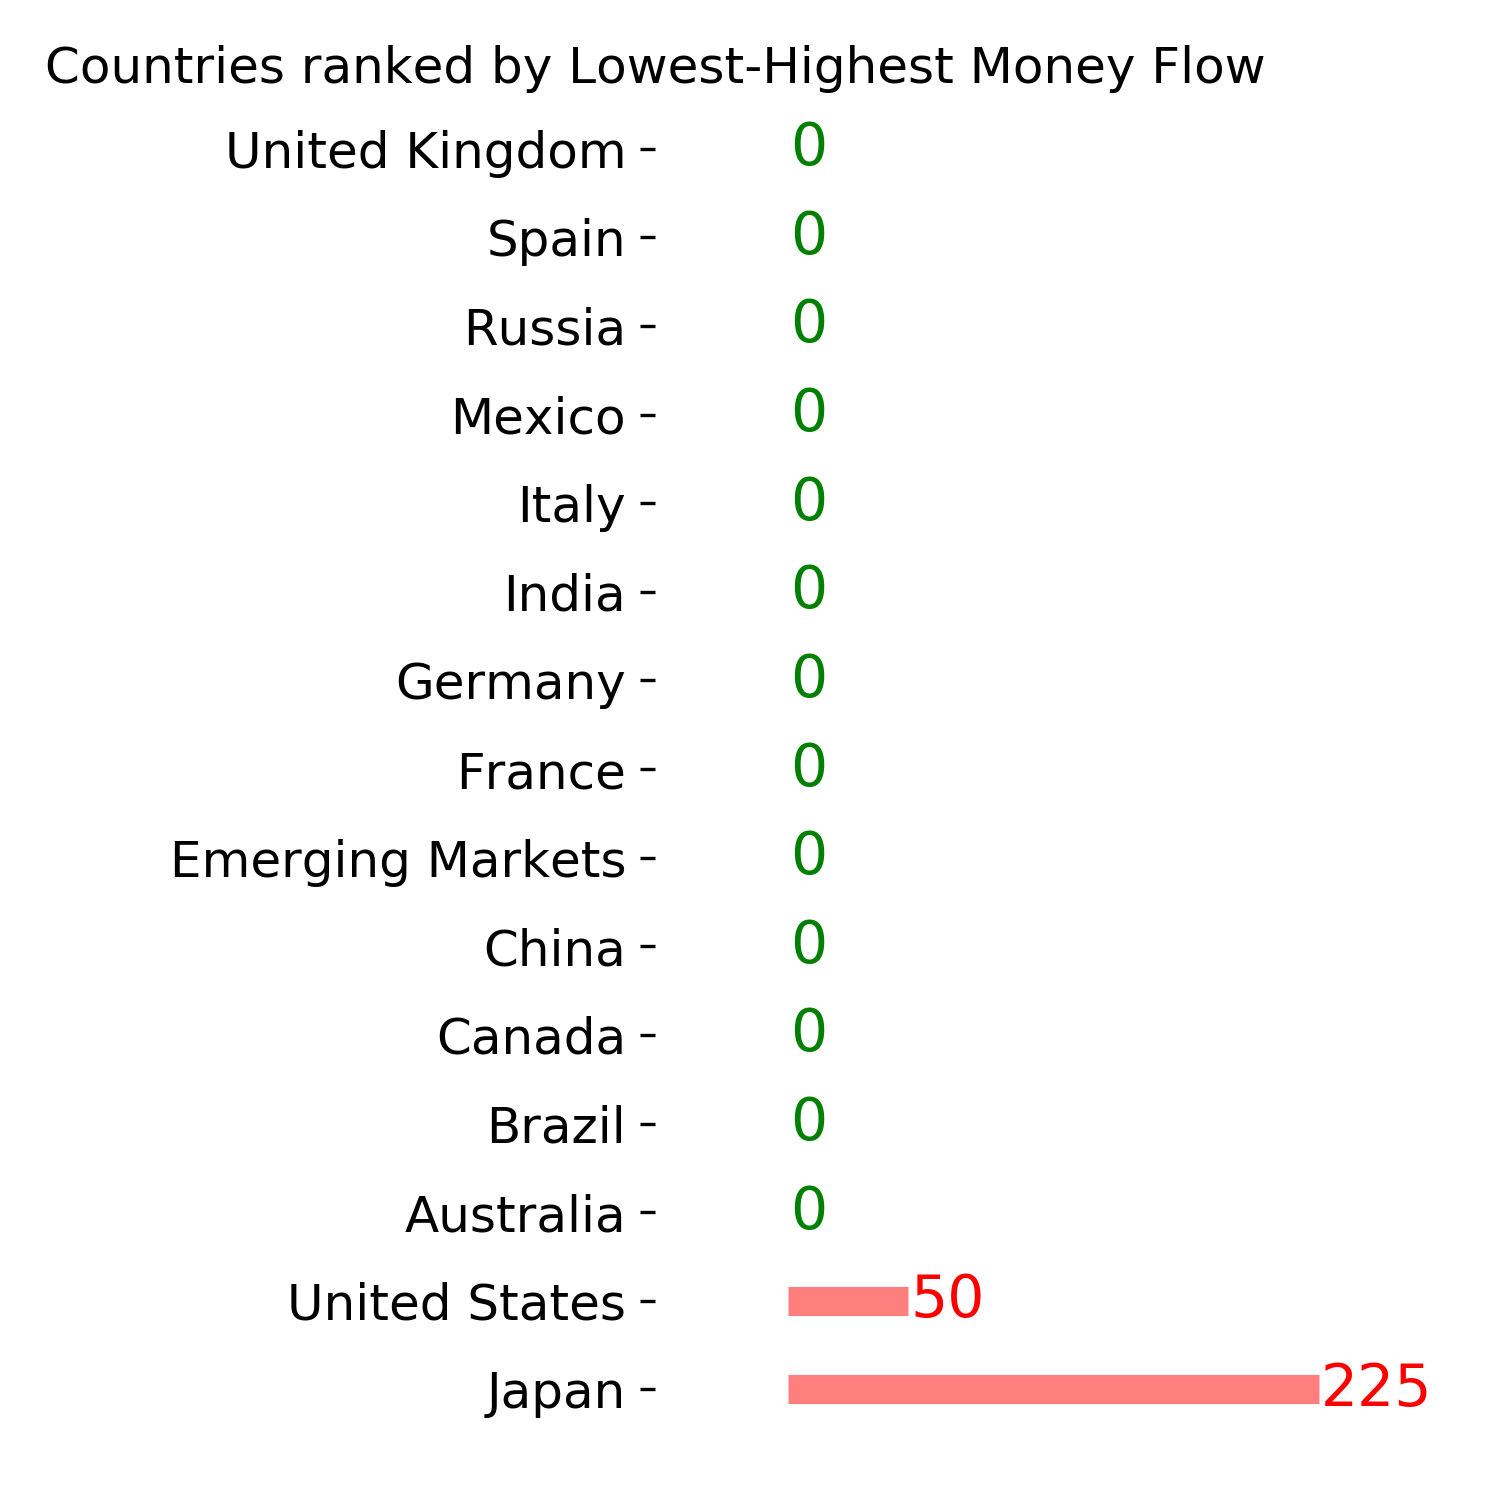
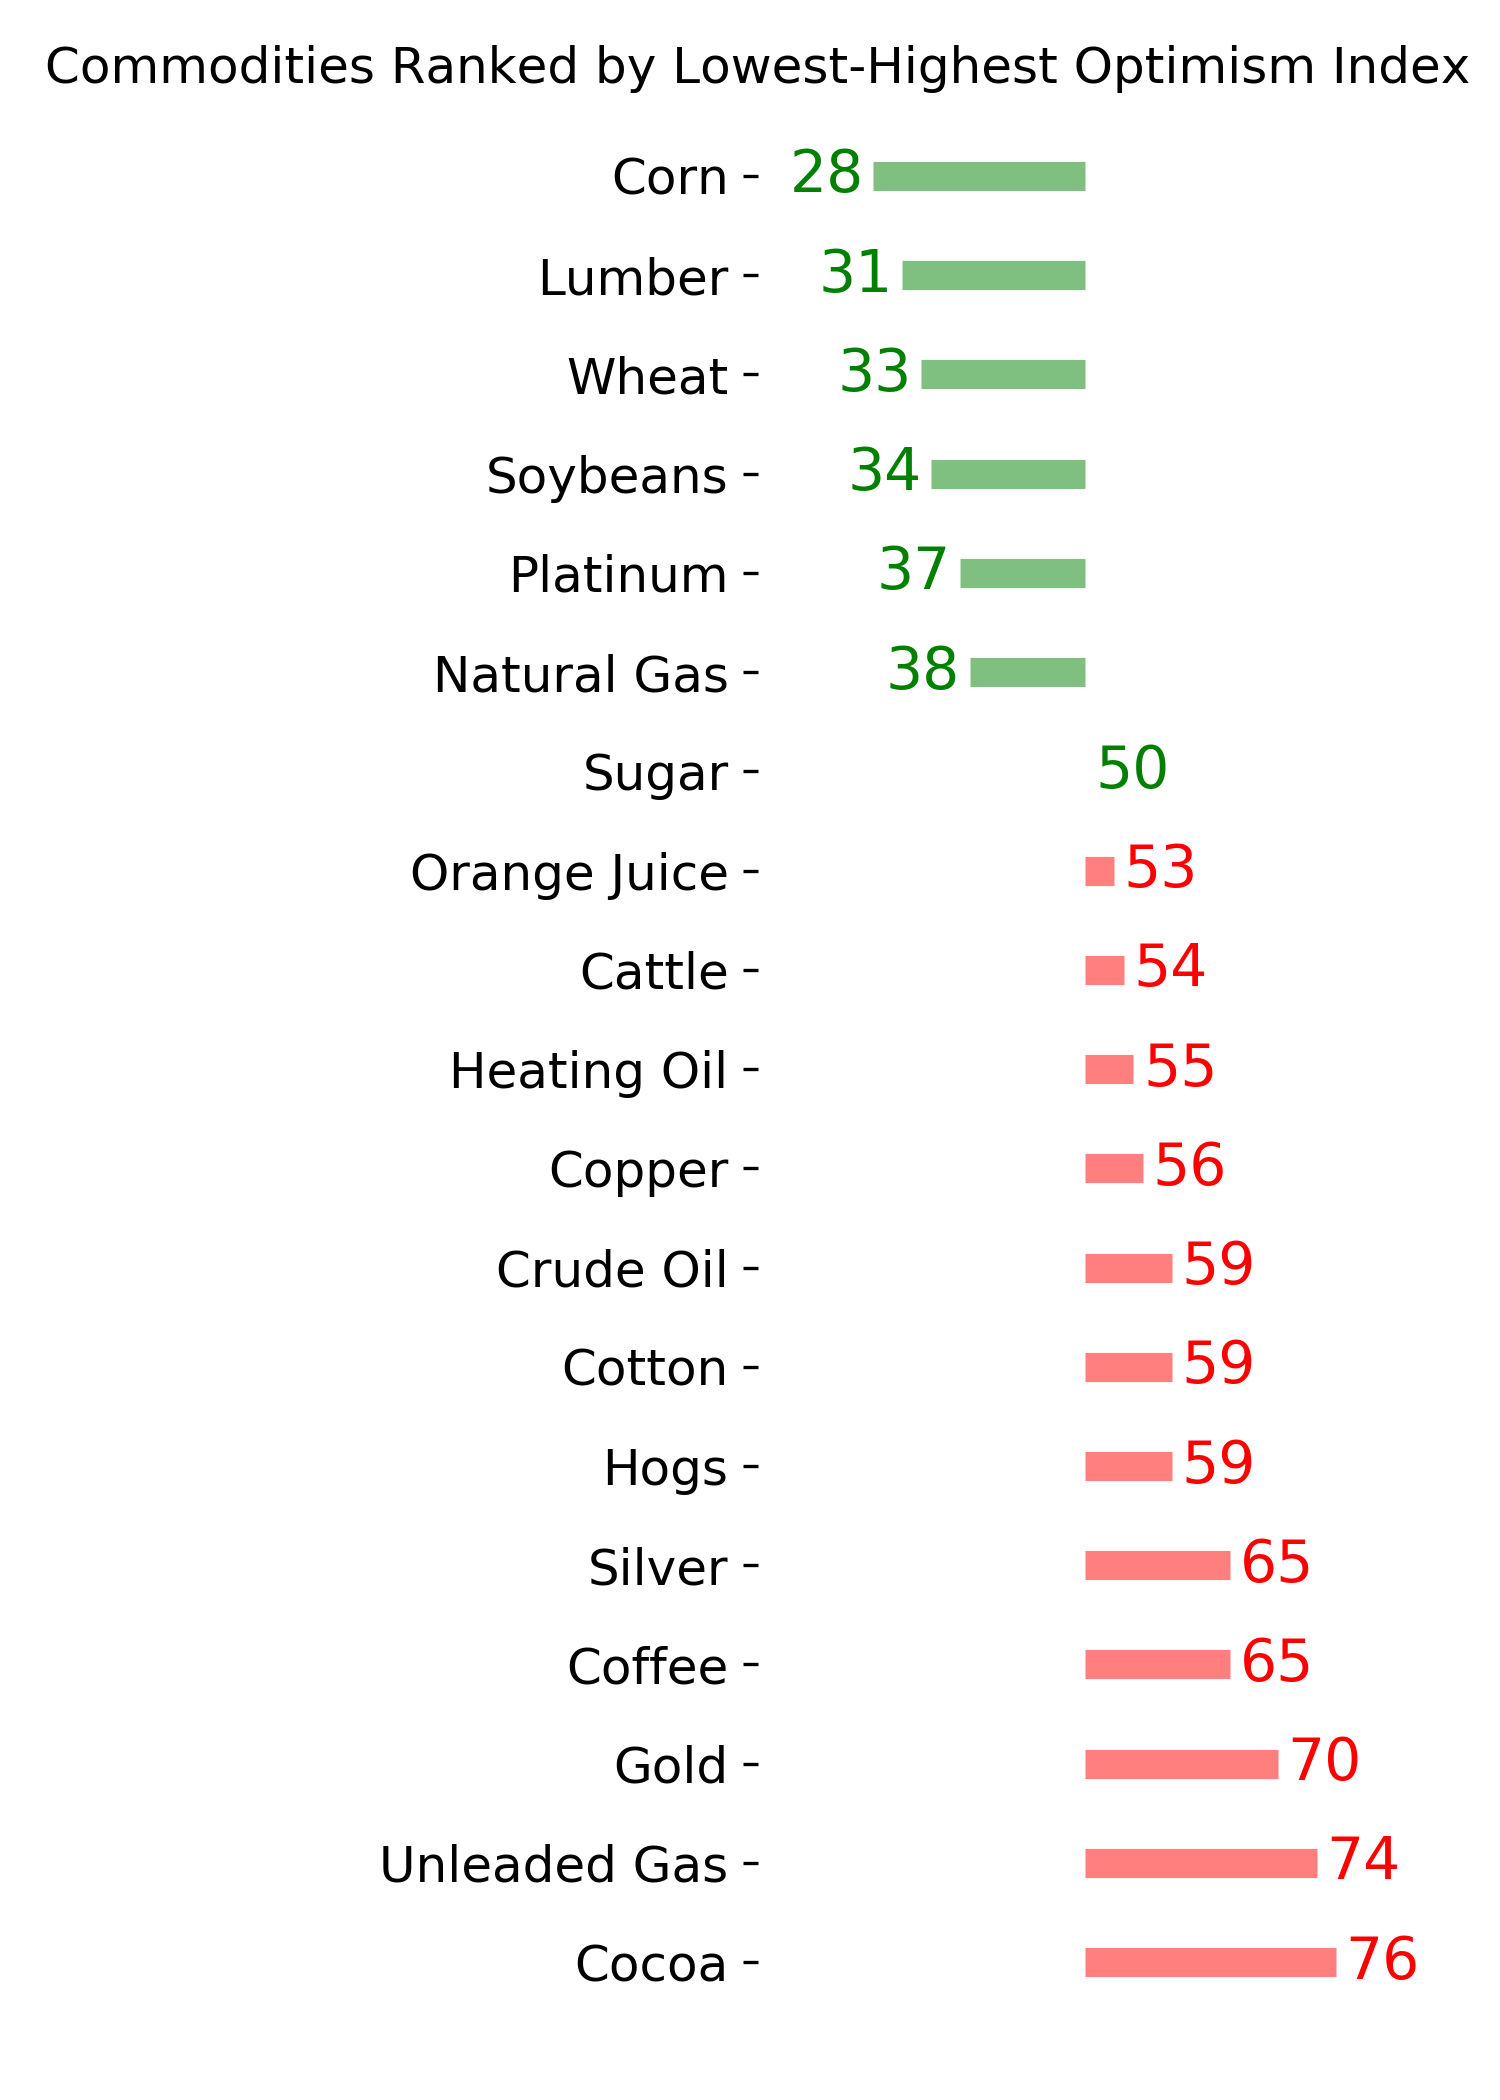
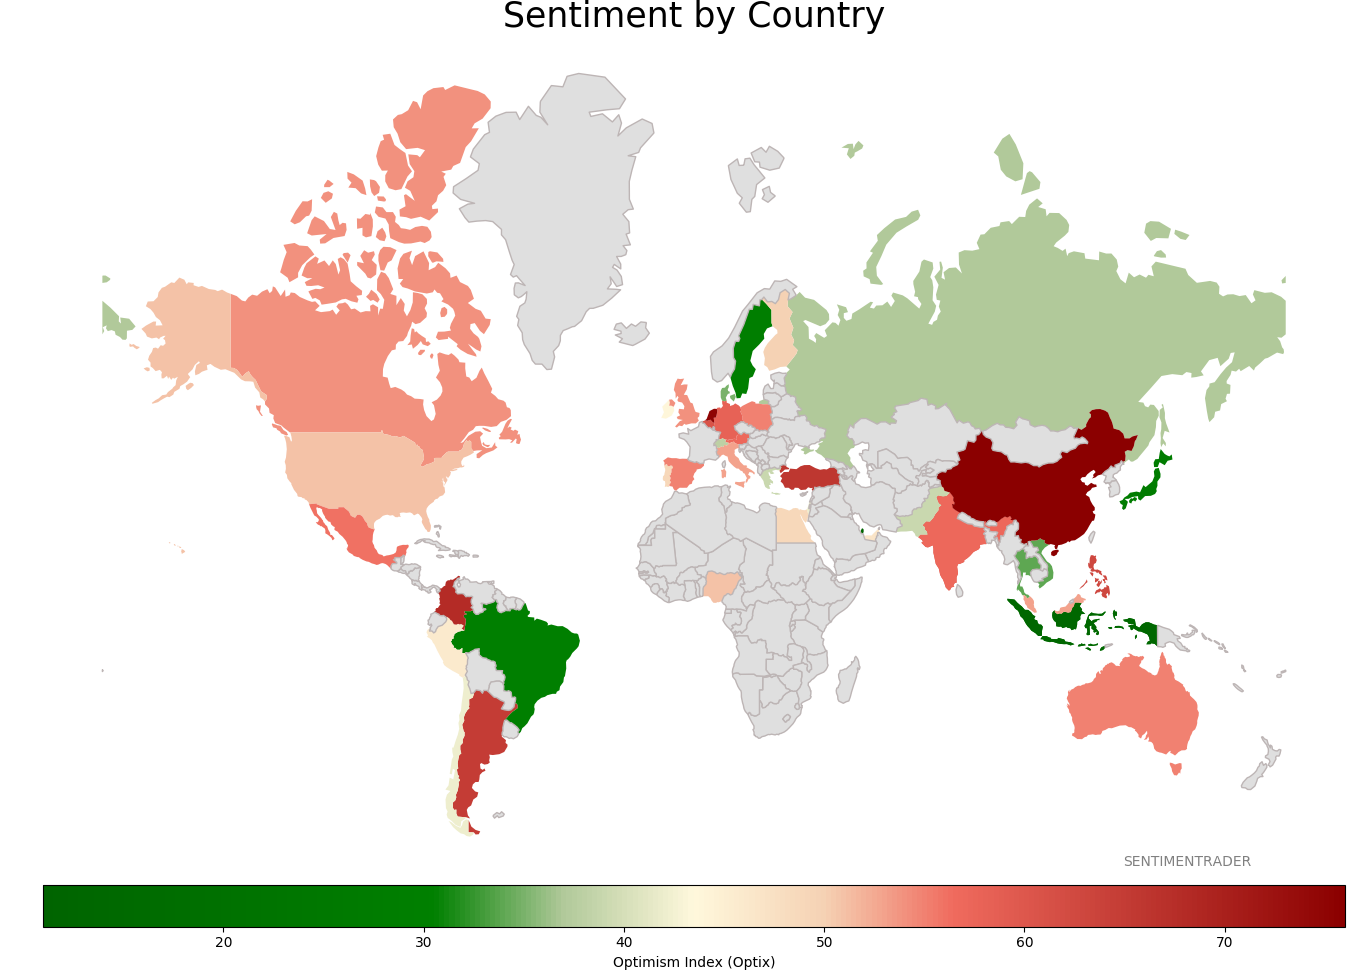
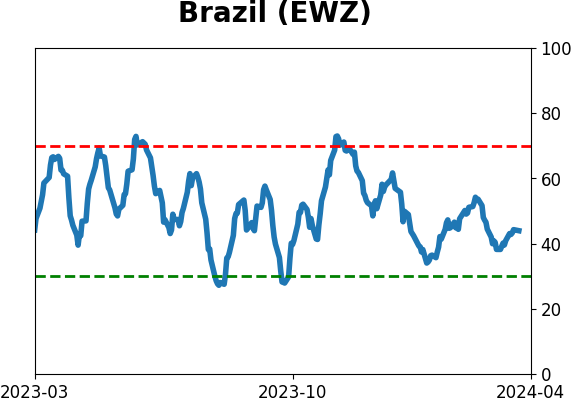
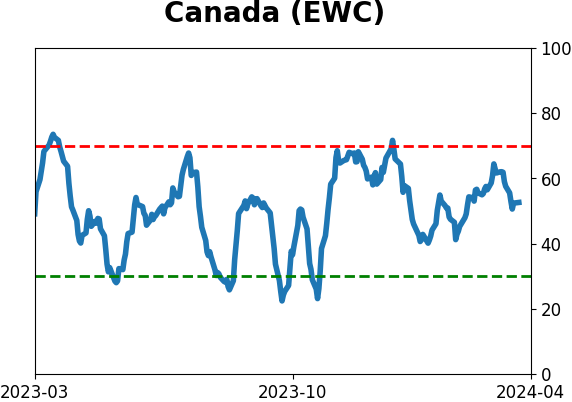
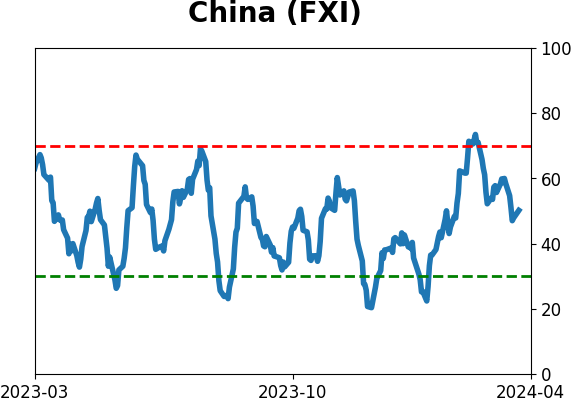
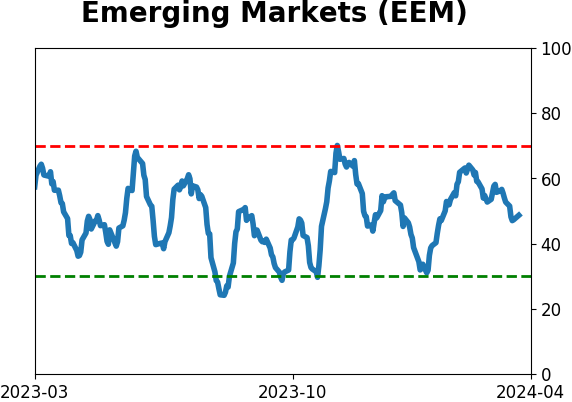
Sentiment Around The World
Optimism Index Thumbnails
|
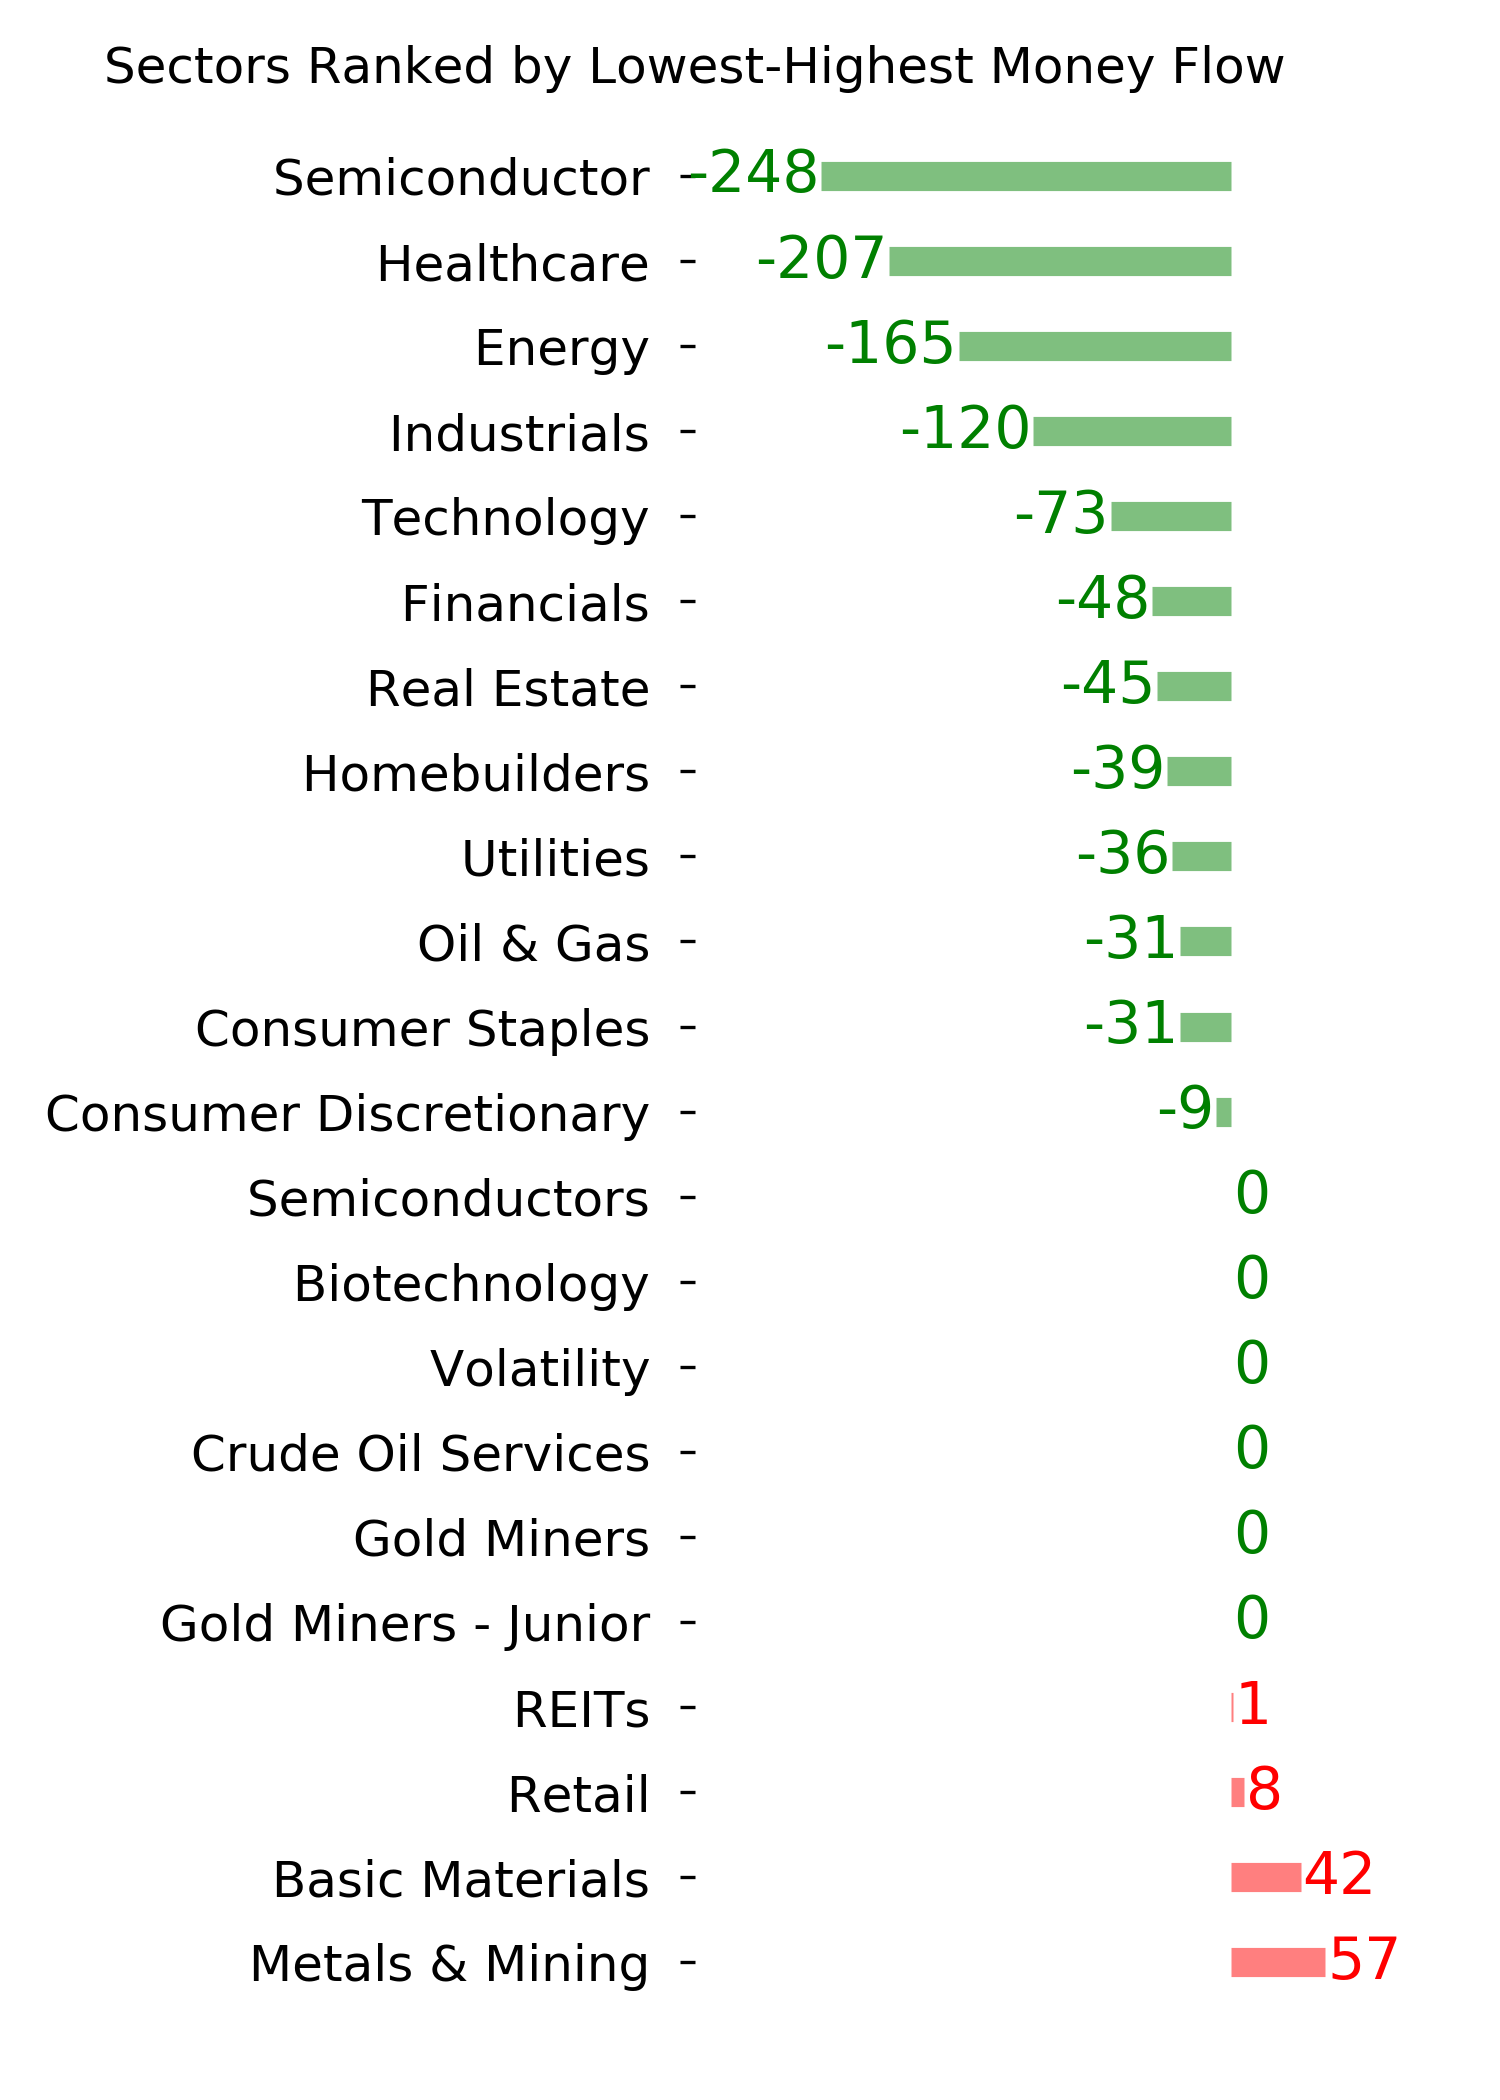
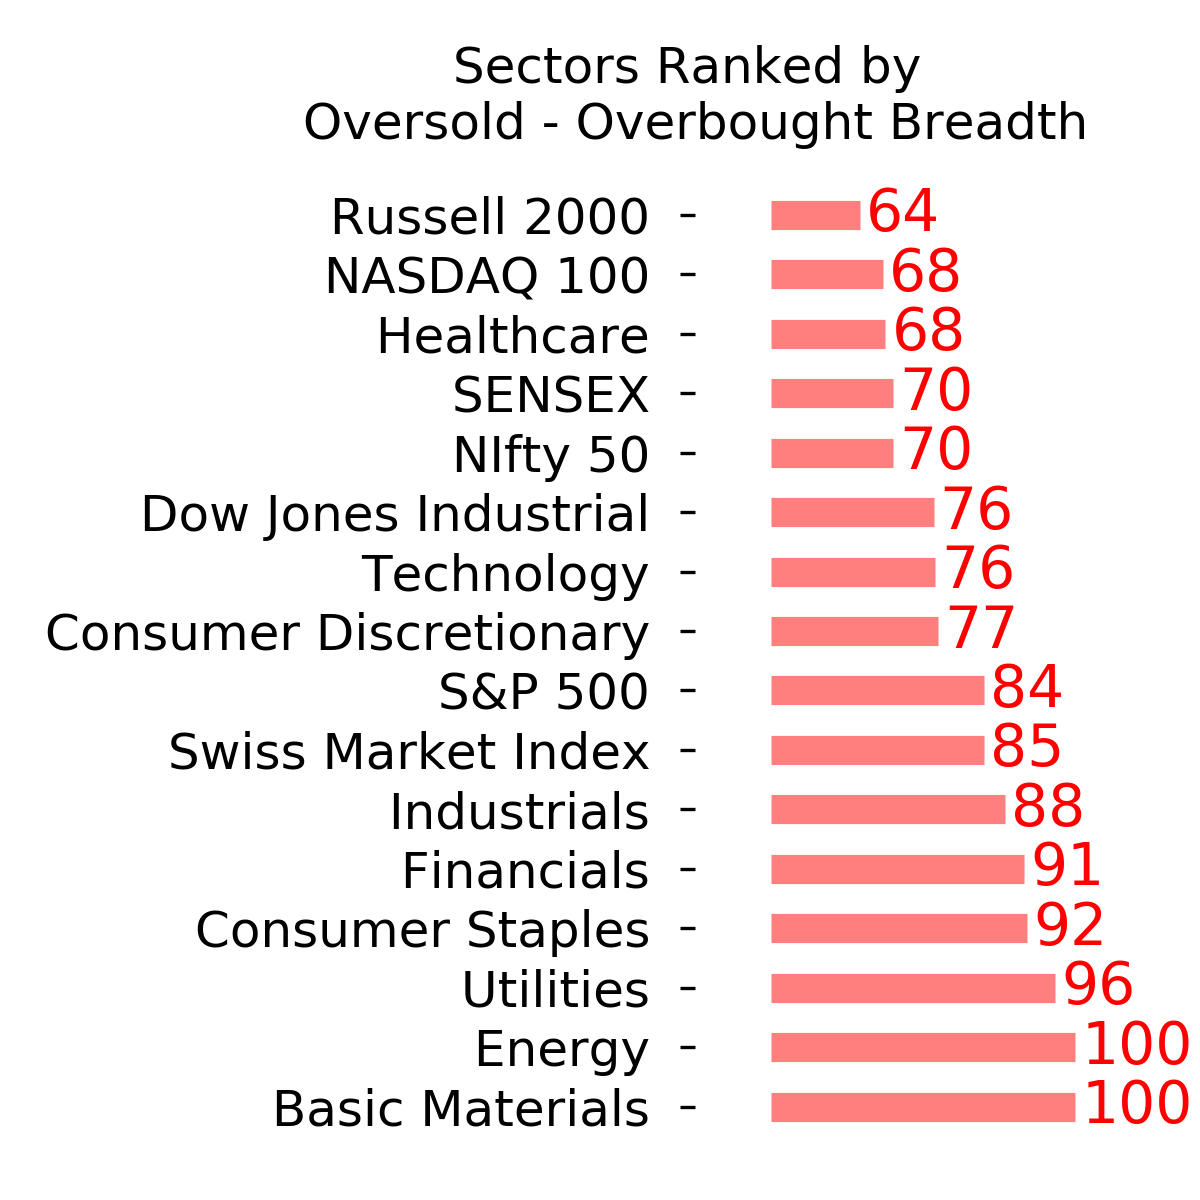
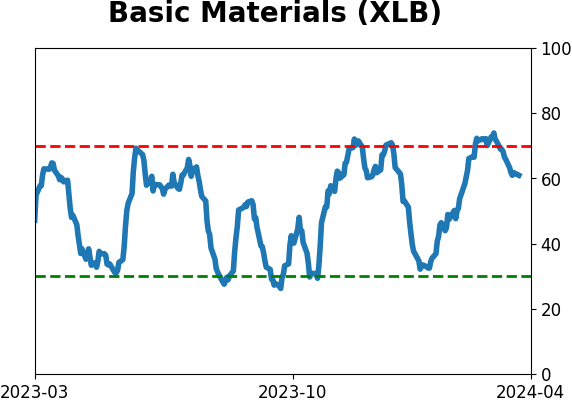
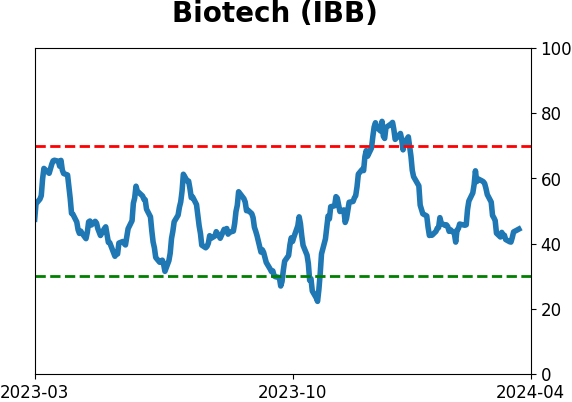
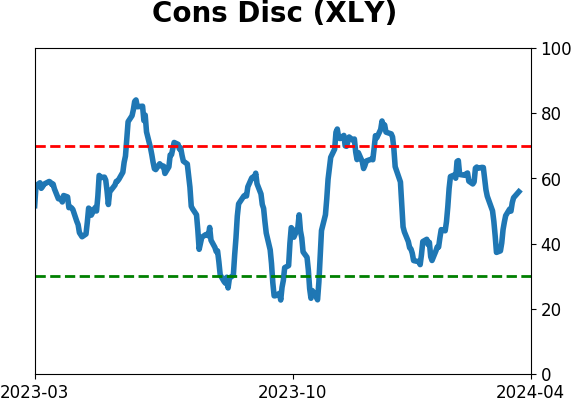
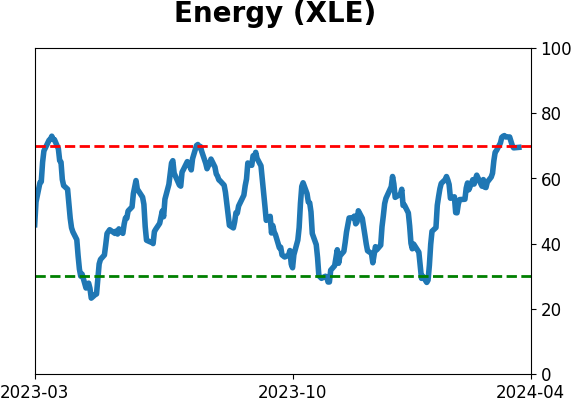
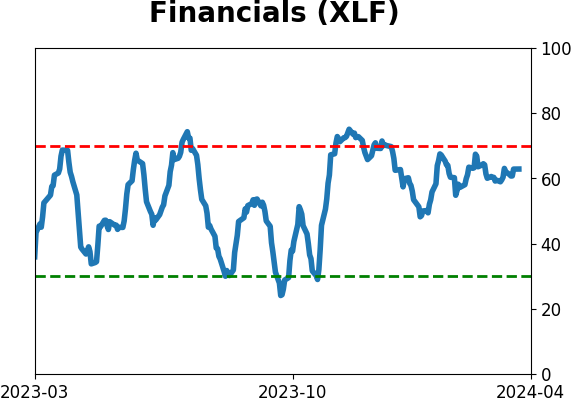
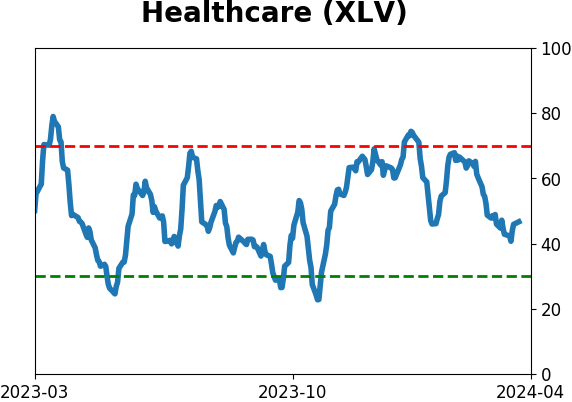
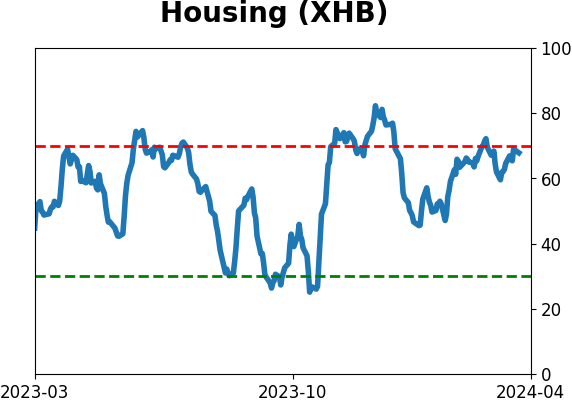
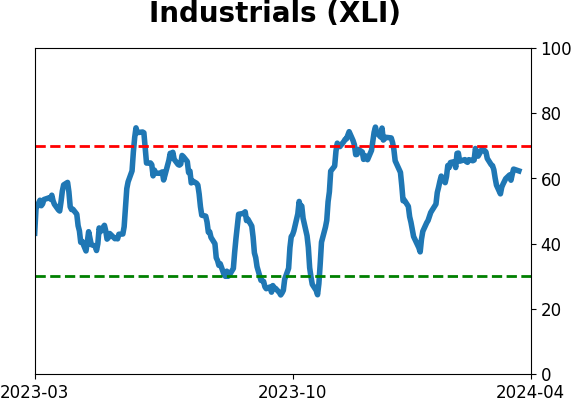
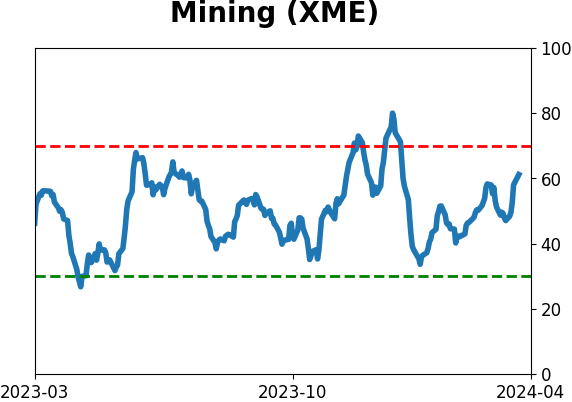
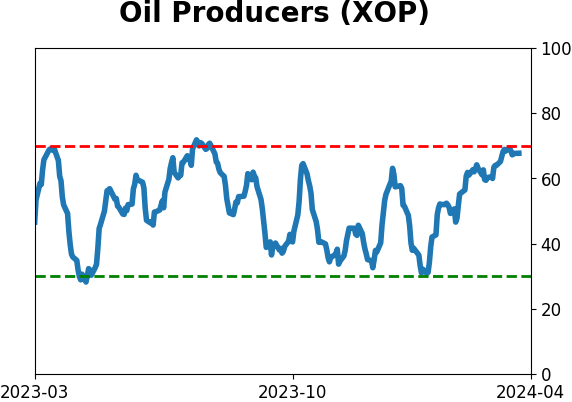
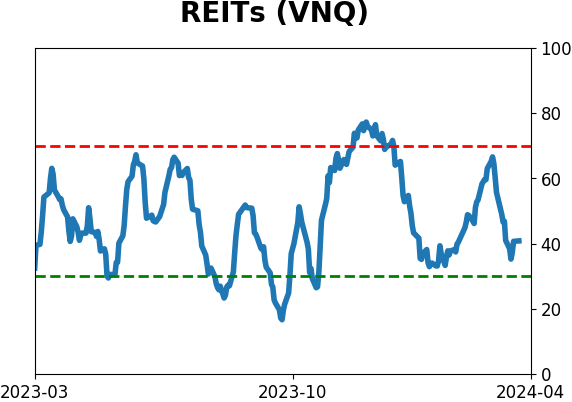
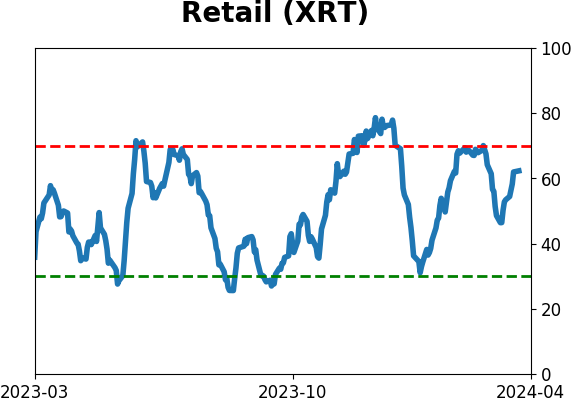
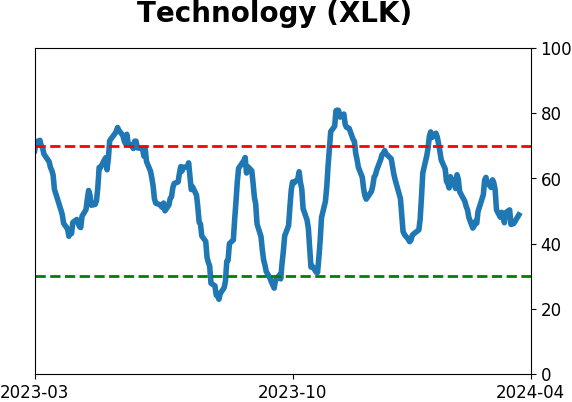
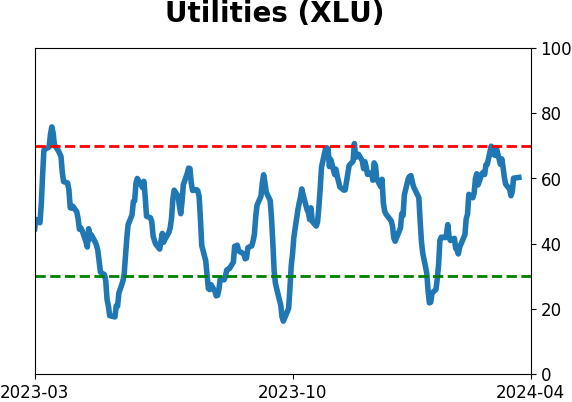
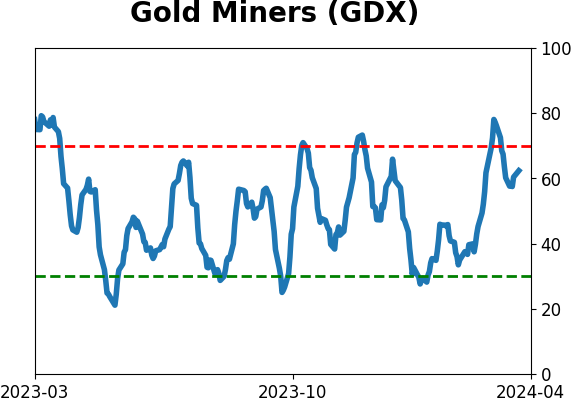
Sector ETF's - 10-Day Moving Average
|
|
|
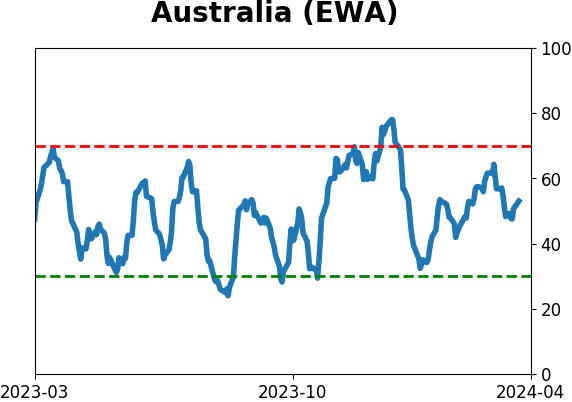
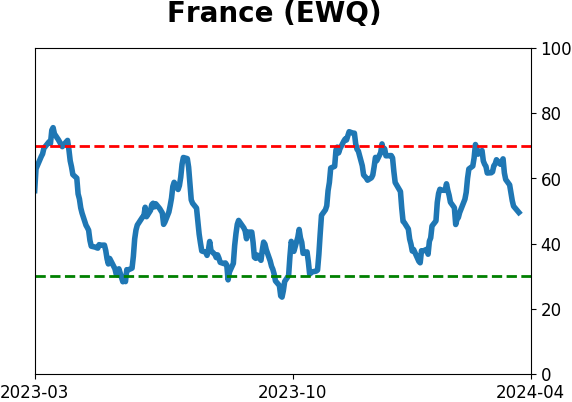
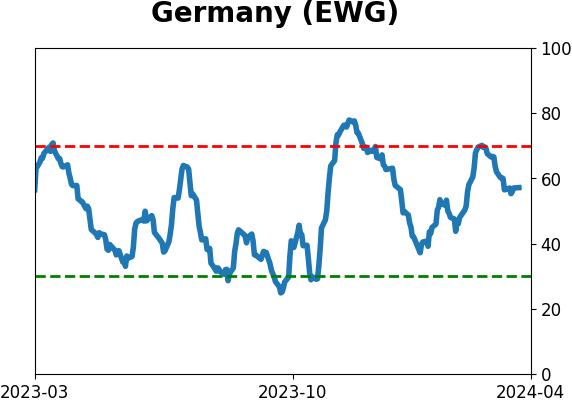
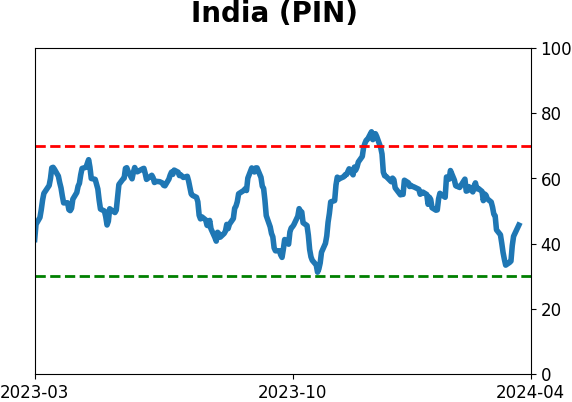
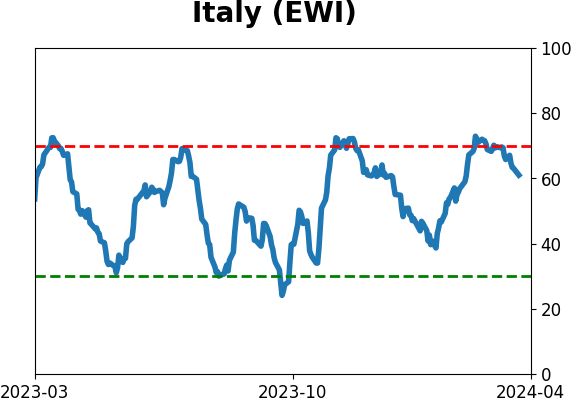
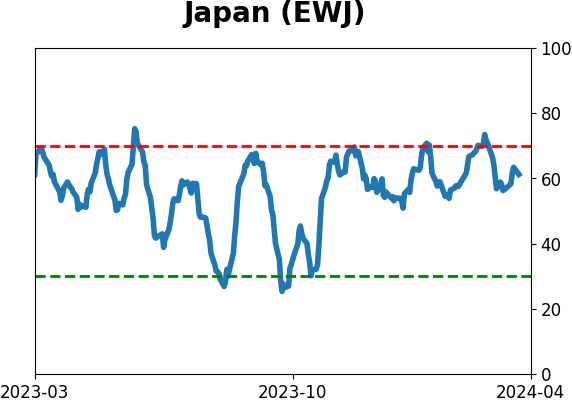
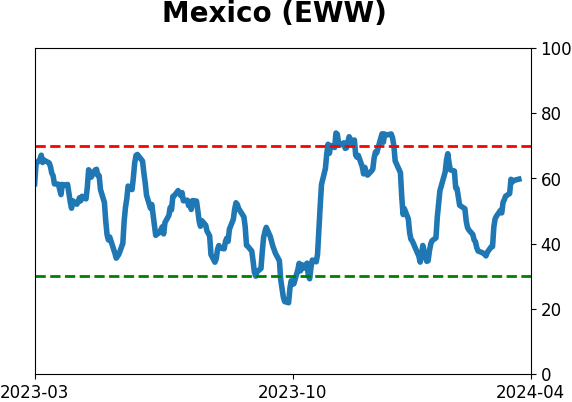
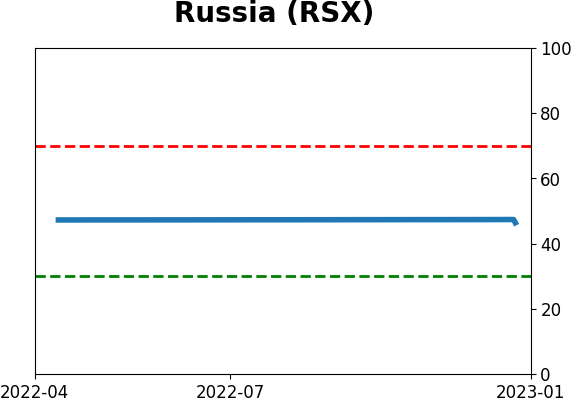
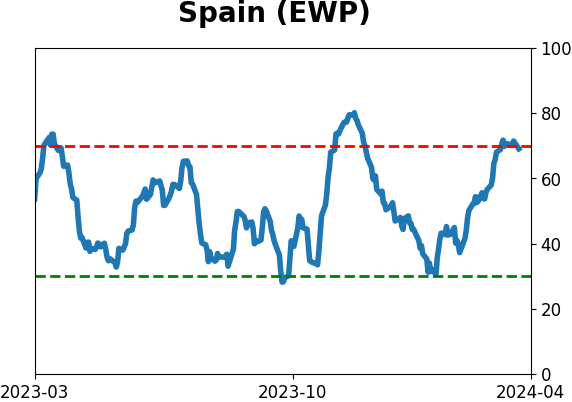
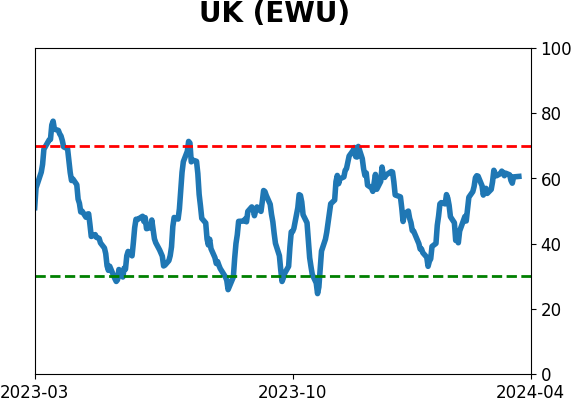
Country ETF's - 10-Day Moving Average
|
|
|
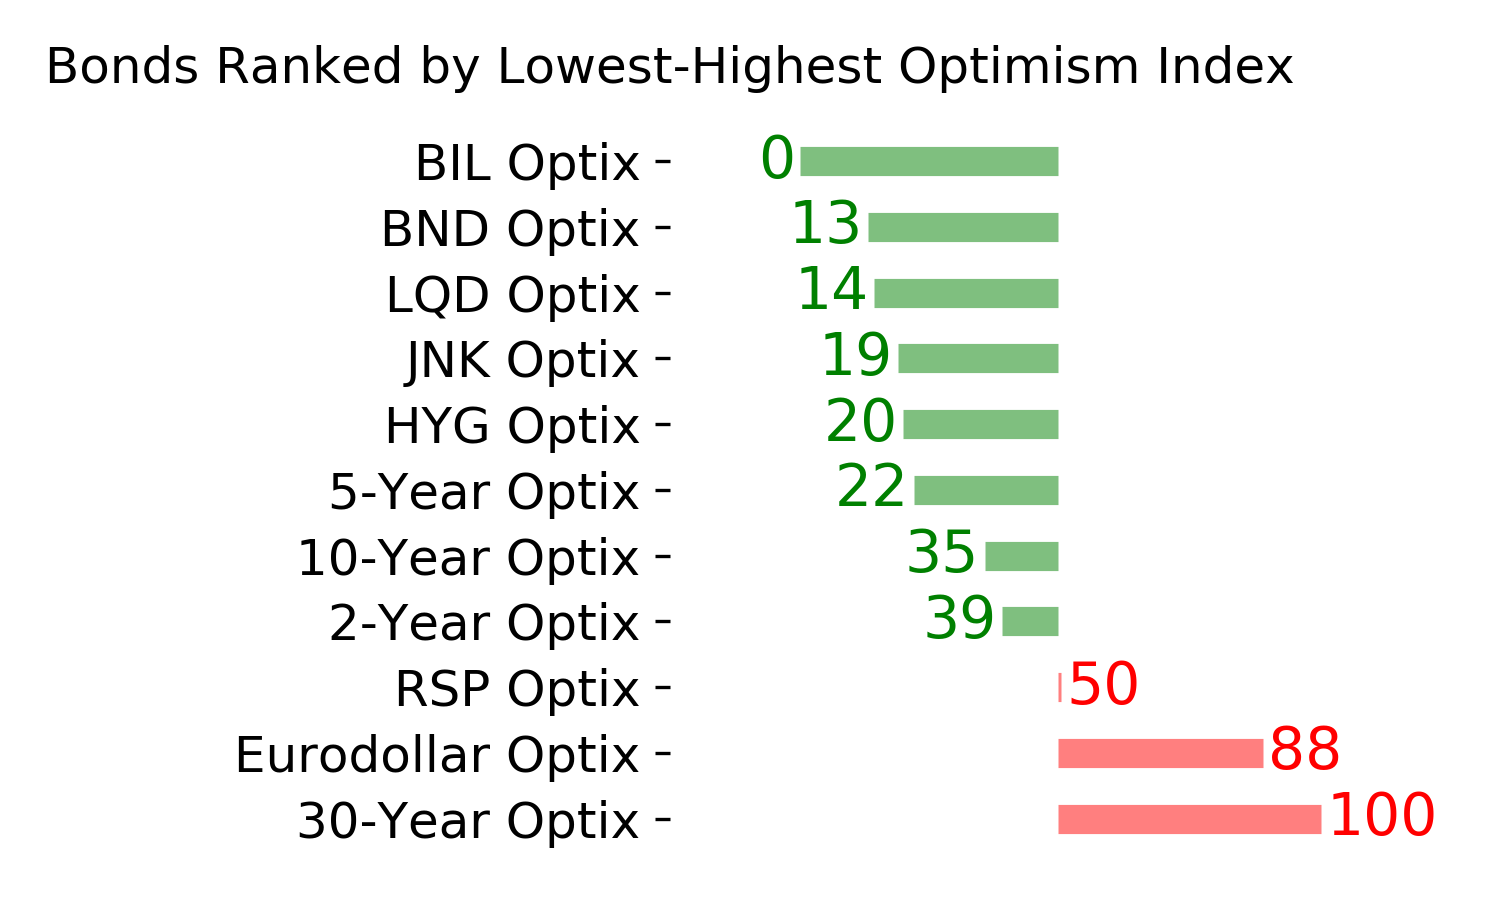
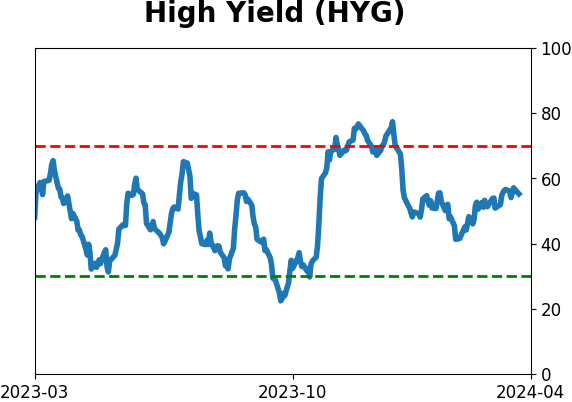
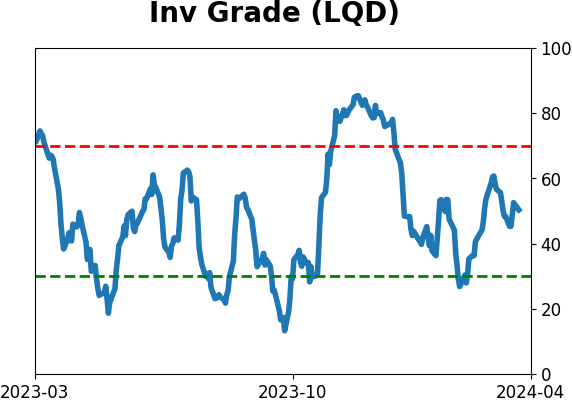
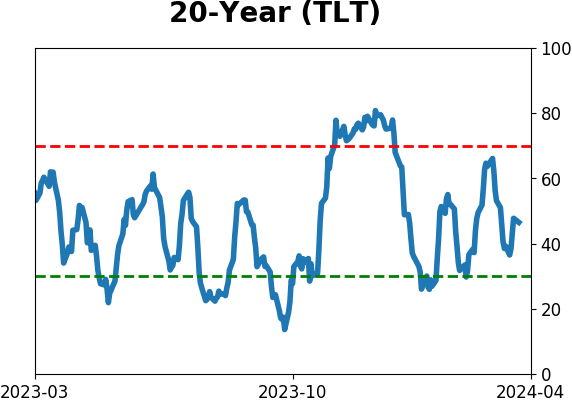
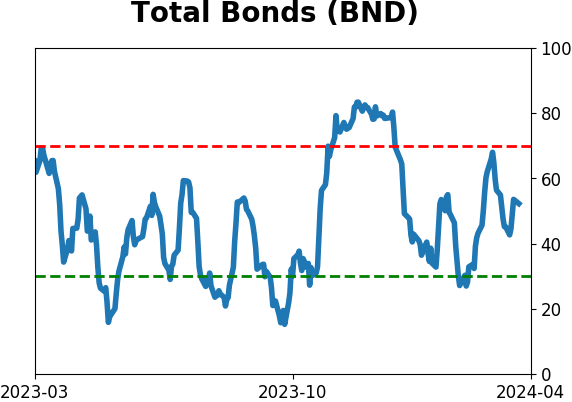
Bond ETF's - 10-Day Moving Average
|
|
|
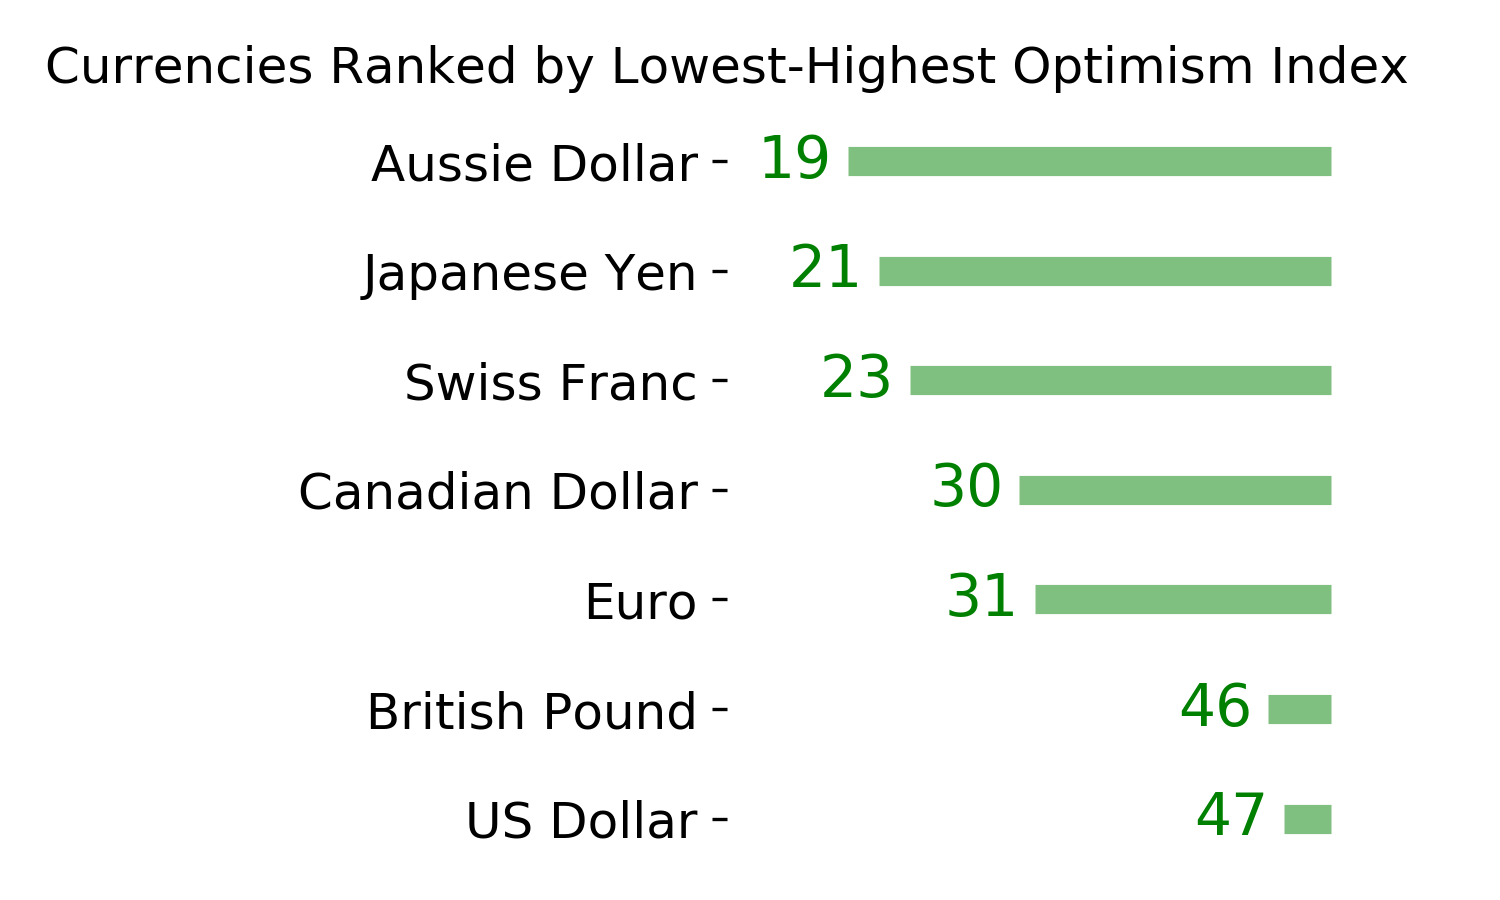
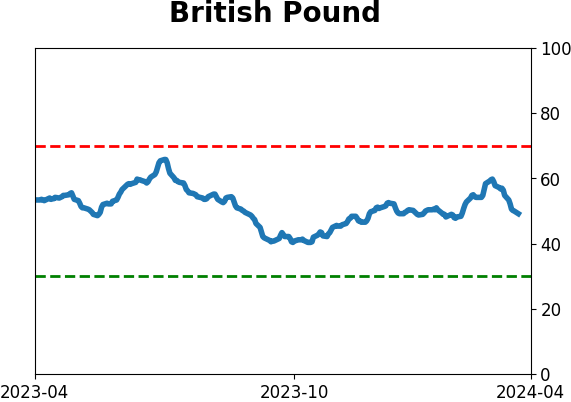
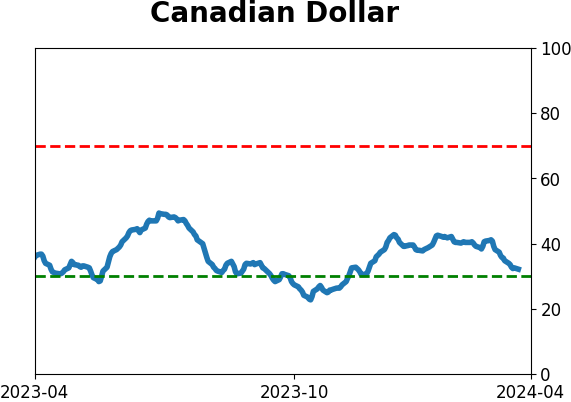
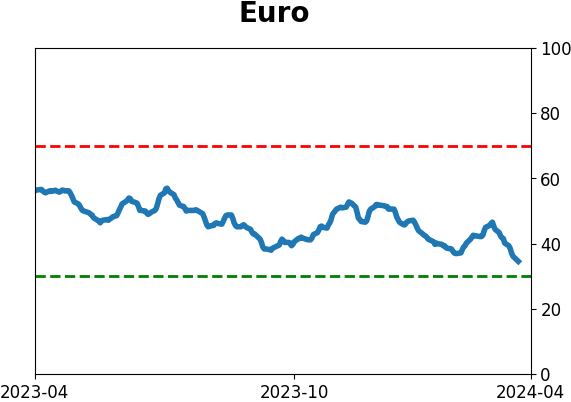
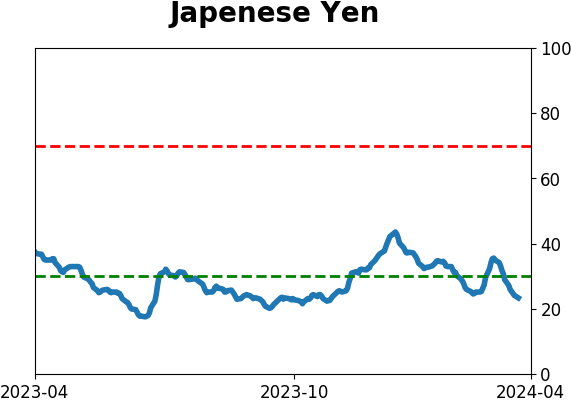
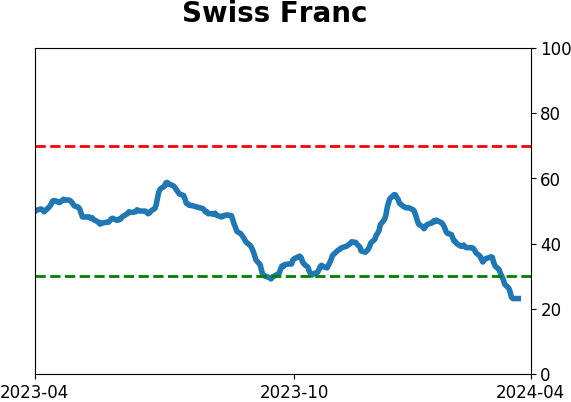
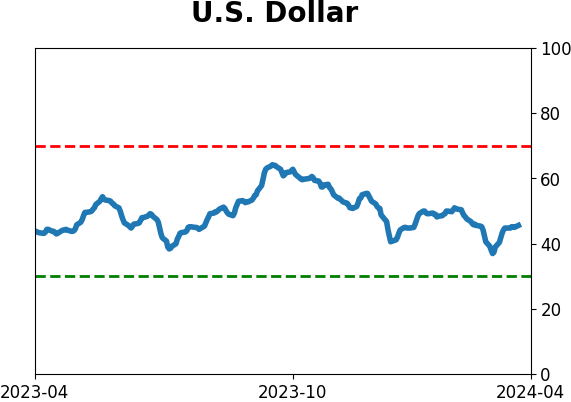
Currency ETF's - 5-Day Moving Average
|
|
|
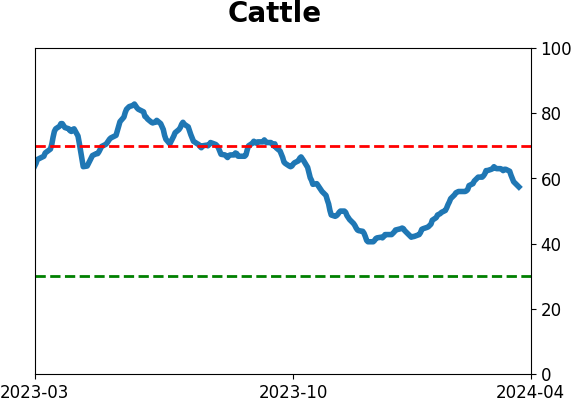
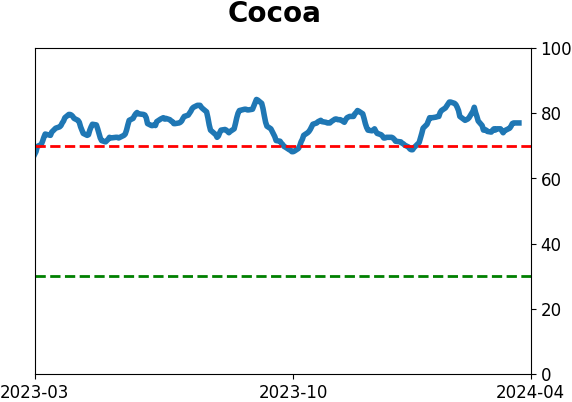
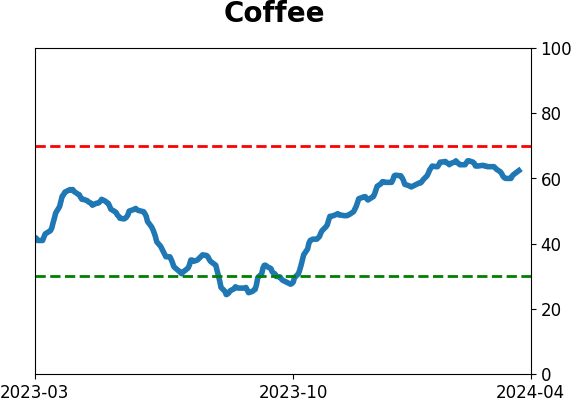
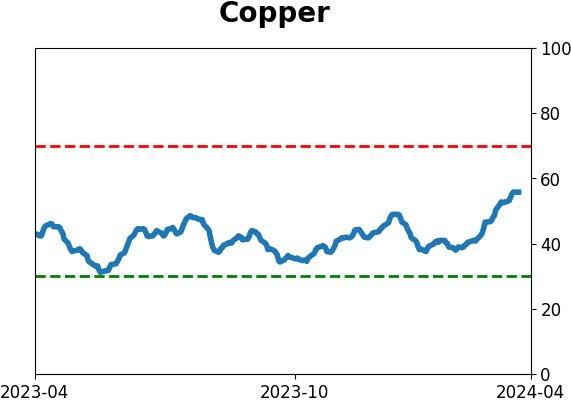
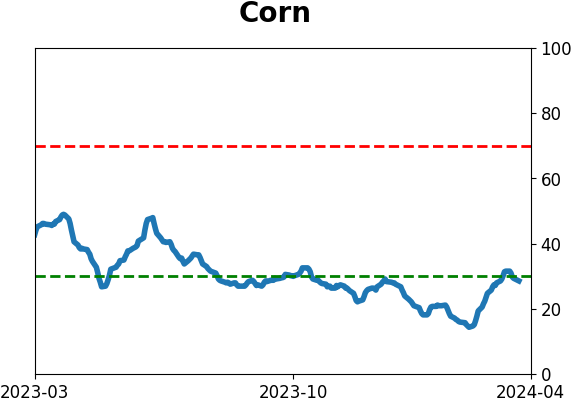
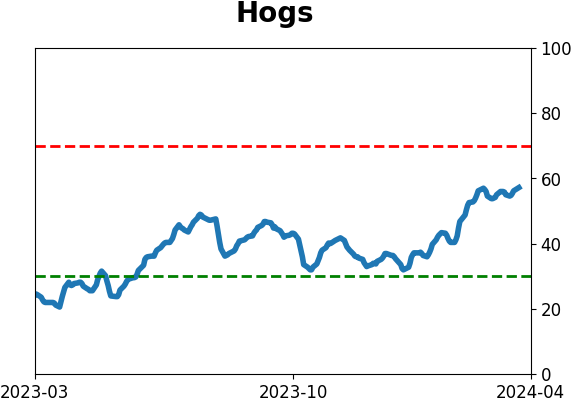
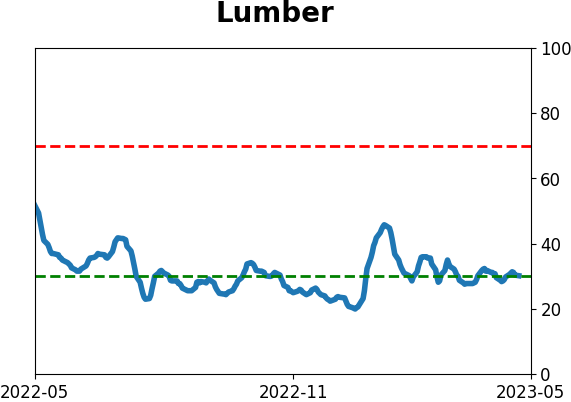
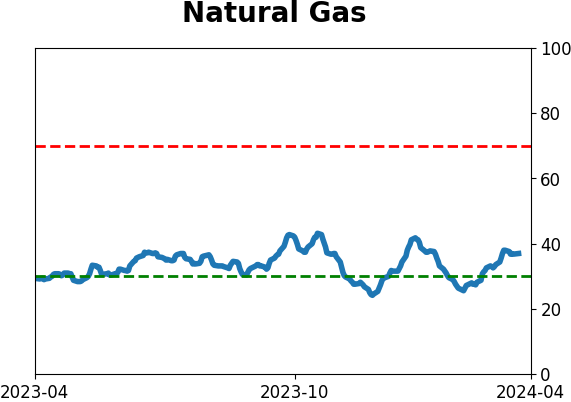
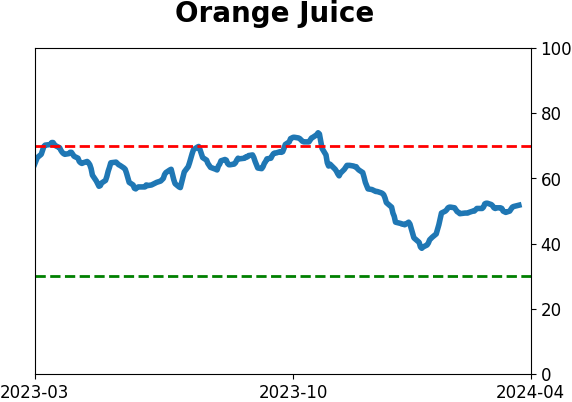
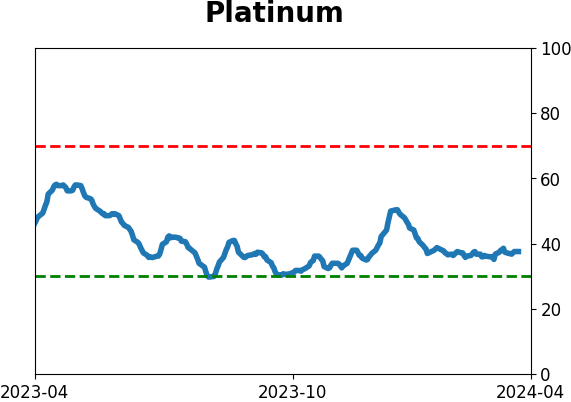
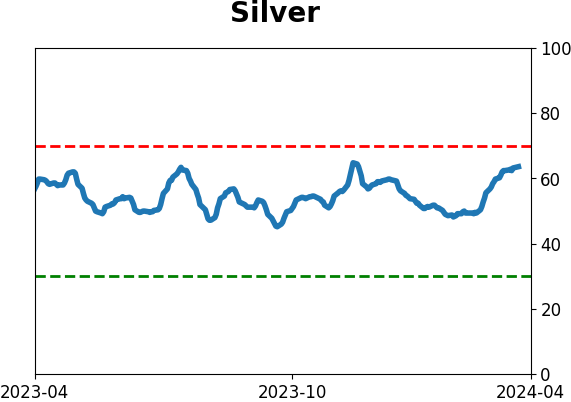
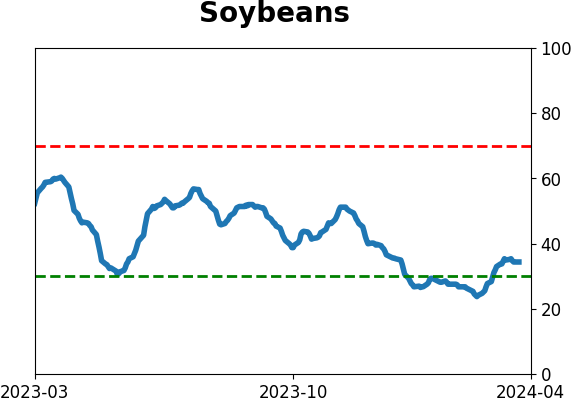
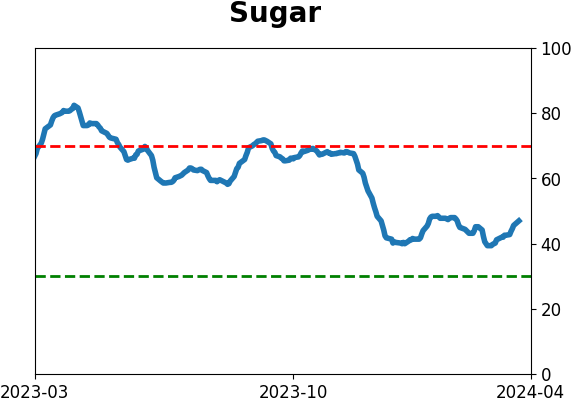
Commodity ETF's - 5-Day Moving Average
|
|