
A bullish buy signal from margin debt

Key points:
- NYSE margin debt growth cycled from less than -33% to greater than -1%
- The S&P 500 was higher a year later every time after similar recoveries in margin debt
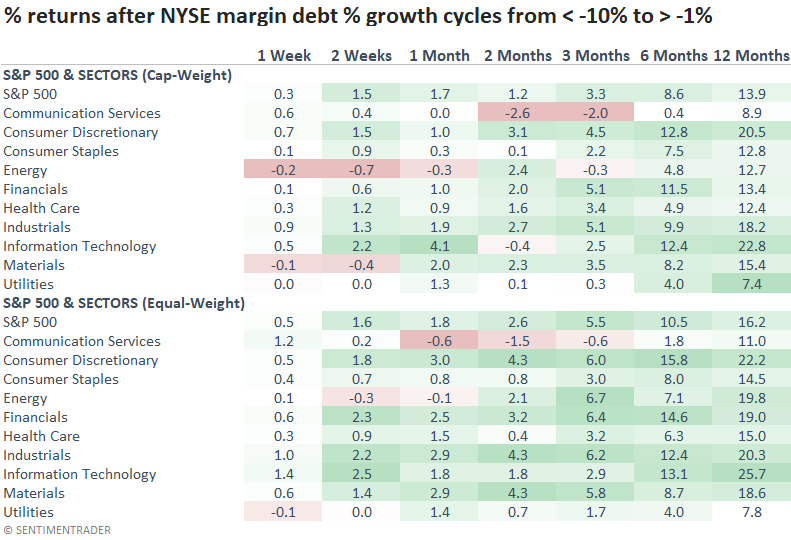
- Technology and Consumer Discretionary outperform other sectors over the next six and twelve months
A real money measure of market sentiment turns bullish
Over the last six months, I've shared several bullish survey-based sentiment signals from Investors Intelligence and the American Association of Individual Investors. While effective, surveys generally measure what people say rather than what they actually do.
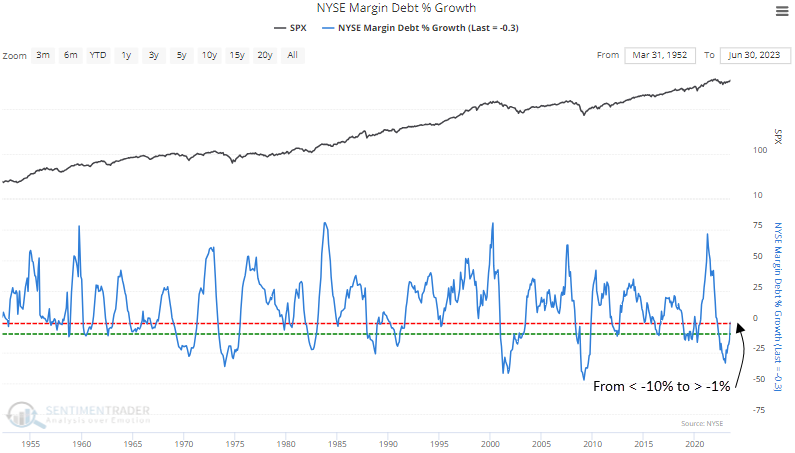
One of the real money sentiment indicators that we maintain on the website is NYSE margin debt. Margin debt is the amount of money an investor borrows from their broker via a margin account and acts as a sentiment gauge for the stock market, reflecting the prevailing attitudes of investors.
A rise in margin debt indicates increased optimism, with investors willing to take on more leverage to capitalize on potential gains. Conversely, a decline in margin debt signifies negative sentiment, as investors become more risk-averse and hesitant about the stock market's future.
Similar to other sentiment measures, the most effective margin debt signals occur when the indicator reverses from an extreme.
NYSE margin debt % growth, which measures the year-over-year percentage change in margin debt, declined to the 4th lowest level in more than 70 years and subsequently reversed higher, triggering a bullish signal for stocks.
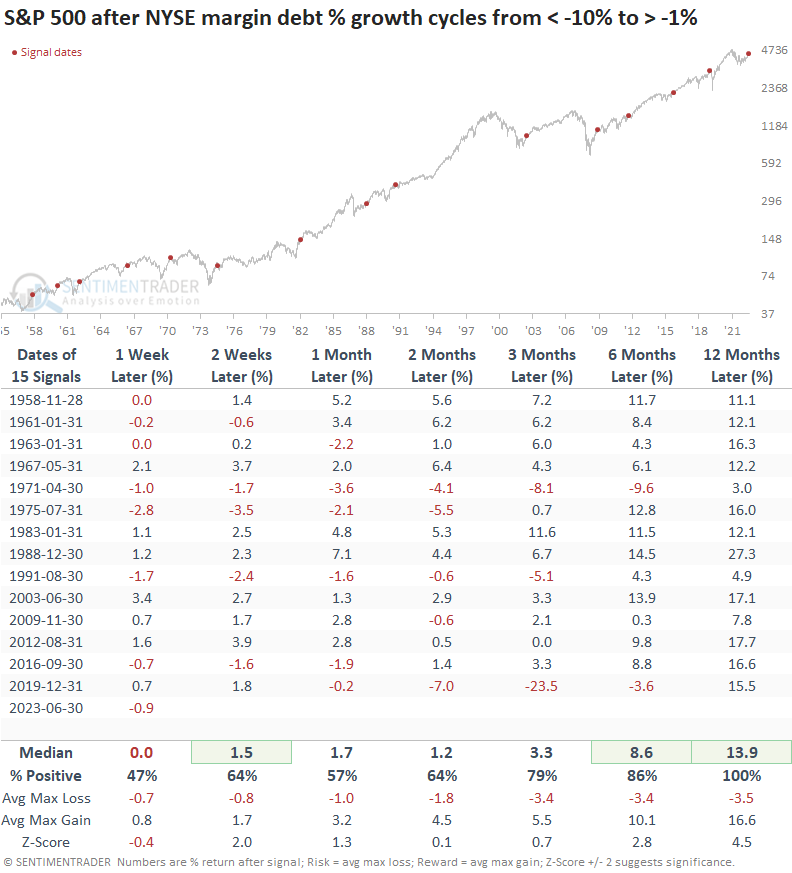
Similar reversals in margin debt growth preceded excellent returns
When the year-over-year change in NYSE margin debt cycles from less than -10% to greater than -1%, the S&P 500 was higher a year later every time. I lowered the threshold for a signal to -10% to capture more precedents.
Because margin debt is a monthly series reported in the third week of each month and reflects data from the previous month, I would classify the alert as a big-picture confirmation signal that should be used in a broader weight of the evidence approach.
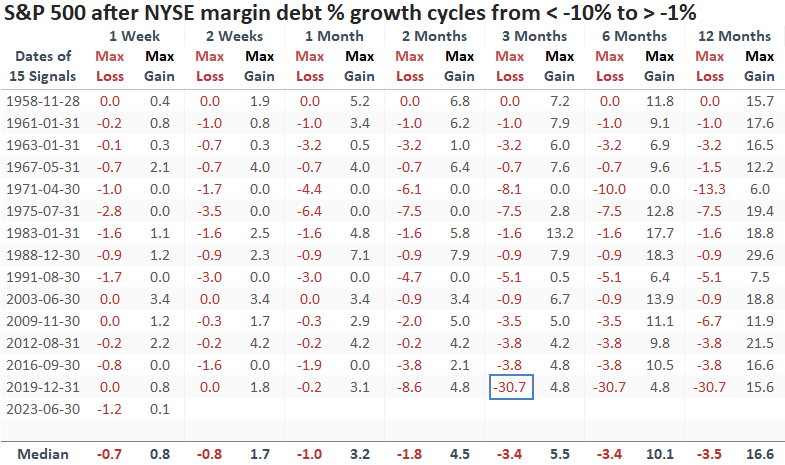
Over the next three and six months, only one alert incurred a max loss of greater than -10%. That instance took place right before the COVID lockdown. A year later, the max gain exceeded the max loss in 13 out of 15 precedents.
Consumer Discretionary and Technology, two sectors with bullish relative trends, tend to outperform after margin debt signals.
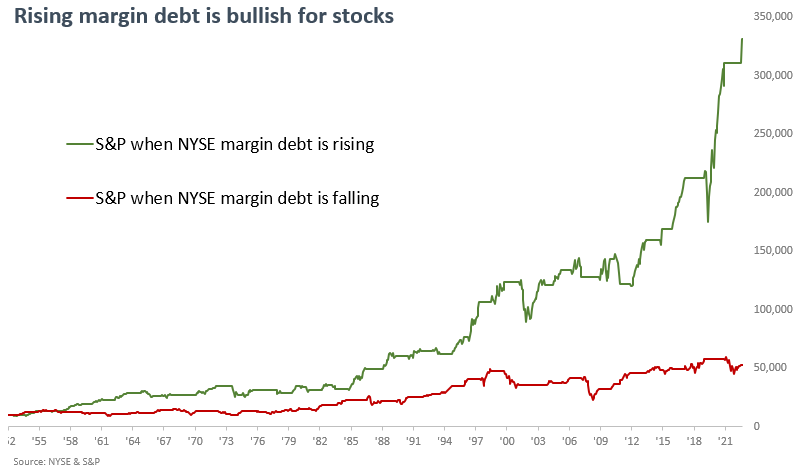
A trend-following system for NYSE margin debt
In an effort to comprehend the impact of margin debt on the stock market, I devised a straightforward trend-following system. This system applies a 6-month moving average to the year-over-year growth in margin debt. If the moving average exceeds the value from six months ago, the system initiates a purchase of the S&P 500. In contrast, if the average falls below the value from six months ago, it exits the market.
Utilizing the trend-following rules, a $10,000 investment in the S&P 500 soars to $331,000 when margin debt increases. Conversely, a decline in margin debt results in significantly smaller growth, with the initial investment reaching only $52,000.
What the research tells us...
After reaching one of the lowest levels in history, margin debt growth, a gauge of market sentiment, has reversed, suggesting investors are now more optimistic about the stock market. After similar recoveries, the S&P 500 was higher a year later every time. Cyclical sectors like Consumer Discretionary and Technology tend to outperform. When the trend for margin debt is rising, the backdrop for stocks is bullish.
Historically, margin debt growth becomes problematic for the stock market when it increases above 60% and reverses below 28%.