Headlines
|
|
A horrible quarter for safe havens:
The current quarter saw heavy losses in gold and bonds, among the worst in their histories. For both markets, this has preceded good returns going forward, at least in recent decades. This safe-haven selling was not necessarily a contrary signal for stocks.
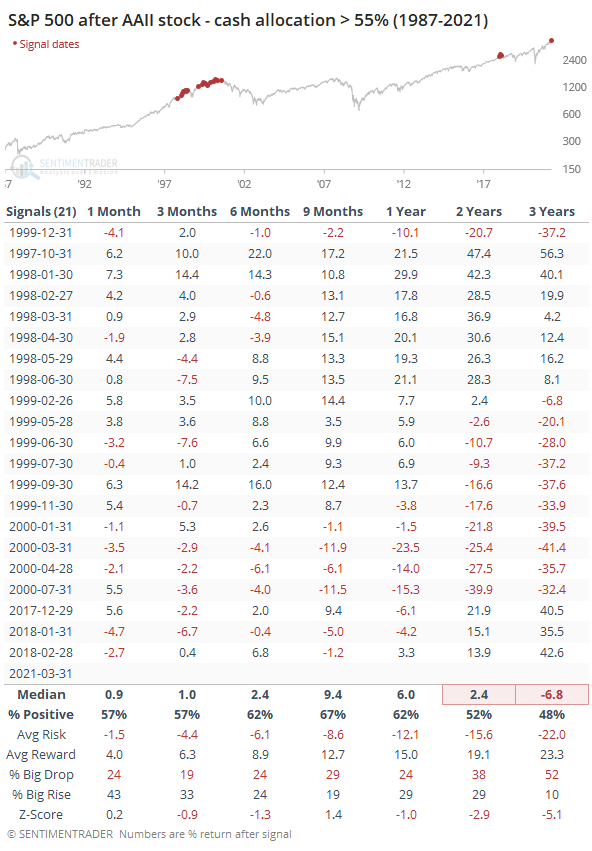
All in: Individual investors in the monthly asset allocation survey from the American Association of Individual Investors showed a jump in their exposure to stocks while sitting on a dwindling cash cushion. They now hold 55% more in stocks than cash for only the 22nd month out of the 402 months in the survey's history.
Bottom Line:
See the Outlook & Allocations page for more details on these summaries STOCKS: Weak sell
The extreme speculation registered in January and February is starting to get wrung out. Internal dynamics have mostly held up, so a return to neutral sentiment conditions would improve the forward risk/reward profile substantially. We're still a ways off from that. BONDS: Weak buy
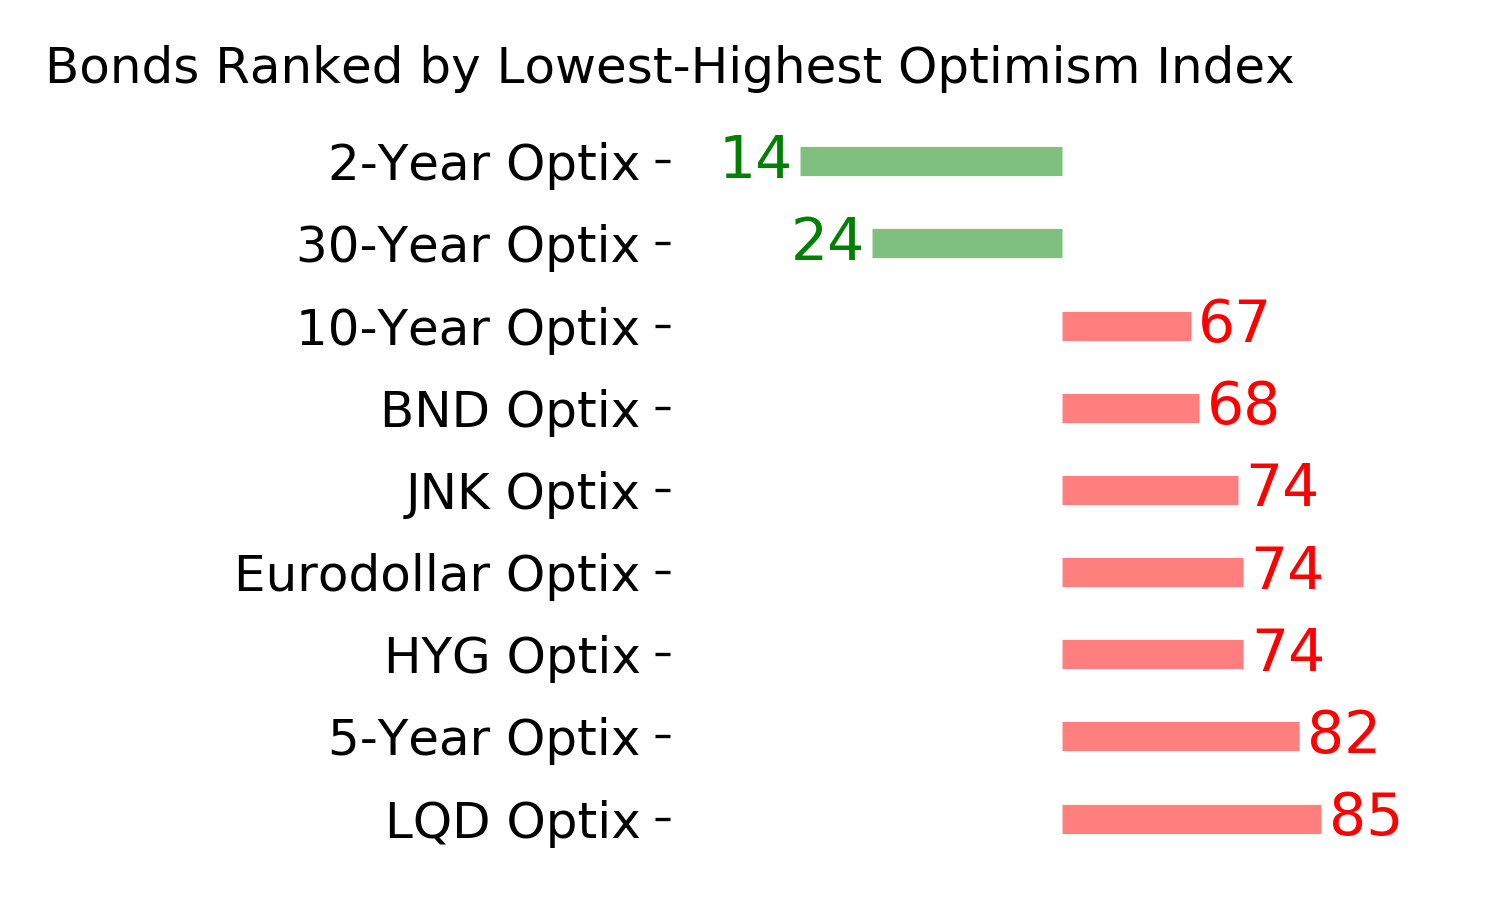
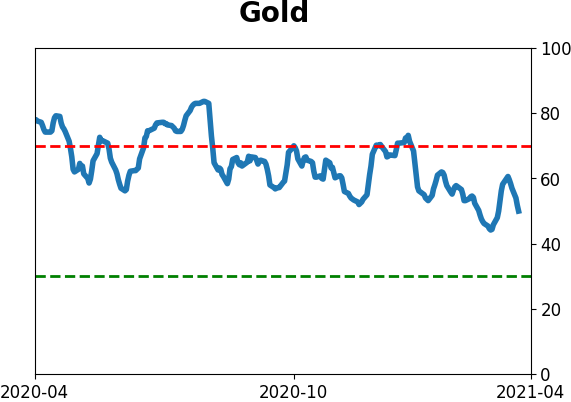
Various parts of the market have been hit in recent weeks, with mild oversold conditions. The Bond Optimism Index is now about as low as it gets during healthy bond market environments. Fixed income isn't responding well, so that needs to be monitored in case it's transitioning to a longer-term negative market environment. GOLD: Weak buy
A dollar trying to rebound from a severe short position has weighed on gold and miners. The types of signals they've given in recent weeks, within the context of their recent surge, have usually resulted in higher prices over a medium- to long-term time frame. Like bonds, gold and miners aren't responding very well, and this needs to be monitored.
|
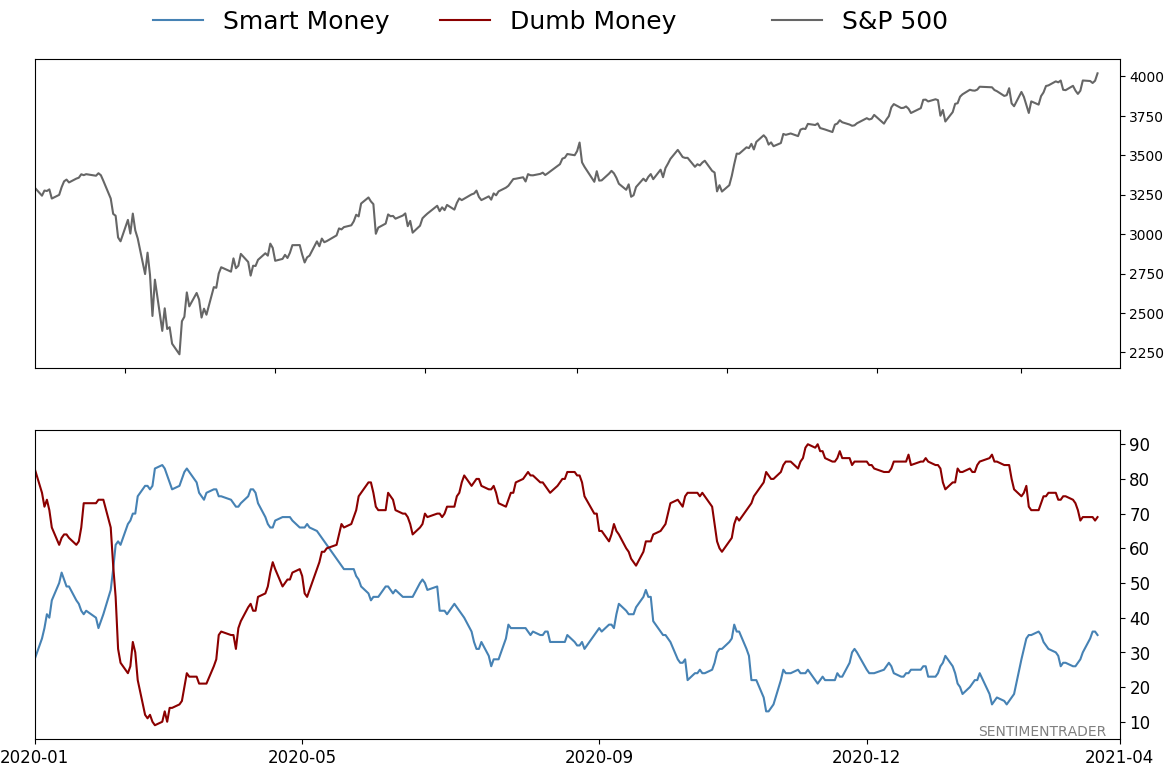
Smart / Dumb Money Confidence
|
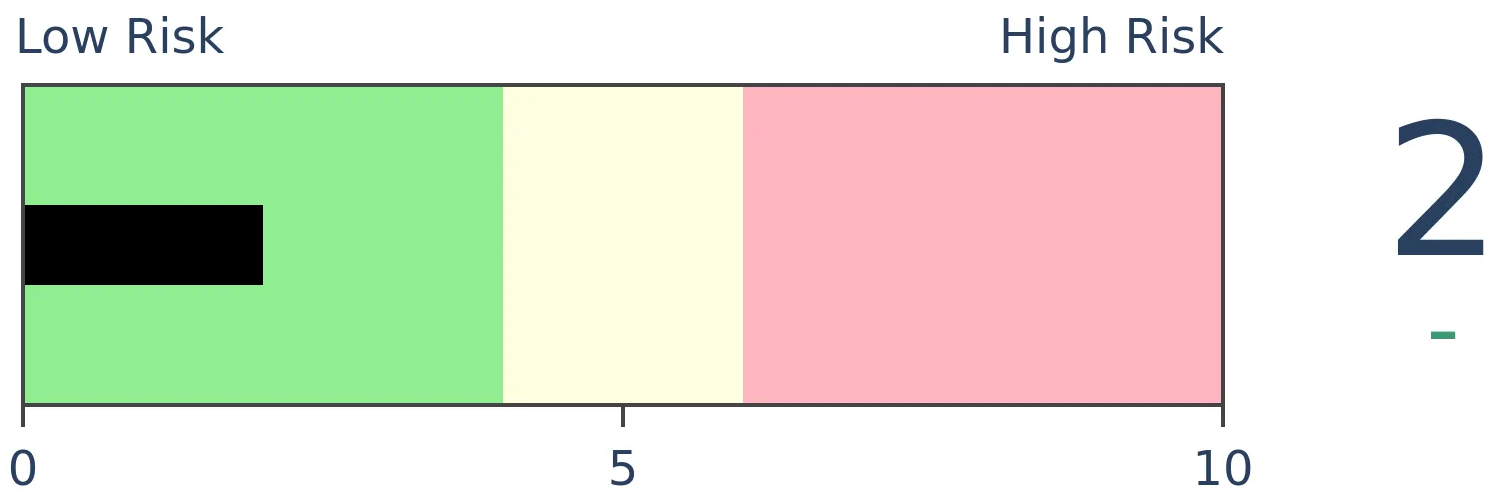
Smart Money Confidence: 35%
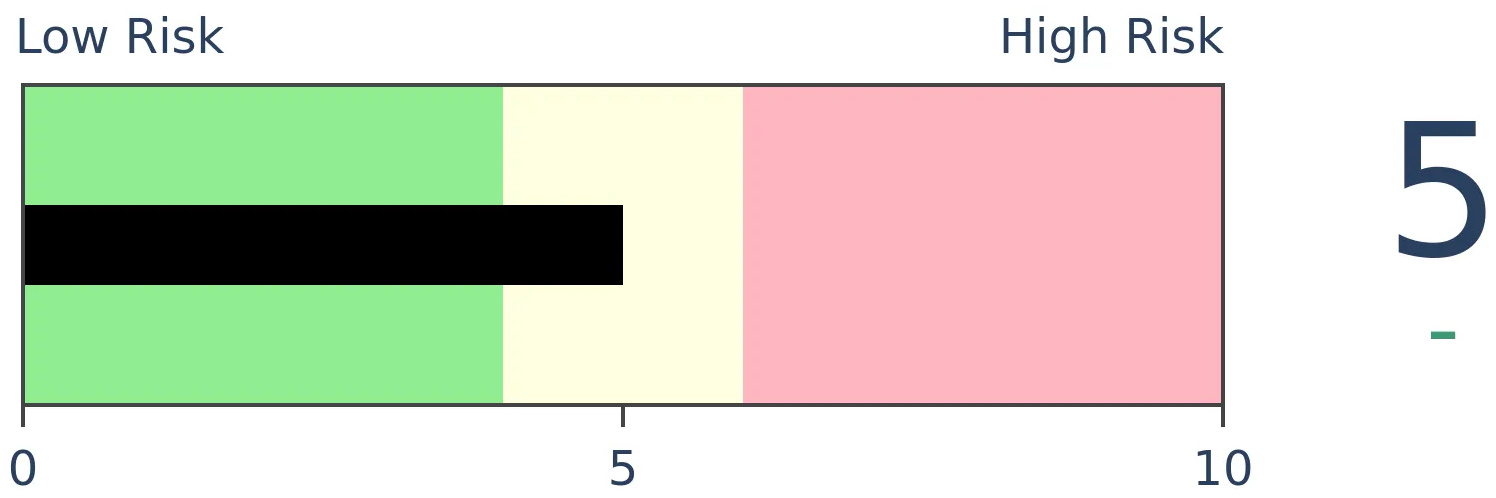
Dumb Money Confidence: 69%
|
|
Risk Levels
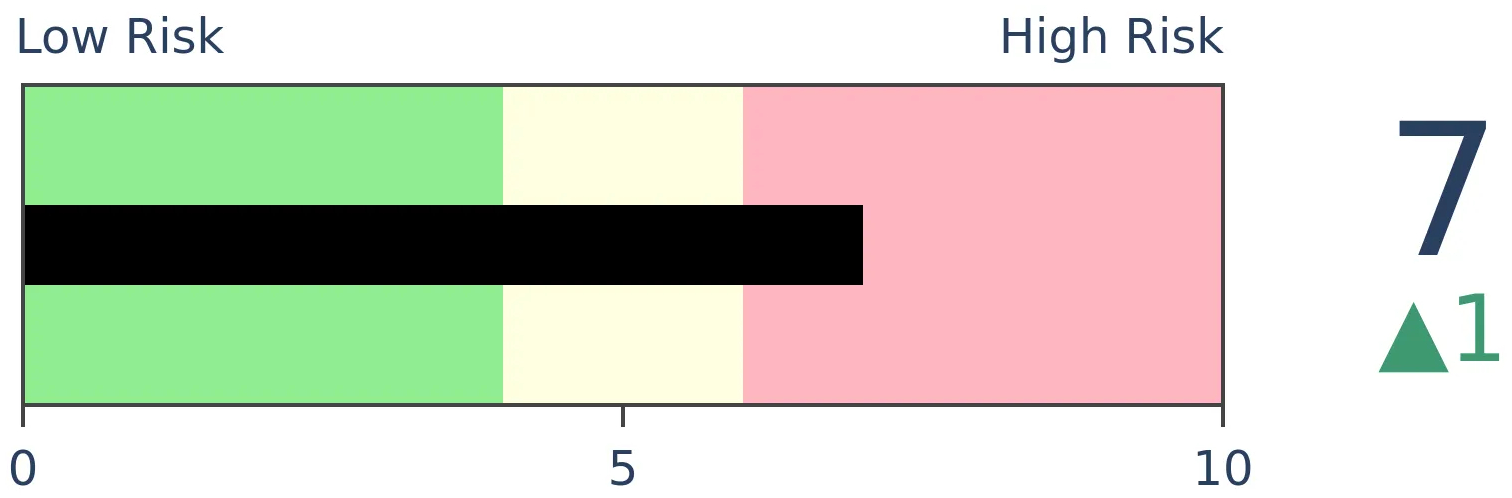
Stocks Short-Term
|
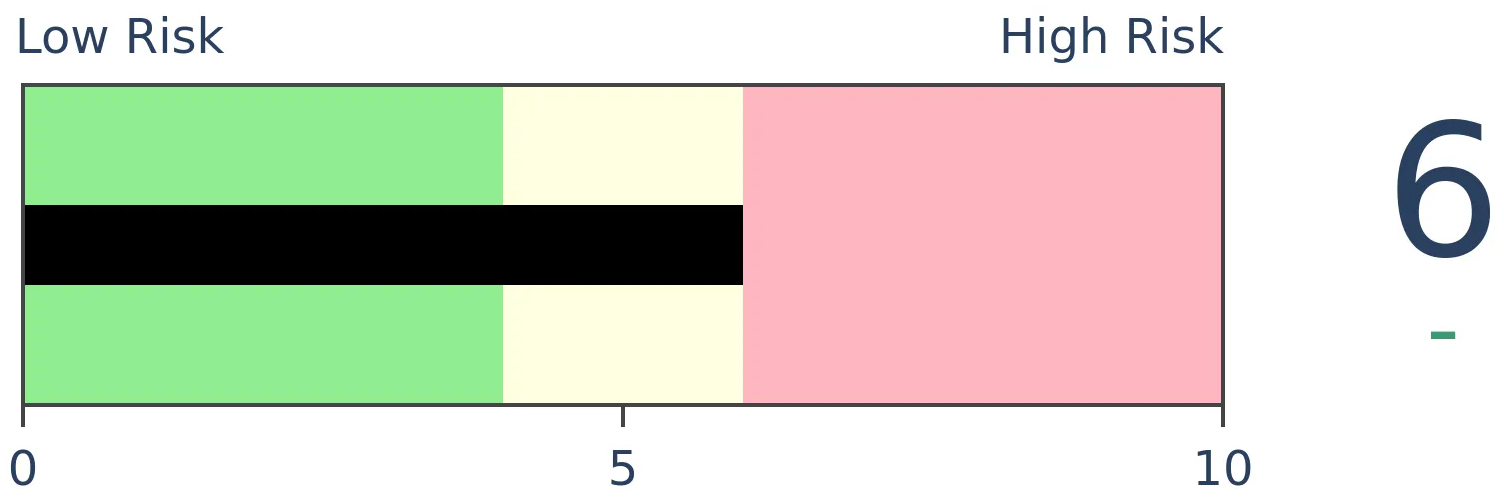
Stocks Medium-Term
|
|
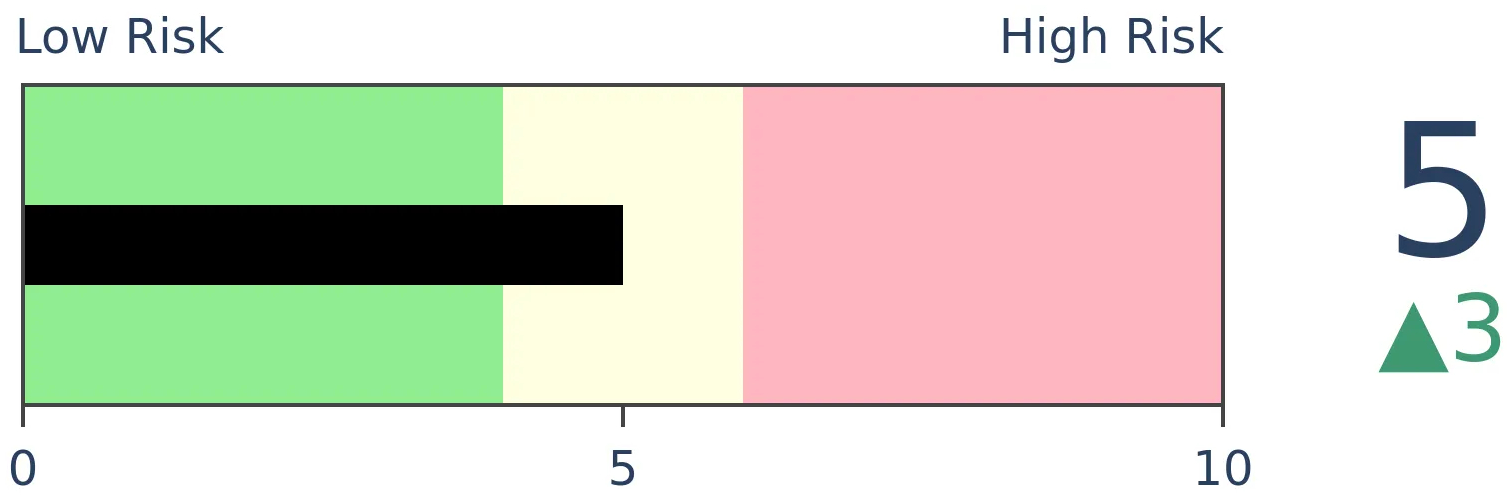
Bonds
|
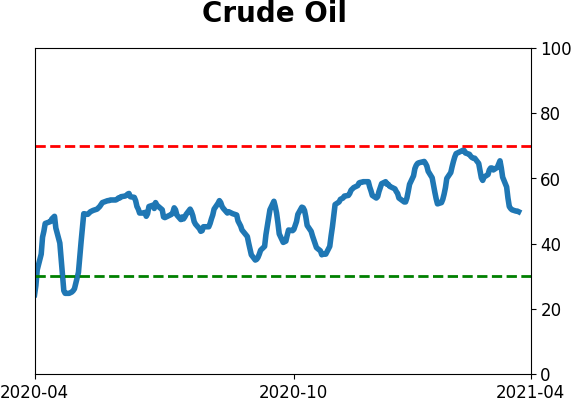
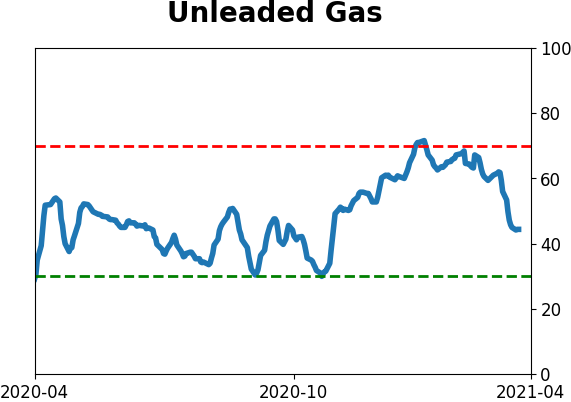
Crude Oil
|
|
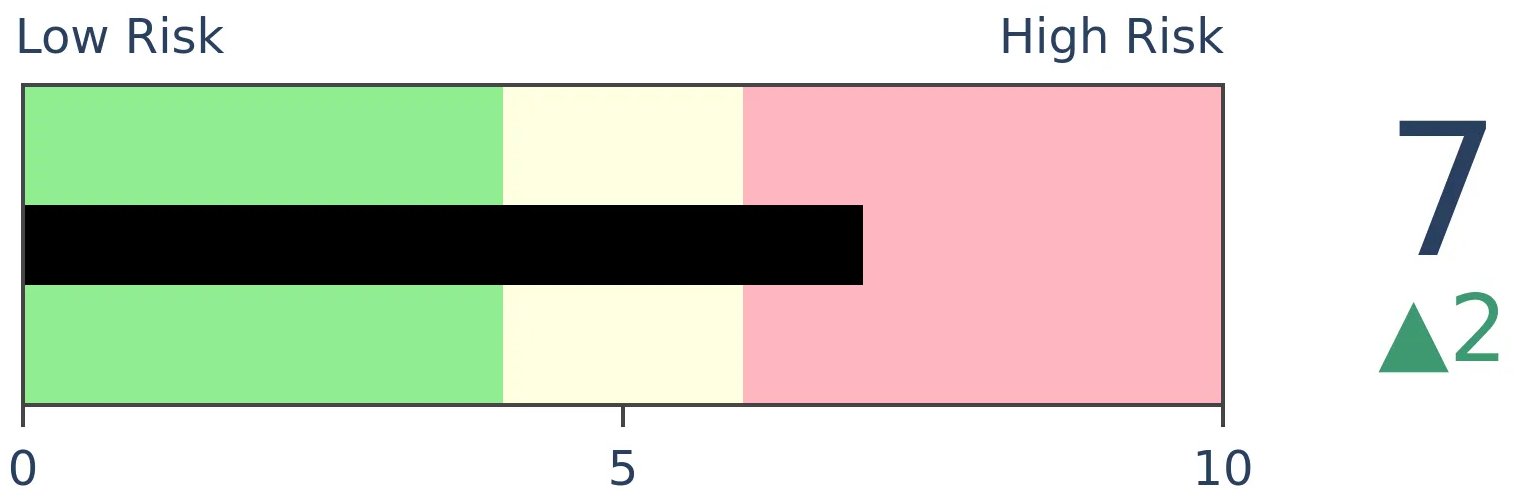
Gold
|
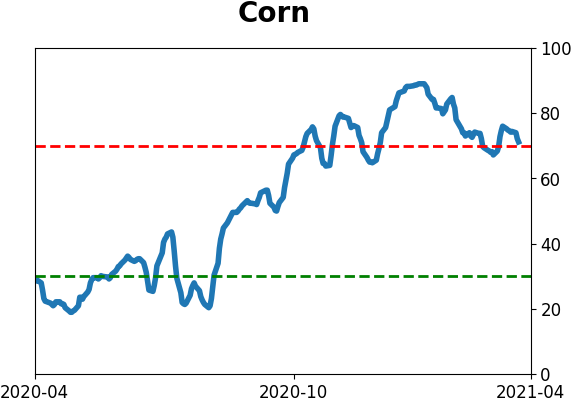
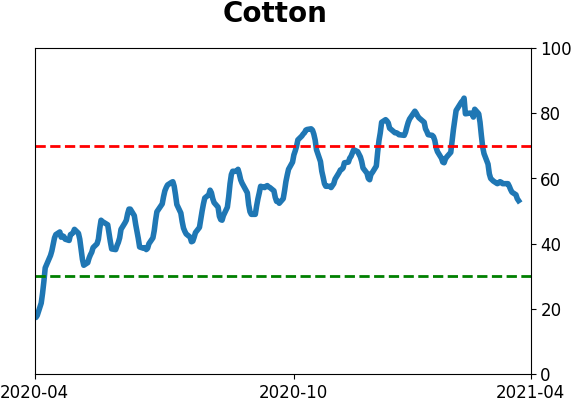
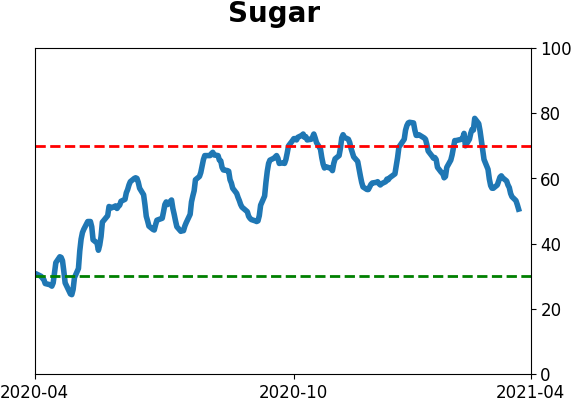
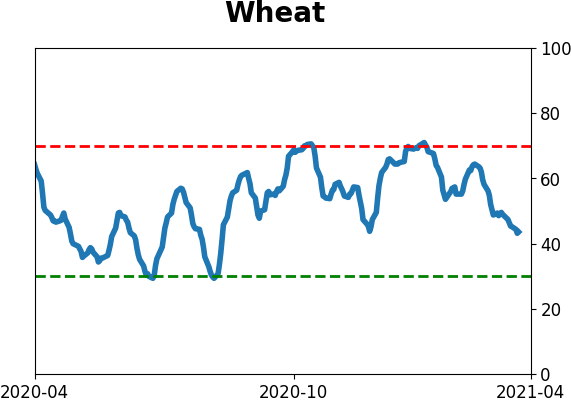
Agriculture
|
|
Research
BOTTOM LINE
The current quarter saw heavy losses in gold and bonds, among the worst in their histories. For both markets, this has preceded good returns going forward, at least in recent decades. This safe-haven selling was not necessarily a contrary signal for stocks.
FORECAST / TIMEFRAME
GLD -- Up, Long-Term
|
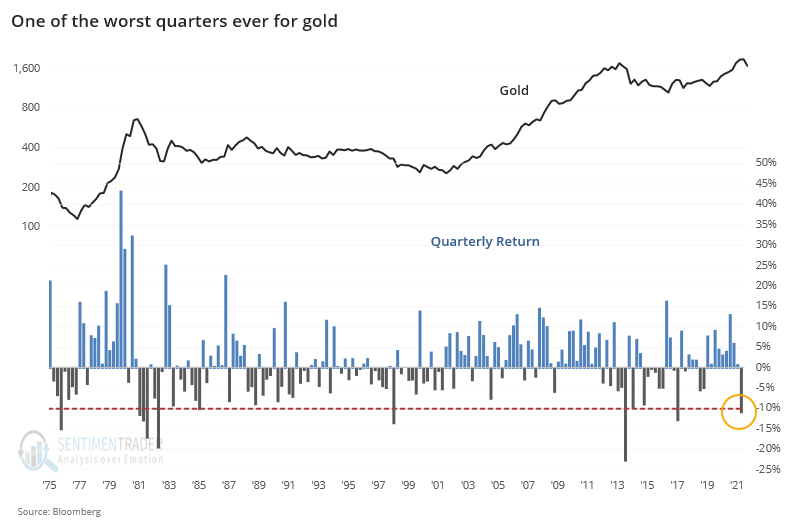
During a mostly positive quarter for stocks - depending on where in the stock universe you were concentrated - other major markets got hit hard. For both gold and bonds, it was among the worst ever.
For gold, a 10% quarterly loss is unusual. In nearly 50 years, there had only been 9 other quarters with a loss this large.
In terms of what it meant going forward, the answer was "not much." That's mostly thanks to the huge volatility in the years surrounding 1980, though - after that, all four of the quarters with massive losses ended up leading to gains for gold during the months ahead.
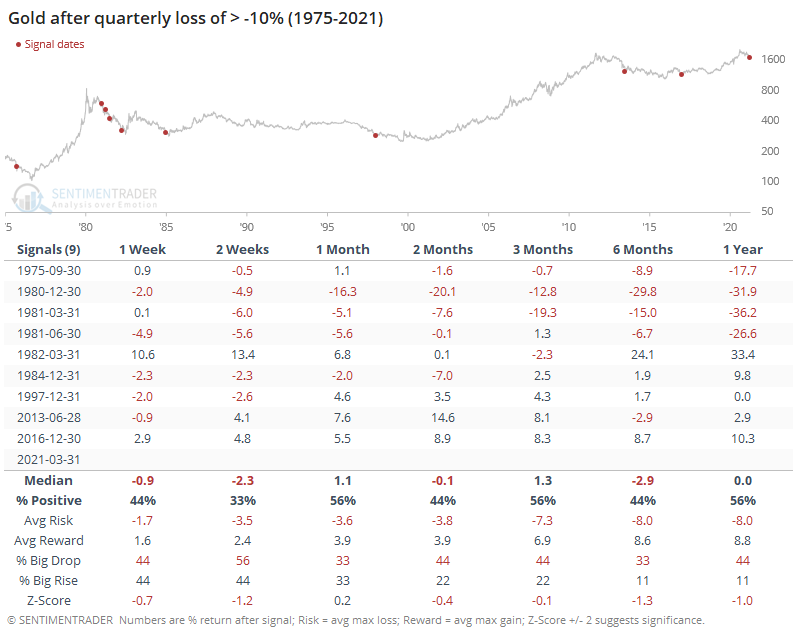
If we want to commit the cardinal sign of ignoring anything prior to the last 40 years simply because they were ugly, then we can get a better handle on the risk vs reward of the good signals in more recent decades.
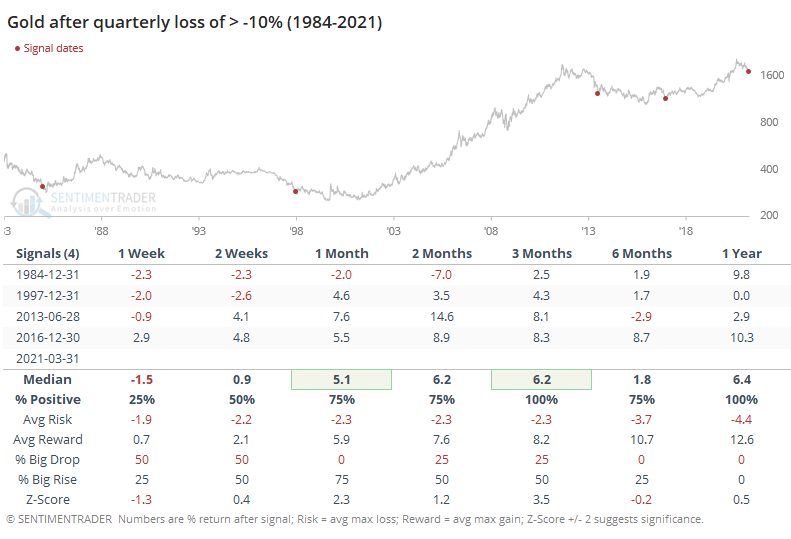
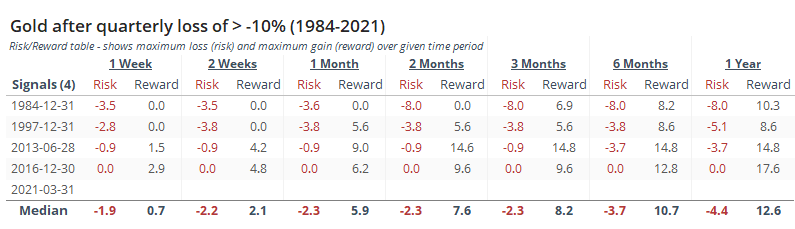
After the most recent horrible quarters for gold, it continued to dip in the first few weeks of the new quarters in 1984 and 1997, versus almost nothing in 2013 and 2016, as we can see from the Risk/Reward Table below.
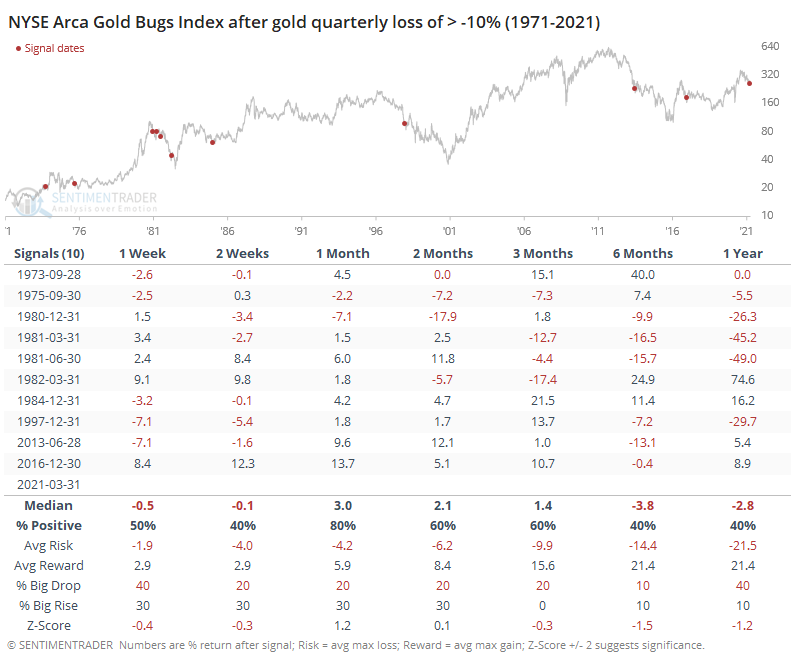
For gold mining stocks, big quarterly losses in gold weren't necessarily a good sign to pick up a potential bargain. While the Gold Bugs index did show a positive return 80% of the time over the next month, many of those gains evaporated over the next 6-12 months.
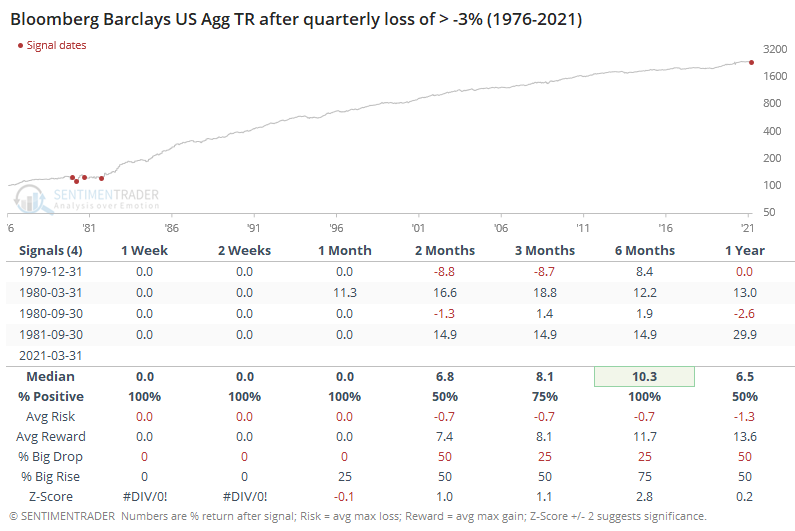
The bond market has had a horrible quarter, too. While focused mainly on long-dated Treasuries, the total return of an aggregate bond index suffered one of the worst losses in its history.
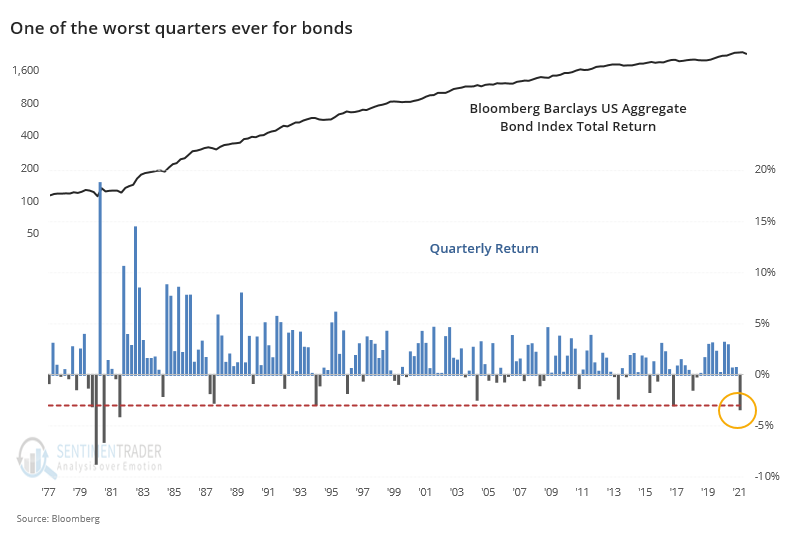
There were only a few months with a total return loss in the aggregate bond market of more than -3%, all surrounding 1980. Prior to 1986, the index is a monthly time series, so you can ignore the "0" figures in the shorter time frames.
This doesn't give us much of a sample to work with, so if we lessen the loss to -2% or greater, we pick up a few more precedents. The chart doesn't show us much because it's pretty much just a straight shot up and to the right, but the table shows impressive results.
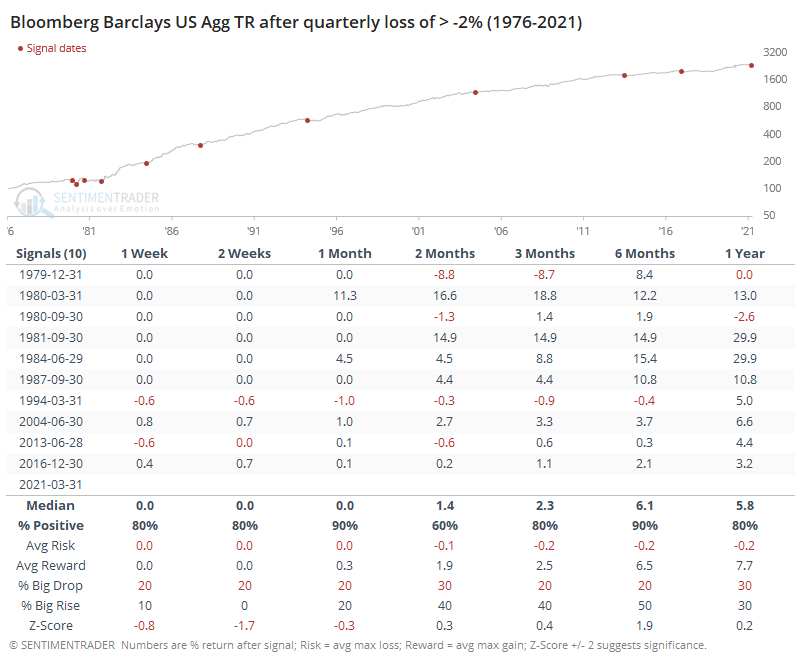
Across most time frames, and especially the next 6 months, returns were good. There was only one minor loss, and the risk/reward skew was phenomenal. When dealing with any 40-year history of the bond market, though, the caveat is that it has pretty much been a one-way market, so if we're undergoing a generational change in trend, then this is iffy.
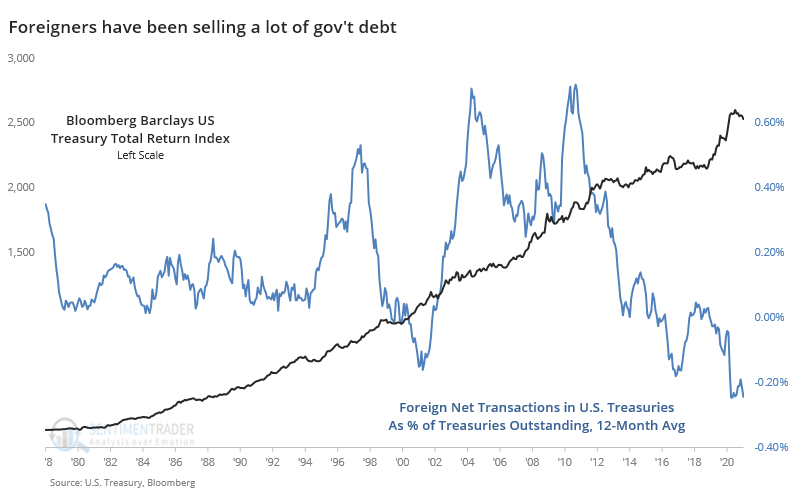
The Wall Street Journal noted that selling in bonds, Treasuries in particular, has been particularly acute among foreign holders, sometimes simply for technical reasons and nothing to do with sentiment toward U.S. government debt. Even if it was sentiment-related, heavy selling of Treasuries from foreign holders has not necessarily been a good contrary signal.
If we assume that big losses in gold and bonds mean that investors were completely avoiding safe-haven assets in favor of risky assets like stocks, then maybe this behavior was a contrary (and negative) sign for stocks going forward.
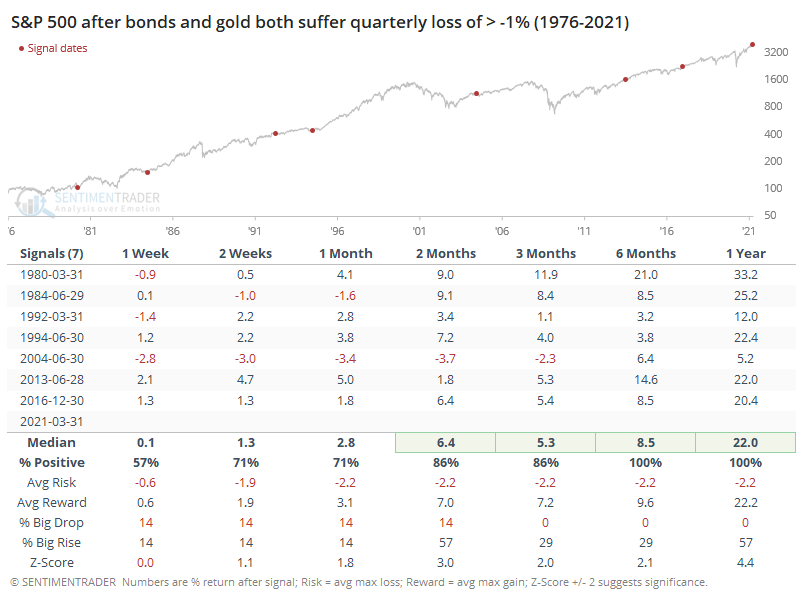
Well...no.
Despite selling pressure in the two main safe-haven markets, the S&P 500 didn't show poor returns going forward. Quite the opposite, with above-average returns from 2 months and beyond. Over the next 6-12 months, the S&P's returns and risk/reward skew were excellent. This is fairly surprising.
In recent decades, heavy selling pressure in gold and bonds has meant positive forward returns for both of those markets. Like we often see, though, trying to apply an indicator in one market doesn't necessarily work well by assuming it has a direct impact on another market. So while this quarter's heavy losses in the safe havens may be a moderate positive for them going forward, it's not necessarily a negative for stocks.
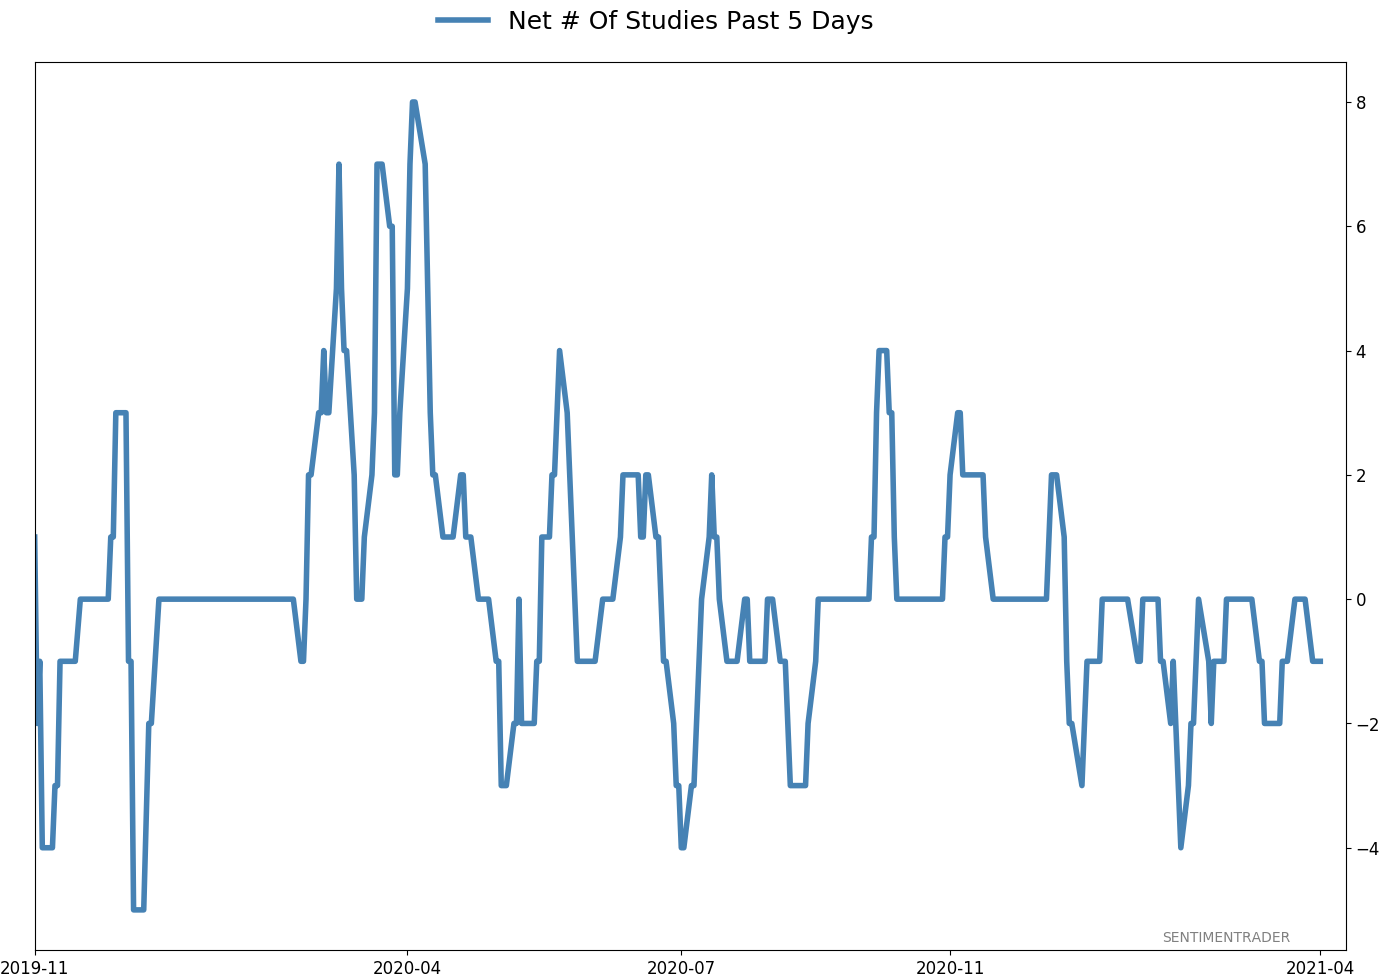
Active Studies
| Time Frame | Bullish | Bearish | | Short-Term | 0 | 0 | | Medium-Term | 0 | 10 | | Long-Term | 11 | 4 |
|
Indicators at Extremes
Portfolio
| Position | Description | Weight % | Added / Reduced | Date | | Stocks | RSP | 4.9 | Reduced 4% | 2021-02-09 | | Bonds | 30.0% BND, 8.8% SCHP | 38.8 | Added 15.1% | 2021-02-18 | | Commodities | GCC | 2.3 | Reduced 2.1%
| 2020-09-04 | | Precious Metals | GDX | 9.0 | Added 0.1% | 2021-02-18 | | Special Situations | 7.3% XLE, 4.8% PSCE | 12.1 | Reduced 5.6% | 2021-02-18 | | Cash | | 32.8 | | |
|
Updates (Changes made today are underlined)
With a market that has seen the kinds of broad participation and big breath thrusts like we did in the fall, it's hard to become too negative. Those kinds of conditions have consistently preceded higher returns over the next 6-12 months. It's the interim that's more of an issue. Even conditions like that haven't prevented some shorter-term pullbacks. And when we combine an environment where speculation is rampant and recent days have seen an increase in cracks under the surface of the indexes, it's enough to become more defensive over a short- to medium-term time frame. We still don't have much confirmation from the price action in the indexes, so those who are more conservative would likely wait before increasing cash levels. I've decreased risk exposure a bit more, mainly in terms of energy stocks and the ANGL fund, while adding more to the broader bond market. RETURN YTD: 7.0% 2020: 8.1%, 2019: 12.6%, 2018: 0.6%, 2017: 3.8%, 2016: 17.1%, 2015: 9.2%, 2014: 14.5%, 2013: 2.2%, 2012: 10.8%, 2011: 16.5%, 2010: 15.3%, 2009: 23.9%, 2008: 16.2%, 2007: 7.8%
|
|
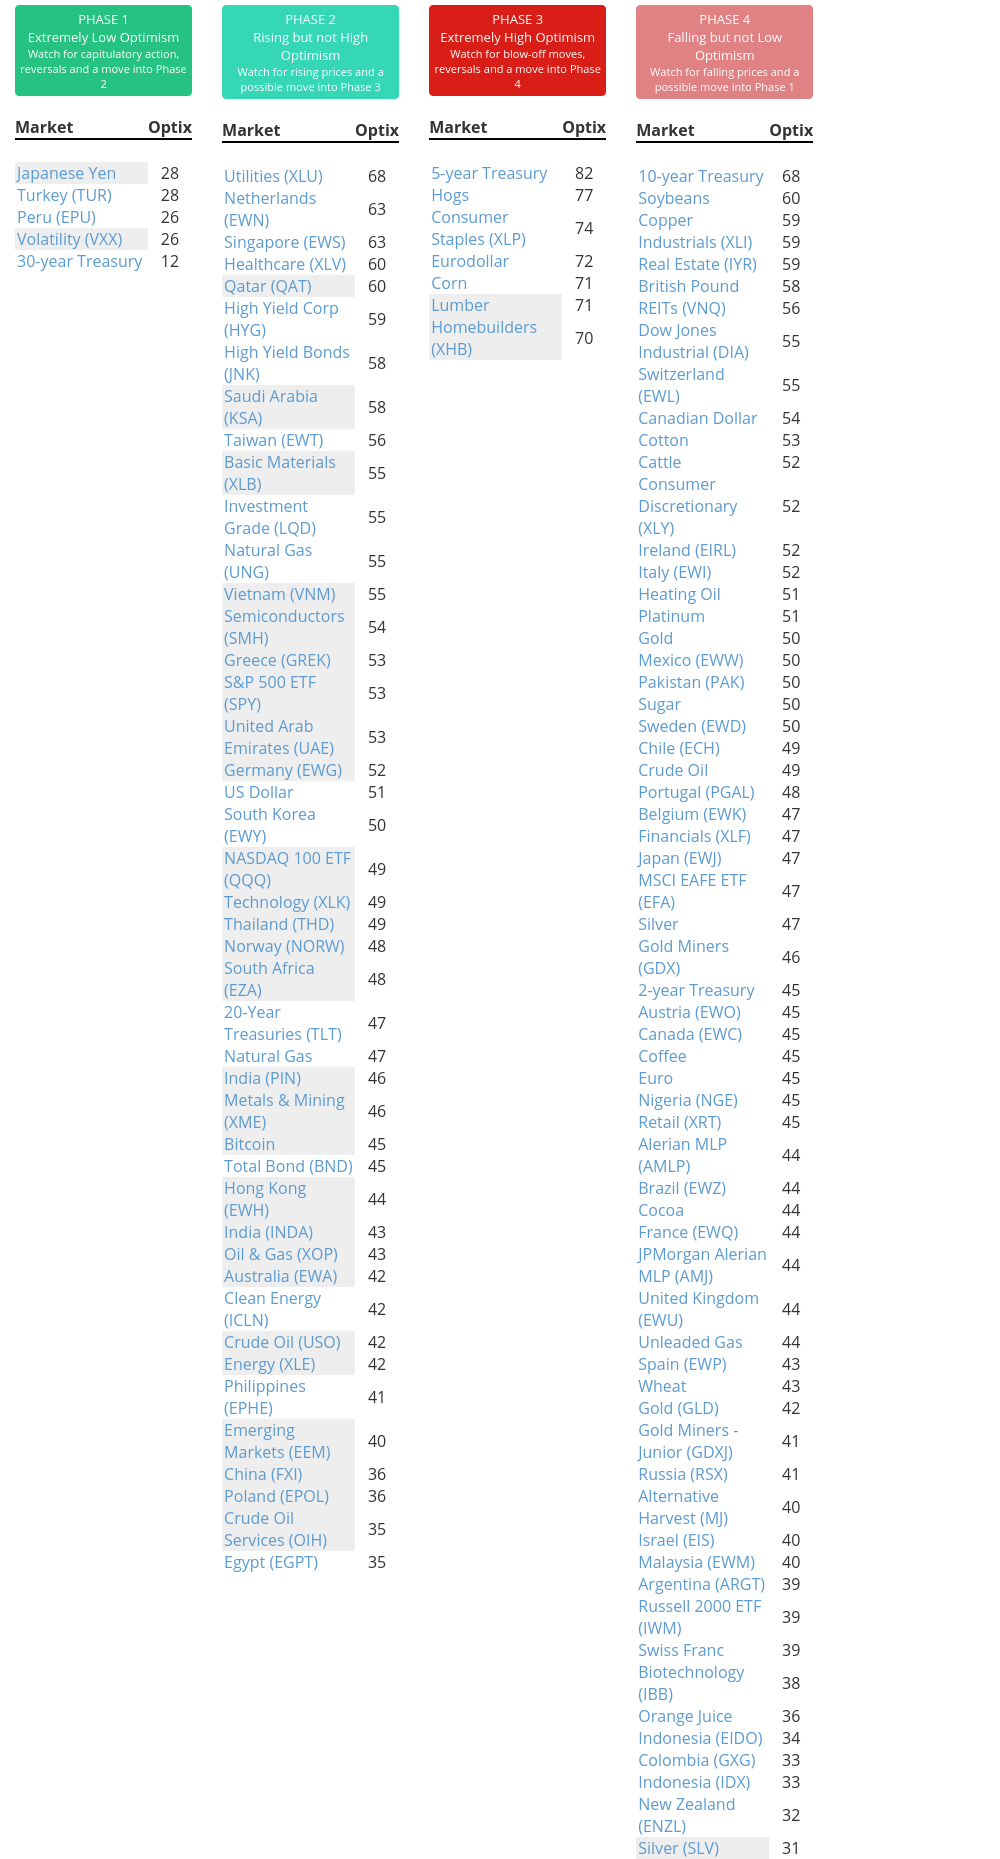
Phase Table
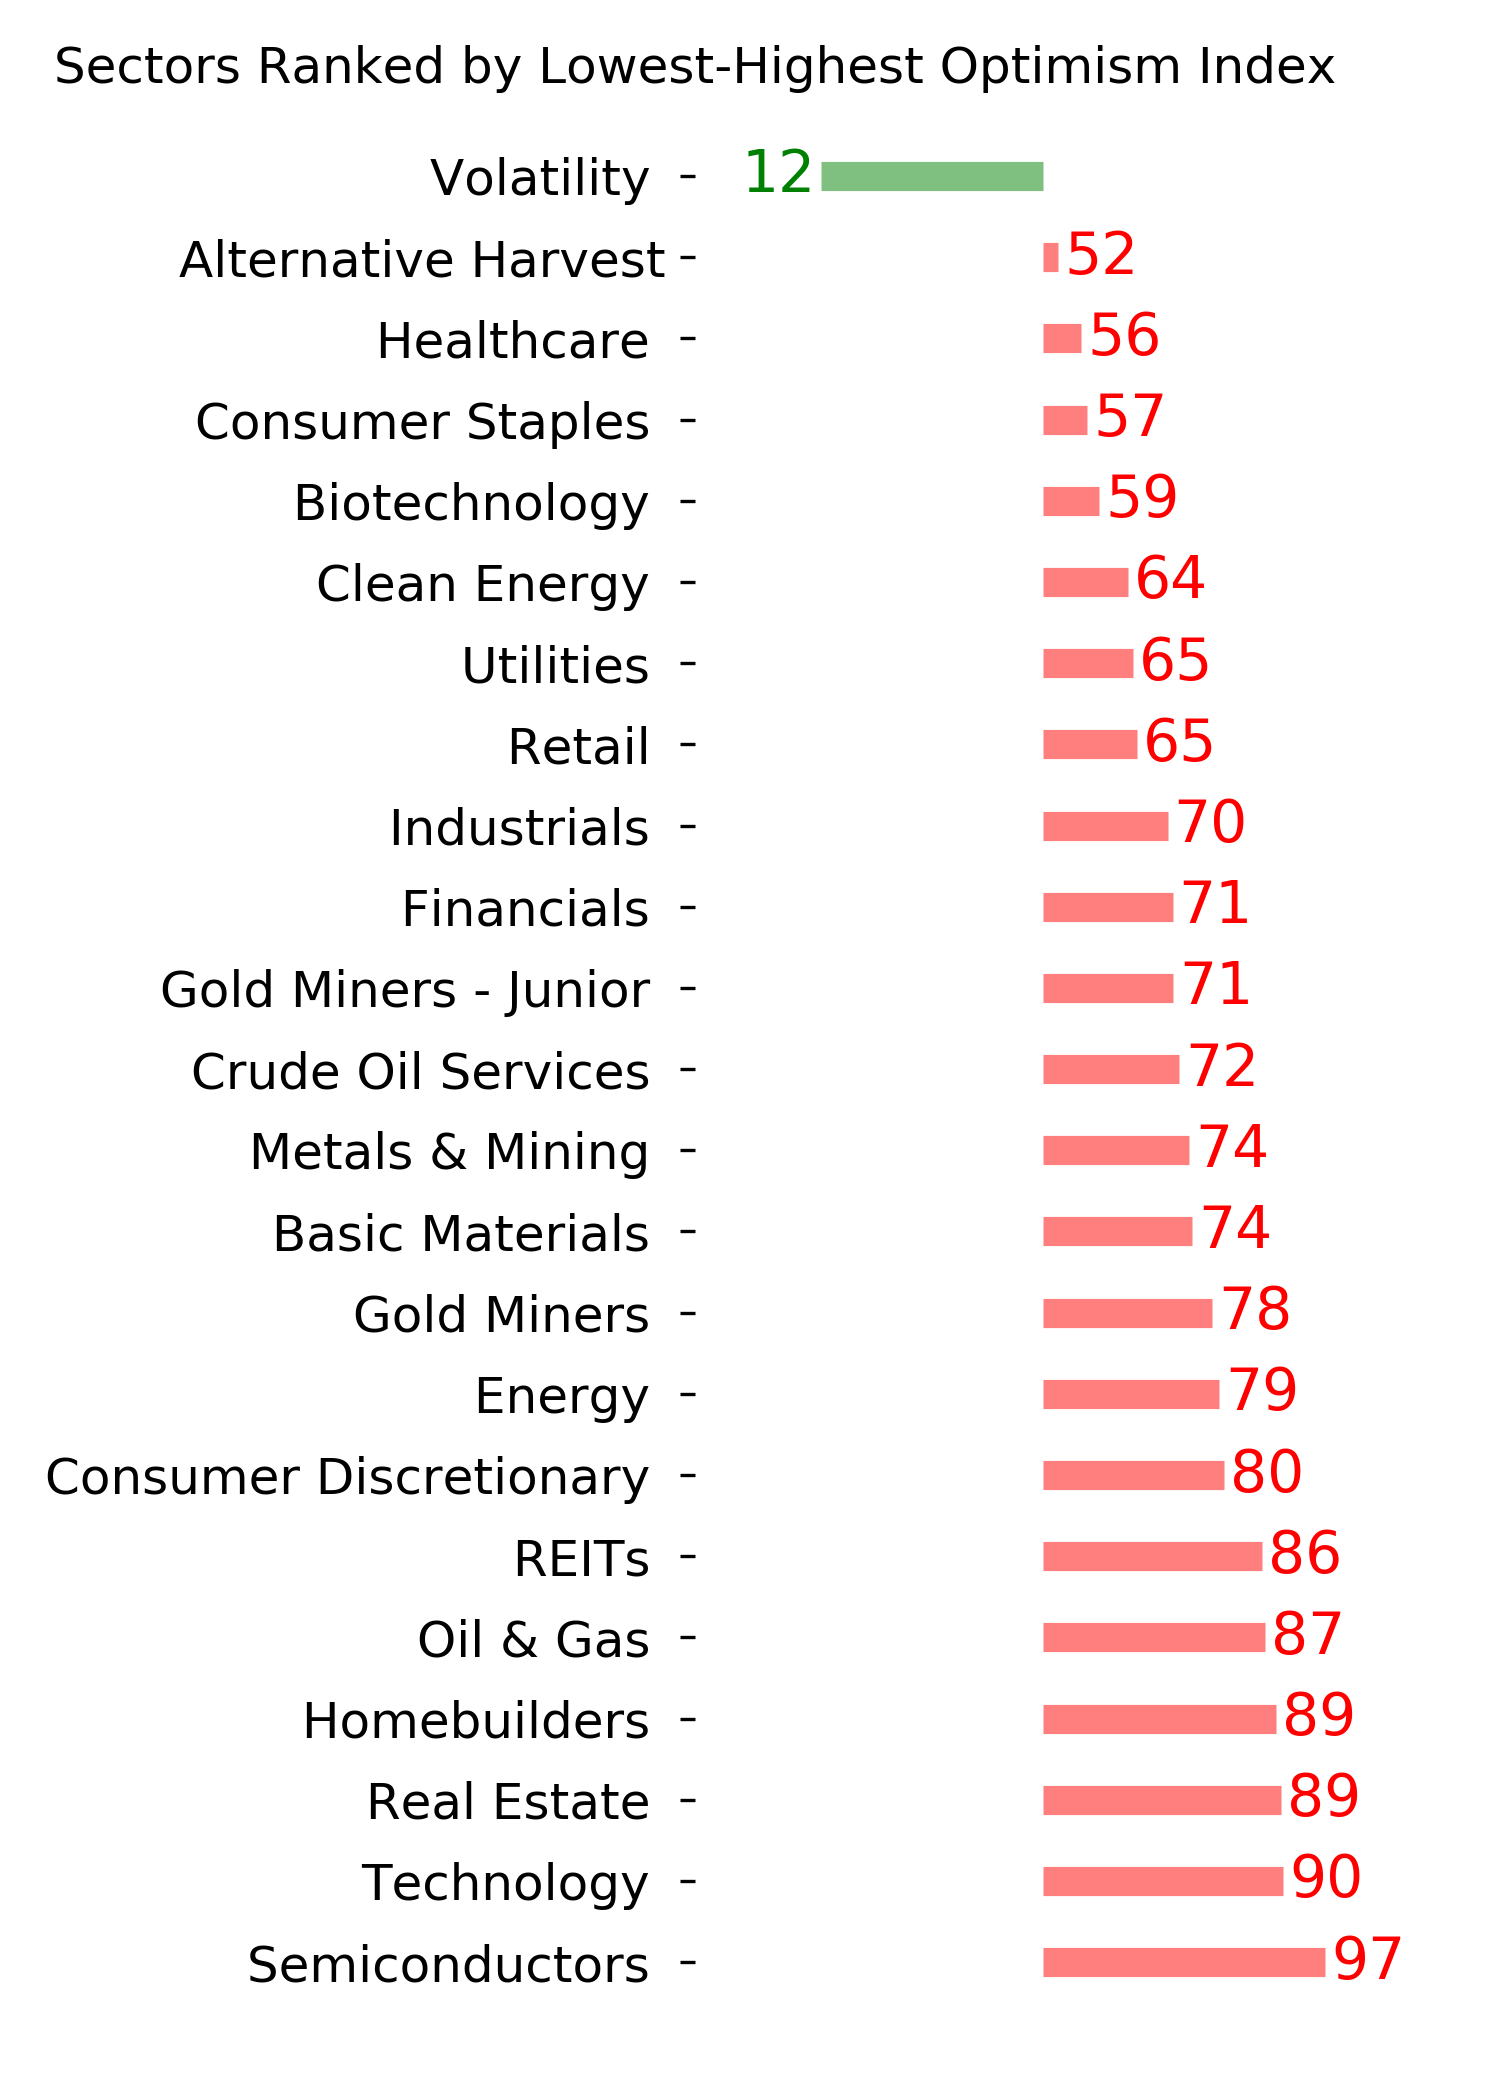
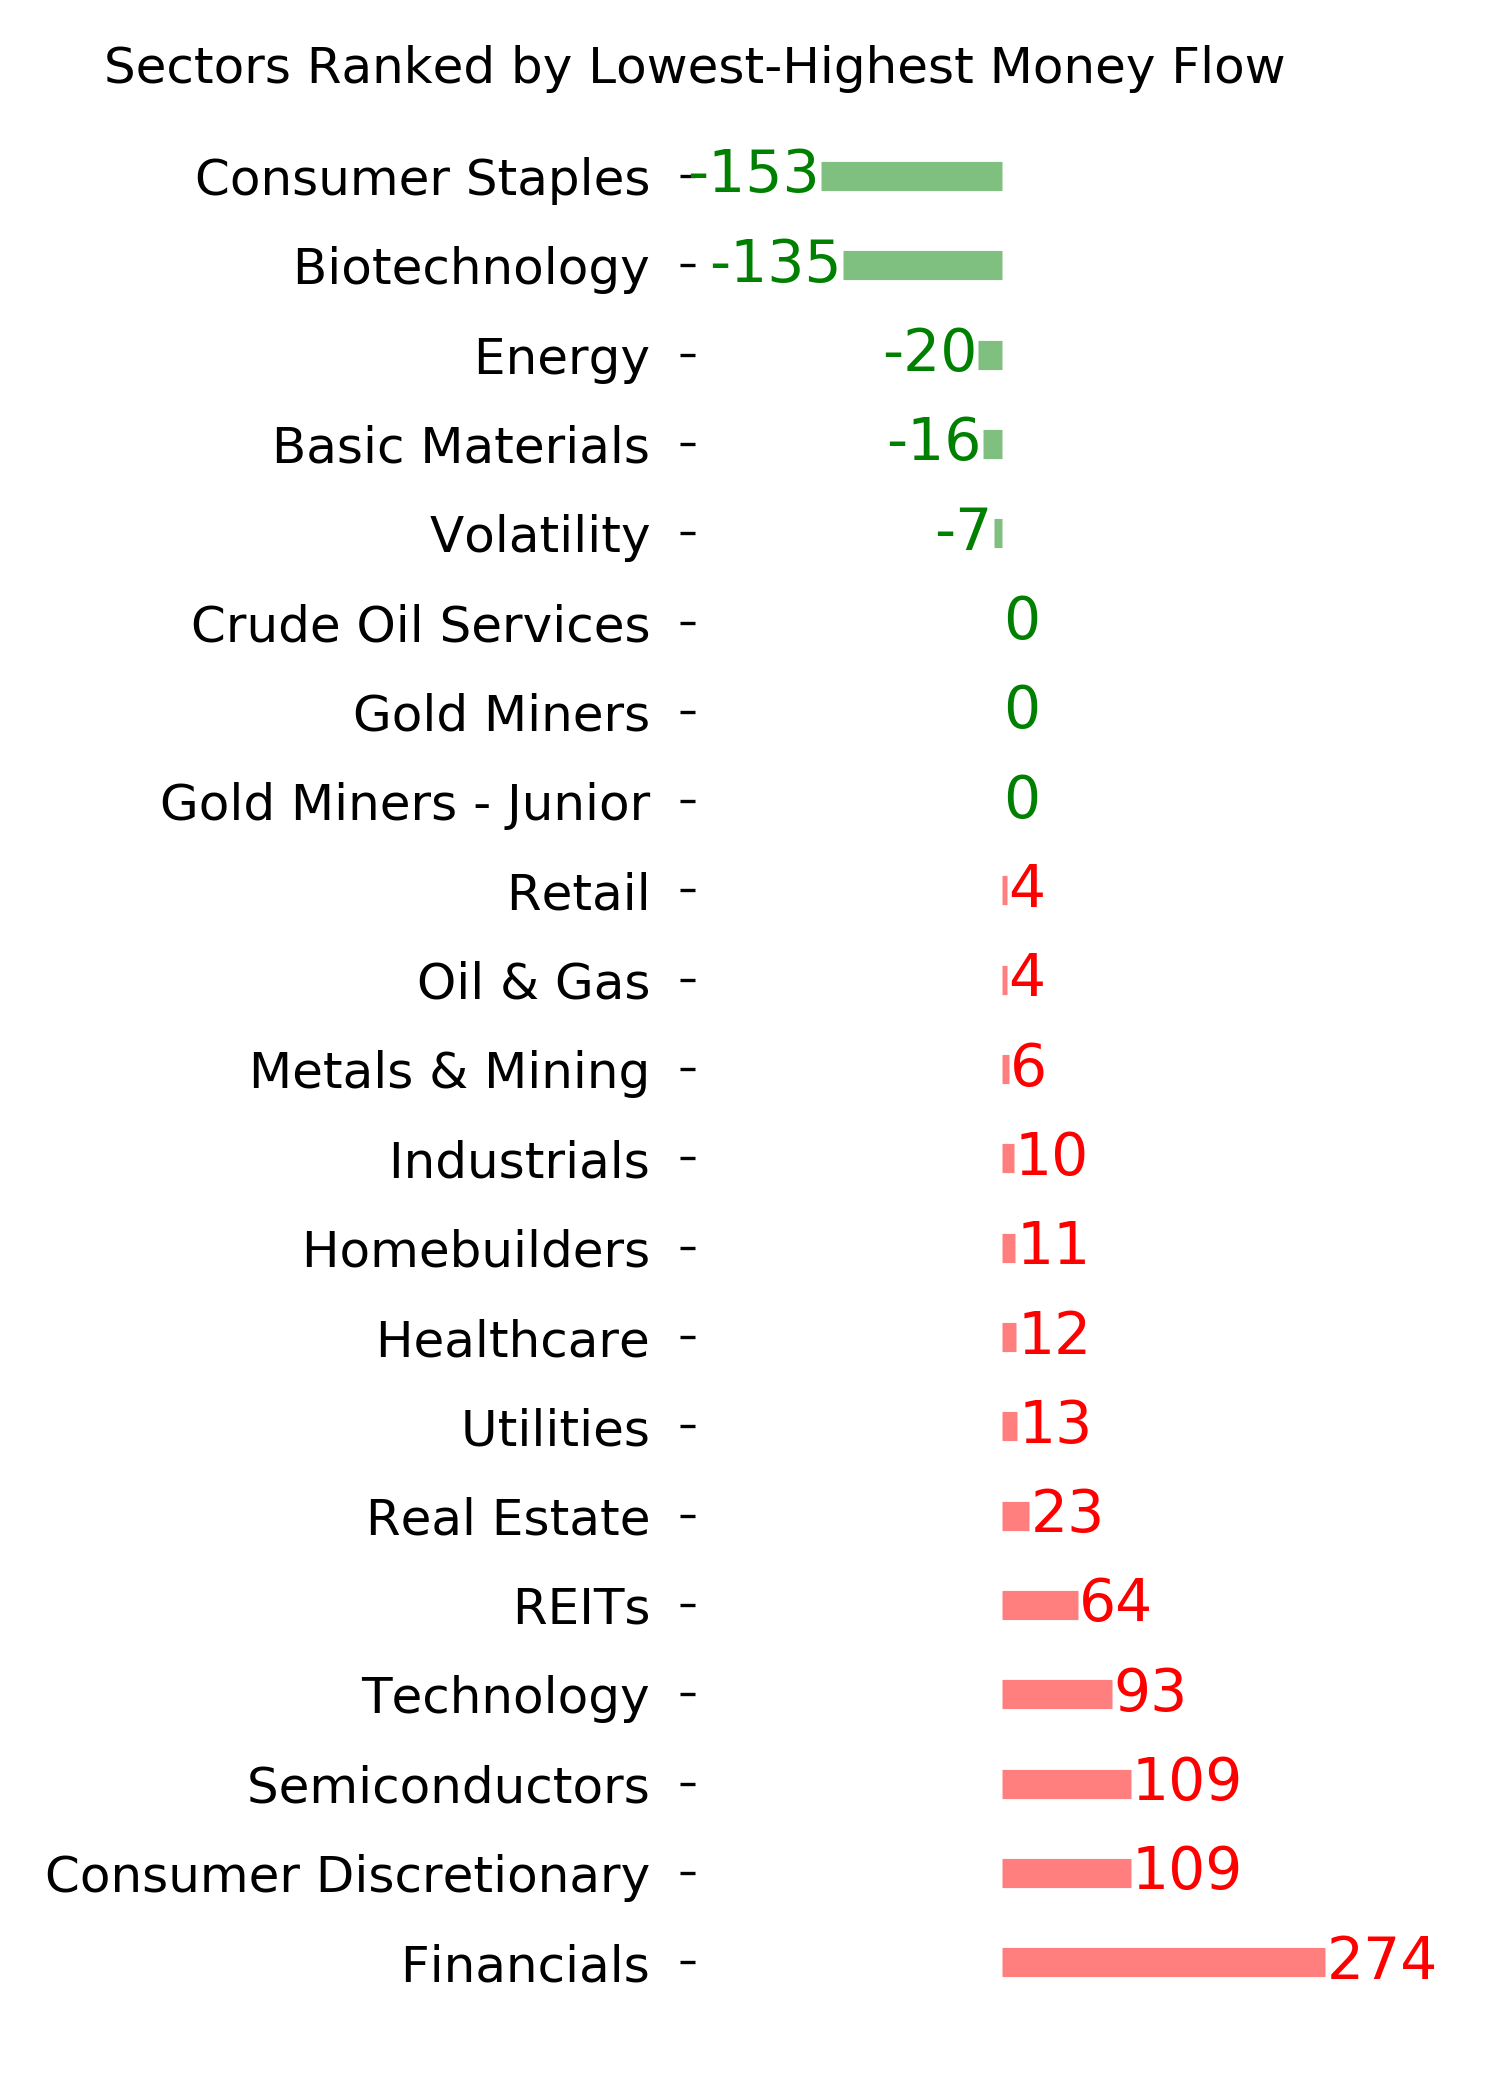
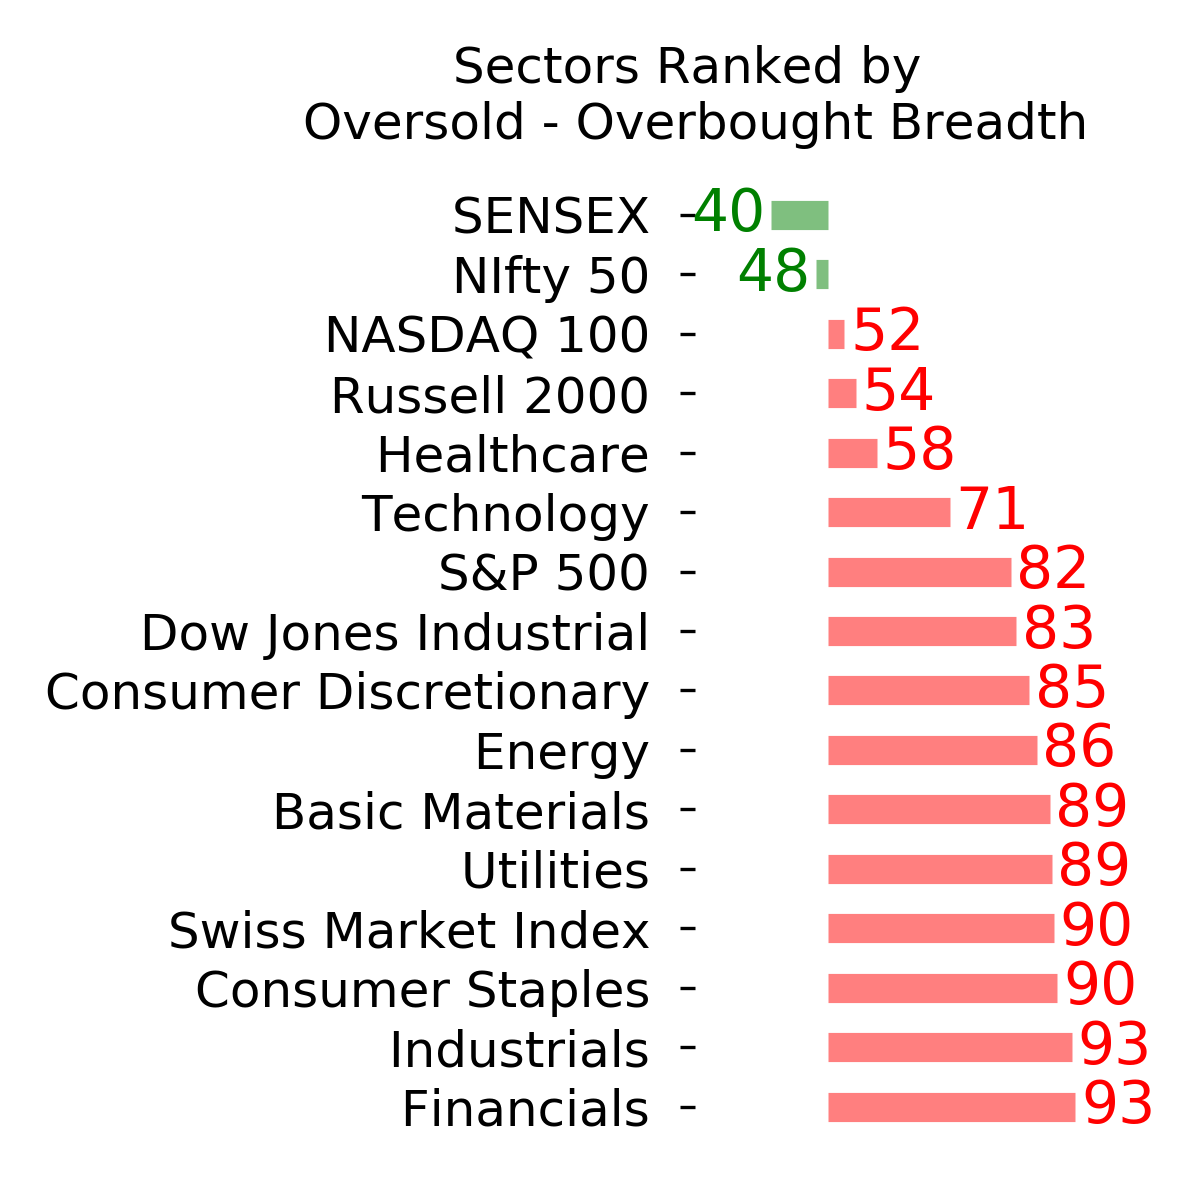
Ranks
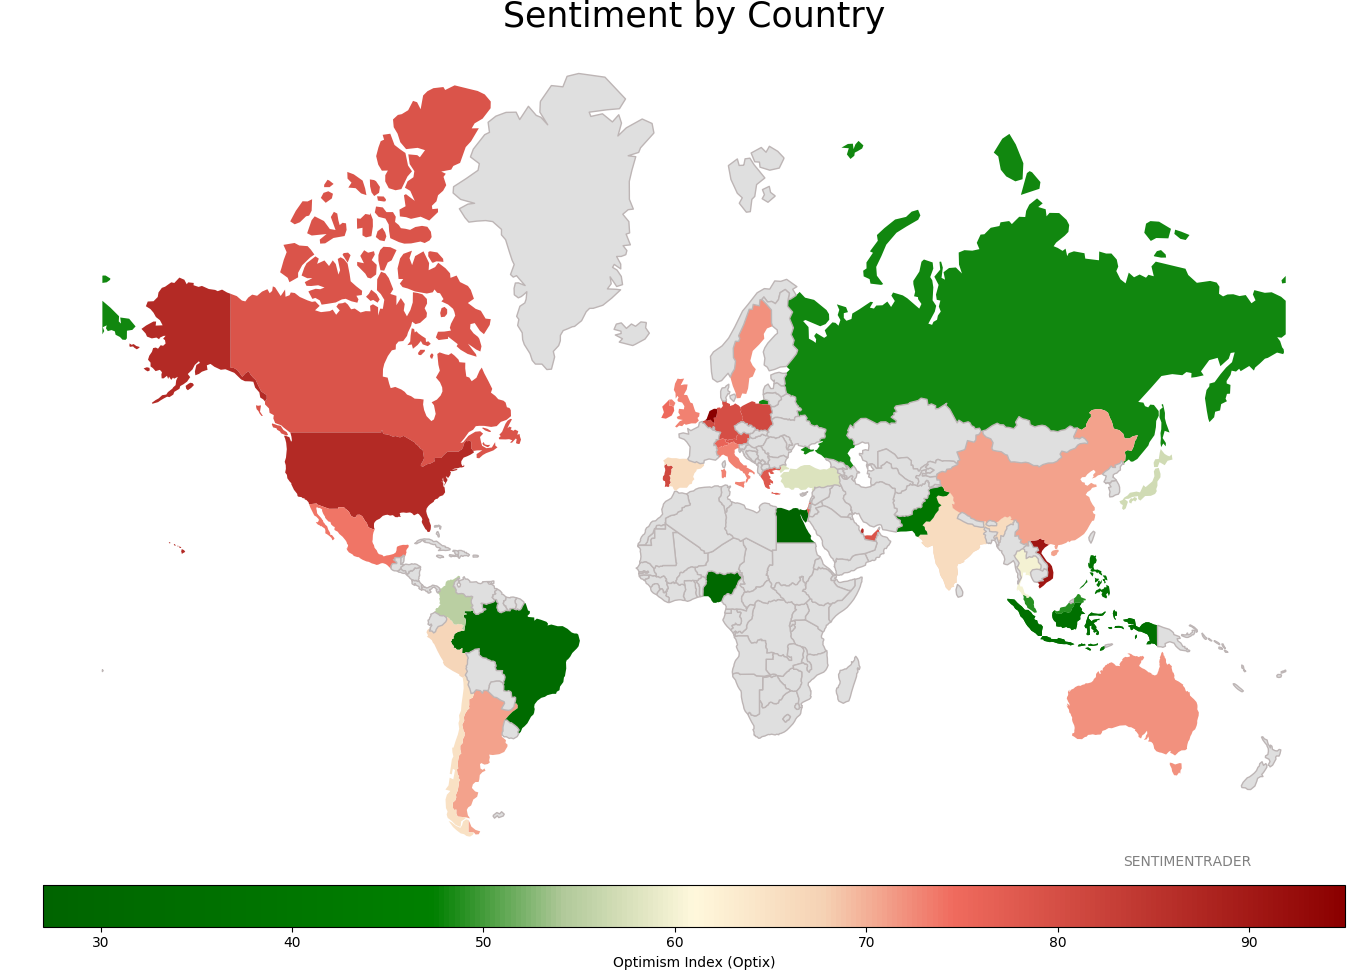
Sentiment Around The World
Optimism Index Thumbnails
|
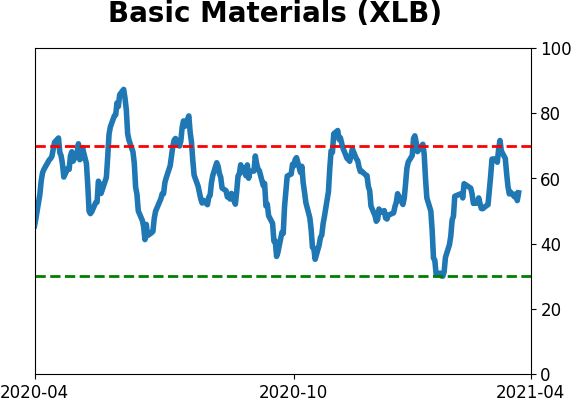
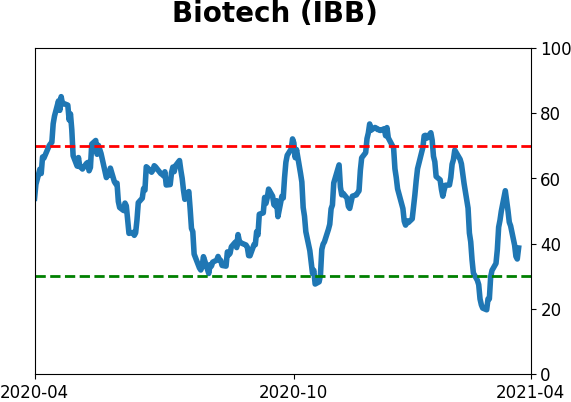
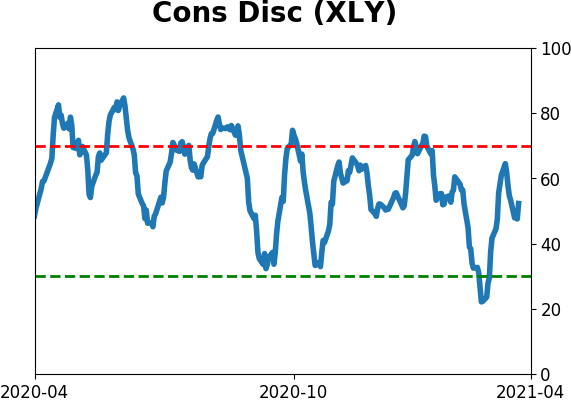
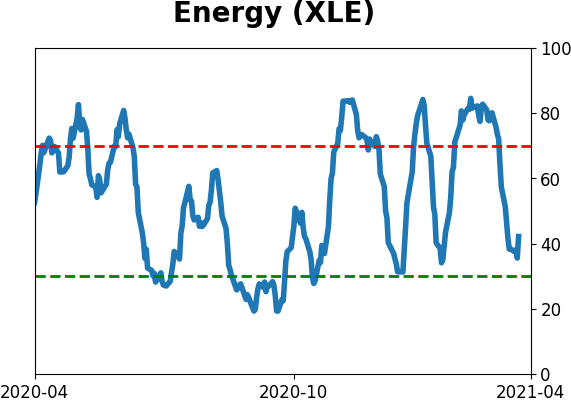
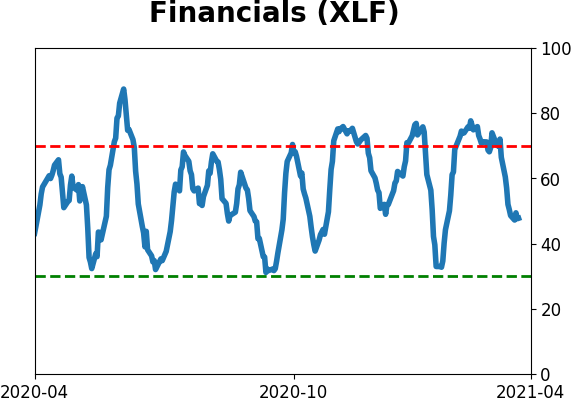
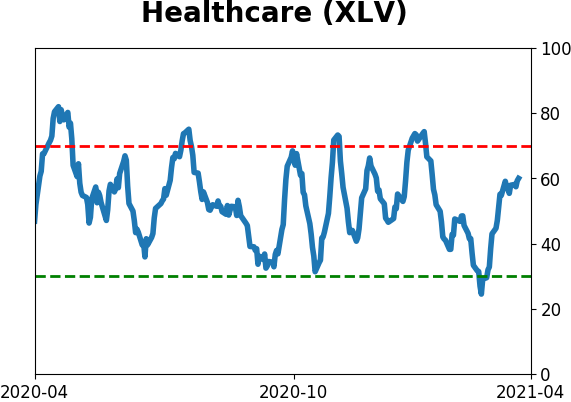
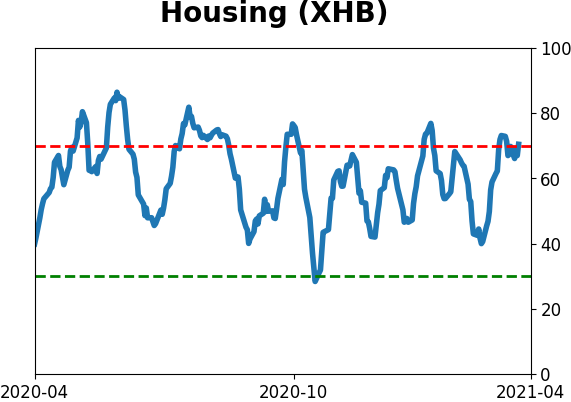
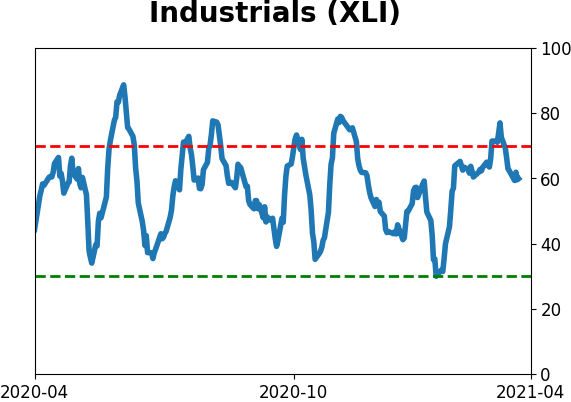
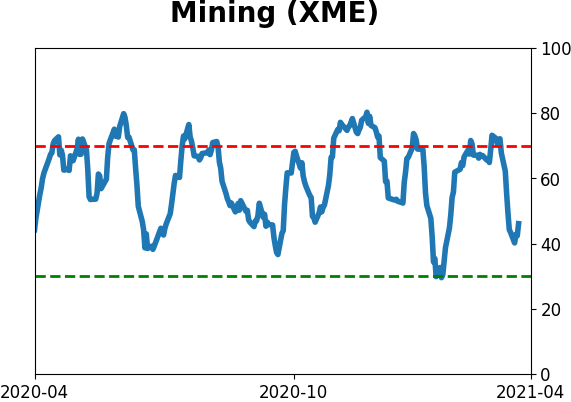
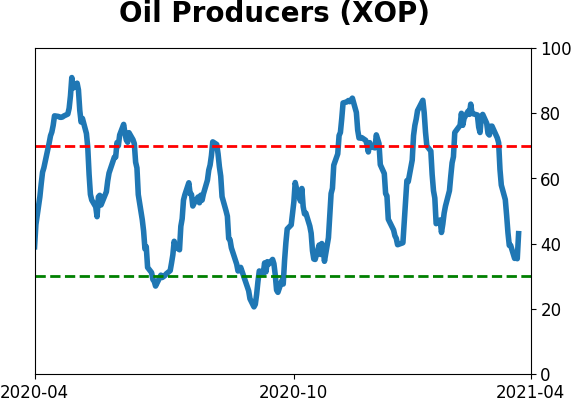
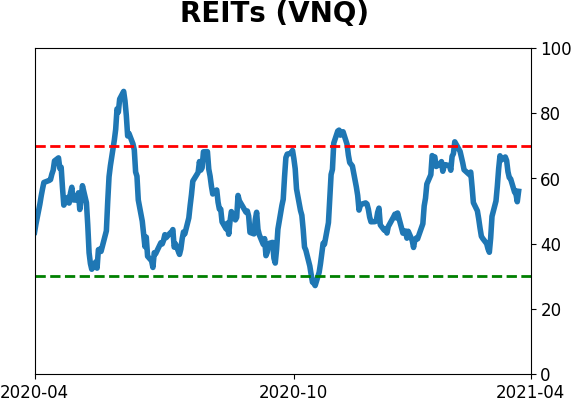
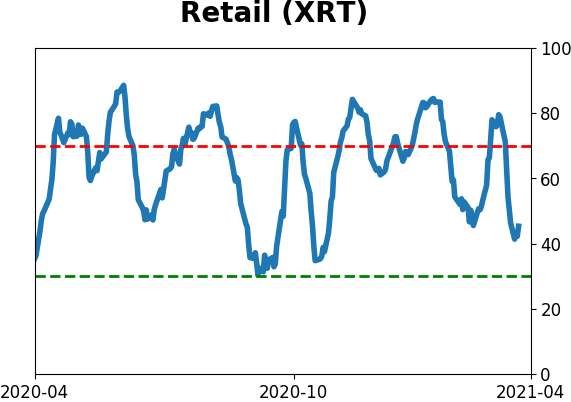
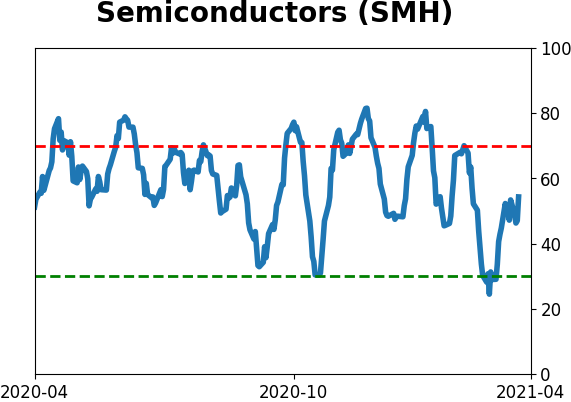
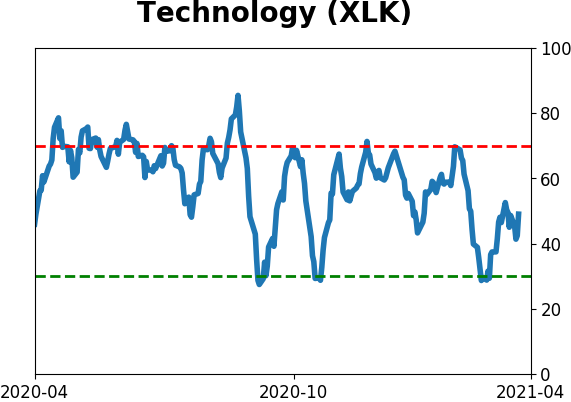
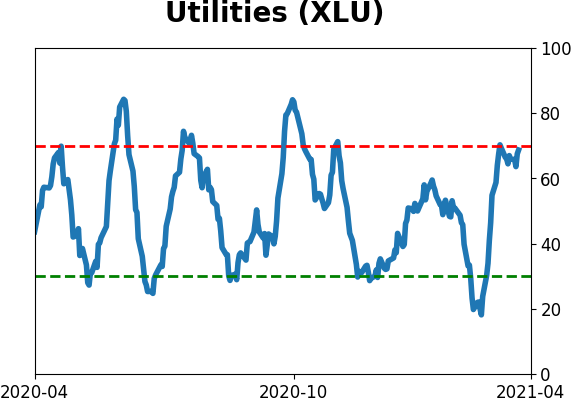
Sector ETF's - 10-Day Moving Average
|
|
|
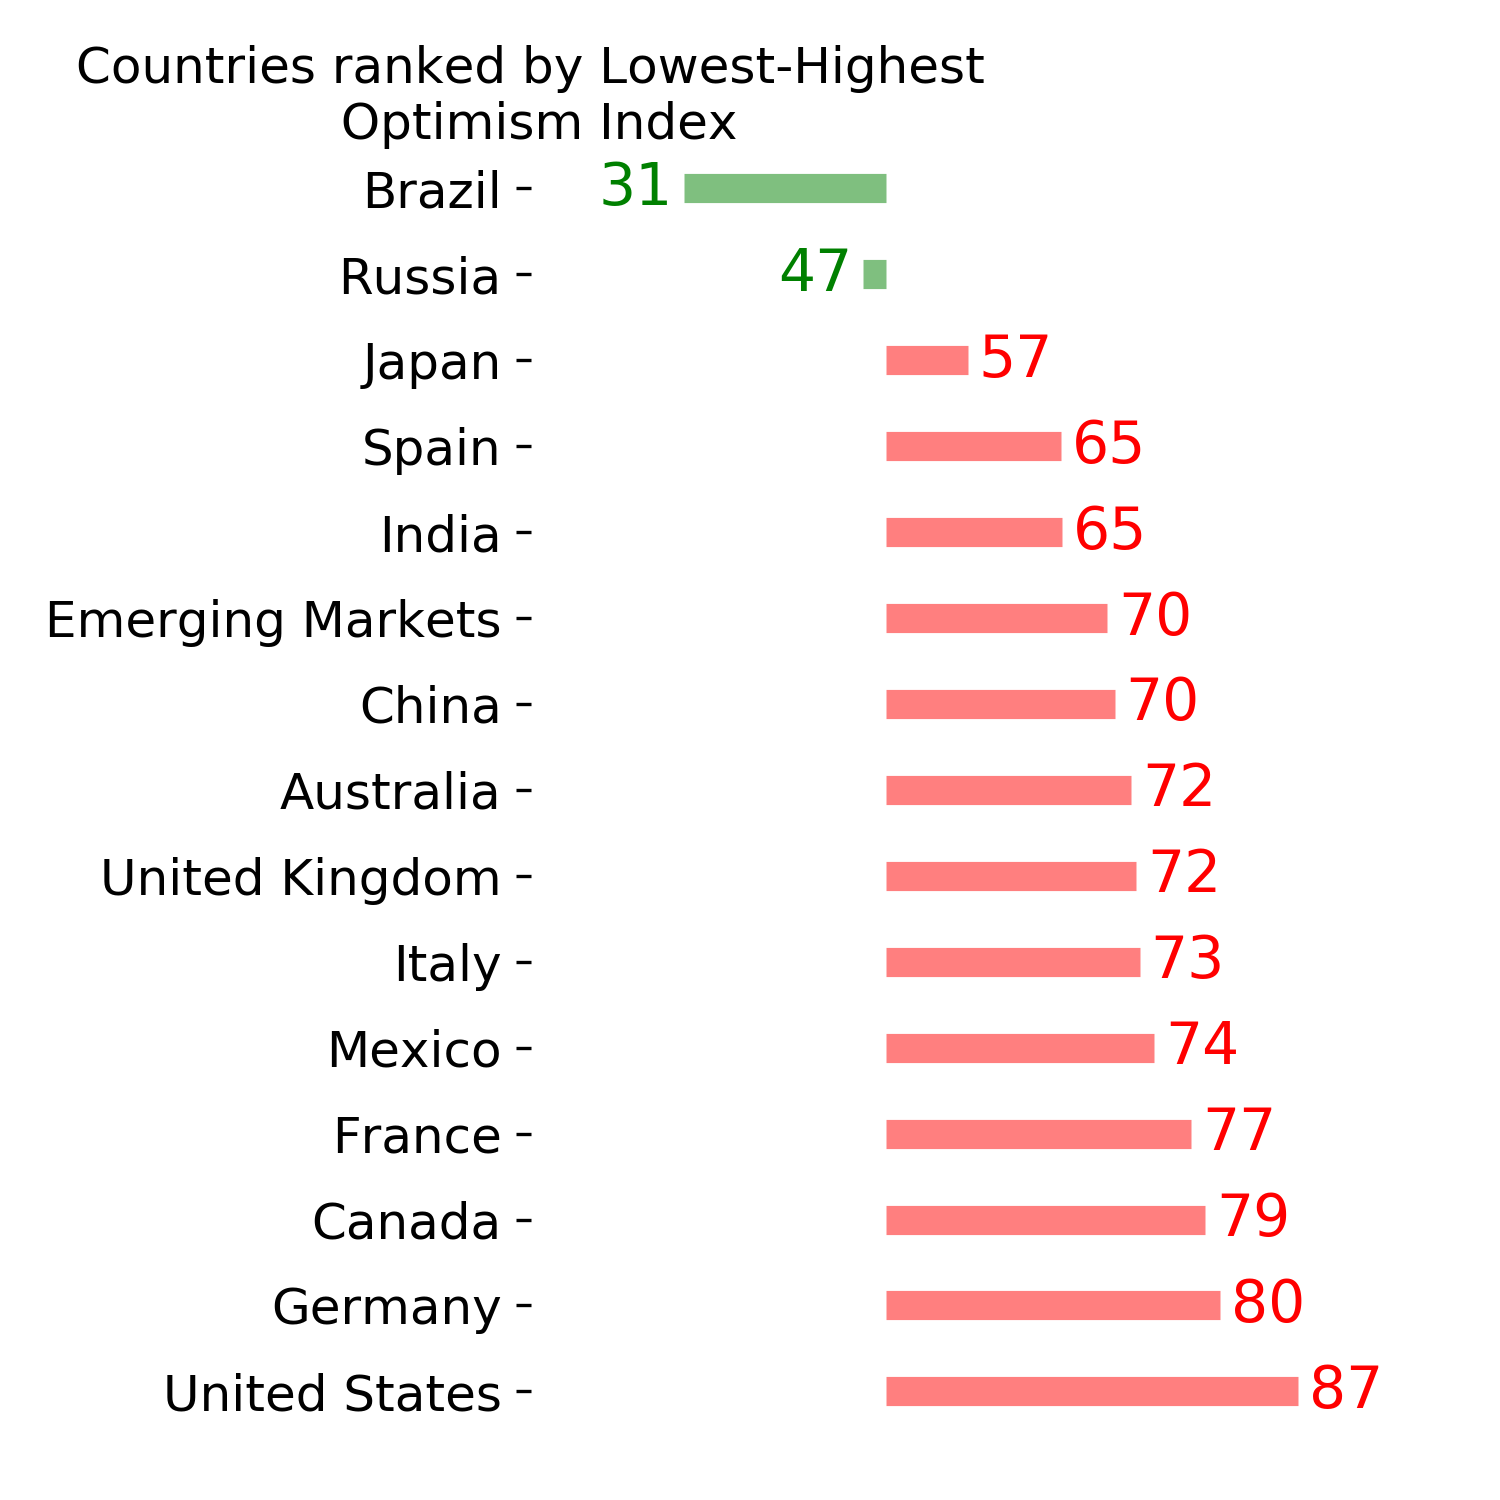
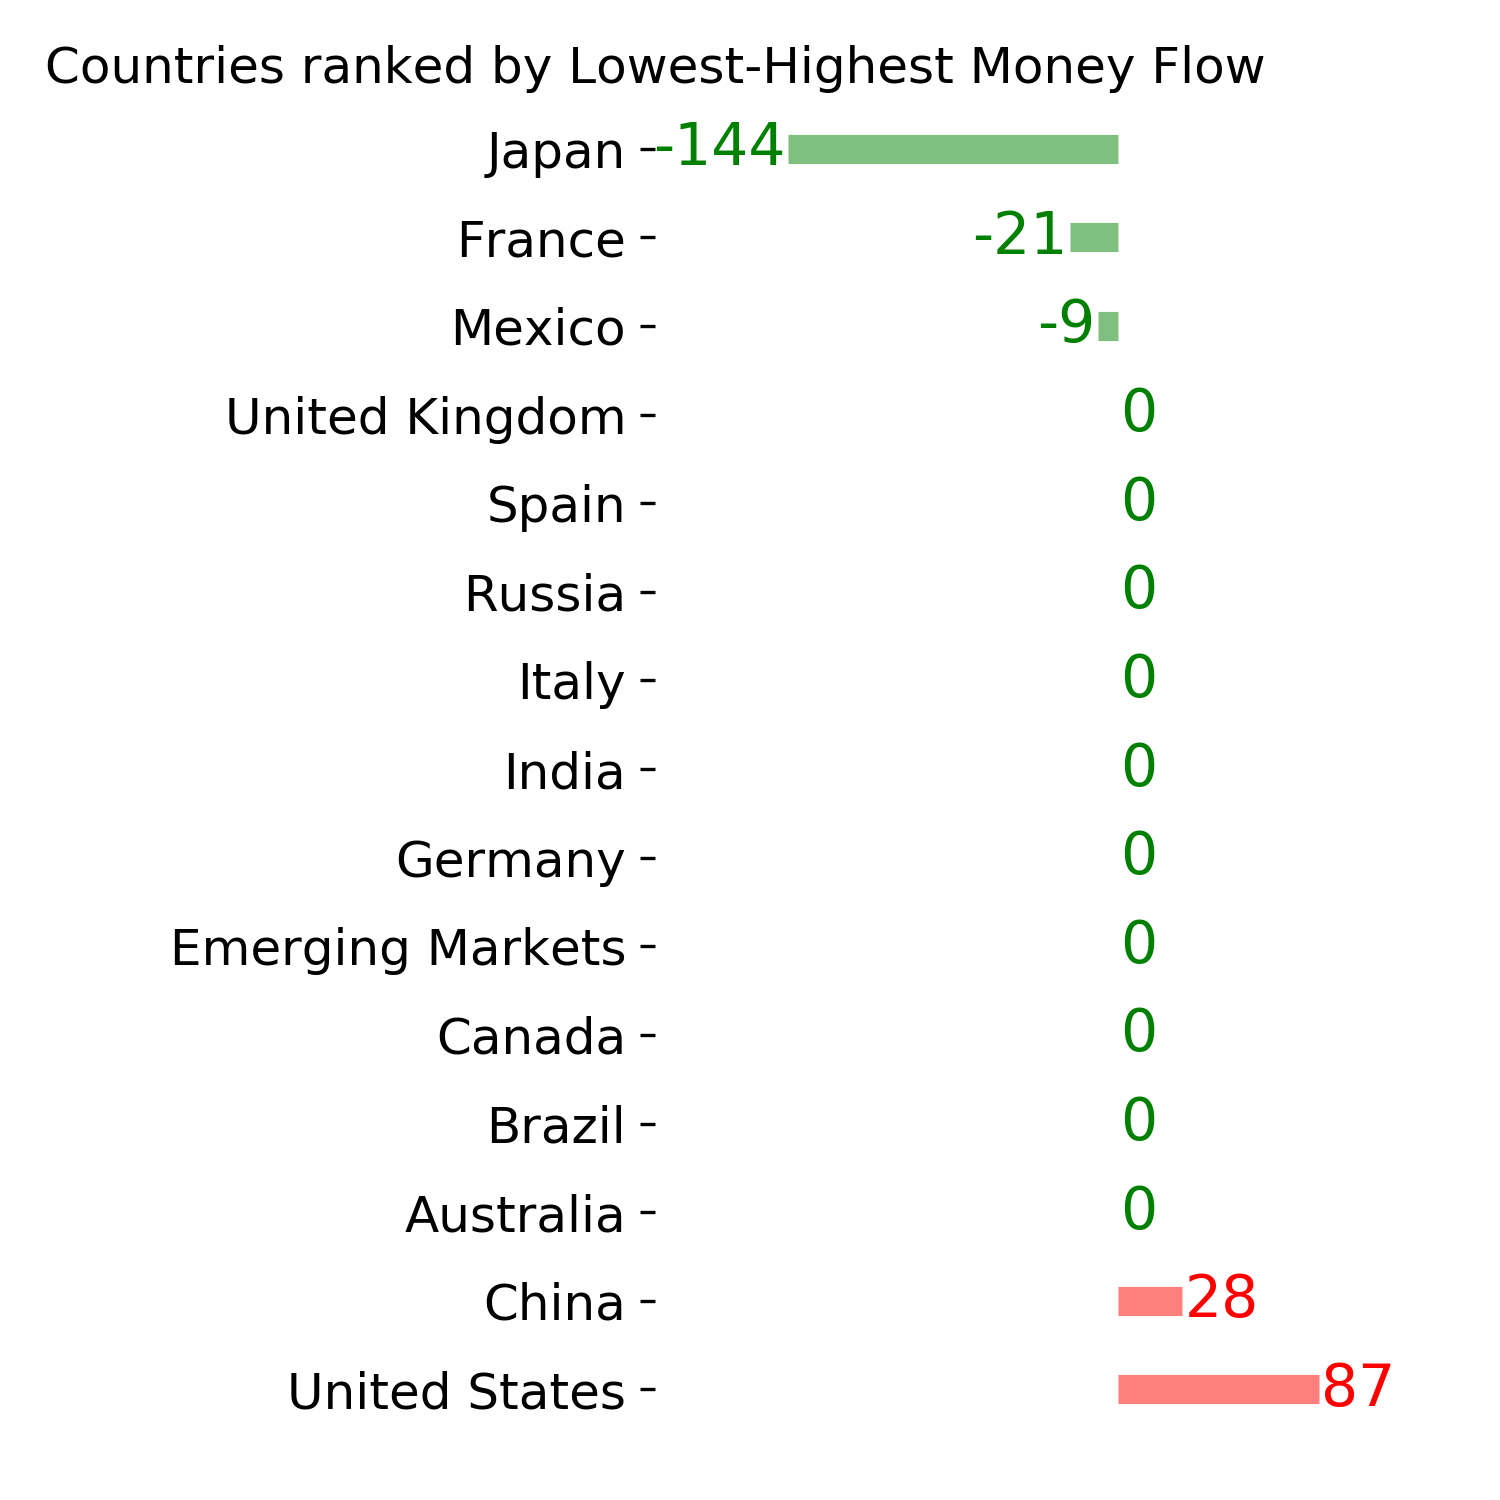
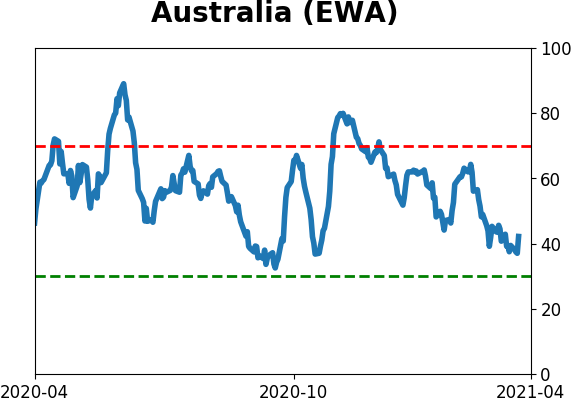
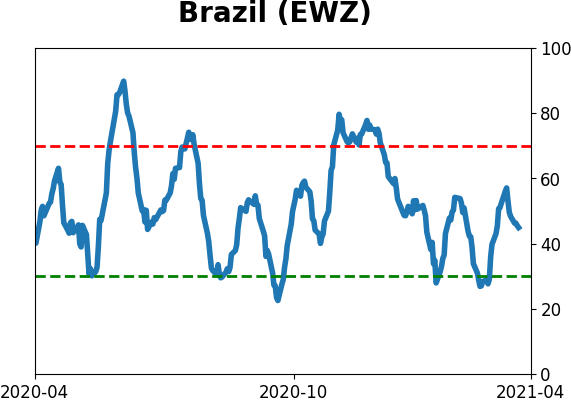
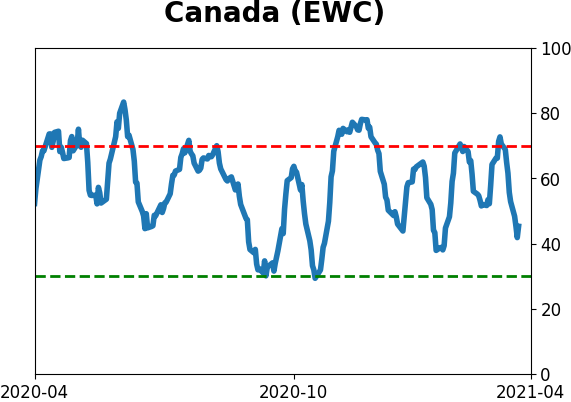
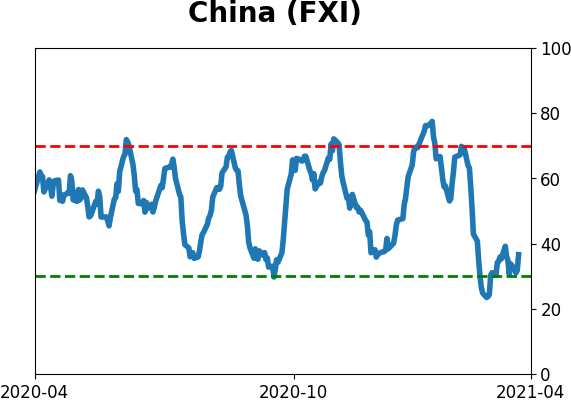
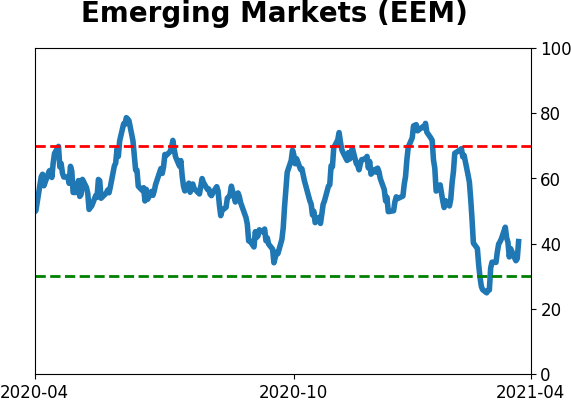
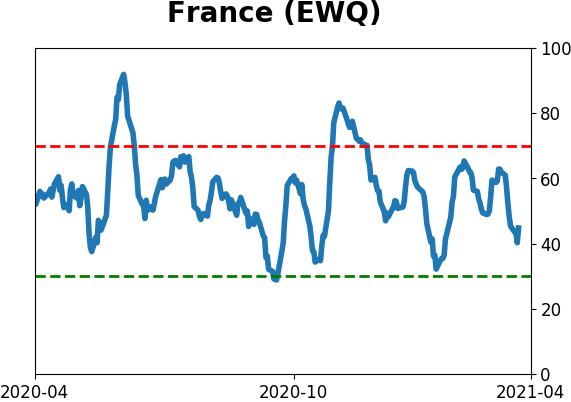
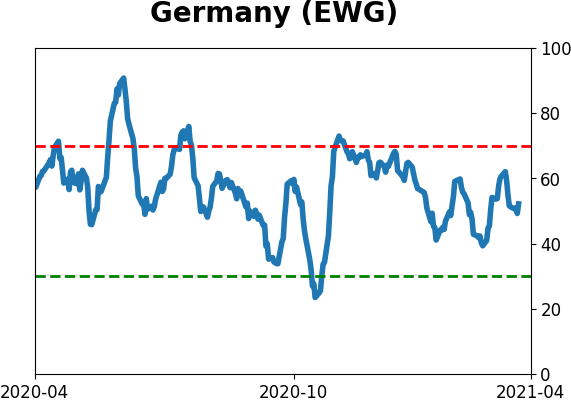
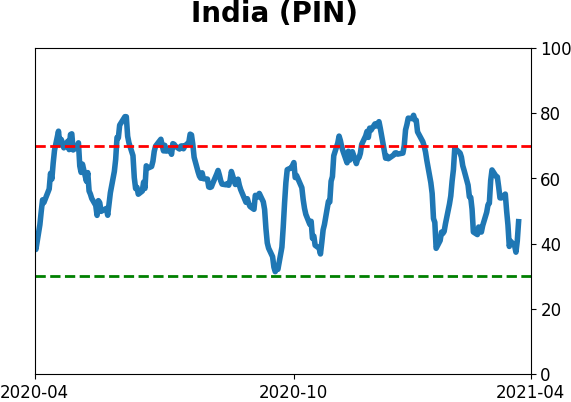
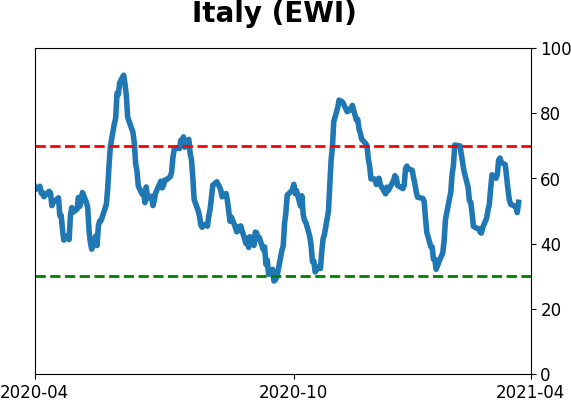
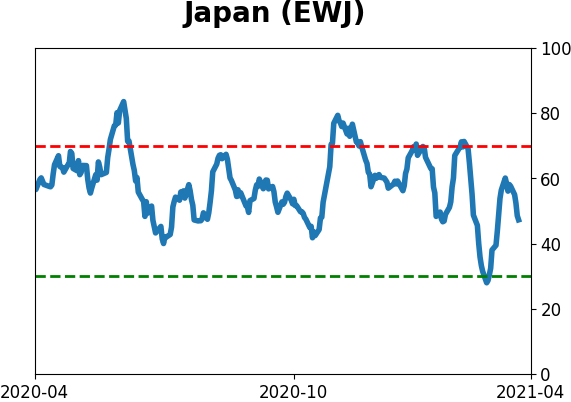
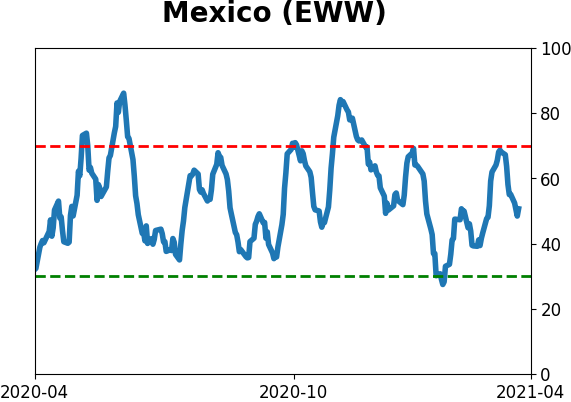
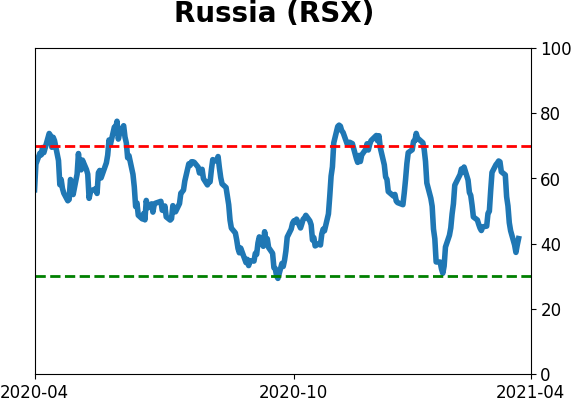
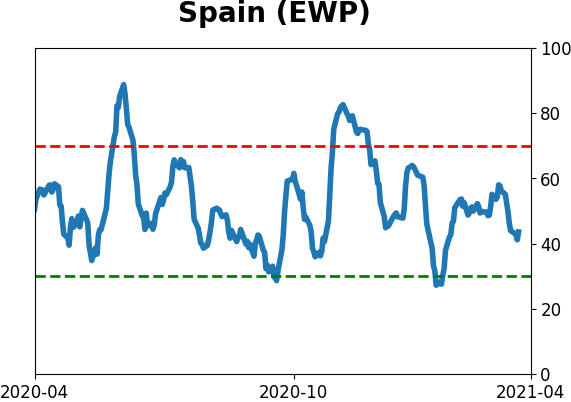
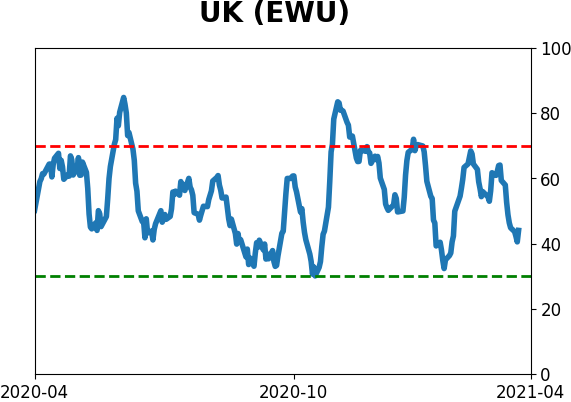
Country ETF's - 10-Day Moving Average
|
|
|
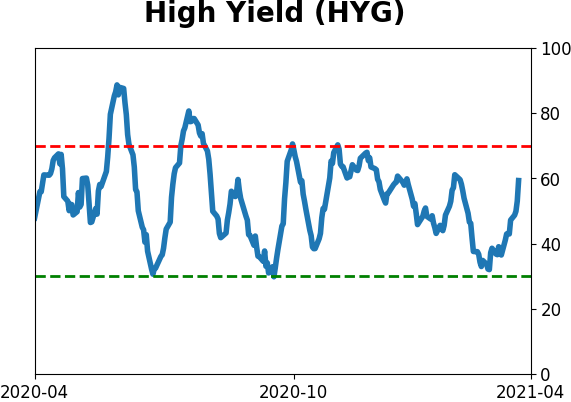
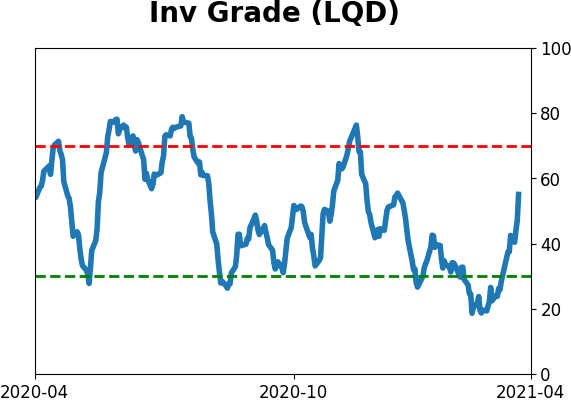
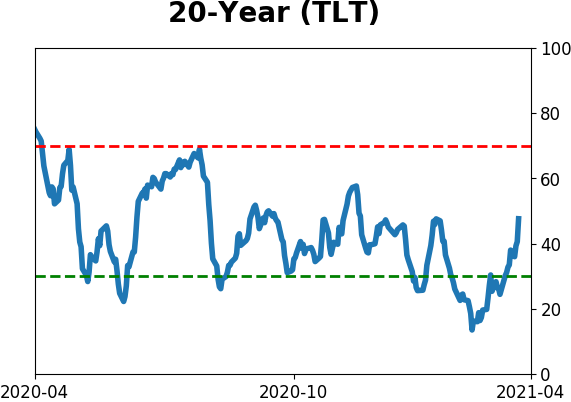
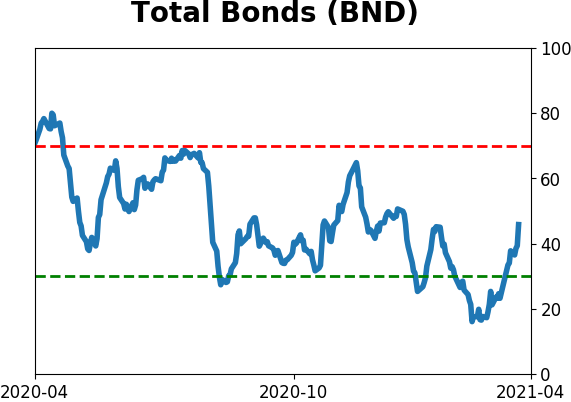
Bond ETF's - 10-Day Moving Average
|
|
|
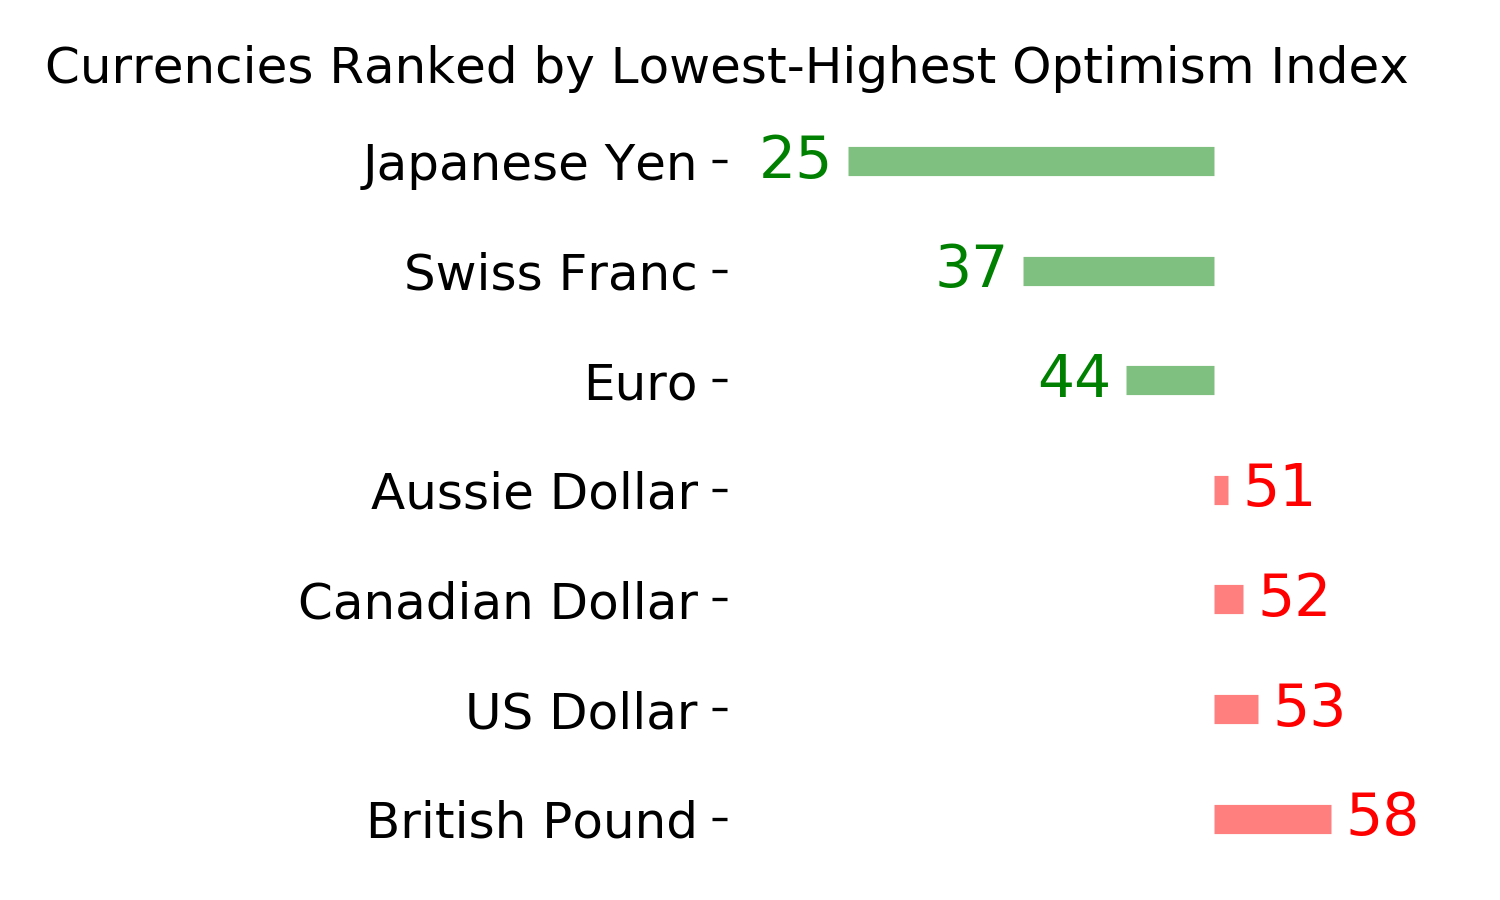
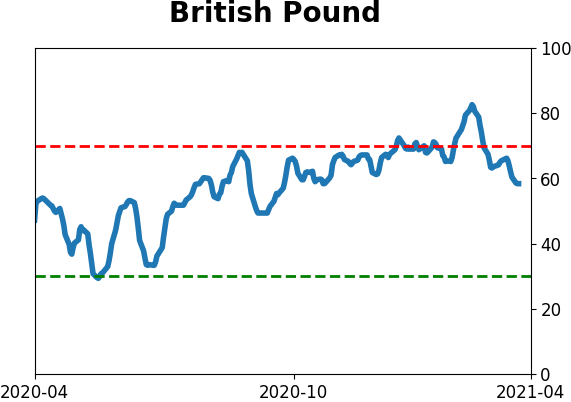
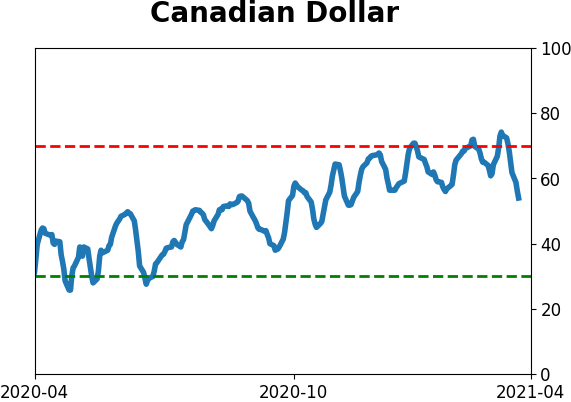
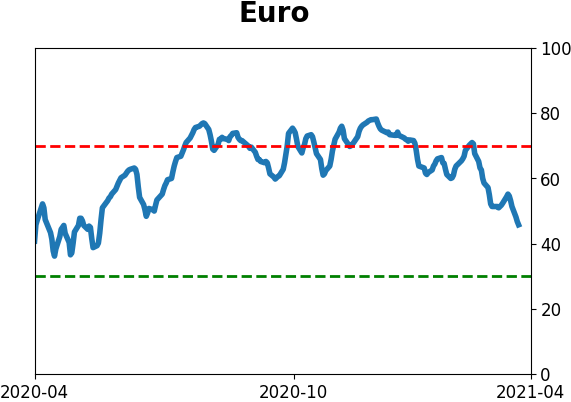
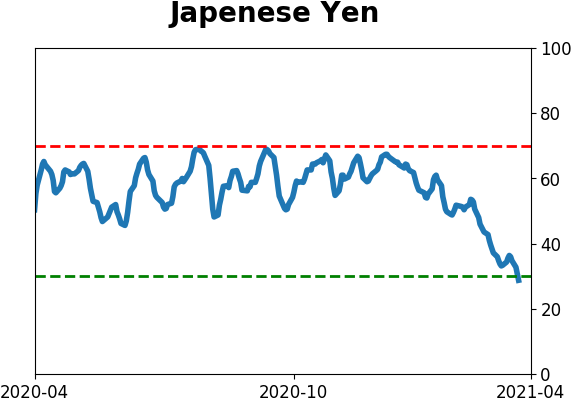
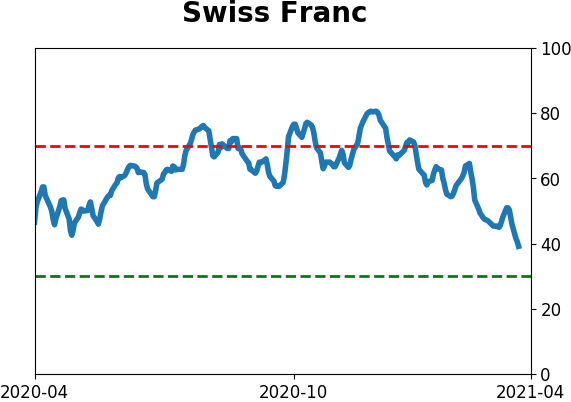
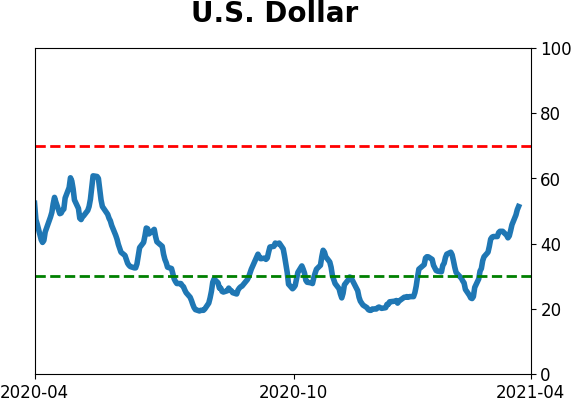
Currency ETF's - 5-Day Moving Average
|
|
|
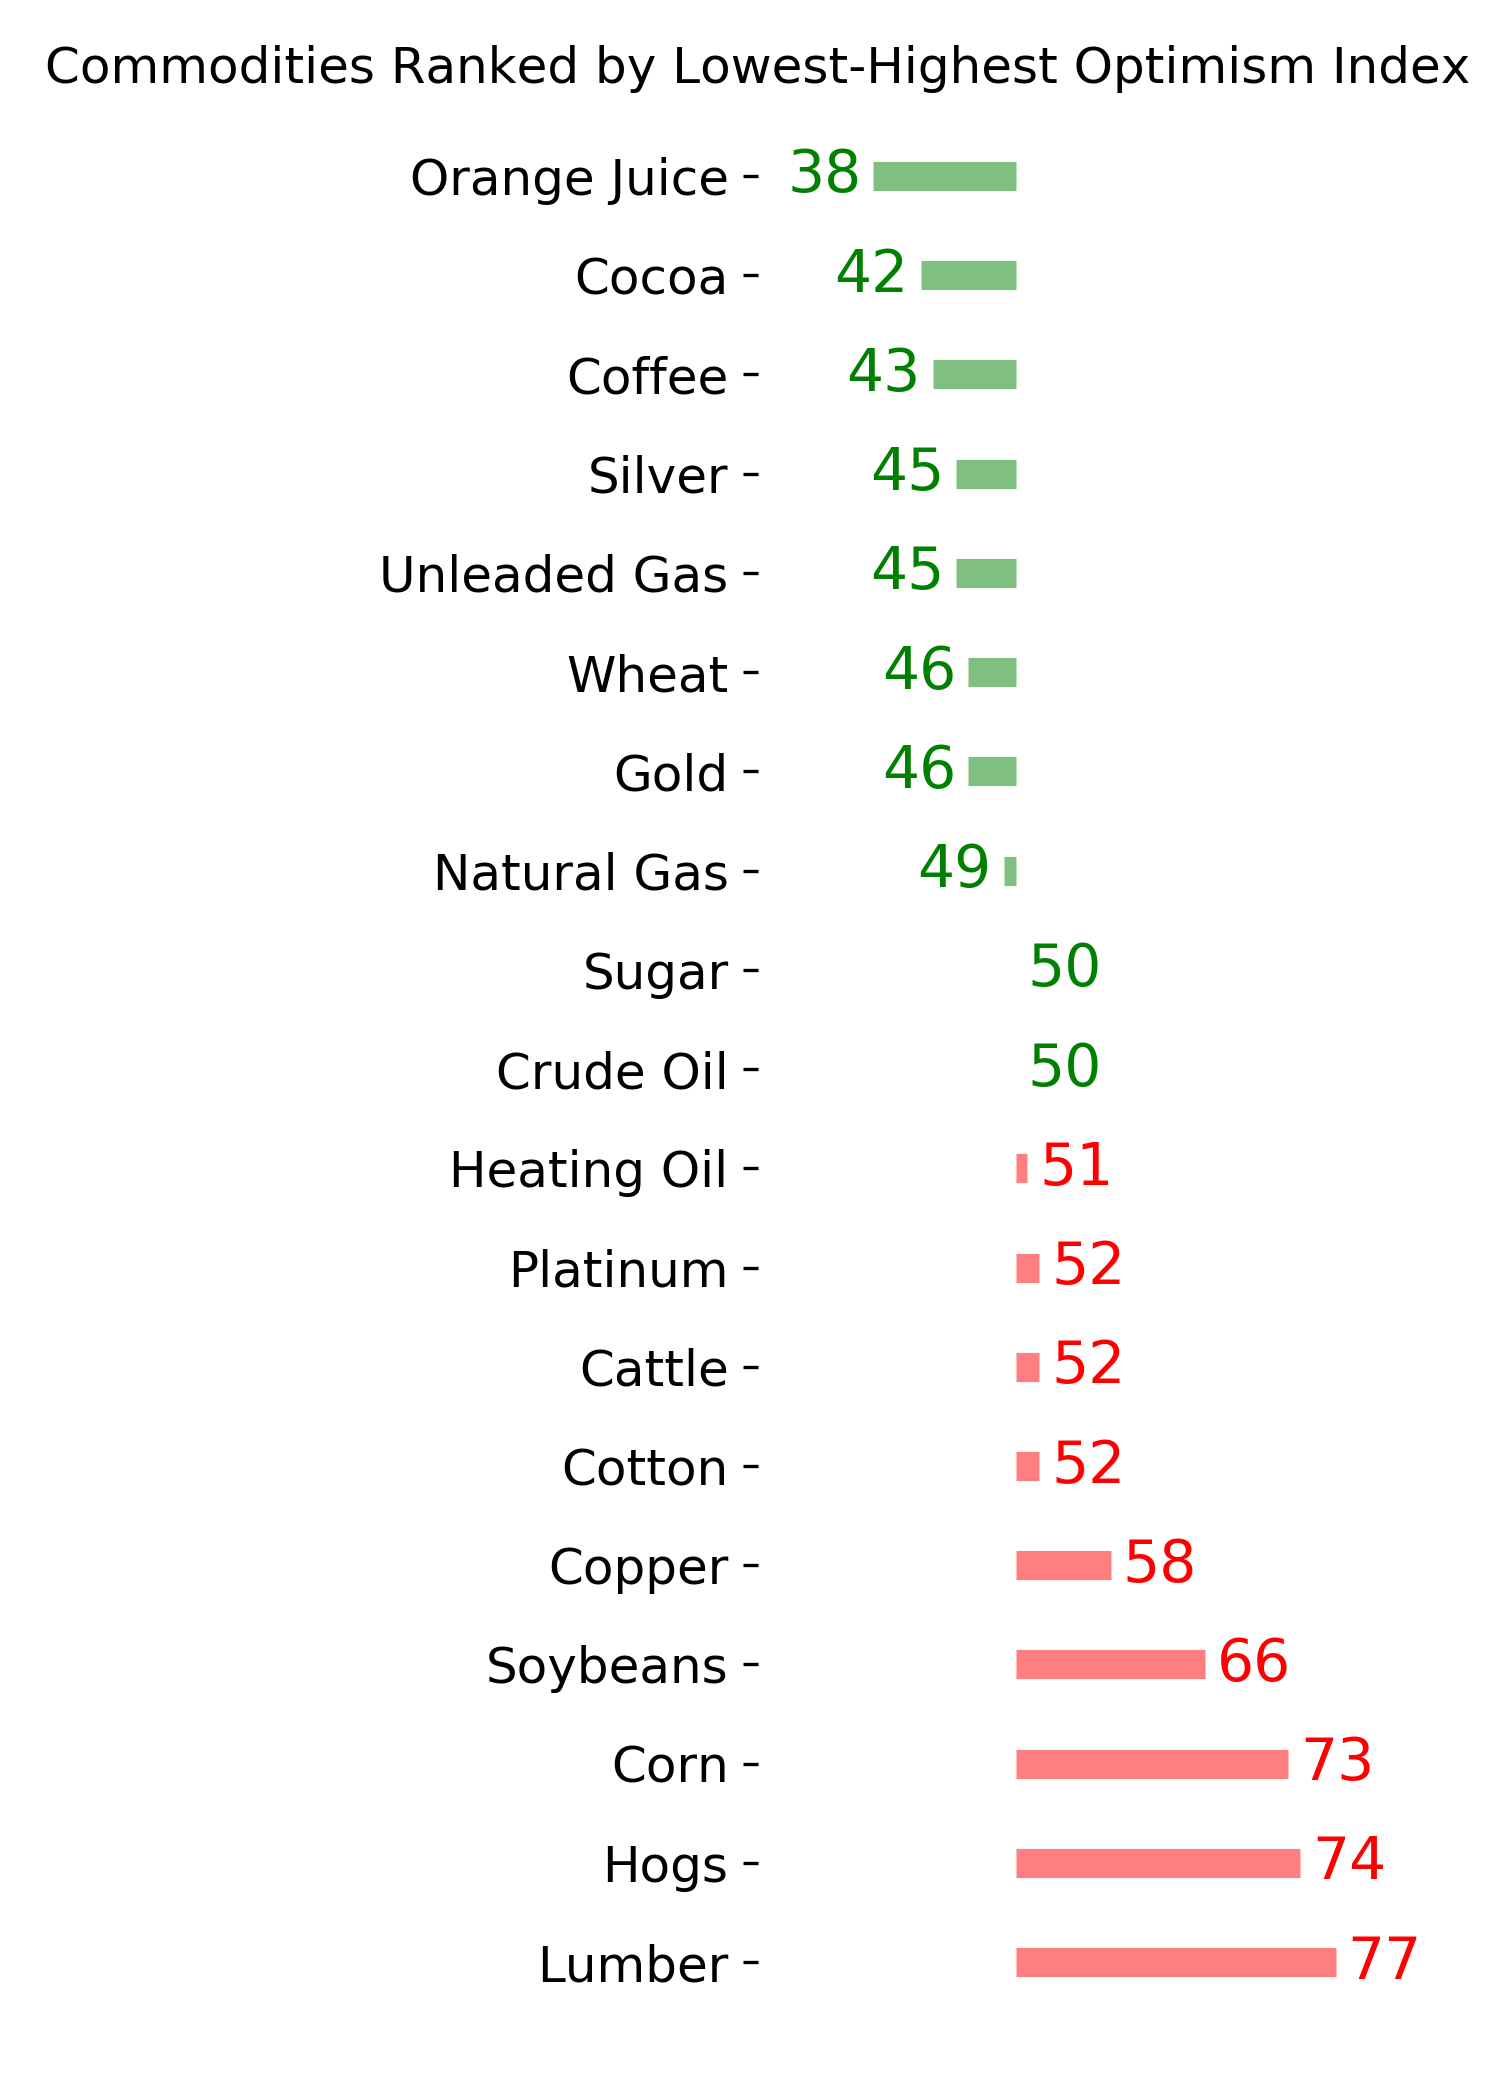
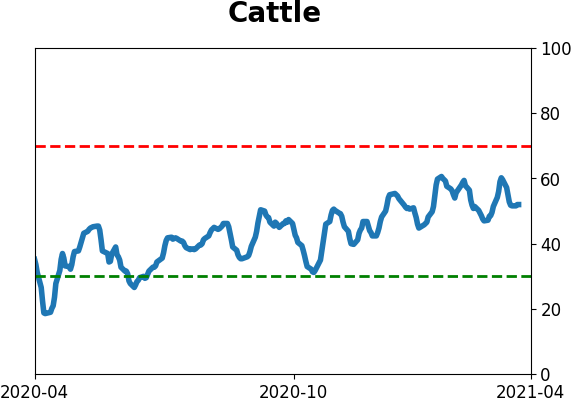
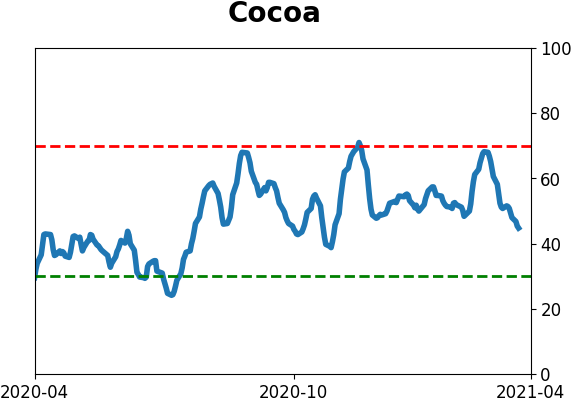
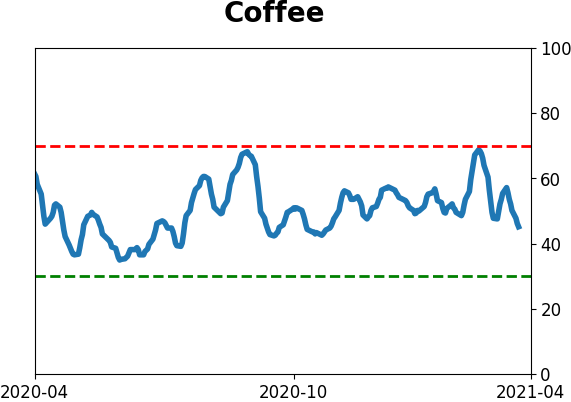
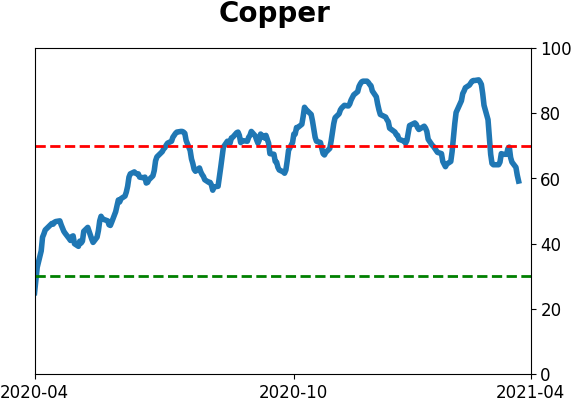
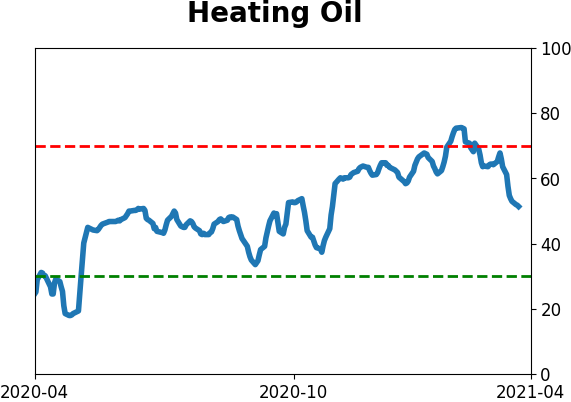
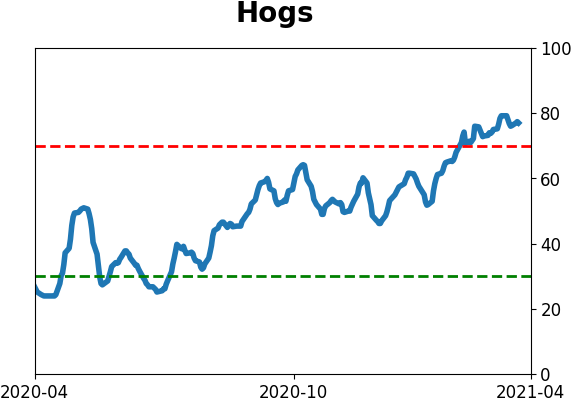
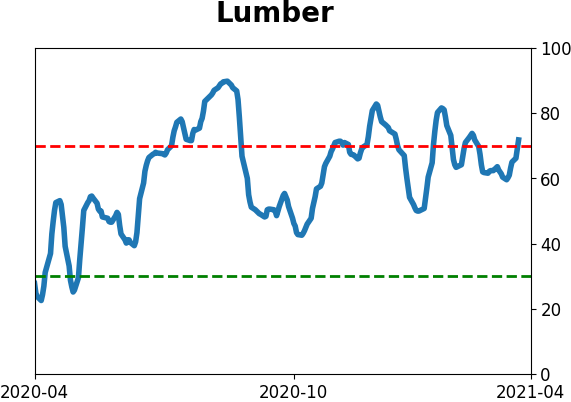
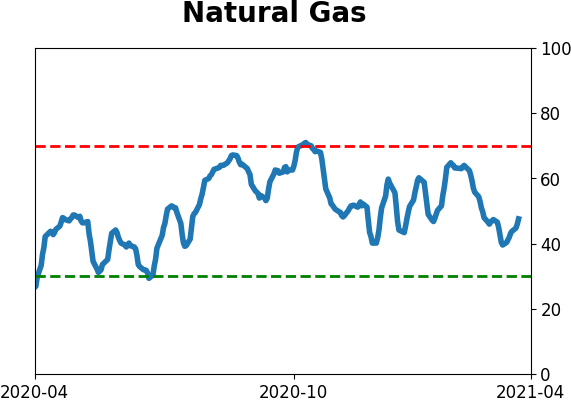
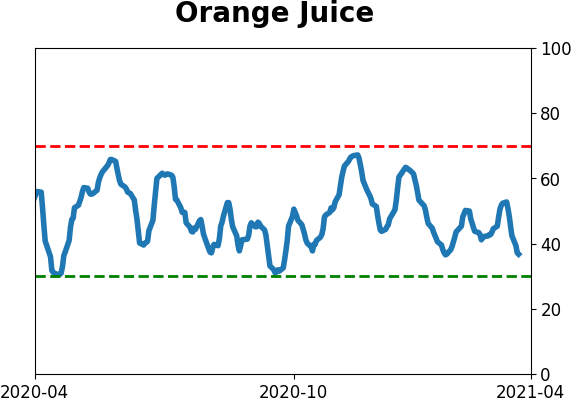
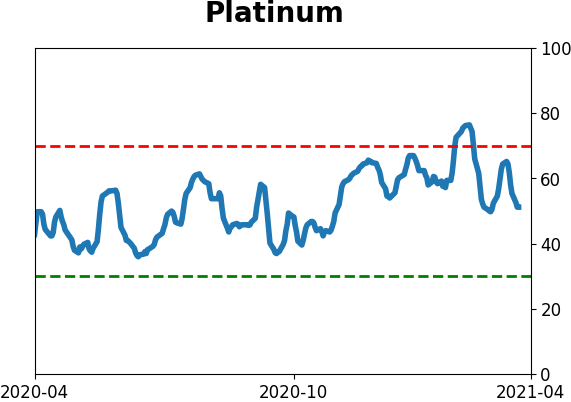
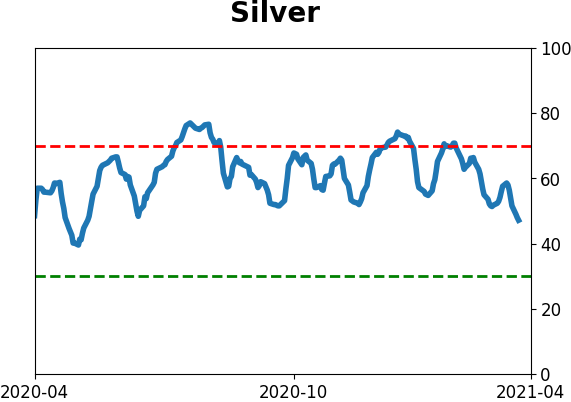
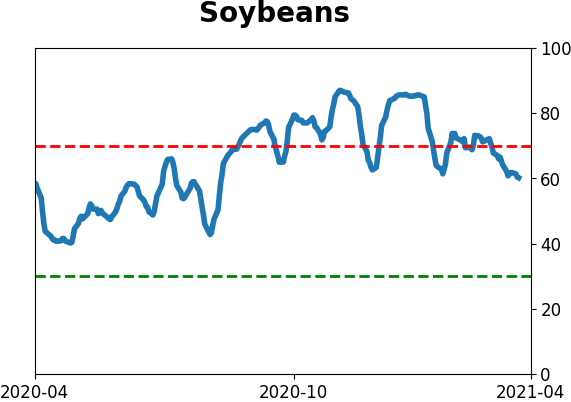
Commodity ETF's - 5-Day Moving Average
|
|