Headlines
|
|
Negative energy:
Sentiment on oil has reached compelling extremes, even if not everything agrees. There has been record volatility, and a mismatch in different contract terms. ETF investors have taken notice, and our Optimism Index is nearing a record low.
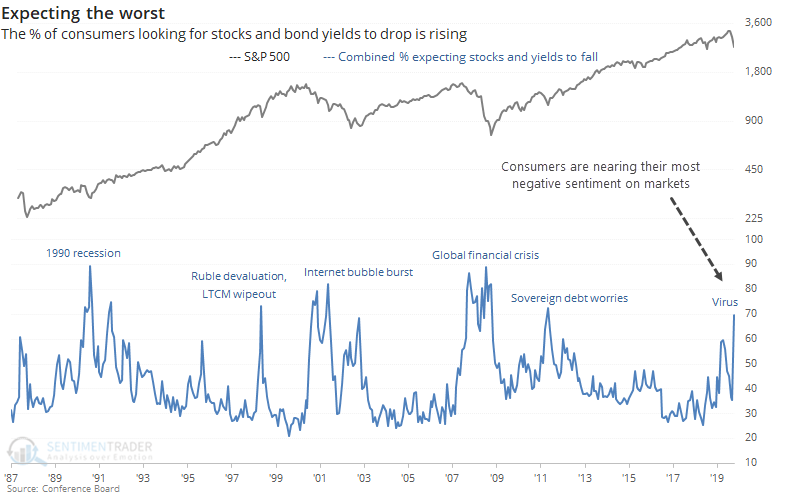
Consumers are increasingly expecting negative returns:
Sentiment surveys of the average consumer are starting to reflect a sharp change in expectations toward stocks. After record or near-record optimism earlier in 2020, they're now showing huge shifts toward pessimism. Most have not had enough time to fully reflect the decline, though.
|
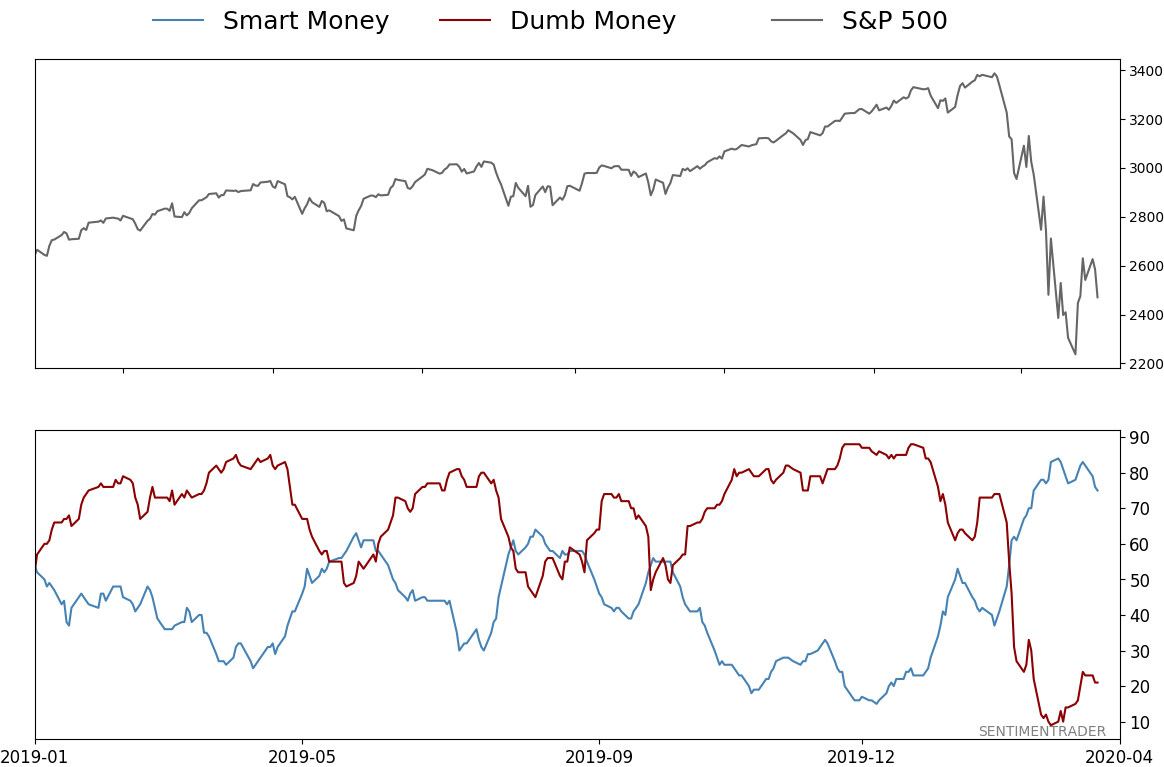
Smart / Dumb Money Confidence
|
Smart Money Confidence: 75%
Dumb Money Confidence: 21%
|
|
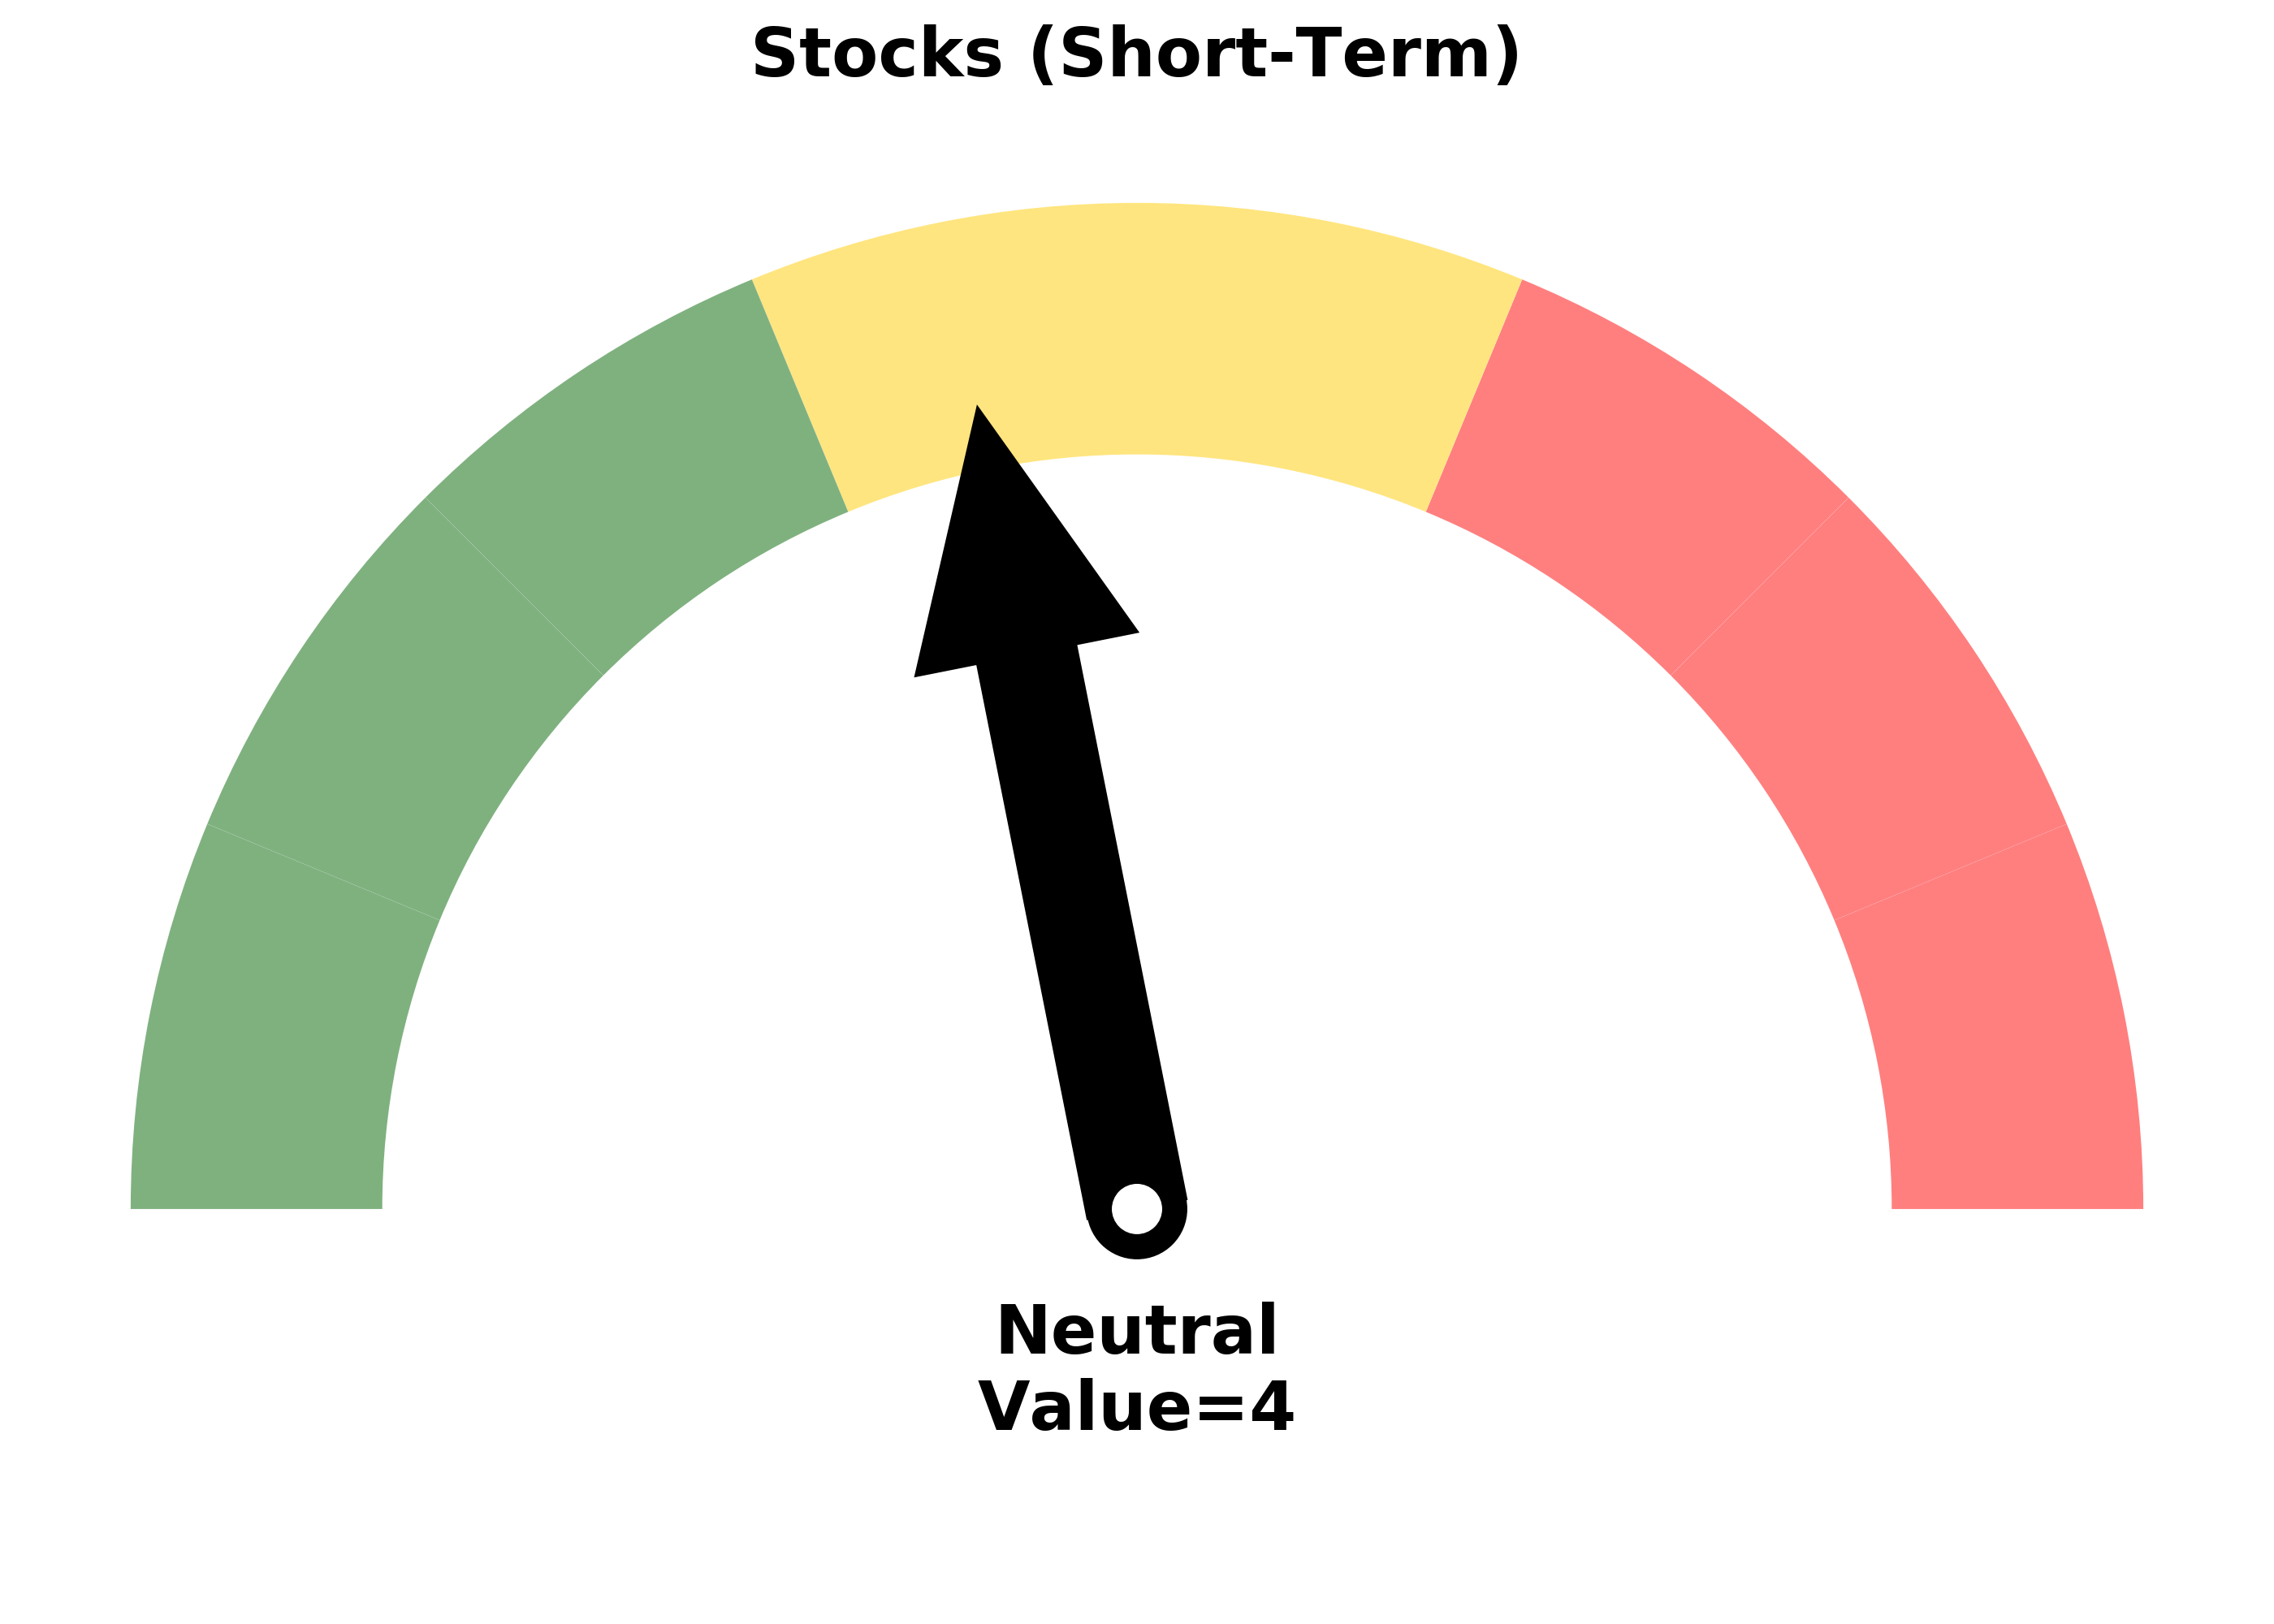
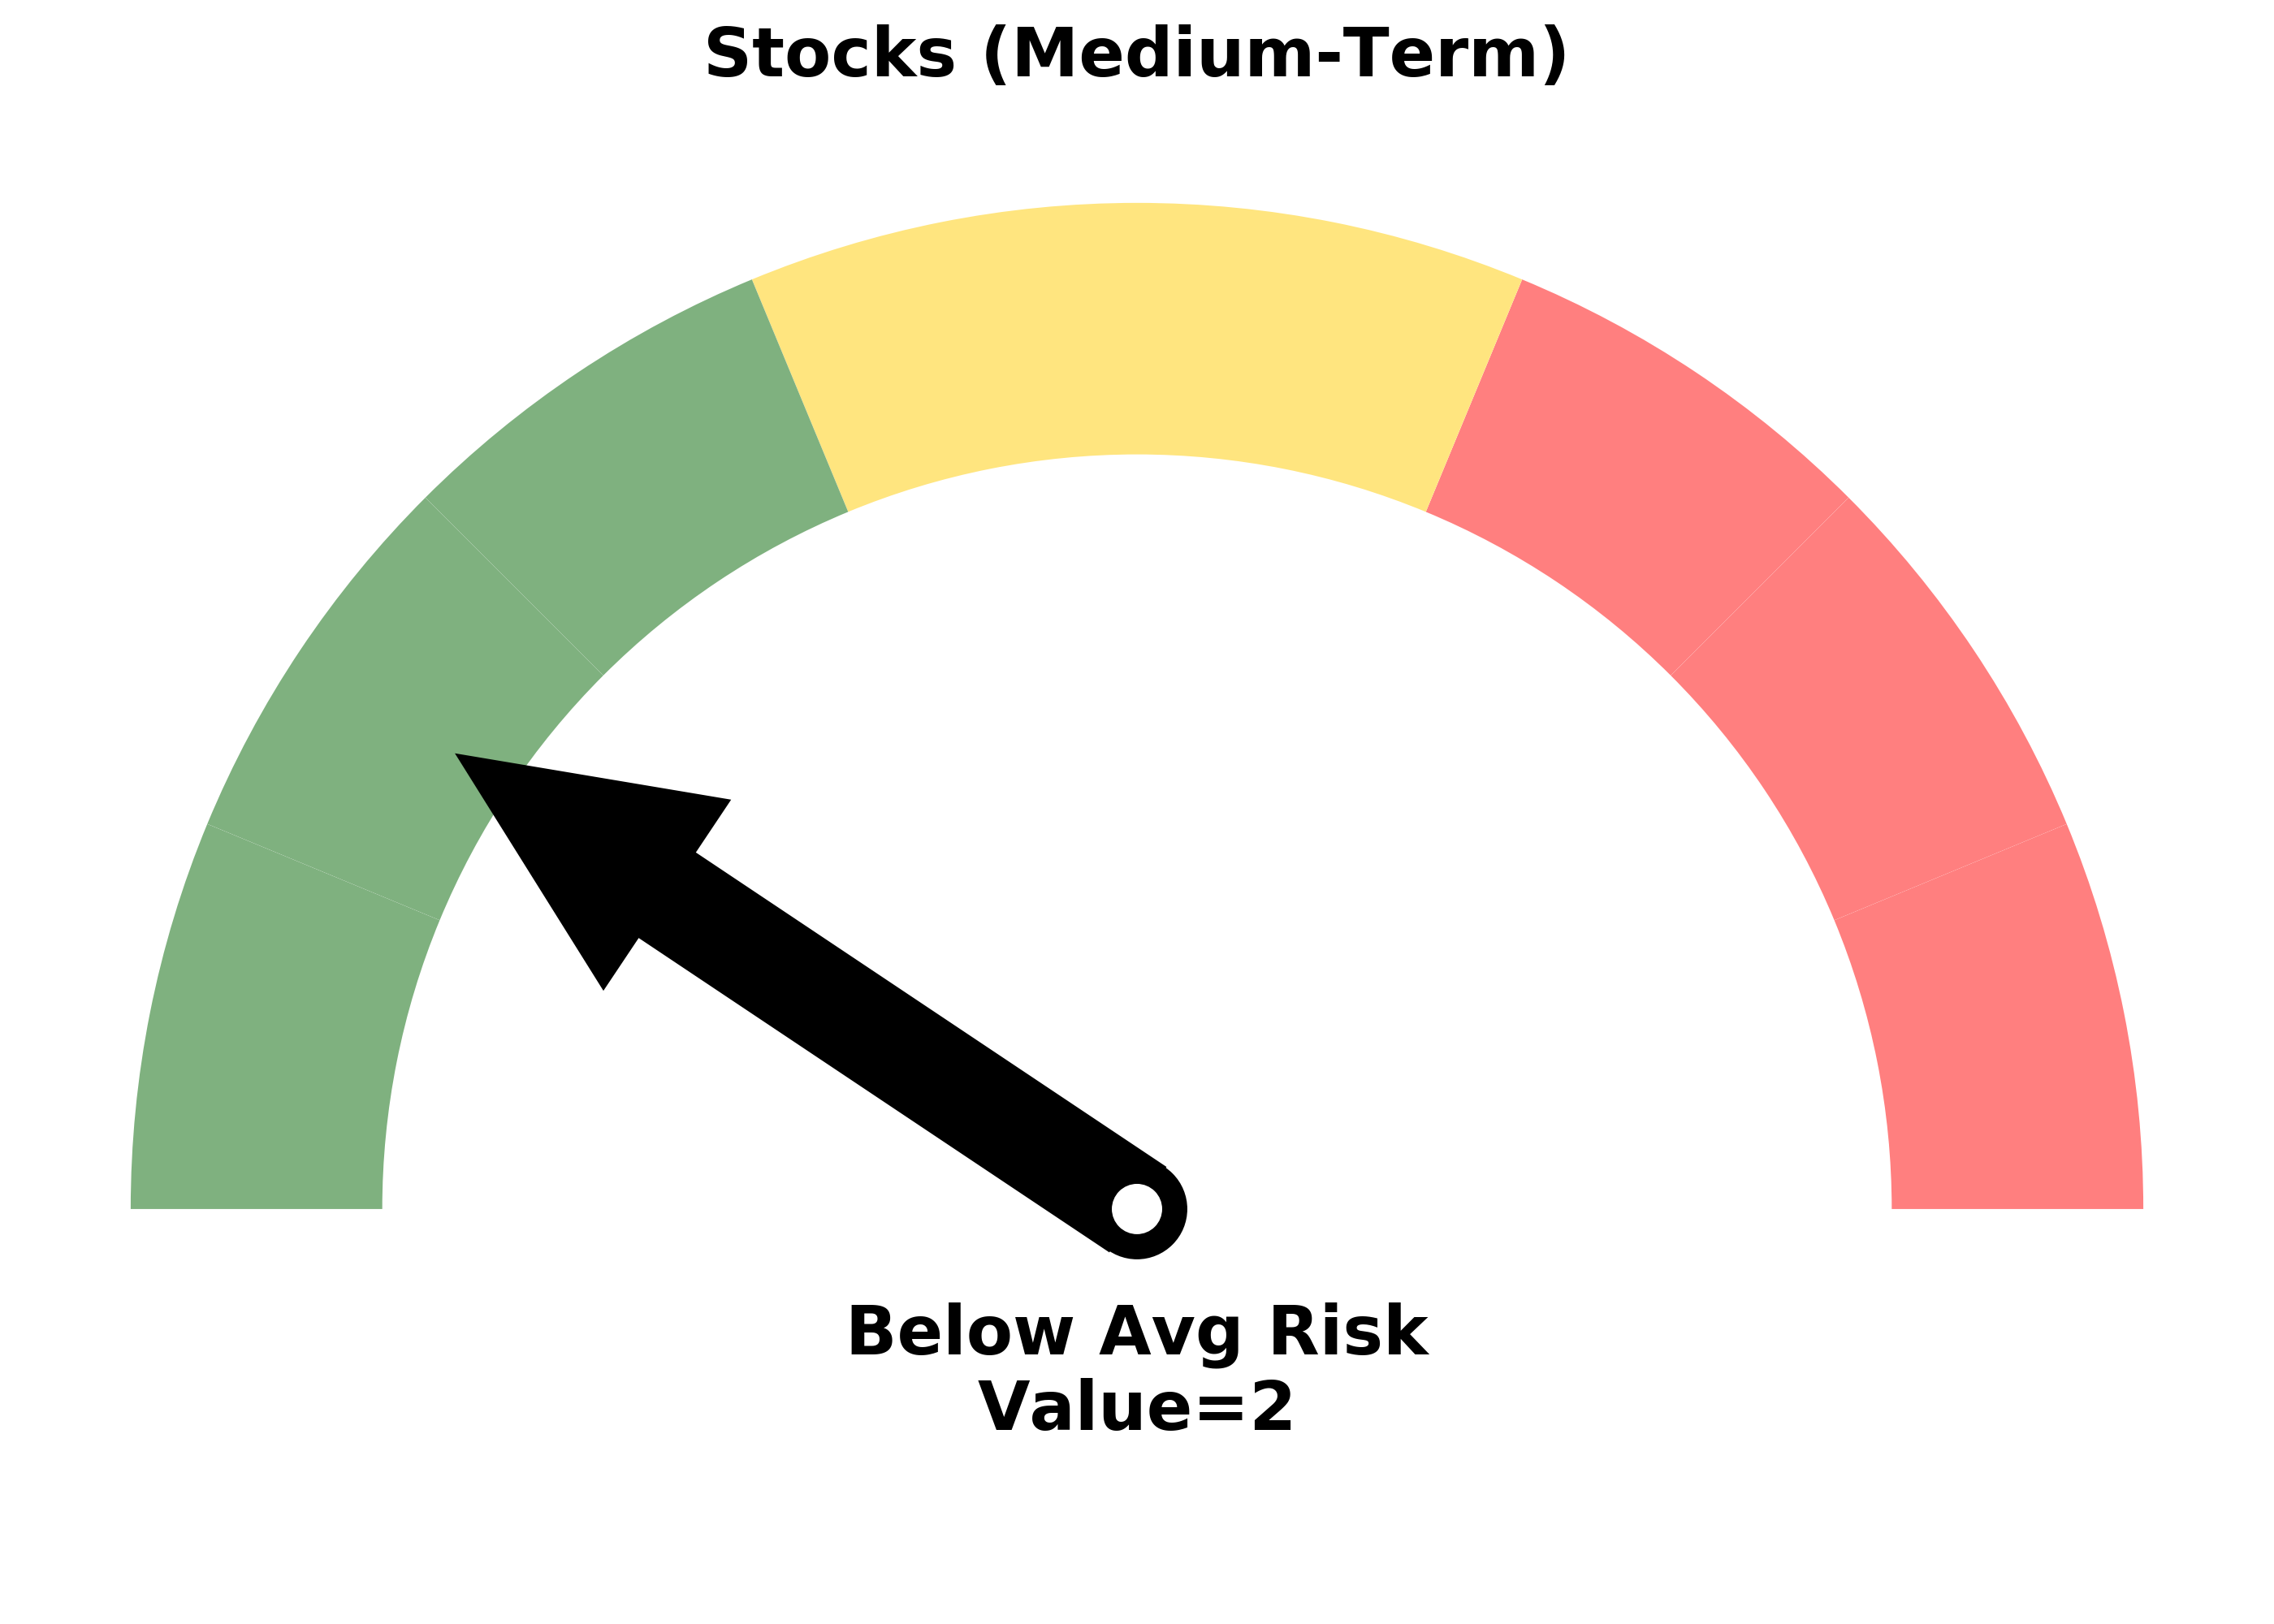
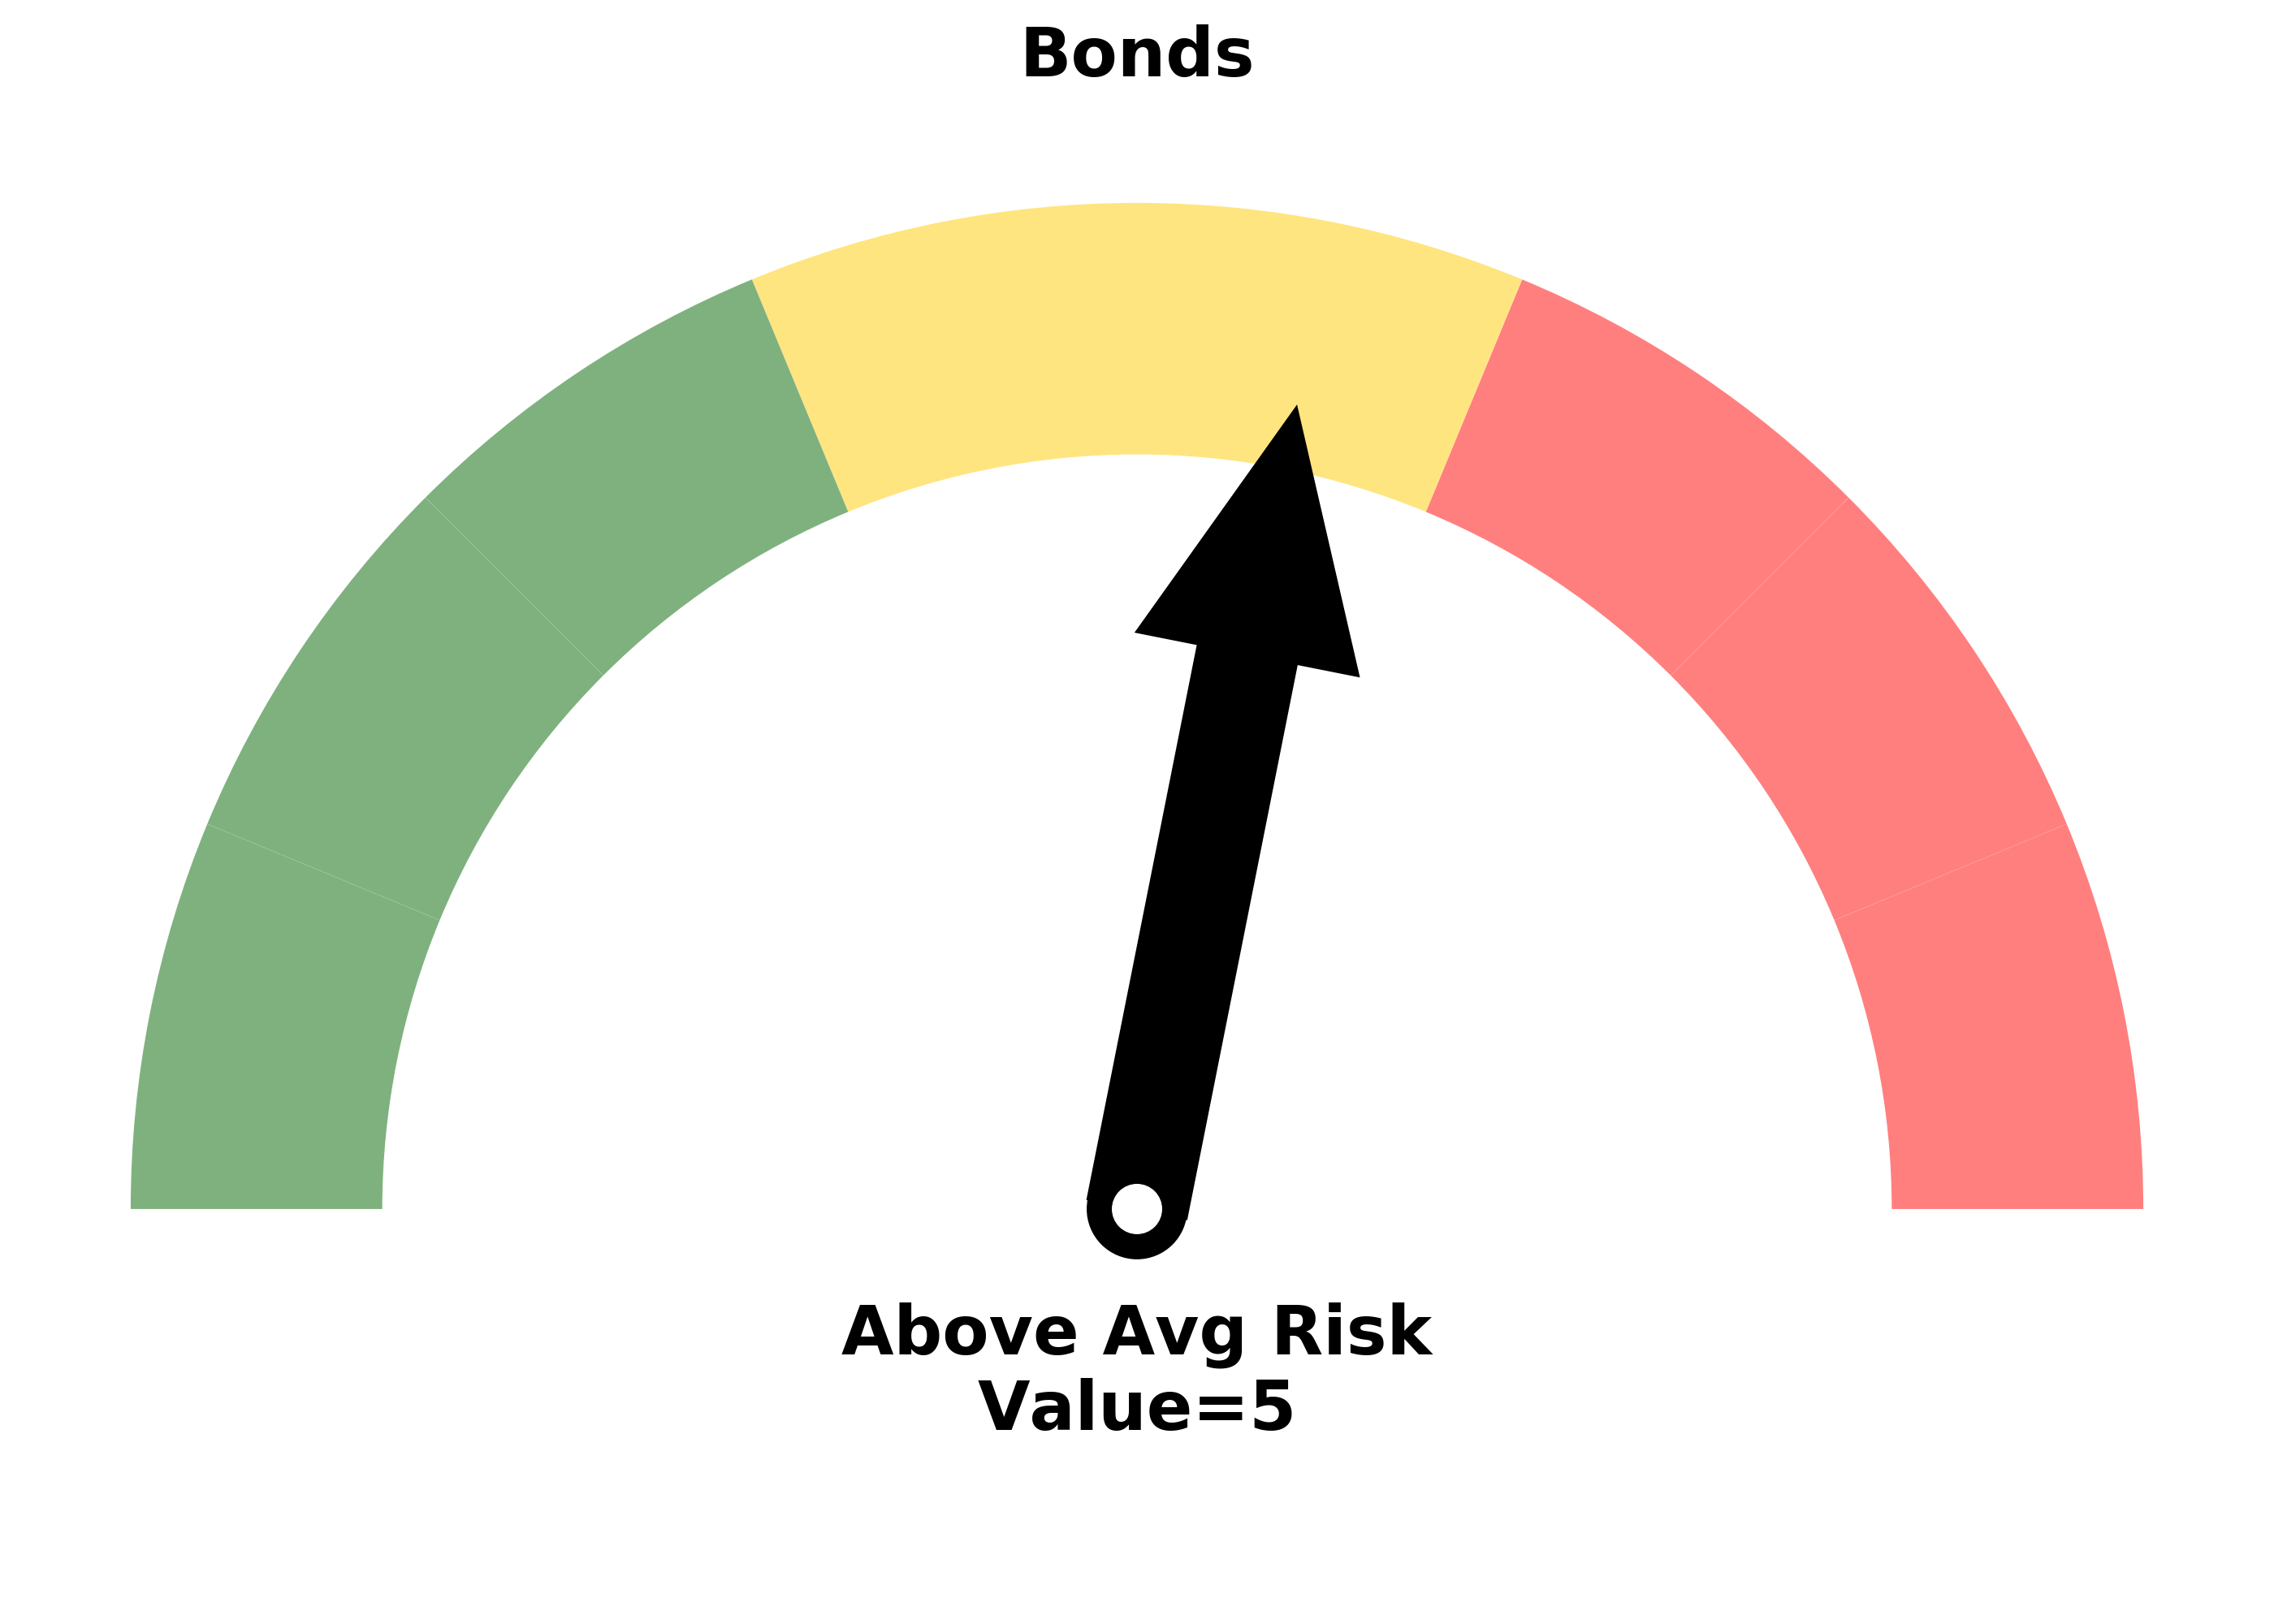
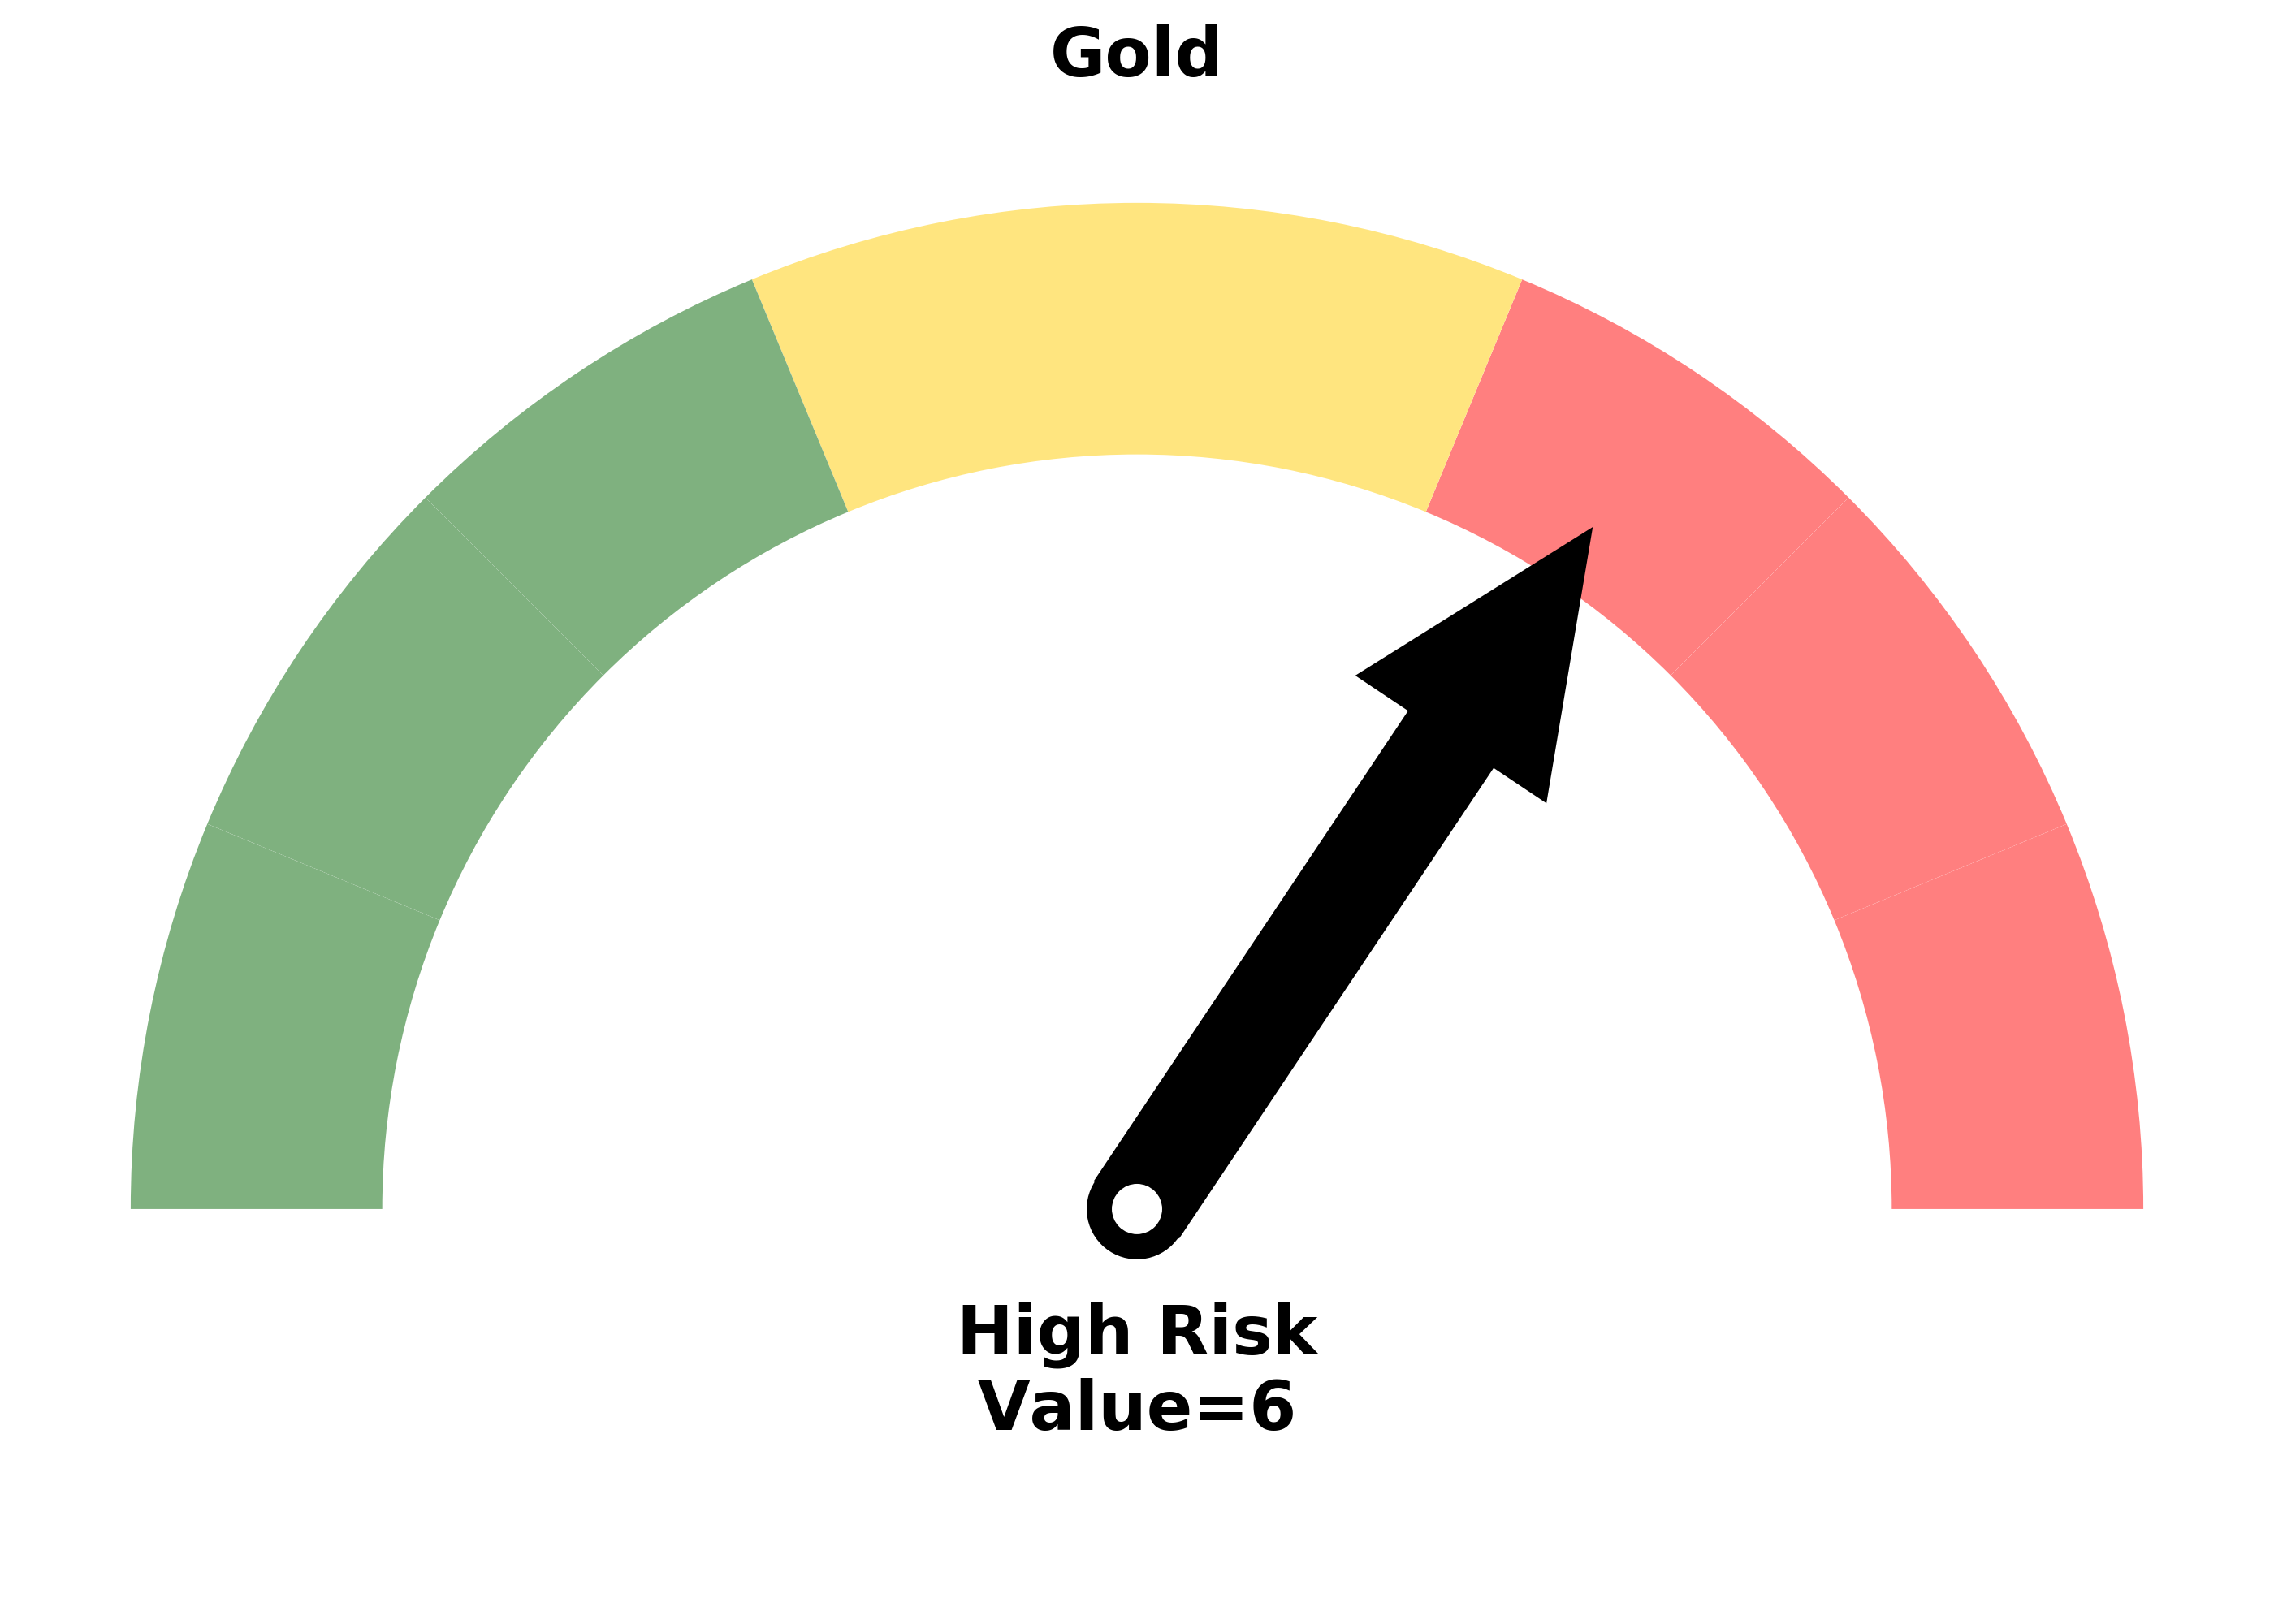
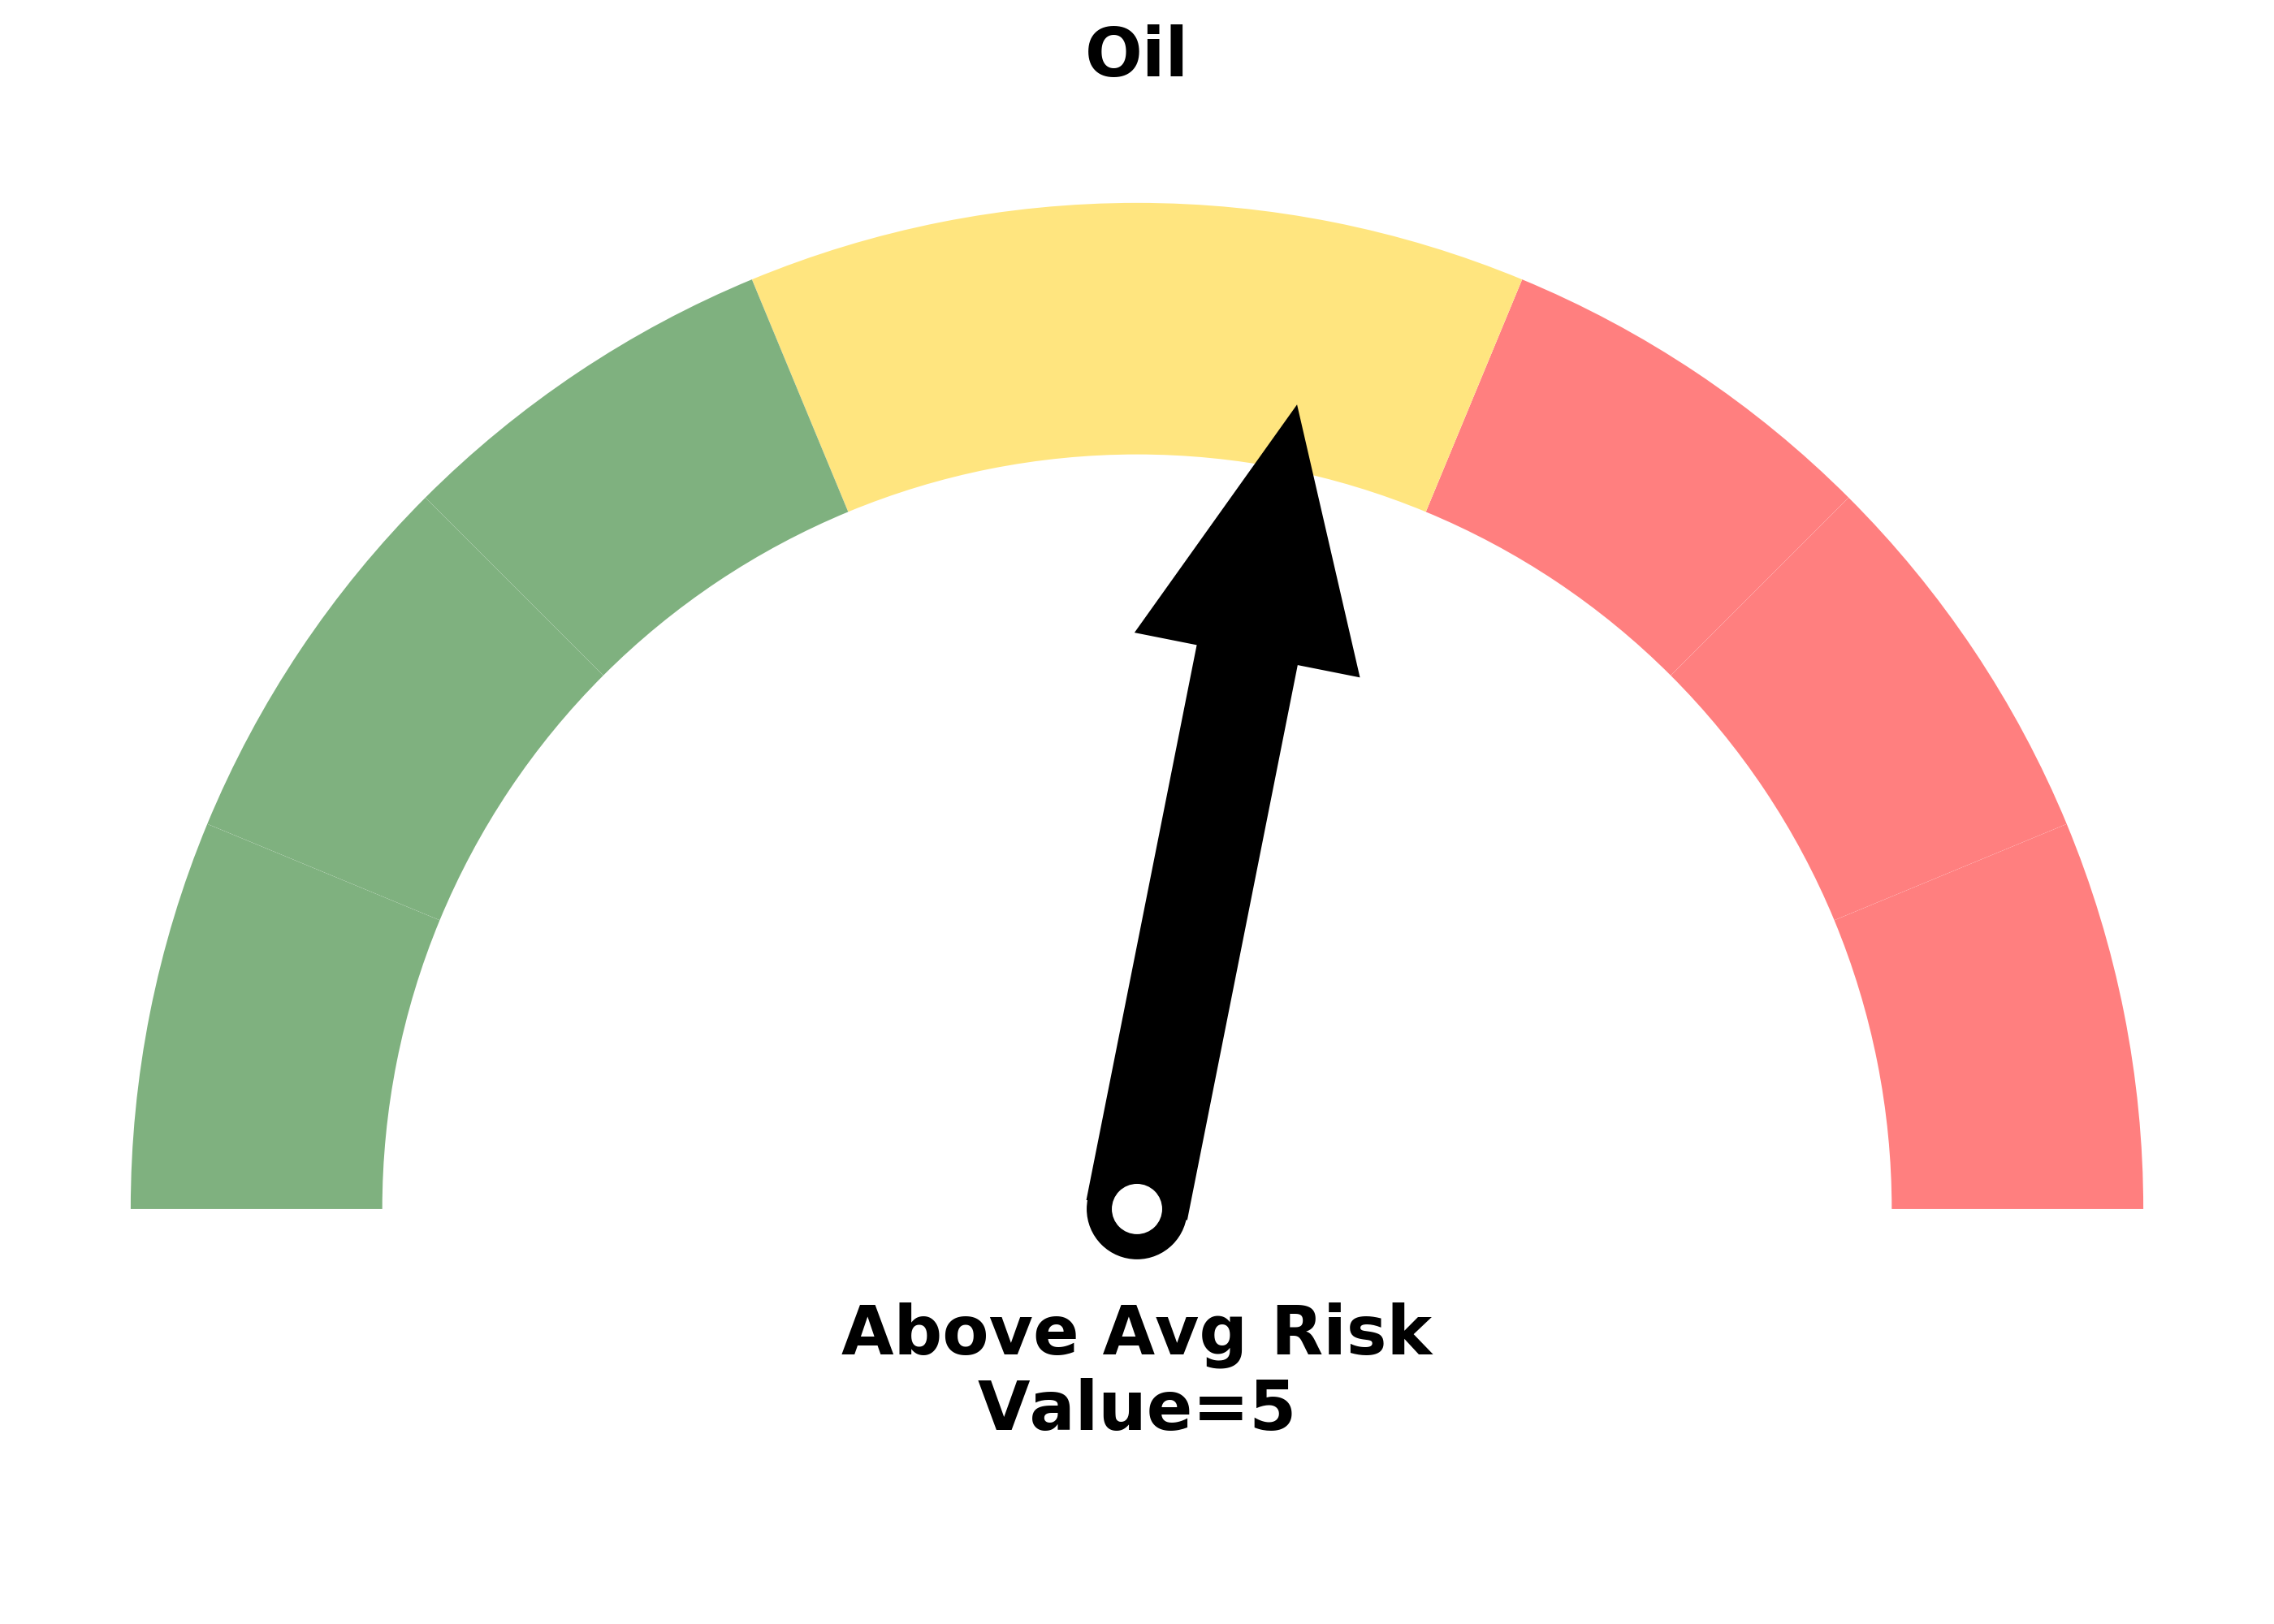
Risk Levels
Research
BOTTOM LINE
Sentiment on oil has reached compelling extremes, even if not everything agrees. There has been record volatility, and a mismatch in different contract terms. ETF investors have taken notice, and our Optimism Index is nearing a record low.
FORECAST / TIMEFRAME
USO -- Up, Medium-Term
|
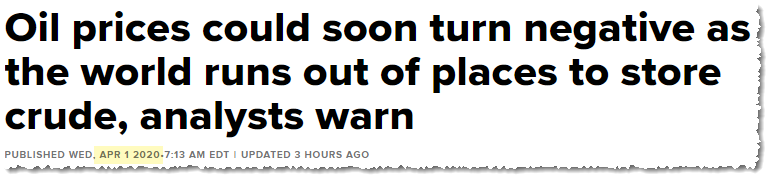
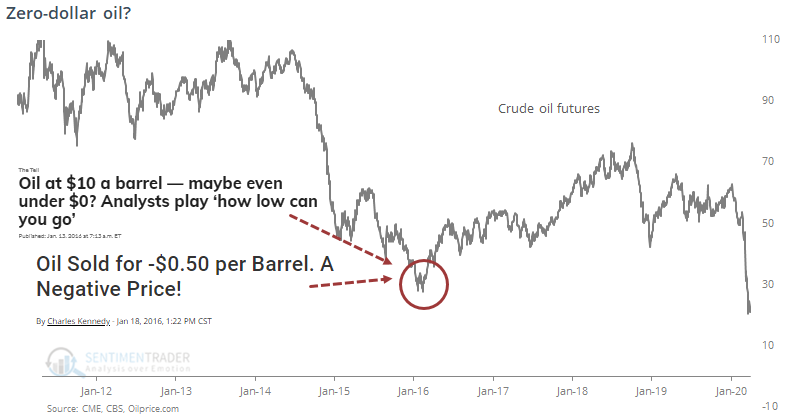
Negative oil prices? According to some, it could happen. Per CNBC:
What's interesting about this is it's not the first time the concept of zero or negative oil prices has been discussed in mainstream financial media. This also made the rounds in early 2016.
It seems like the drumbeat of negative views has commanded attention. The number of shares outstanding in oil ETPs has gone parabolic.
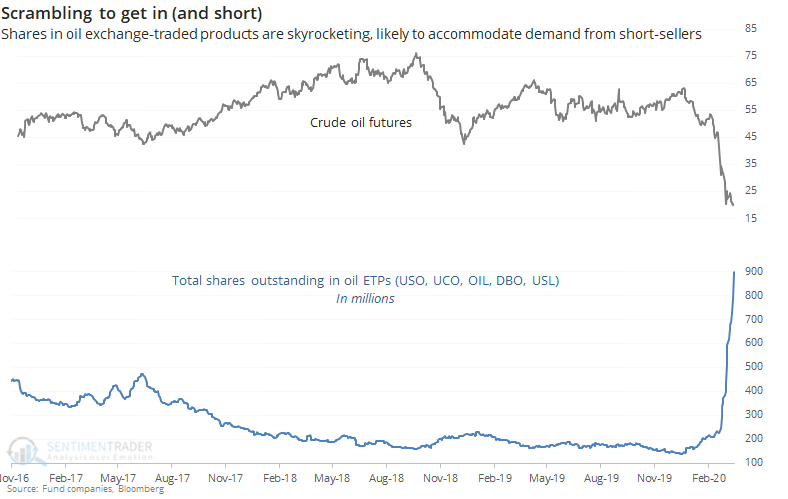
In funds like these, we often see share counts rise during declines, and it's not always due to knife-catching buy-the-dippers. It can also be due to the companies creating more units in order to accommodate demand from those looking to sell short.
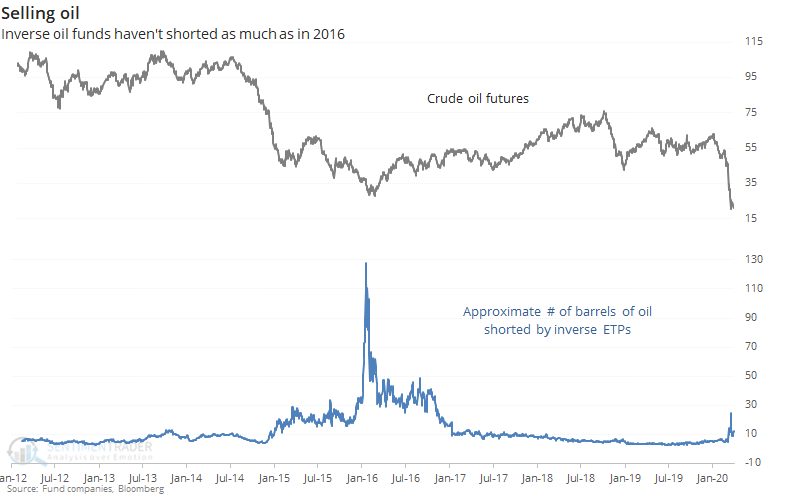
Instead of selling an ETF or ETN short, a trader could buy an inverse fund that profits when oil falls. These aren't as popular as inverse funds for stocks, and while they've picked up lately, it's nowhere near like what happened in early 2016. Bloomberg creates a custom index that approximates the number of barrels of oil sold short by the inverse funds, and currently it's far from the 2016 extreme.
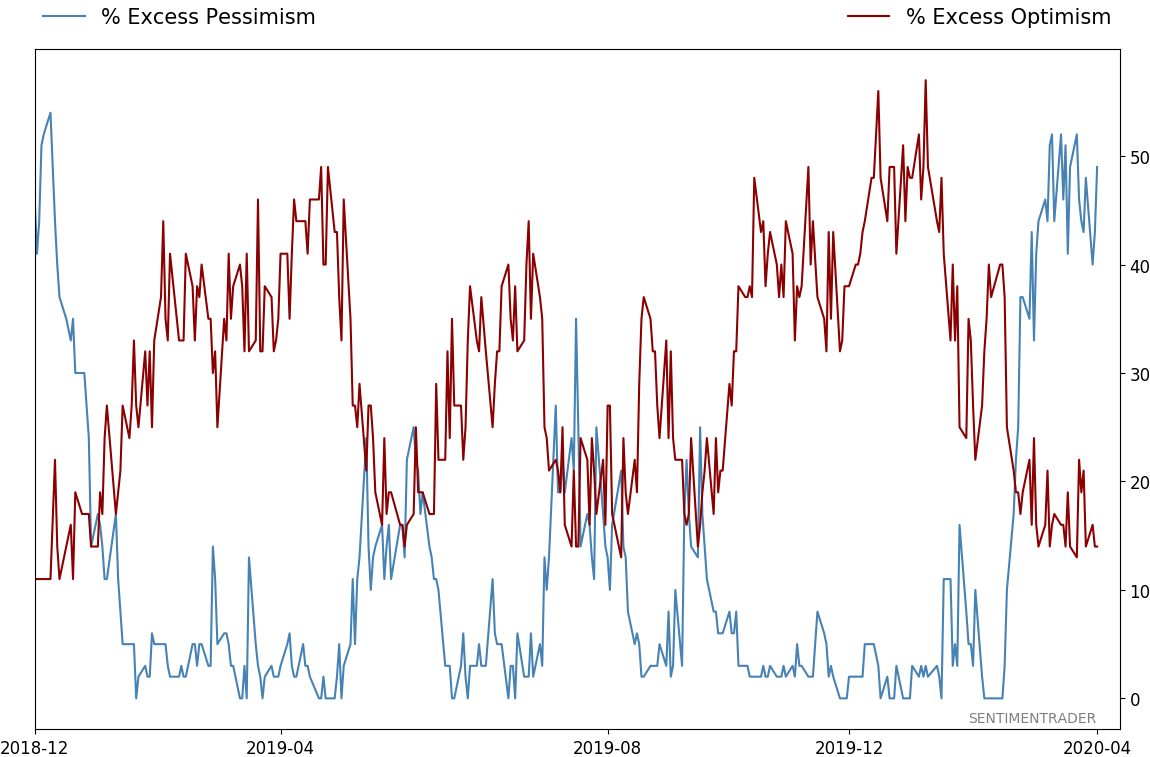
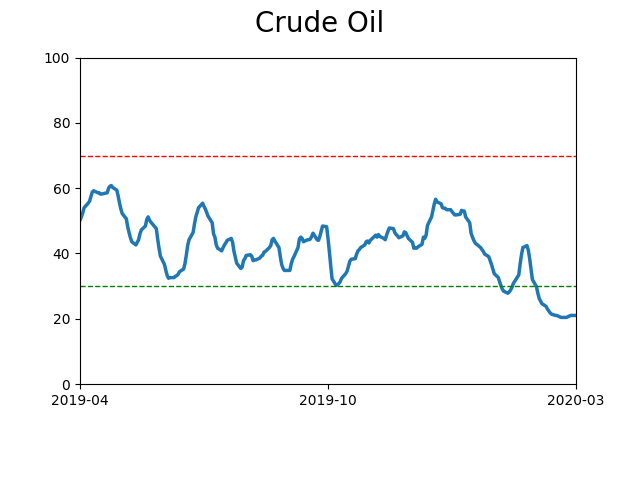
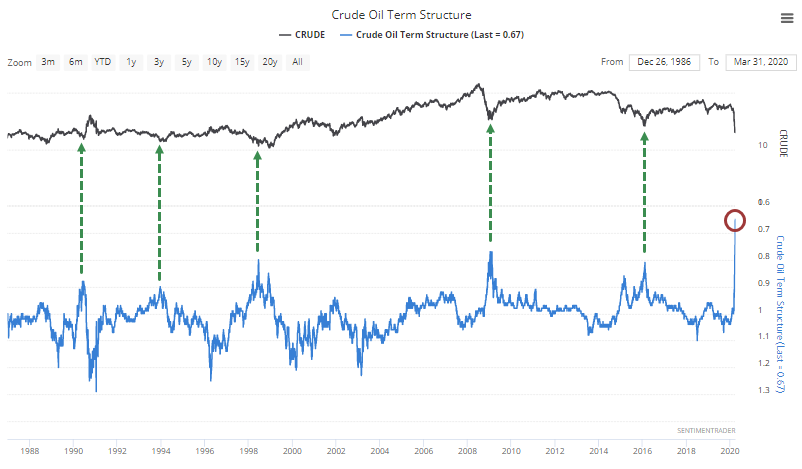
Sentiment on oil and energy stocks hit extremely negative territory in late February, and has only gotten worse, one of the rare cases of truly extreme sentiment becoming even more so. The negative sentiment been enough to push the 20-day Optimism Index for crude to one of the lowest levels since 1991.
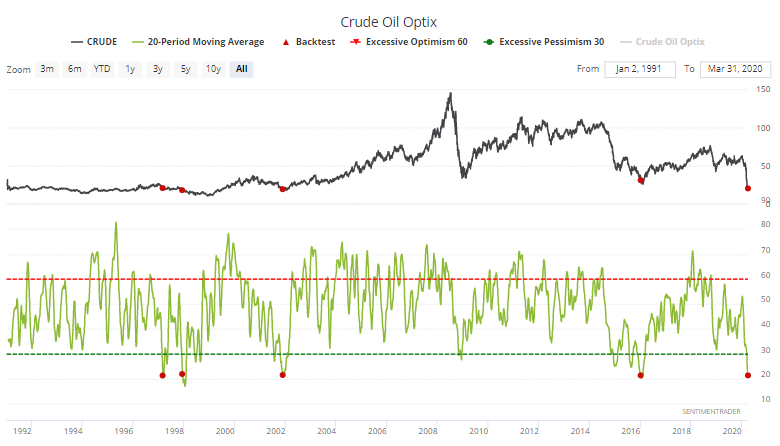
That wasn't enough to stop the slide in the late 1990s as the contract went on to (much) lower lows.
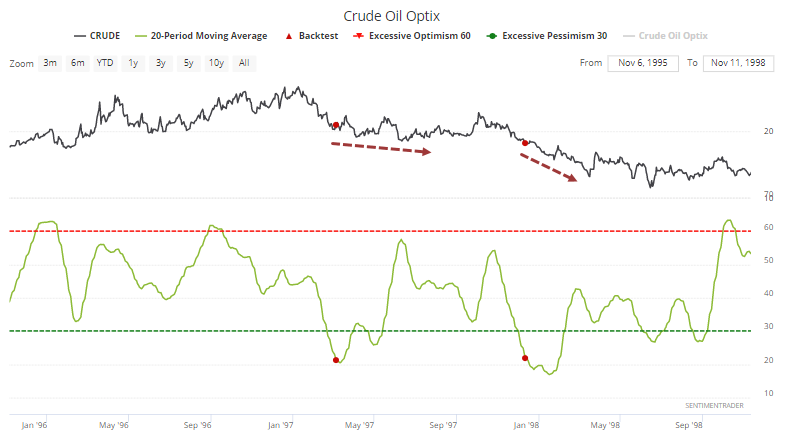
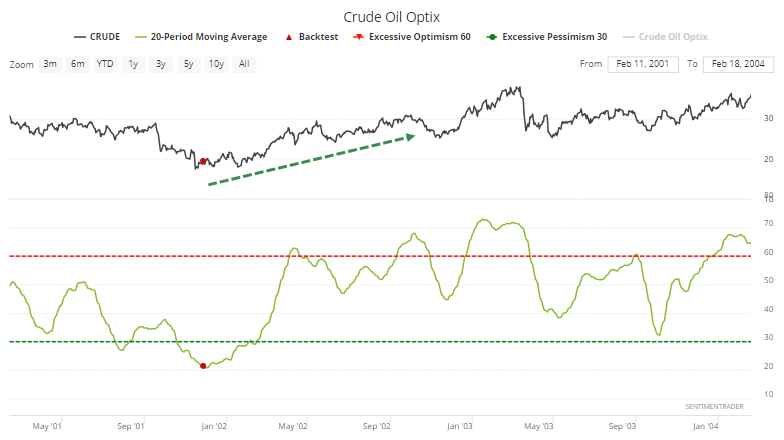
The signal in 2001 was a lot more successful.
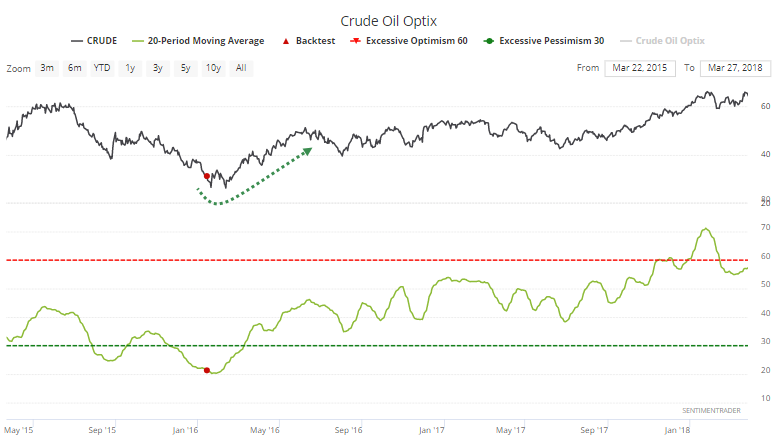
So was the bout of pessimism in 2016, though it suffered some shorter-term volatility first.
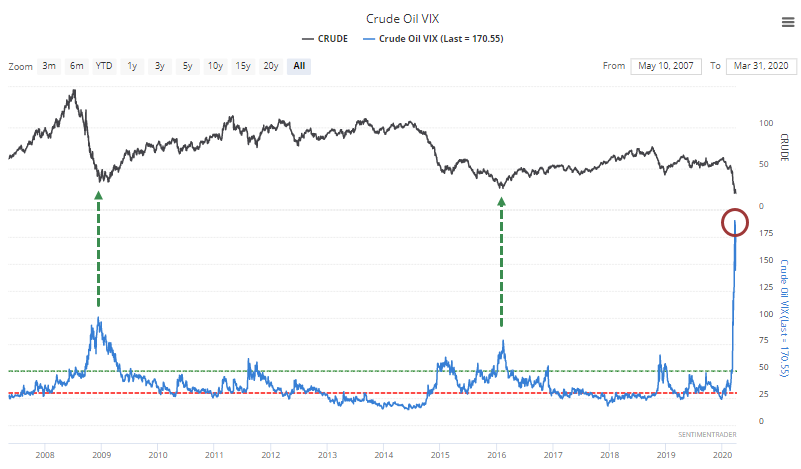
In some respects, the move this time has been even more extreme. Implied volatility in oil has by far exceeded the prior extremes.
The spread between near and far-term oil futures has moved to a record, depending on the calculations used (scale is inverted).
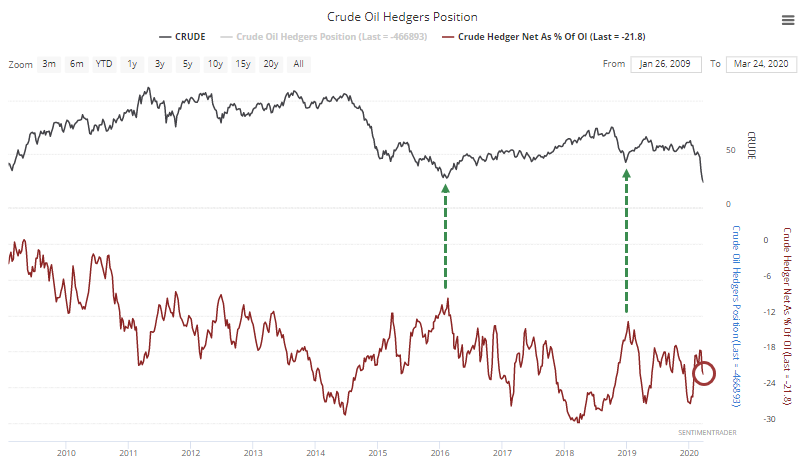
Those are compelling, but not everything agrees. "Smart money" hedgers haven't been too eager to buy, with their position as a percentage of open interest remaining about in the middle of their recent range. Recent lows in crude coincided with more optimistic positioning from this group of traders.
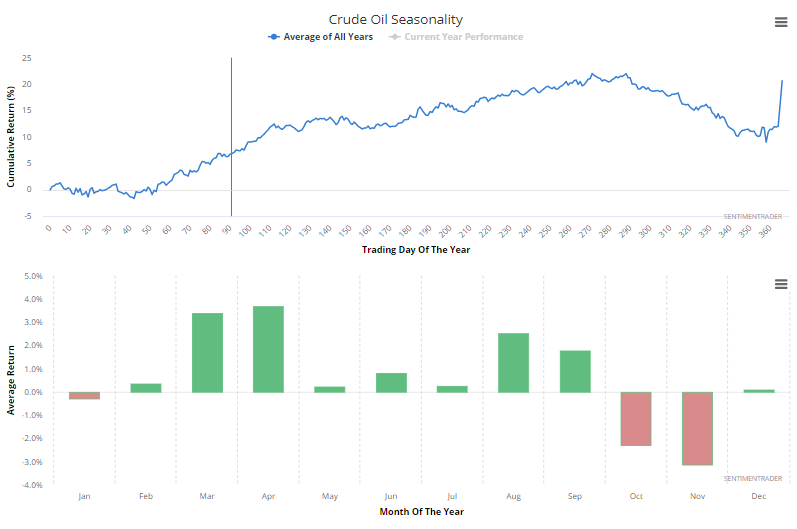
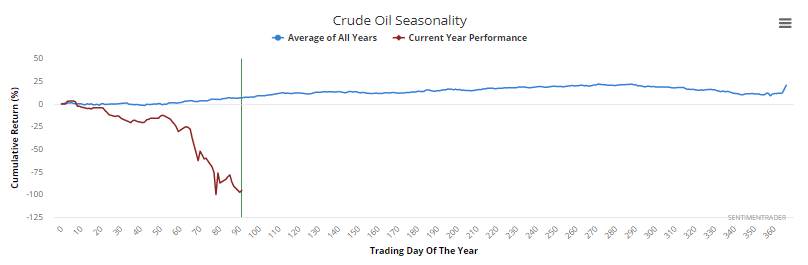
Oil tends to drift higher during the summer months, for whatever a seasonal pattern is worth this year.
So far in 2020, it hasn't exactly followed its usual path.
Overall, there are some compelling reasons to believe that sentiment has reached its practical minimum. When we start to hear talk about negative prices, that's a pretty good clue in and of itself. Quite a few indicators support that view, even though like usual, not everything agrees. If the commodity (and energy stocks) hadn't already reached a lesser extreme in February and completely failed, then this setup would be more compelling.
When a market doesn't do what it should, it's usually telling us something. Commodity markets can be overwhelmed by structural factors from time to time, and it looks like that's what's happening in oil. Because of that recent failure, trying to pick this bottom seems higher risk than it normally would. But those trying to press short bets with indicator values like this seem to be running an even higher risk of sentiment quickly changing and recouping some of the damage.
BOTTOM LINE
Sentiment surveys of the average consumer are starting to reflect a sharp change in expectations toward stocks. After record or near-record optimism earlier in 2020, they're now showing huge shifts toward pessimism. Most have not had enough time to fully reflect the decline, though.
FORECAST / TIMEFRAME
|
We saw in February that a record number of consumers were expecting stocks to rise, which hasn't been a great sign in the past, and wasn't again. Their attitude changed drastically according to surveys that are starting to include the March freefall.
The latest release from the University of Michigan showed a record one-month decline in the percentage of consumers looking for a rally. The March survey from the Conference Board also showed a sharp drop.
Not only are consumers now expecting stocks to fall, they're also looking for declining bond yields. We looked at the survey in this way last September and it has been a decent sign for stocks going forward. Not surprisingly, now it's even more extreme than it was then.
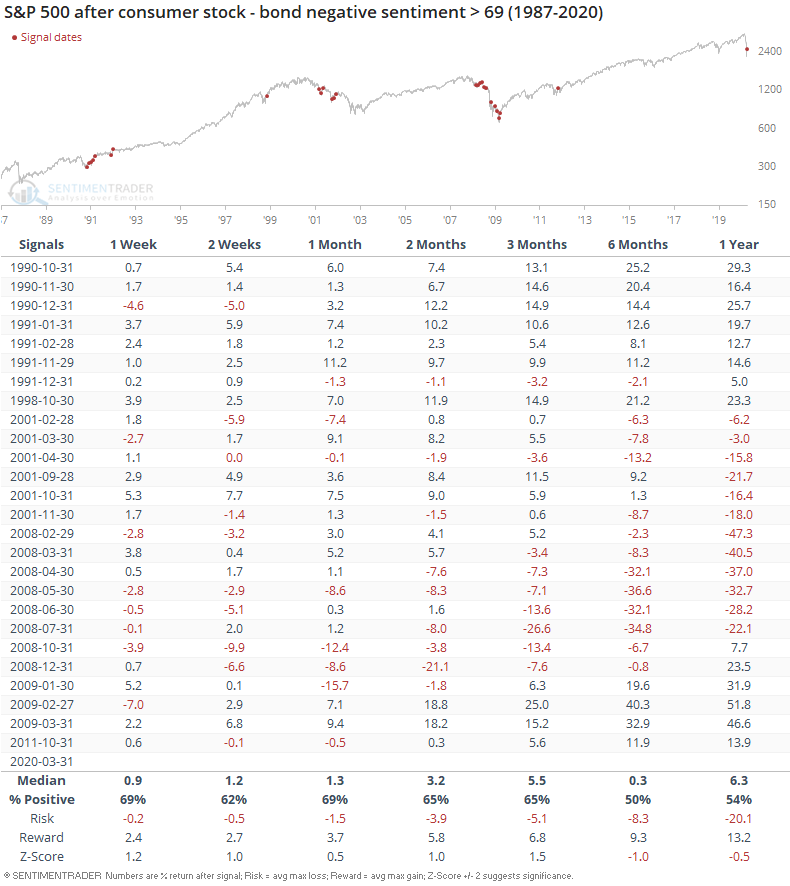
Such negative sentiment led to mostly higher returns for stocks, but it was awfully early in 2001 and 2008, depending on the time frame.
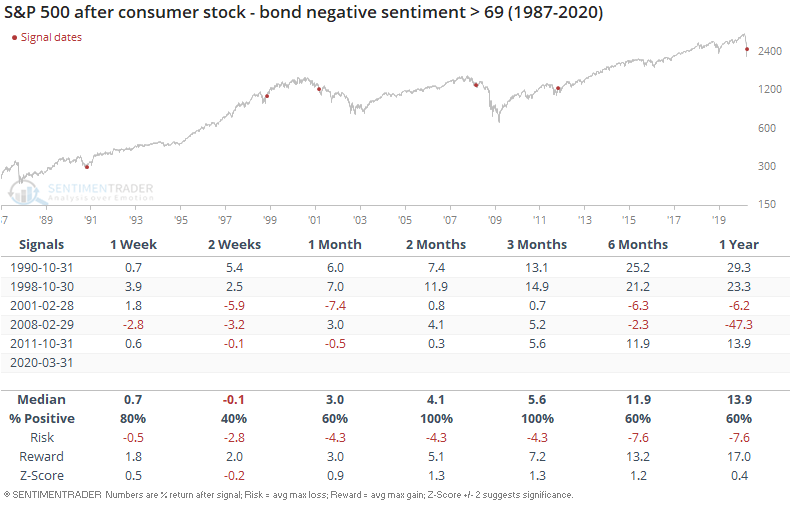
If we only look at the first signal in at least a year, then returns improve over the medium-term. That first stab lower in sentiment proved to be a temporary drop before at least a multi-month reprieve.
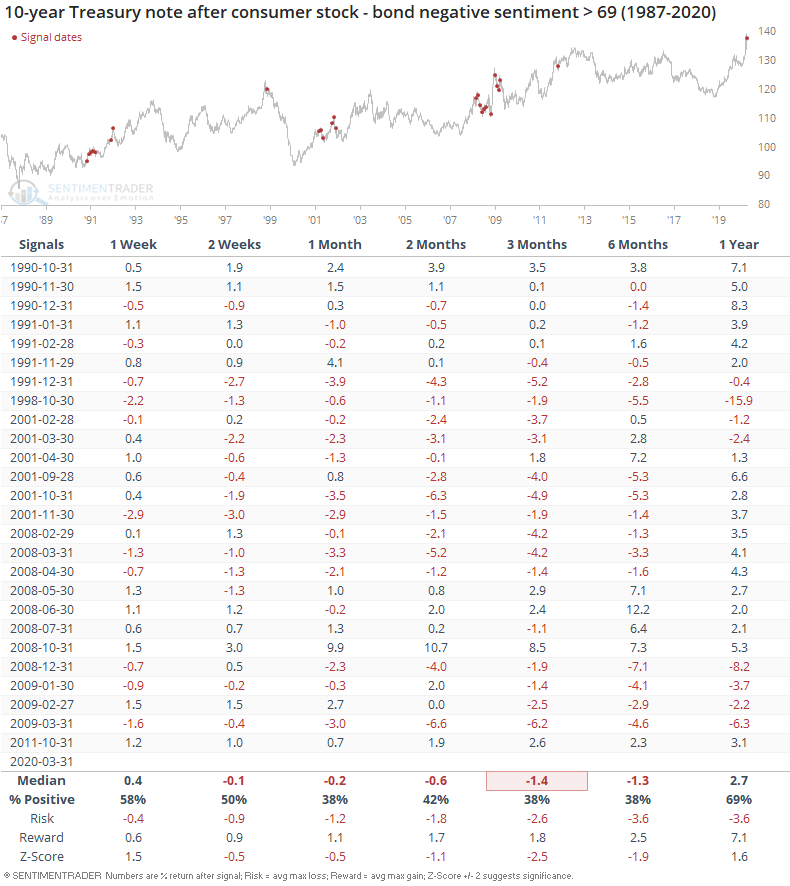
For bonds, it wasn't such a great sign.
Sentiment indicators, especially those that are survey-based, don't change on a dime. The wicked market in March served to make folks think hard about what had been record or near-record optimism, but most haven't had time to fully absorb the losses that were compressed in only a few weeks' time. Unless we see a strong rebound in April, many of these indicators (especially the surveys) will likely see pessimism on par with the largest declines in 30 years.
Active Studies
| Time Frame | Bullish | Bearish | | Short-Term | 0 | 2 | | Medium-Term | 17 | 14 | | Long-Term | 32 | 3 |
|
Indicators at Extremes
Portfolio
| Position | Weight % | Added / Reduced | Date | | Stocks | 73.2 | Added 31.3% | 2020-03-17 | | Bonds | 0.0 | Reduced 6.7% | 2020-02-28 | | Commodities | 5.5 | Added 2.4%
| 2020-02-28 | | Precious Metals | 0.0 | Reduced 3.6% | 2020-02-28 | | Special Situations | 0.0 | Reduced 31.9% | 2020-03-17 | | Cash | 21.3 | | |
|
Updates (Changes made today are underlined)
In the first months of the year, we saw manic trading activity. From big jumps in specific stocks to historic highs in retail trading activity to record highs in household confidence to almost unbelievable confidence among options traders. All of that has come amid a market where the average stock can’t keep up with their indexes. There were signs of waning momentum in stocks underlying the major averages, which started triggering technical warning signs in late January. The kinds of extremes we saw in December and January typically take months to wear away, but the type of selling we’ve seen over the past month has gone a long way toward getting there. When we place the kind of moves we saw into March 23 into the context of coming off an all-time high, there has been a high probability of a multi-month rebound. The volatility we’ve seen lately is extremely compelling from a medium-term point of view. Virtually everything we’ve looked at suggests a strong probability of gains over the next several months, even within the context of a potential bear market, and even from what had been higher prices. After stocks bottomed on the 23rd, they enjoyed a historic buying thrust. While other signs are mixed at best that panic is subsiding, that thrust is one of the most encouraging sign we've seen in years. There is often a test of a panic low in the weeks after an initial recovery, but that thrust we saw, combined with the larger-than-usual retracement, have me less convinced a test is necessary. For now, I see no overwhelming reason to add or reduce exposure.
RETURN YTD: -16.3% 2019: 12.6%, 2018: 0.6%, 2017: 3.8%, 2016: 17.1%, 2015: 9.2%, 2014: 14.5%, 2013: 2.2%, 2012: 10.8%, 2011: 16.5%, 2010: 15.3%, 2009: 23.9%, 2008: 16.2%, 2007: 7.8%
|
|
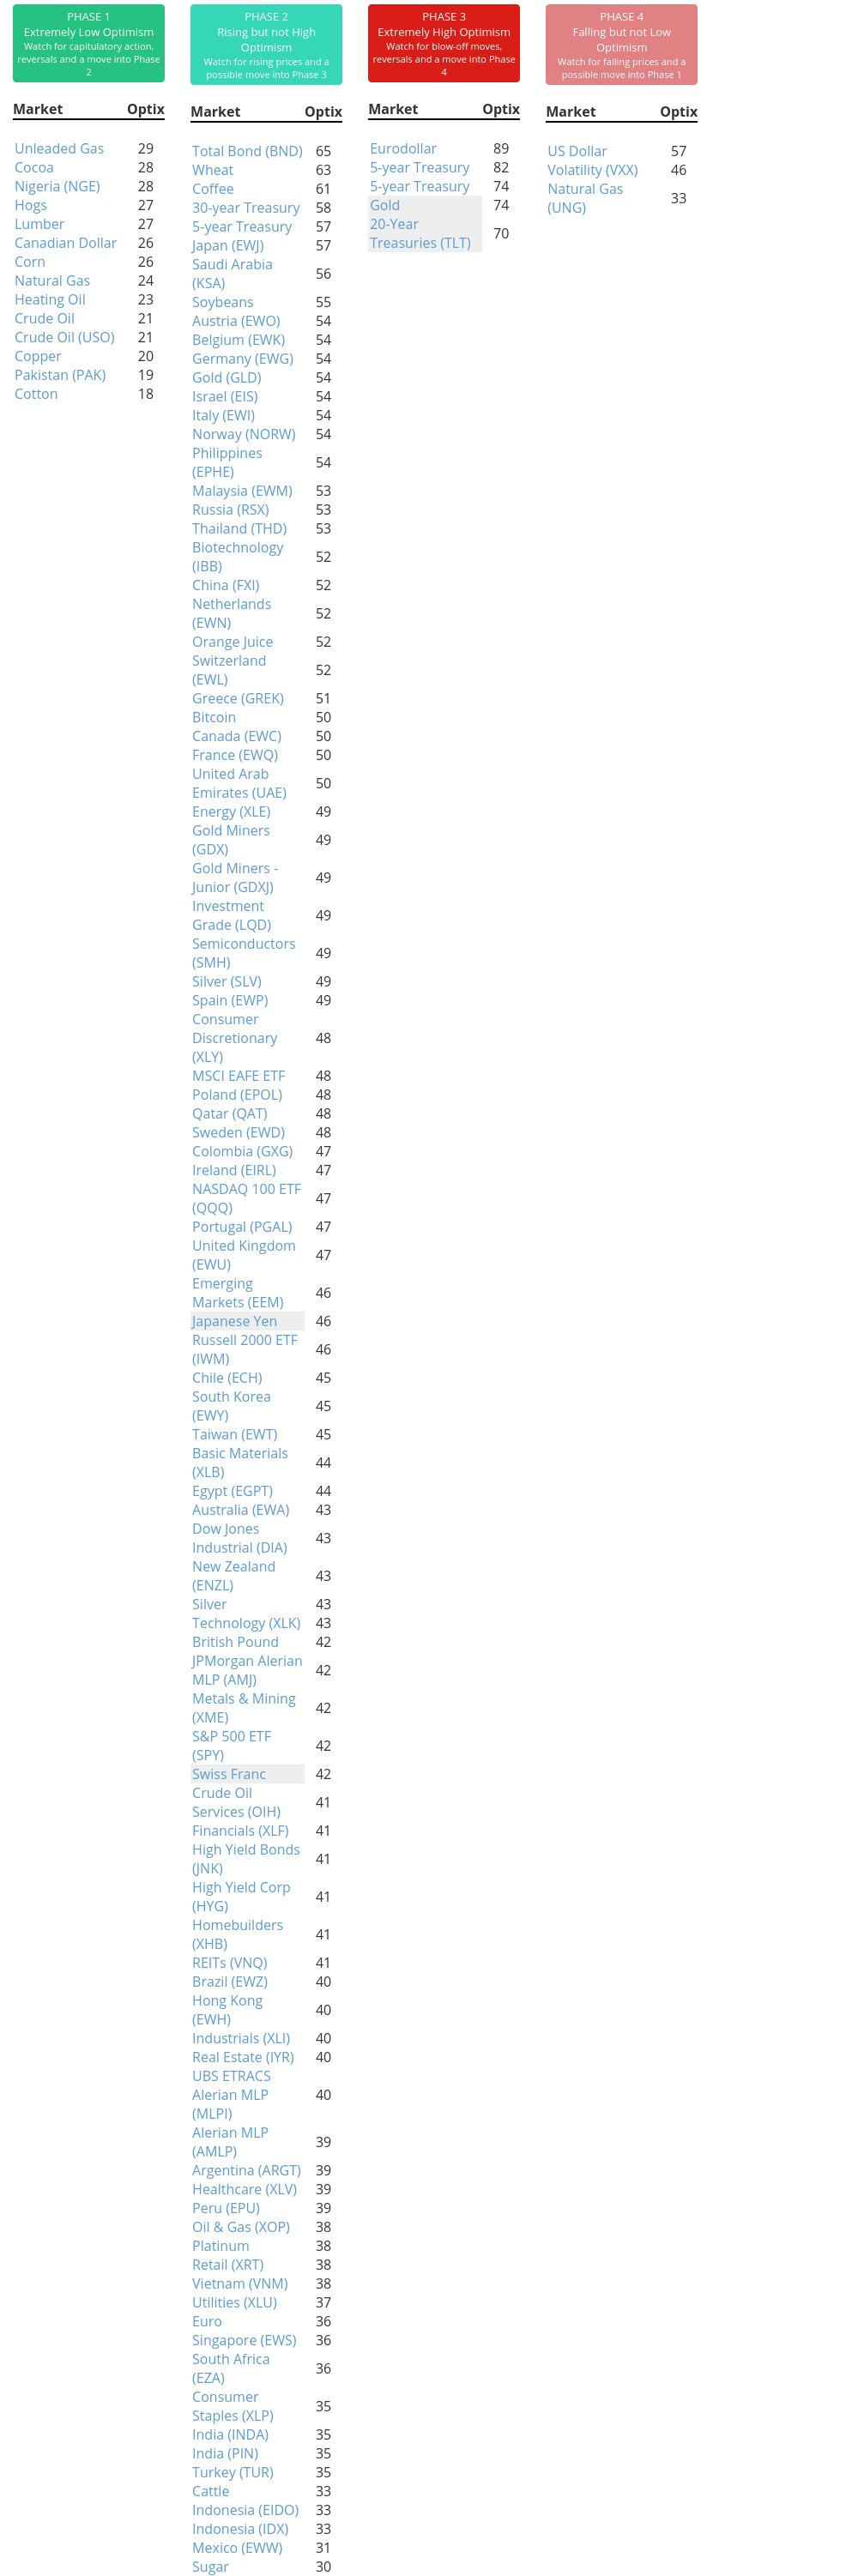
Phase Table
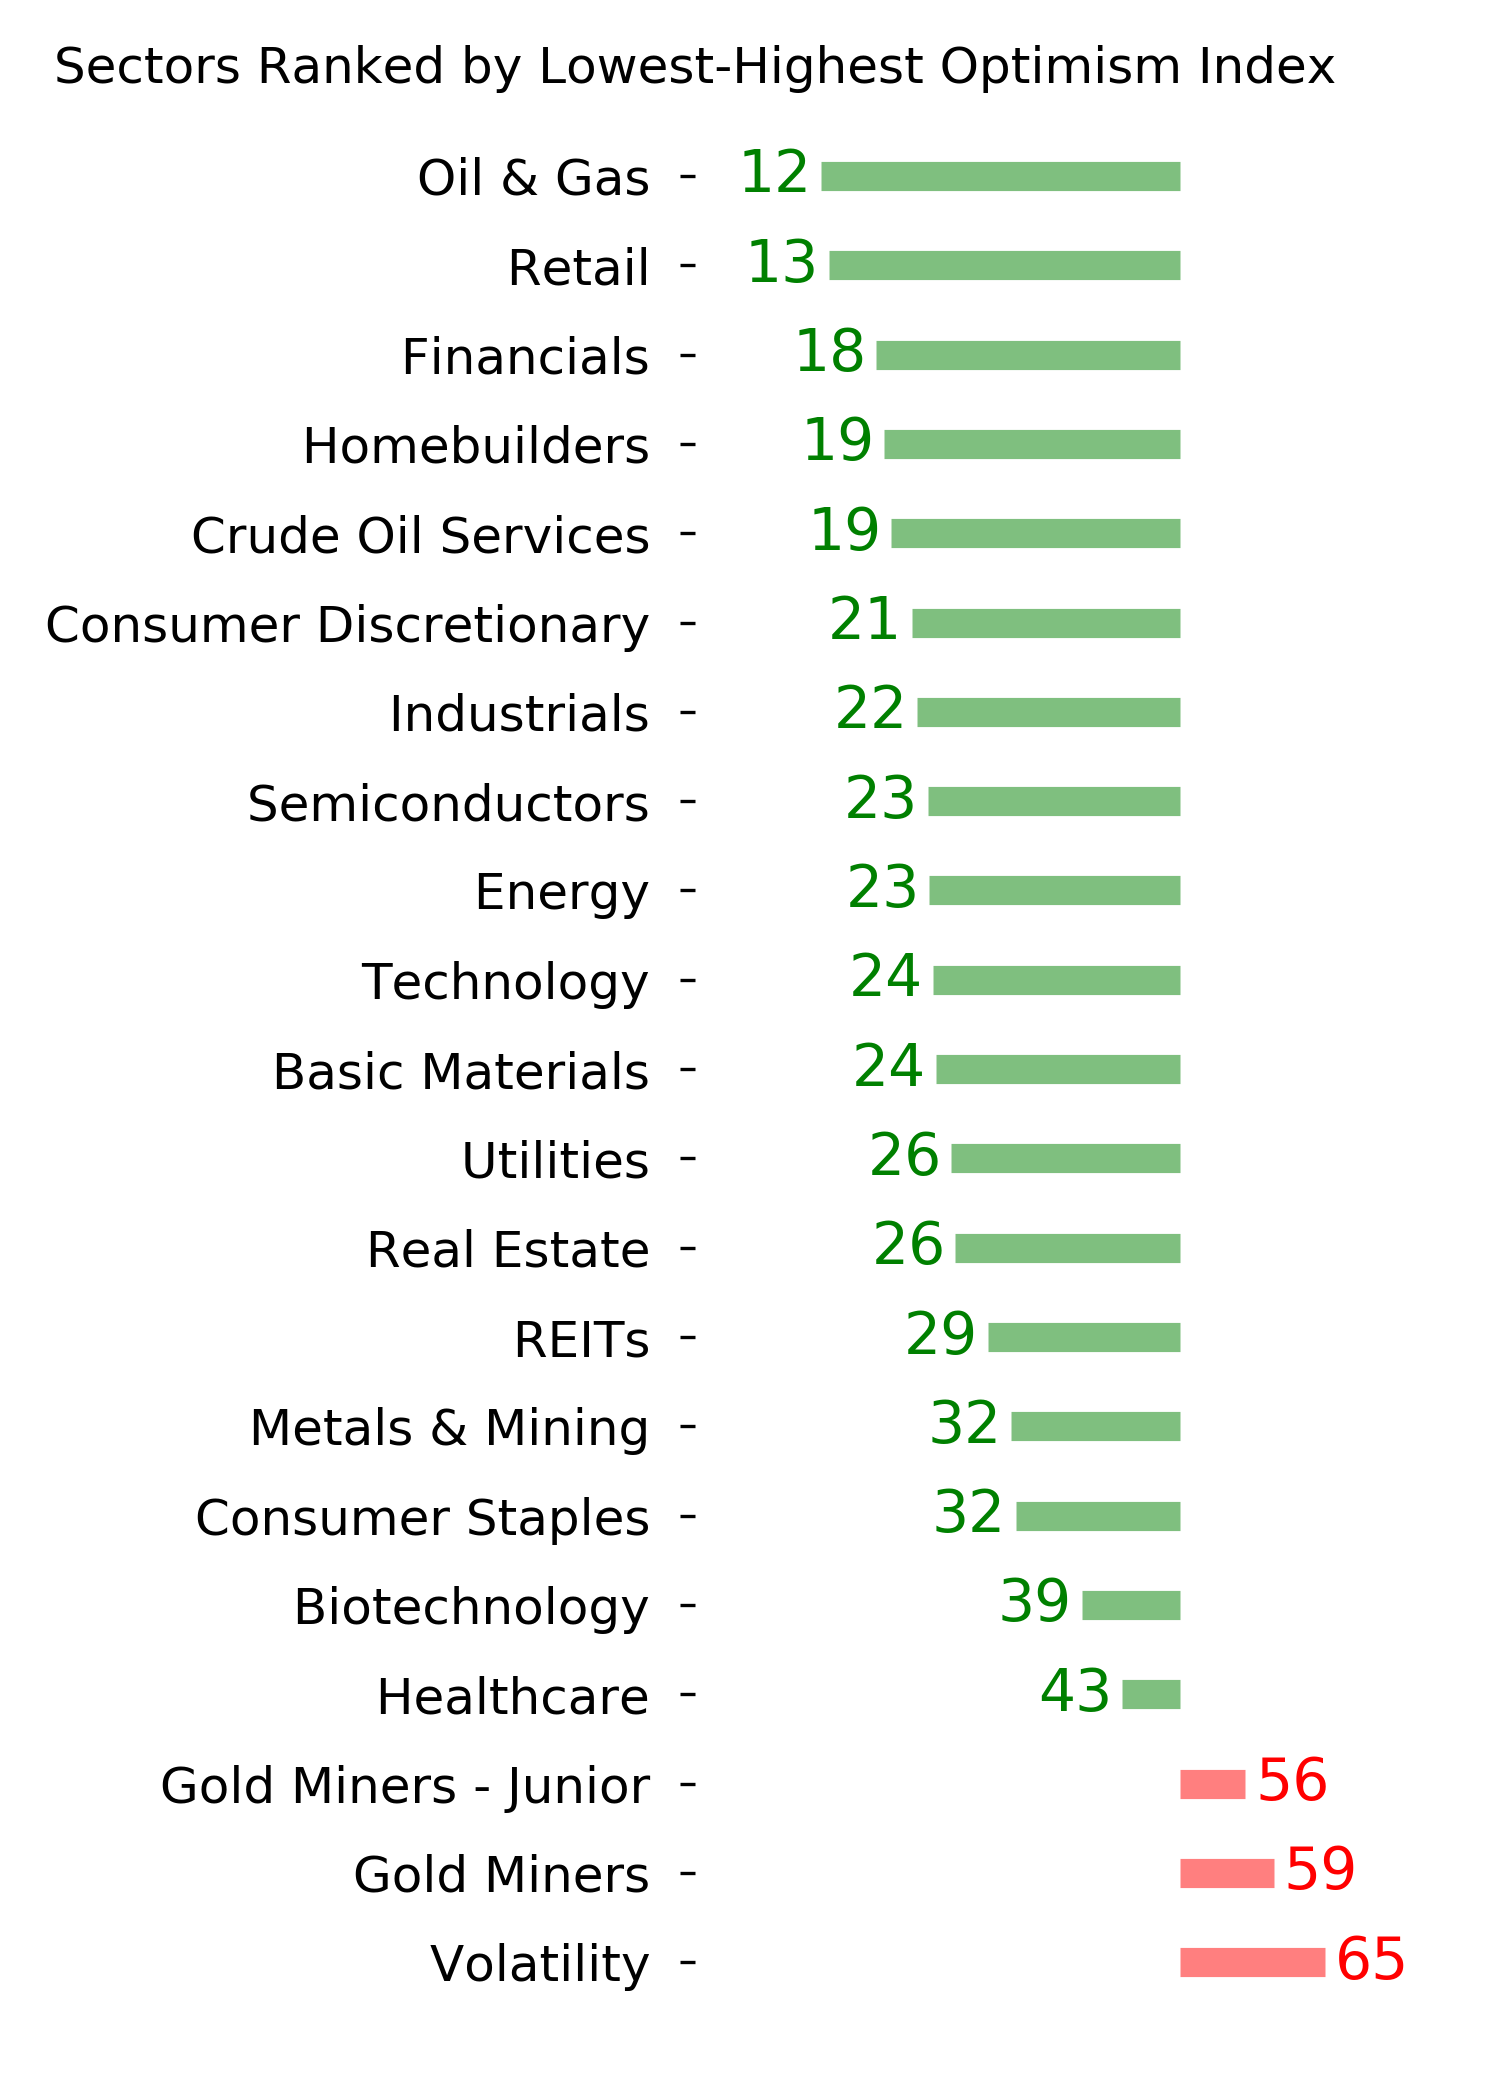
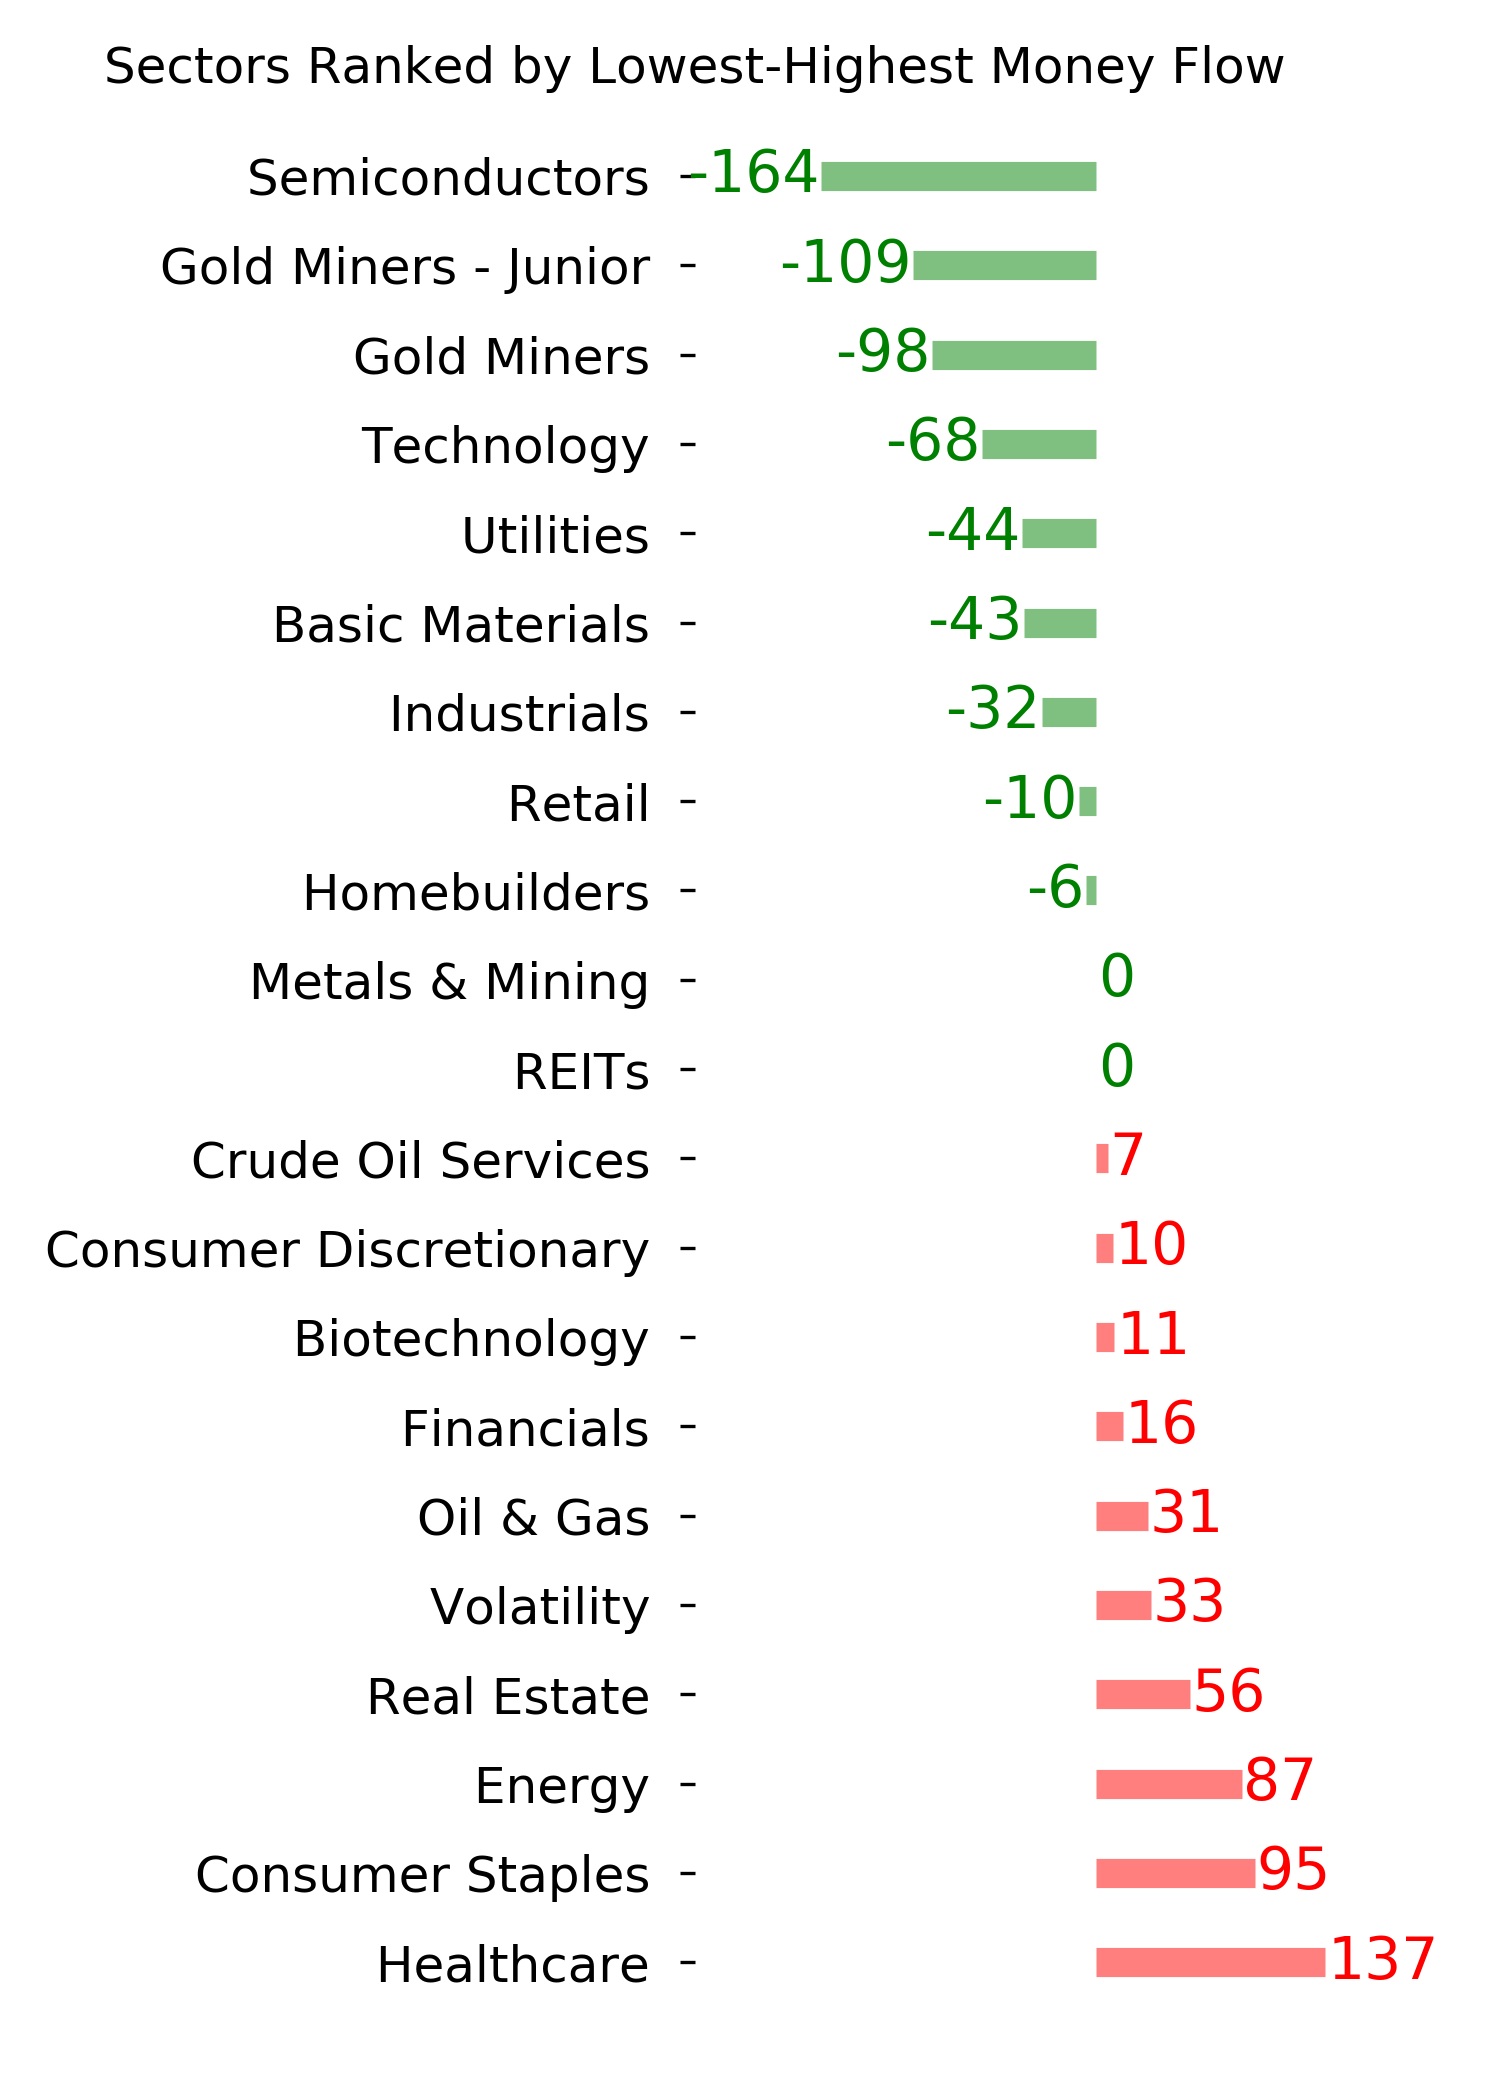
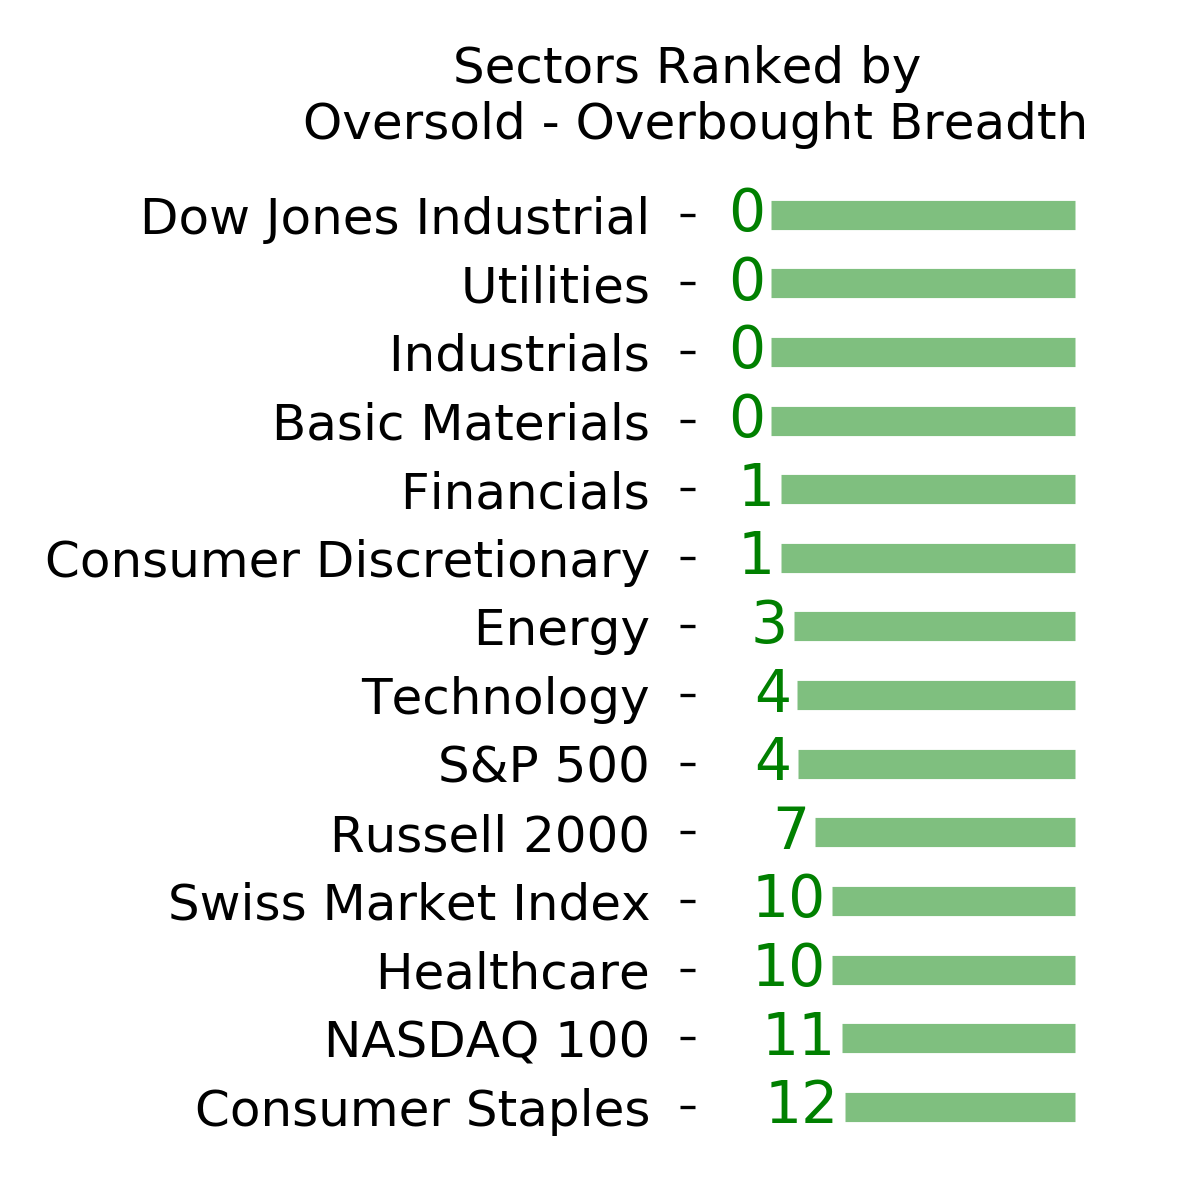
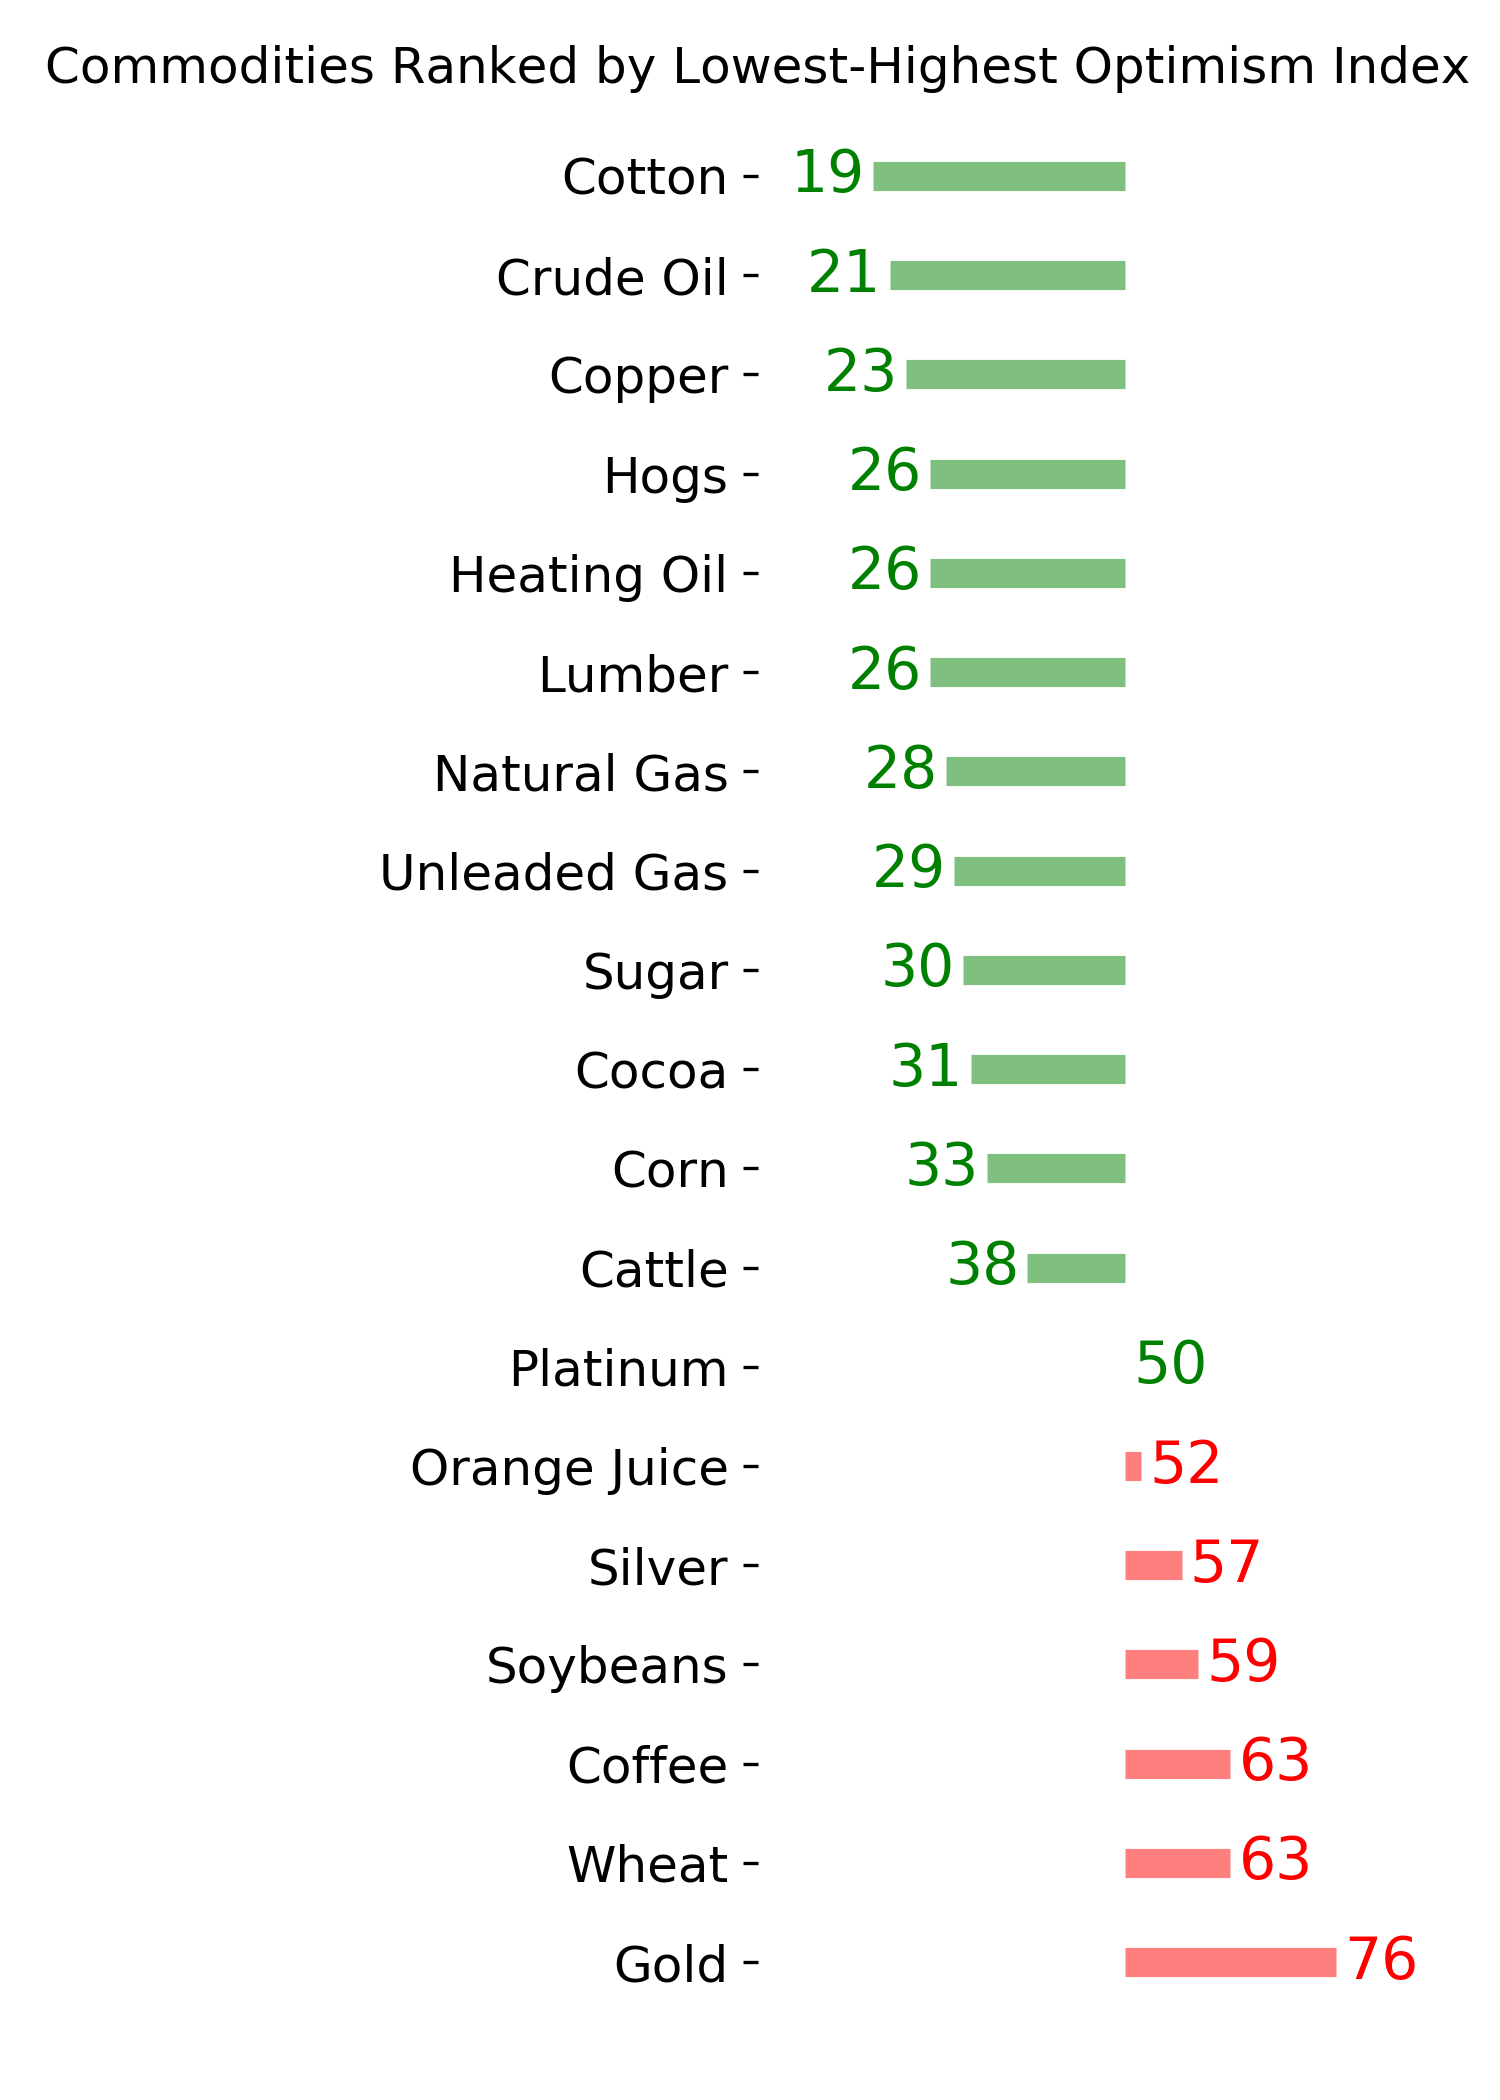
Ranks
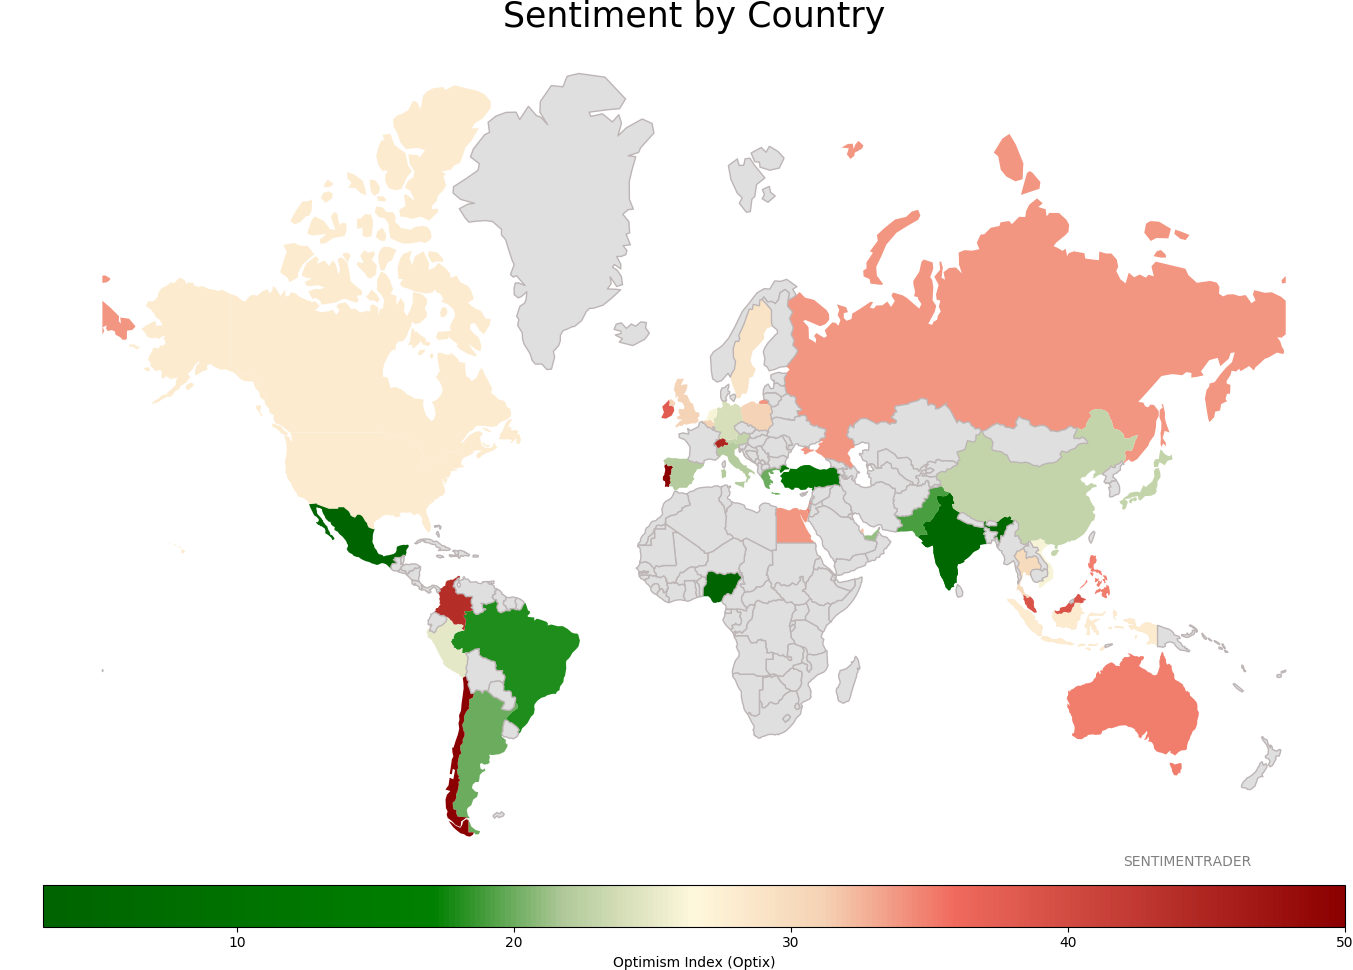
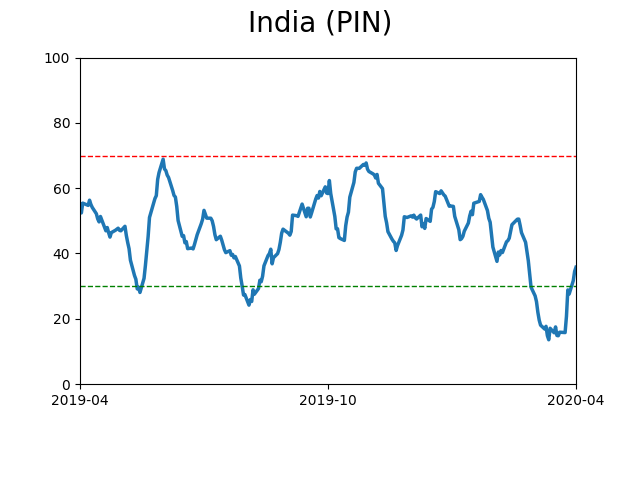
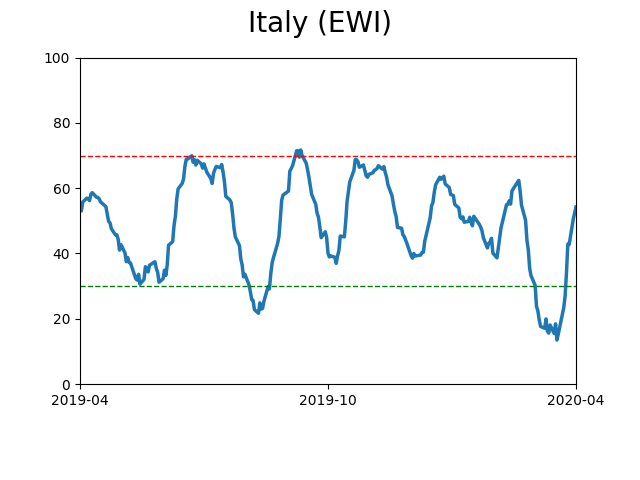
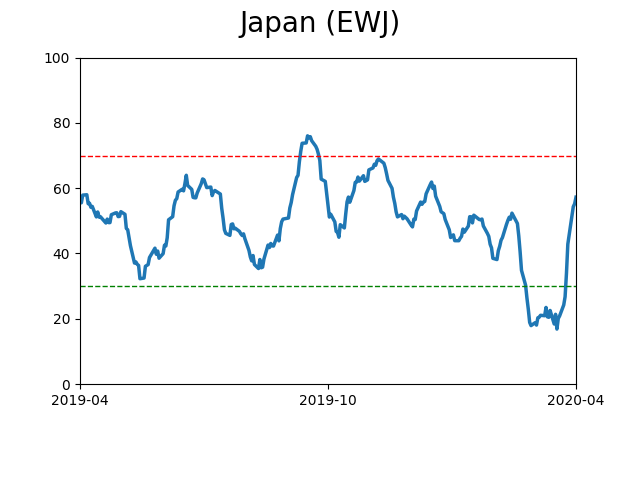
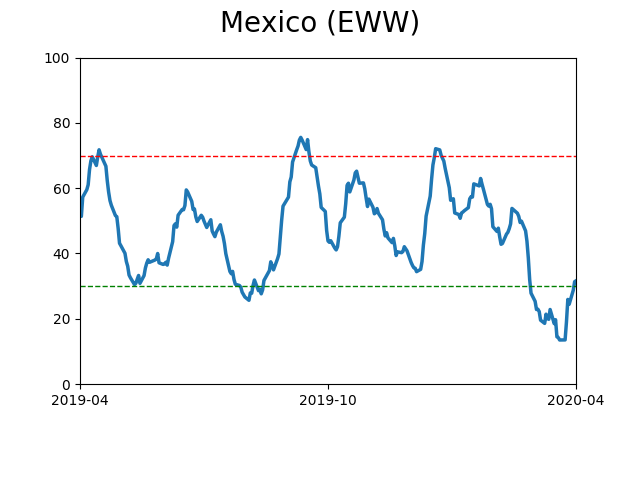
Sentiment Around The World
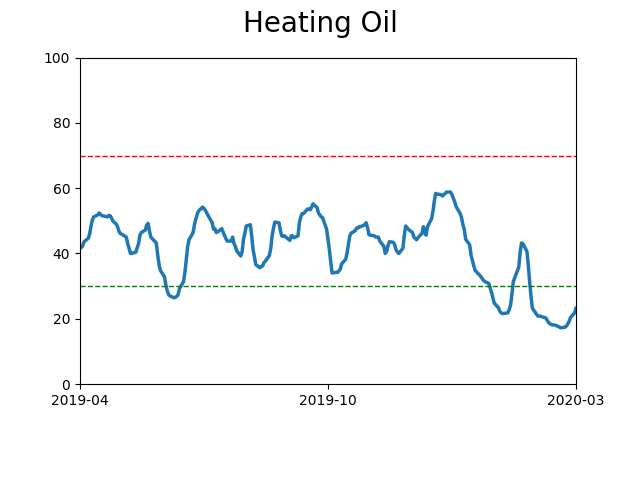
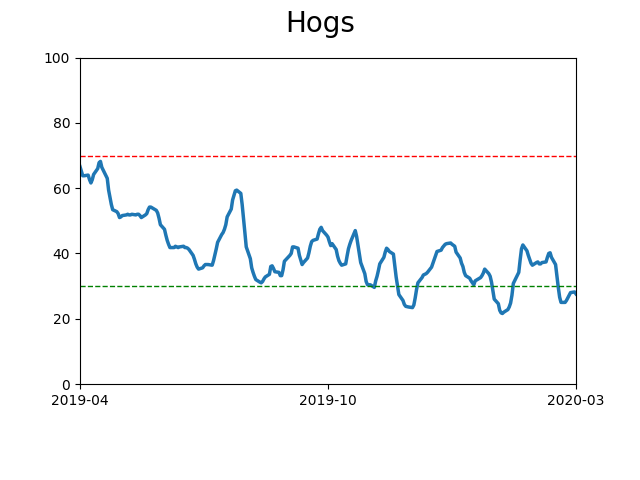
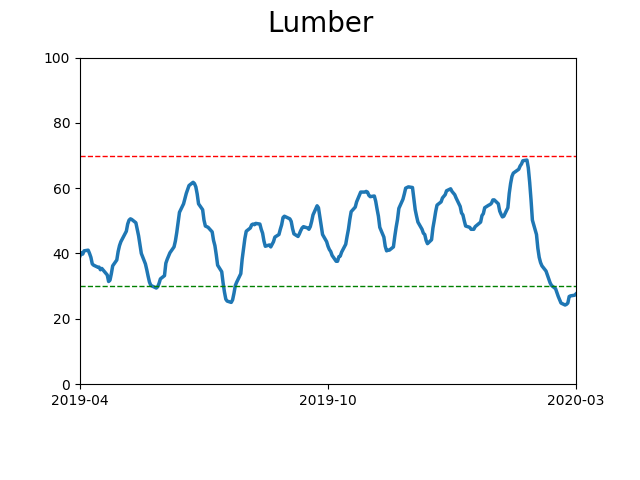
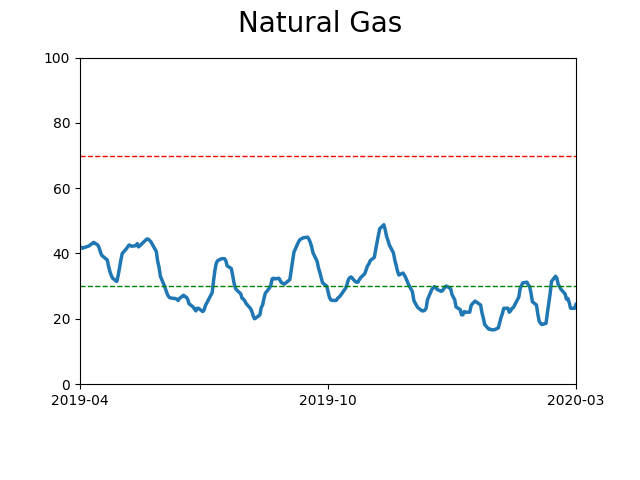
Optimism Index Thumbnails
|
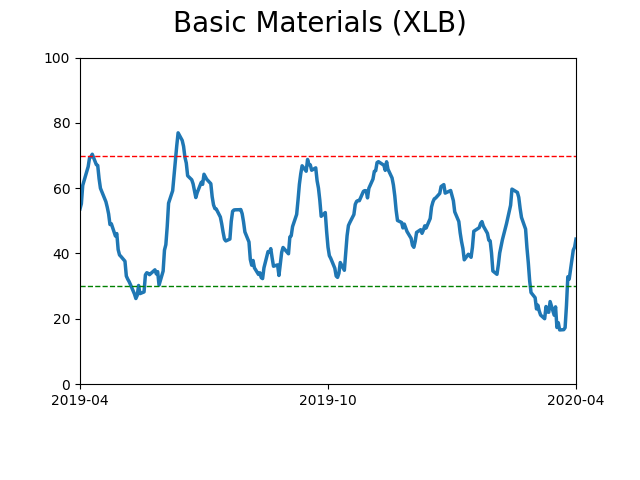
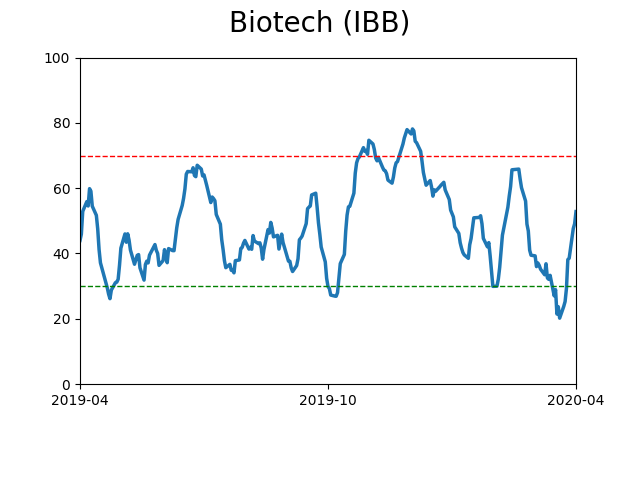
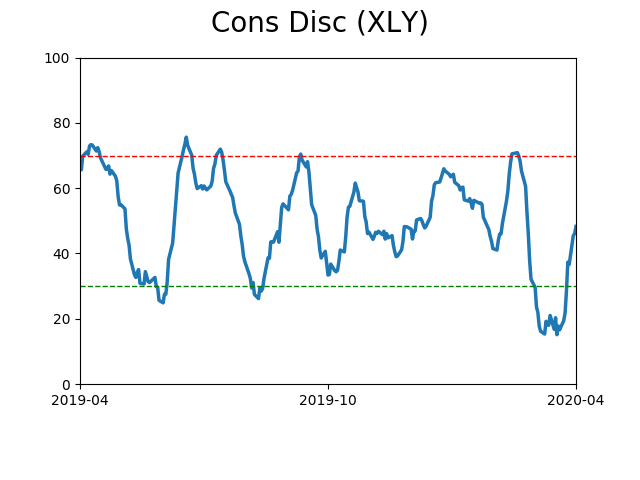
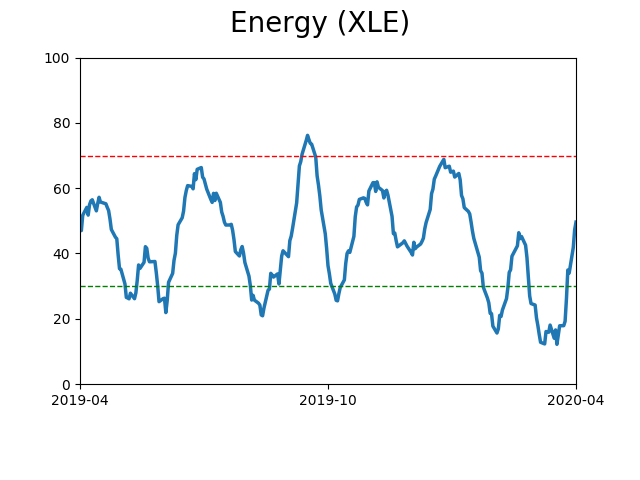
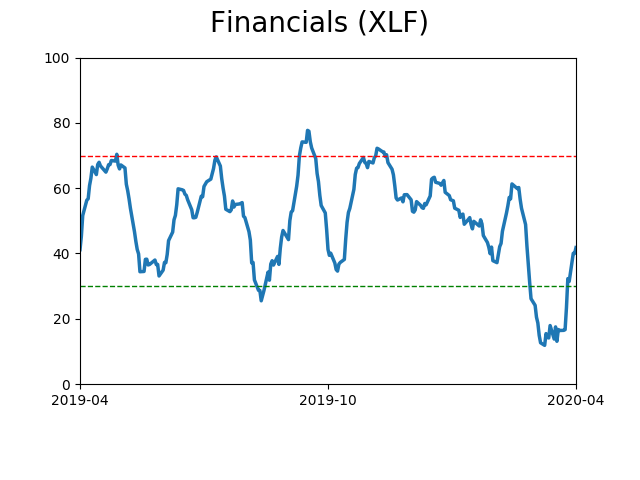
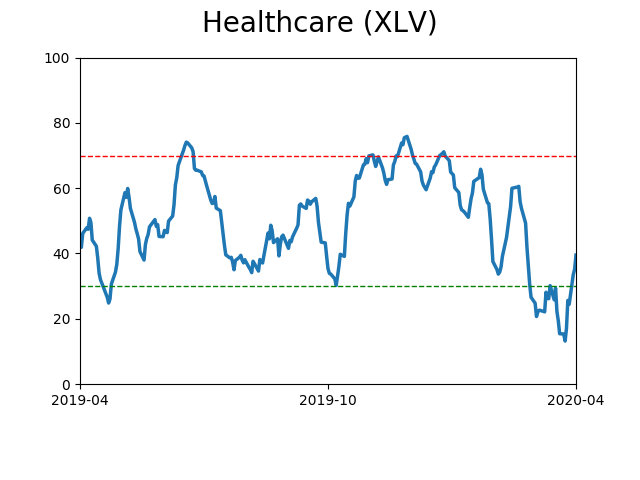
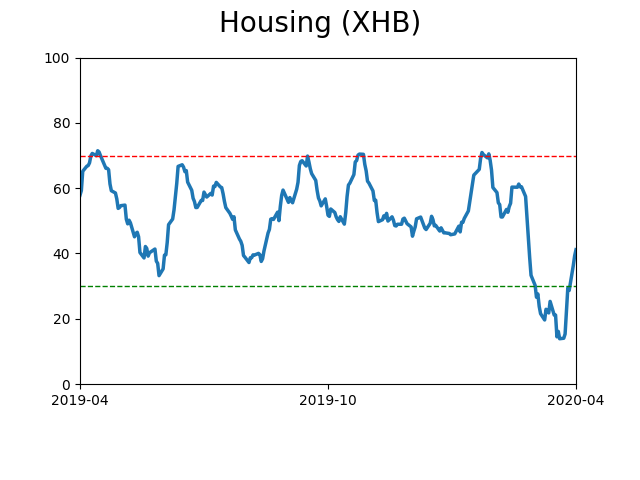
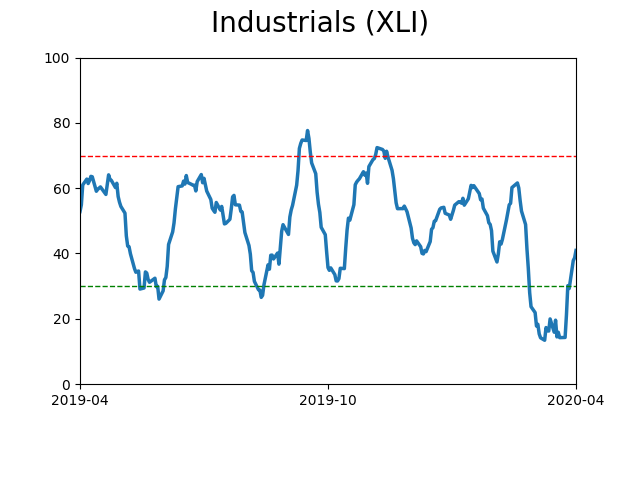
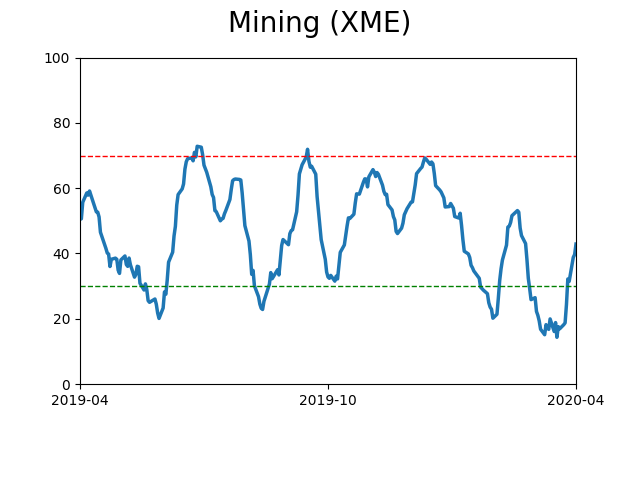
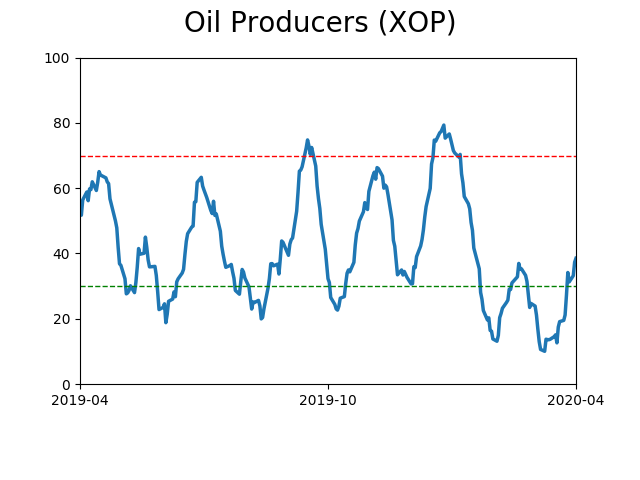
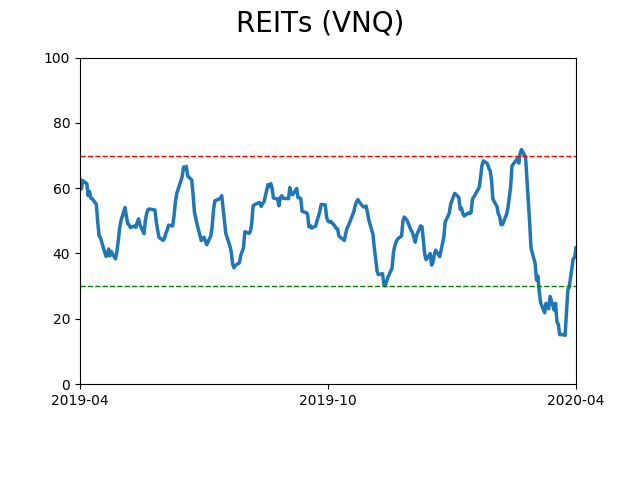
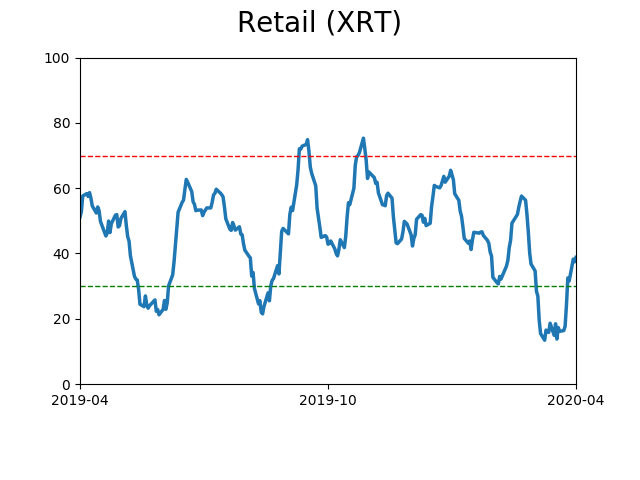
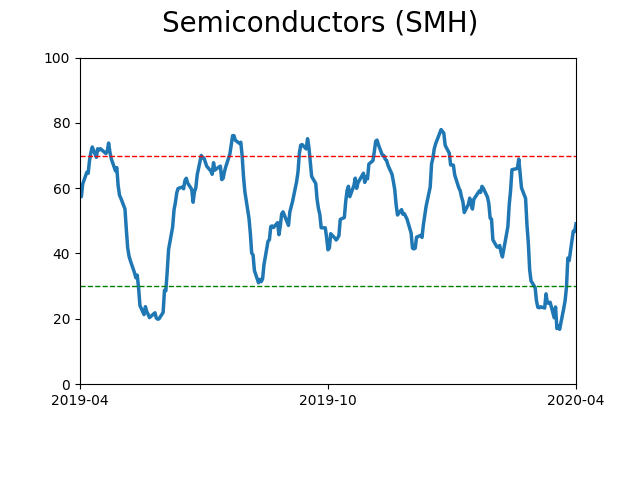
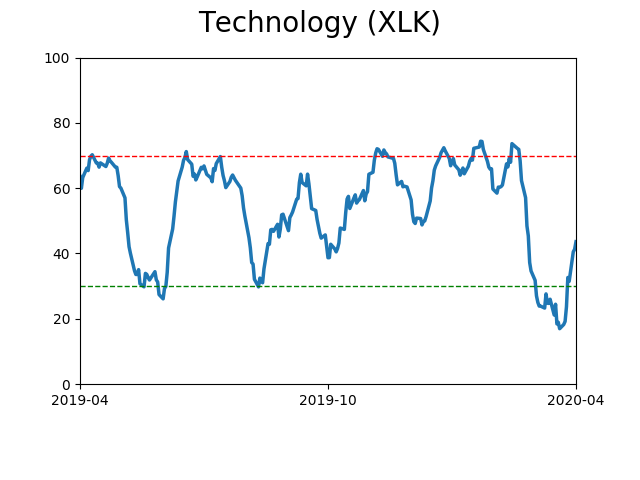
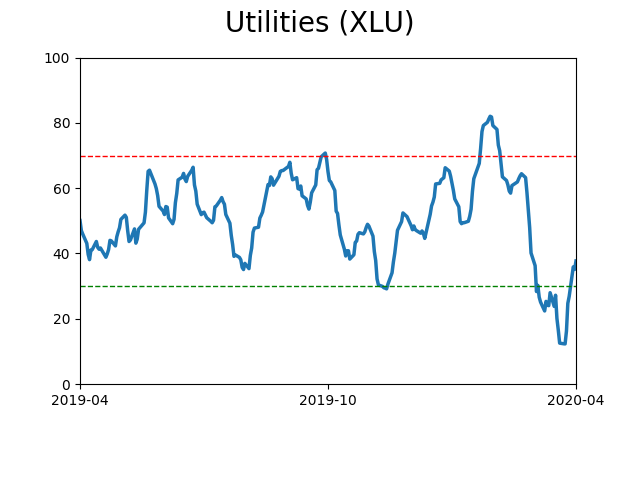
Sector ETF's - 10-Day Moving Average
|
|
|
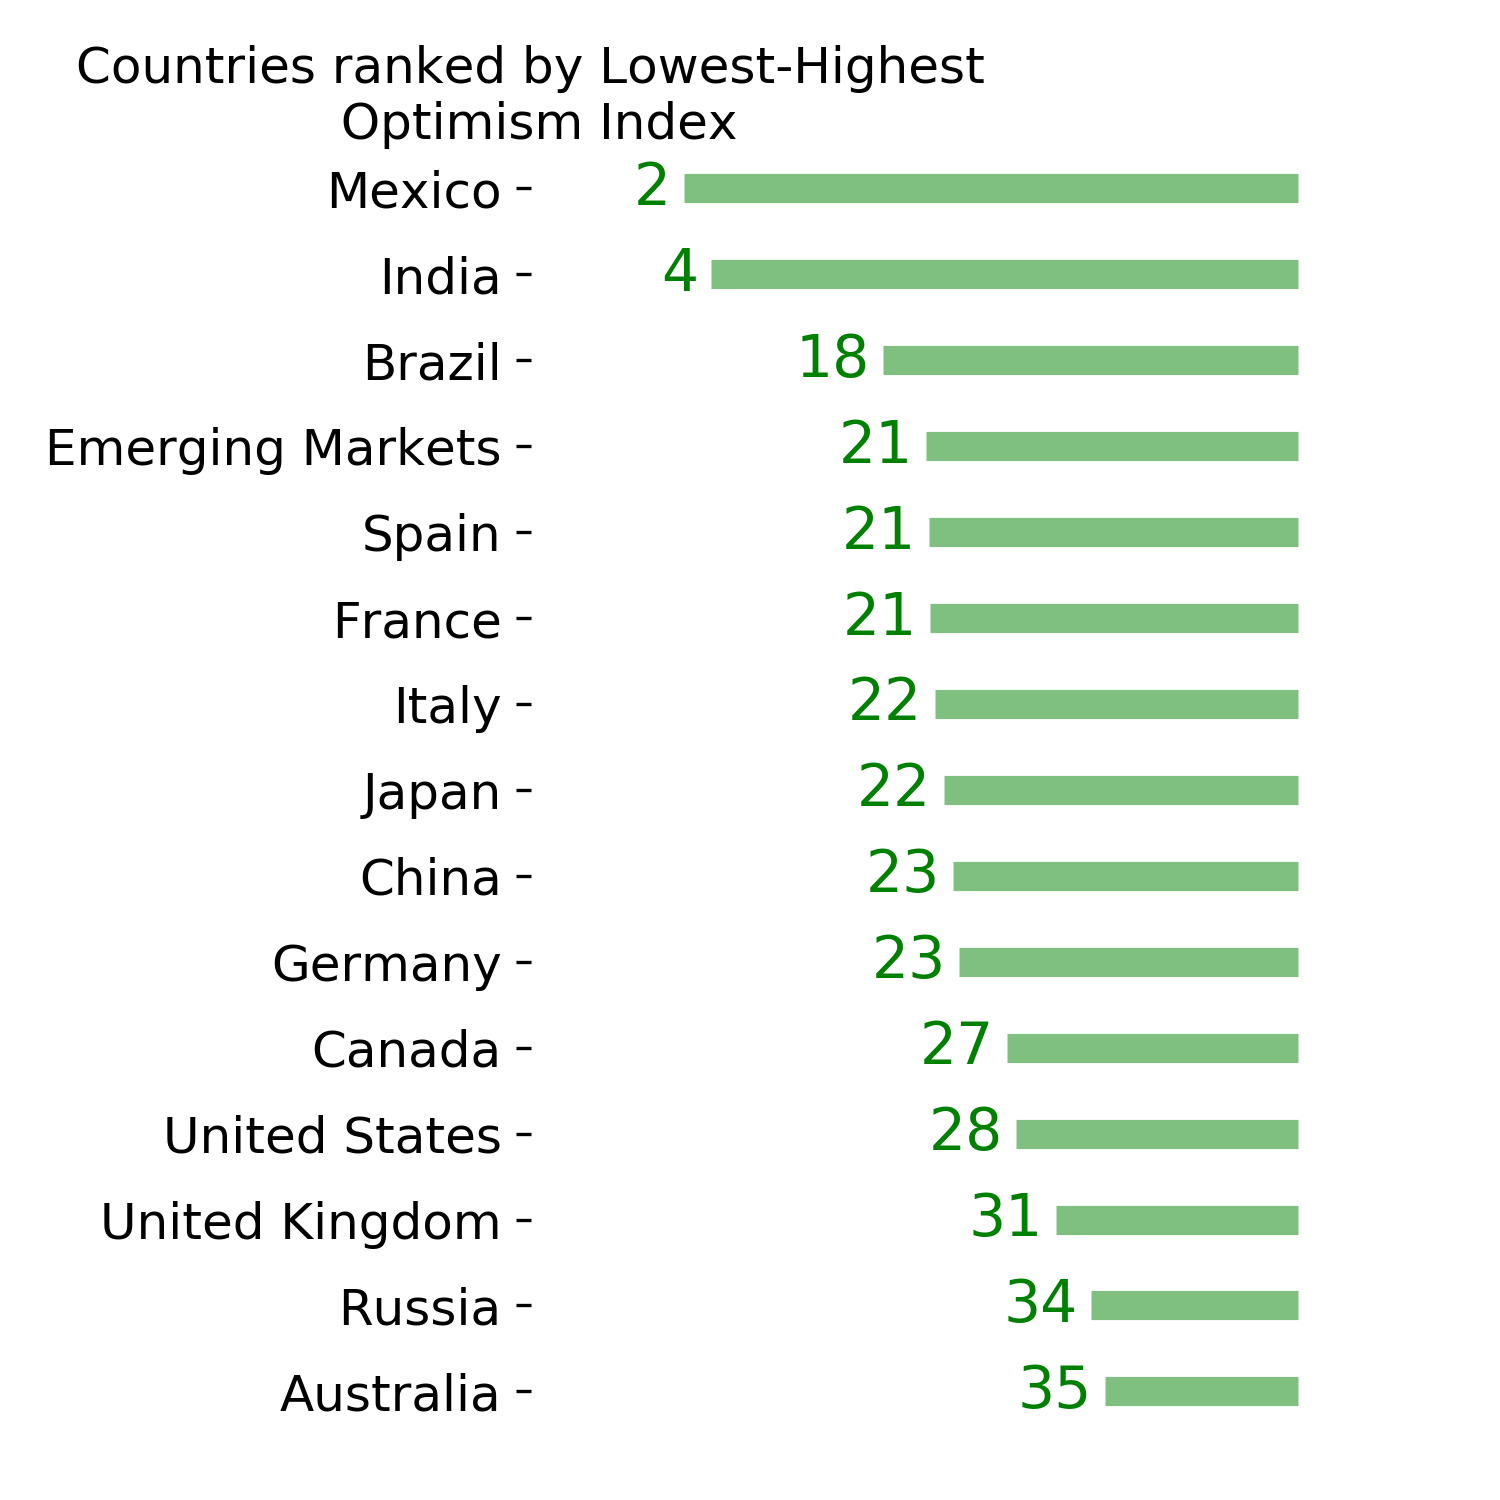
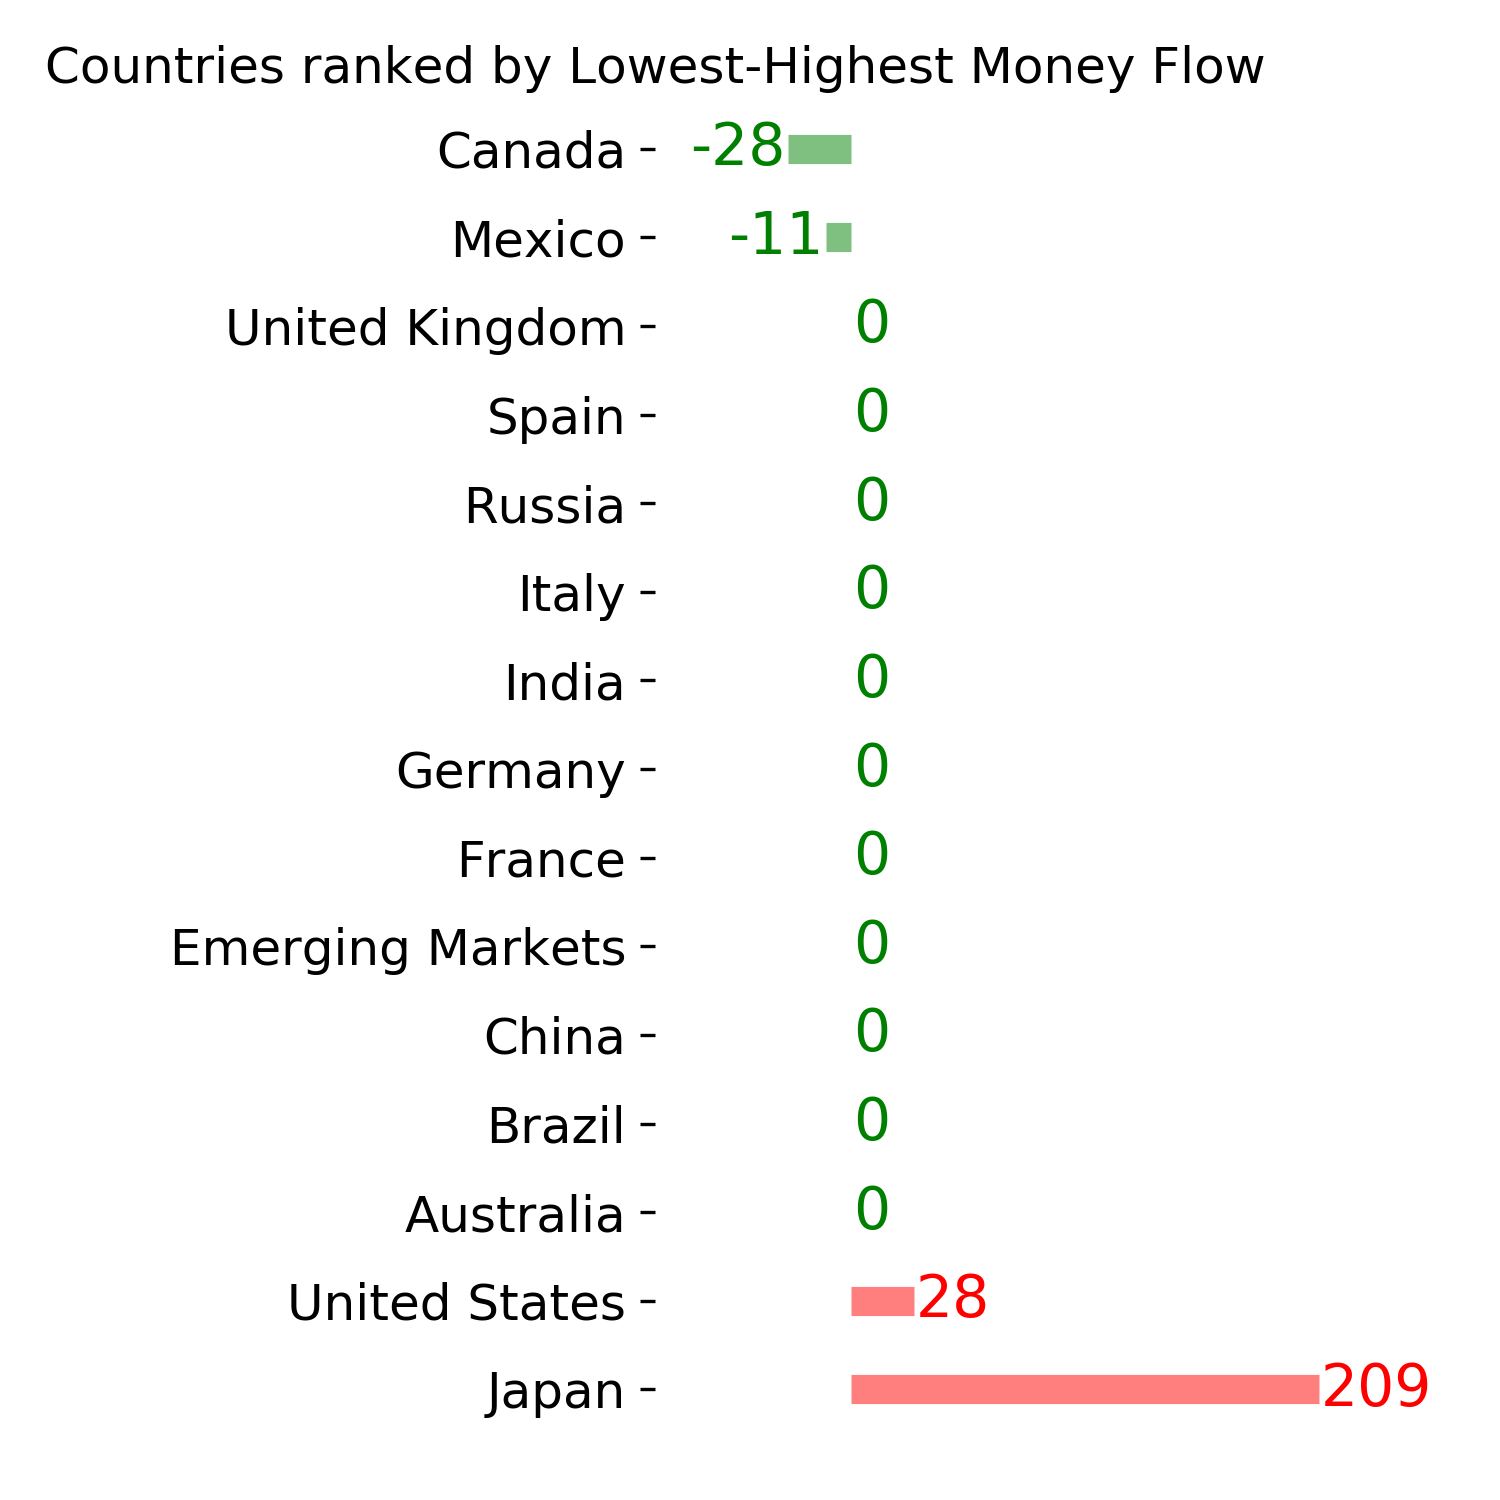
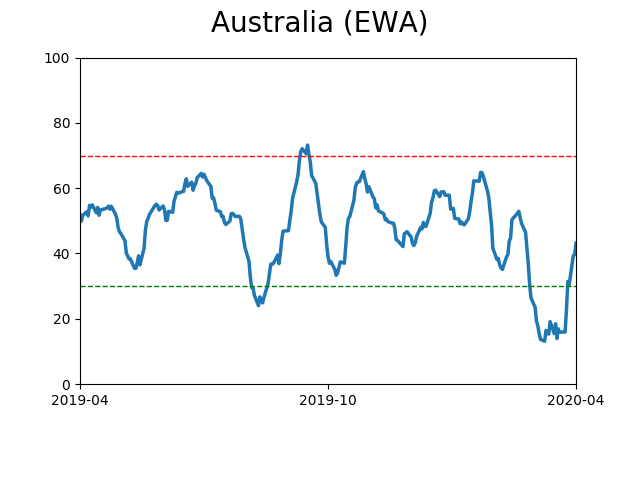
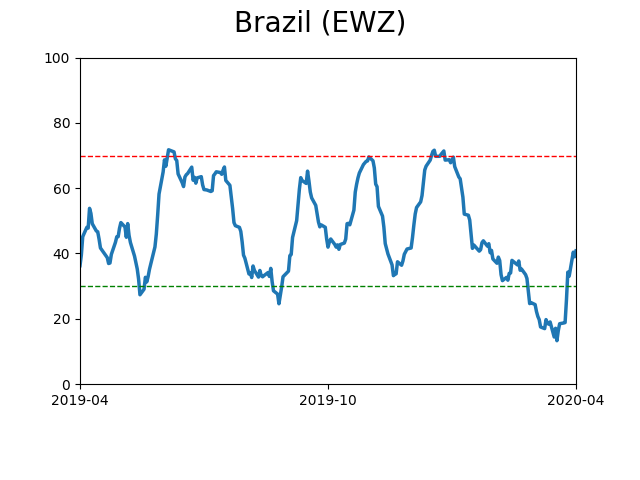
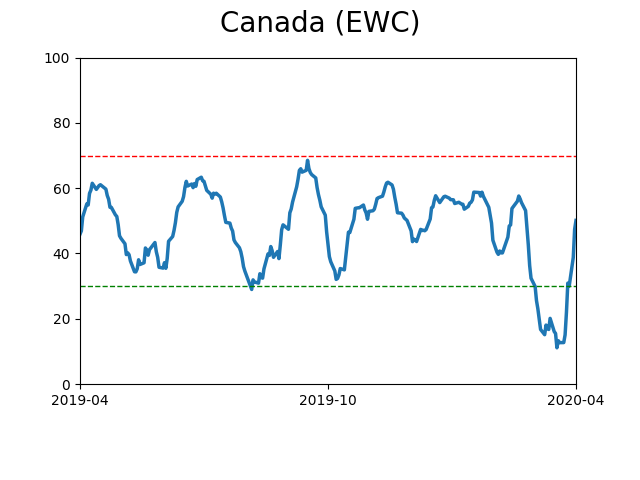
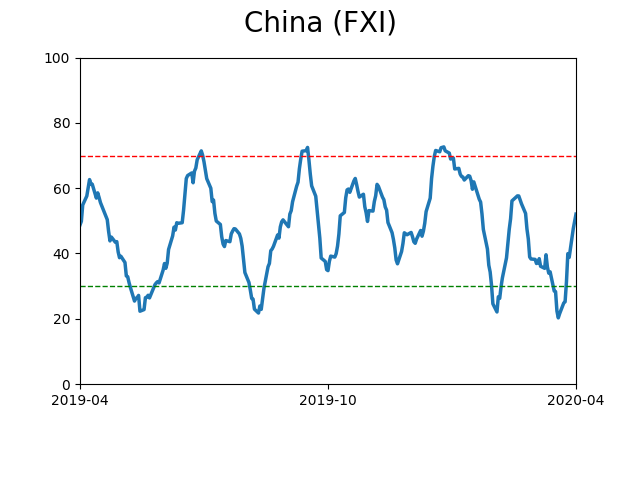
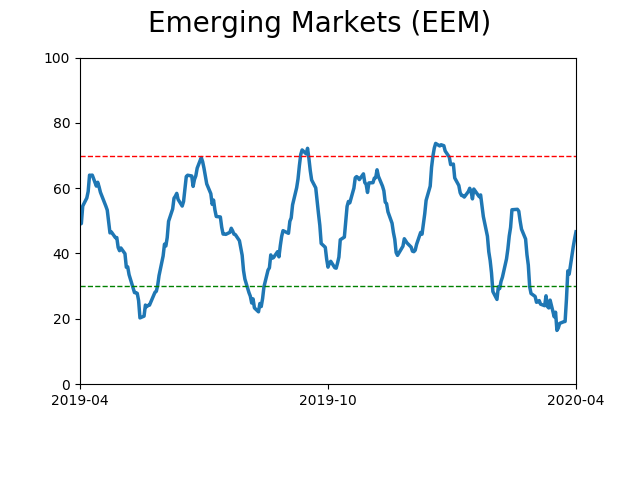
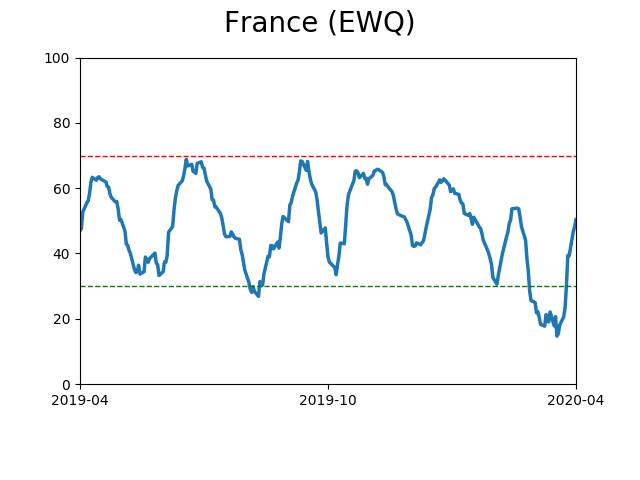
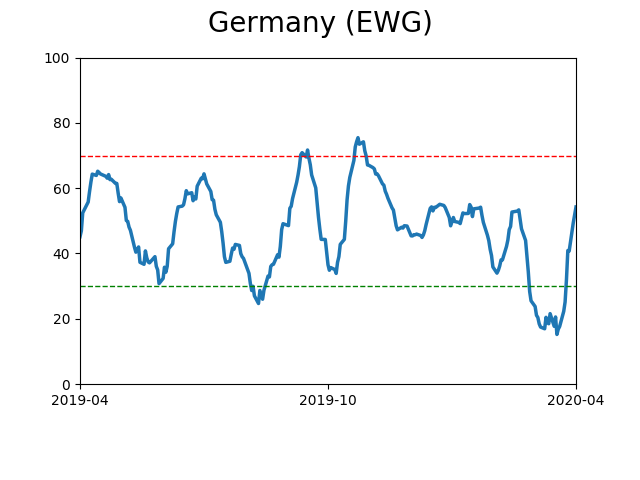
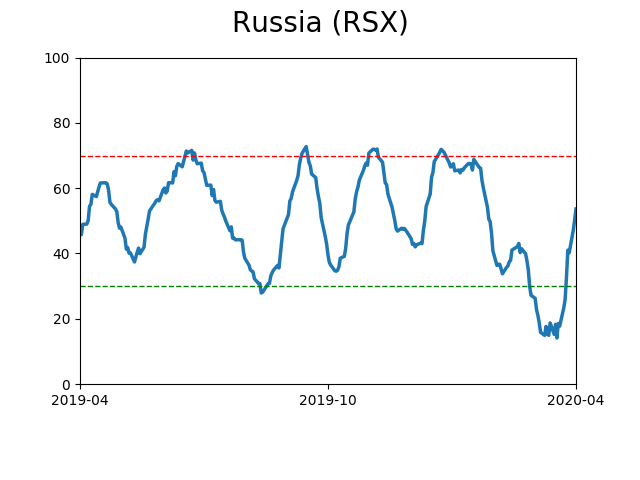
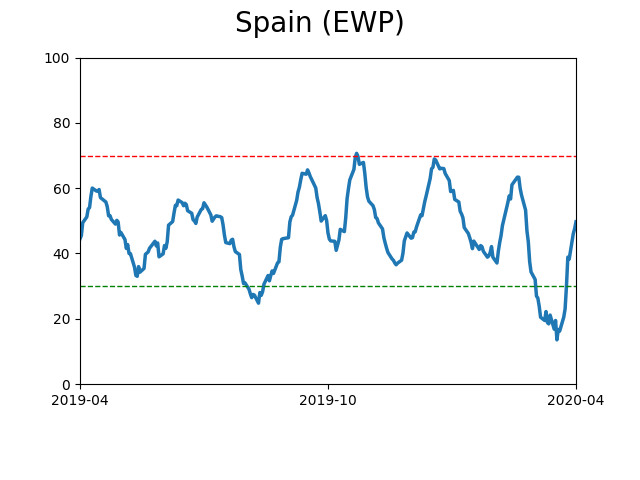
Country ETF's - 10-Day Moving Average
|
|
|
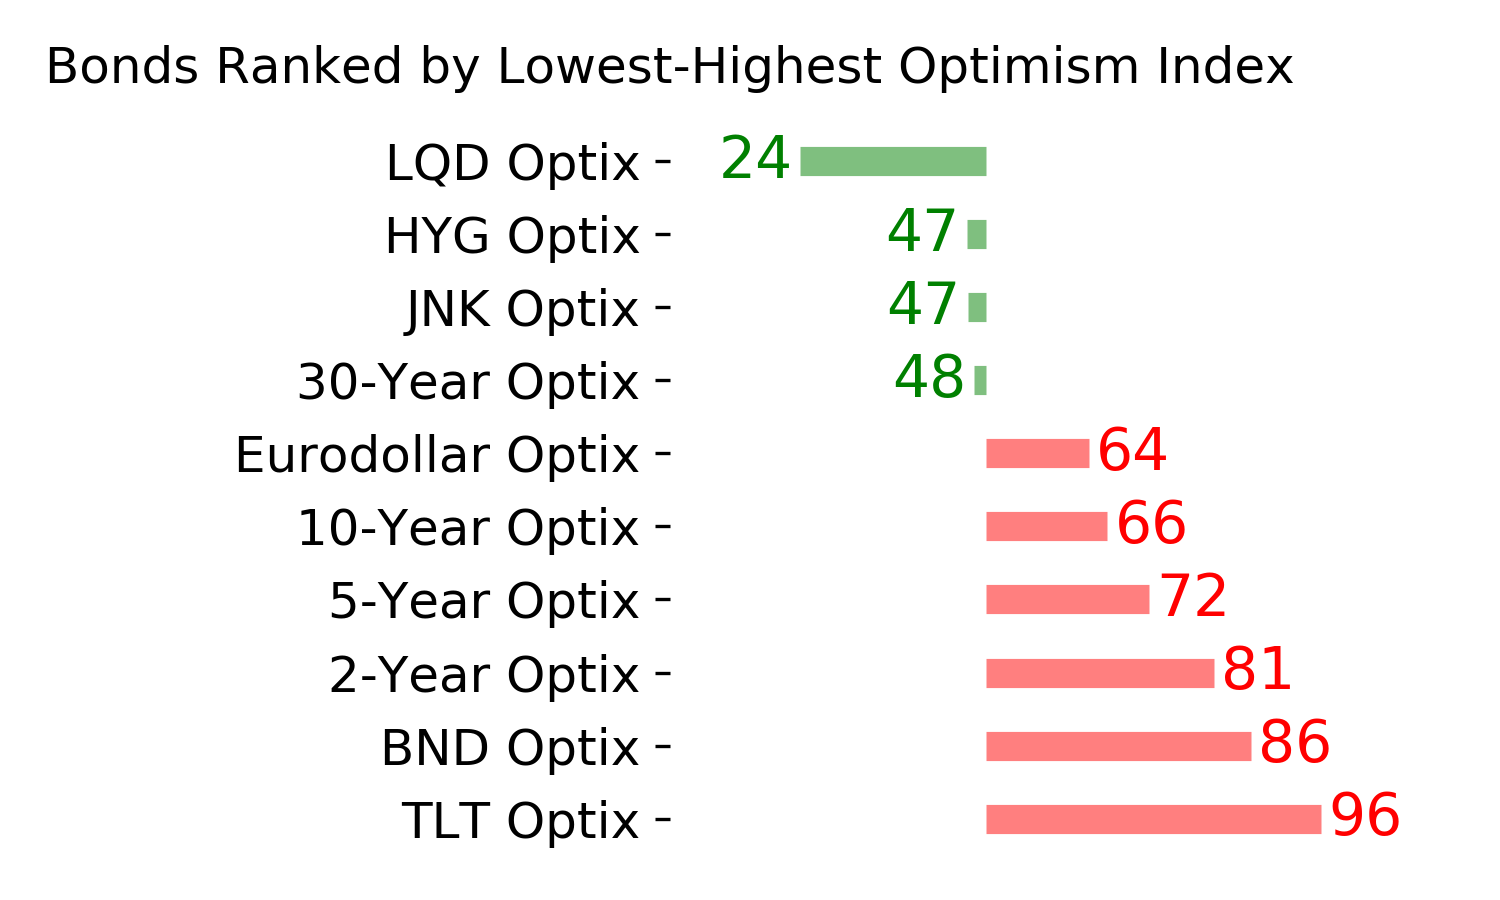
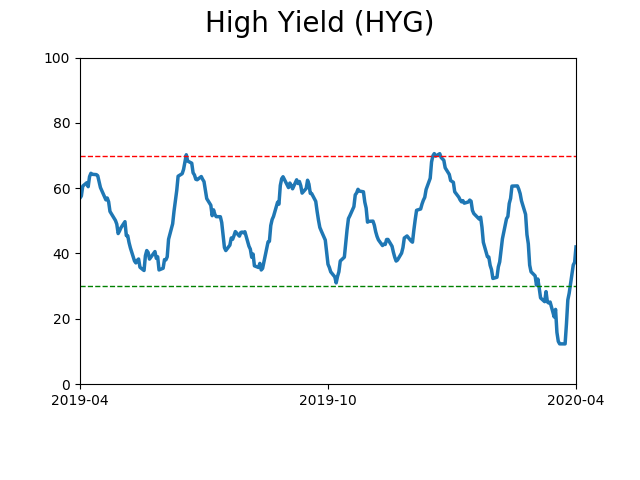
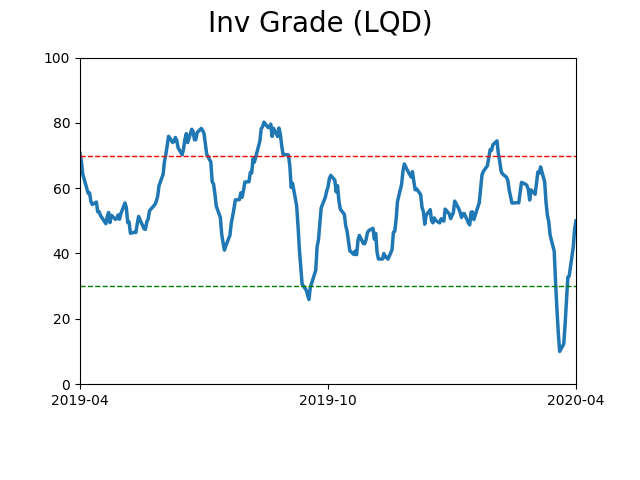
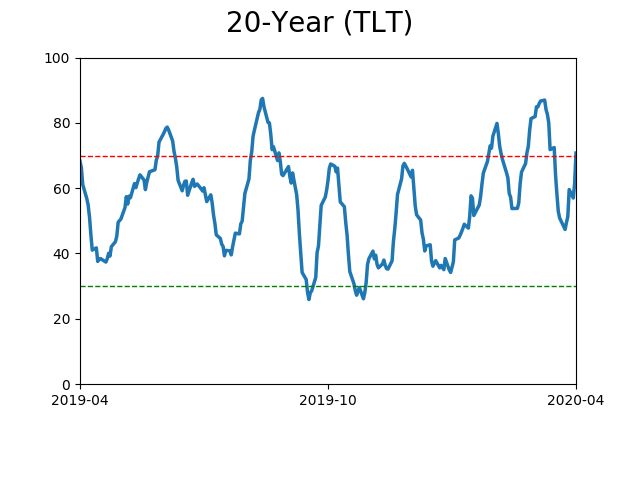
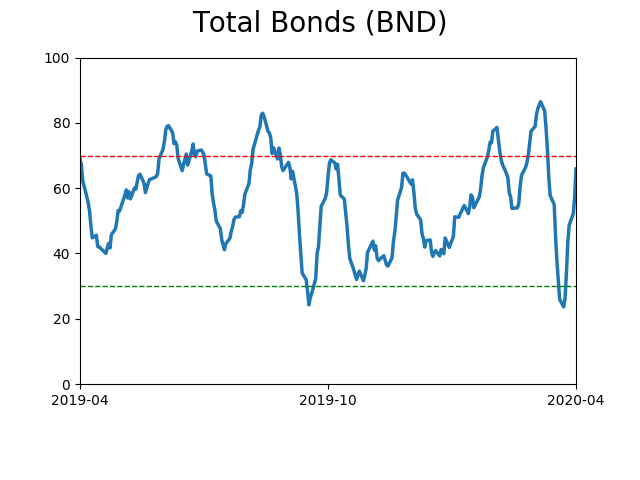
Bond ETF's - 10-Day Moving Average
|
|
|
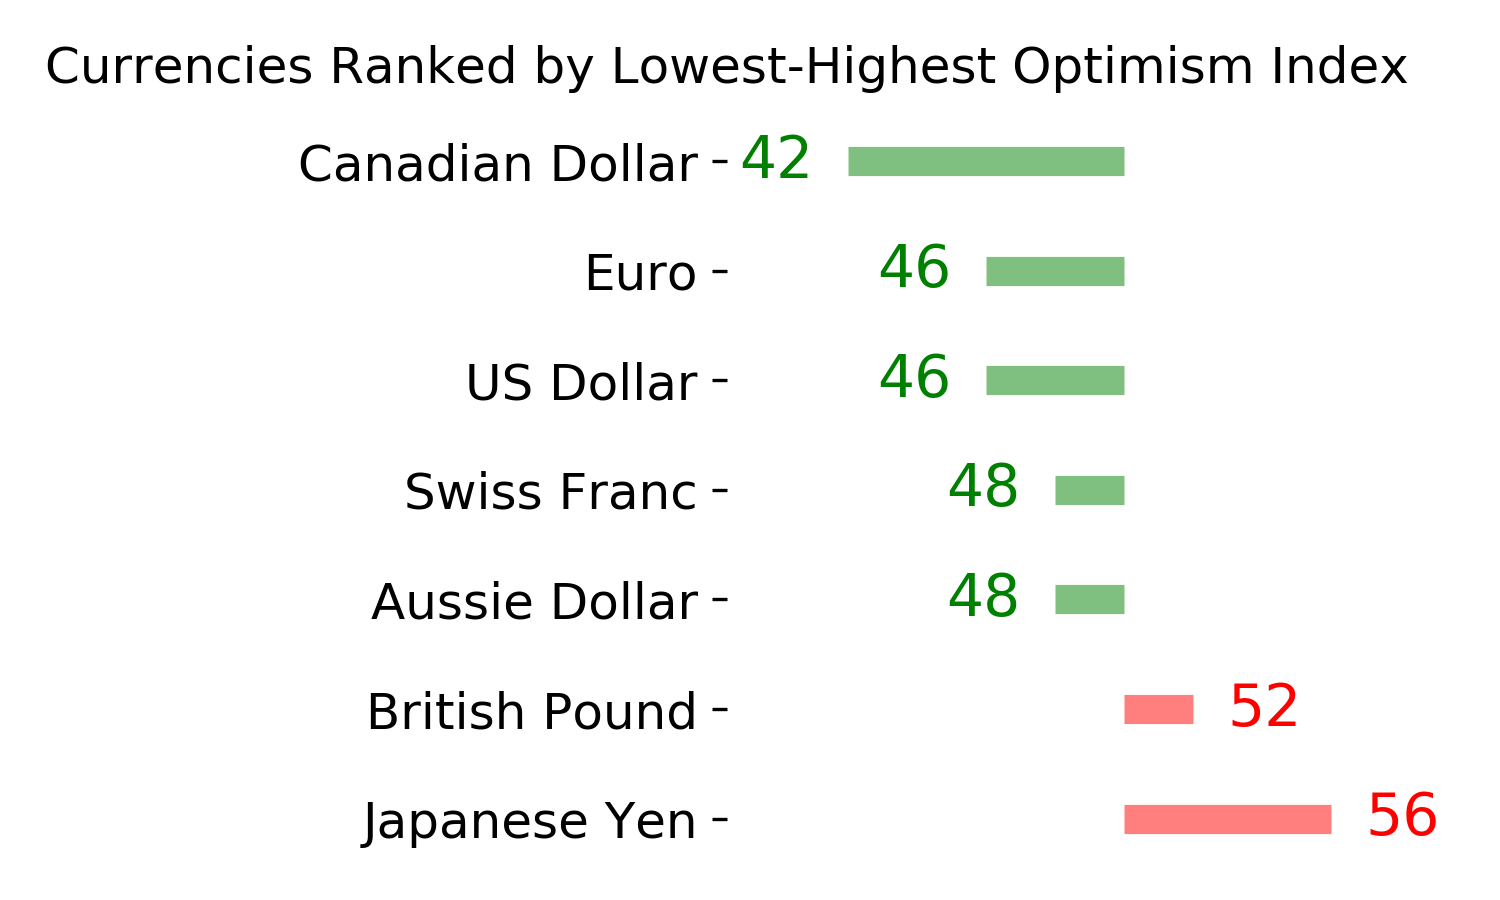
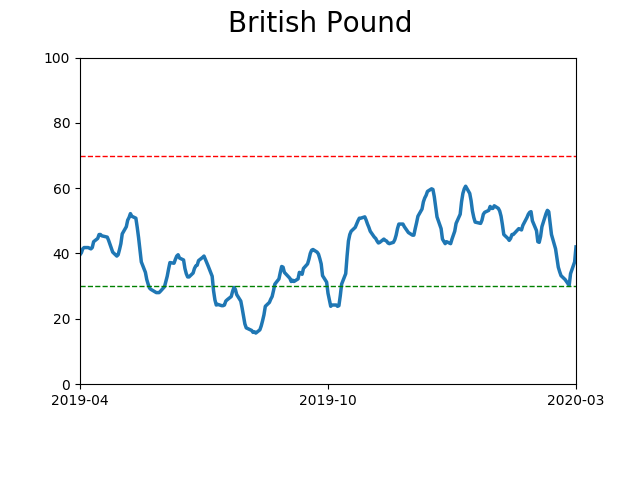
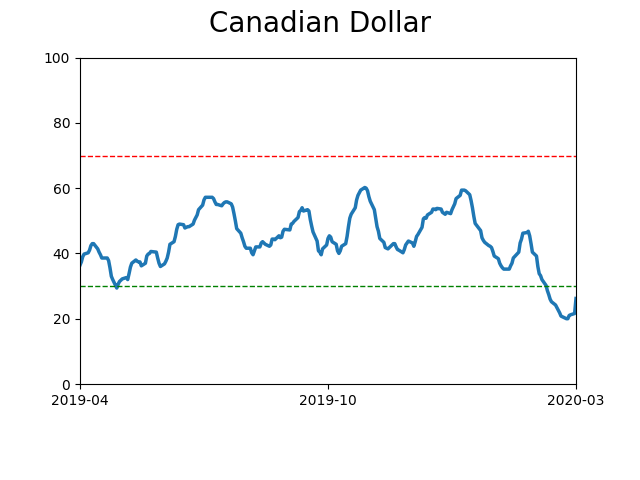
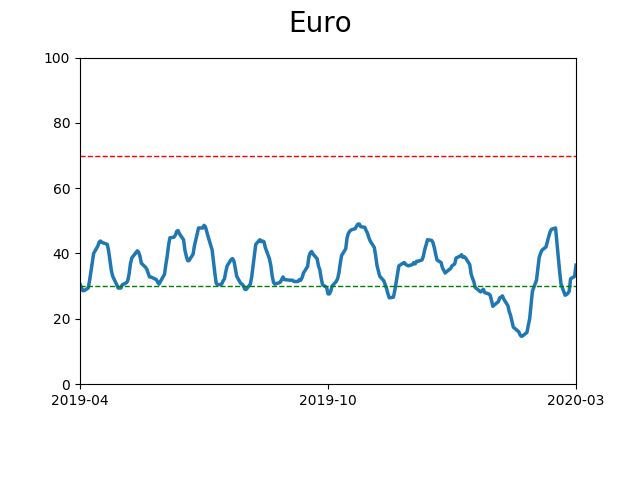
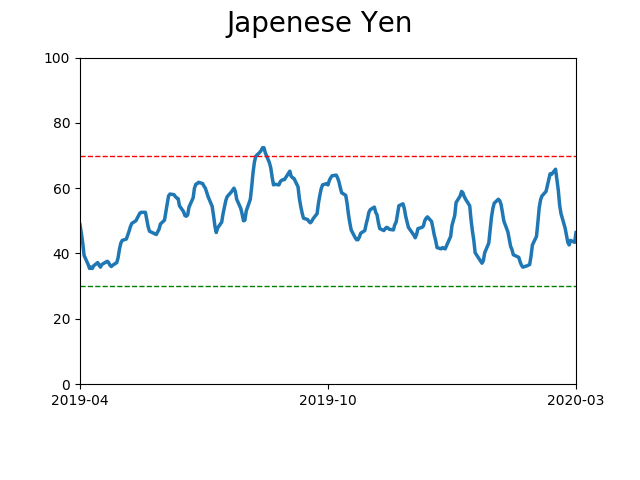
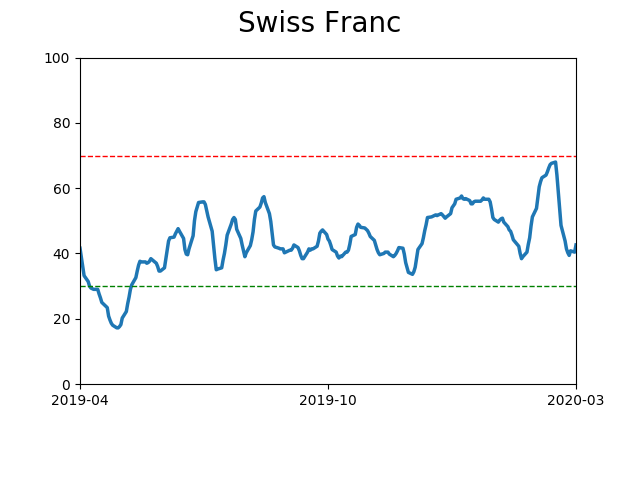
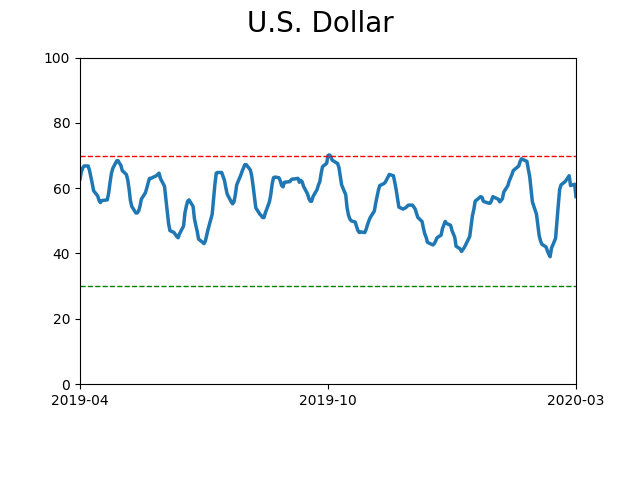
Currency ETF's - 5-Day Moving Average
|
|
|
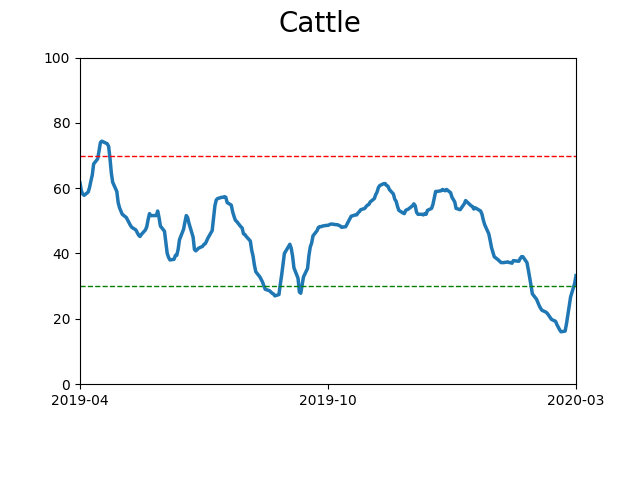
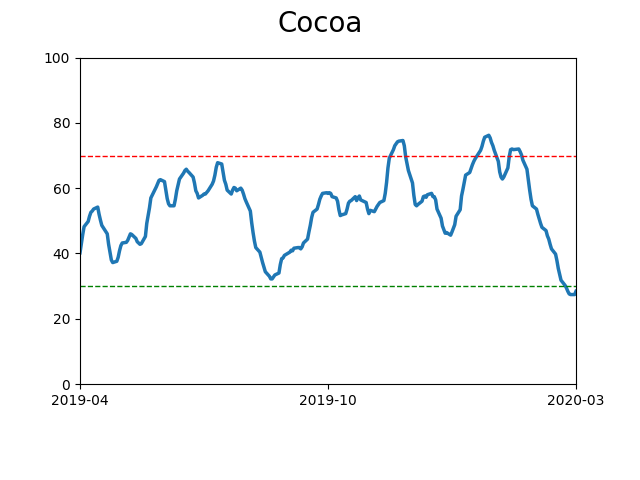
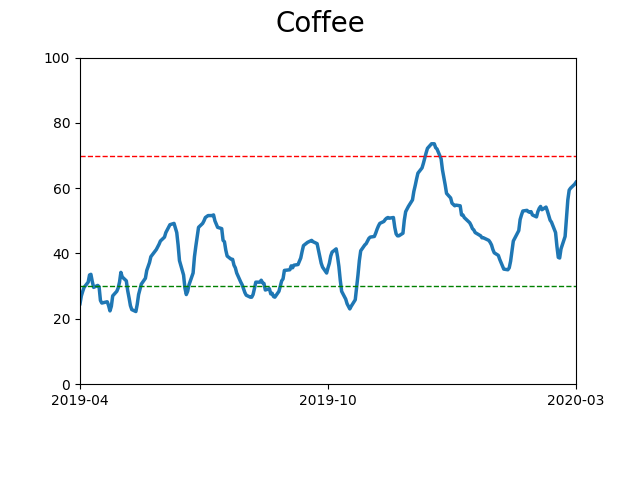
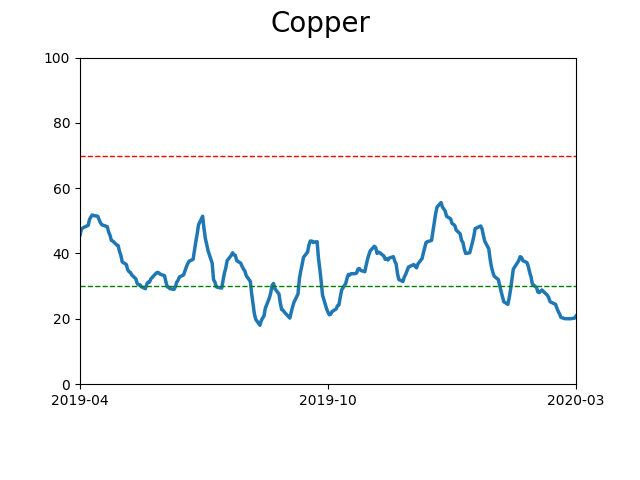
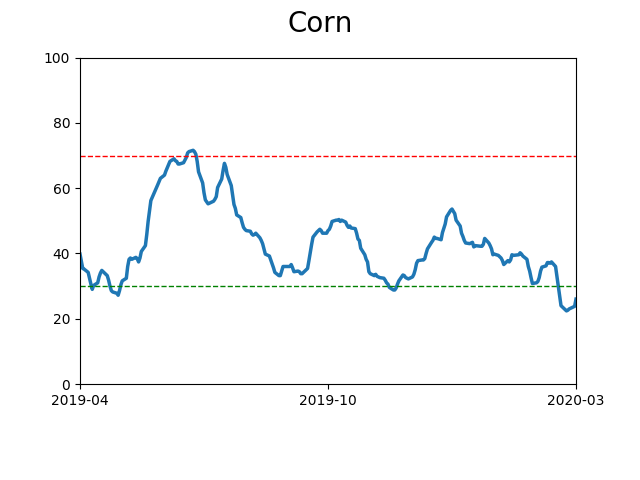
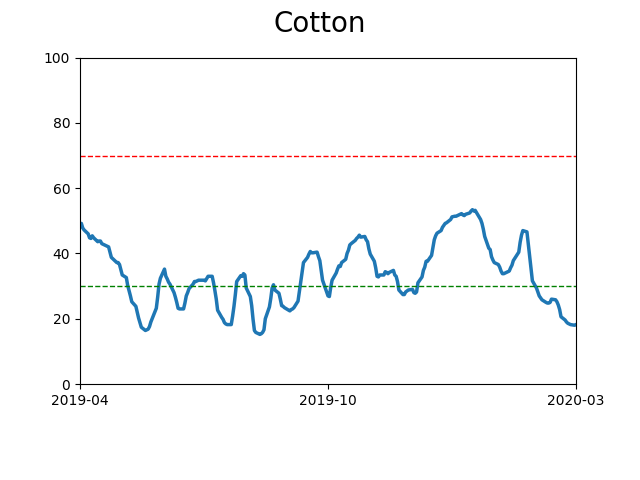
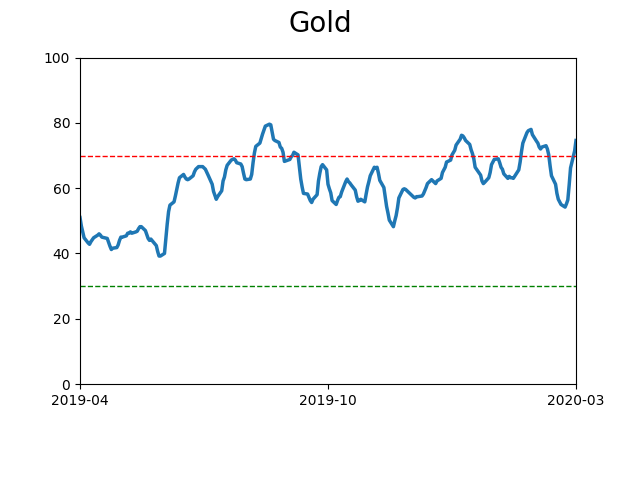
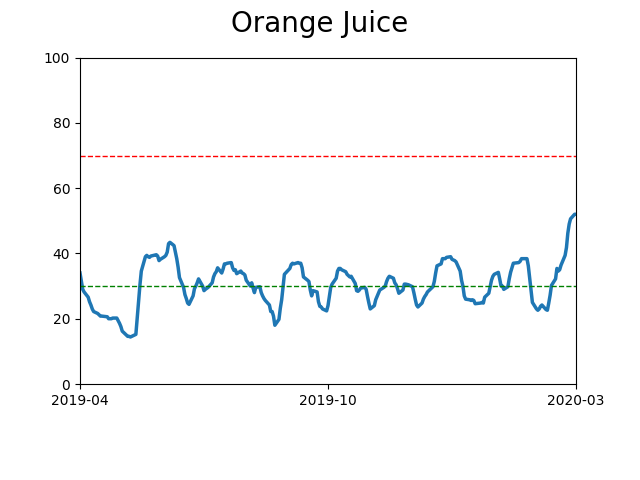
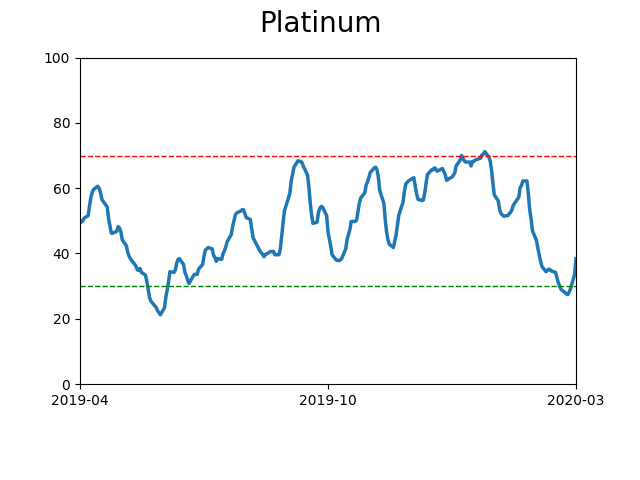
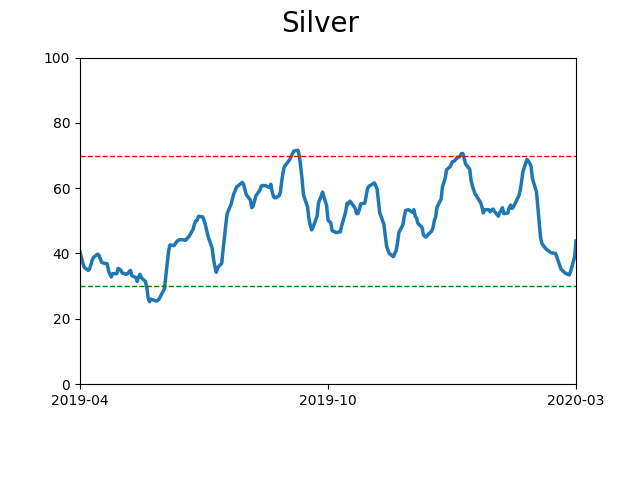
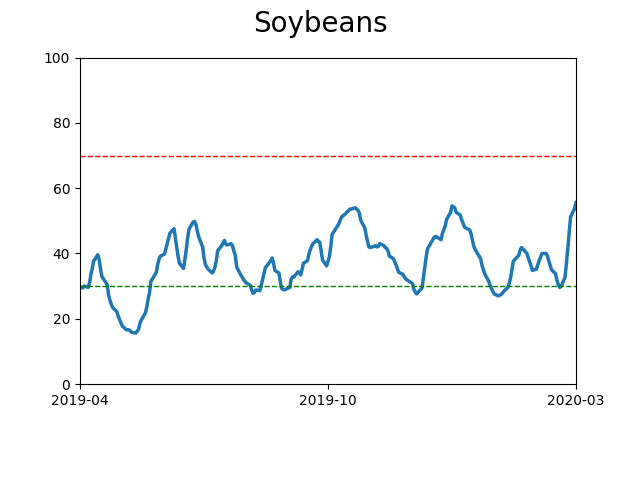
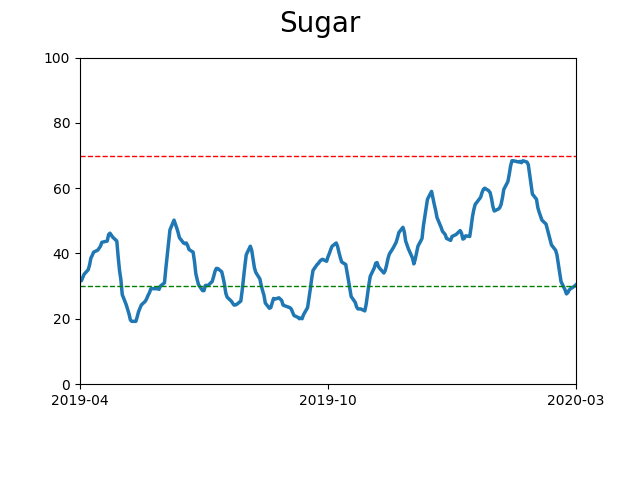
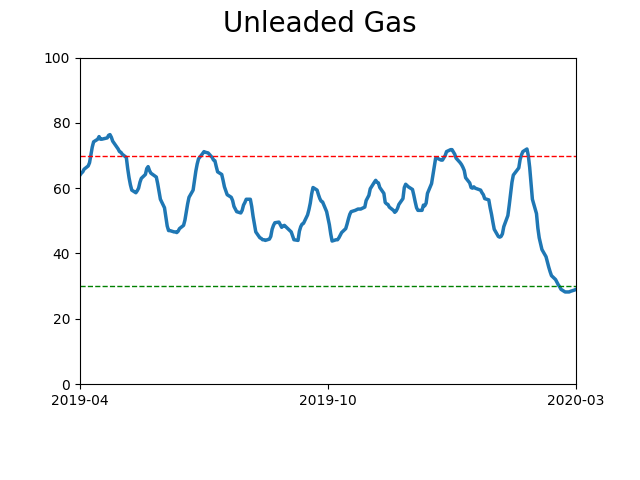
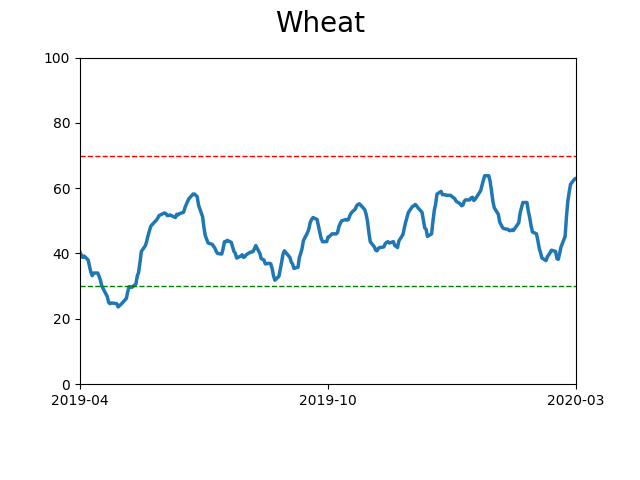
Commodity ETF's - 5-Day Moving Average
|
|