Headlines
|
|
Small cap stocks near historic volatility extreme:
Over the past 30 days, the small-cap Russell 2000 has been showing much higher volatility than the large-cap S&P 500. Over the past 40 years, this has happened only a handful of times, with smaller stocks ending up outperforming over the next 6 months.
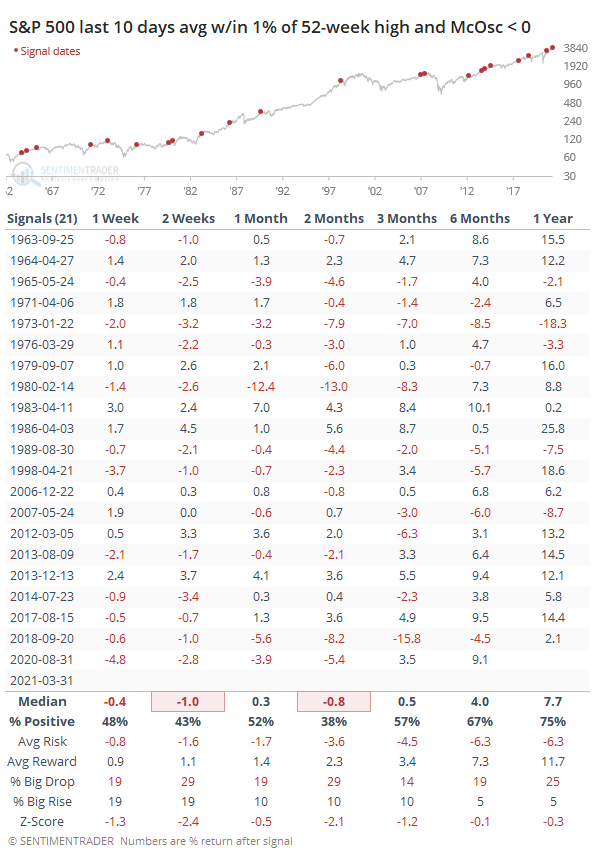
Still some internal weakness: Another day with the S&P 500 hovering near a record high, and another day with a negative McClellan Oscillator. We touched on this on Tuesday. The condition has now persisted for 10 straight sessions, with the S&P spending an average day less than 1% from its 52-week high, and the Oscillator being negative all 10 days, averaging more than -20. Over the past 60 years, the S&P showed a negative return between 1-3 months later after 16 out of the 21 times this type of condition existed.
Bottom Line:
See the Outlook & Allocations page for more details on these summaries STOCKS: Weak sell
The extreme speculation registered in January and February is starting to get wrung out. Internal dynamics have mostly held up, so a return to neutral sentiment conditions would improve the forward risk/reward profile substantially. We're still a ways off from that. BONDS: Weak buy
Various parts of the market have been hit in recent weeks, with mild oversold conditions. The Bond Optimism Index is now about as low as it gets during healthy bond market environments. Fixed income isn't responding well, so that needs to be monitored in case it's transitioning to a longer-term negative market environment. GOLD: Weak buy
A dollar trying to rebound from a severe short position has weighed on gold and miners. The types of signals they've given in recent weeks, within the context of their recent surge, have usually resulted in higher prices over a medium- to long-term time frame. Like bonds, gold and miners aren't responding very well, and this needs to be monitored.
|
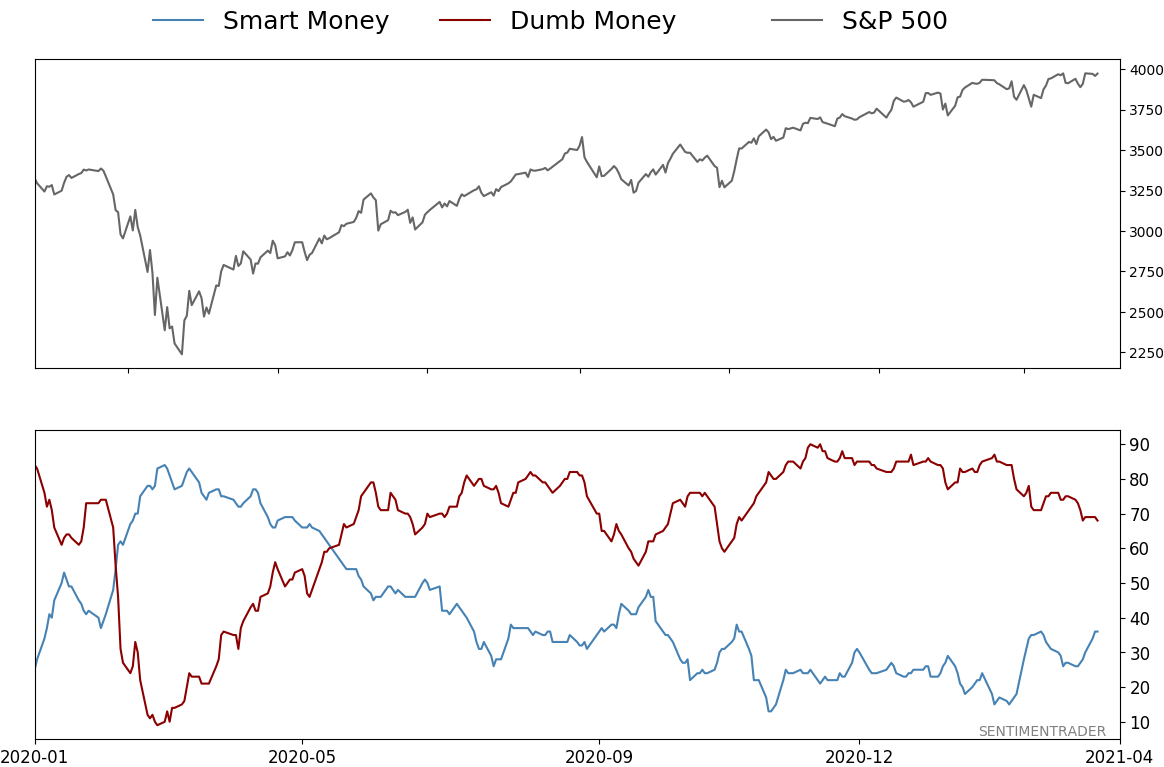
Smart / Dumb Money Confidence
|
Smart Money Confidence: 36%
Dumb Money Confidence: 68%
|
|
Risk Levels
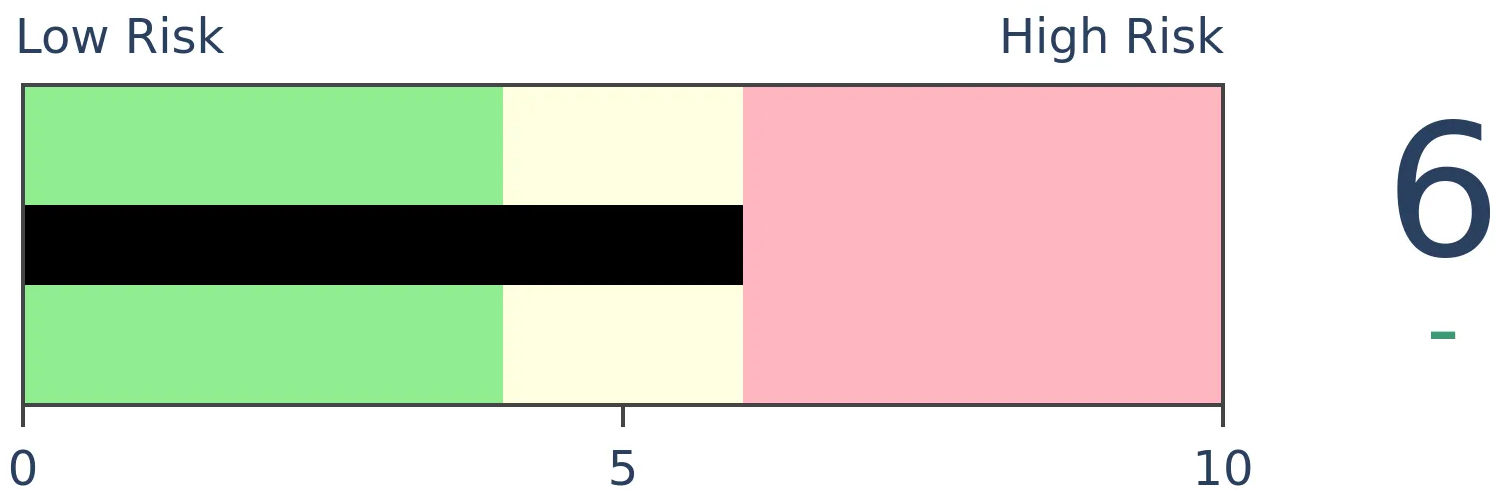
Stocks Short-Term
|
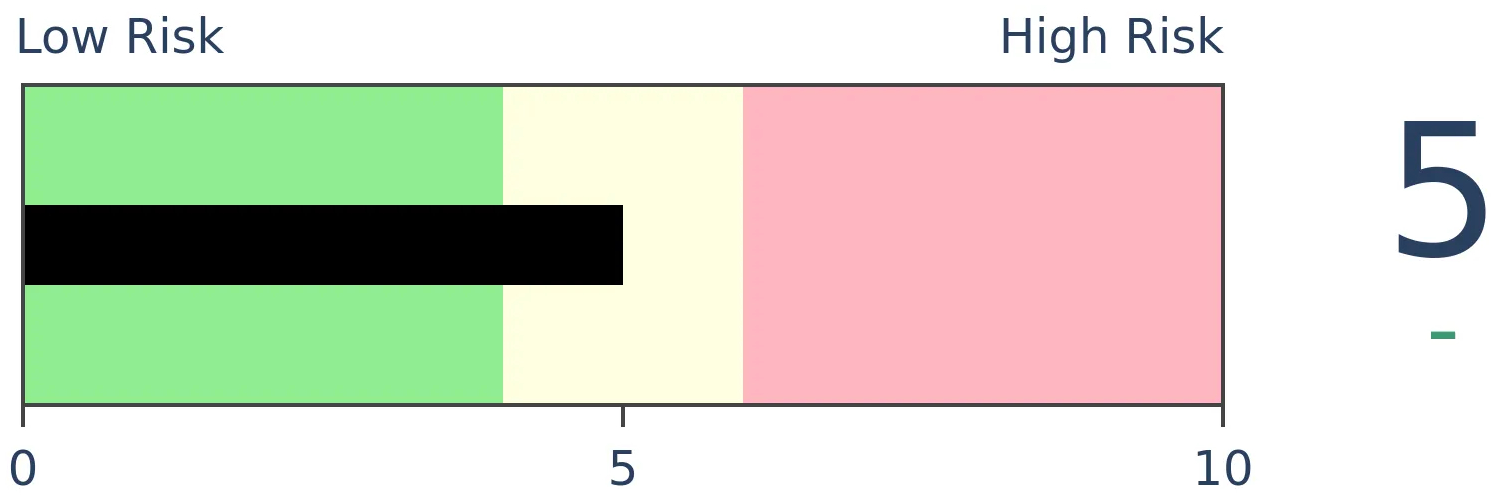
Stocks Medium-Term
|
|
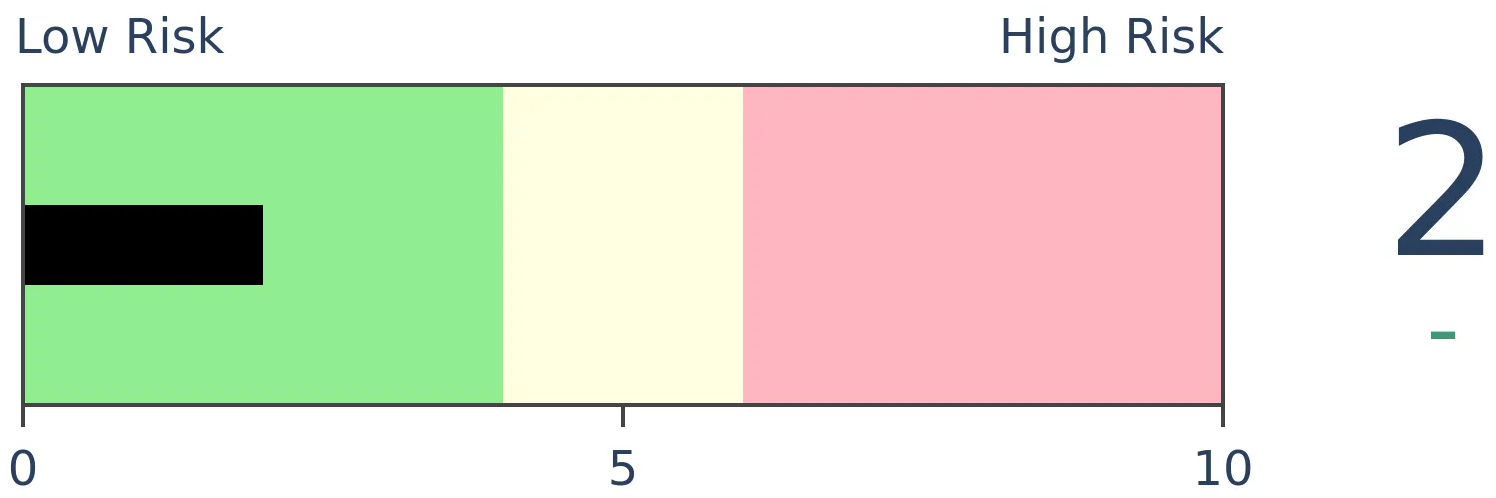
Bonds

|
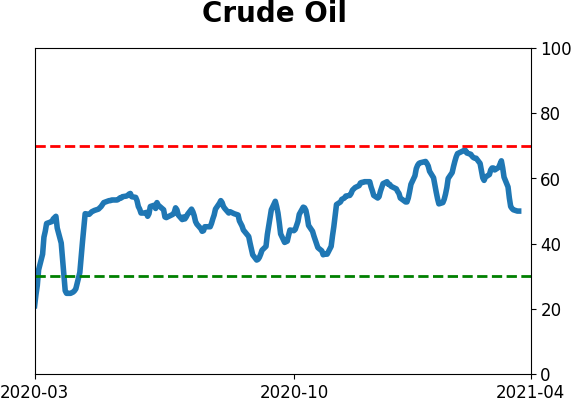
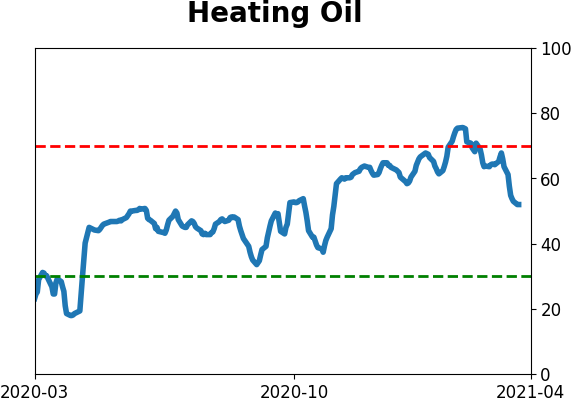
Crude Oil
|
|
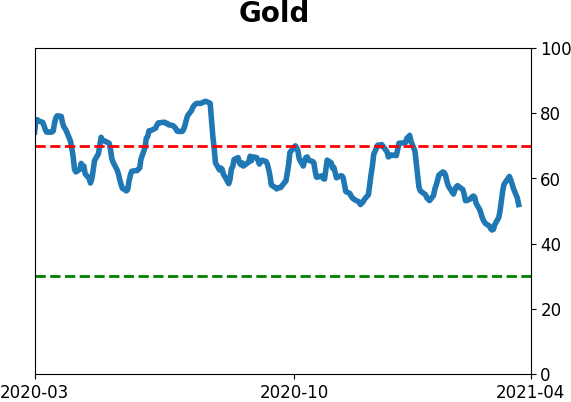
Gold
|
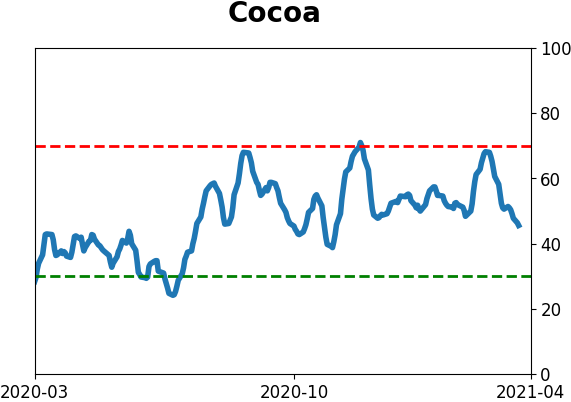
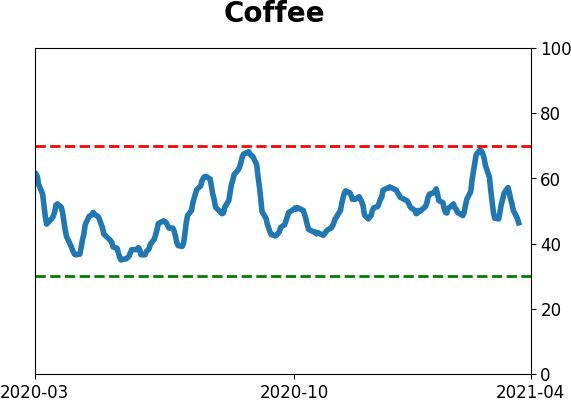
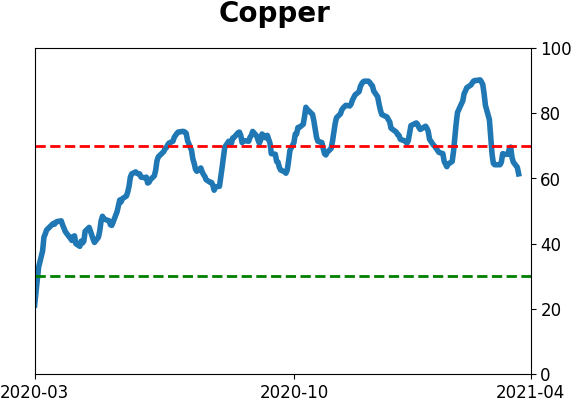
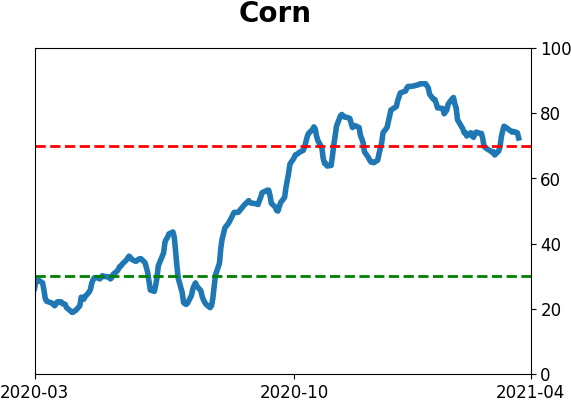
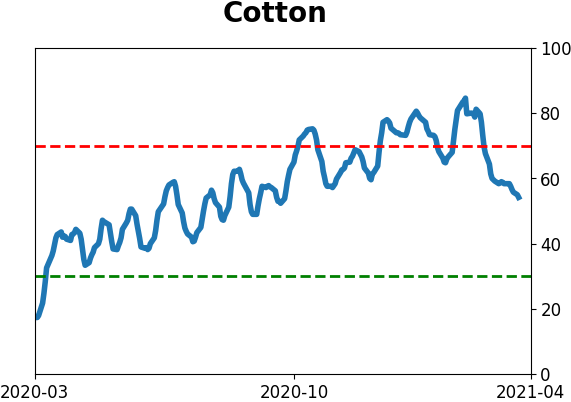
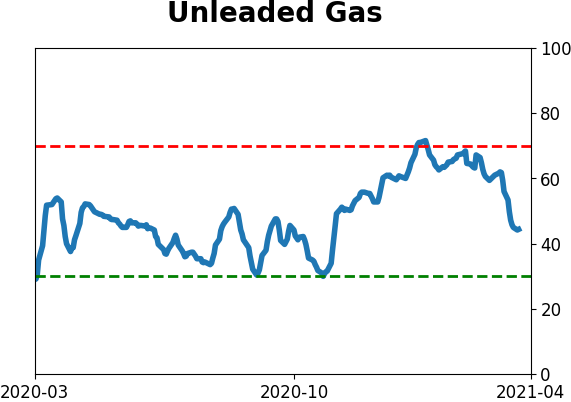
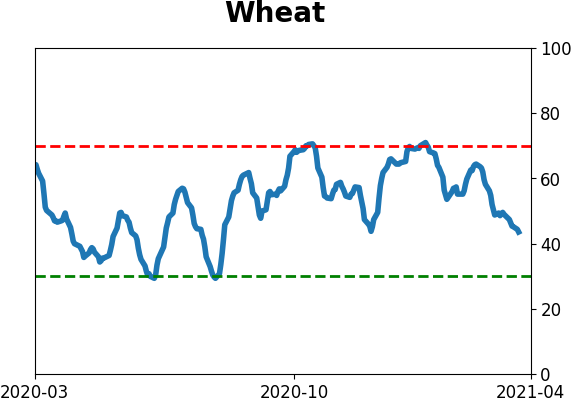
Agriculture

|
|
Research
BOTTOM LINE
Over the past 30 days, the small-cap Russell 2000 has been showing much higher volatility than the large-cap S&P 500. Over the past 40 years, this has happened only a handful of times, with smaller stocks ending up outperforming over the next 6 months.
FORECAST / TIMEFRAME
None
|
Large-cap stocks, defined by the S&P 500, jumped to a record high on Friday. Other parts of the market, including small-caps, have been dragging.
Small-caps have a major influence on breadth statistics, a big reason why the S&P was meandering near an all-time high on Monday, yet breadth metrics were the worst in history.
Monday's activity was further evidence that volatility in those small-caps has jumped in recent weeks, even as the broader market stays relatively calm. Over the past 30 days, historical volatility in the Russell 2000 is now about 15 points higher than that for the S&P 500, one of the widest spreads in 40 years.
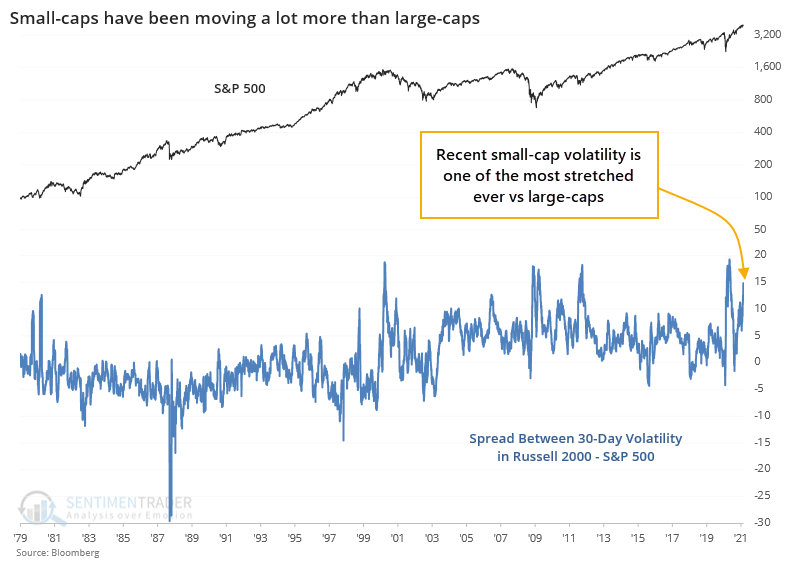
There aren't a whole lot of precedents for this kind of behavior since the inception of the Russell 2000 index. The handful of times that volatility between the two indexes reached the current level of extreme, the S&P didn't do so great going forward, excepting the last occurrence in the aftermath of the pandemic.
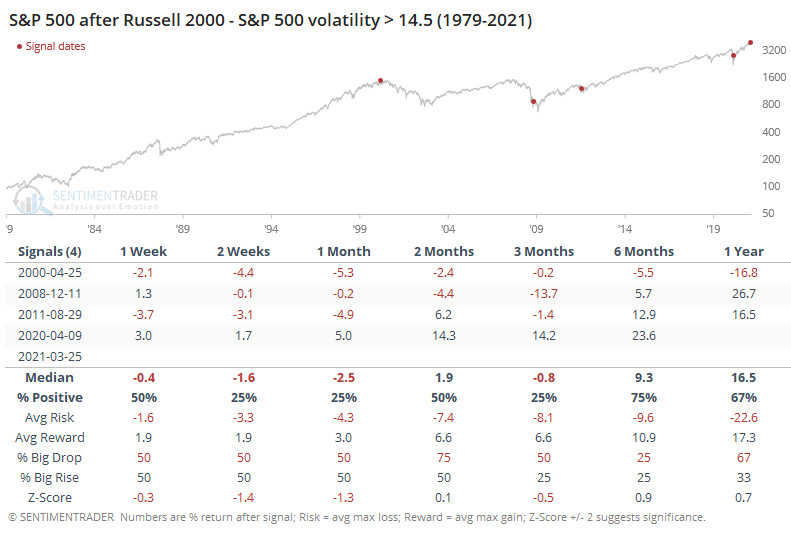
The Russell also showed mixed returns over the shorter-term, but at least by 6 months later showed a positive return each time.
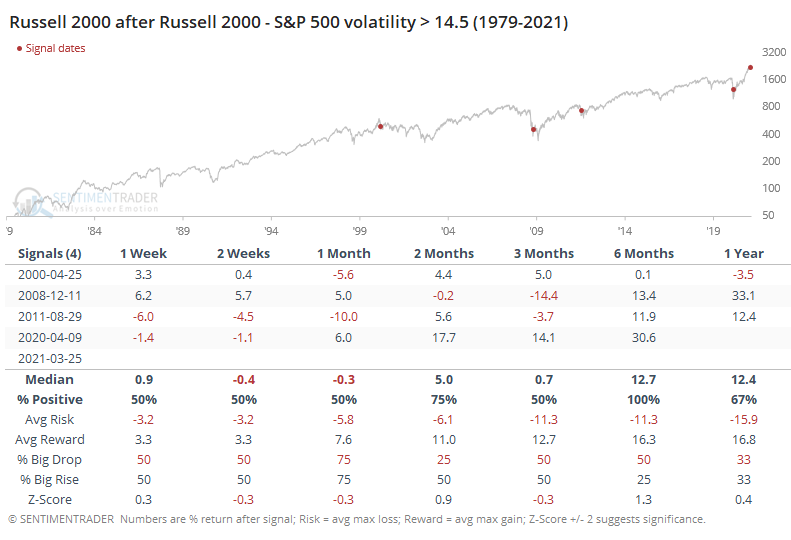
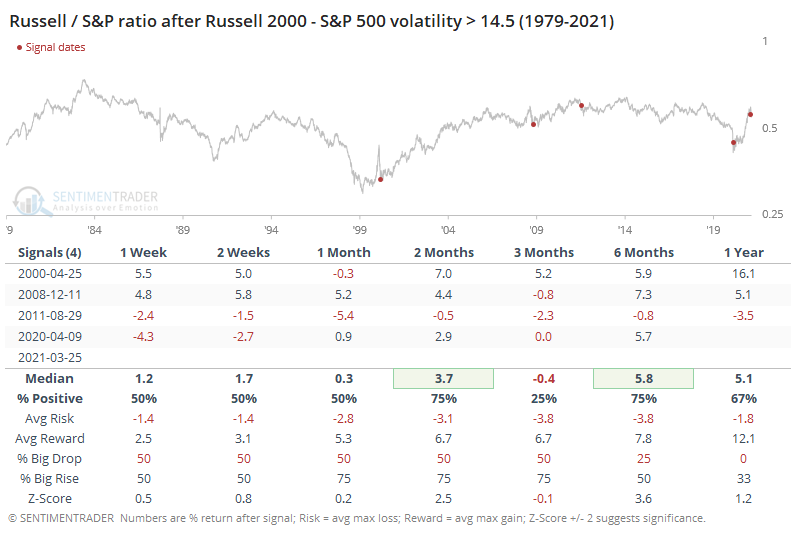
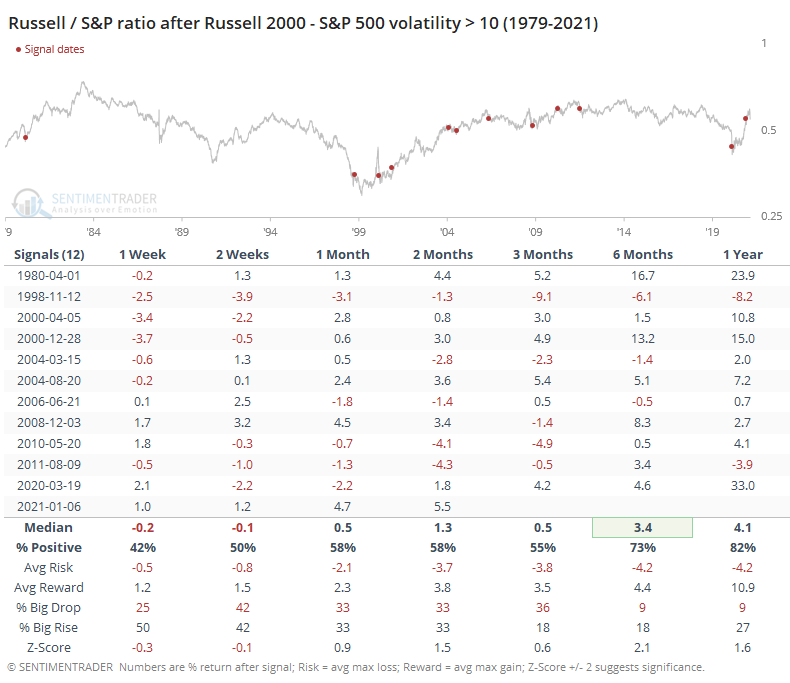
This means that the ratio of the Russell to S&P tended to rise as smaller stocks outperformed in the wake of their higher volatility. But it was a volatile ride.
To get a larger sample size, we have to lessen the threshold to a spread of 10 points. That gives us more history to work with to see if there's any solid conclusion here, but it also means that it's less applicable since the lesser extreme triggered nearly 3 months ago.
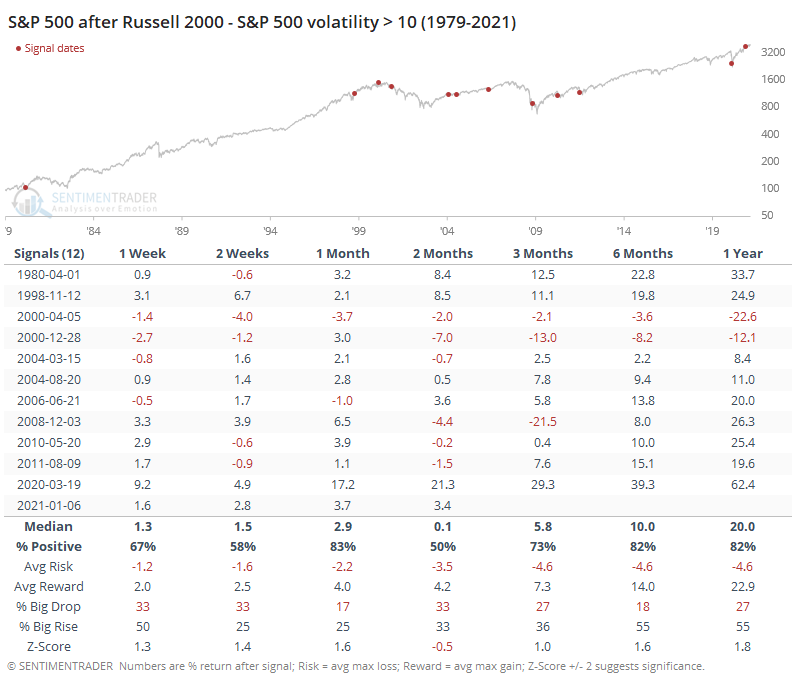
Again, the Russell tended to do better.
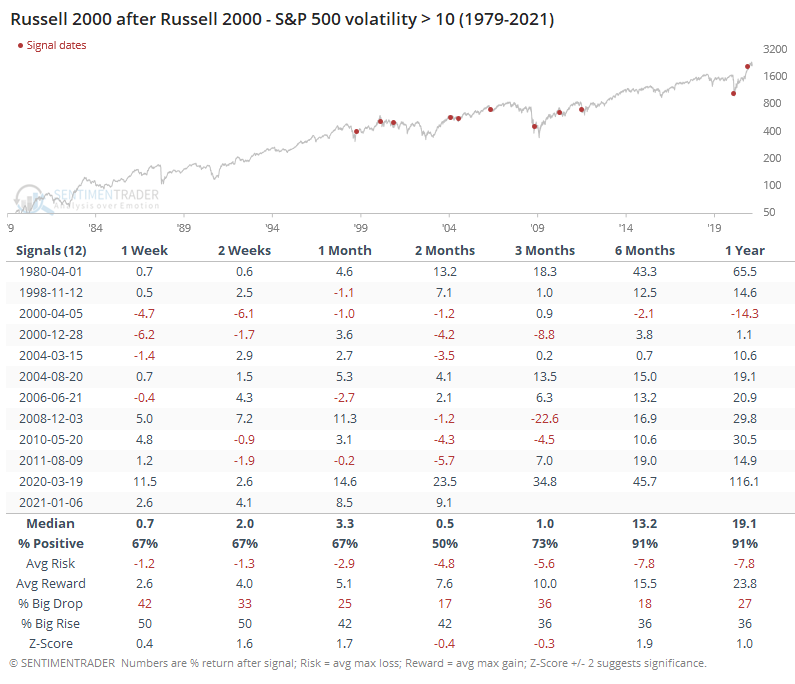
The ratio of the Russell to S&P was still volatile, but over the next 6 months, the disparity in favor of smaller stocks was especially wide.
As markets hit new highs and then become volatile, there is a tendency to think that it necessarily suggests a trend change. If overall levels of current and implied volatility start to persistently march higher, then the likelihood of a sustained decline becomes more probable. Currently, the simple fact that small-caps have been swinging so much more than large-caps isn't giving us too much of a hint that that's likely just yet, though.
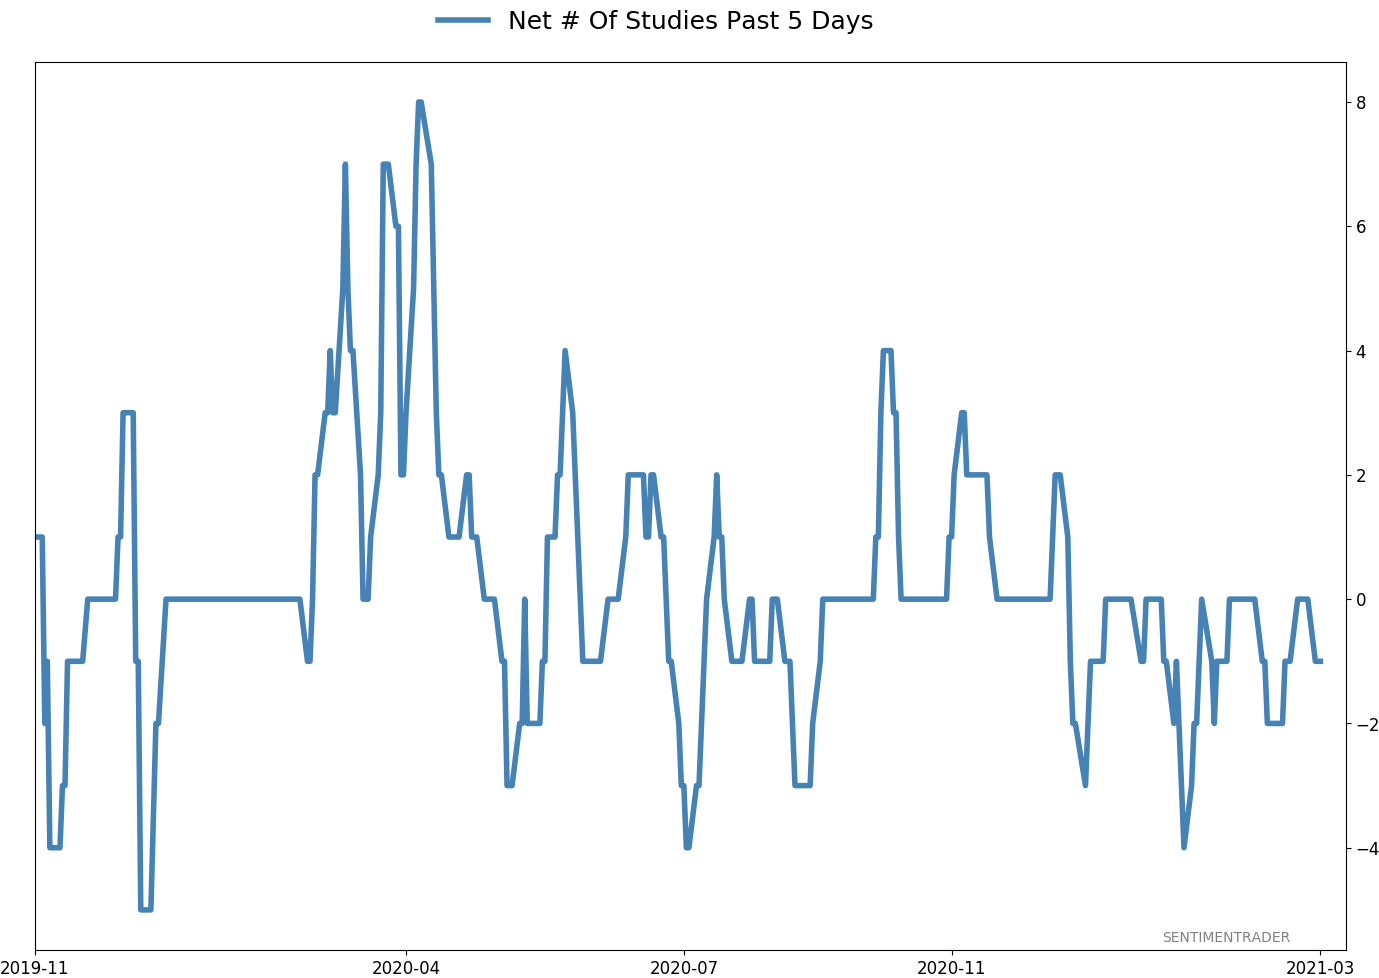
Active Studies
| Time Frame | Bullish | Bearish | | Short-Term | 0 | 0 | | Medium-Term | 0 | 10 | | Long-Term | 11 | 4 |
|
Indicators at Extremes
Portfolio
| Position | Description | Weight % | Added / Reduced | Date | | Stocks | RSP | 4.9 | Reduced 4% | 2021-02-09 | | Bonds | 30.0% BND, 8.8% SCHP | 38.8 | Added 15.1% | 2021-02-18 | | Commodities | GCC | 2.3 | Reduced 2.1%
| 2020-09-04 | | Precious Metals | GDX | 9.0 | Added 0.1% | 2021-02-18 | | Special Situations | 7.3% XLE, 4.8% PSCE | 12.1 | Reduced 5.6% | 2021-02-18 | | Cash | | 32.8 | | |
|
Updates (Changes made today are underlined)
With a market that has seen the kinds of broad participation and big breath thrusts like we did in the fall, it's hard to become too negative. Those kinds of conditions have consistently preceded higher returns over the next 6-12 months. It's the interim that's more of an issue. Even conditions like that haven't prevented some shorter-term pullbacks. And when we combine an environment where speculation is rampant and recent days have seen an increase in cracks under the surface of the indexes, it's enough to become more defensive over a short- to medium-term time frame. We still don't have much confirmation from the price action in the indexes, so those who are more conservative would likely wait before increasing cash levels. I've decreased risk exposure a bit more, mainly in terms of energy stocks and the ANGL fund, while adding more to the broader bond market. RETURN YTD: 5.4% 2020: 8.1%, 2019: 12.6%, 2018: 0.6%, 2017: 3.8%, 2016: 17.1%, 2015: 9.2%, 2014: 14.5%, 2013: 2.2%, 2012: 10.8%, 2011: 16.5%, 2010: 15.3%, 2009: 23.9%, 2008: 16.2%, 2007: 7.8%
|
|
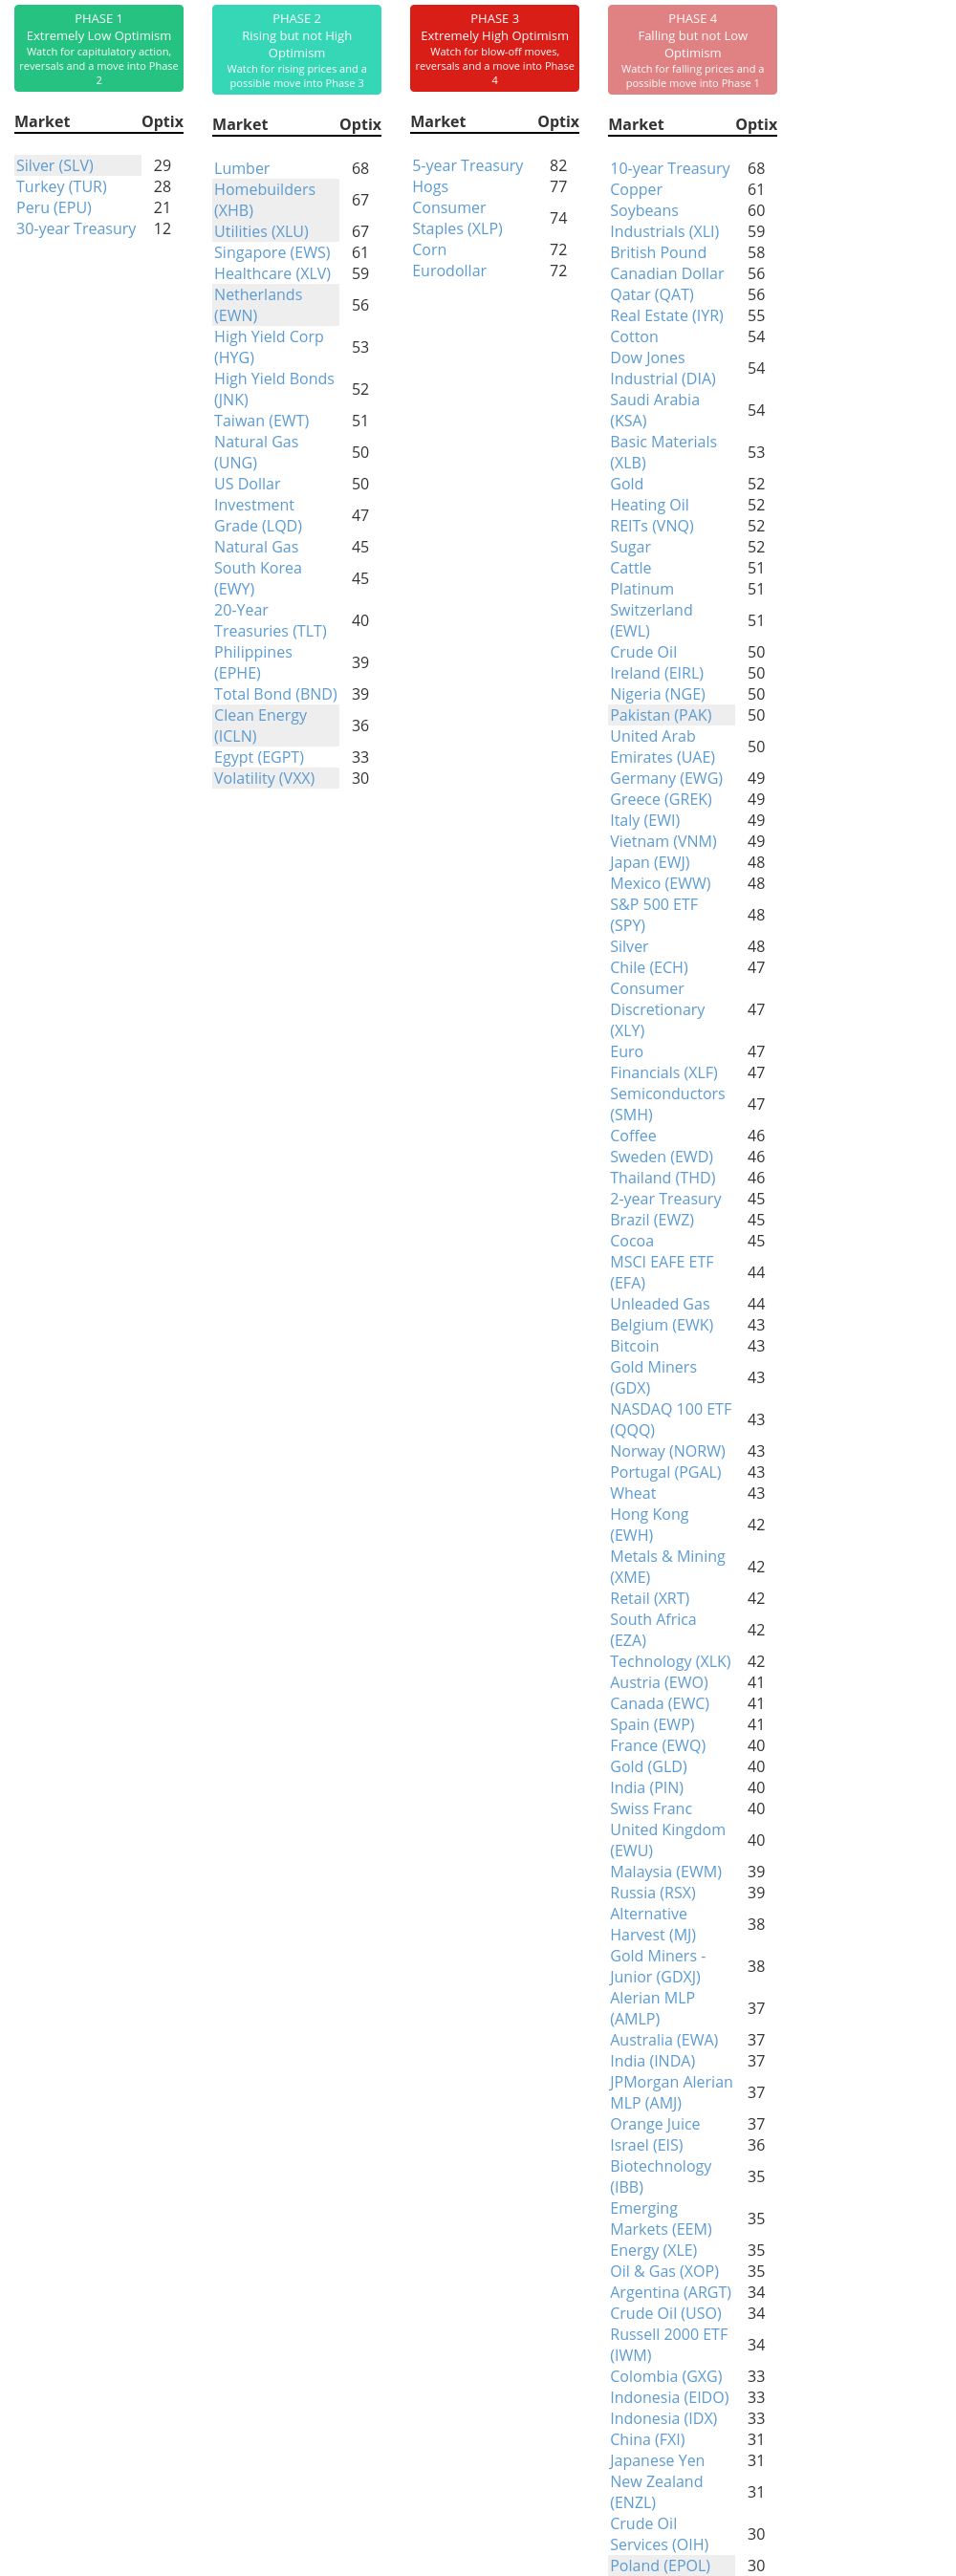
Phase Table
Ranks
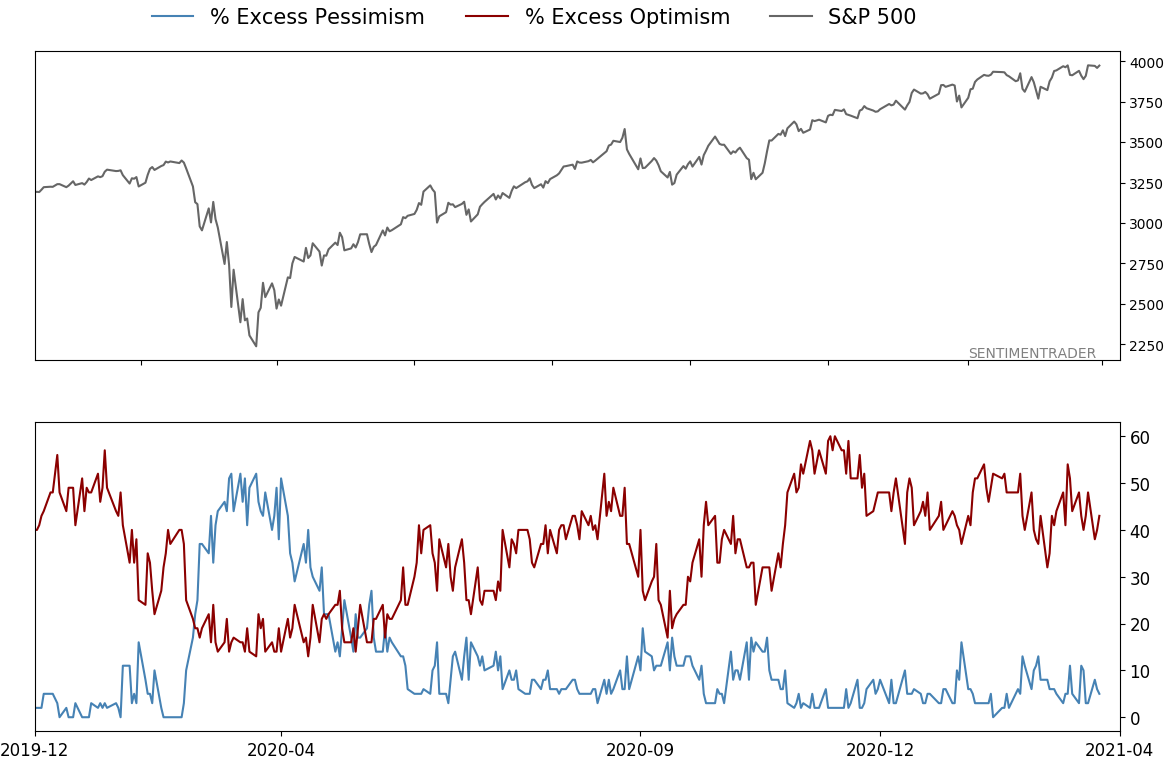
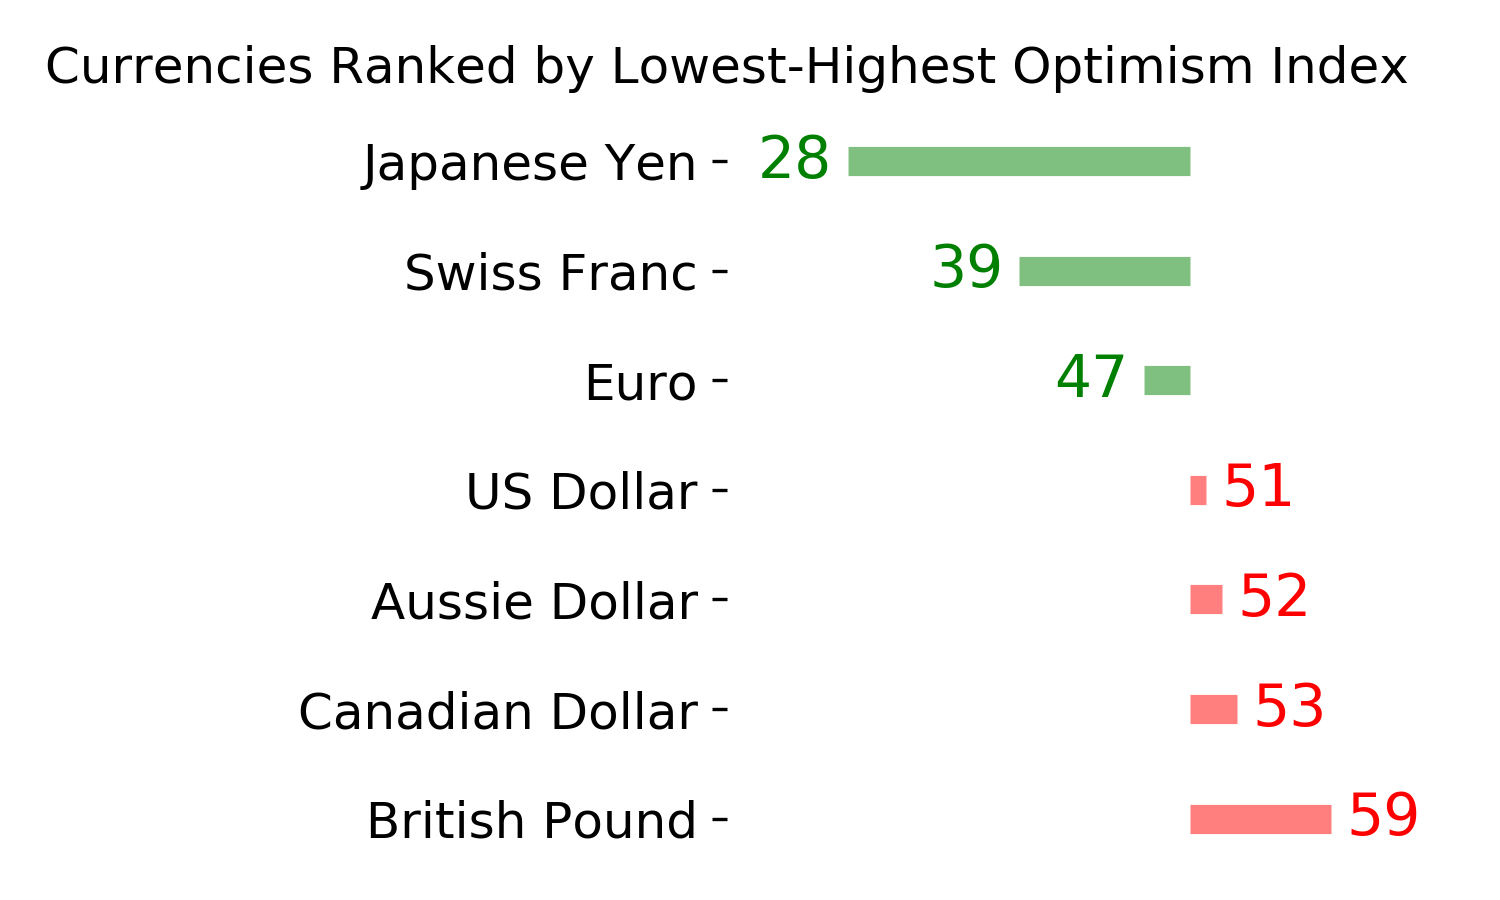
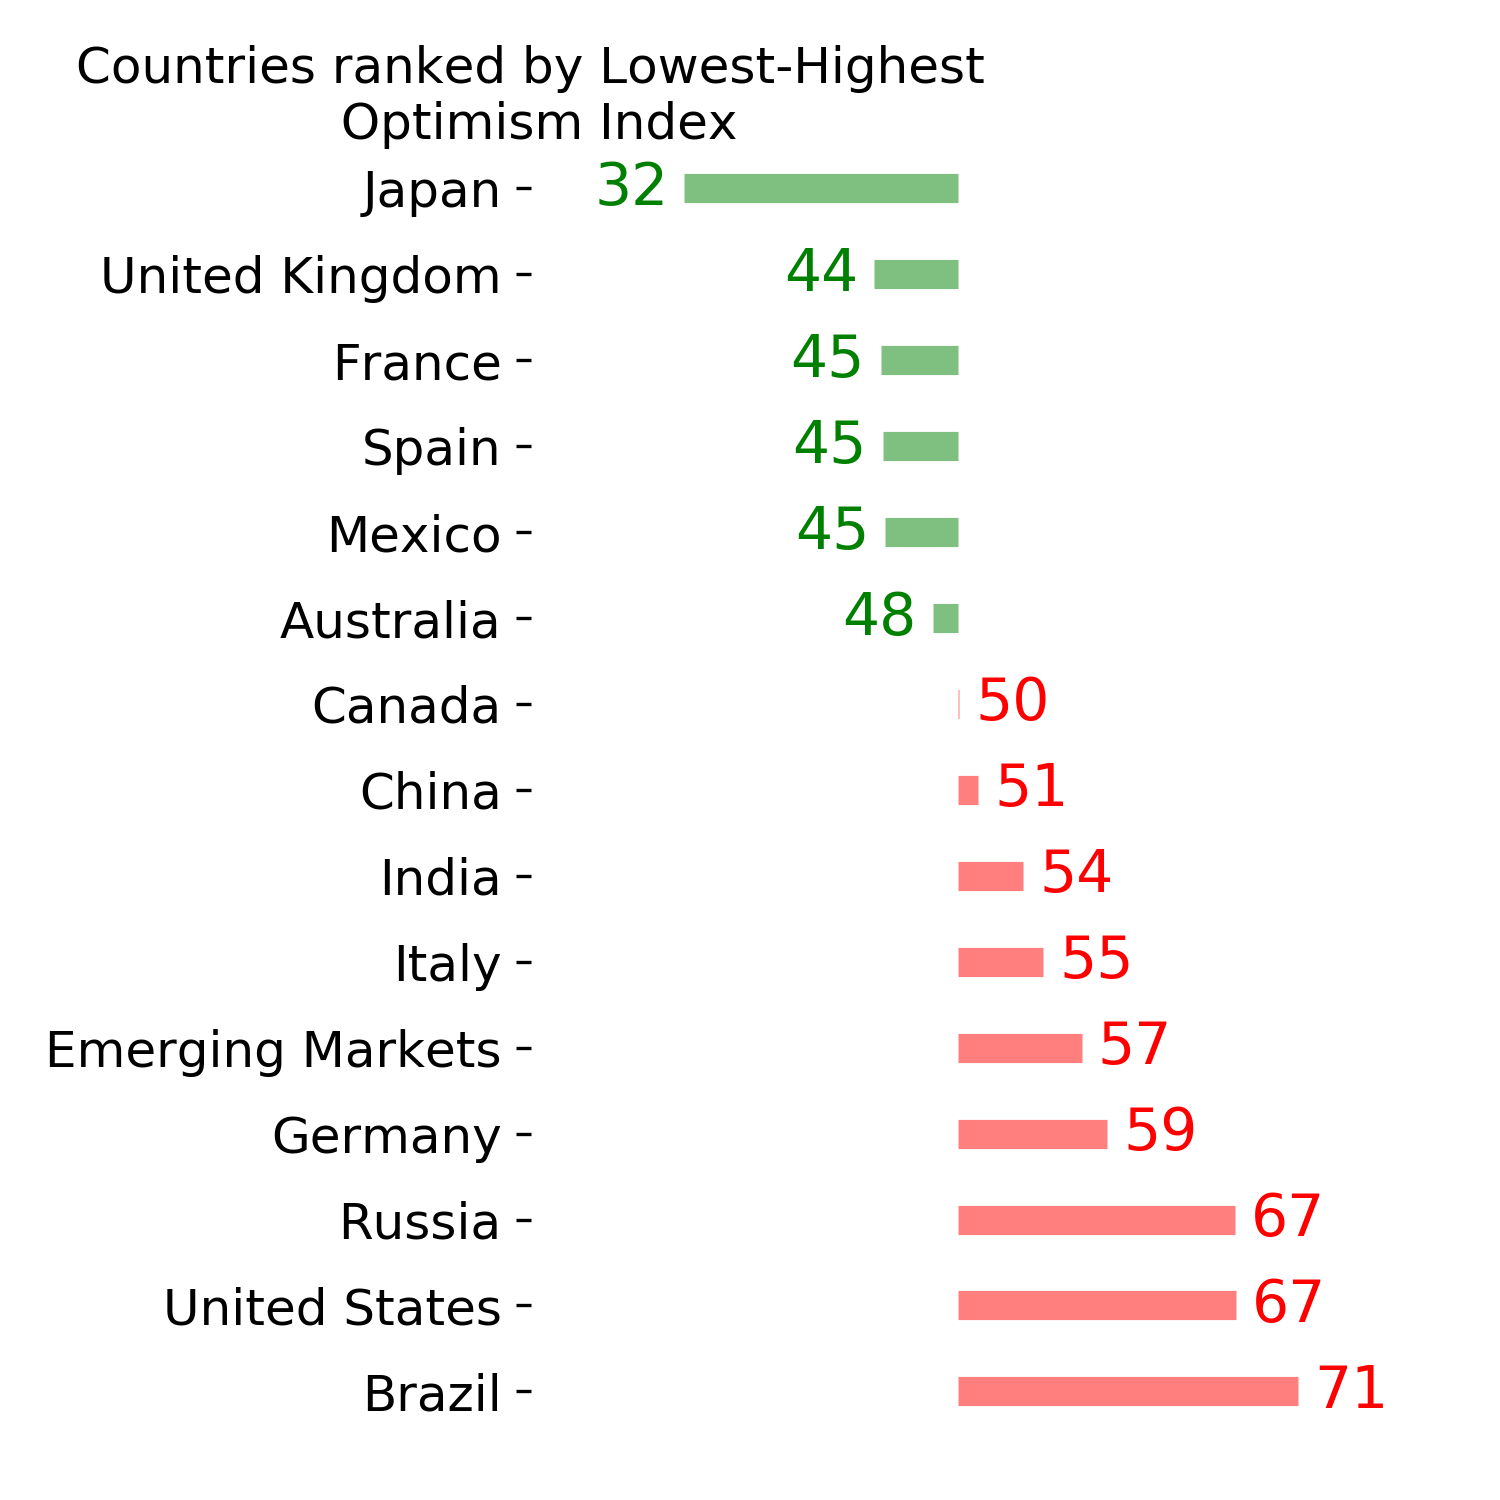
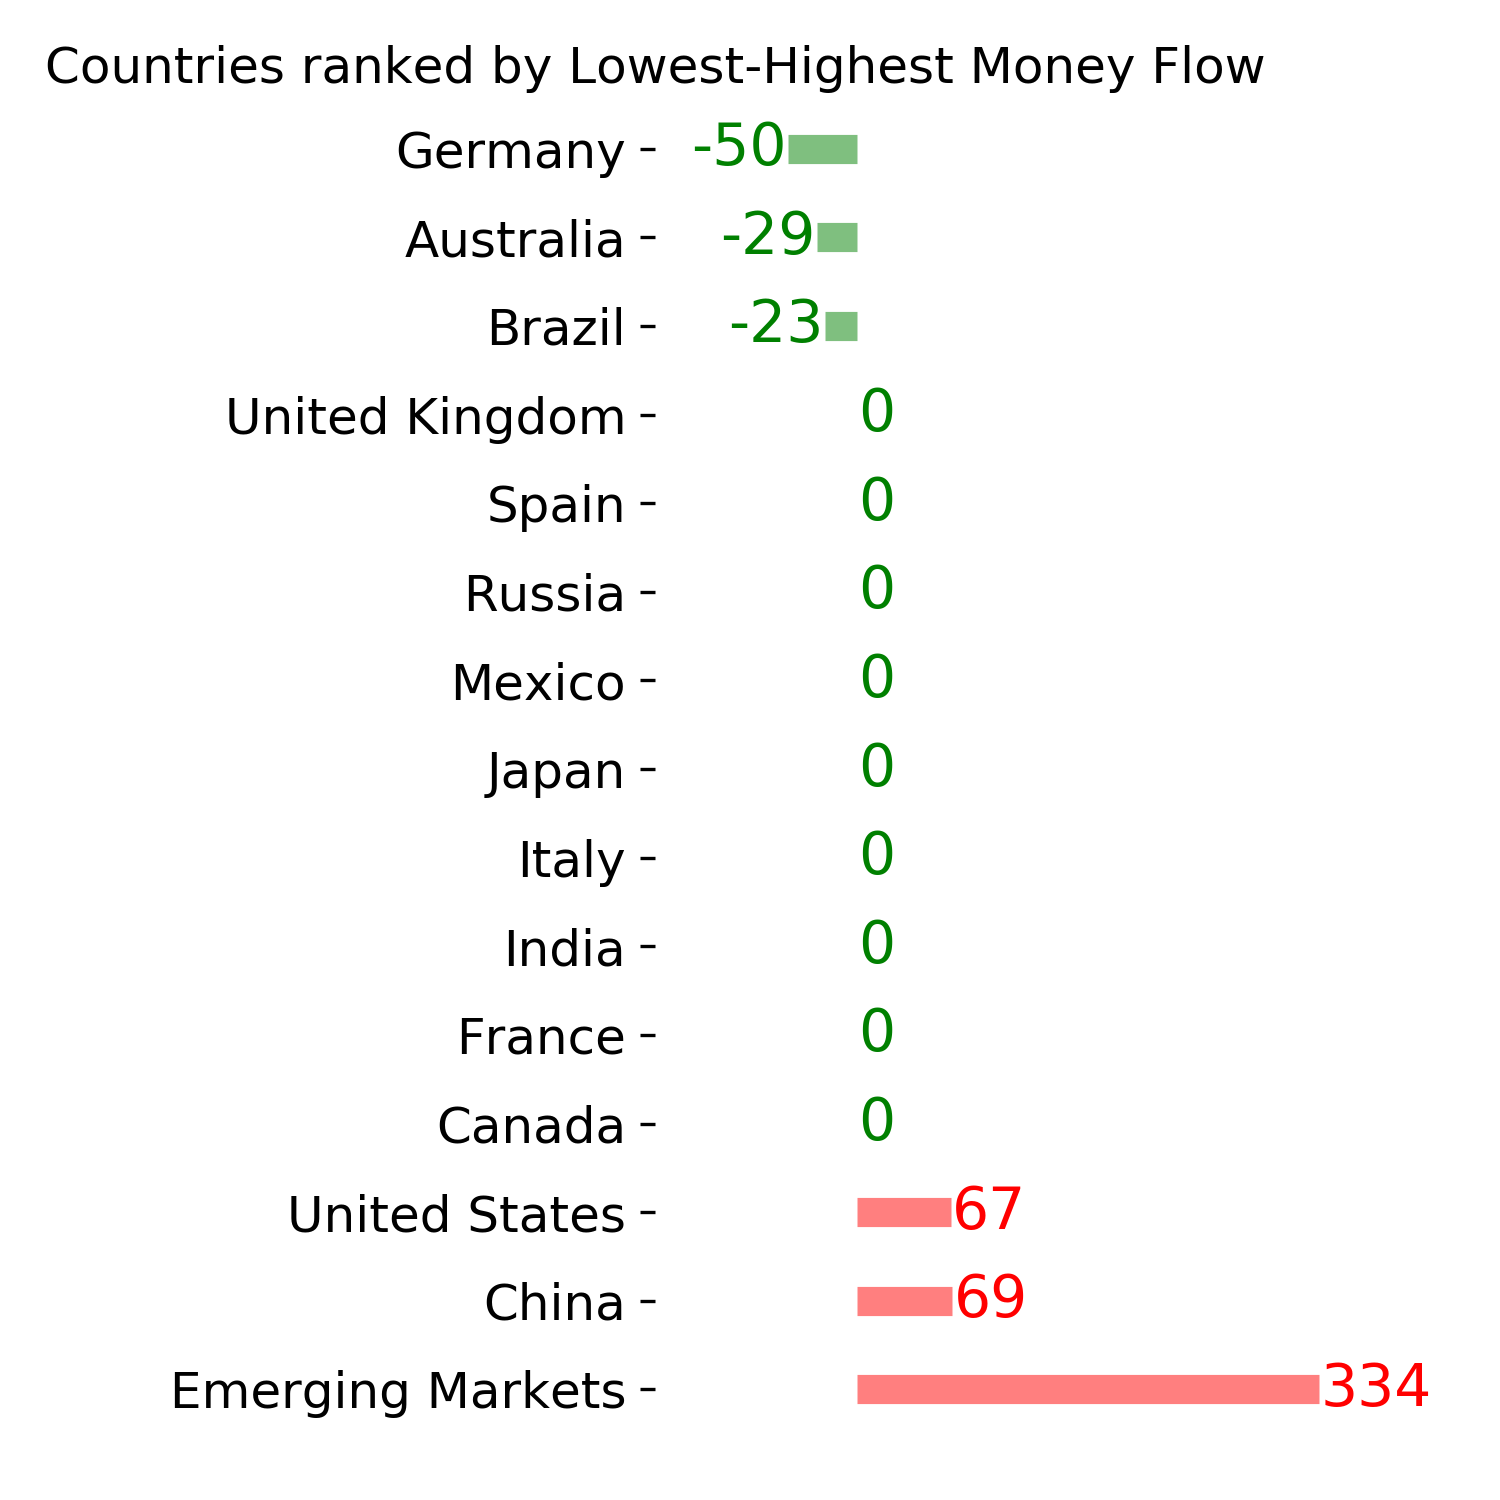
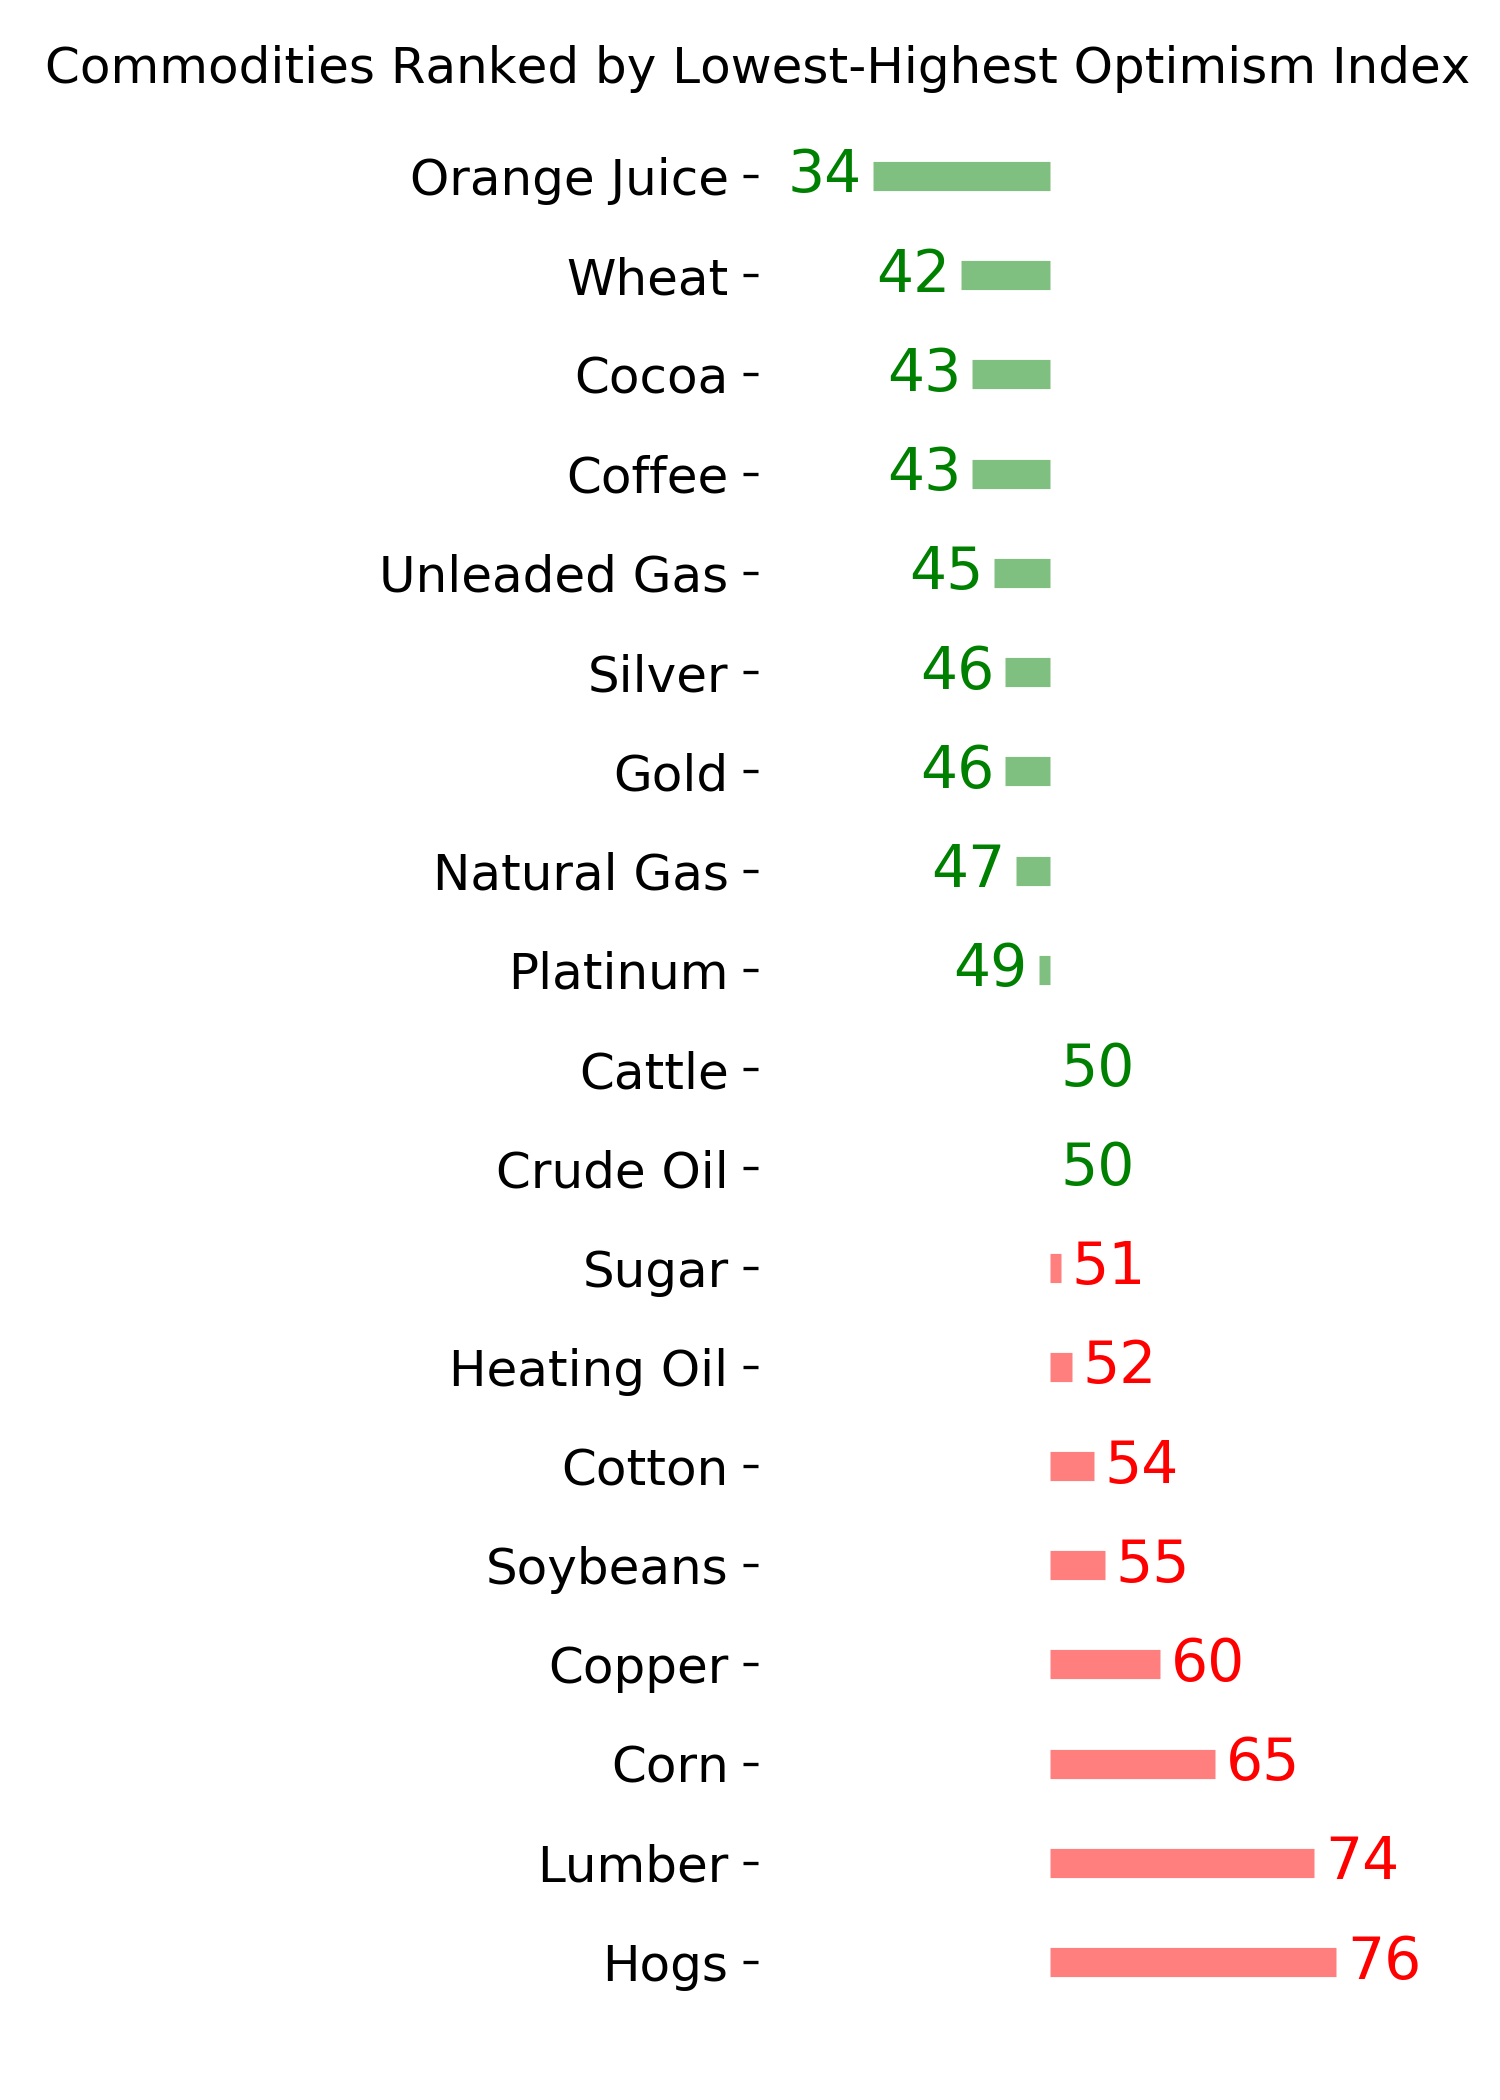
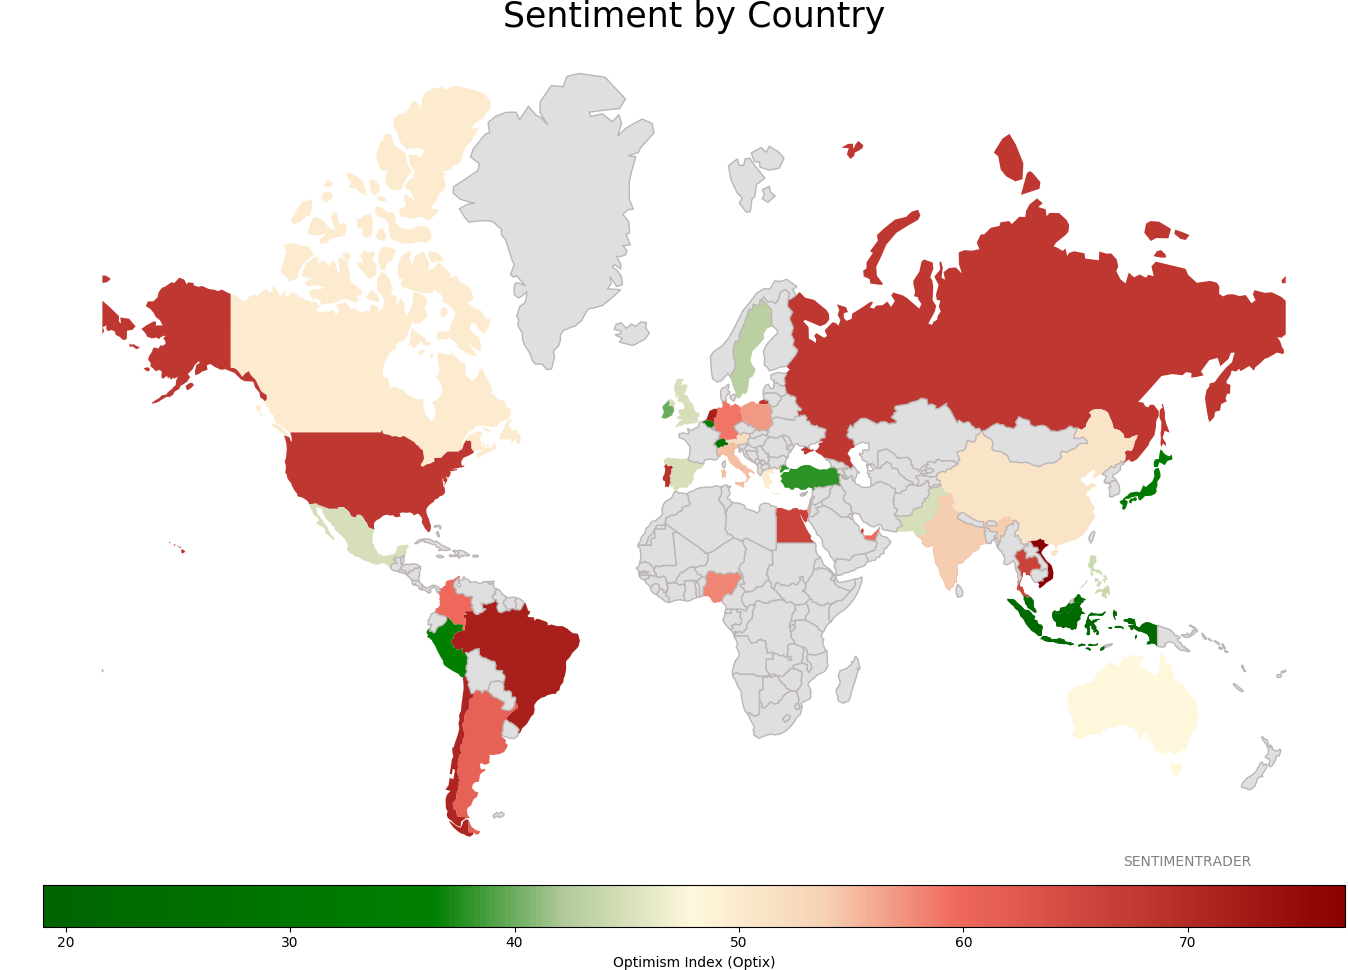
Sentiment Around The World
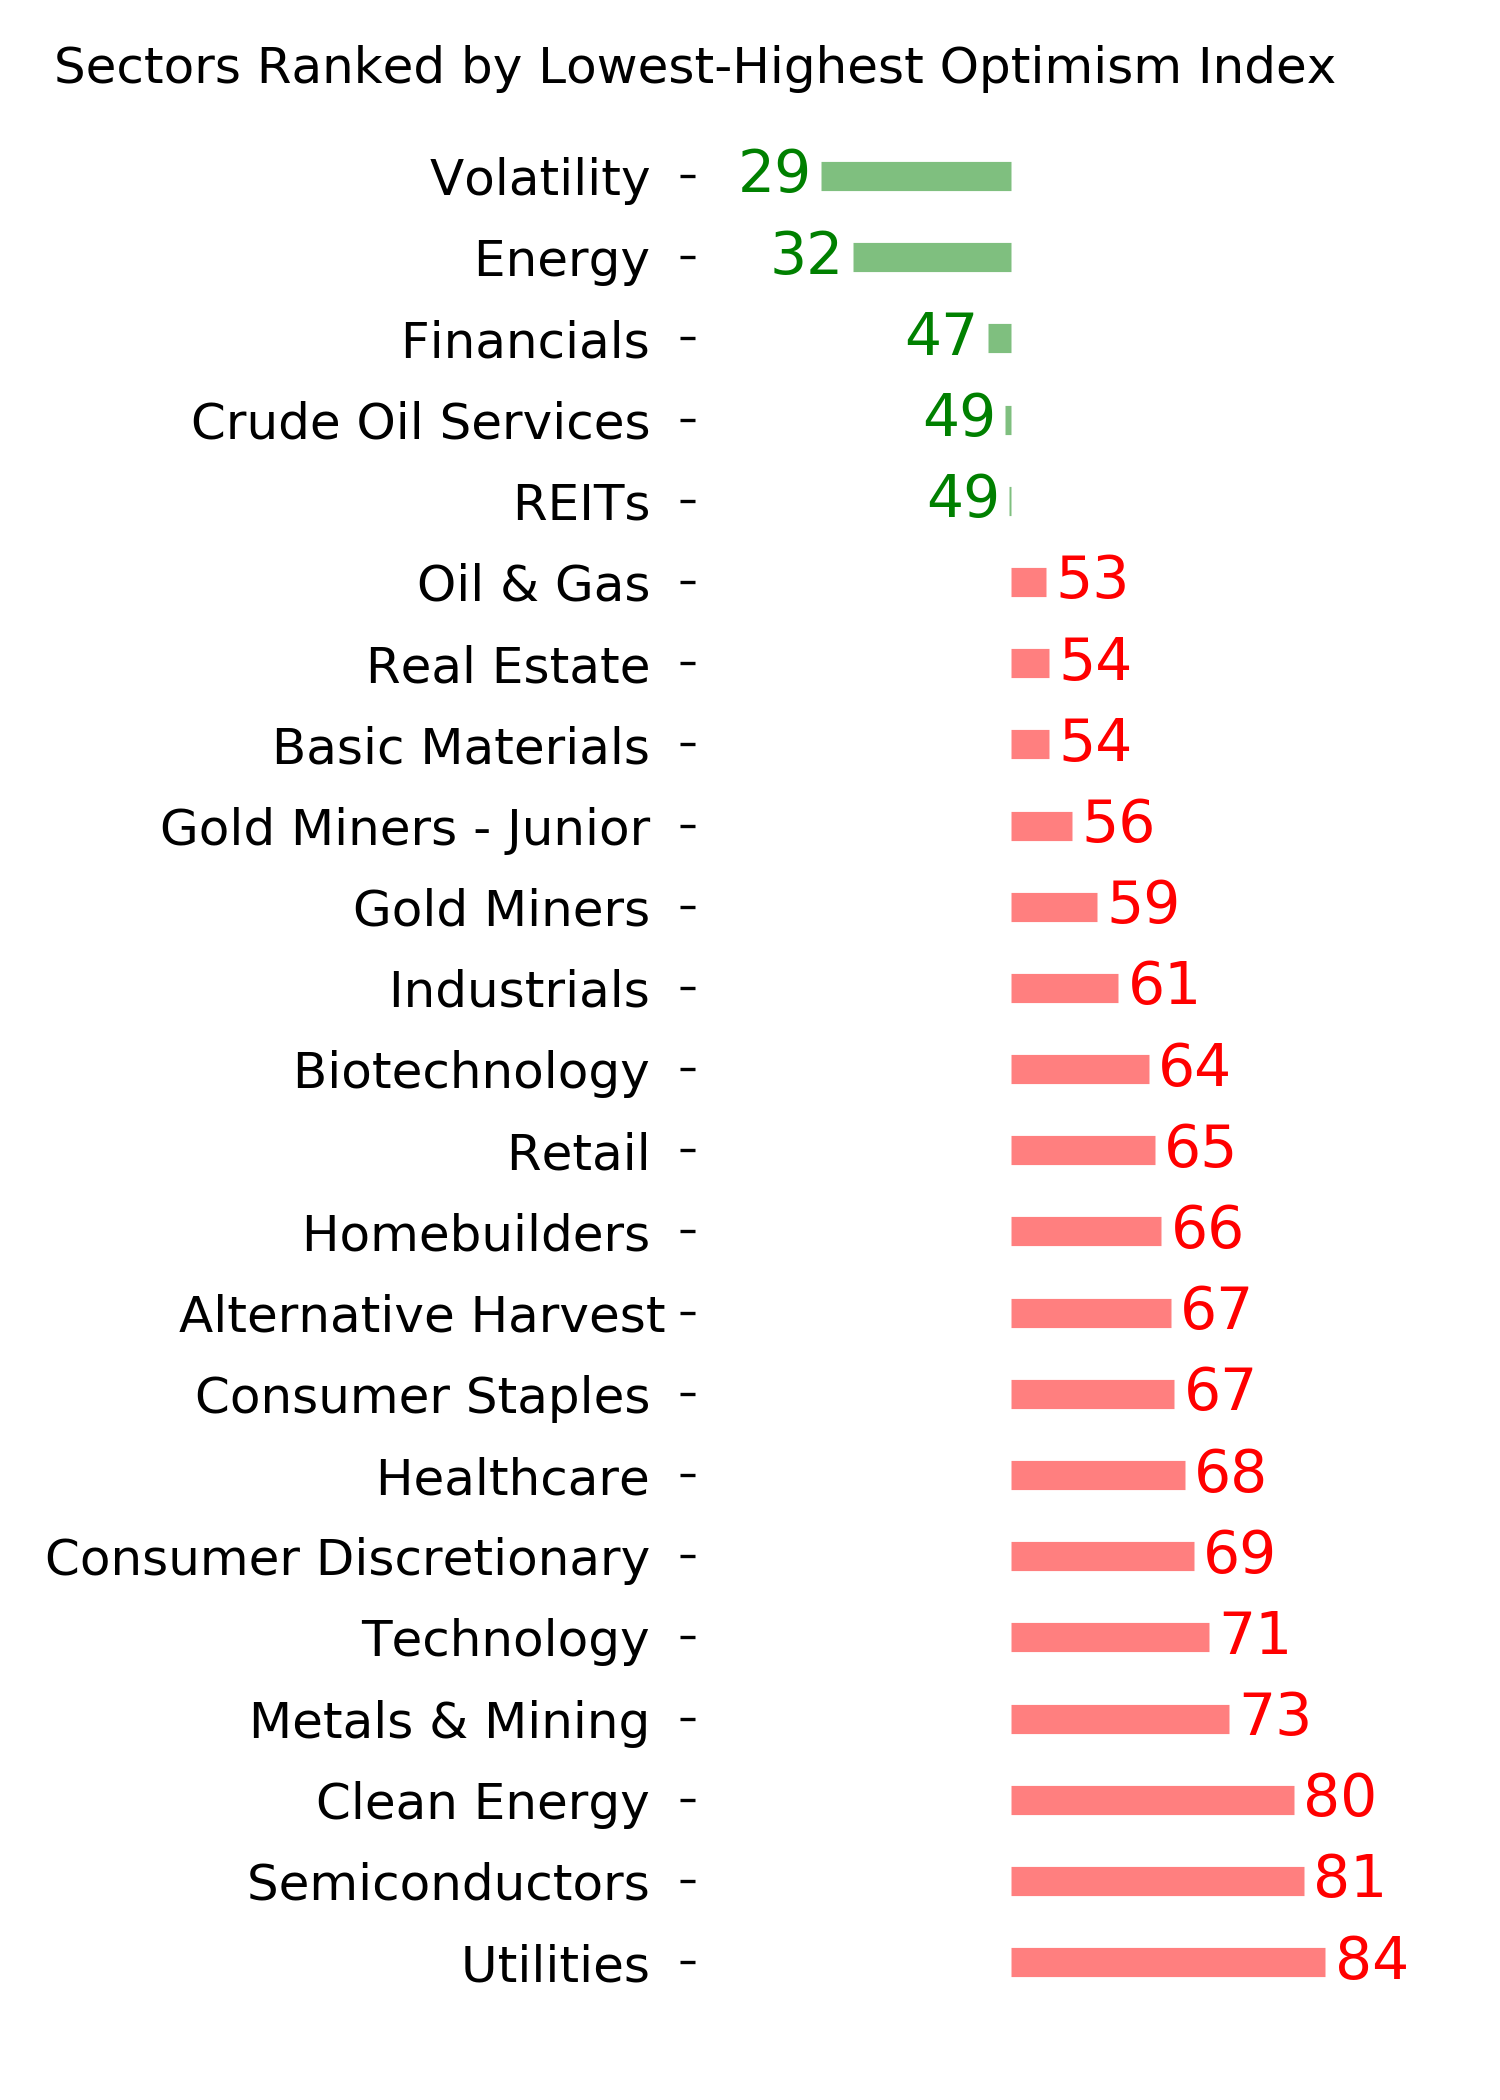
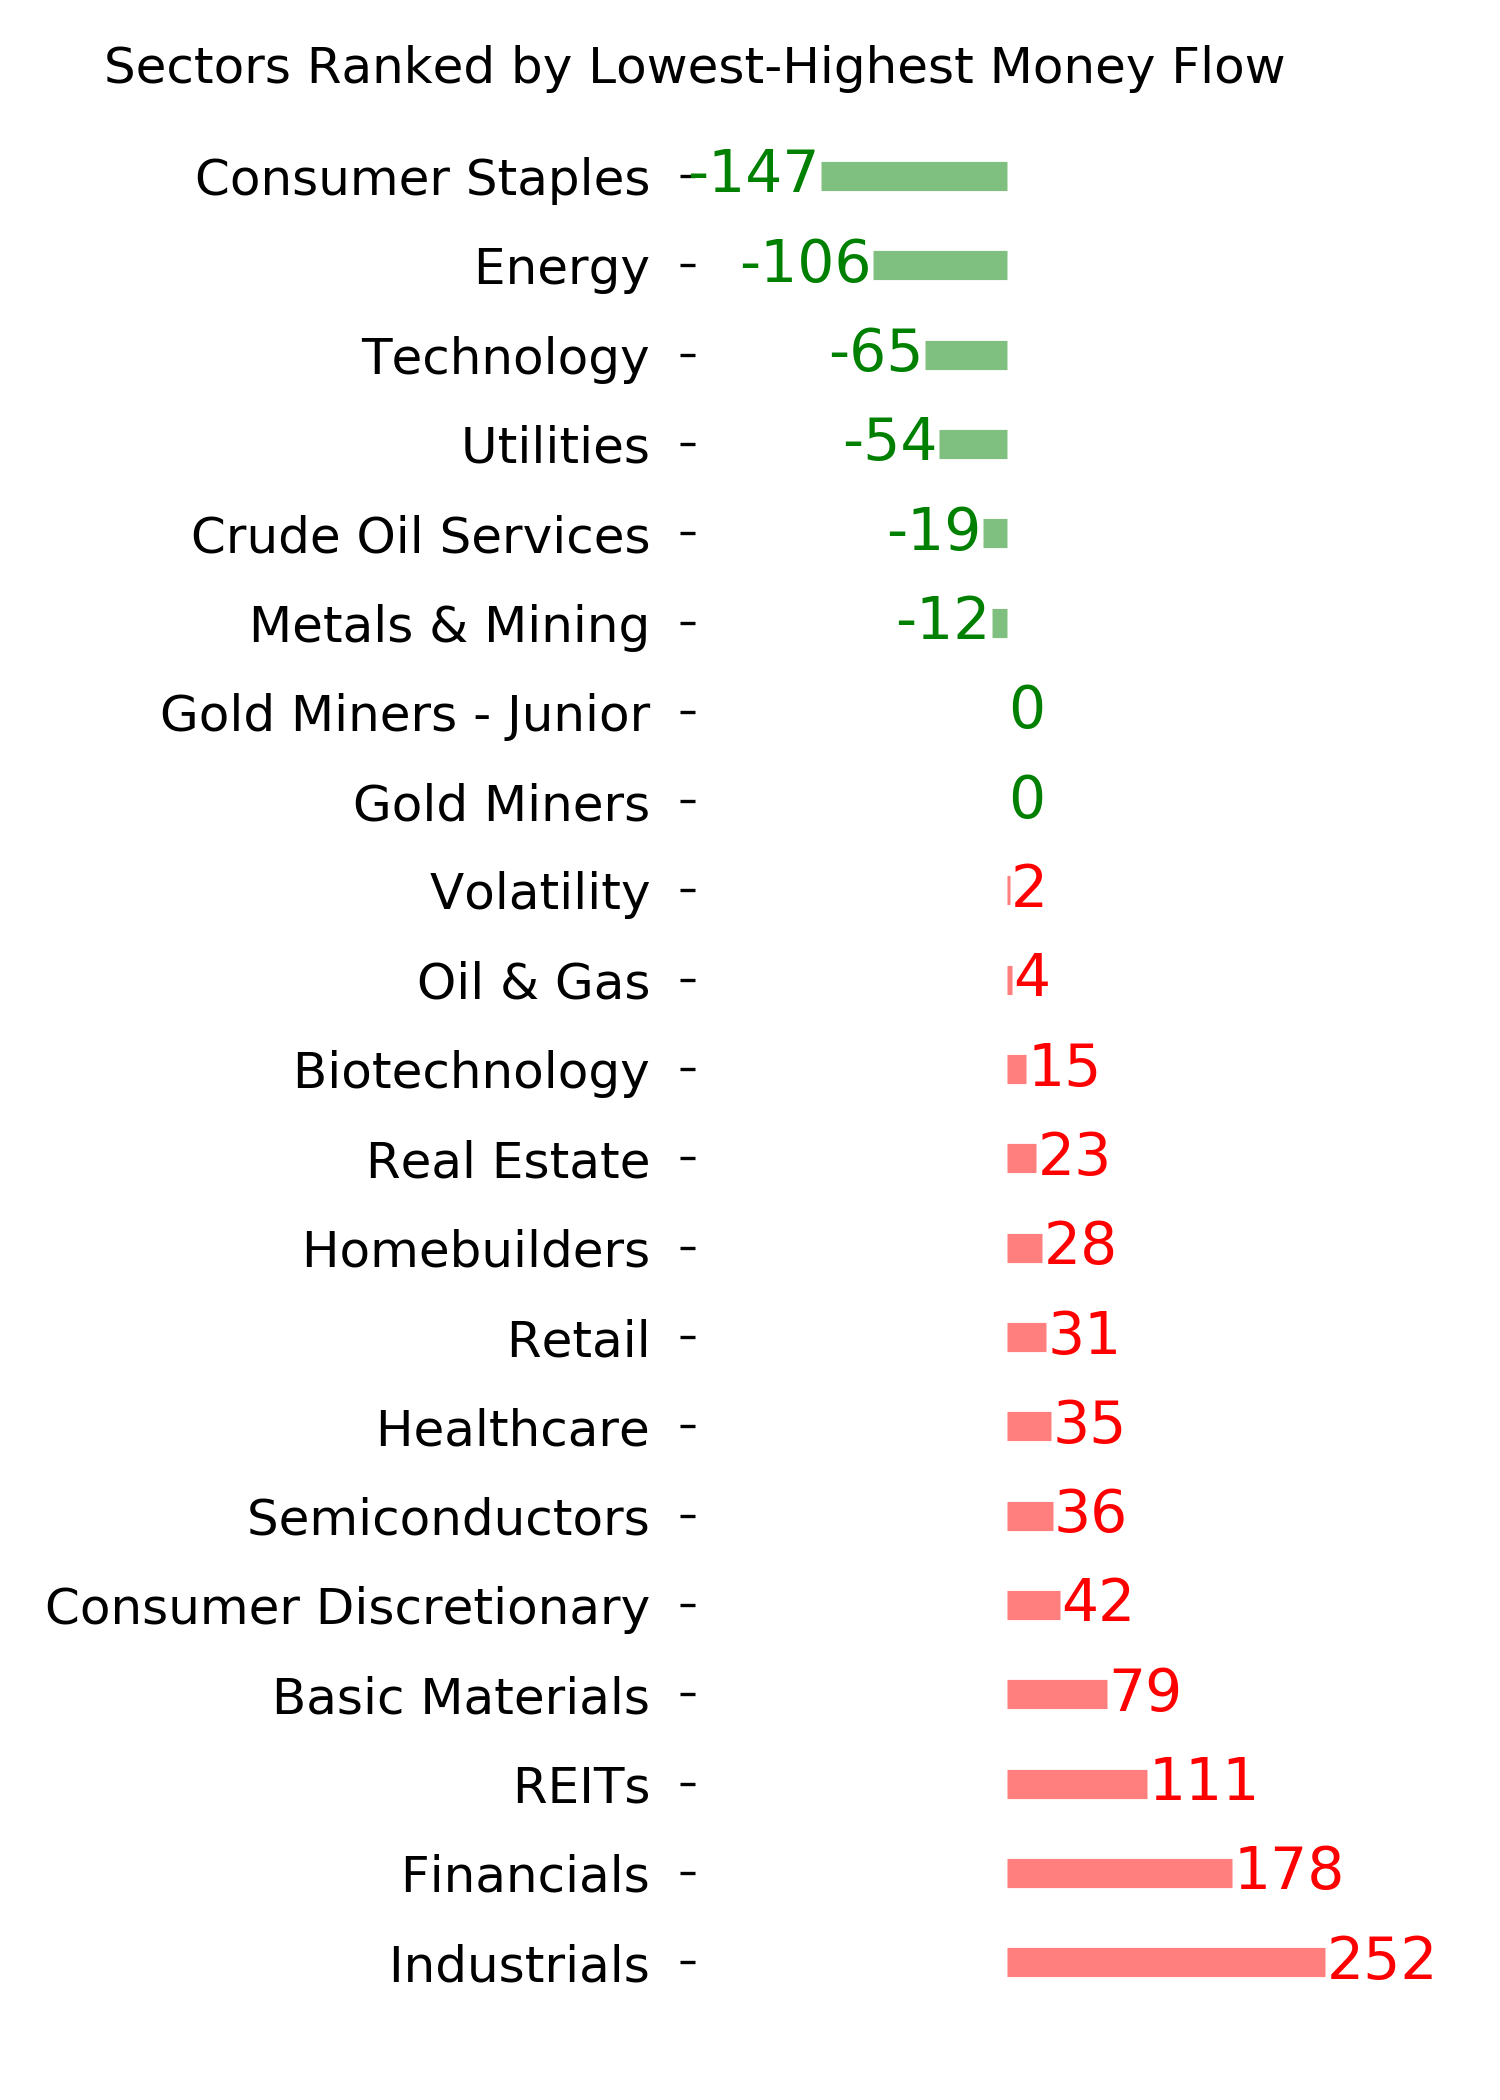
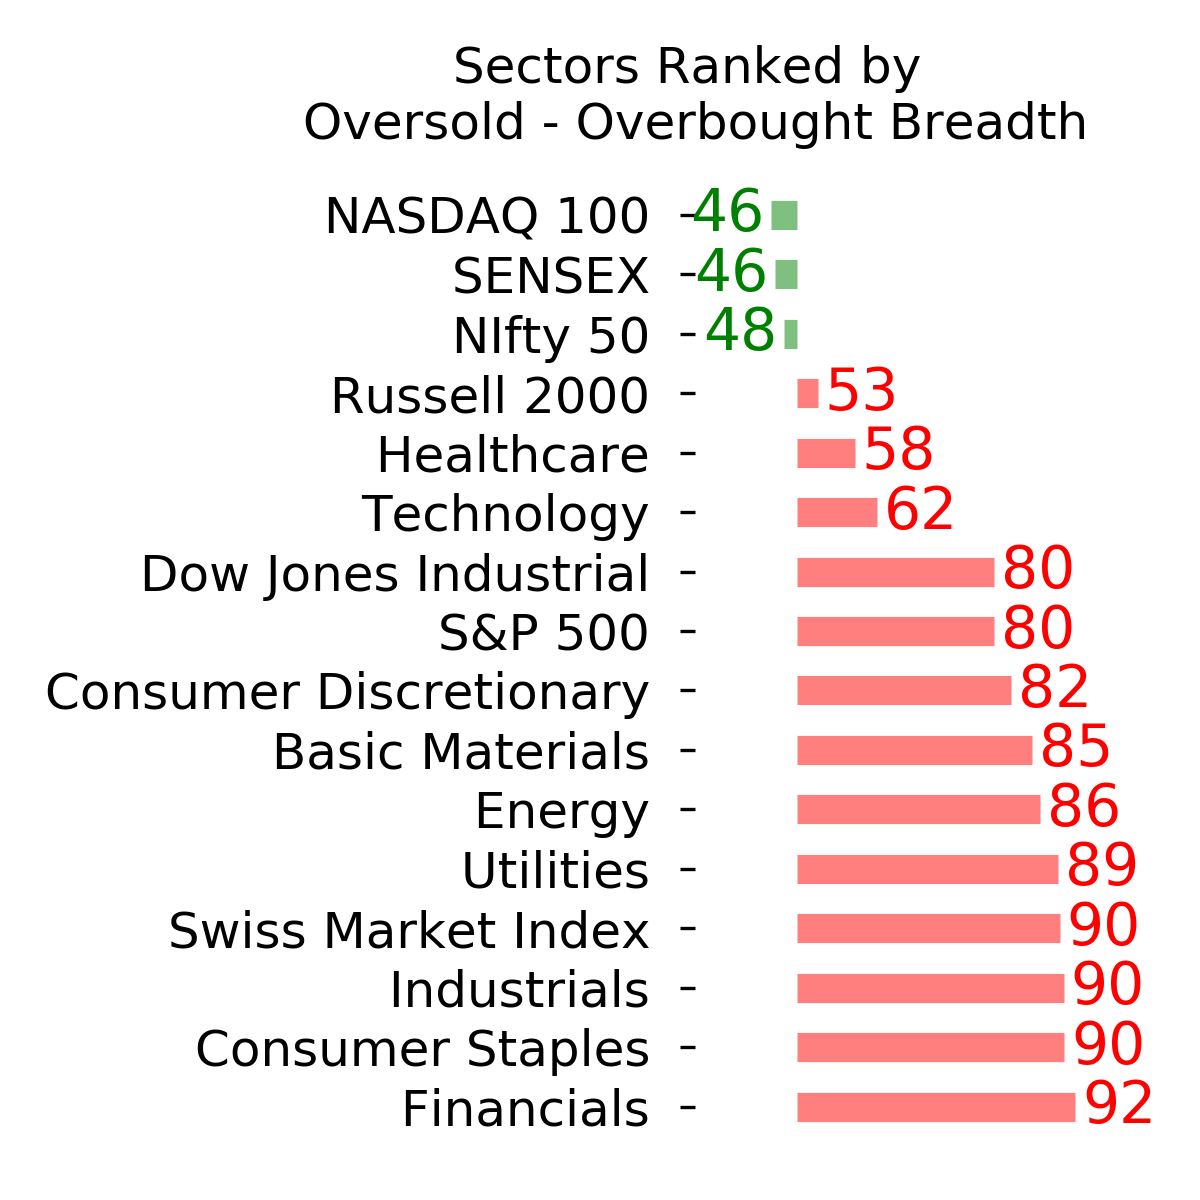
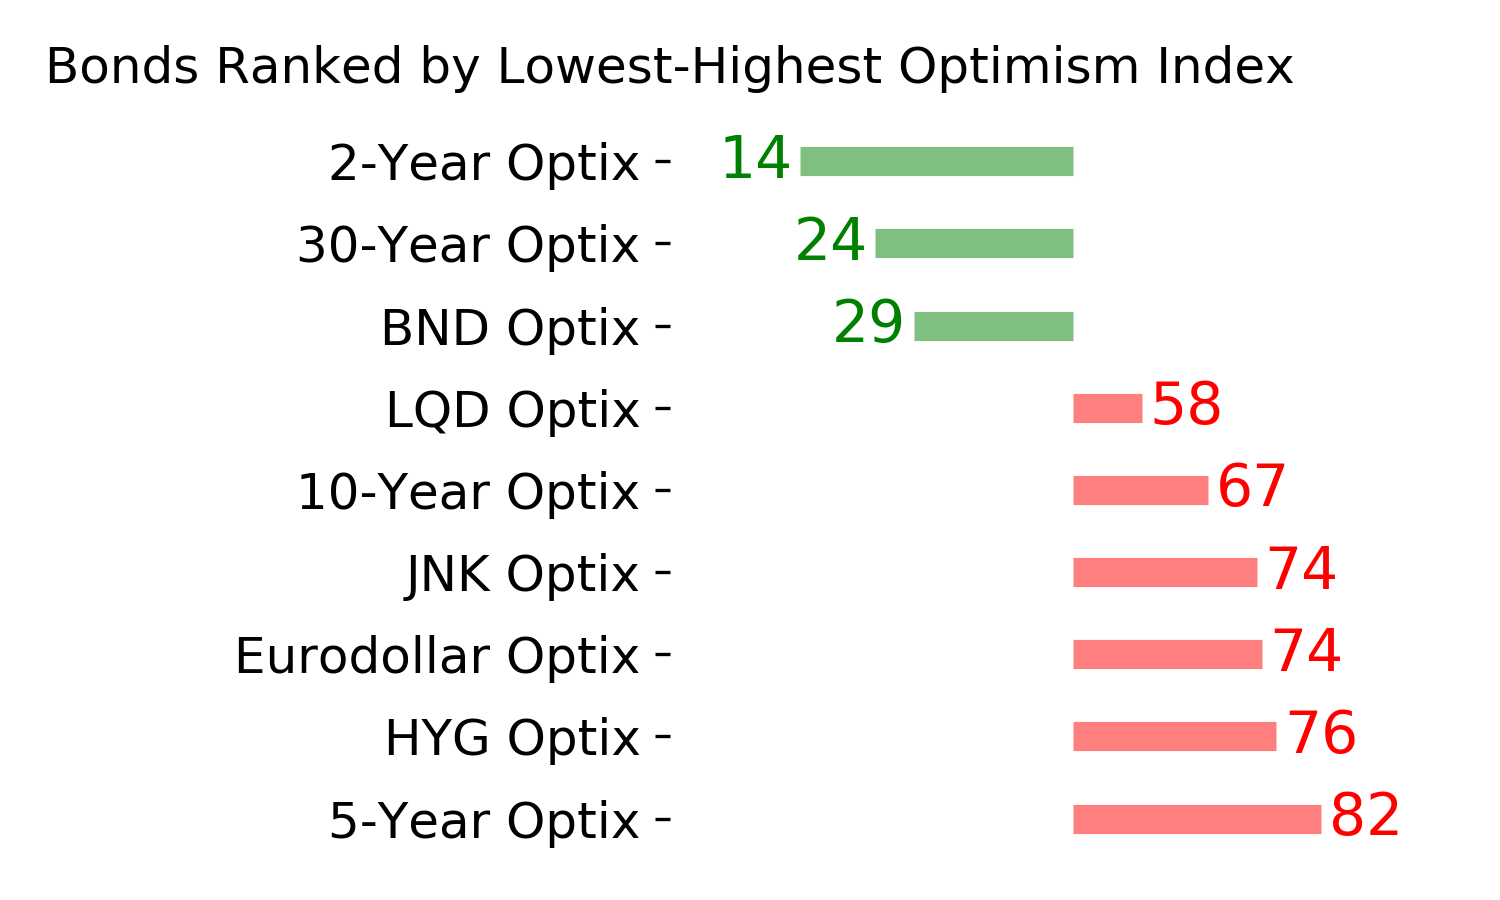
Optimism Index Thumbnails
|
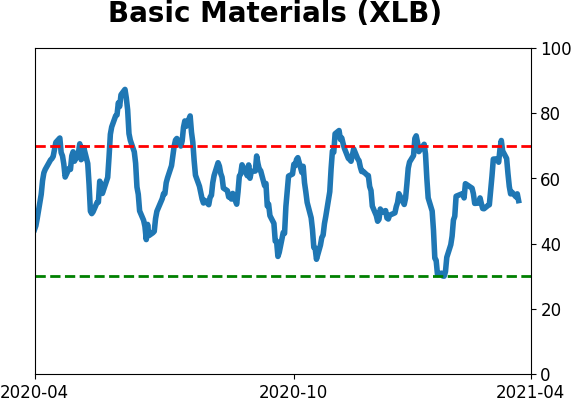
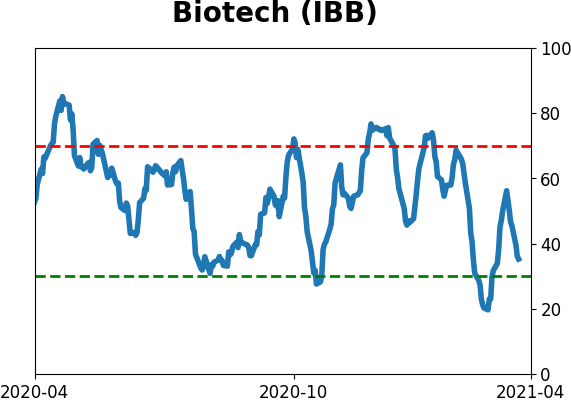
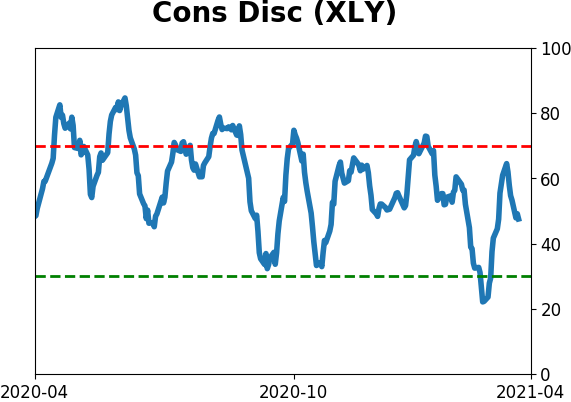
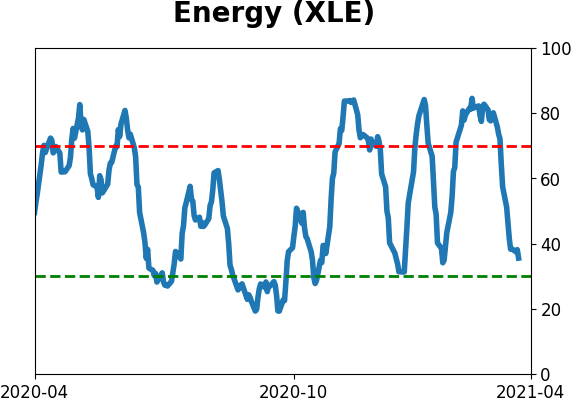
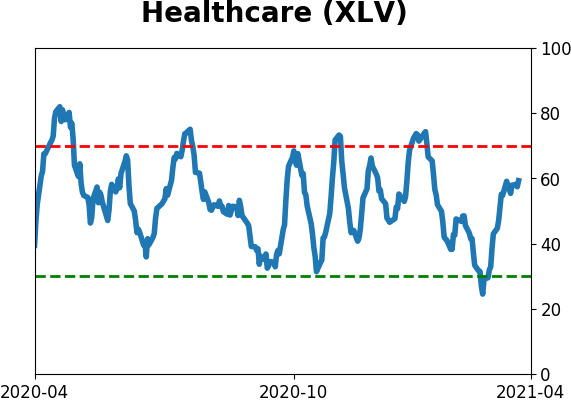
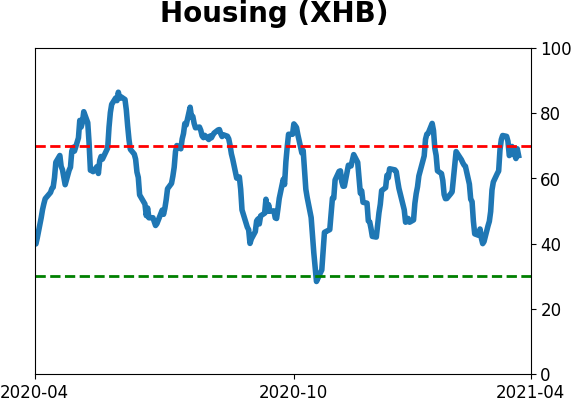
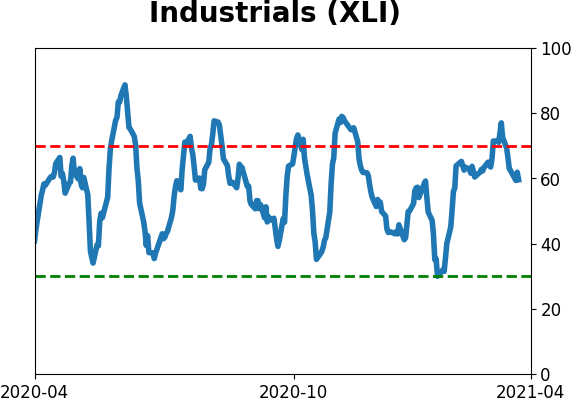
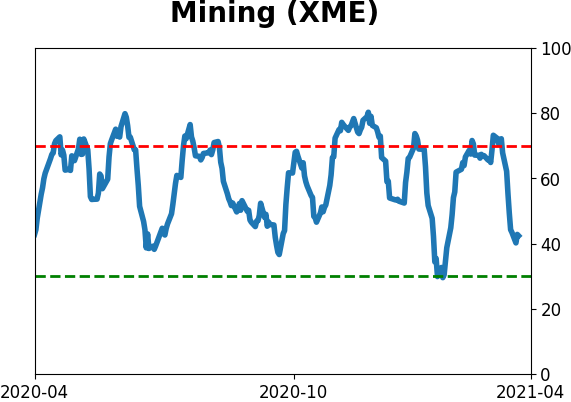
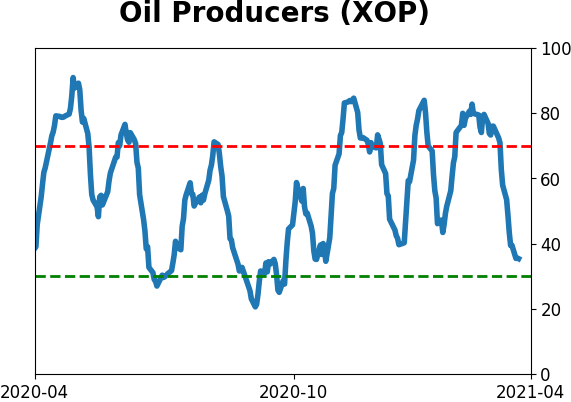
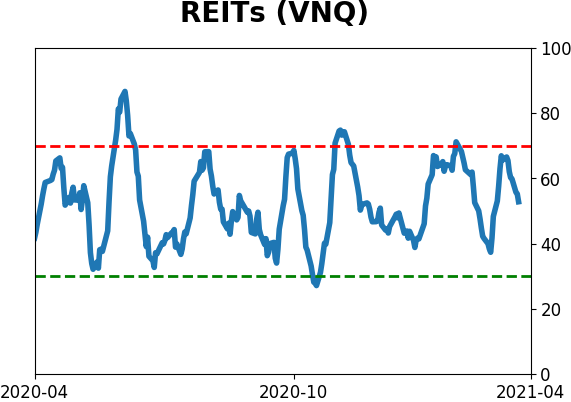
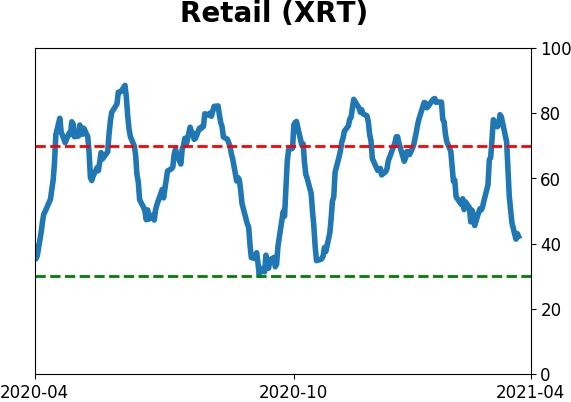
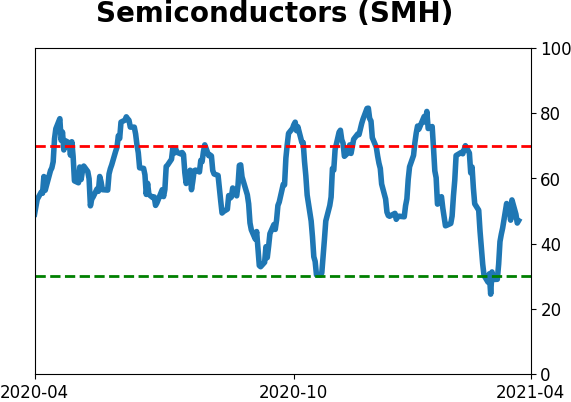
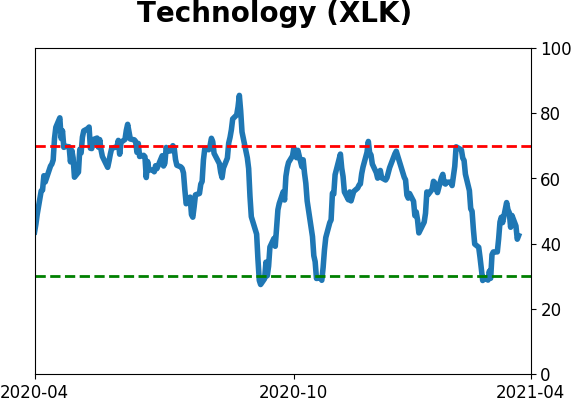
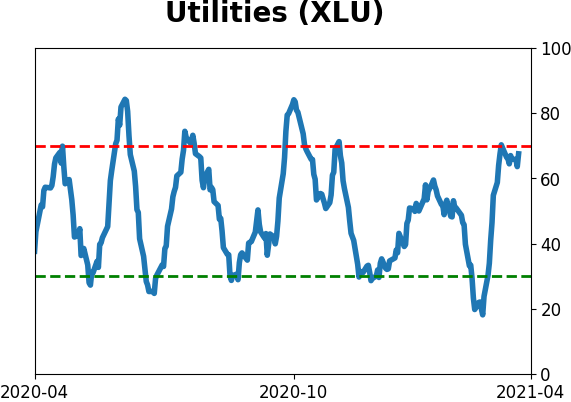
Sector ETF's - 10-Day Moving Average
|
|
|
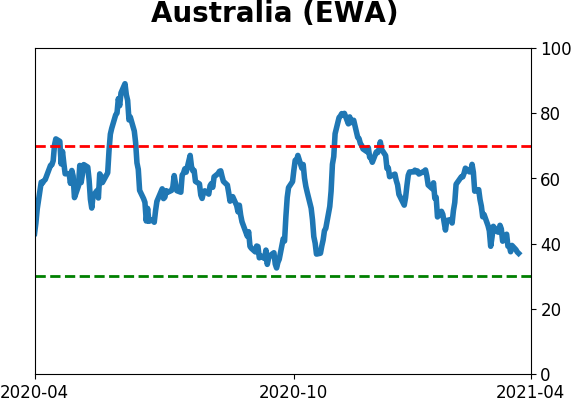
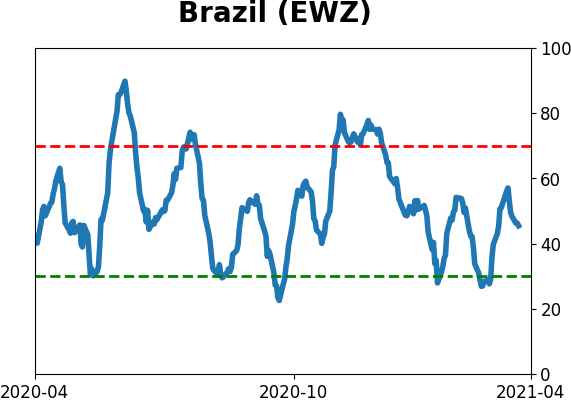
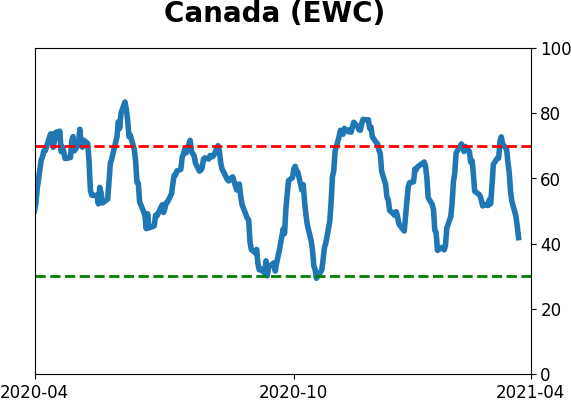
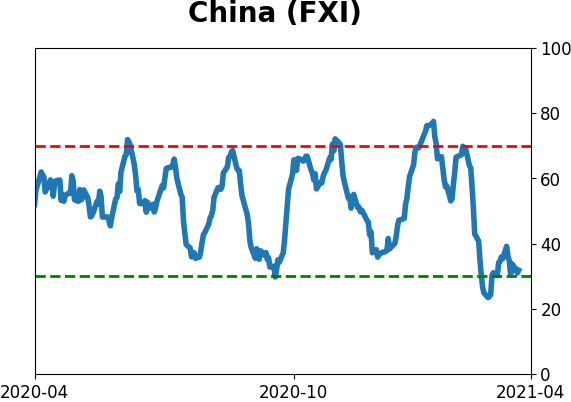
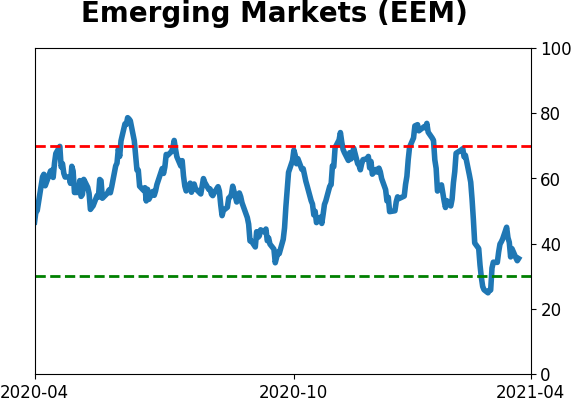
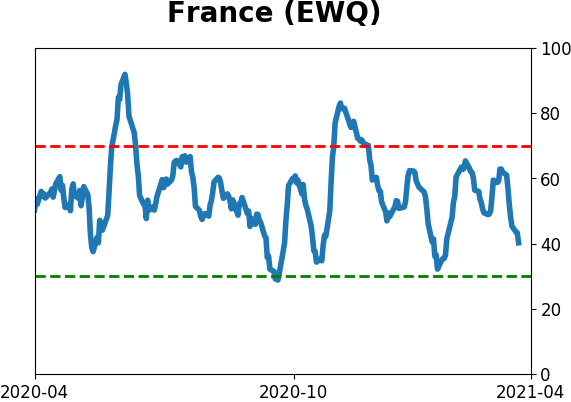
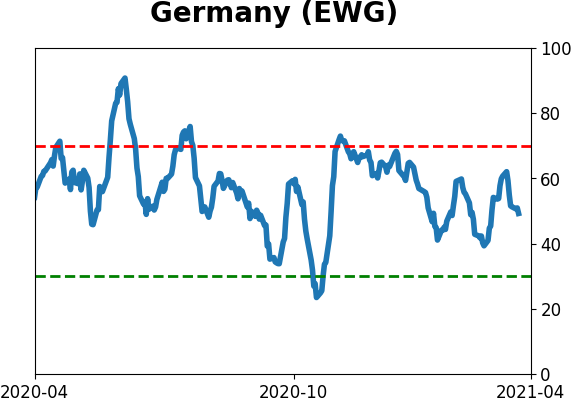
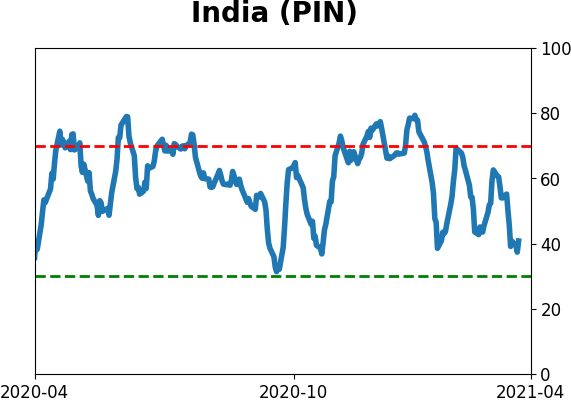
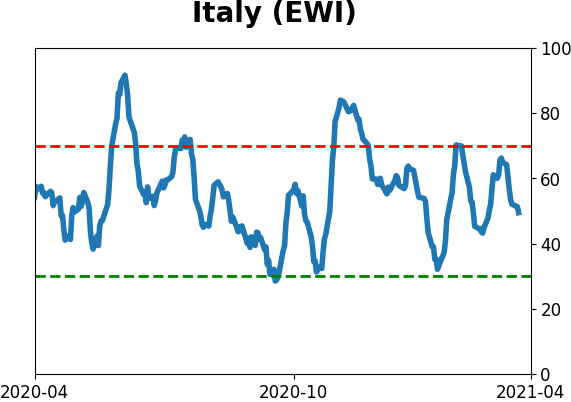
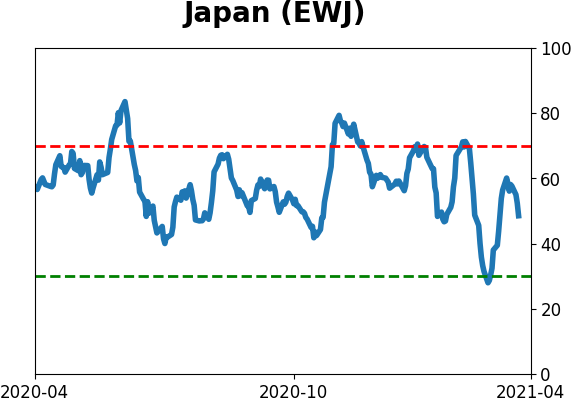
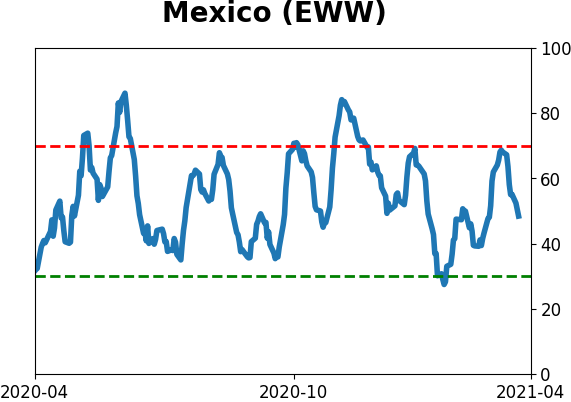
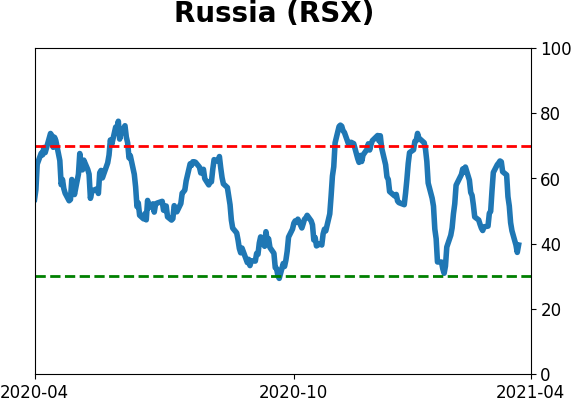
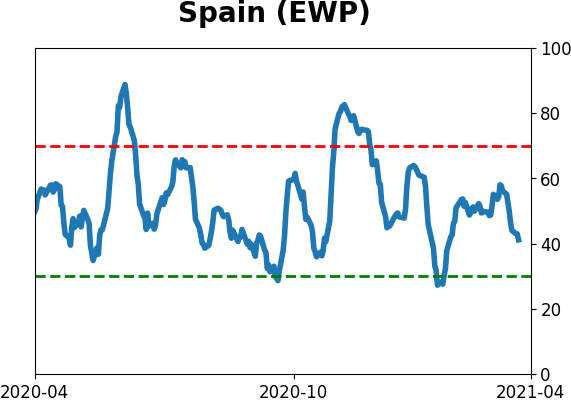
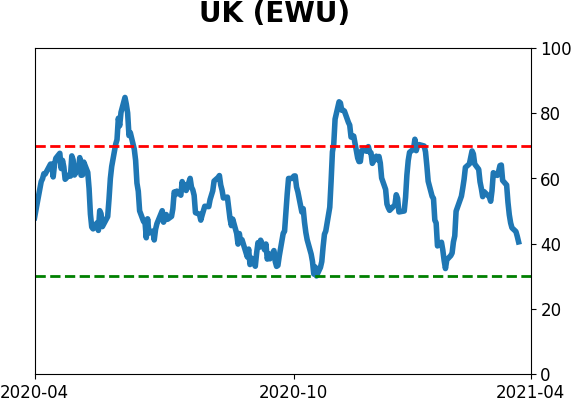
Country ETF's - 10-Day Moving Average
|
|
|
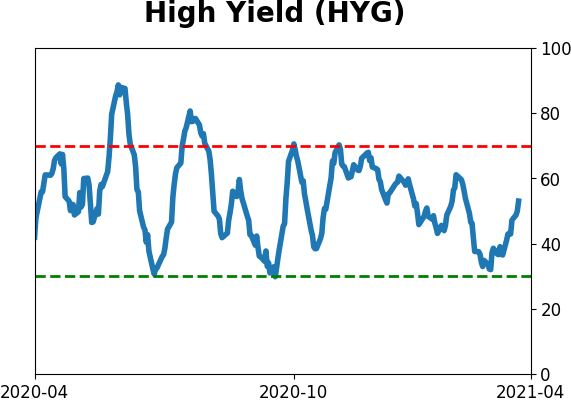
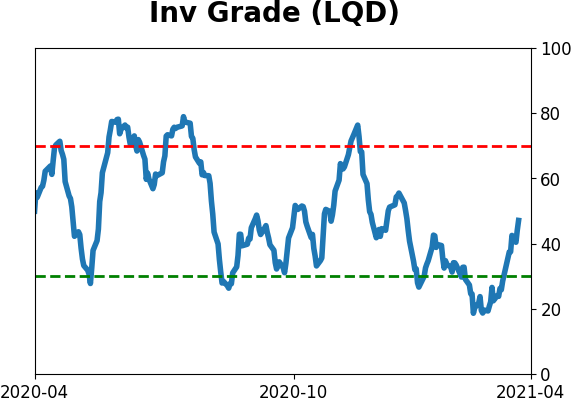
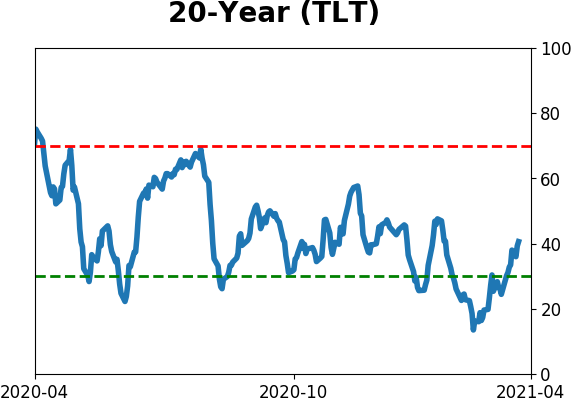
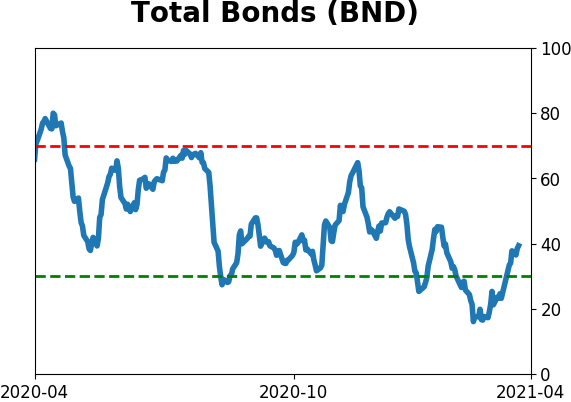
Bond ETF's - 10-Day Moving Average
|
|
|
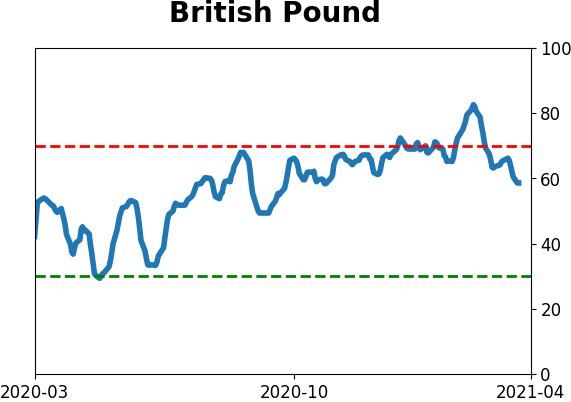
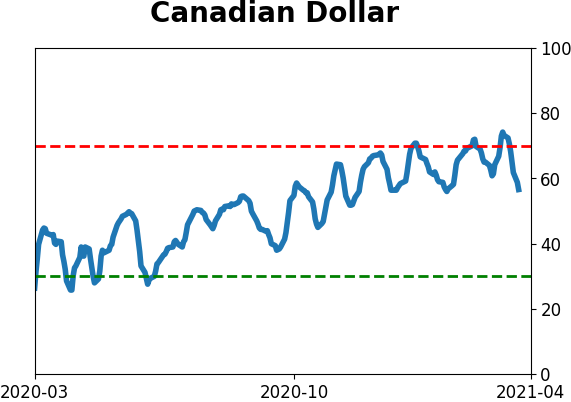
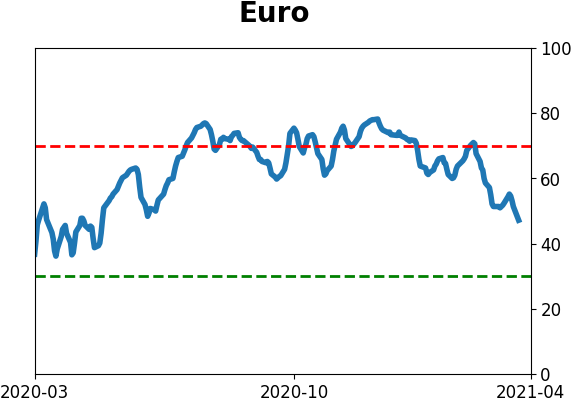
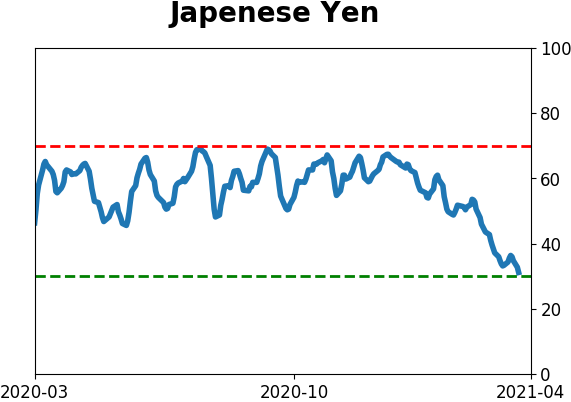
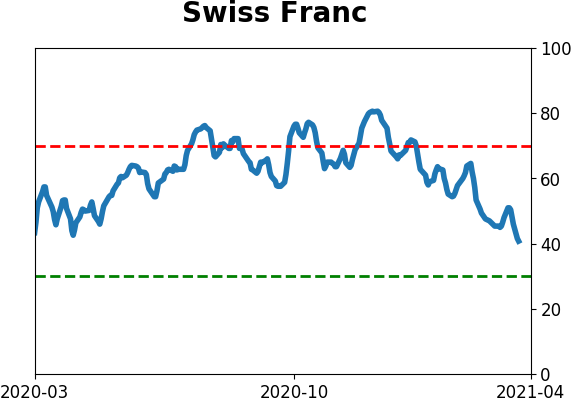
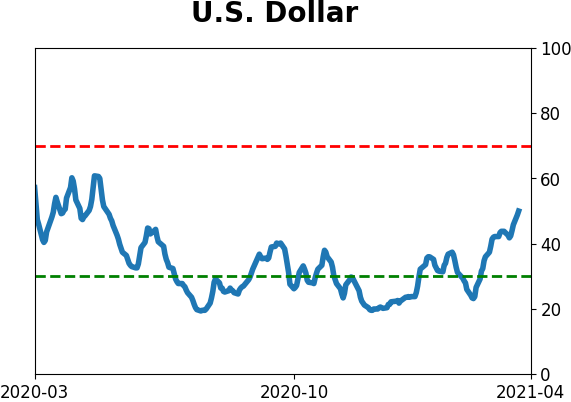
Currency ETF's - 5-Day Moving Average
|
|
|
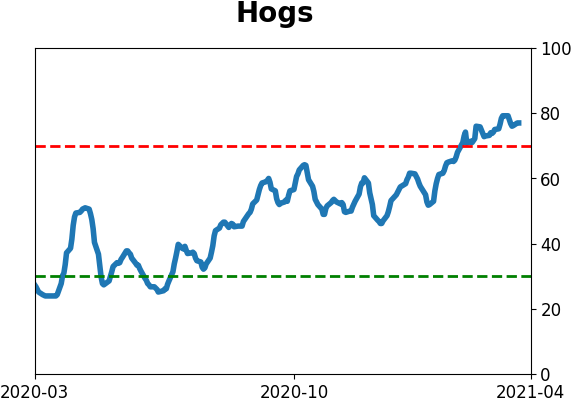
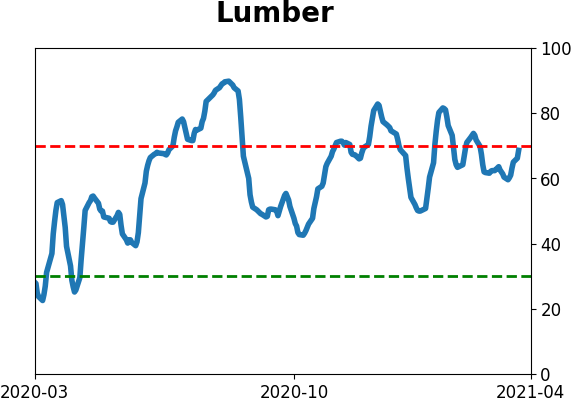
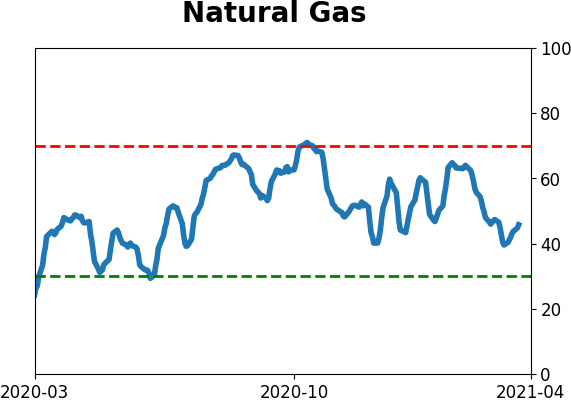
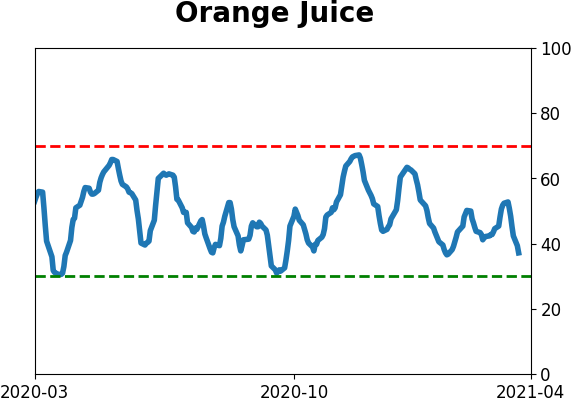
Commodity ETF's - 5-Day Moving Average
|
|