Headlines
|
|
Internal turmoil:
Despite indexes like the S&P 500 hitting new highs and holding close to them, there has been a lot of weakness under the surface, with low Up Issues on Monday, and persistently low McClellan Oscillator and Summation Index.
Bottom Line:
See the Outlook & Allocations page for more details on these summaries STOCKS: Weak sell
The extreme speculation registered in January and February is starting to get wrung out. Internal dynamics have mostly held up, so a return to neutral sentiment conditions would improve the forward risk/reward profile substantially. We're still a ways off from that. BONDS: Weak buy
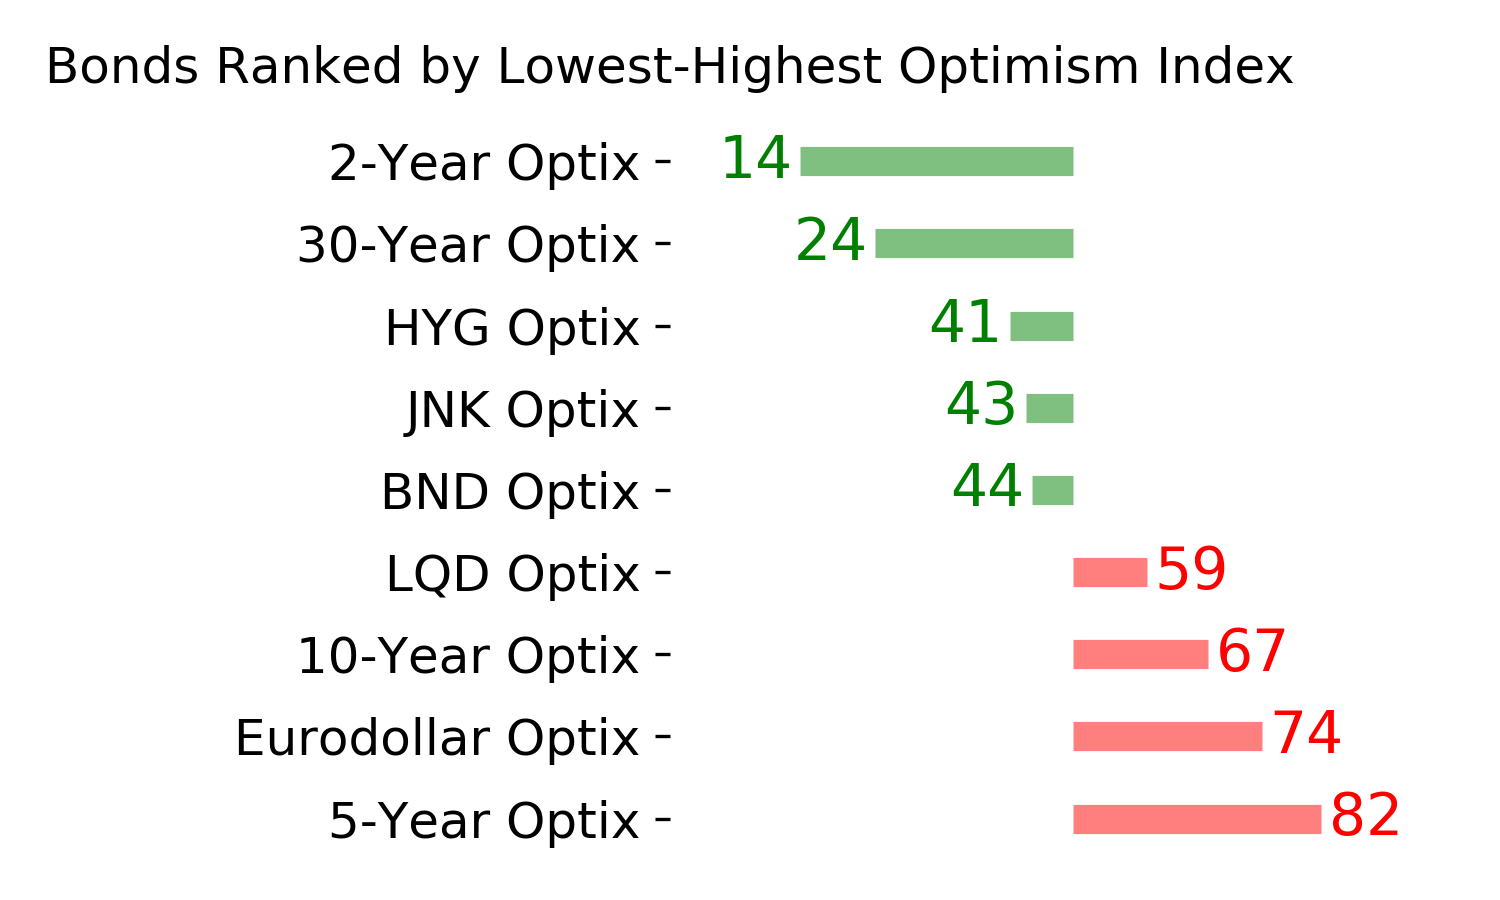
Various parts of the market have been hit in recent weeks, with mild oversold conditions. The Bond Optimism Index is now about as low as it gets during healthy bond market environments. Fixed income isn't responding well, so that needs to be monitored in case it's transitioning to a longer-term negative market environment. GOLD: Weak buy
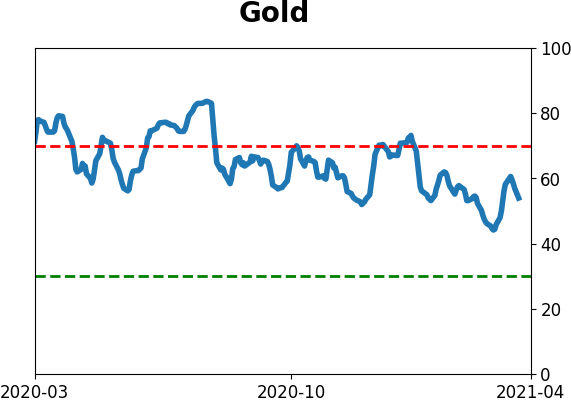
A dollar trying to rebound from a severe short position has weighed on gold and miners. The types of signals they've given in recent weeks, within the context of their recent surge, have usually resulted in higher prices over a medium- to long-term time frame. Like bonds, gold and miners aren't responding very well, and this needs to be monitored.
|
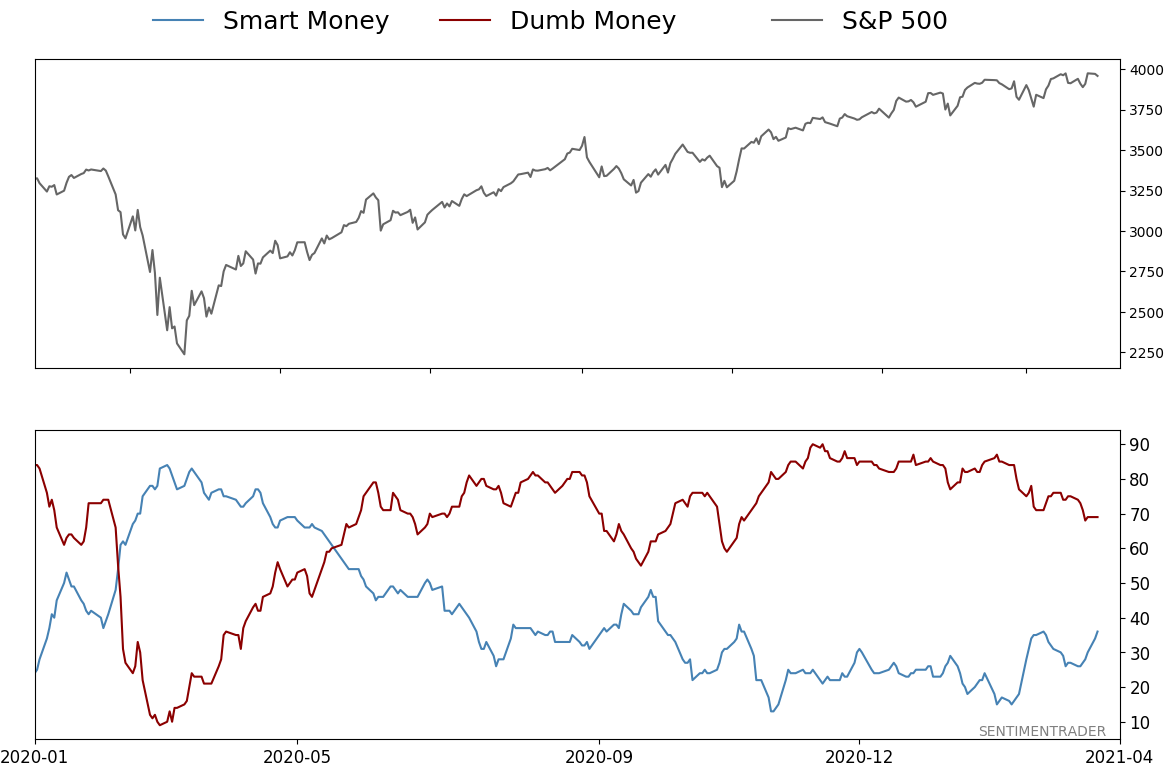
Smart / Dumb Money Confidence
|
Smart Money Confidence: 36%
Dumb Money Confidence: 69%
|
|
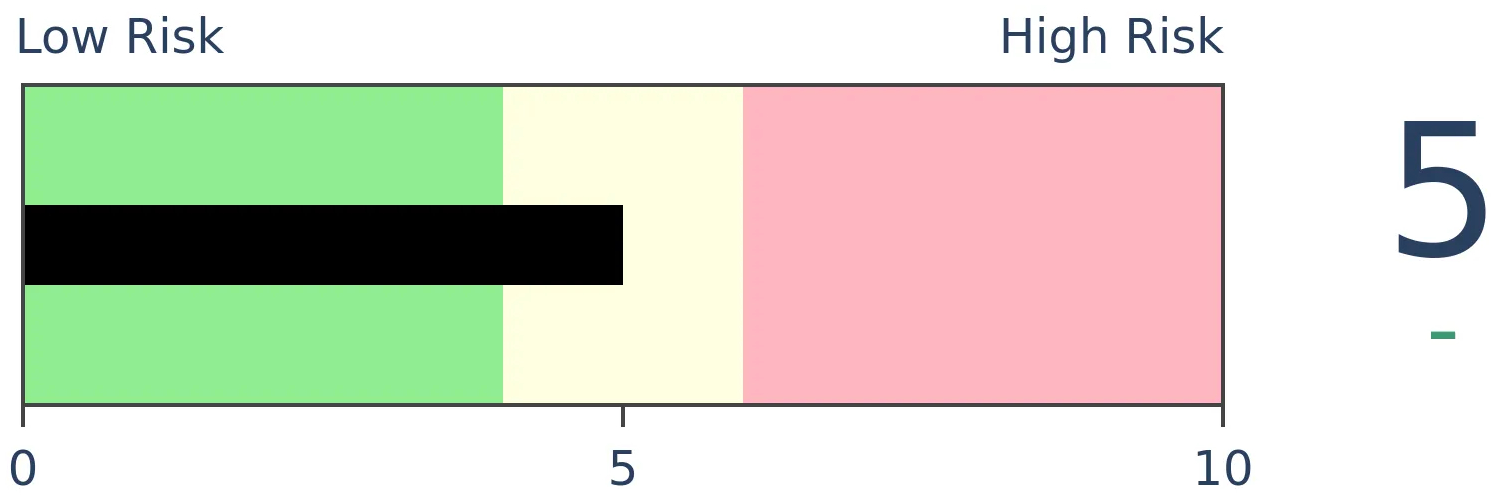
Risk Levels
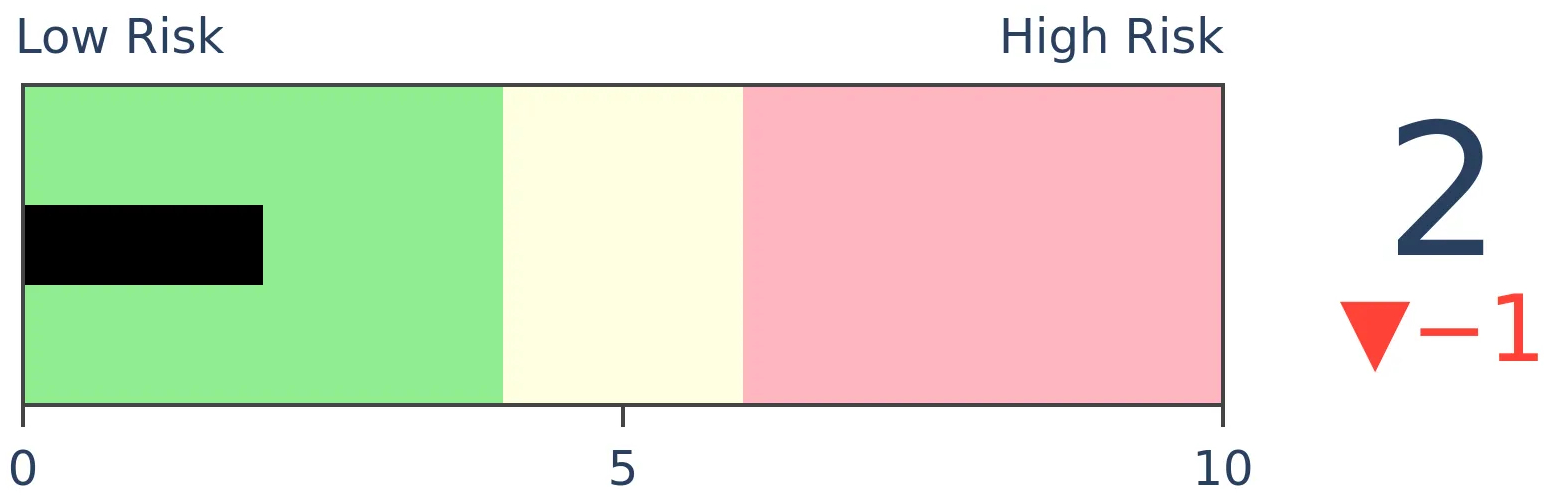
Stocks Short-Term
|
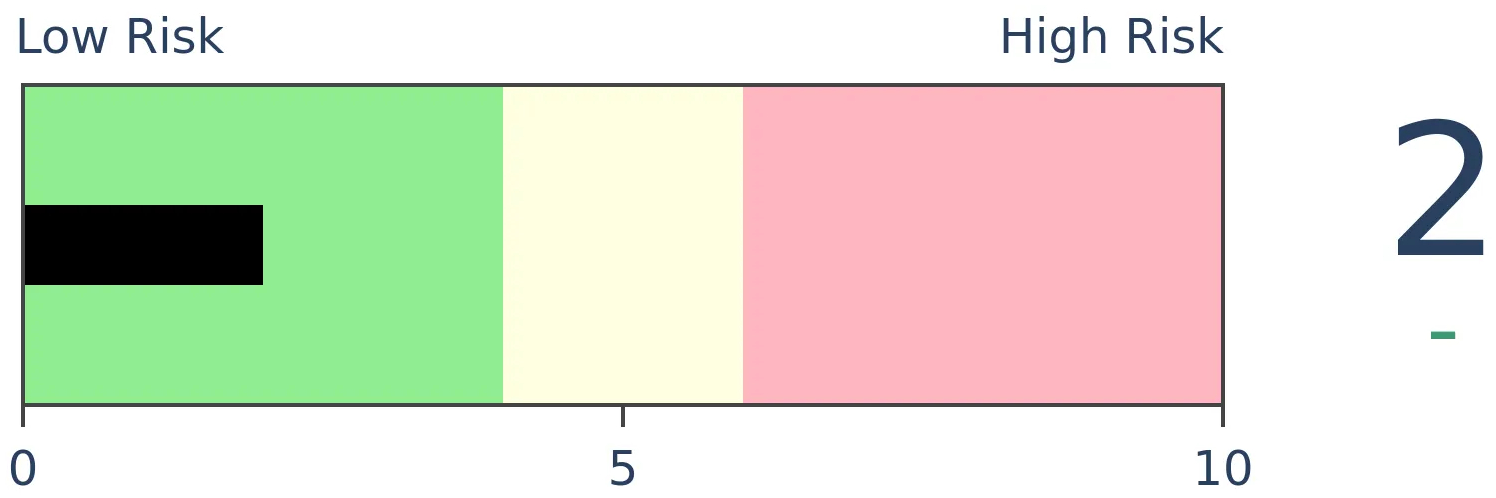
Stocks Medium-Term

|
|
Bonds
|
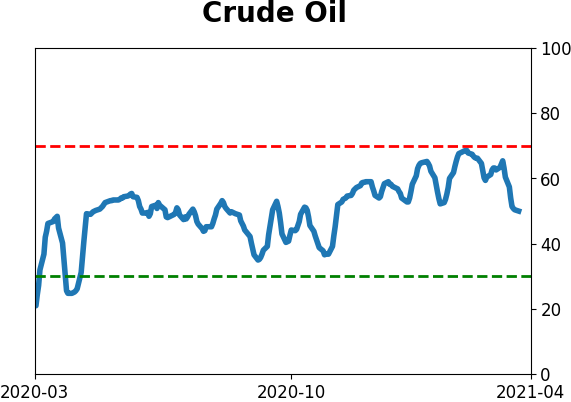
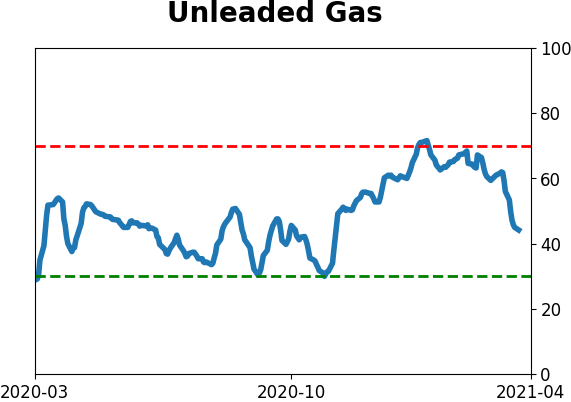
Crude Oil

|
|
Gold
|
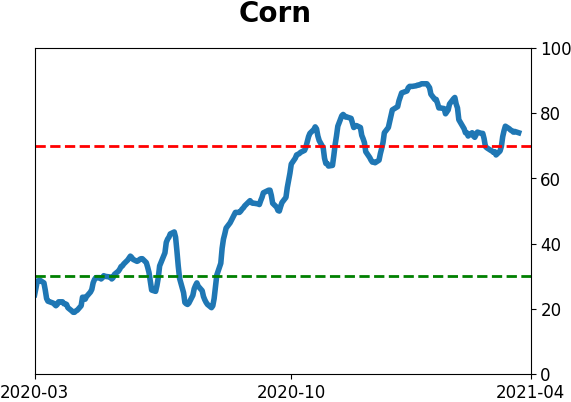
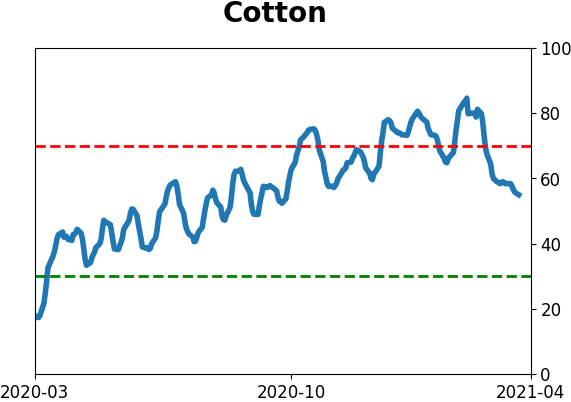
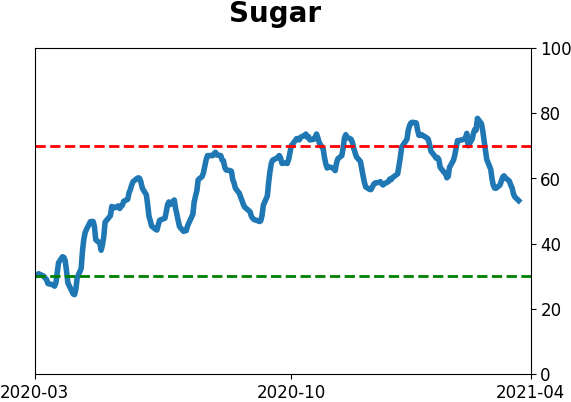
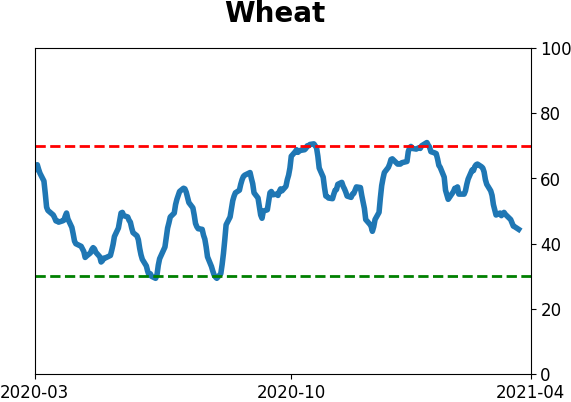
Agriculture

|
|
Research
BOTTOM LINE
Despite indexes like the S&P 500 hitting new highs and holding close to them, there has been a lot of weakness under the surface, with low Up Issues on Monday, and persistently low McClellan Oscillator and Summation Index.
FORECAST / TIMEFRAME
None
|
It's always sketchy to make a big deal about a single trading session, especially in relation to drawing conclusions about future returns. Markets are too noisy, and sometimes there is a market event that throws things out of whack for a day or two.
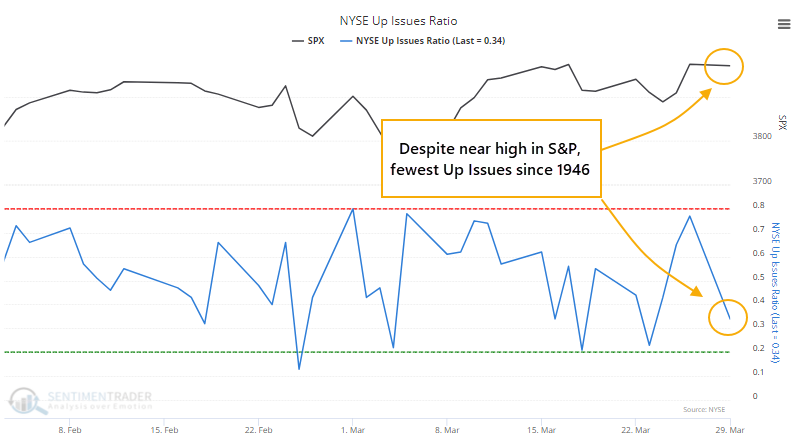
At the risk of that, let's make a big deal about Monday.
In the Daily Report, we saw that despite the S&P 500 closing within 0.1% of a record high on Monday, fewer than 35% of securities on the NYSE managed to close above their closing price from Friday. That was the weakest Up Issues Ratio since at least 1960 for a day the S&P was so near a high. Going back further, we hadn't seen behavior like this since 1946.
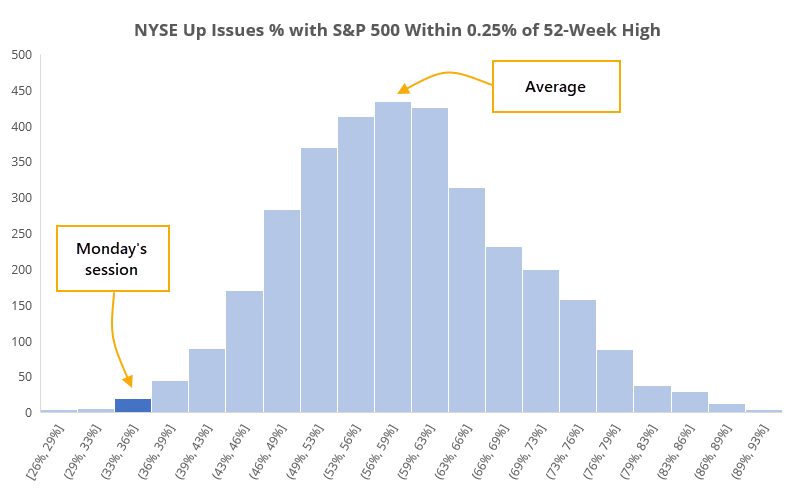
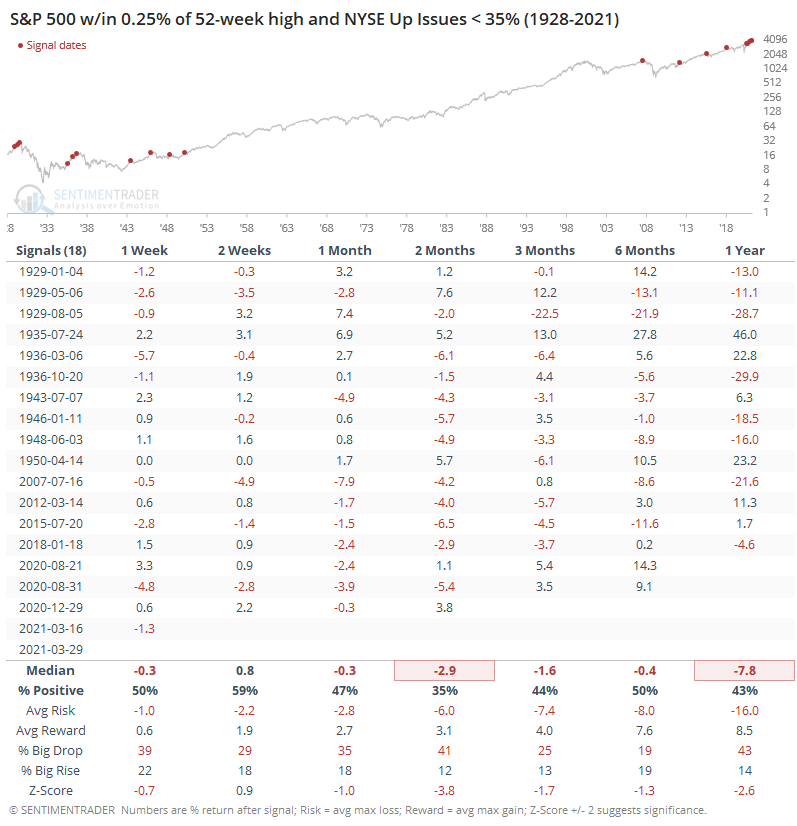
Since 1928, when the S&P 500 was within 0.25% of a 52-week high, an average of 58% of securities on the NYSE advanced for the day. There have been 3,331 days when the S&P was that close to a high, and the histogram below shows just how unusual Monday's session was.
In terms of what those weak days meant for forward returns, the table below shows us that the S&P had some trouble holding near its highs when so many stocks had been declining under the surface. Every signal in the past 30 years showed a negative 1-month return.
It's not just Monday, though. Over the past week, even with the S&P ticking a new high on Friday, the McClellan Oscillator has been deeply negative.
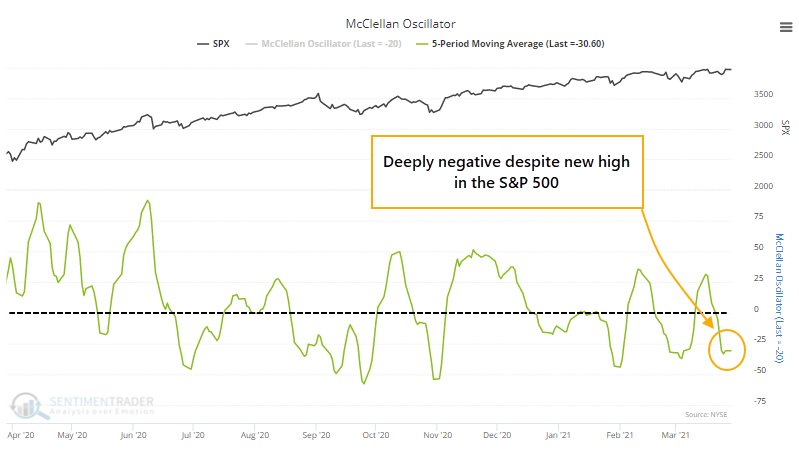
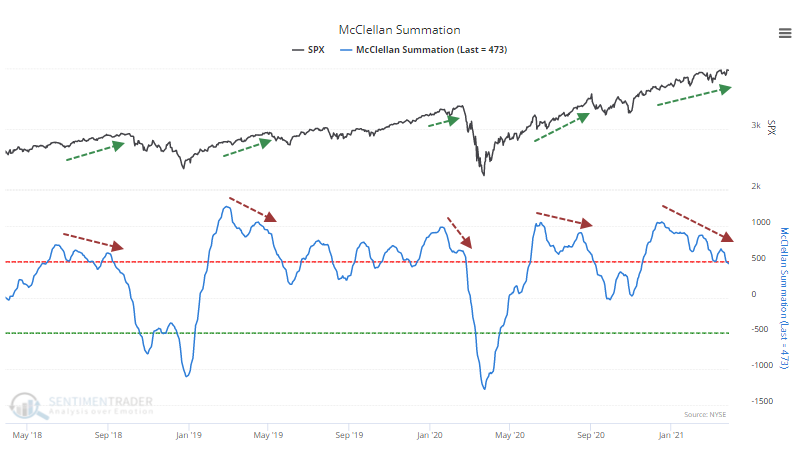
This means that the longer-term McClellan Summation Index has been dropping and diverging from price.
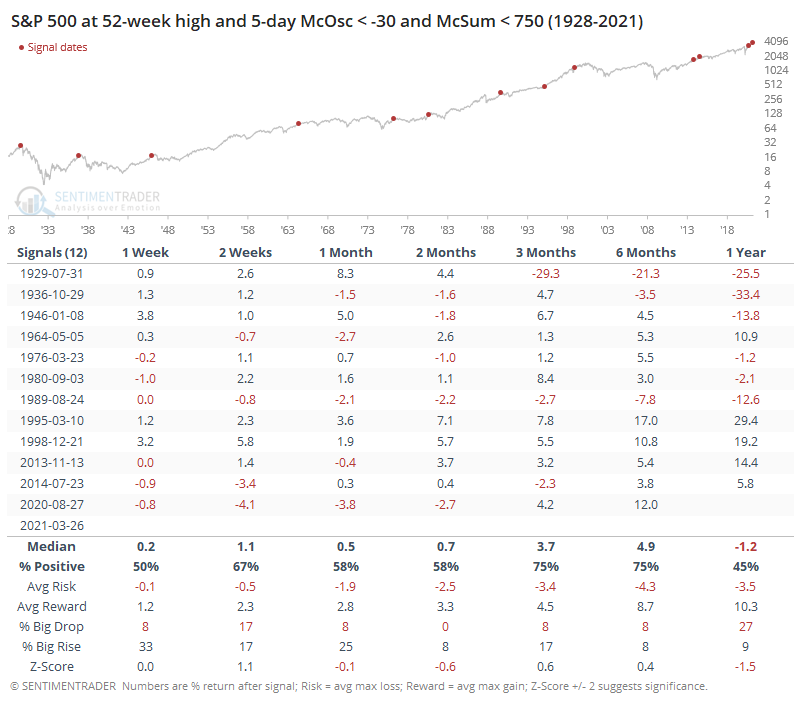
While not as consistent, again the S&P had some trouble consistently maintaining upside momentum under similar conditions. The two biggest exceptions were in 1995 and 1998. Really, those were the only exceptions.
Ever since we started to generate optimistic extremes months ago, we've been on the lookout for oddities like this, signs of internal weakness and deterioration that wouldn't necessarily be visible if we were just watching the price action of major indexes. There were some spotty examples in January, but those ended up getting resolved with more strength.
We're still not seeing broad-based internal weakness, at least enough to generate major warning signs. But the more we see activity like Monday, and continued weakness in measures like the Oscillator and Summation Index, the higher we'll end up generating more of those warnings.
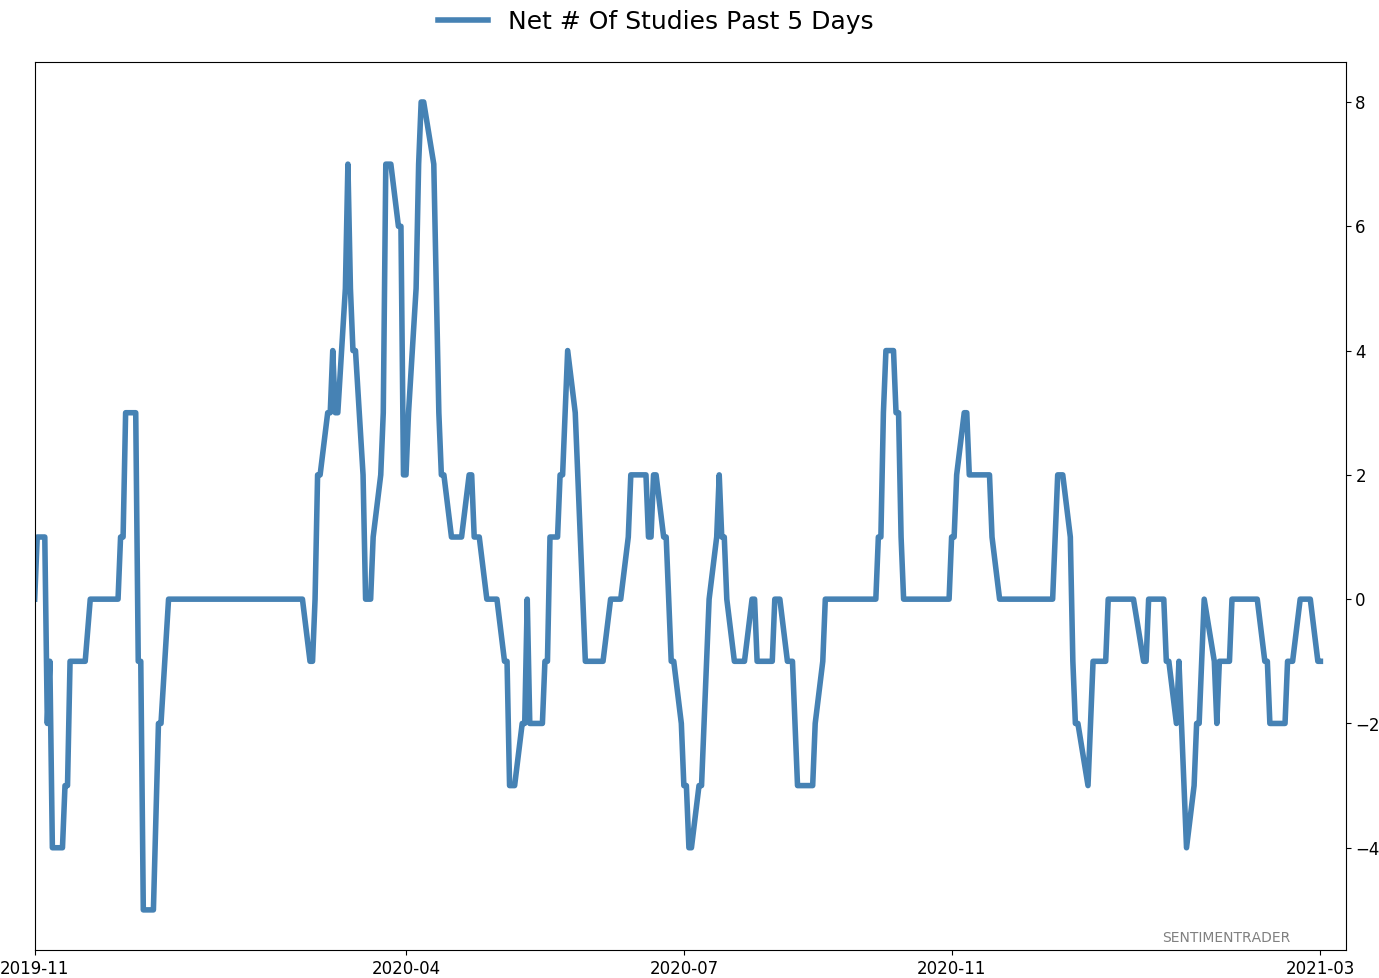
Active Studies
| Time Frame | Bullish | Bearish | | Short-Term | 0 | 0 | | Medium-Term | 0 | 10 | | Long-Term | 11 | 4 |
|
Indicators at Extremes
Portfolio
| Position | Description | Weight % | Added / Reduced | Date | | Stocks | RSP | 4.9 | Reduced 4% | 2021-02-09 | | Bonds | 30.0% BND, 8.8% SCHP | 38.8 | Added 15.1% | 2021-02-18 | | Commodities | GCC | 2.3 | Reduced 2.1%
| 2020-09-04 | | Precious Metals | GDX | 9.0 | Added 0.1% | 2021-02-18 | | Special Situations | 7.3% XLE, 4.8% PSCE | 12.1 | Reduced 5.6% | 2021-02-18 | | Cash | | 32.8 | | |
|
Updates (Changes made today are underlined)
With a market that has seen the kinds of broad participation and big breath thrusts like we did in the fall, it's hard to become too negative. Those kinds of conditions have consistently preceded higher returns over the next 6-12 months. It's the interim that's more of an issue. Even conditions like that haven't prevented some shorter-term pullbacks. And when we combine an environment where speculation is rampant and recent days have seen an increase in cracks under the surface of the indexes, it's enough to become more defensive over a short- to medium-term time frame. We still don't have much confirmation from the price action in the indexes, so those who are more conservative would likely wait before increasing cash levels. I've decreased risk exposure a bit more, mainly in terms of energy stocks and the ANGL fund, while adding more to the broader bond market. RETURN YTD: 5.5% 2020: 8.1%, 2019: 12.6%, 2018: 0.6%, 2017: 3.8%, 2016: 17.1%, 2015: 9.2%, 2014: 14.5%, 2013: 2.2%, 2012: 10.8%, 2011: 16.5%, 2010: 15.3%, 2009: 23.9%, 2008: 16.2%, 2007: 7.8%
|
|
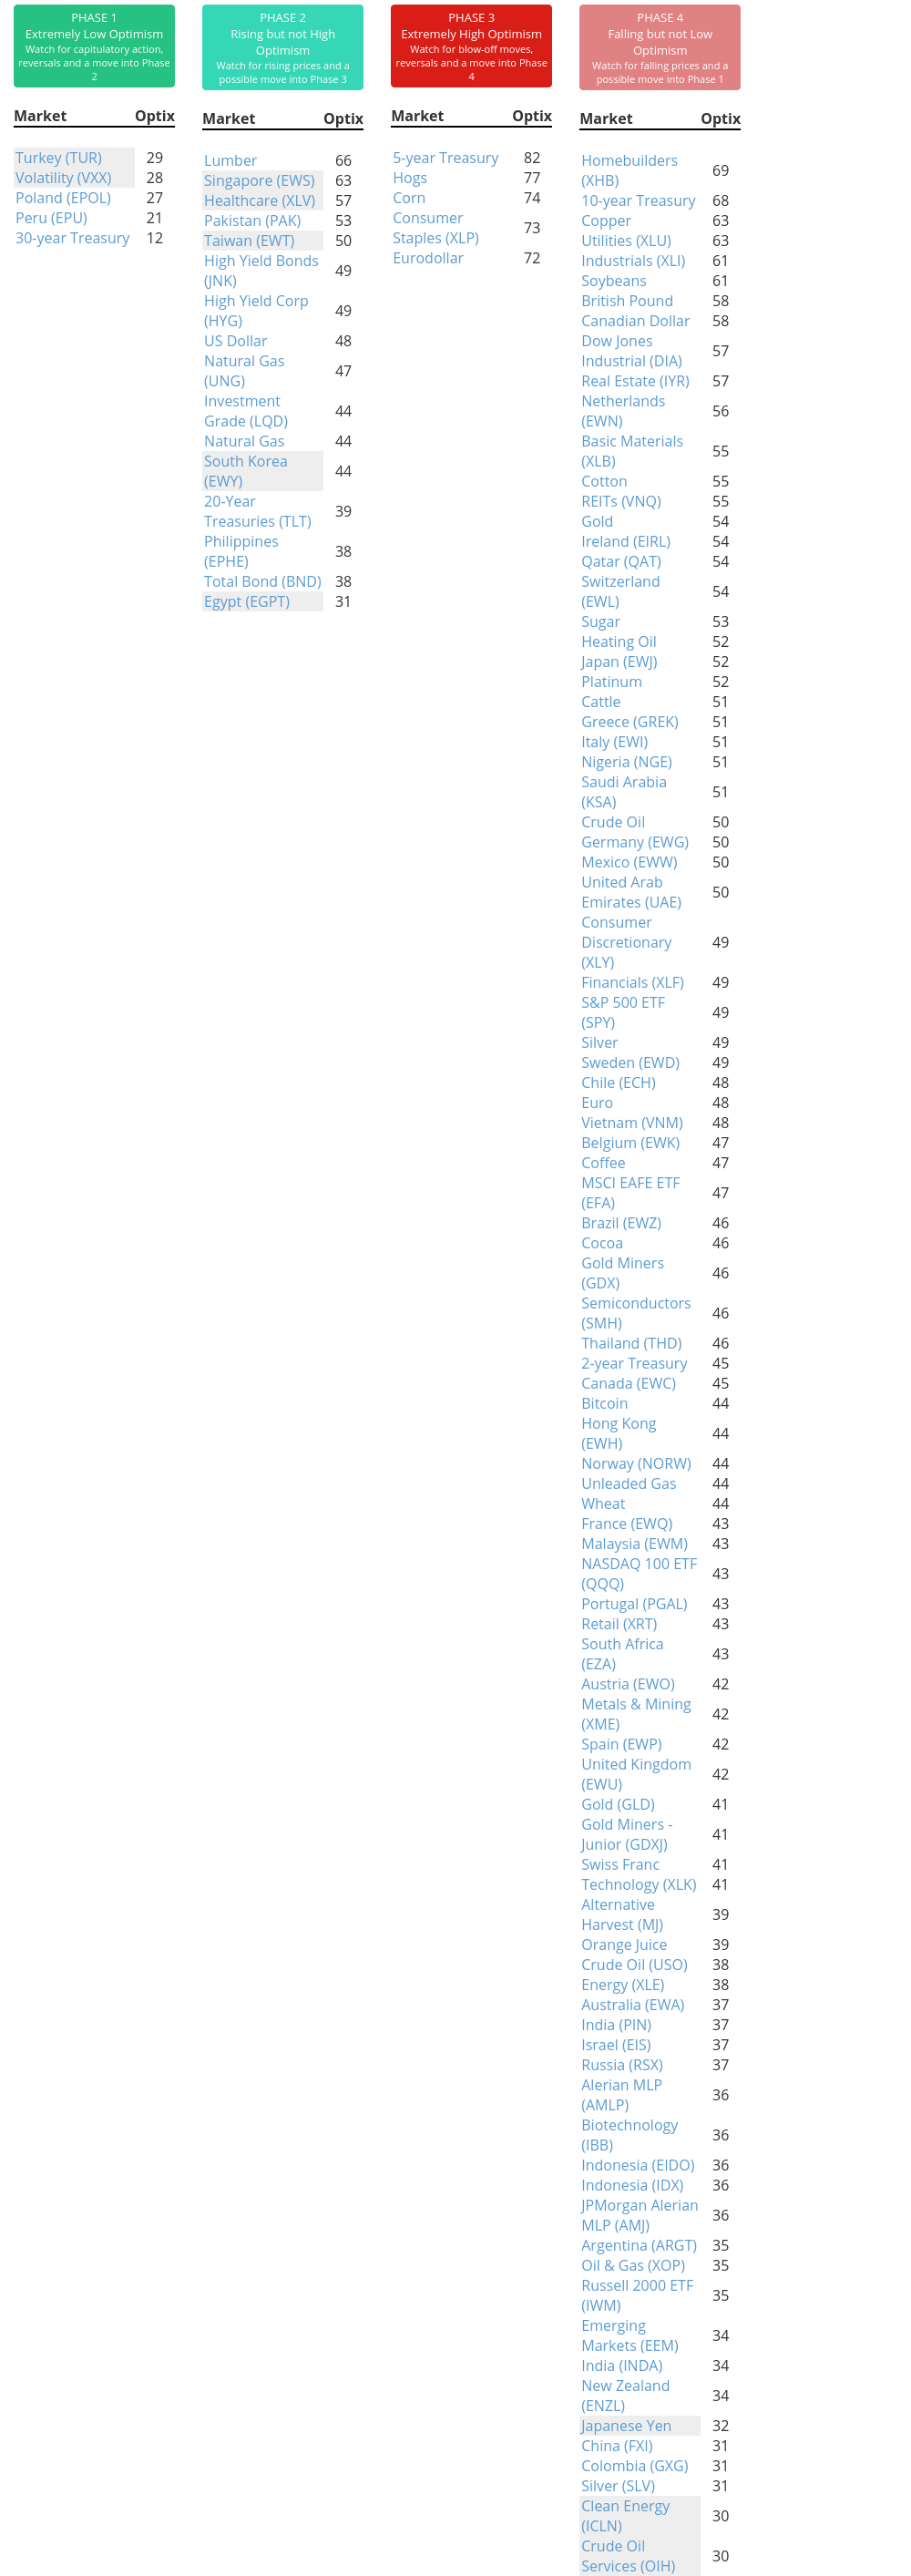
Phase Table
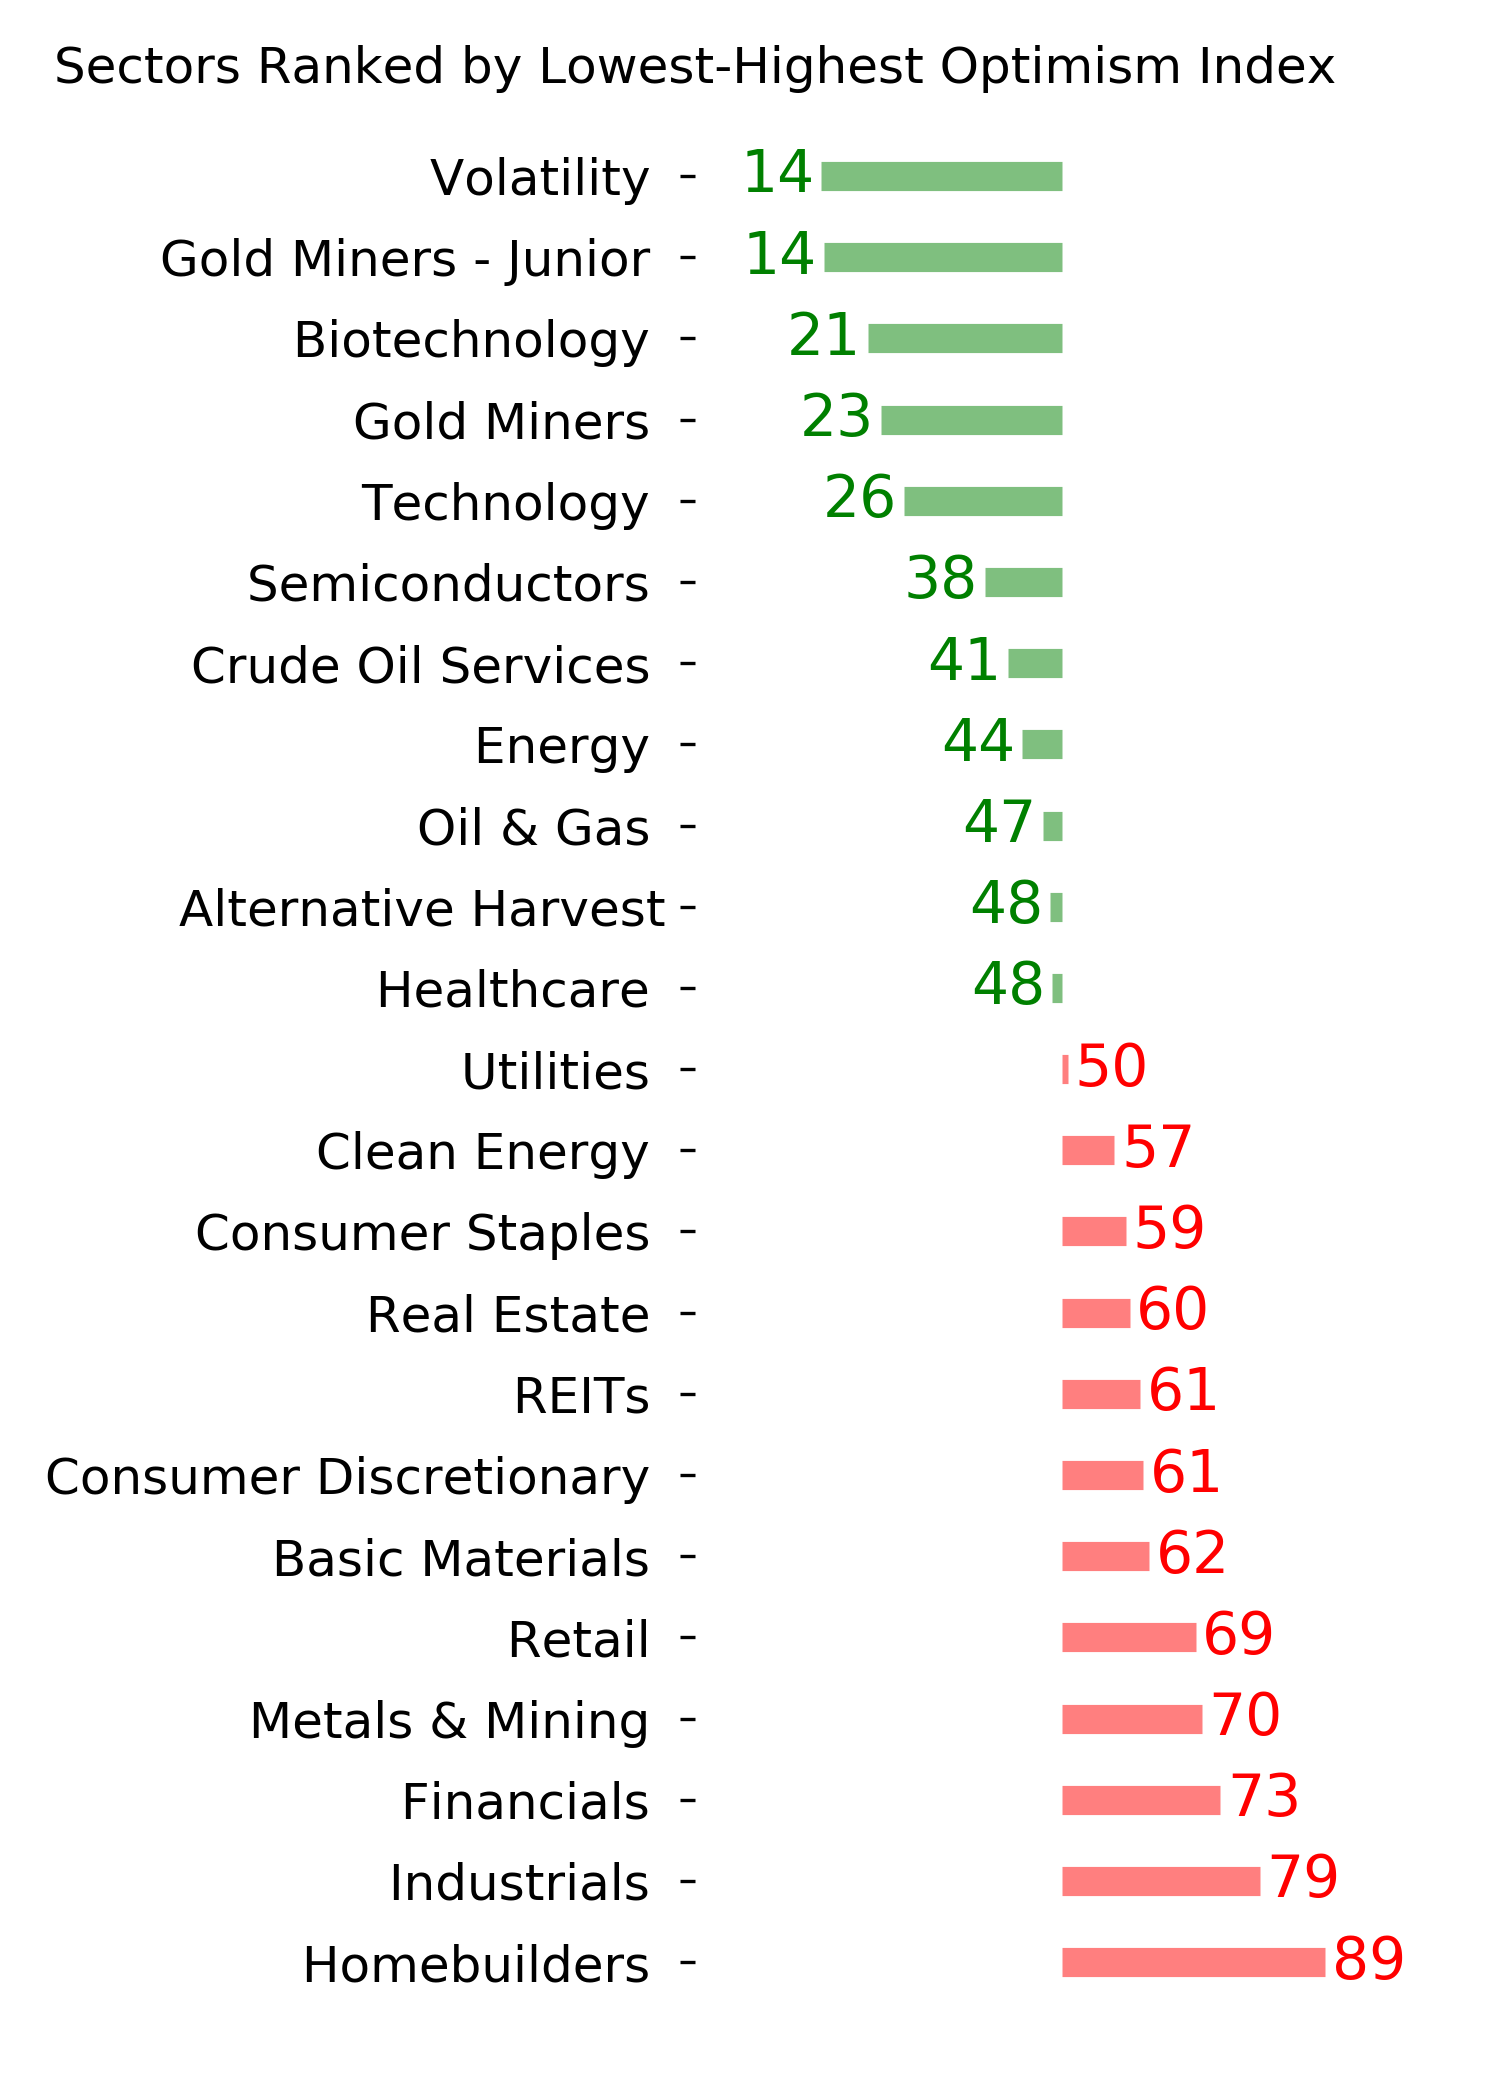
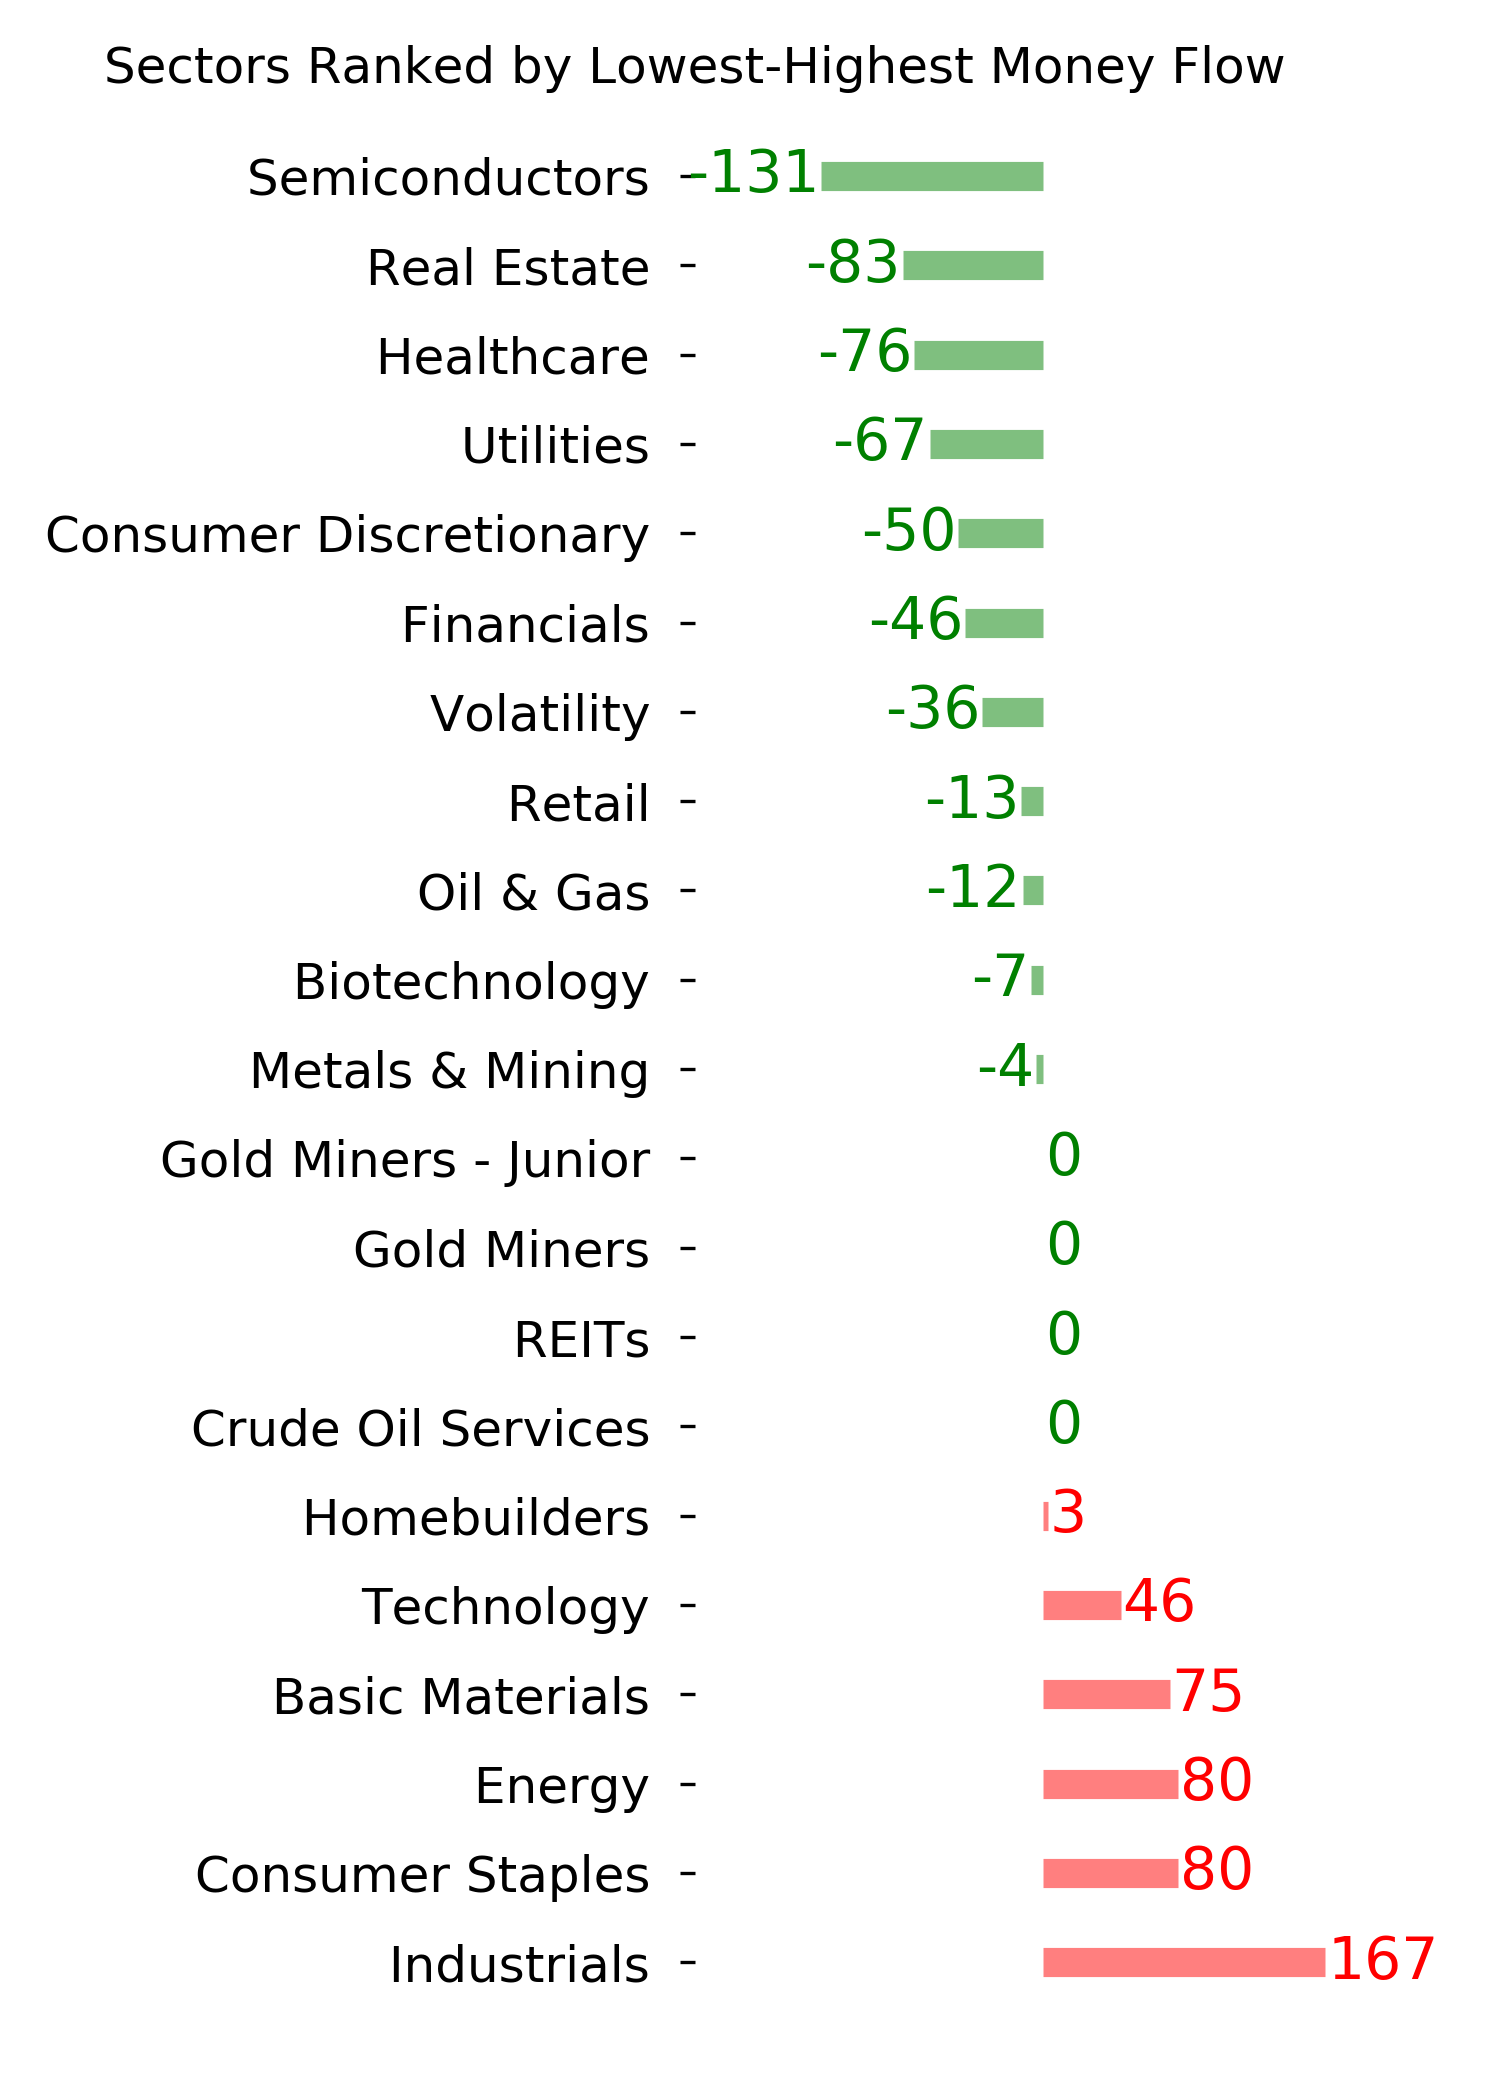
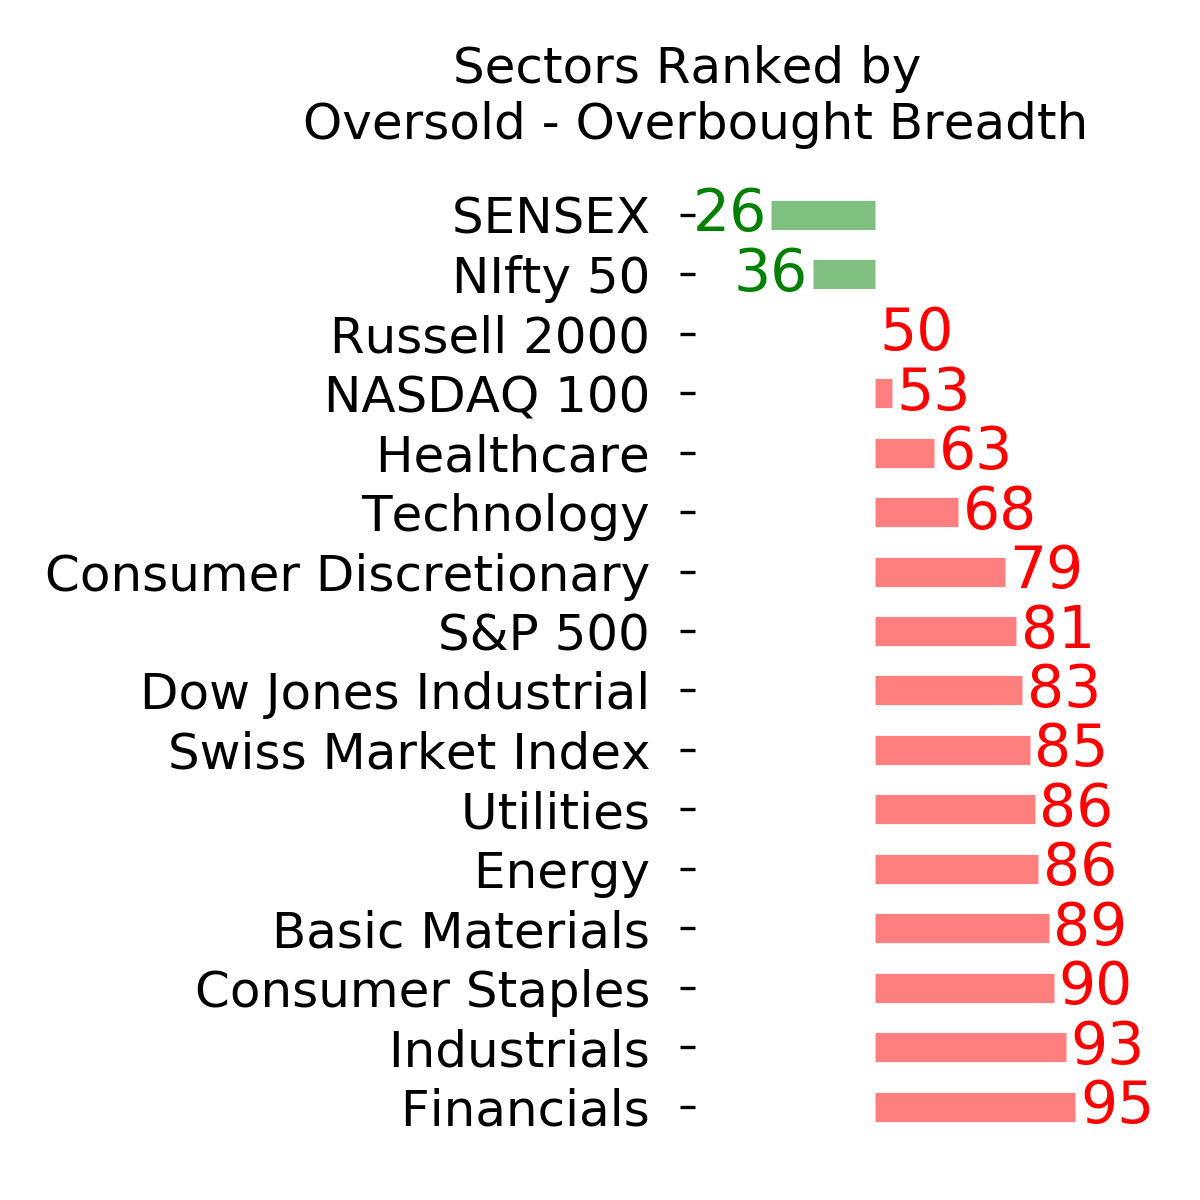
Ranks
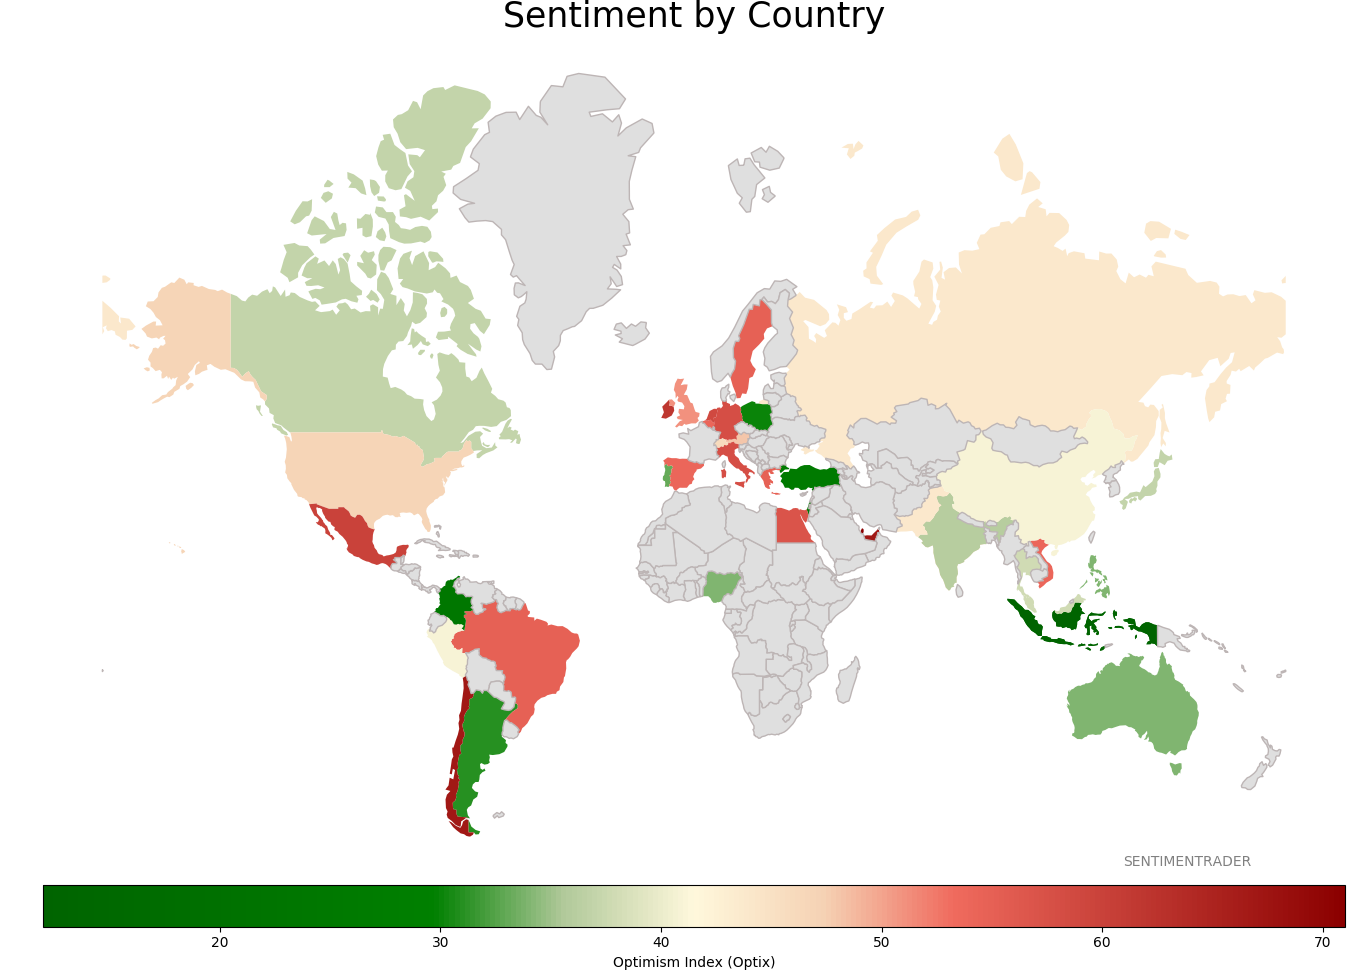
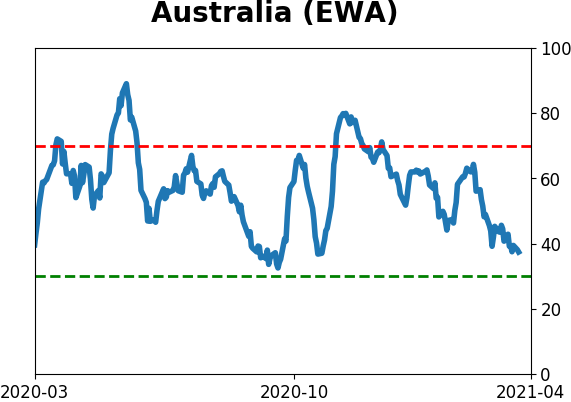
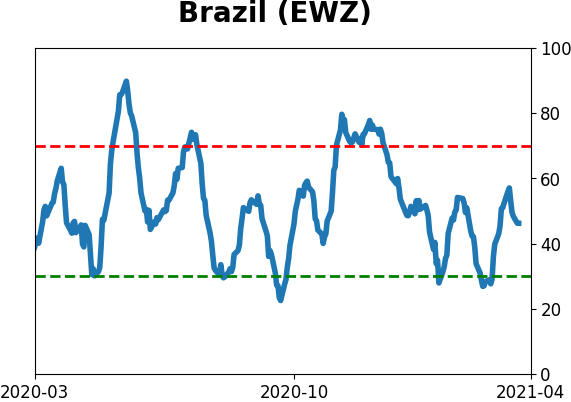
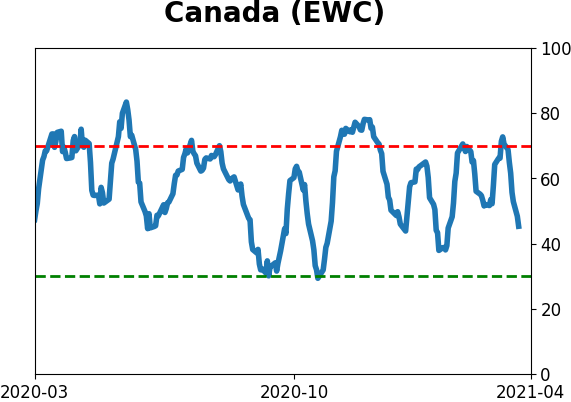
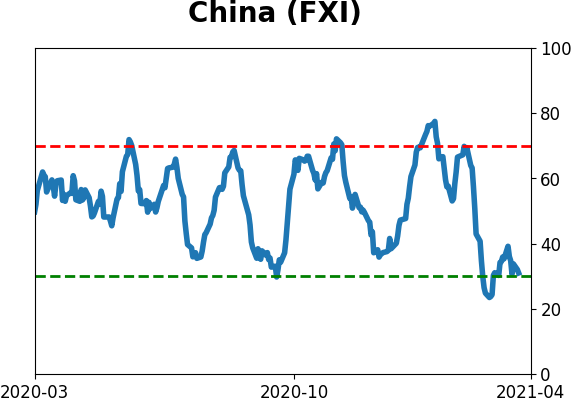
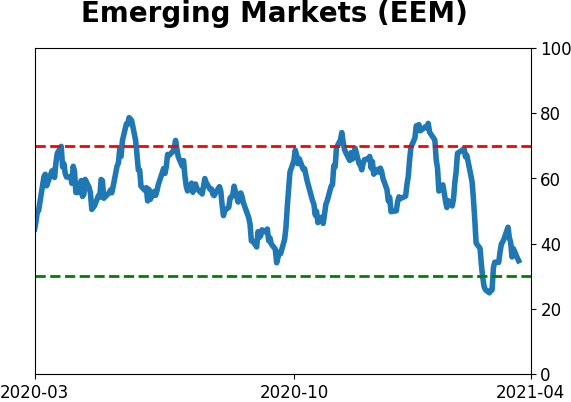
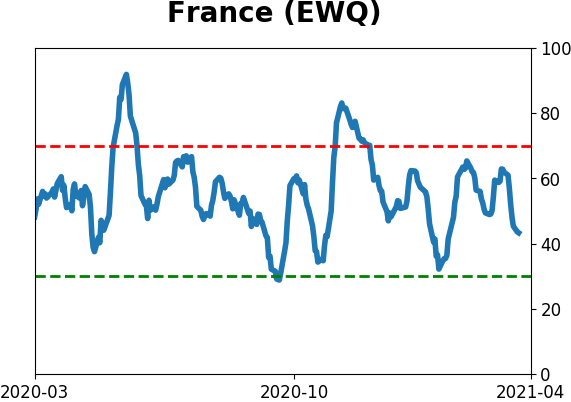
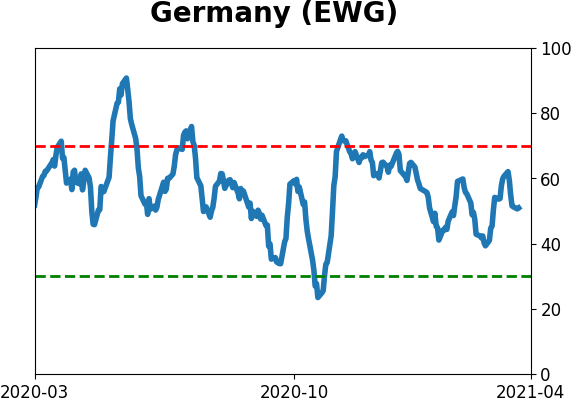
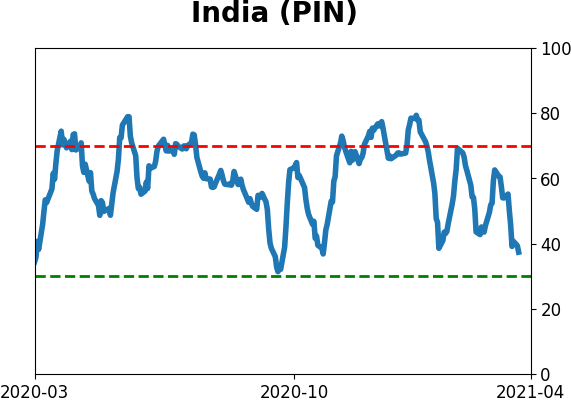
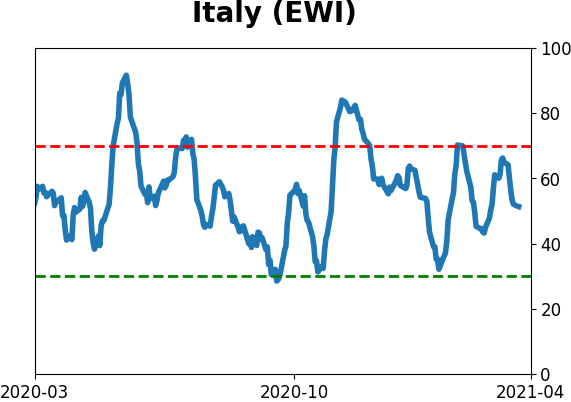
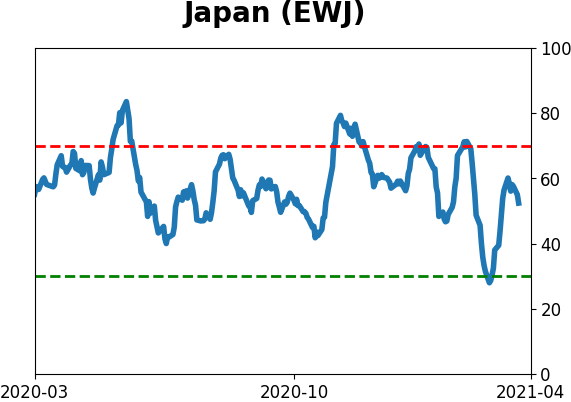
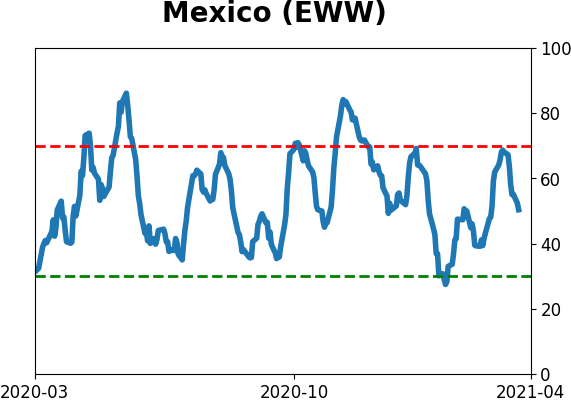
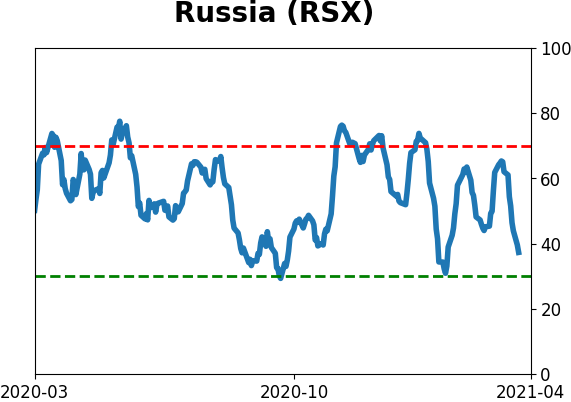
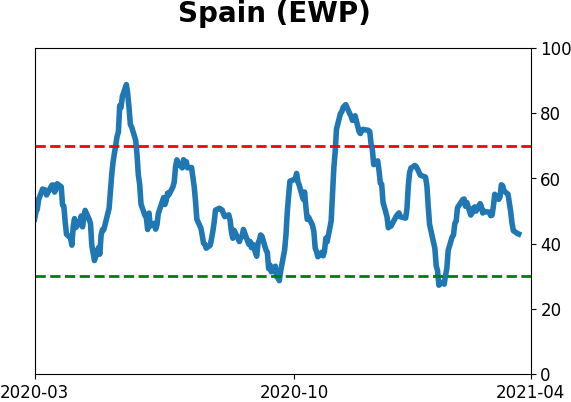
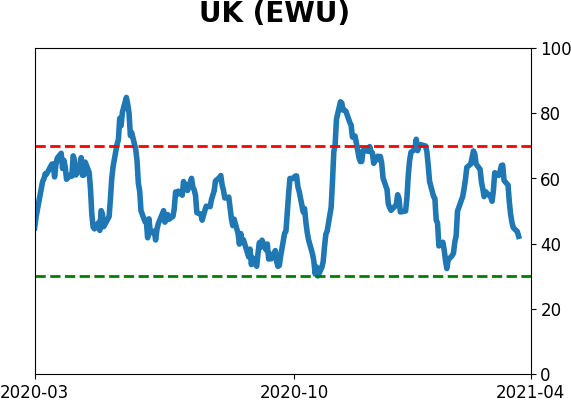
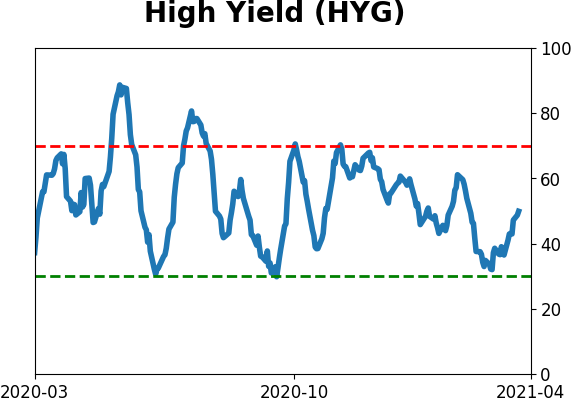
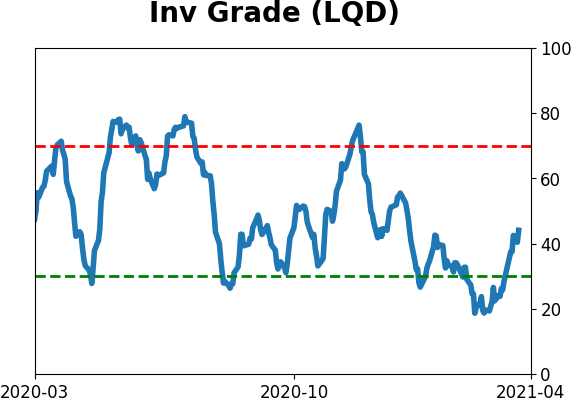
Sentiment Around The World
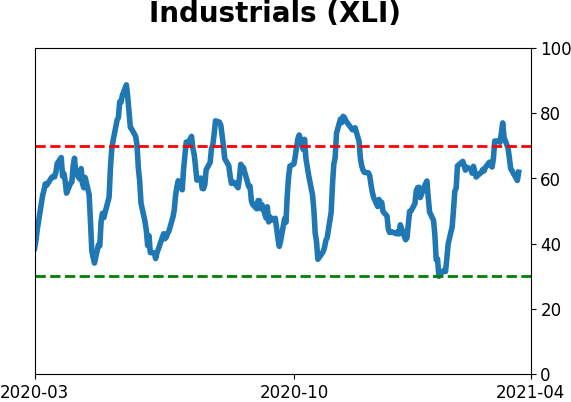
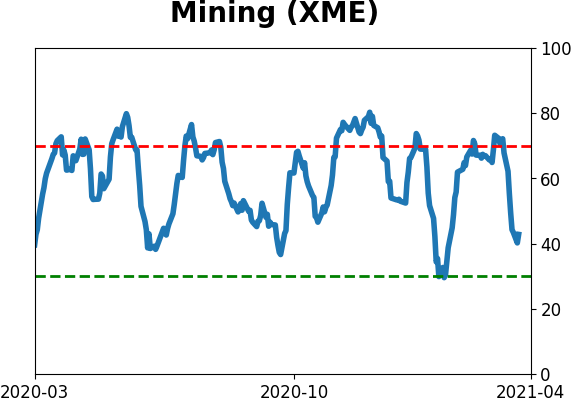
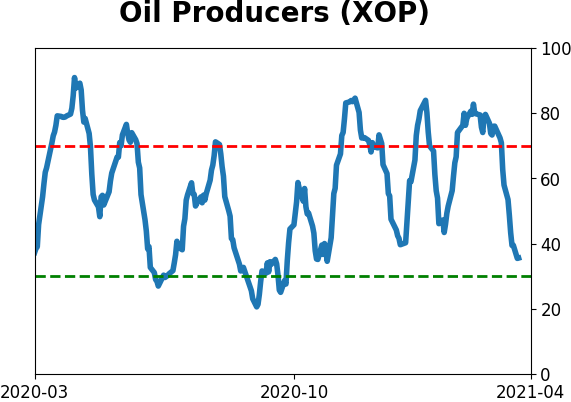
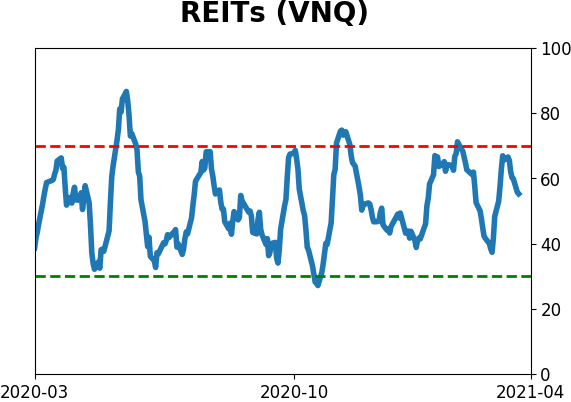
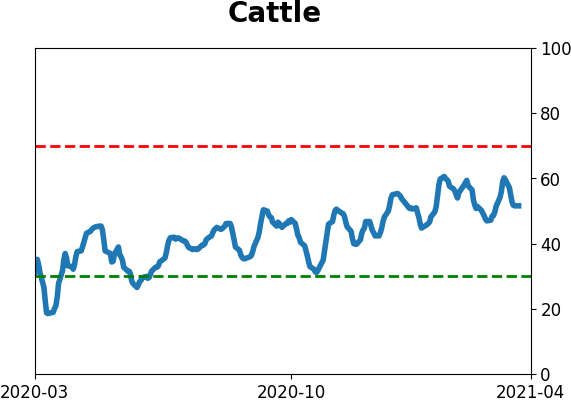
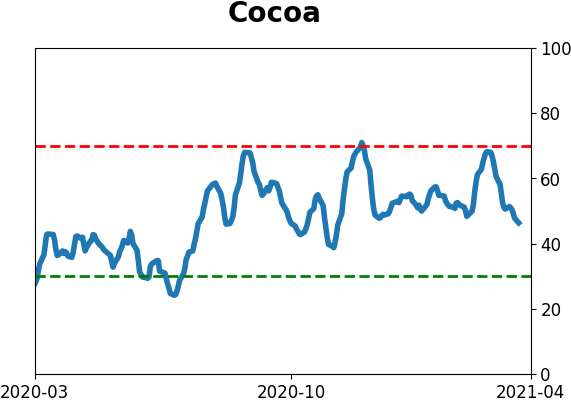
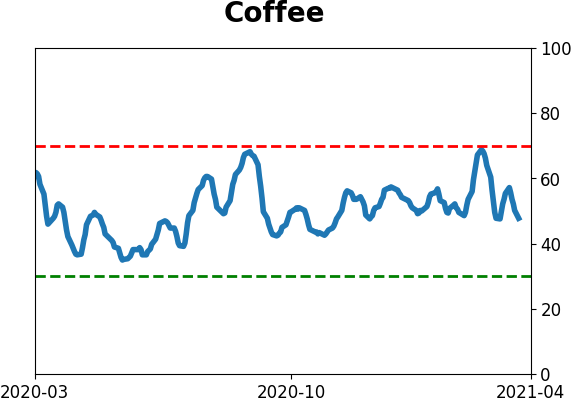
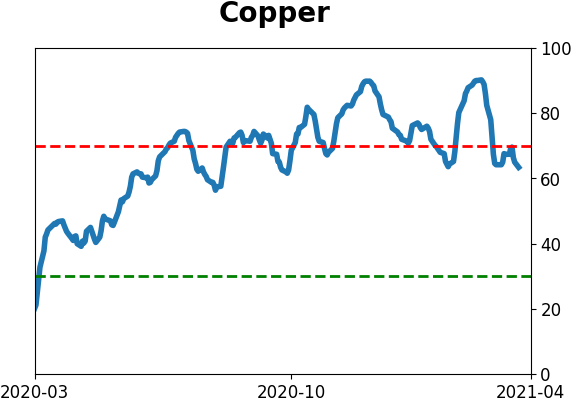
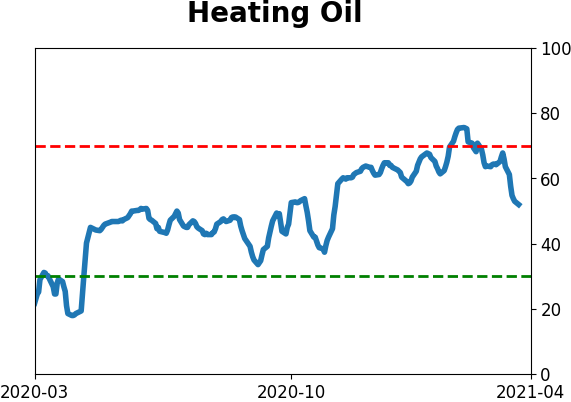
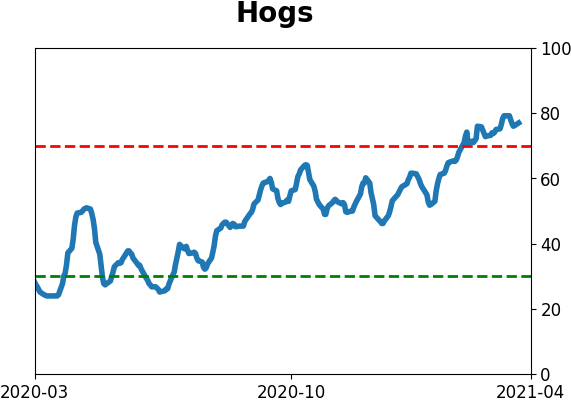
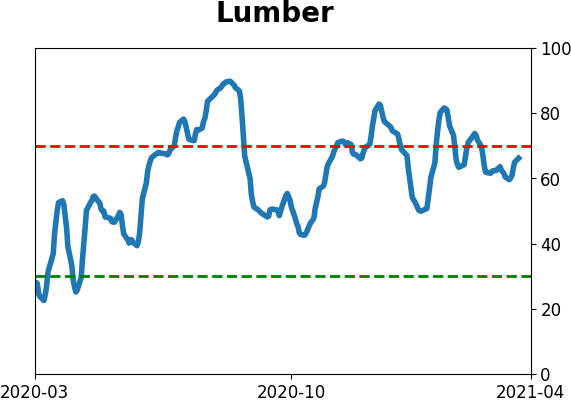
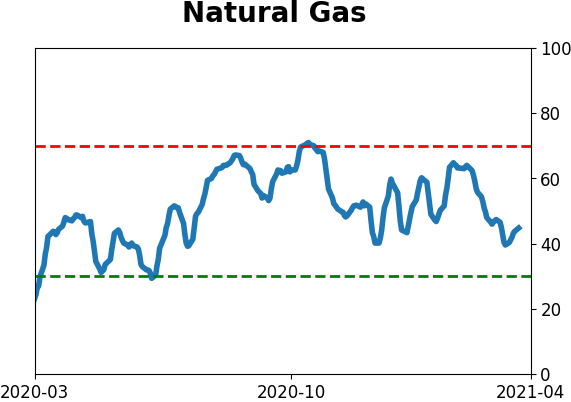
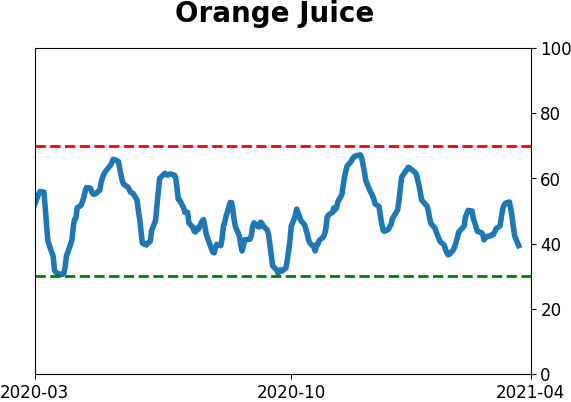
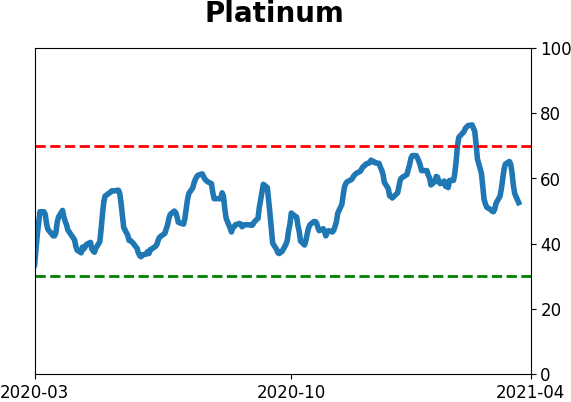
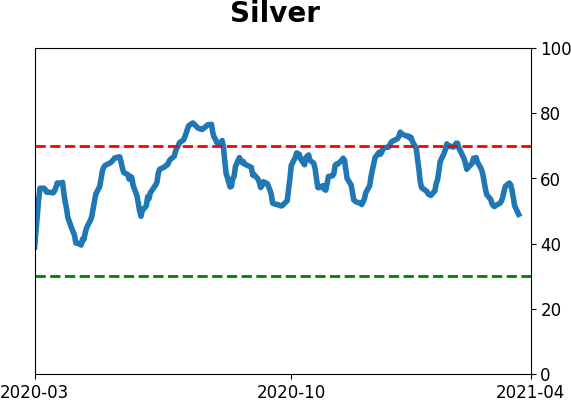
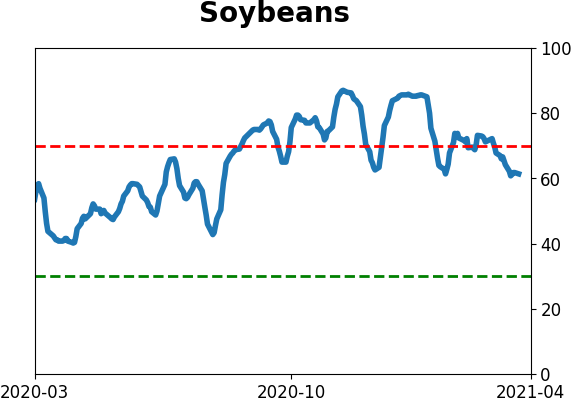
Optimism Index Thumbnails
|
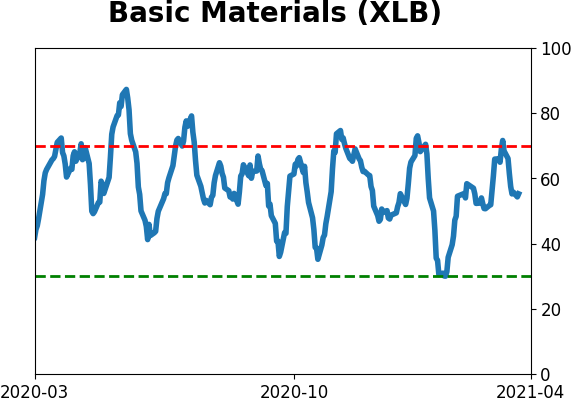
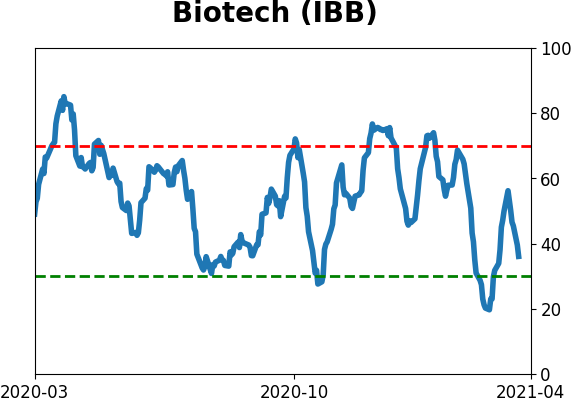
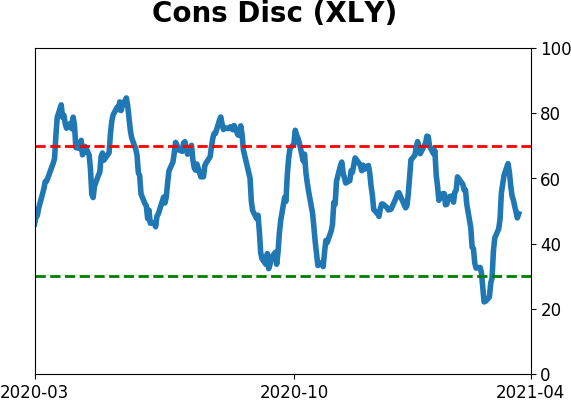
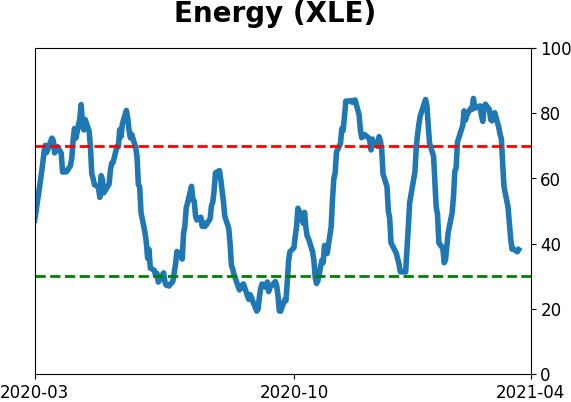
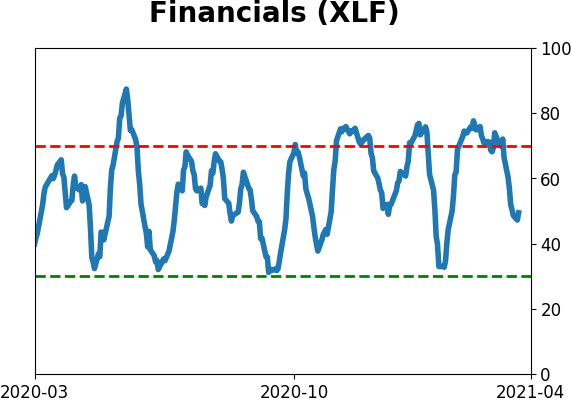
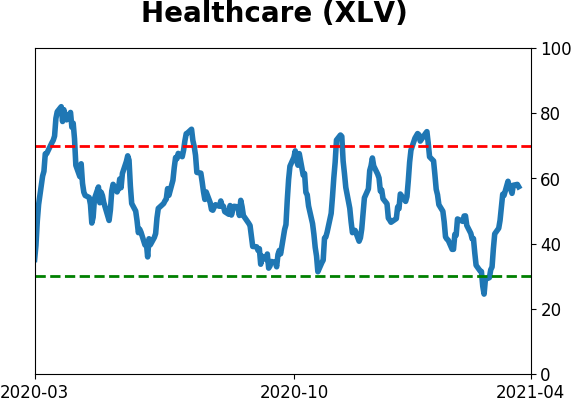
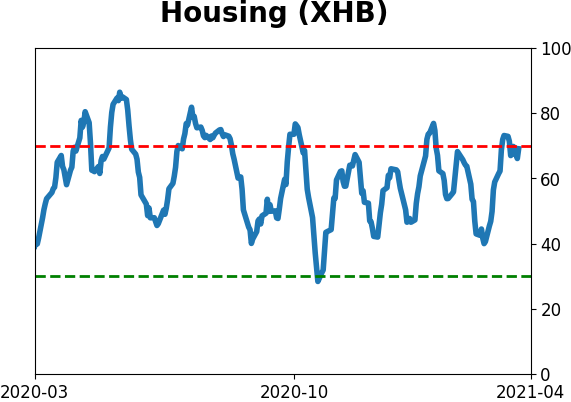
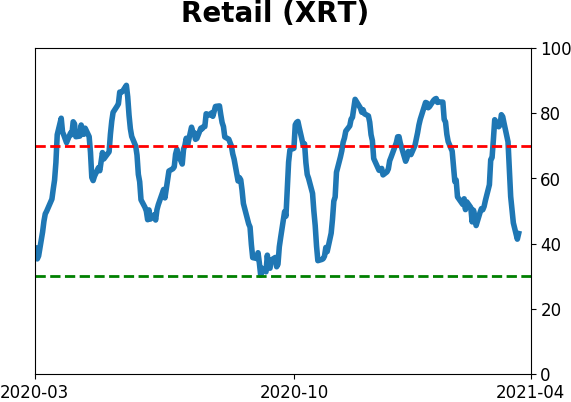
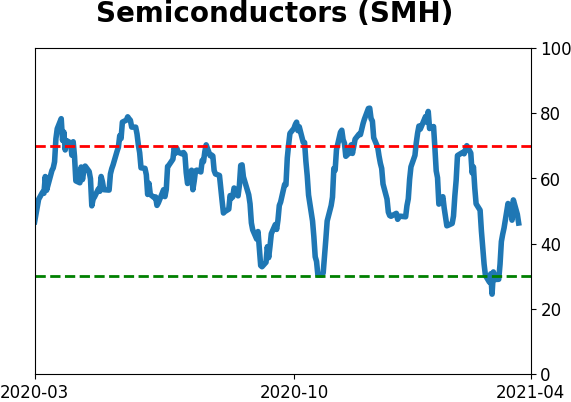
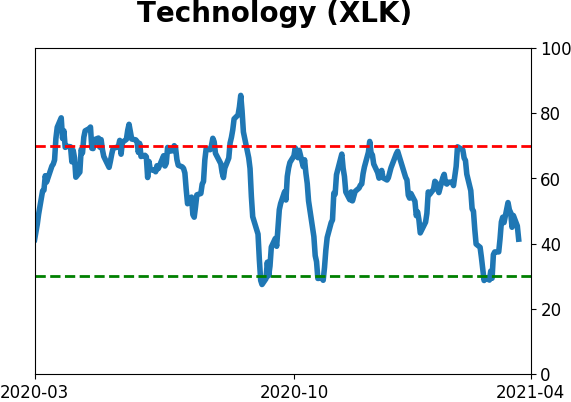
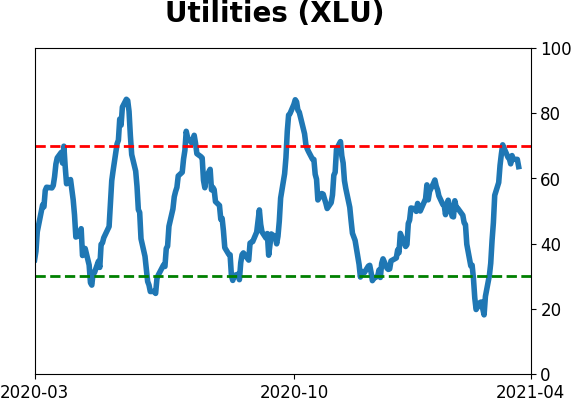
Sector ETF's - 10-Day Moving Average
|
|
|
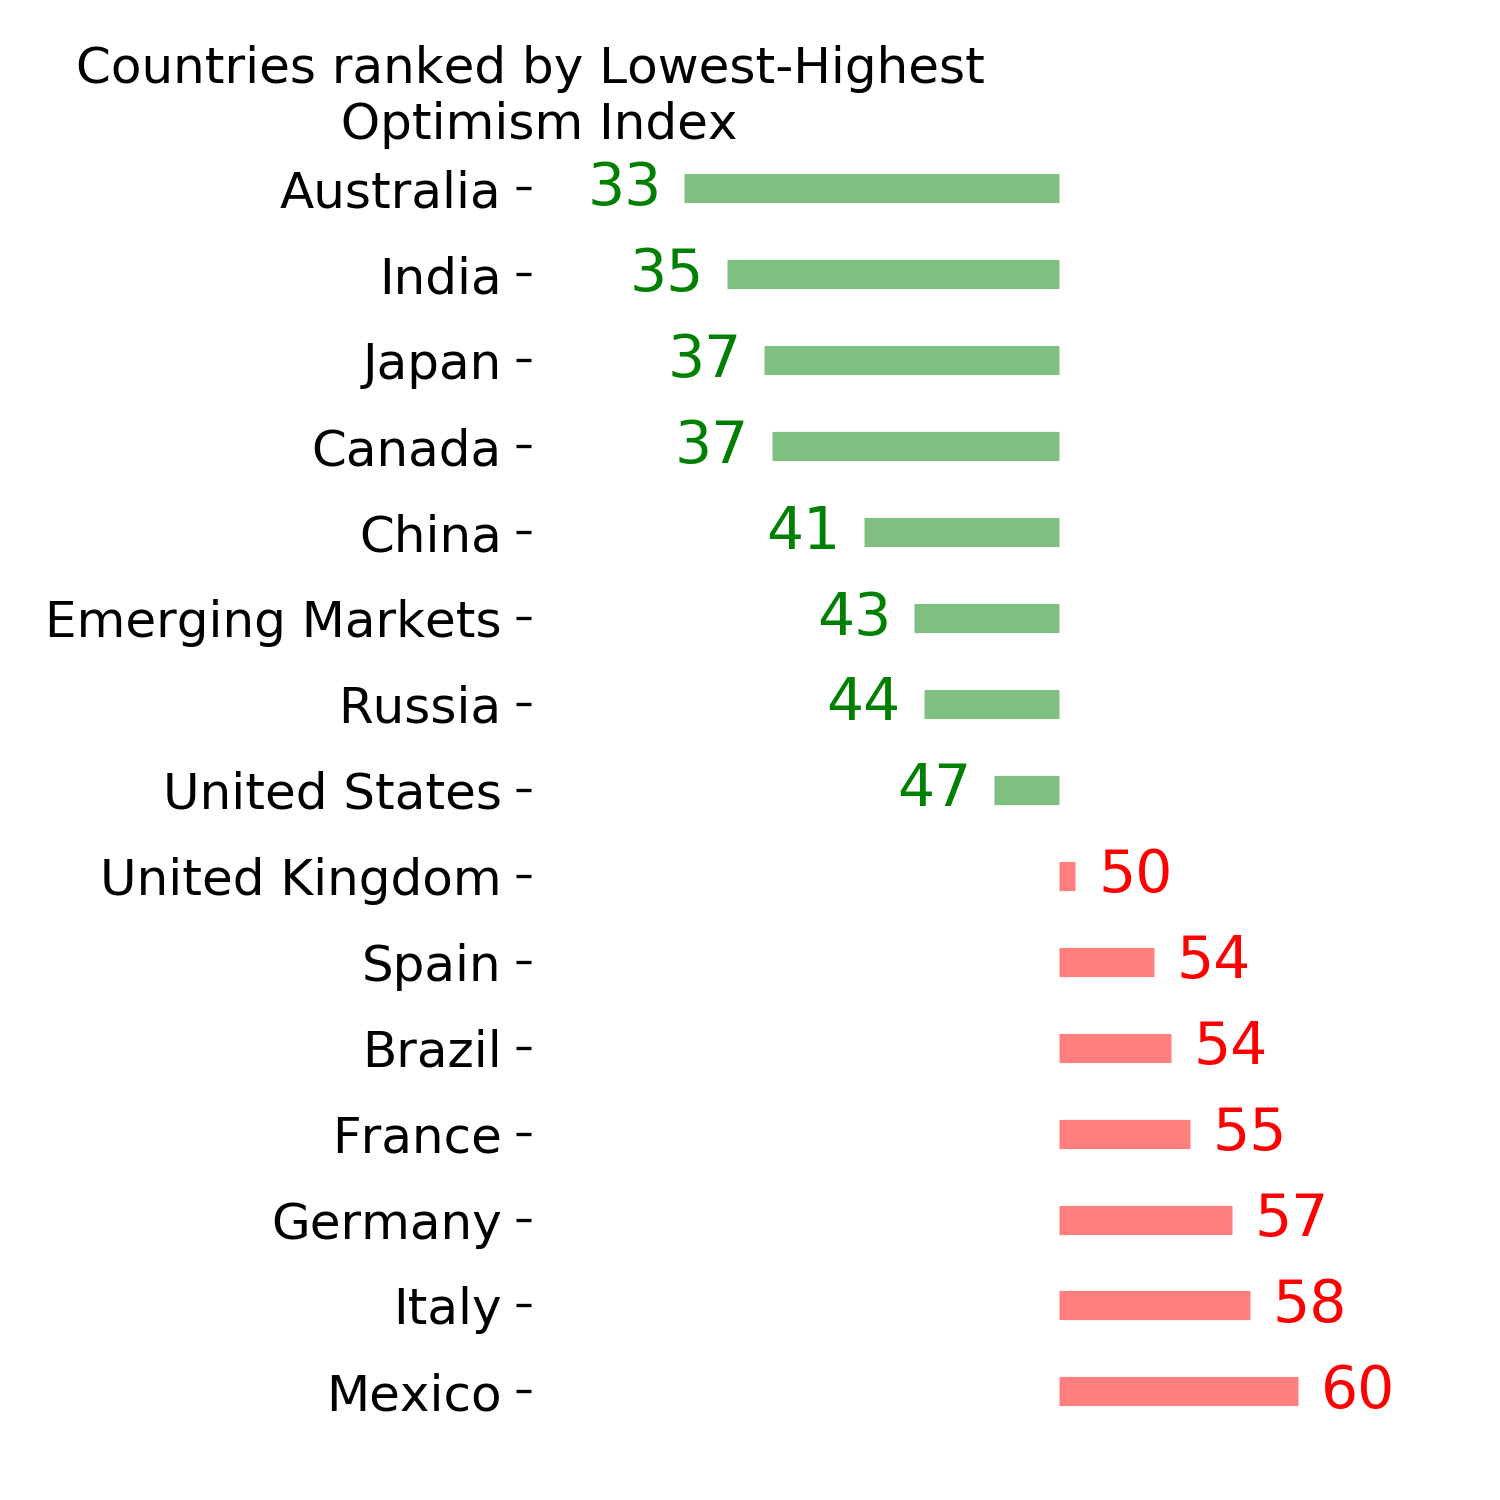
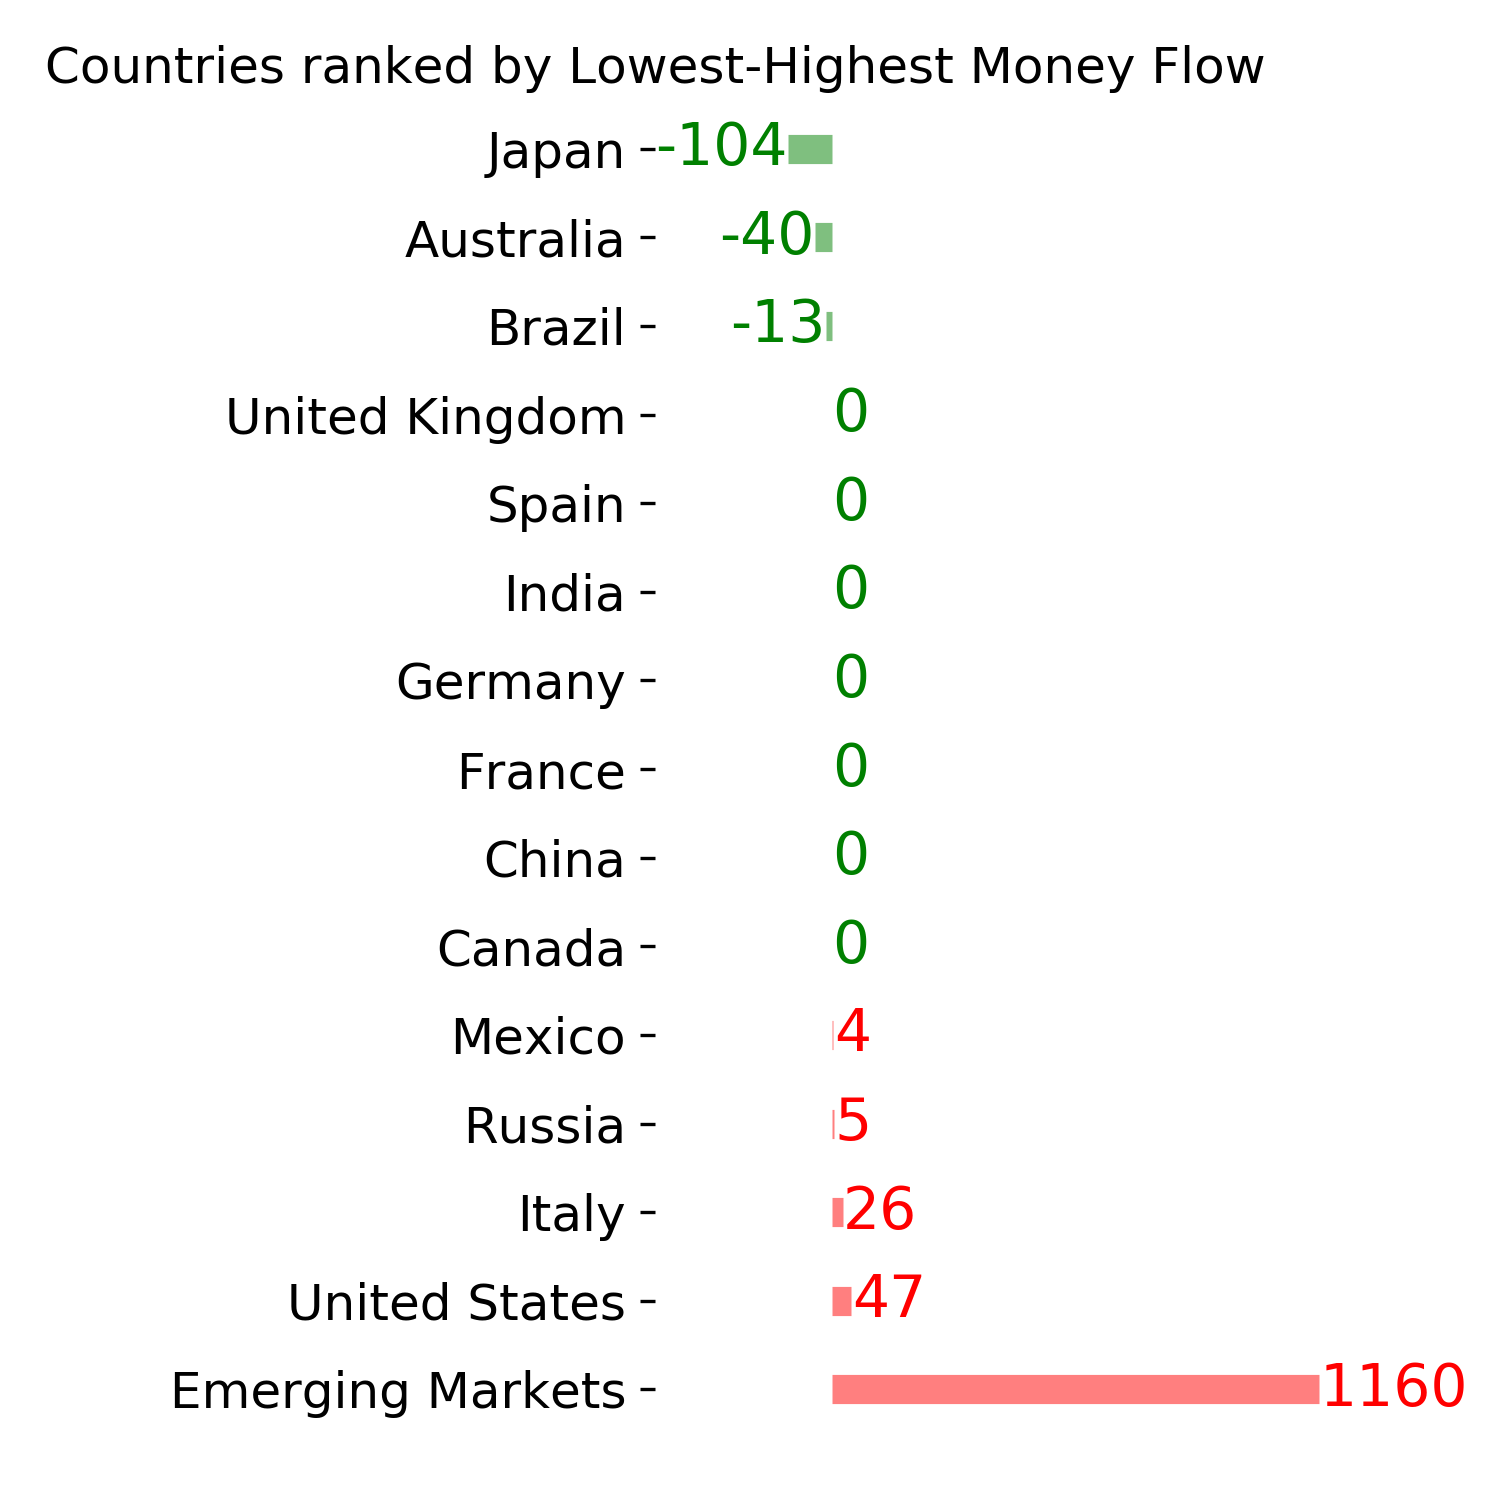
Country ETF's - 10-Day Moving Average
|
|
|
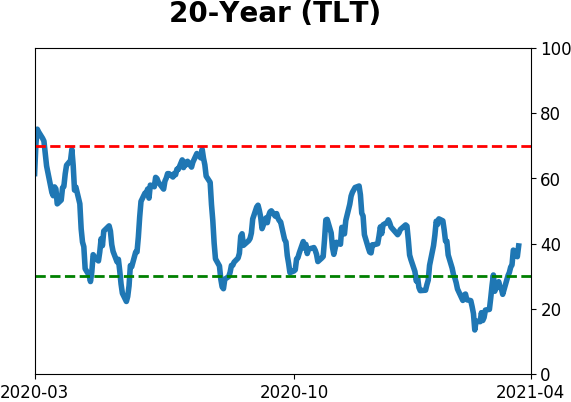
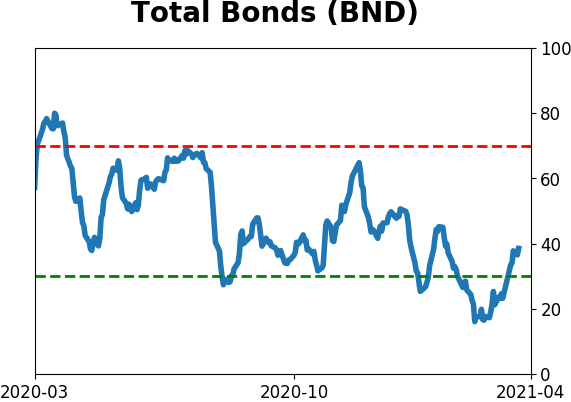
Bond ETF's - 10-Day Moving Average
|
|
|
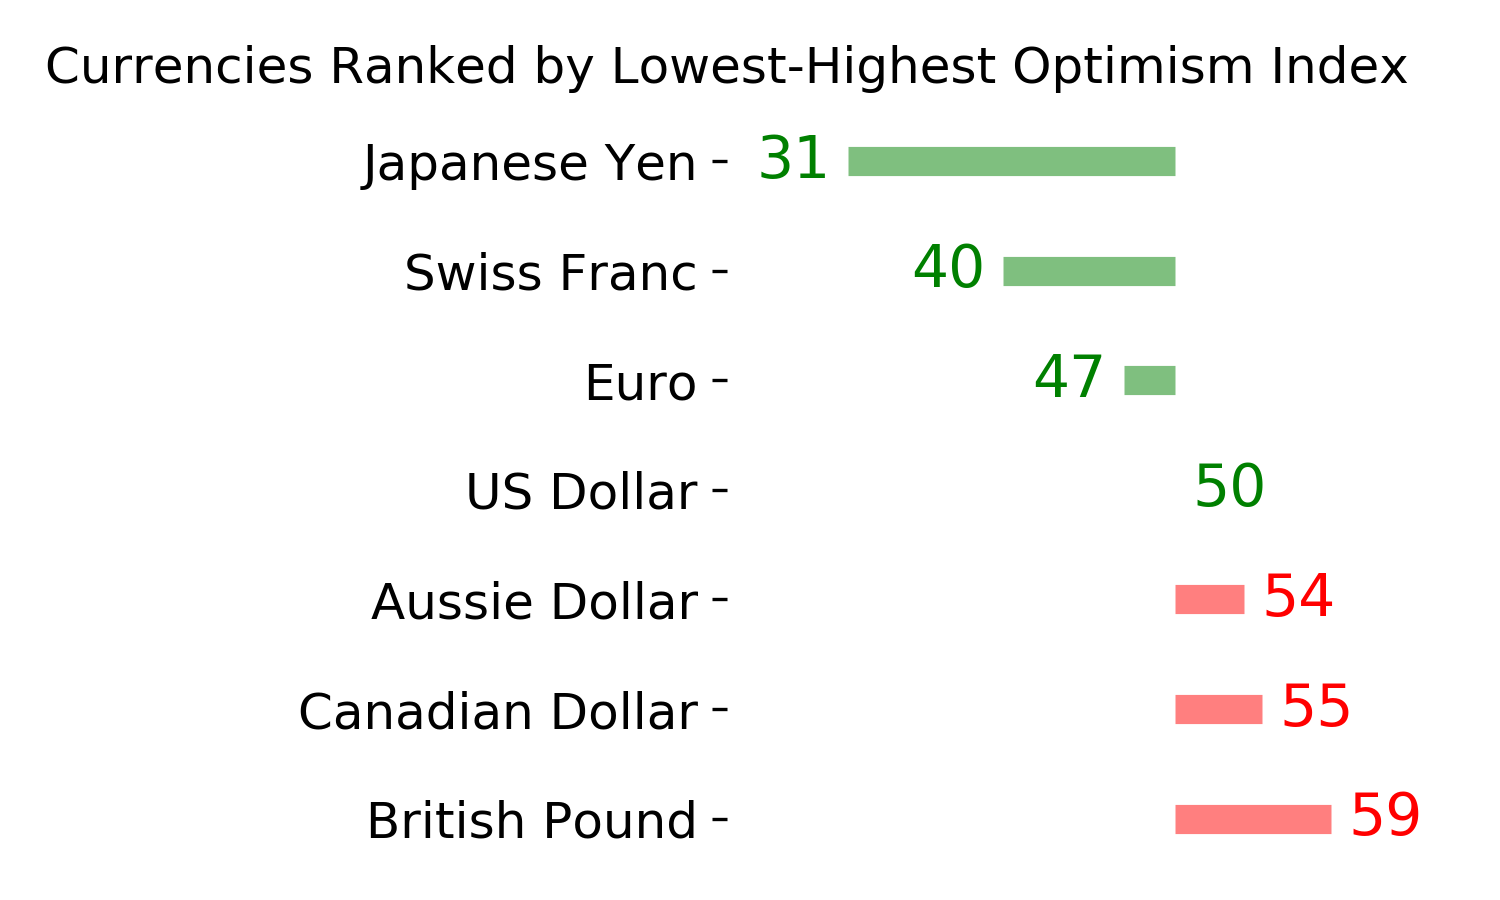
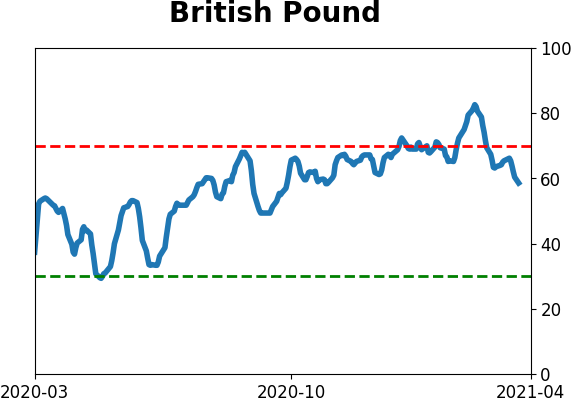
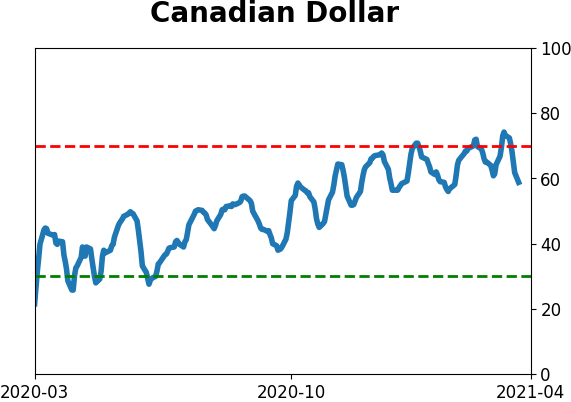
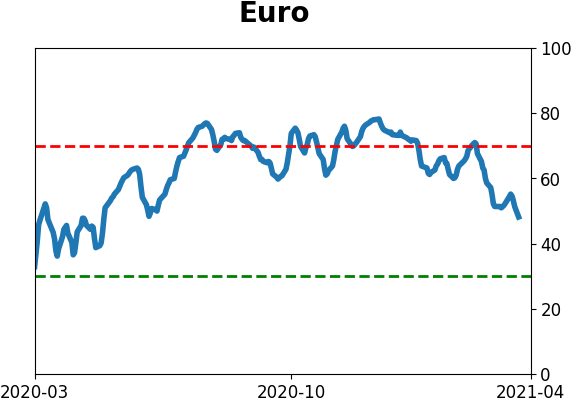
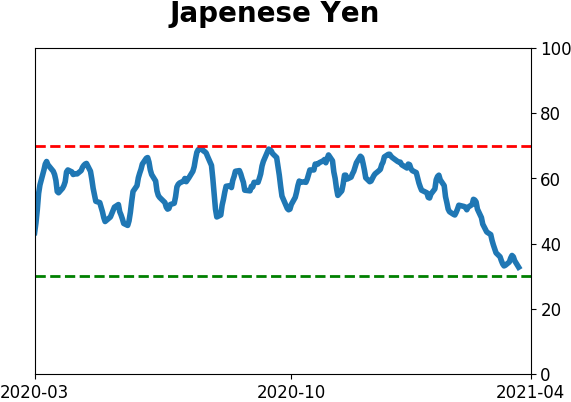
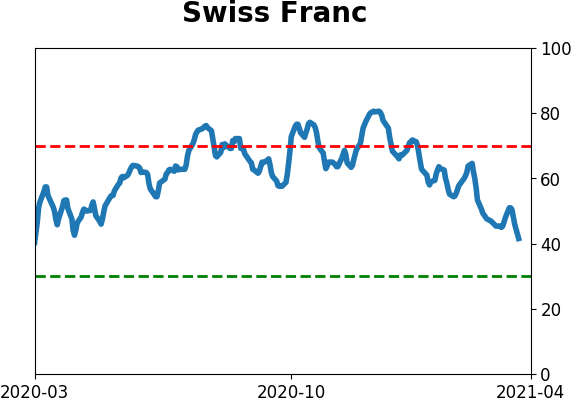
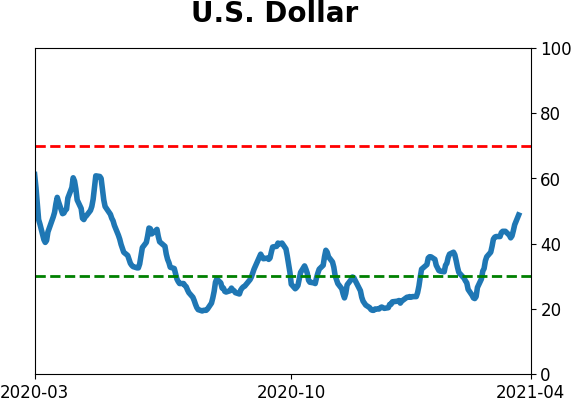
Currency ETF's - 5-Day Moving Average
|
|
|
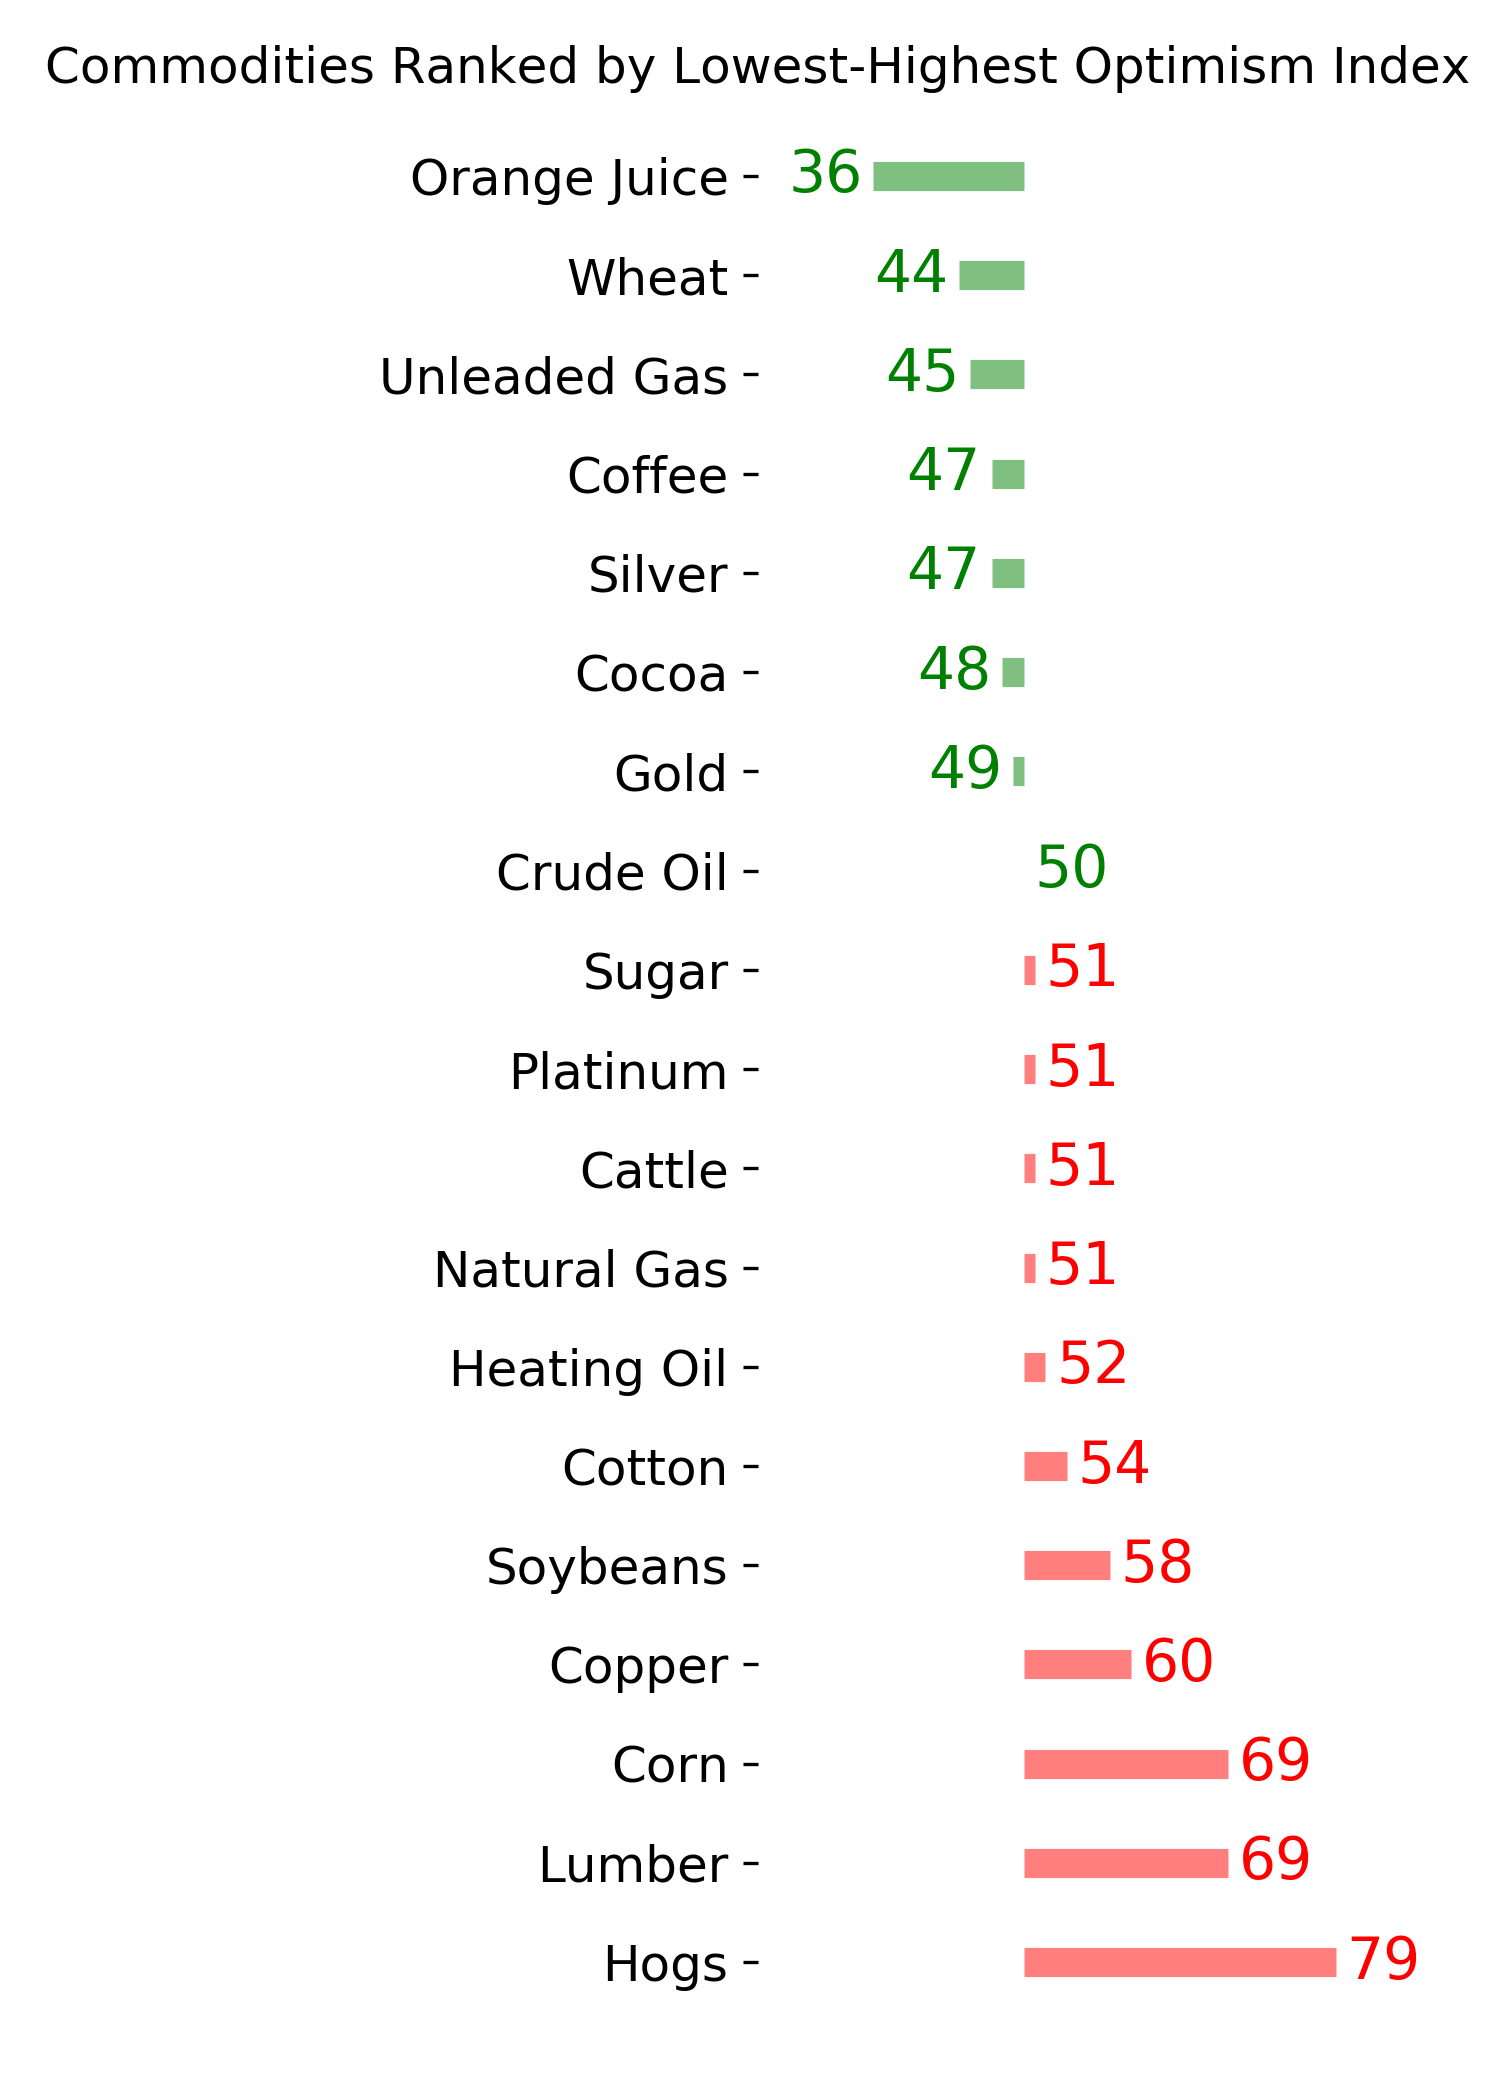
Commodity ETF's - 5-Day Moving Average
|
|