Headlines
|
|
The last hour has been a bear:
Over the past 3 months, stocks have consistently been selling off during the last hour of trading. That has pushed the Cumulative Last Hour indicator near a 52-week low while stocks hover near 52-week highs.
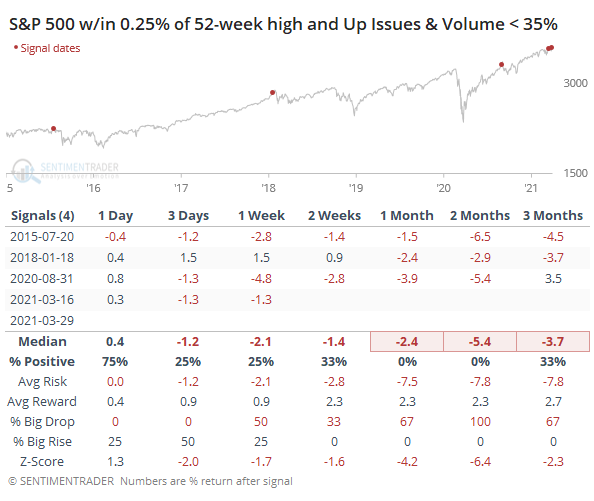
Sketchy: Thanks to some more weakness in smaller-cap stocks, breadth on the NYSE was terrible on Monday. Fewer than 35% of issues advanced, and less than 35% of volume flowed into those advancing issues. This is the weakest breadth in at least 60 years when the S&P 500 closed within 0.1% of a 52-week high.Below, we can see the few times the S&P was within 0.25% of a high with such weak breadth. All of them triggered in the past 6 years.
Bottom Line:
See the Outlook & Allocations page for more details on these summaries STOCKS: Weak sell
The extreme speculation registered in January and February is starting to get wrung out. Internal dynamics have mostly held up, so a return to neutral sentiment conditions would improve the forward risk/reward profile substantially. We're still a ways off from that. BONDS: Weak buy
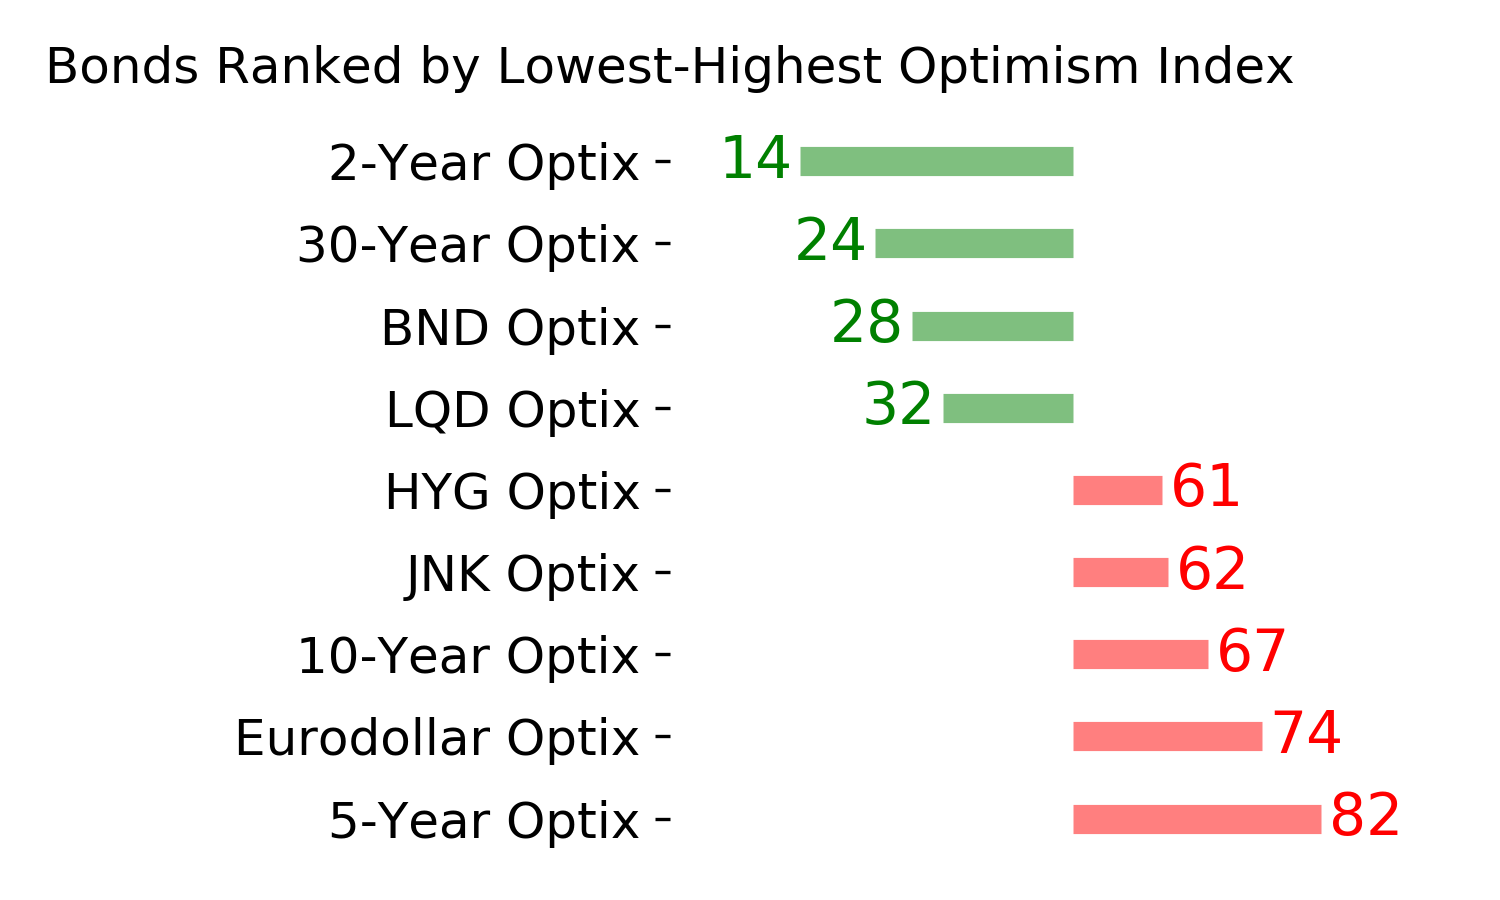
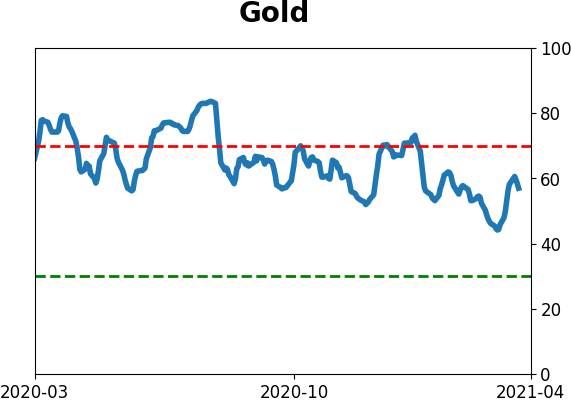
Various parts of the market have been hit in recent weeks, with mild oversold conditions. The Bond Optimism Index is now about as low as it gets during healthy bond market environments. Fixed income isn't responding well, so that needs to be monitored in case it's transitioning to a longer-term negative market environment. GOLD: Weak buy
A dollar trying to rebound from a severe short position has weighed on gold and miners. The types of signals they've given in recent weeks, within the context of their recent surge, have usually resulted in higher prices over a medium- to long-term time frame. Like bonds, gold and miners aren't responding very well, and this needs to be monitored.
|
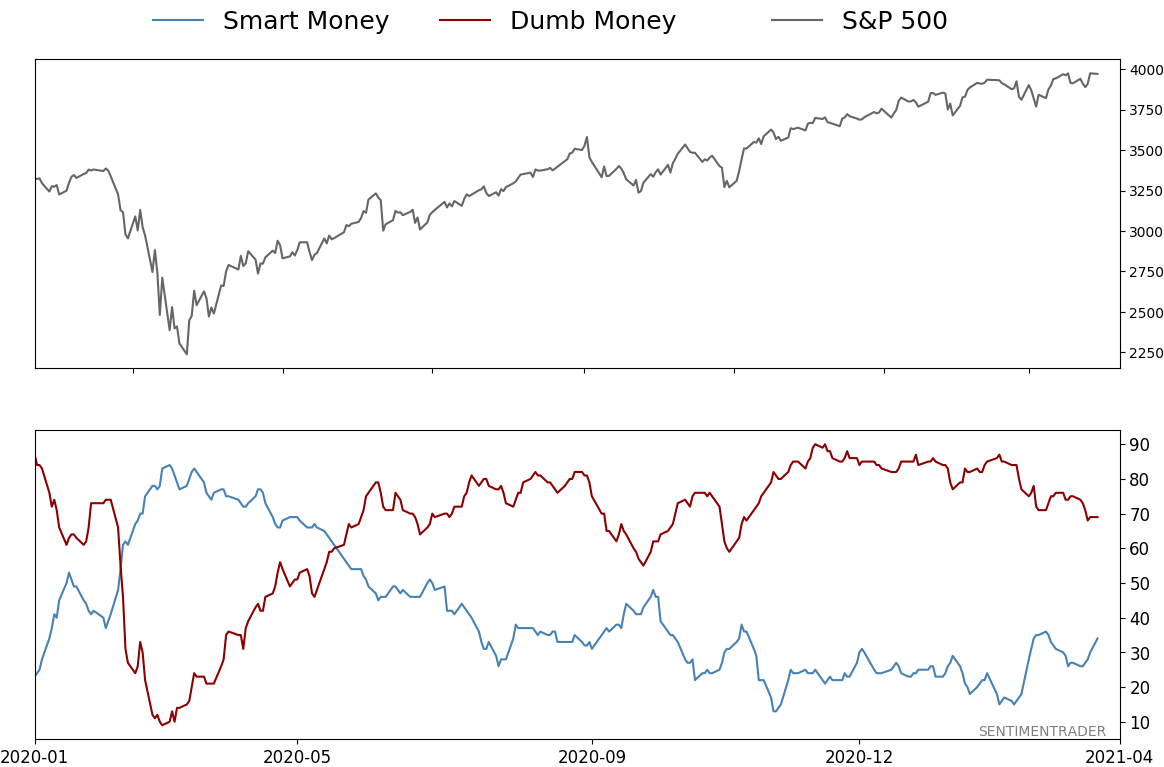
Smart / Dumb Money Confidence
|
Smart Money Confidence: 34%
Dumb Money Confidence: 69%
|
|
Risk Levels
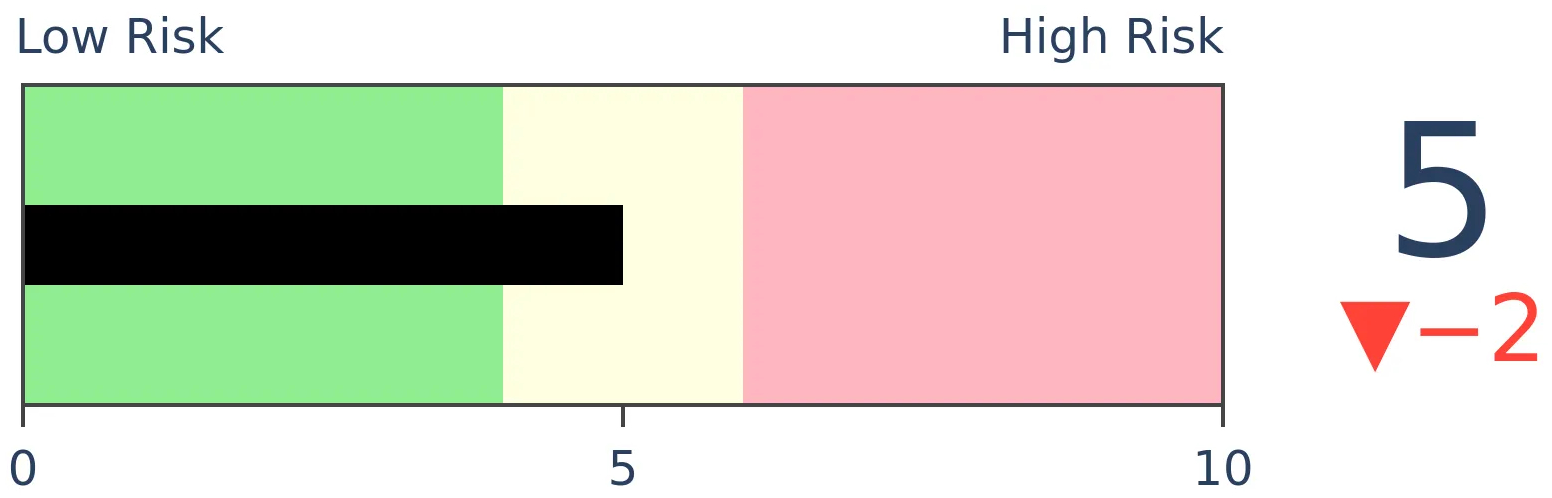
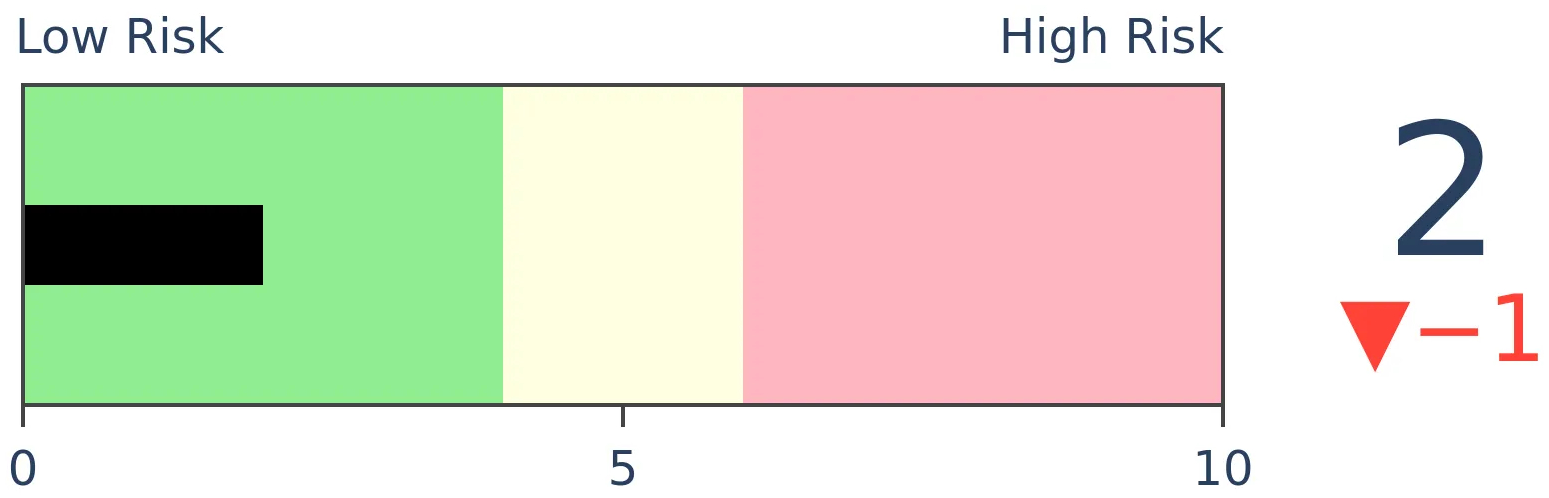
Stocks Short-Term
|
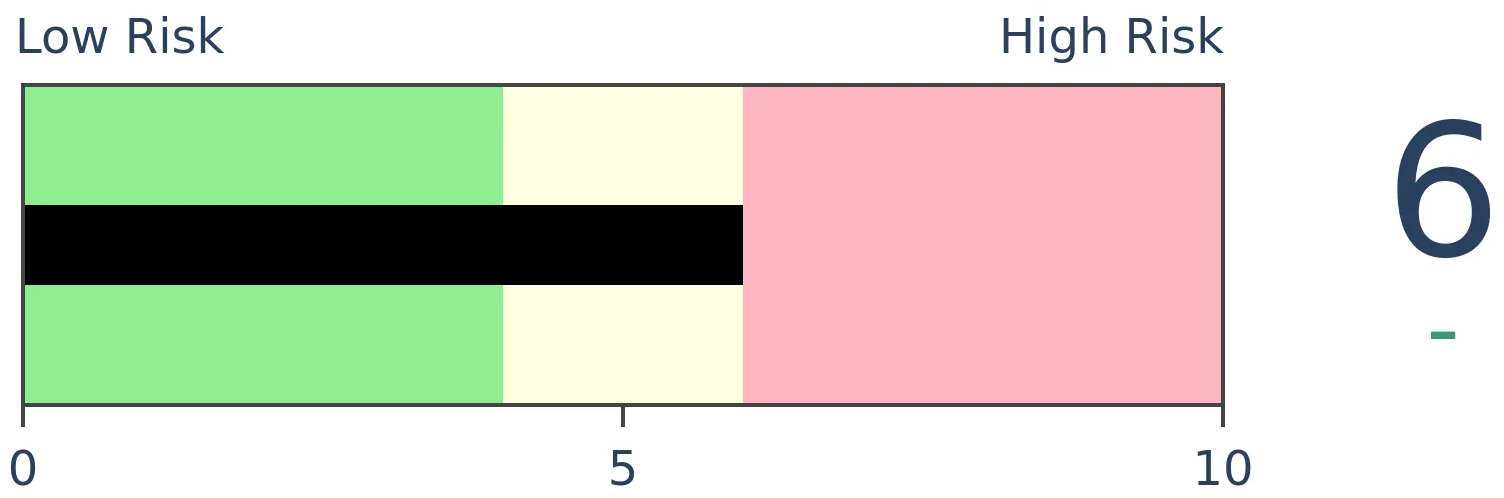
Stocks Medium-Term
|
|
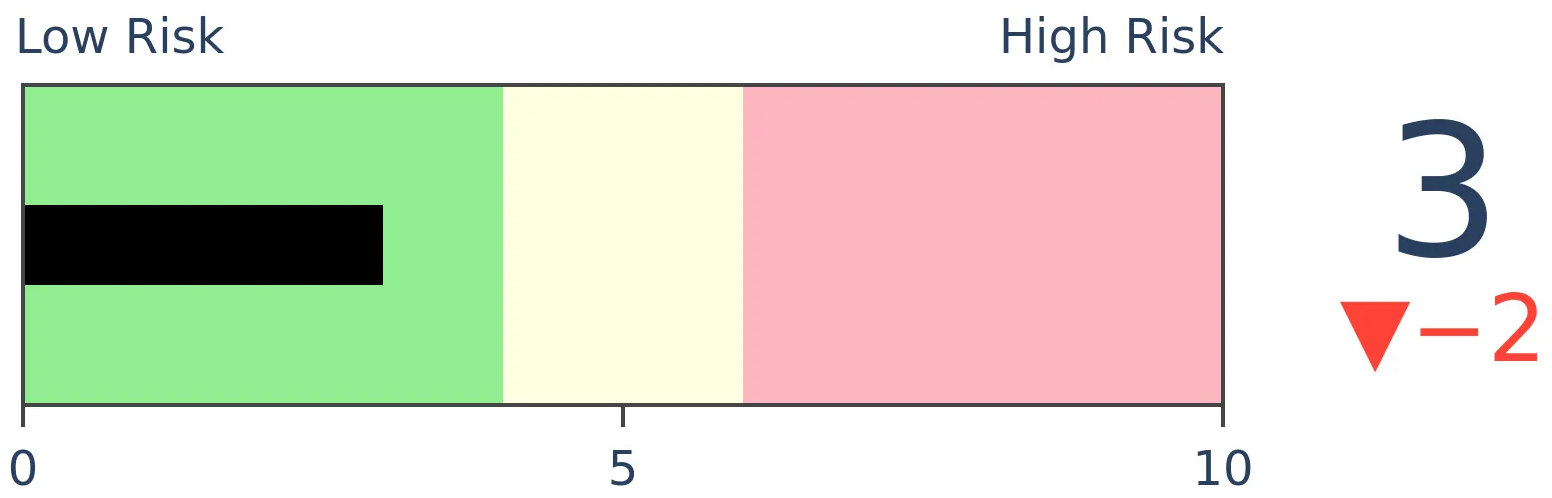
Bonds
|
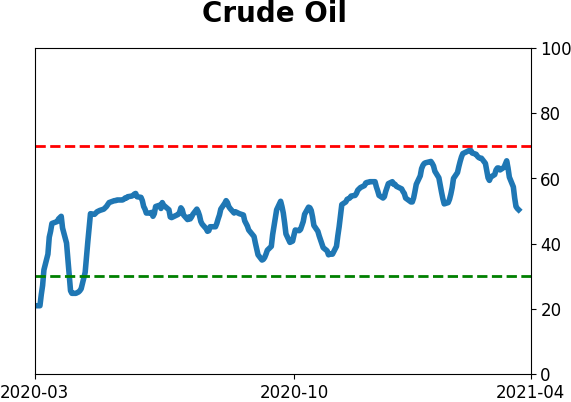
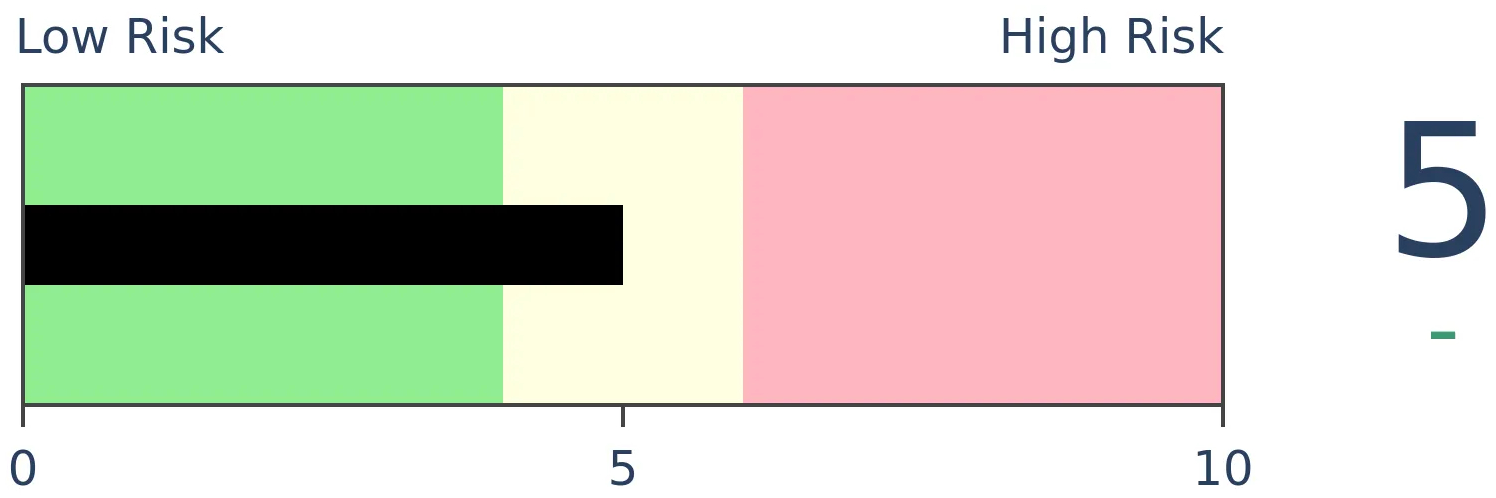
Crude Oil
|
|
Gold
|
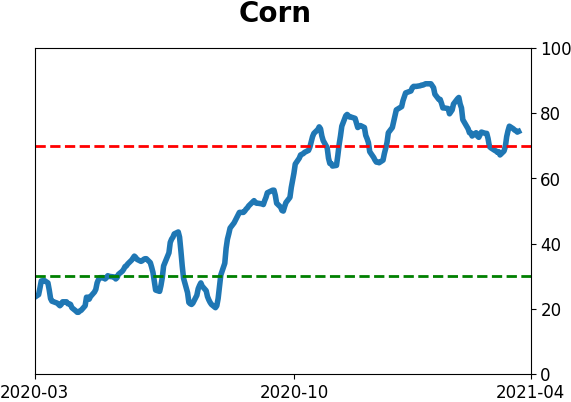
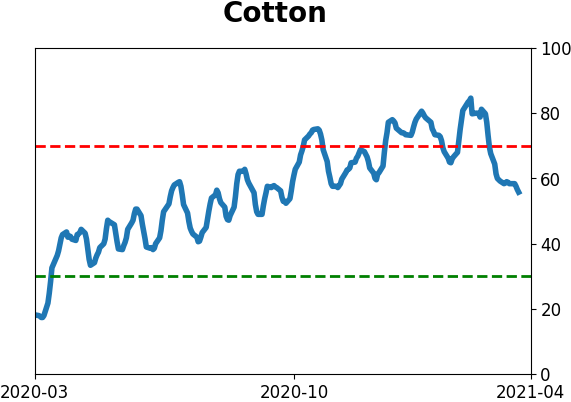
Agriculture

|
|
Research
BOTTOM LINE
Over the past 3 months, stocks have consistently been selling off during the last hour of trading. That has pushed the Cumulative Last Hour indicator near a 52-week low while stocks hover near 52-week highs.
FORECAST / TIMEFRAME
SPY -- Down, Medium-Term
|
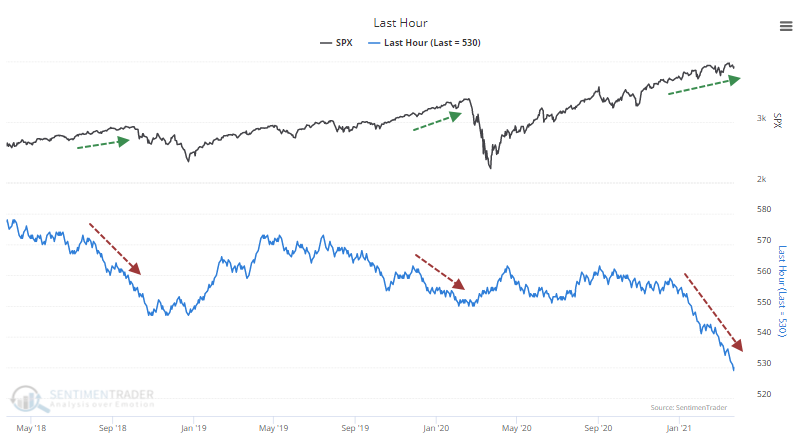
You wouldn't know it by the last couple of days, Friday in particular, but the past few months have been dominated by late-day selling pressure. This predates issues with the blowup of Archegos Capital, though Friday's late-day buying ramp could have been directly influenced.
The Cumulative Last Hour indicator looks at the last hour of trading in the S&P 500 fund, SPY. If the fund rises during that hour, then the indicator adds 1 to the running total. If it drops, then it subtracts 1. Dean noted in February how this gave a signal that has preceded some weakness in the past.
Recent months have seen a continual erosion in the indicator, to the point where it's at the lowest level in 6 years. When stocks have been persistently hitting new highs while the Last Hour indicator was plumbing new lows, it has been a warning sign.
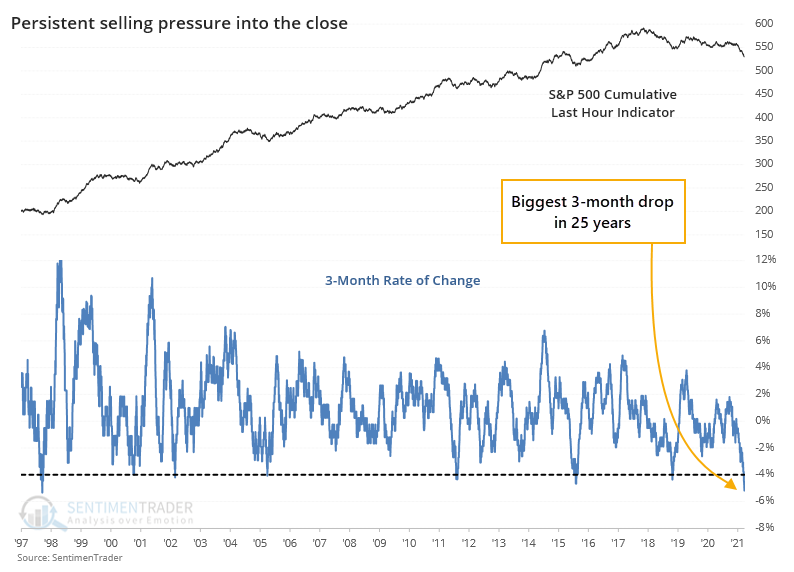
What is especially notable about the current behavior is just how persistent the selling has been during the last hour. Over the past 3 months, the indicator has dropped 5%, which doesn't sound like a lot, but it's the biggest plunge in 25 years.
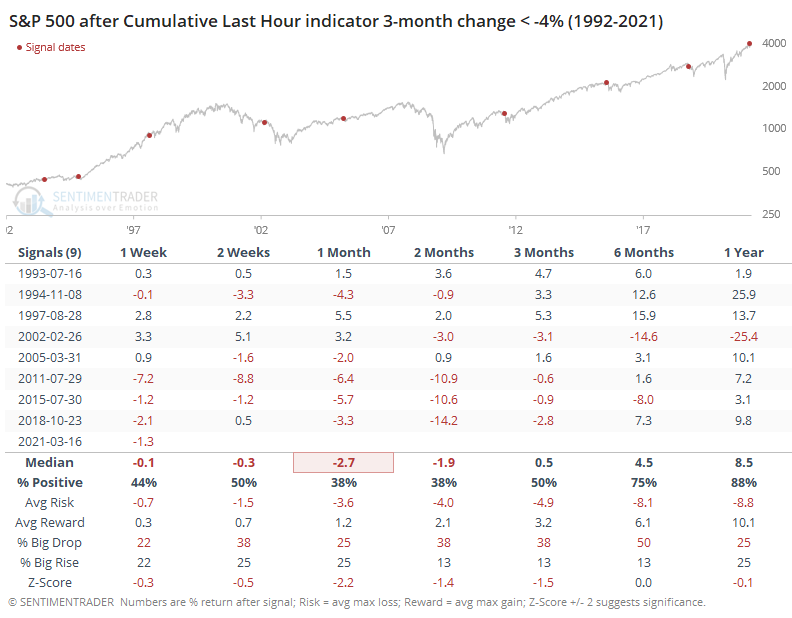
The table below shows that when the indicator dropped 4% or more over a 3-month period, stocks struggled. The only exceptions were in 1995 and 1997.
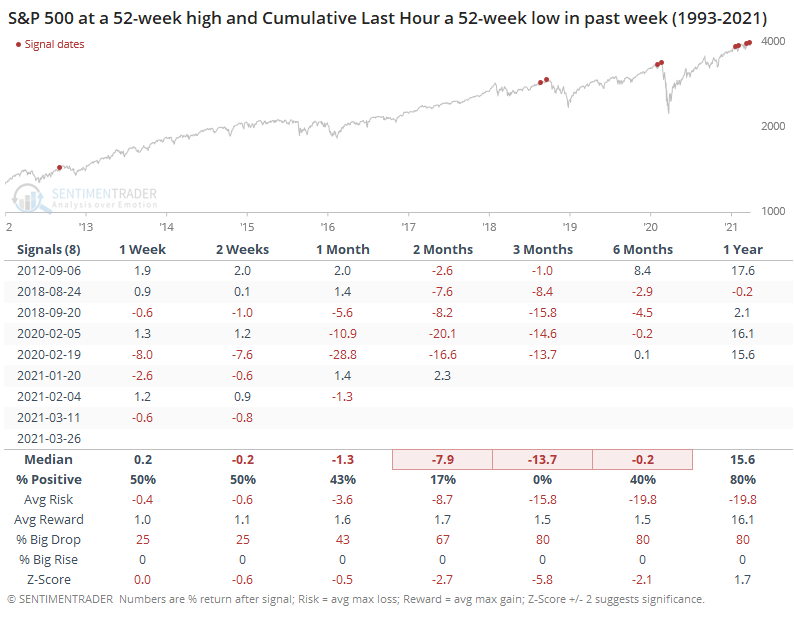
When we look specifically for divergences between the S&P and the Last Hour indicator, with them recently at opposite 52-week extremes, then there isn't much of a sample size. It never happened prior to 2012, and all of them witnessed some weakness going forward.
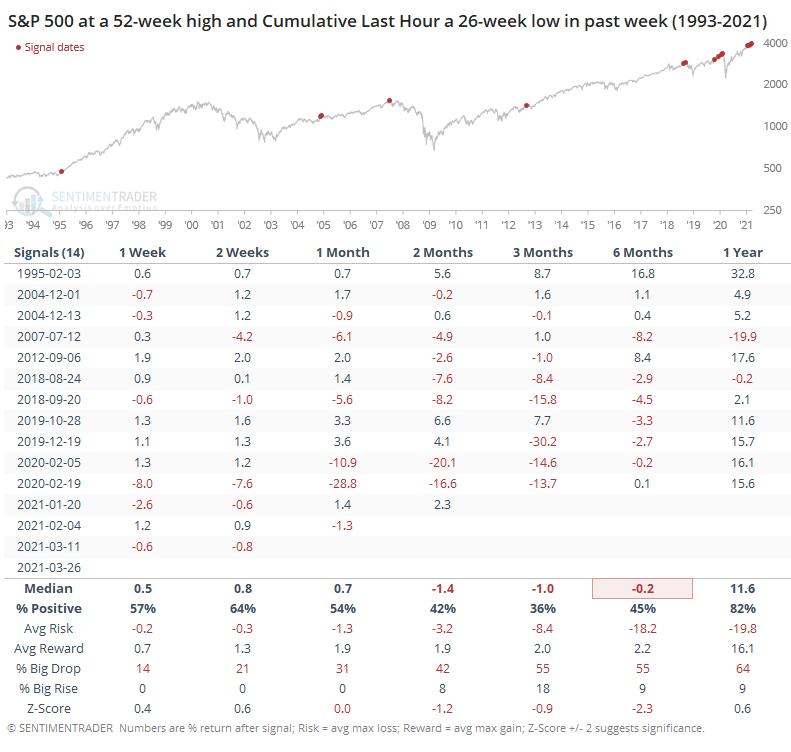
Looking at lesser extremes, when the S&P was at a new high and the Last Hour indicator was at a 6-month low, there were a few more precedents. The only one that saw uninterrupted upside was the first one, back in 1995.
The initial concept of looking at the last hour of trading originated decades ago with the theory that emotional traders make decisions at the open in a knee-jerk reaction to overnight news, while the smart money executed their transactions near the close of trading after absorbing and considering all the data and other traders' reactions.
It's an interesting theory, and probably a good one. It's become less compelling in recent years due to the passive investing trend and the massive amount of volume that funds transact in the last hour nowadays. Maybe that has rendered this indicator useless.
Until there's consistent evidence that that's the case, though, we'll continue to use it as an input, and currently, it is without a doubt signaling caution.
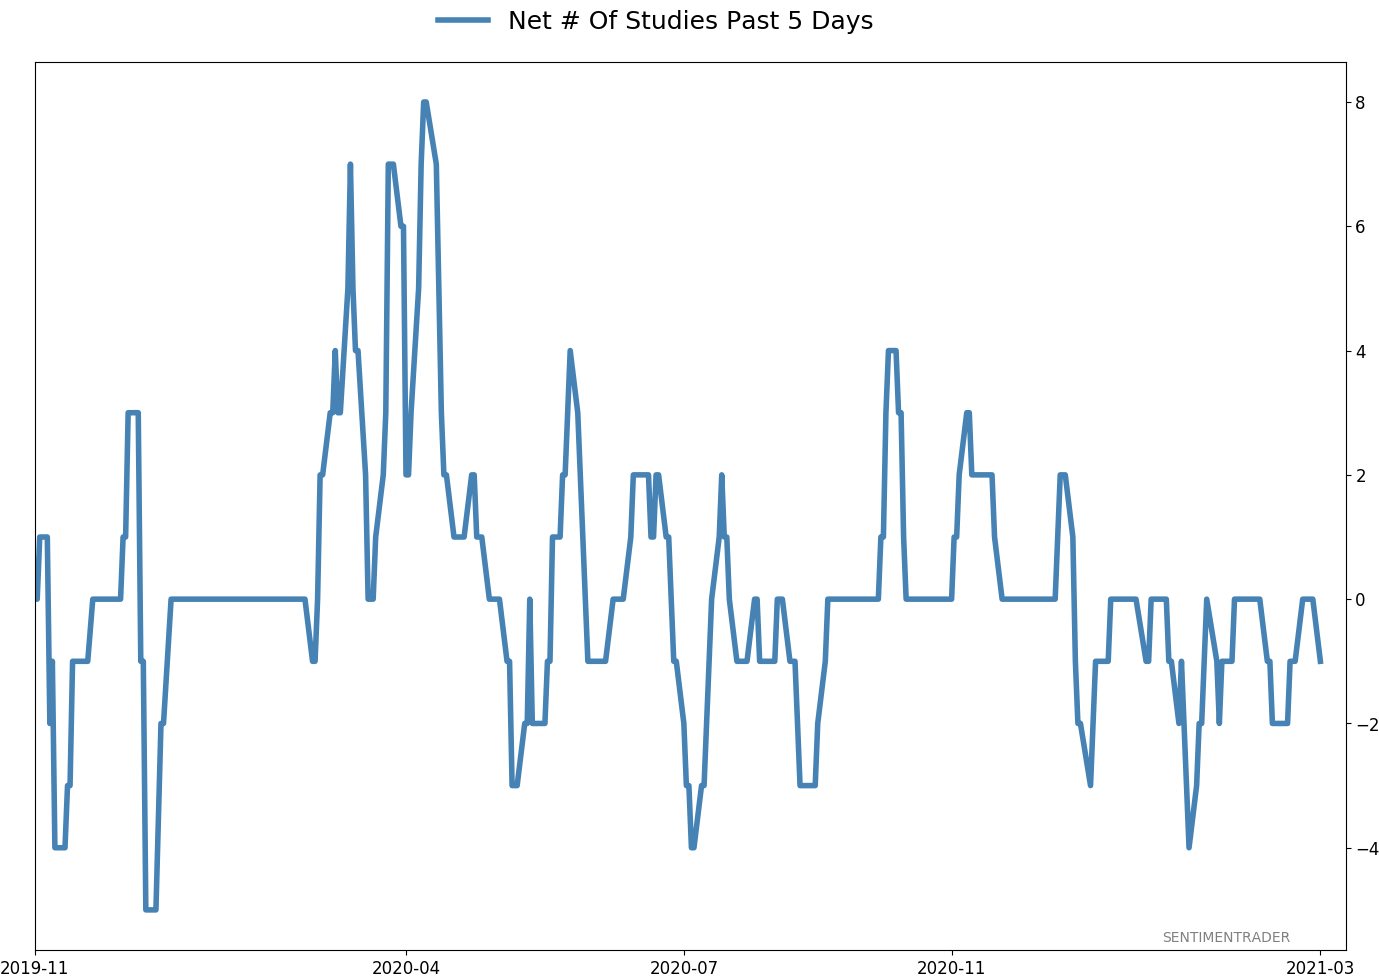
Active Studies
| Time Frame | Bullish | Bearish | | Short-Term | 0 | 0 | | Medium-Term | 0 | 10 | | Long-Term | 11 | 4 |
|
Indicators at Extremes
Portfolio
| Position | Description | Weight % | Added / Reduced | Date | | Stocks | RSP | 4.9 | Reduced 4% | 2021-02-09 | | Bonds | 30.0% BND, 8.8% SCHP | 38.8 | Added 15.1% | 2021-02-18 | | Commodities | GCC | 2.3 | Reduced 2.1%
| 2020-09-04 | | Precious Metals | GDX | 9.0 | Added 0.1% | 2021-02-18 | | Special Situations | 7.3% XLE, 4.8% PSCE | 12.1 | Reduced 5.6% | 2021-02-18 | | Cash | | 32.8 | | |
|
Updates (Changes made today are underlined)
With a market that has seen the kinds of broad participation and big breath thrusts like we did in the fall, it's hard to become too negative. Those kinds of conditions have consistently preceded higher returns over the next 6-12 months. It's the interim that's more of an issue. Even conditions like that haven't prevented some shorter-term pullbacks. And when we combine an environment where speculation is rampant and recent days have seen an increase in cracks under the surface of the indexes, it's enough to become more defensive over a short- to medium-term time frame. We still don't have much confirmation from the price action in the indexes, so those who are more conservative would likely wait before increasing cash levels. I've decreased risk exposure a bit more, mainly in terms of energy stocks and the ANGL fund, while adding more to the broader bond market. RETURN YTD: 5.9% 2020: 8.1%, 2019: 12.6%, 2018: 0.6%, 2017: 3.8%, 2016: 17.1%, 2015: 9.2%, 2014: 14.5%, 2013: 2.2%, 2012: 10.8%, 2011: 16.5%, 2010: 15.3%, 2009: 23.9%, 2008: 16.2%, 2007: 7.8%
|
|
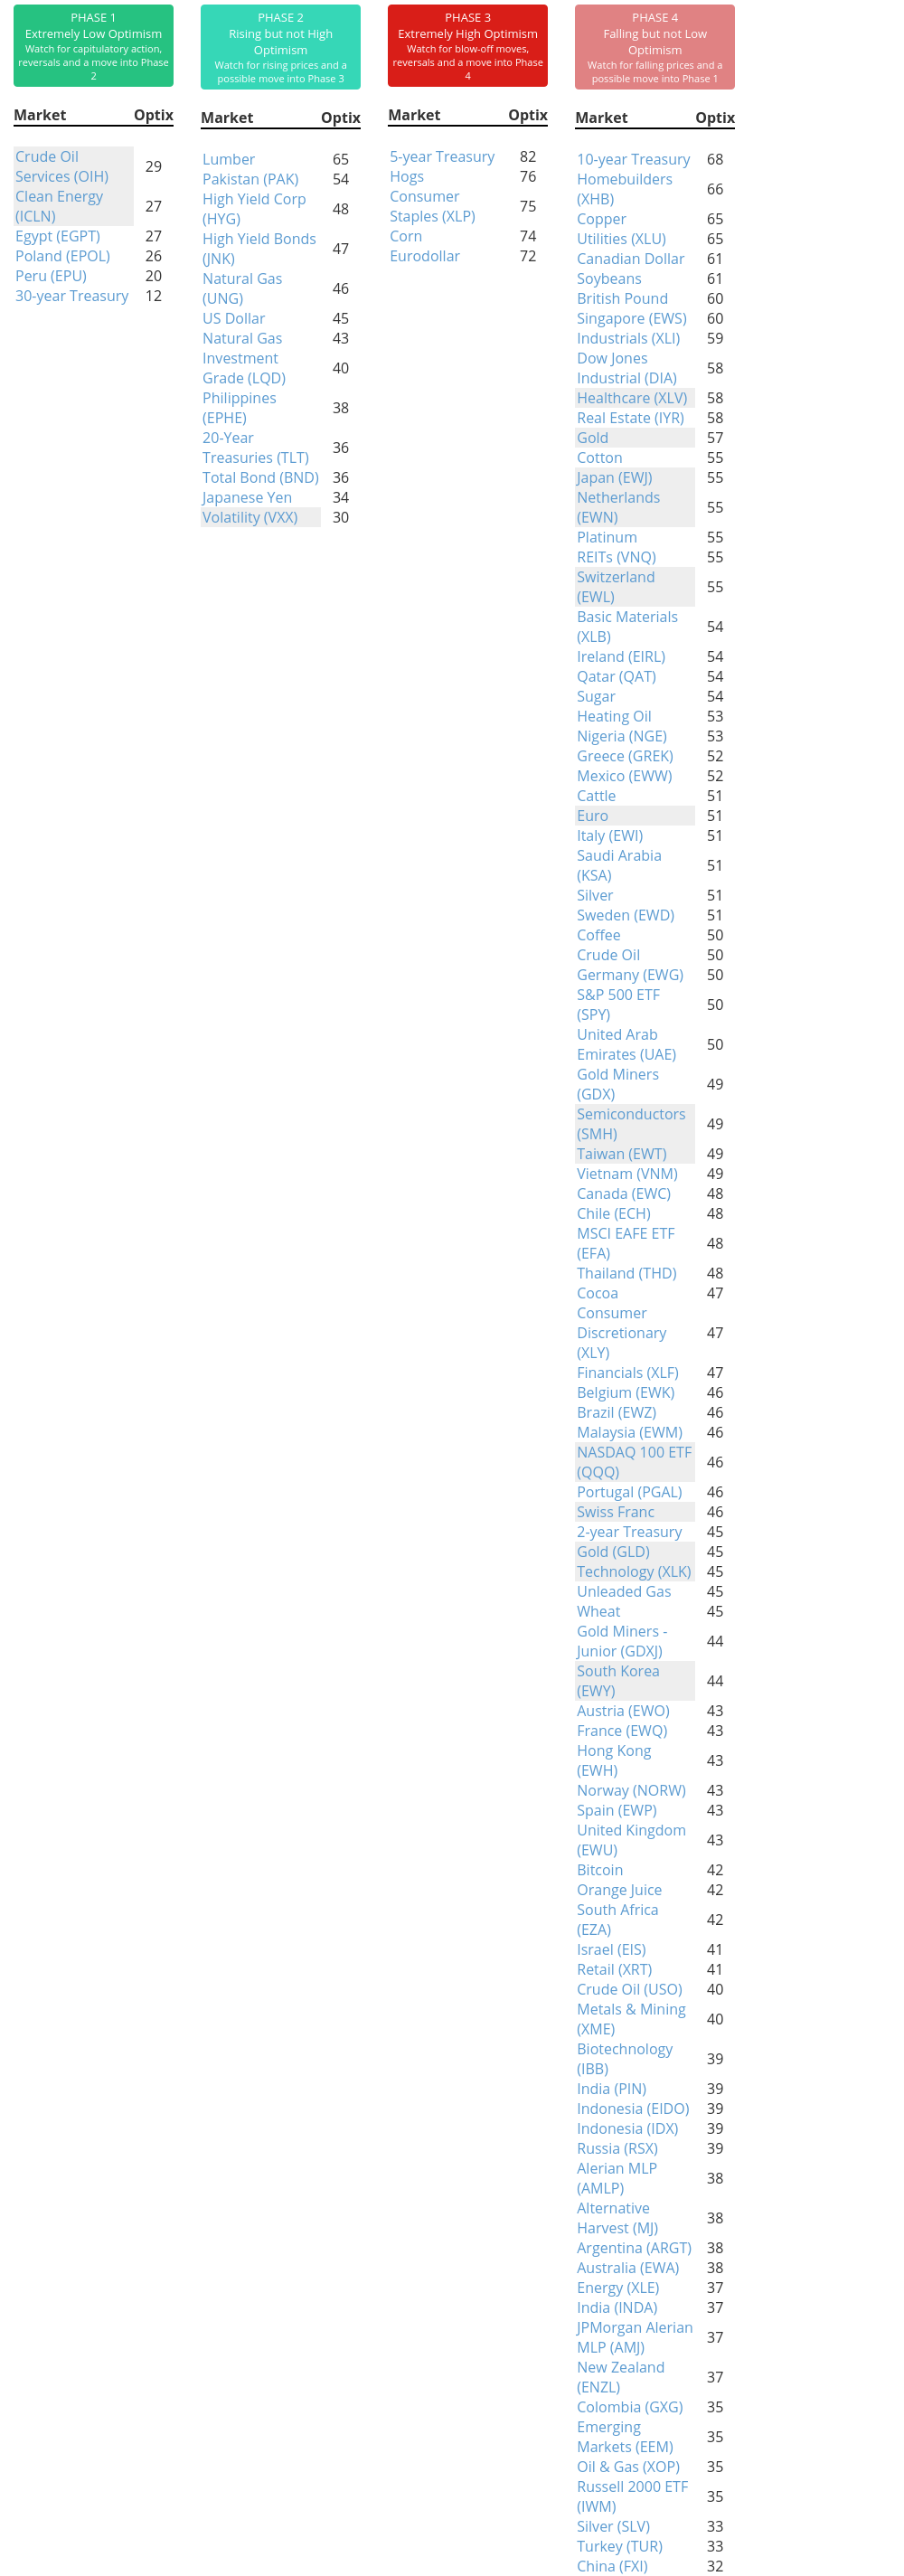
Phase Table
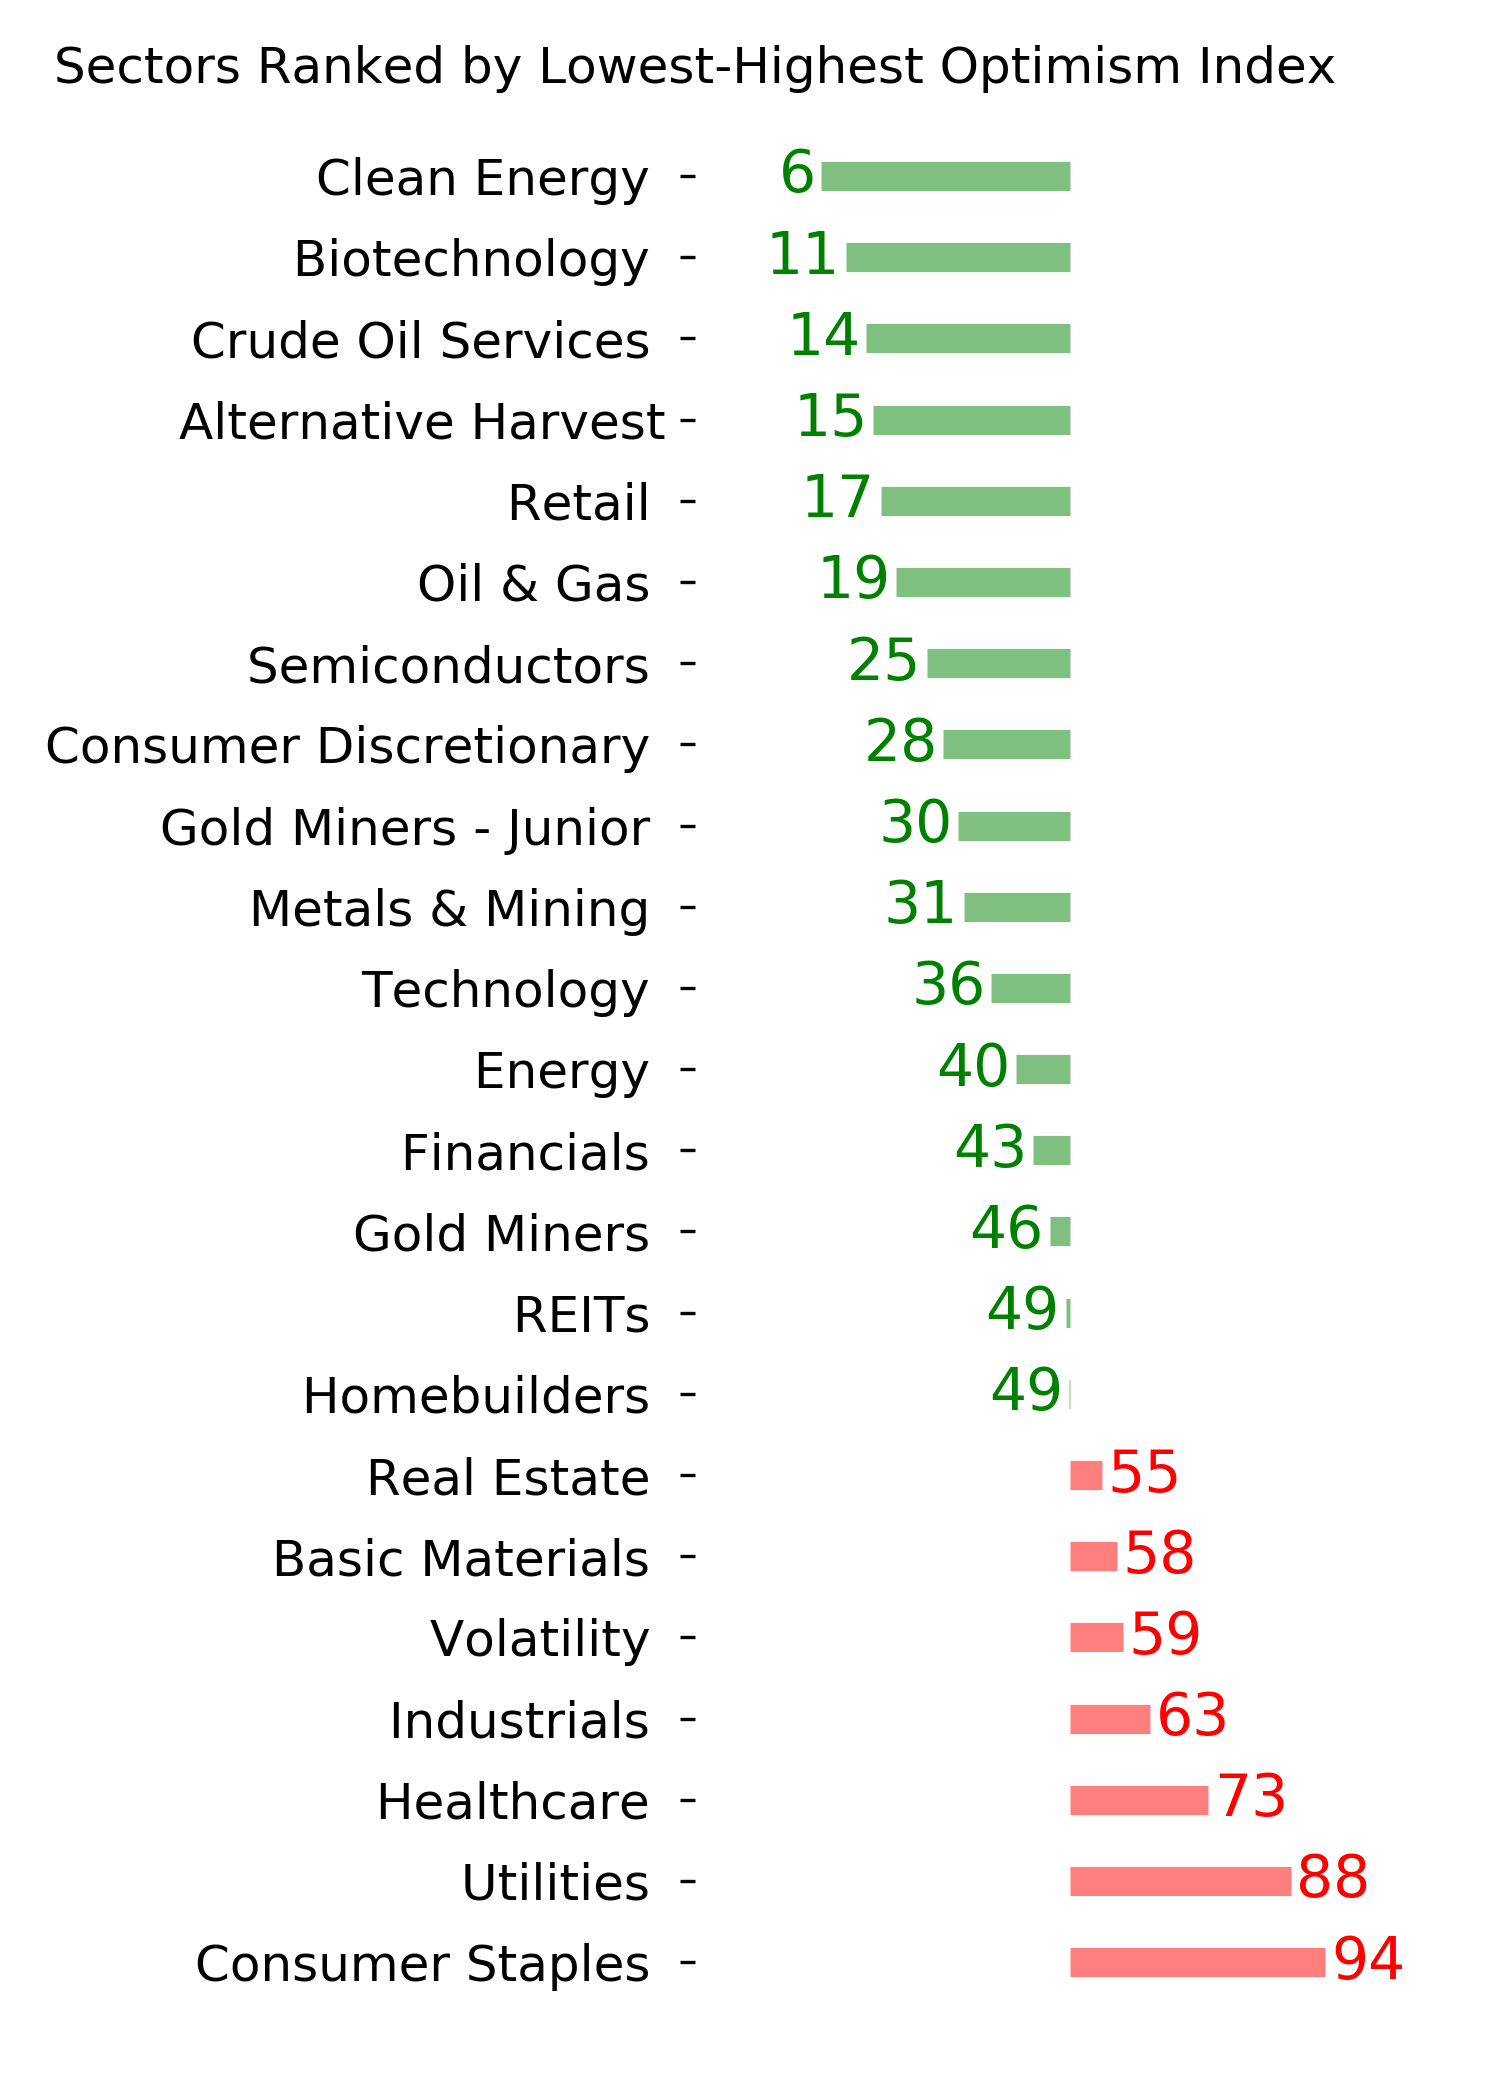
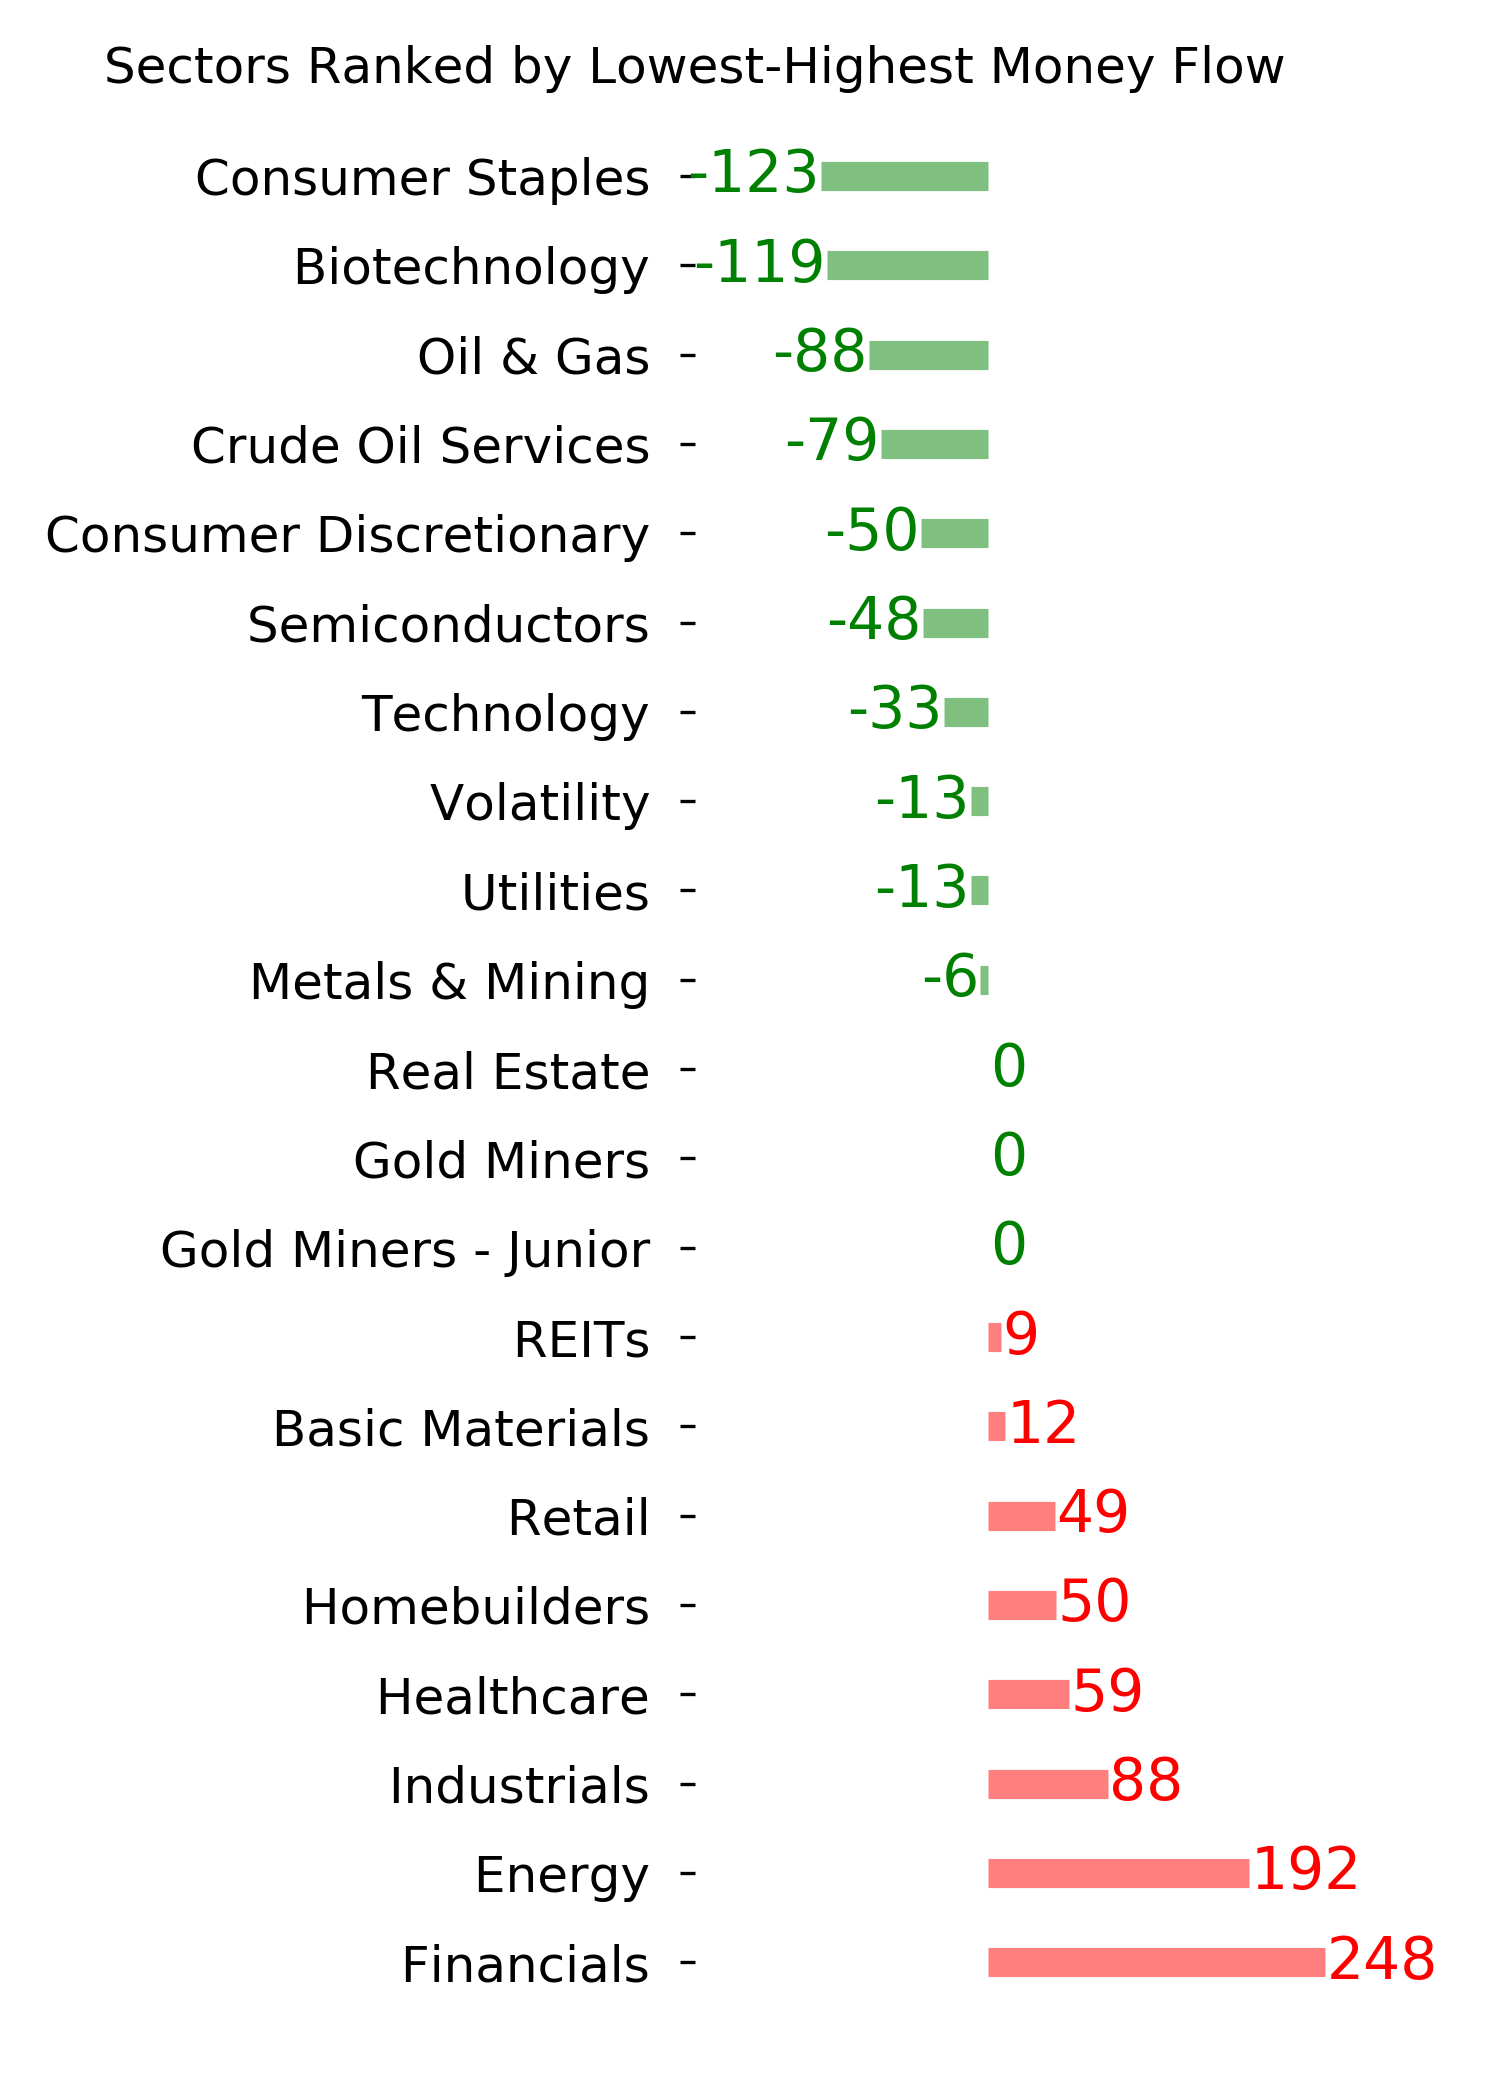
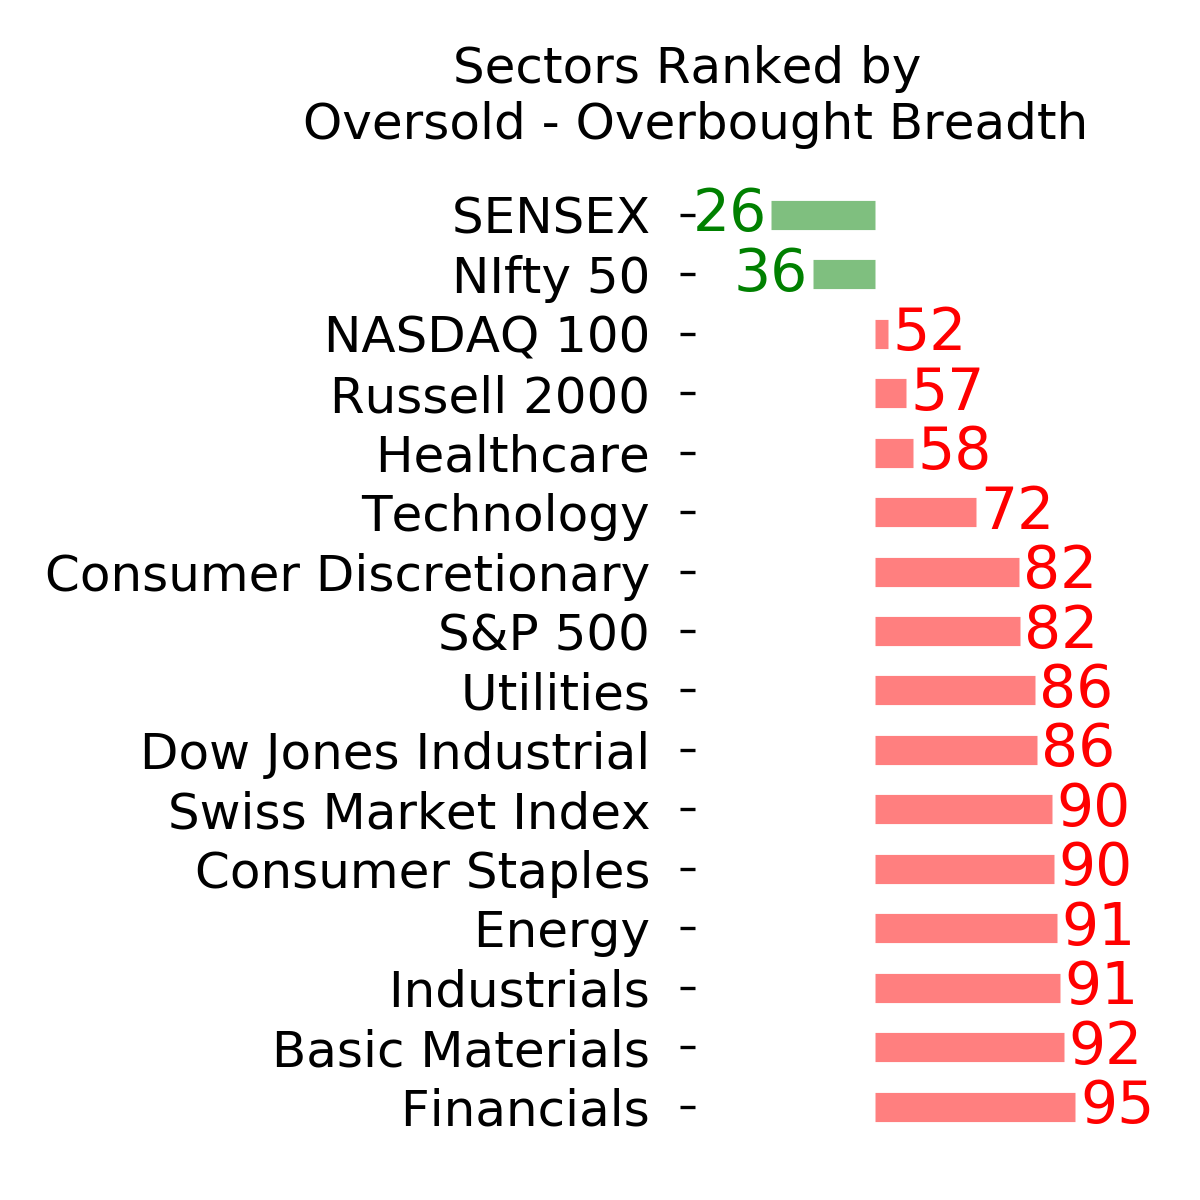
Ranks
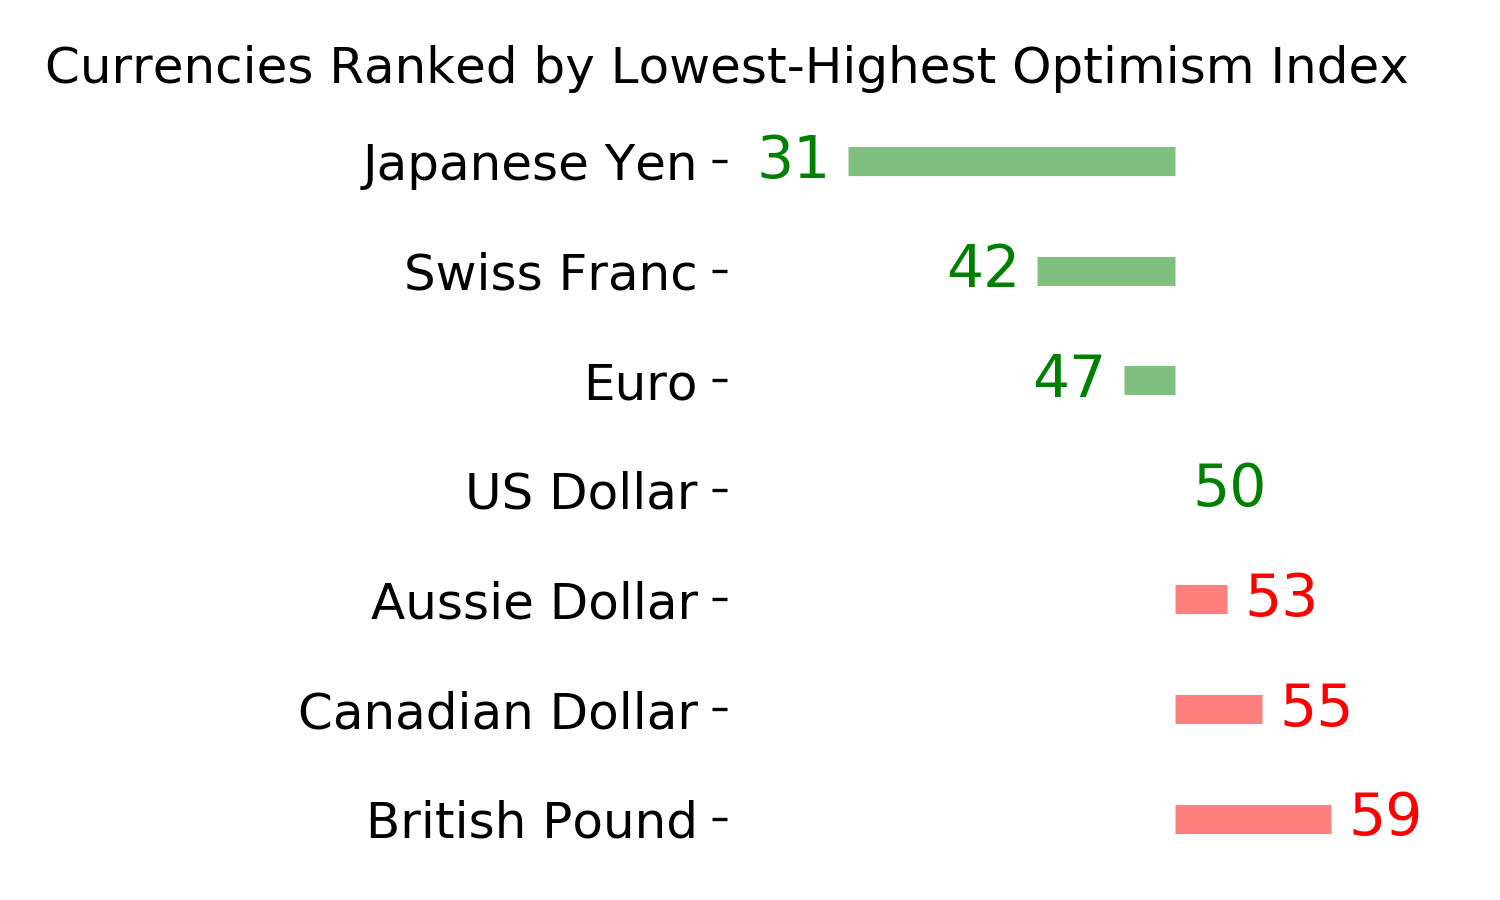
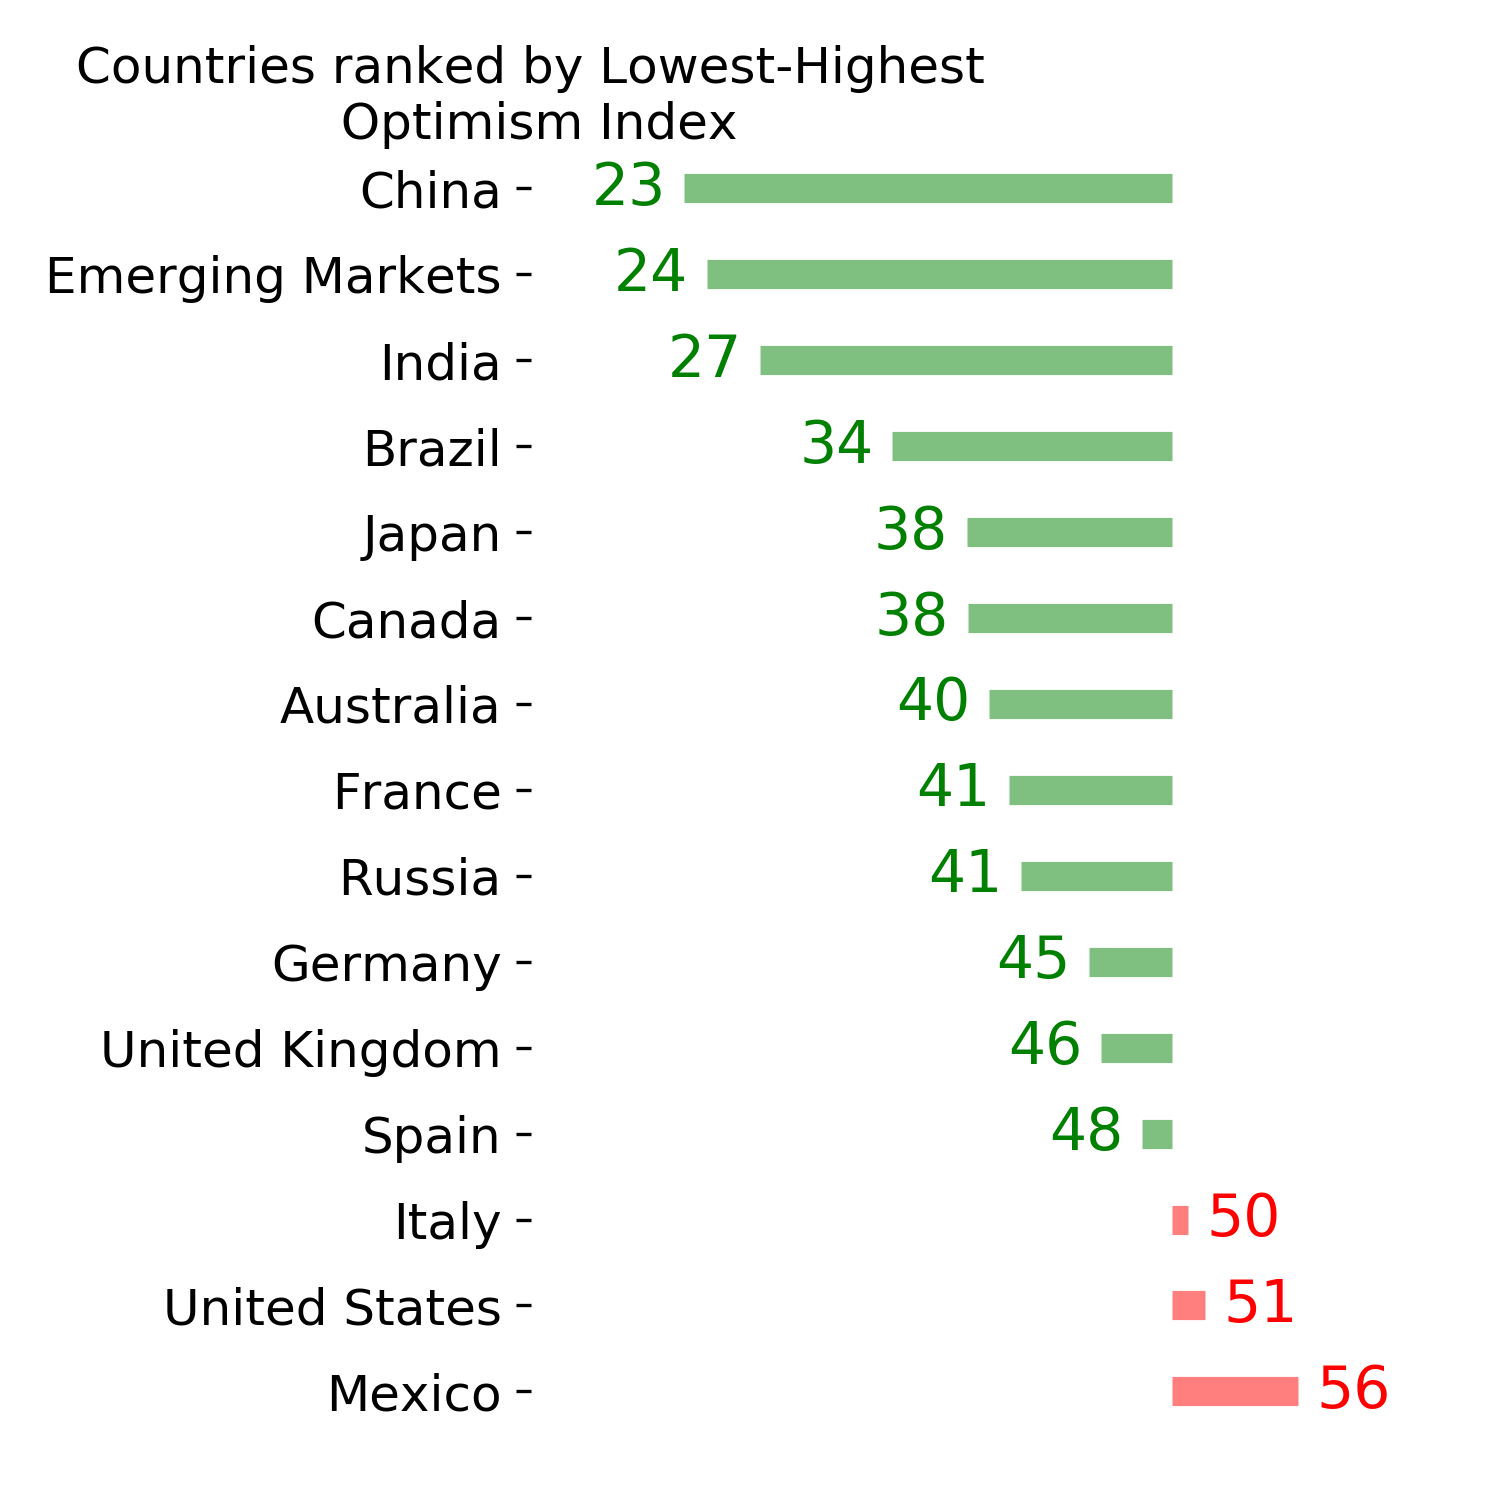
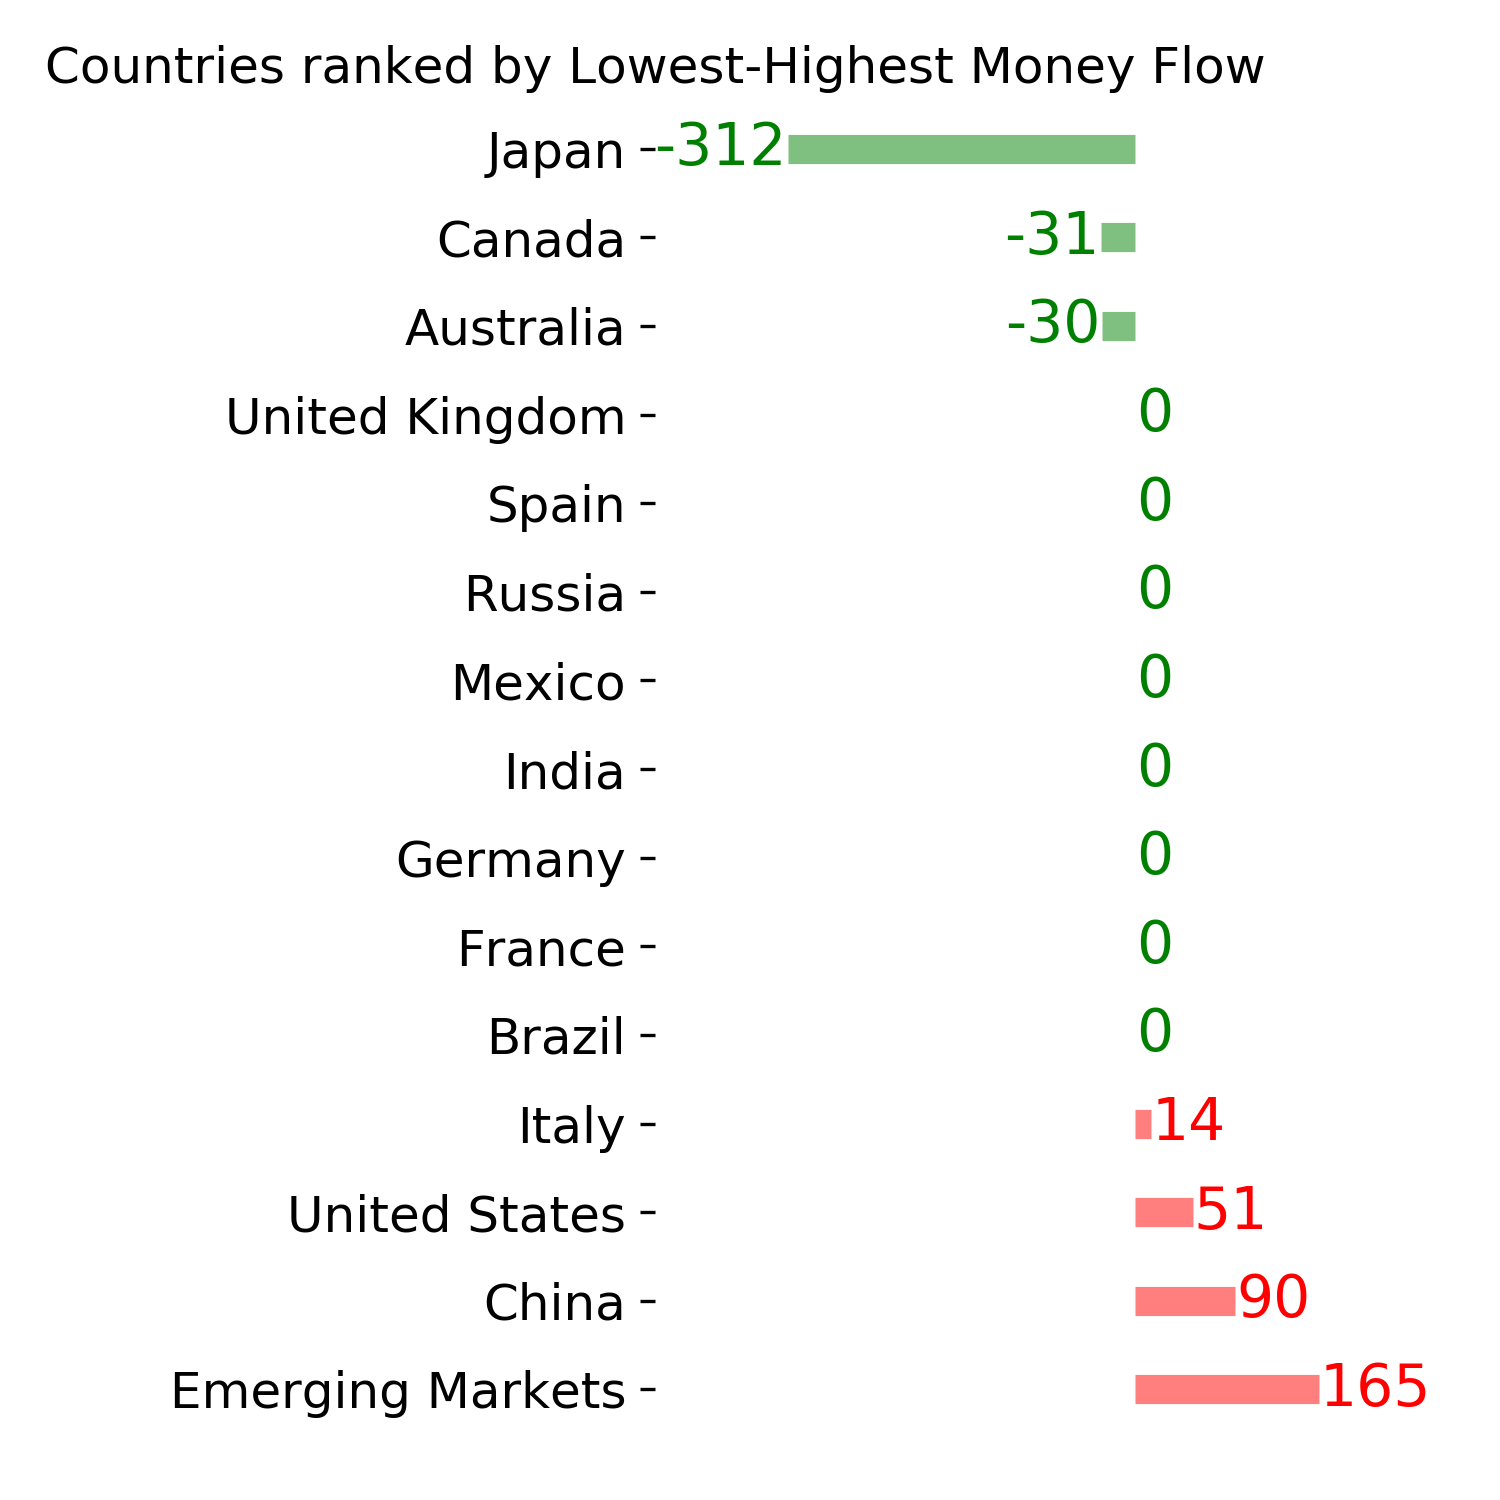
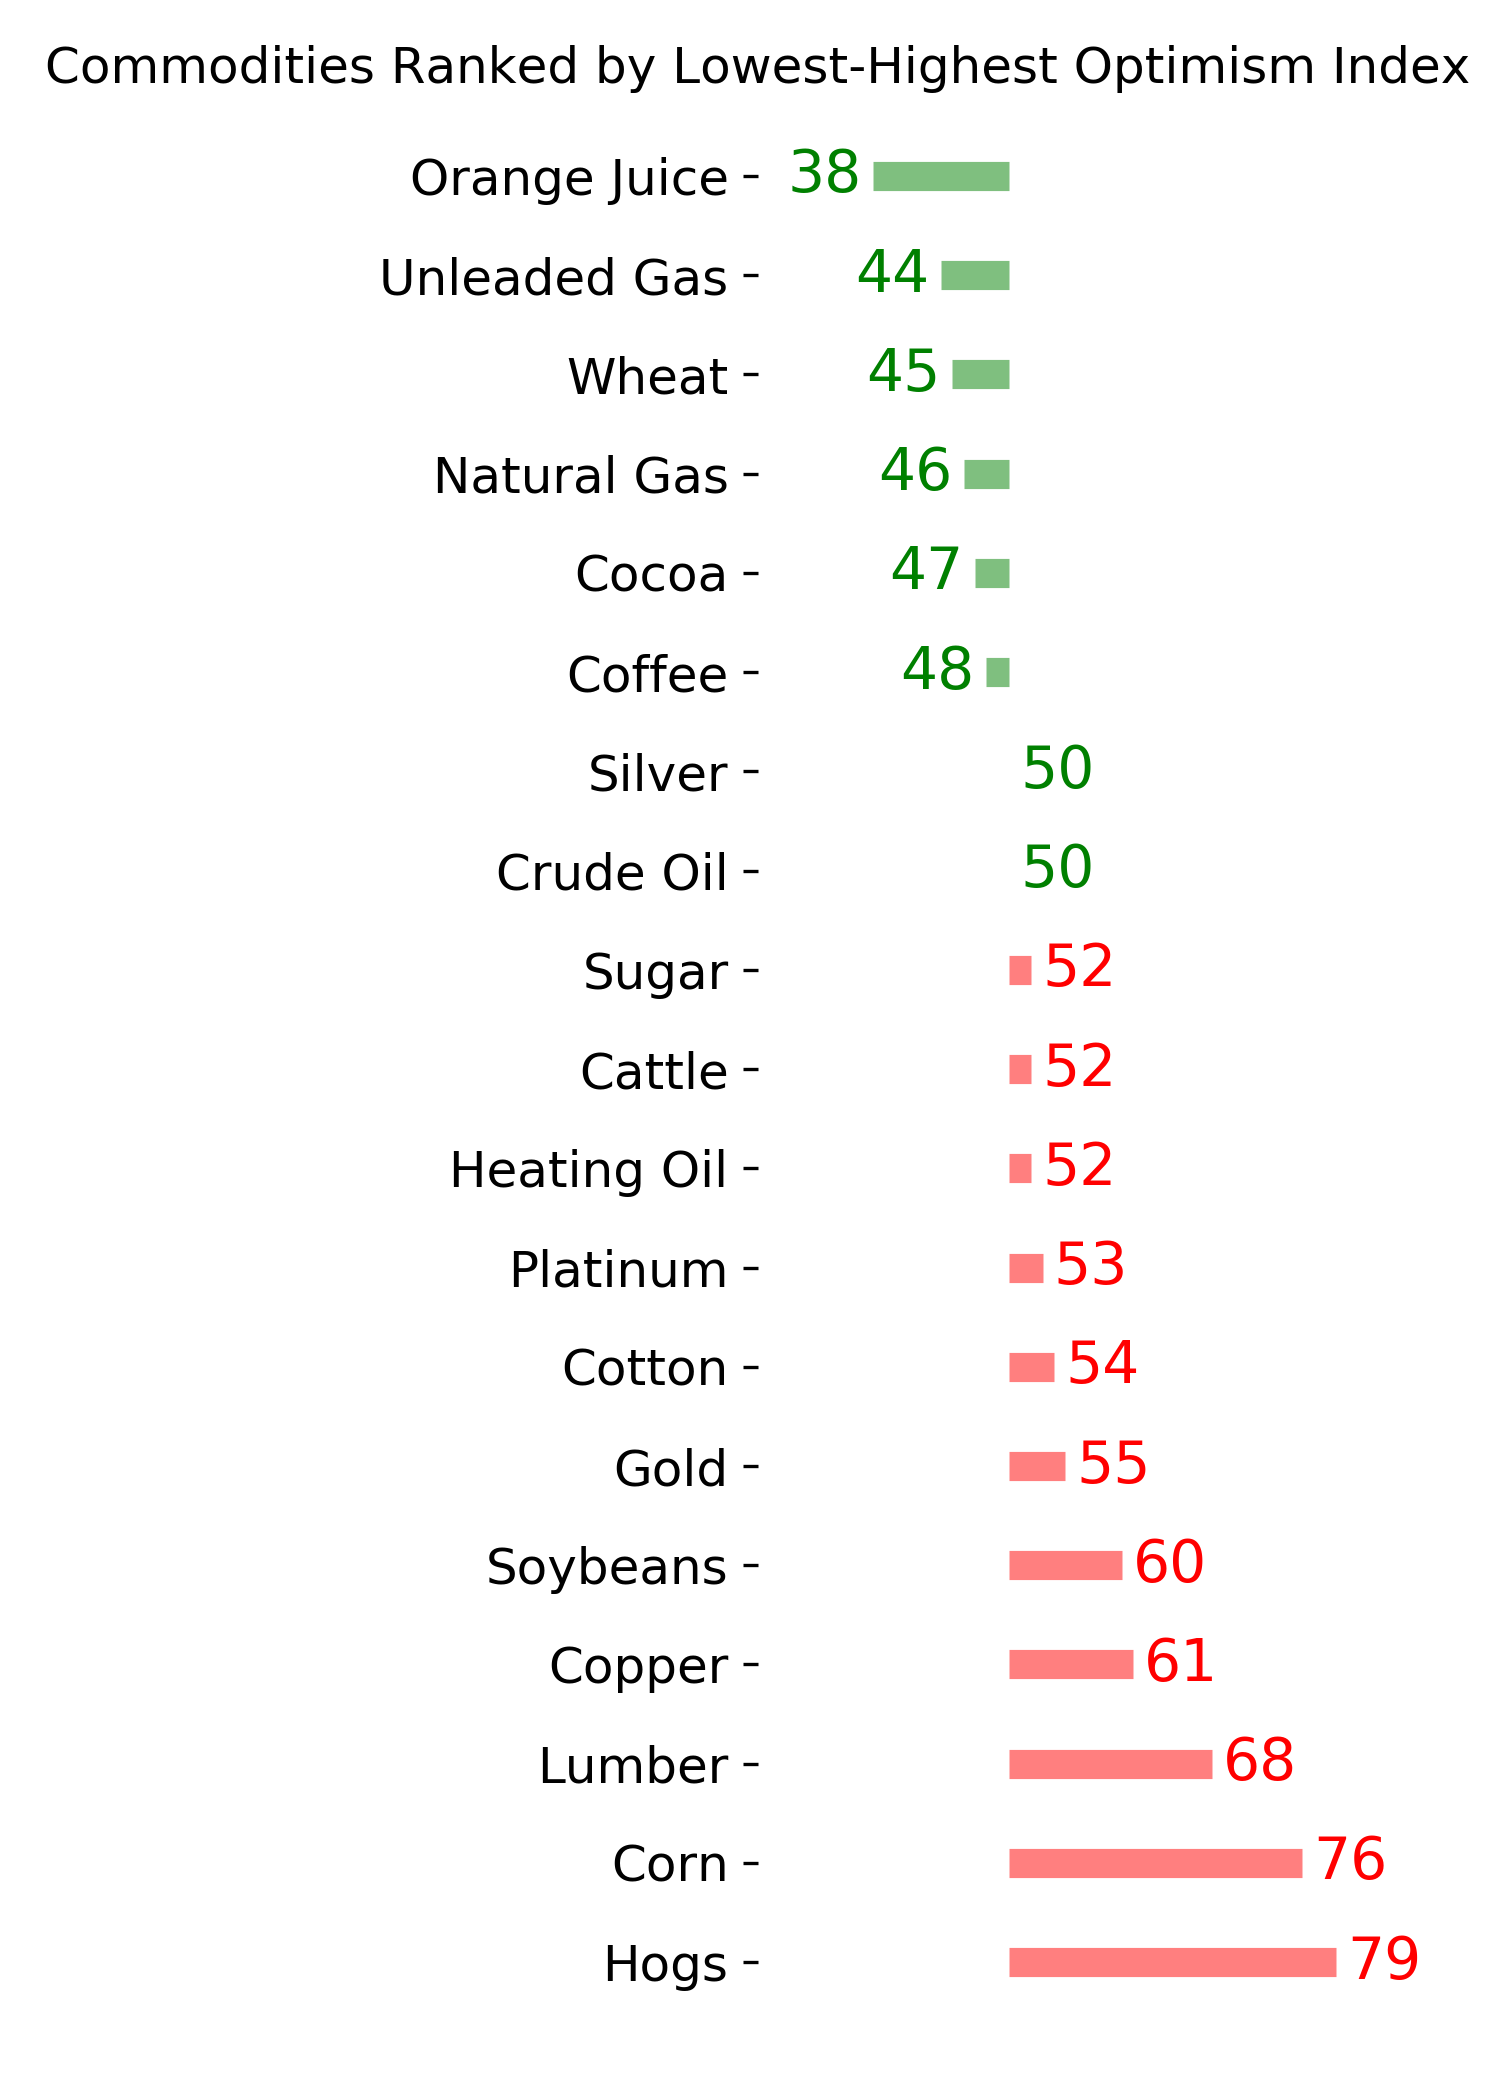
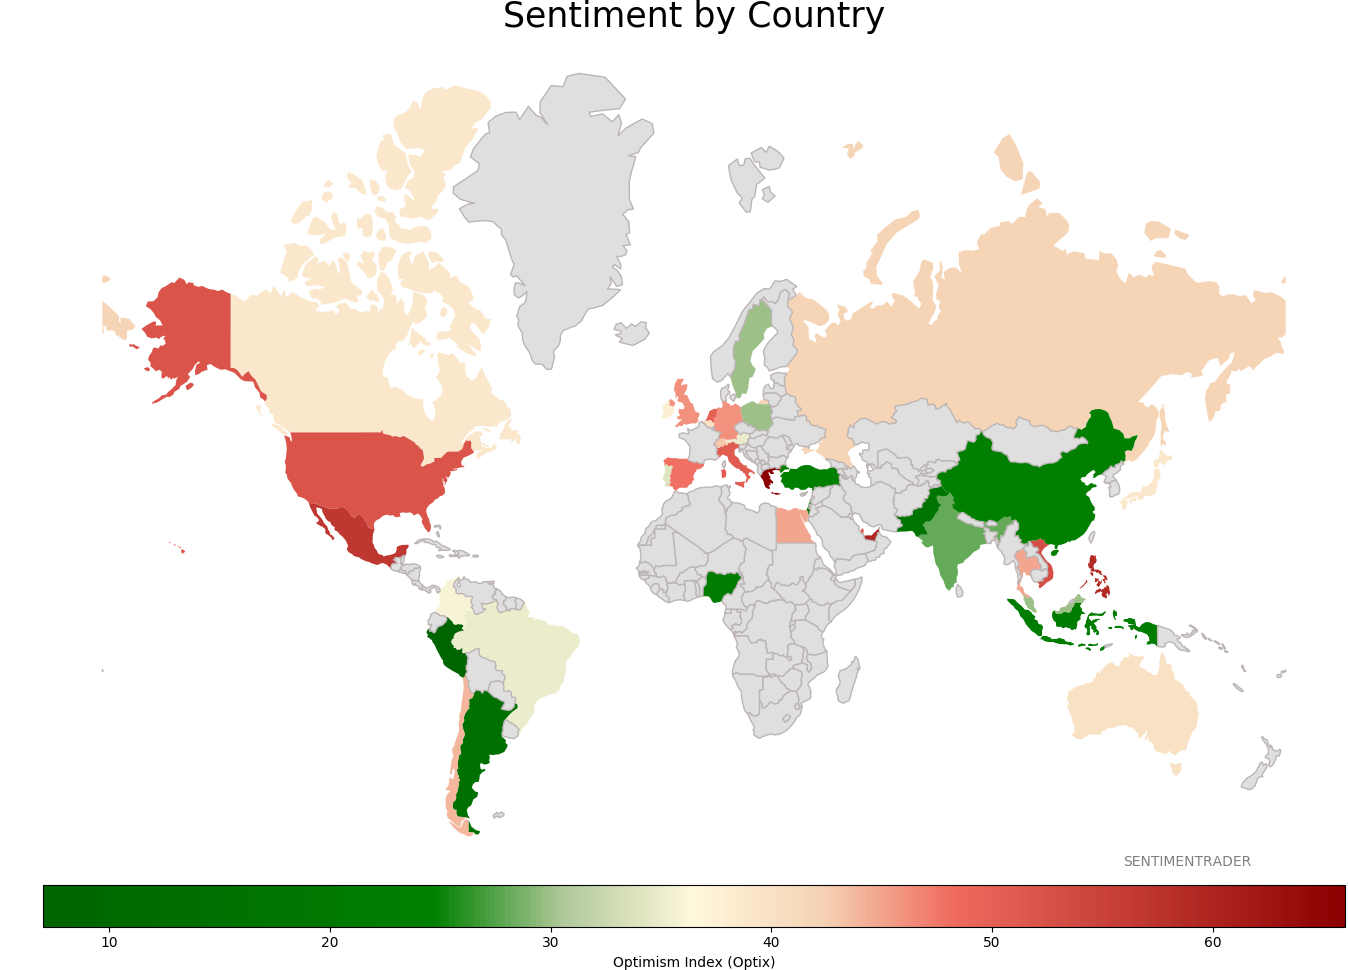
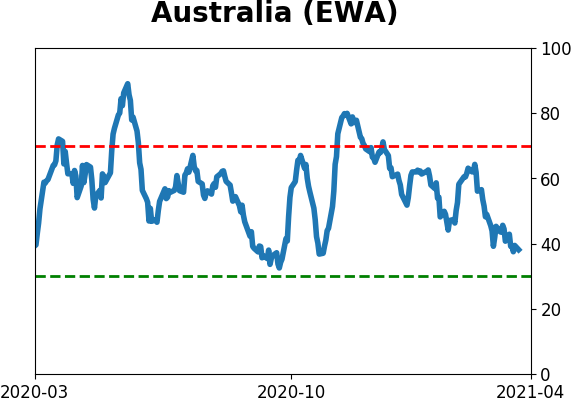
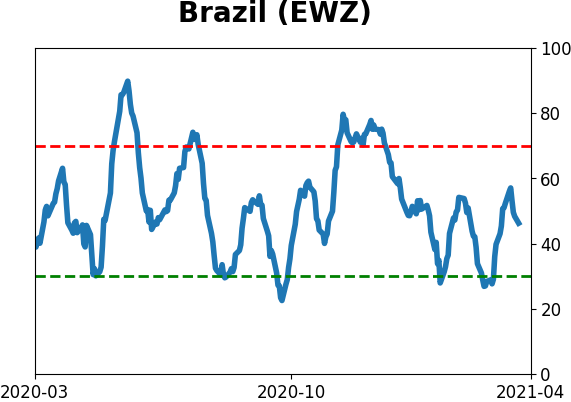
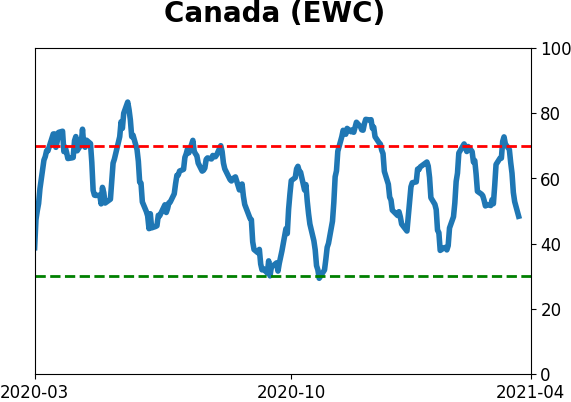
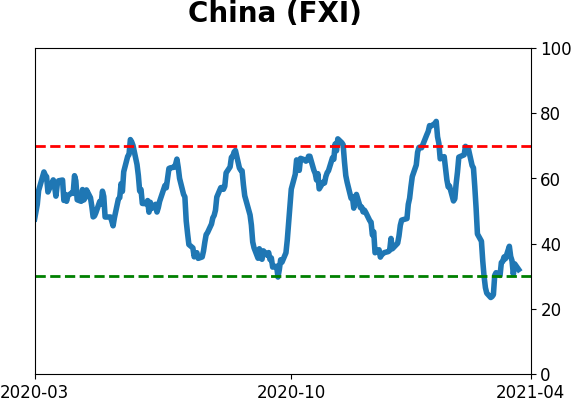
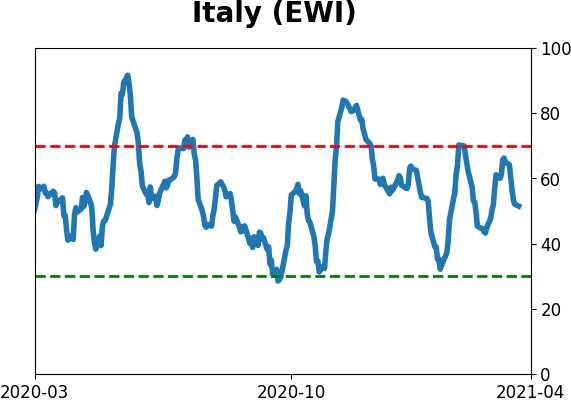
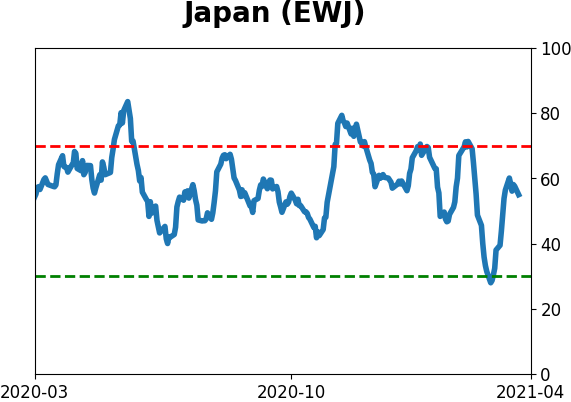
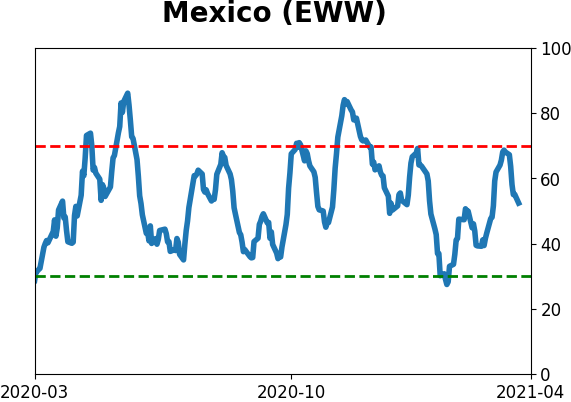
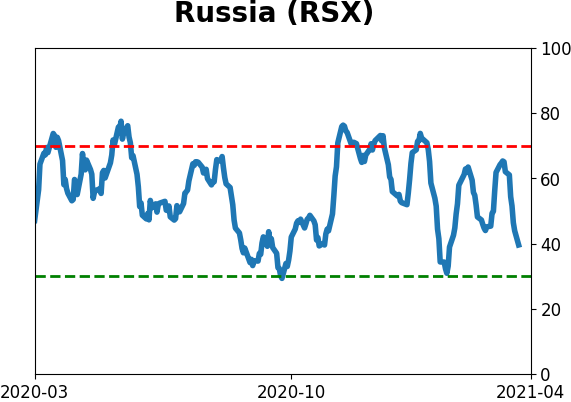
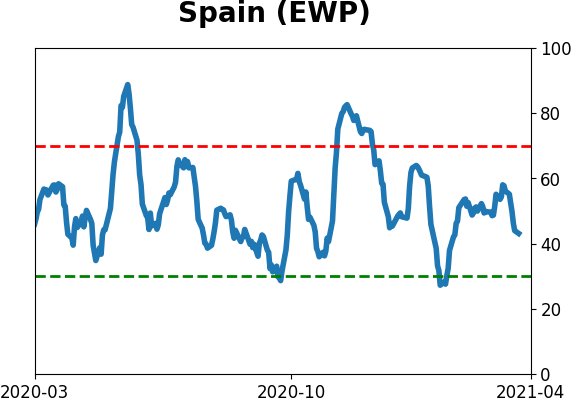
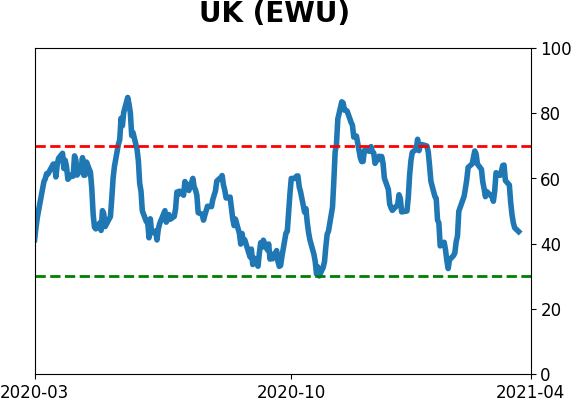
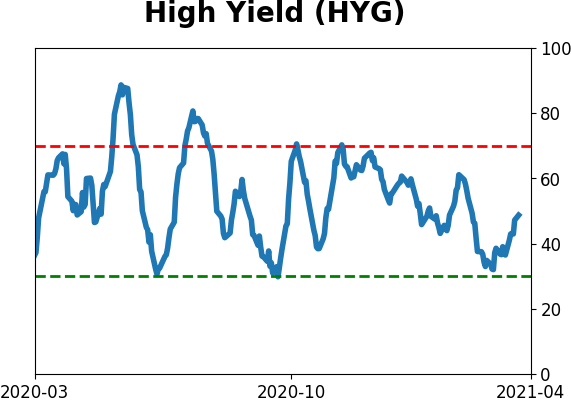
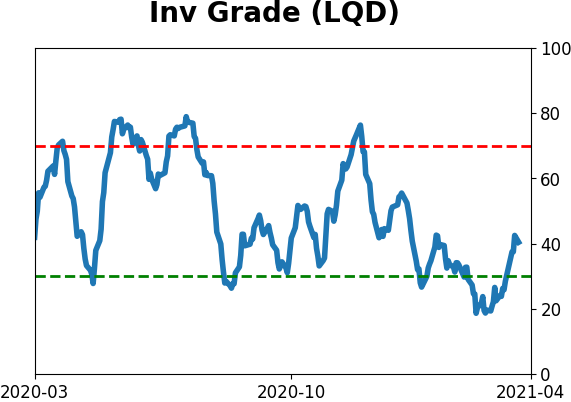
Sentiment Around The World
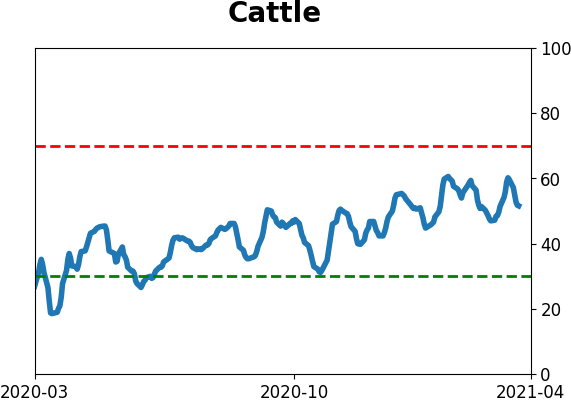
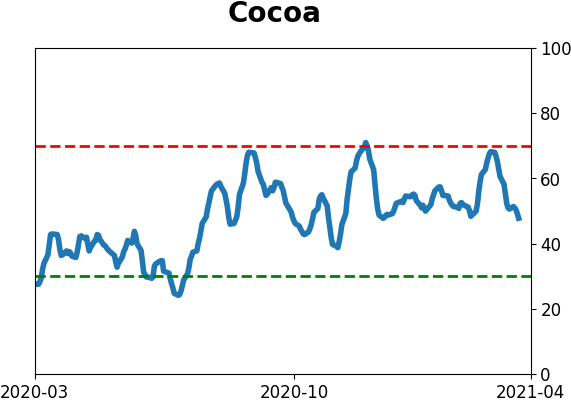
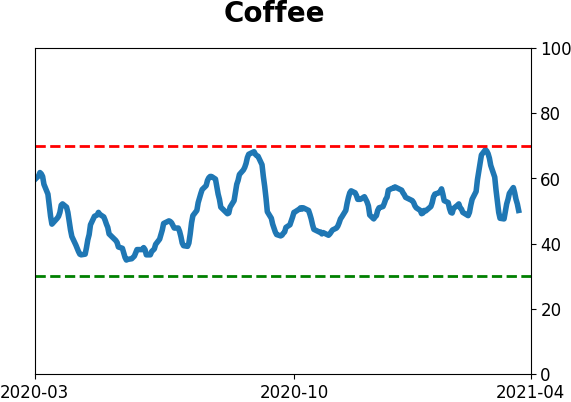
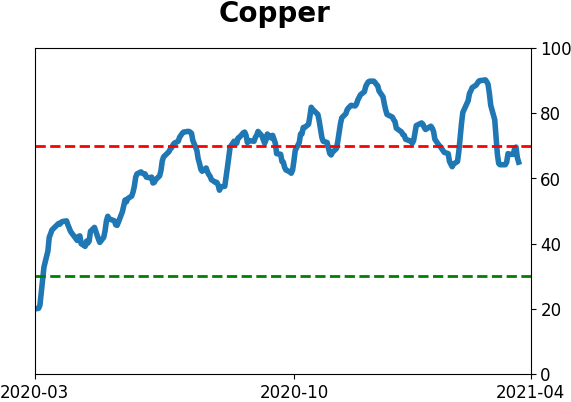
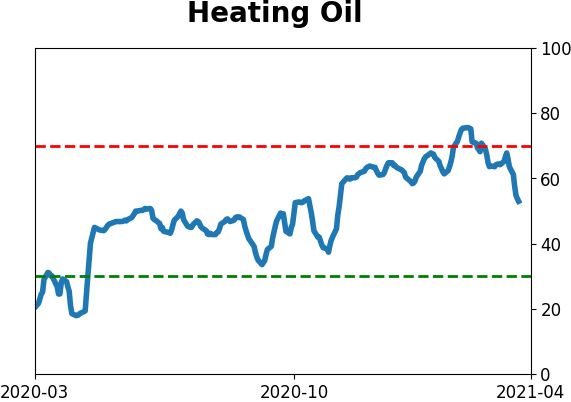
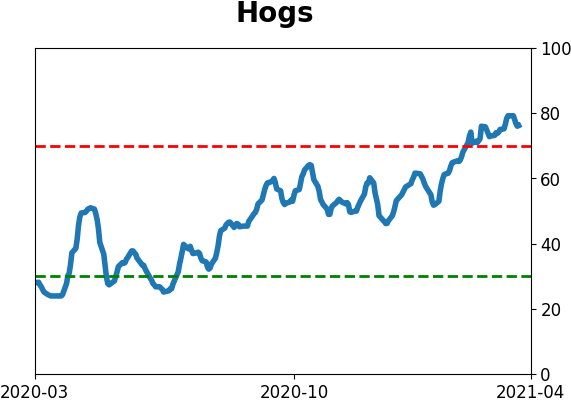
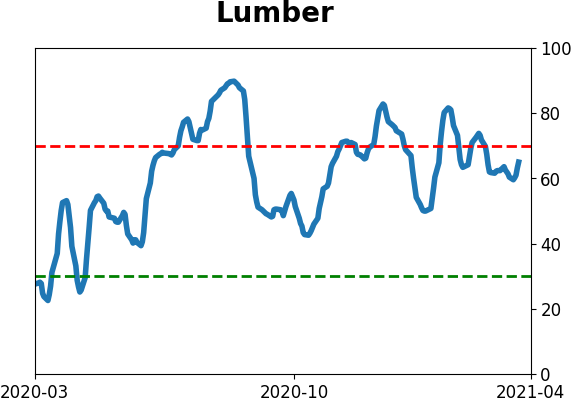
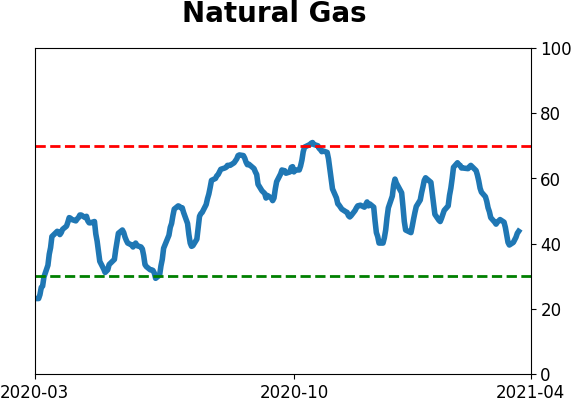
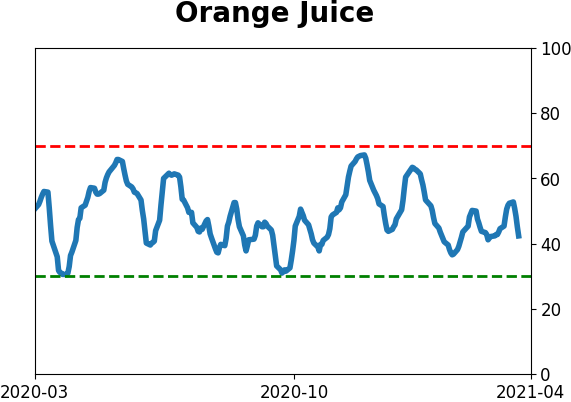
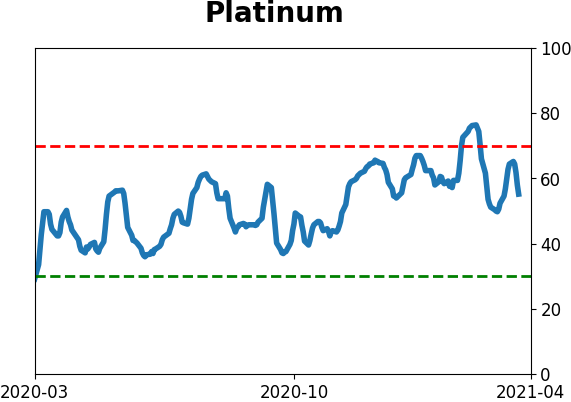
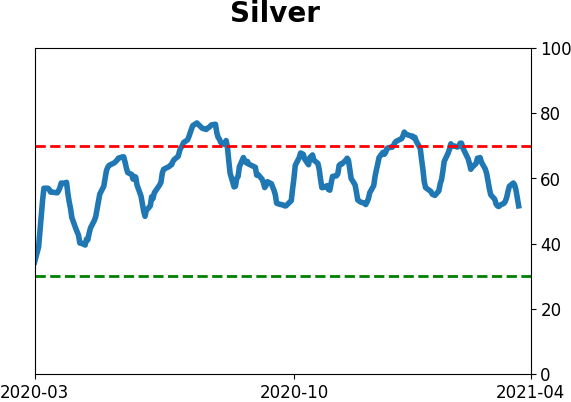
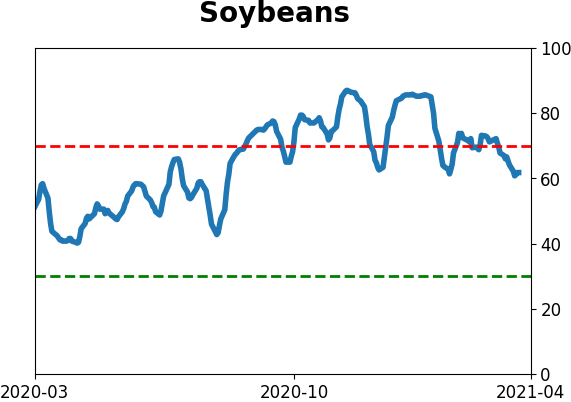
Optimism Index Thumbnails
|
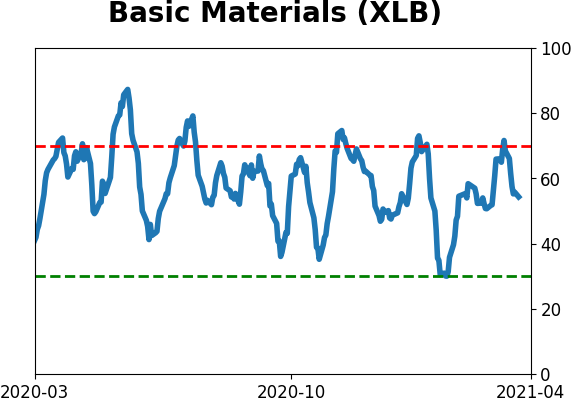
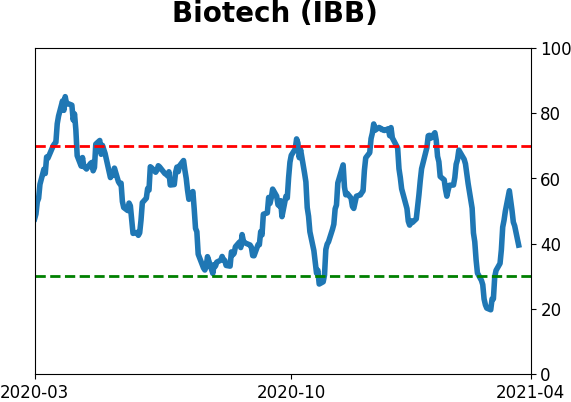
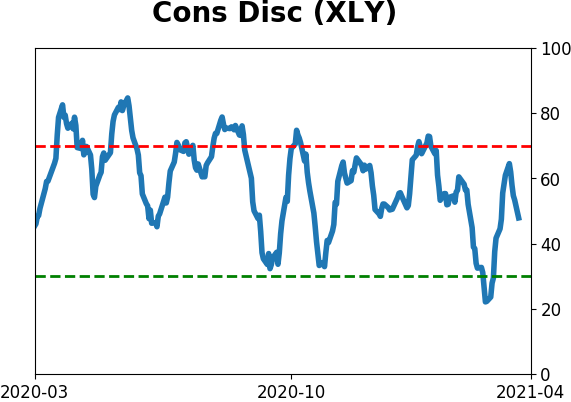
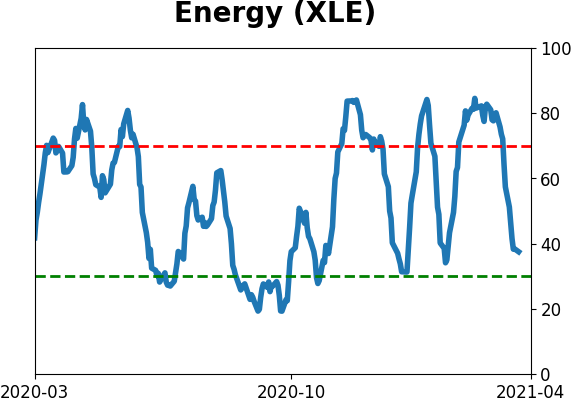
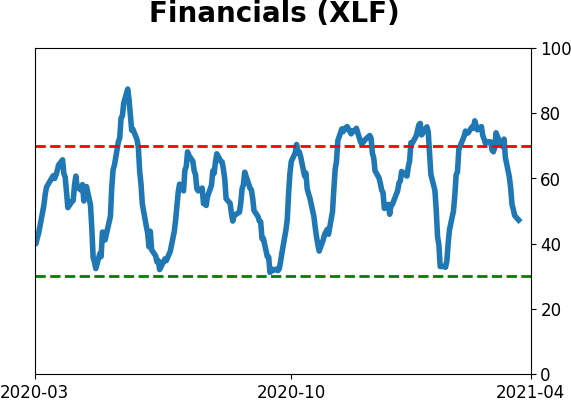
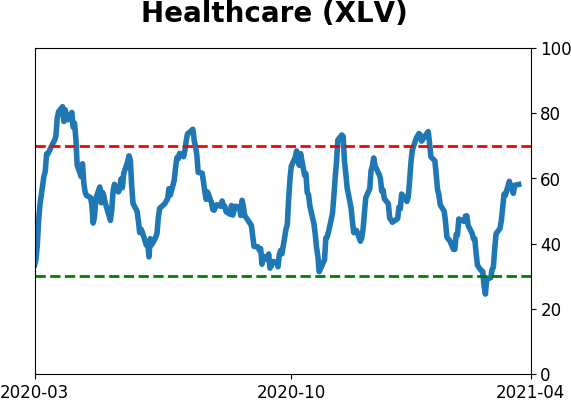
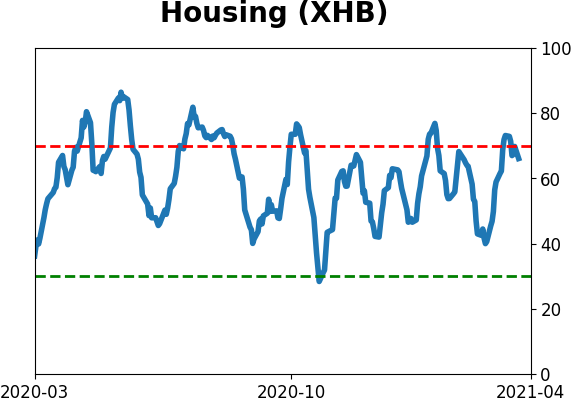
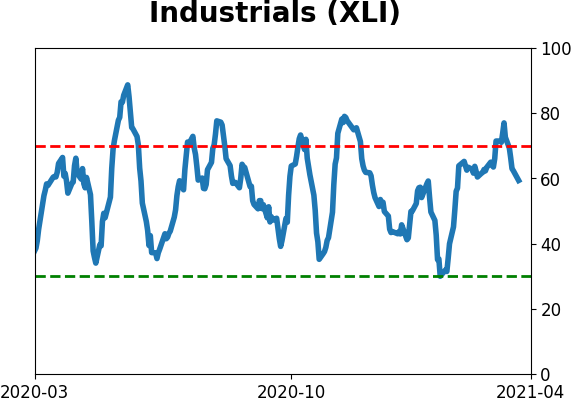
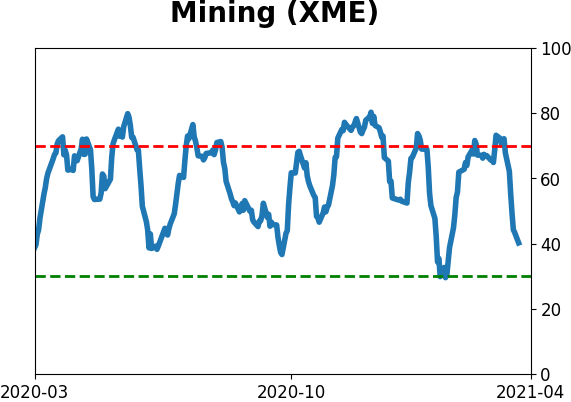
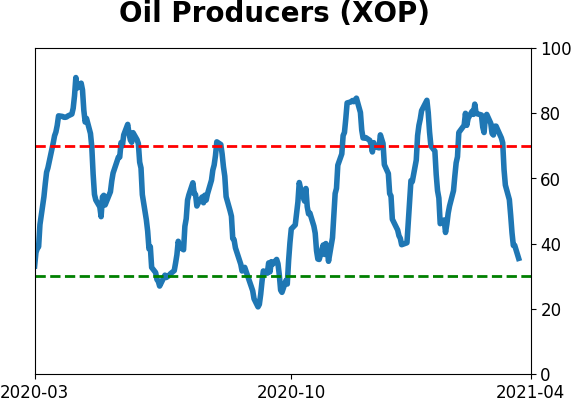
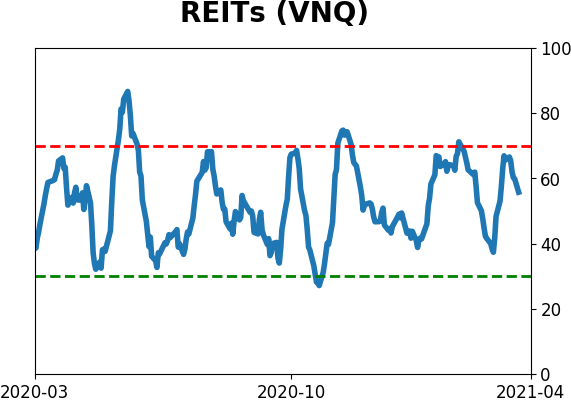
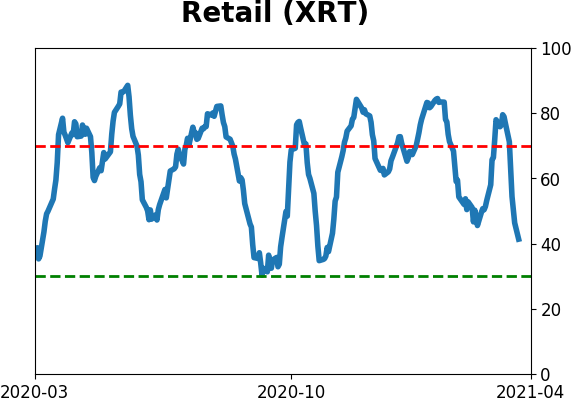
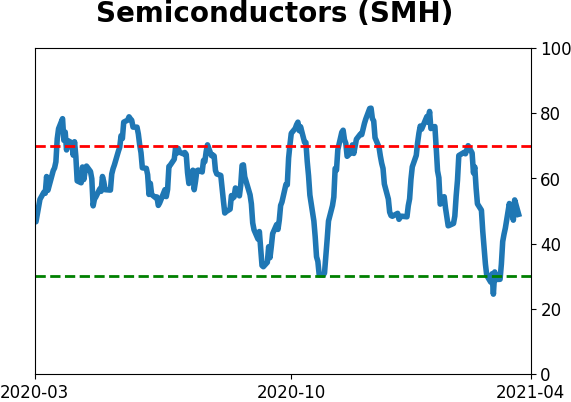
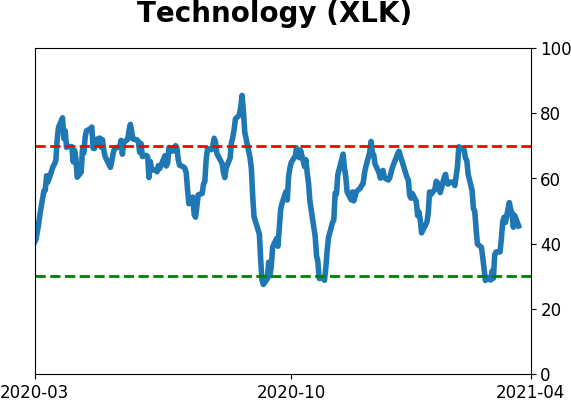
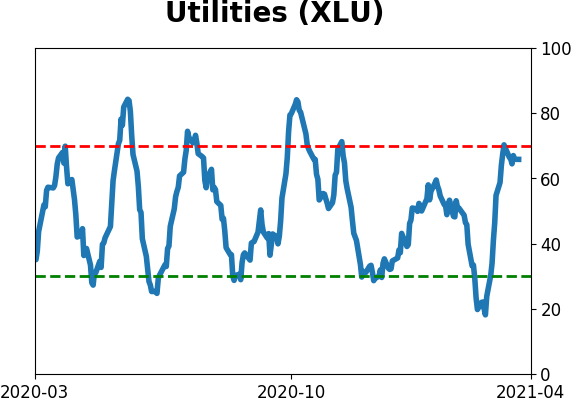
Sector ETF's - 10-Day Moving Average
|
|
|
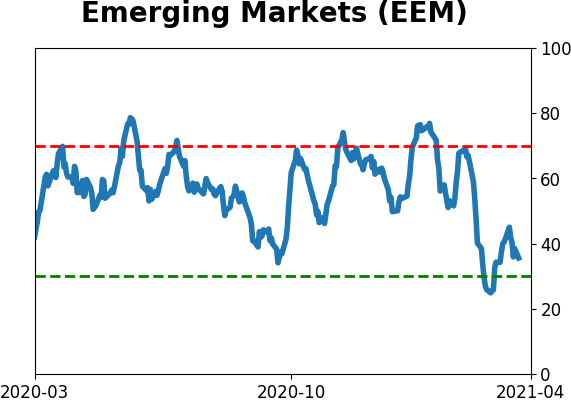
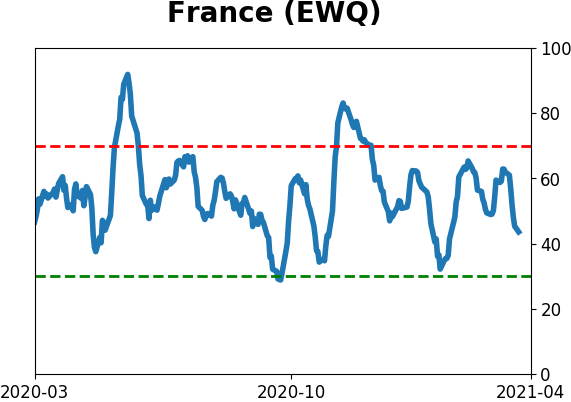
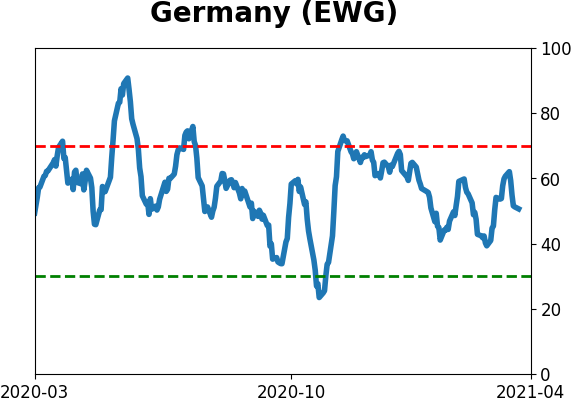
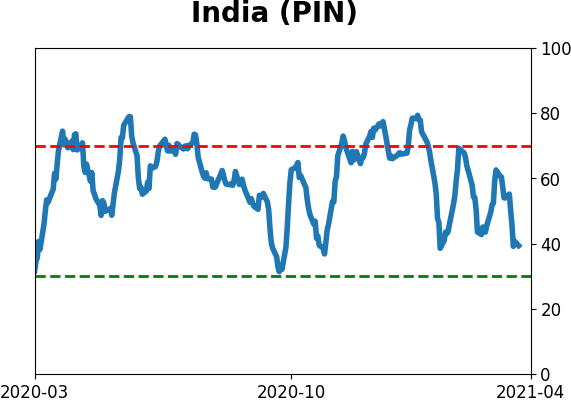
Country ETF's - 10-Day Moving Average
|
|
|
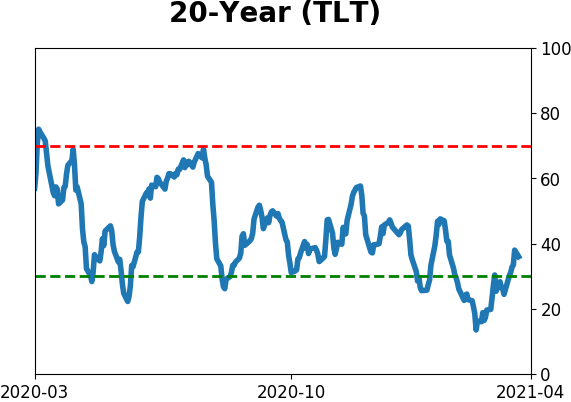
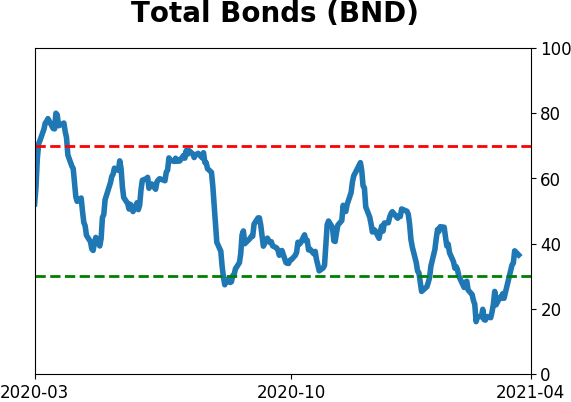
Bond ETF's - 10-Day Moving Average
|
|
|
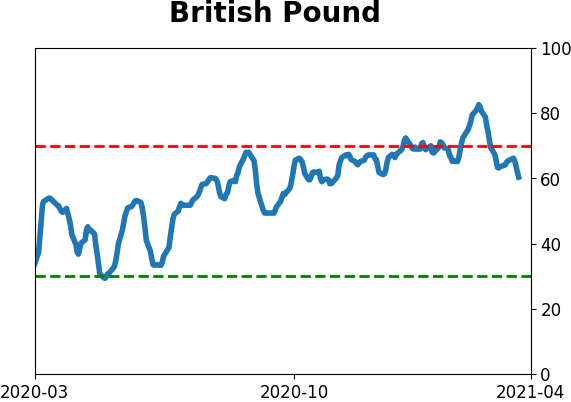
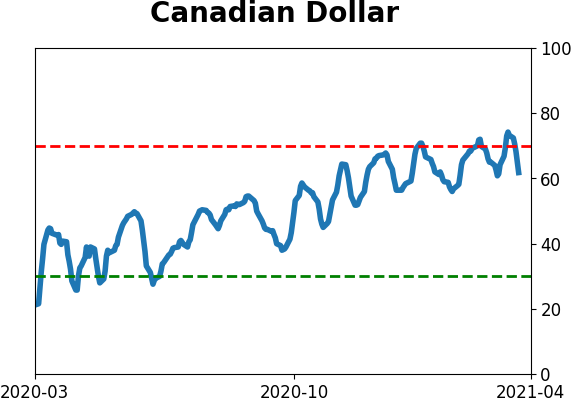
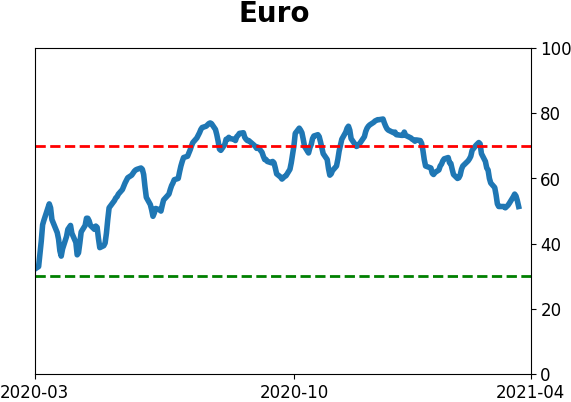
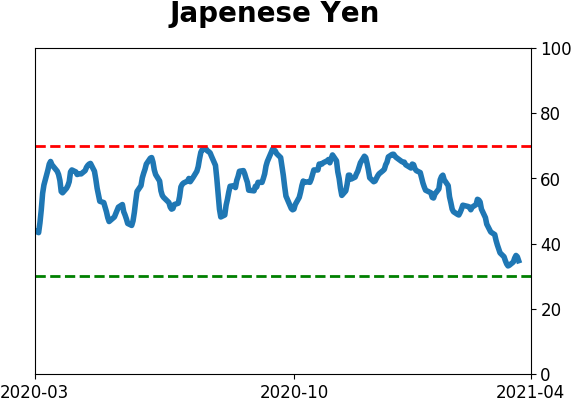
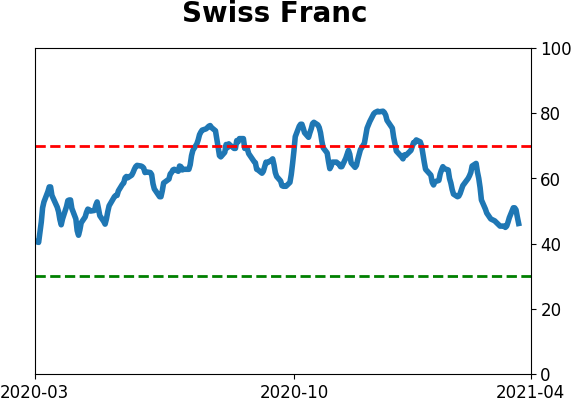
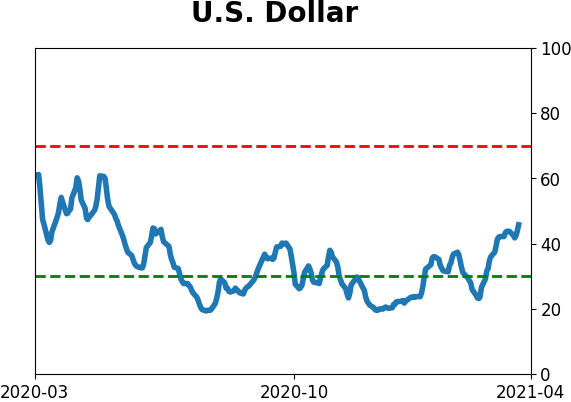
Currency ETF's - 5-Day Moving Average
|
|
|
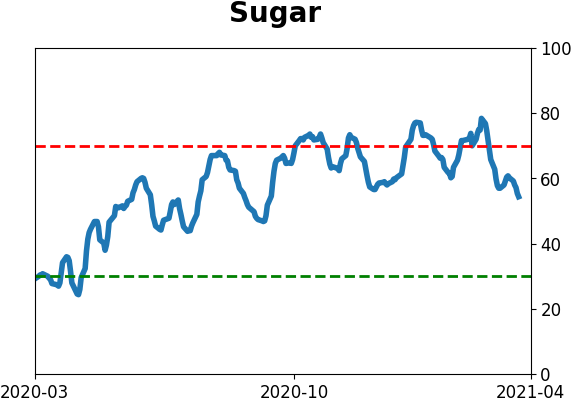
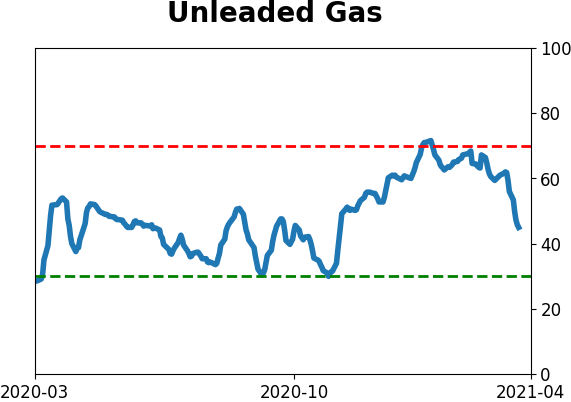
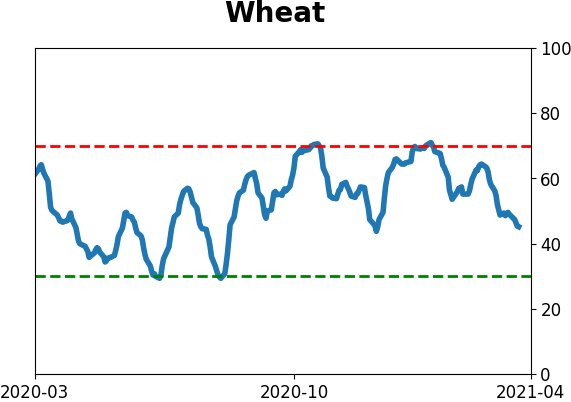
Commodity ETF's - 5-Day Moving Average
|
|