Headlines
|
|
Historic thrust exceeds other post-crash rallies:
The S&P 500 has clawed back more than 30% of its decline, surpassing other post-crash retracements. And the past 3 sessions have seen a historic level of skewed buying pressure.
McClellan indicators show negative momentum is easing:
For the first time in over a month, the McClellan Oscillator has turned positive. That means that the long-term Summation Index has curled higher after hitting an extremely low value.
Premium Note: Another surge as Dow nears 20% threshold:
At midday, we're on track for a 3rd consecutive day with up volume of more than 80%, which has only occurred before further large gains. And the Dow is nearing a 20% gain, which it did not do during other "fakeout" rallies in bear markets.
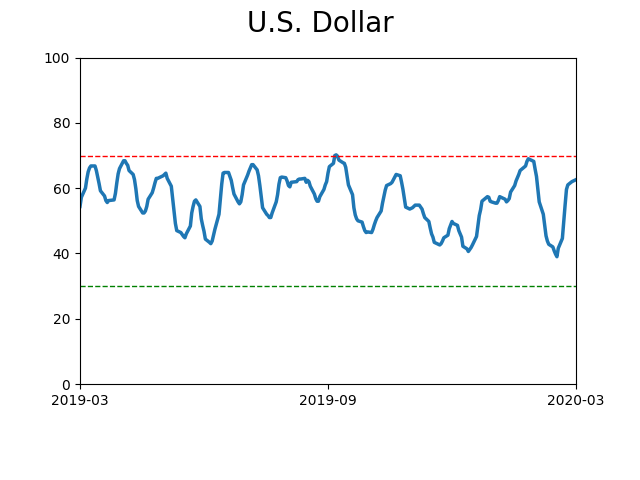
Premium Note: No need for a safe haven?:
The U.S. Dollar spiked during the worst of the stock market's selloff. The USD is falling now that global markets are attempting to stabilize.
Premium Note: Buy signals:
The stock market is trying to putting in a bottom, particularly markets in Europe and Asia. This has triggered a spike in the number of stocks with MACD buy signals.
Premium Note: Breadth coming back to normal:
The stock market's crash over the past 5 weeks pushed an extreme number of stocks into oversold territory. Now that the stock market is trying to put in a medium term bottom, that condition is changing.
|
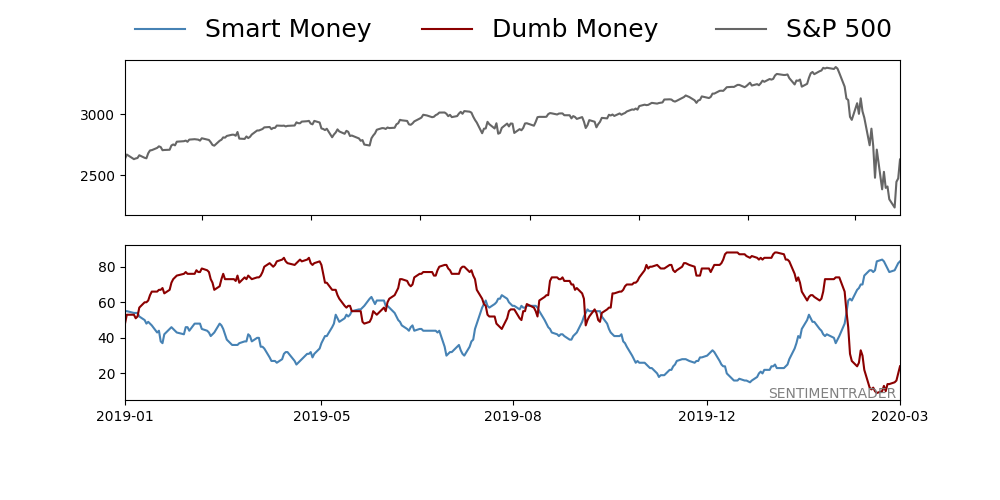
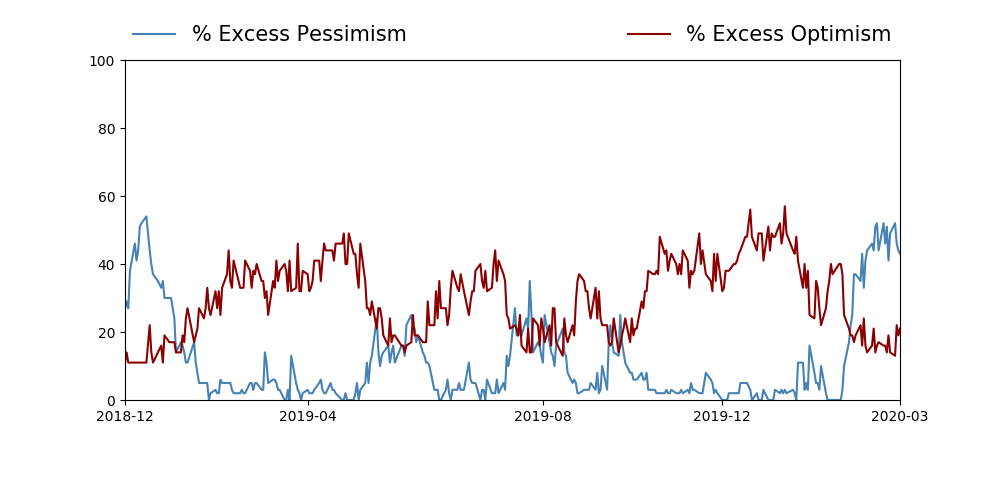
Smart / Dumb Money Confidence
|
Smart Money Confidence: 83.0%
Dumb Money Confidence: 24.0%
|
|
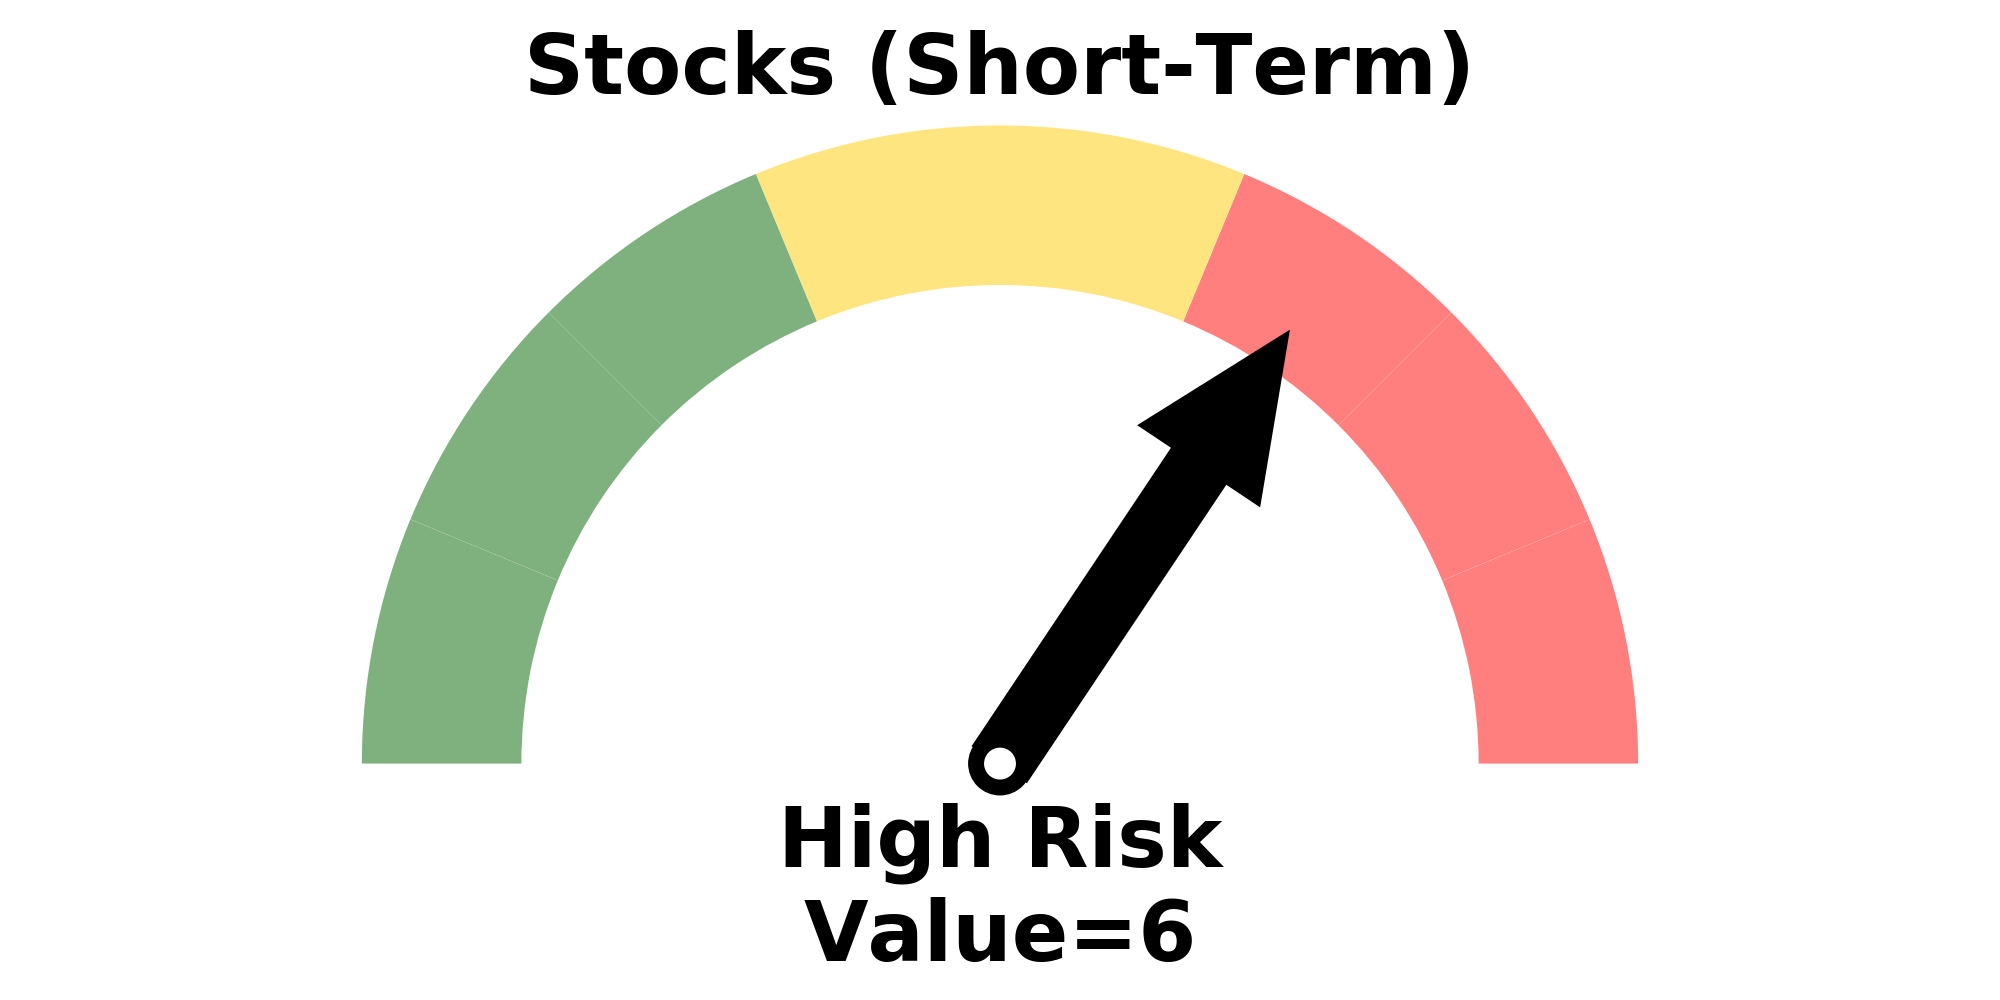
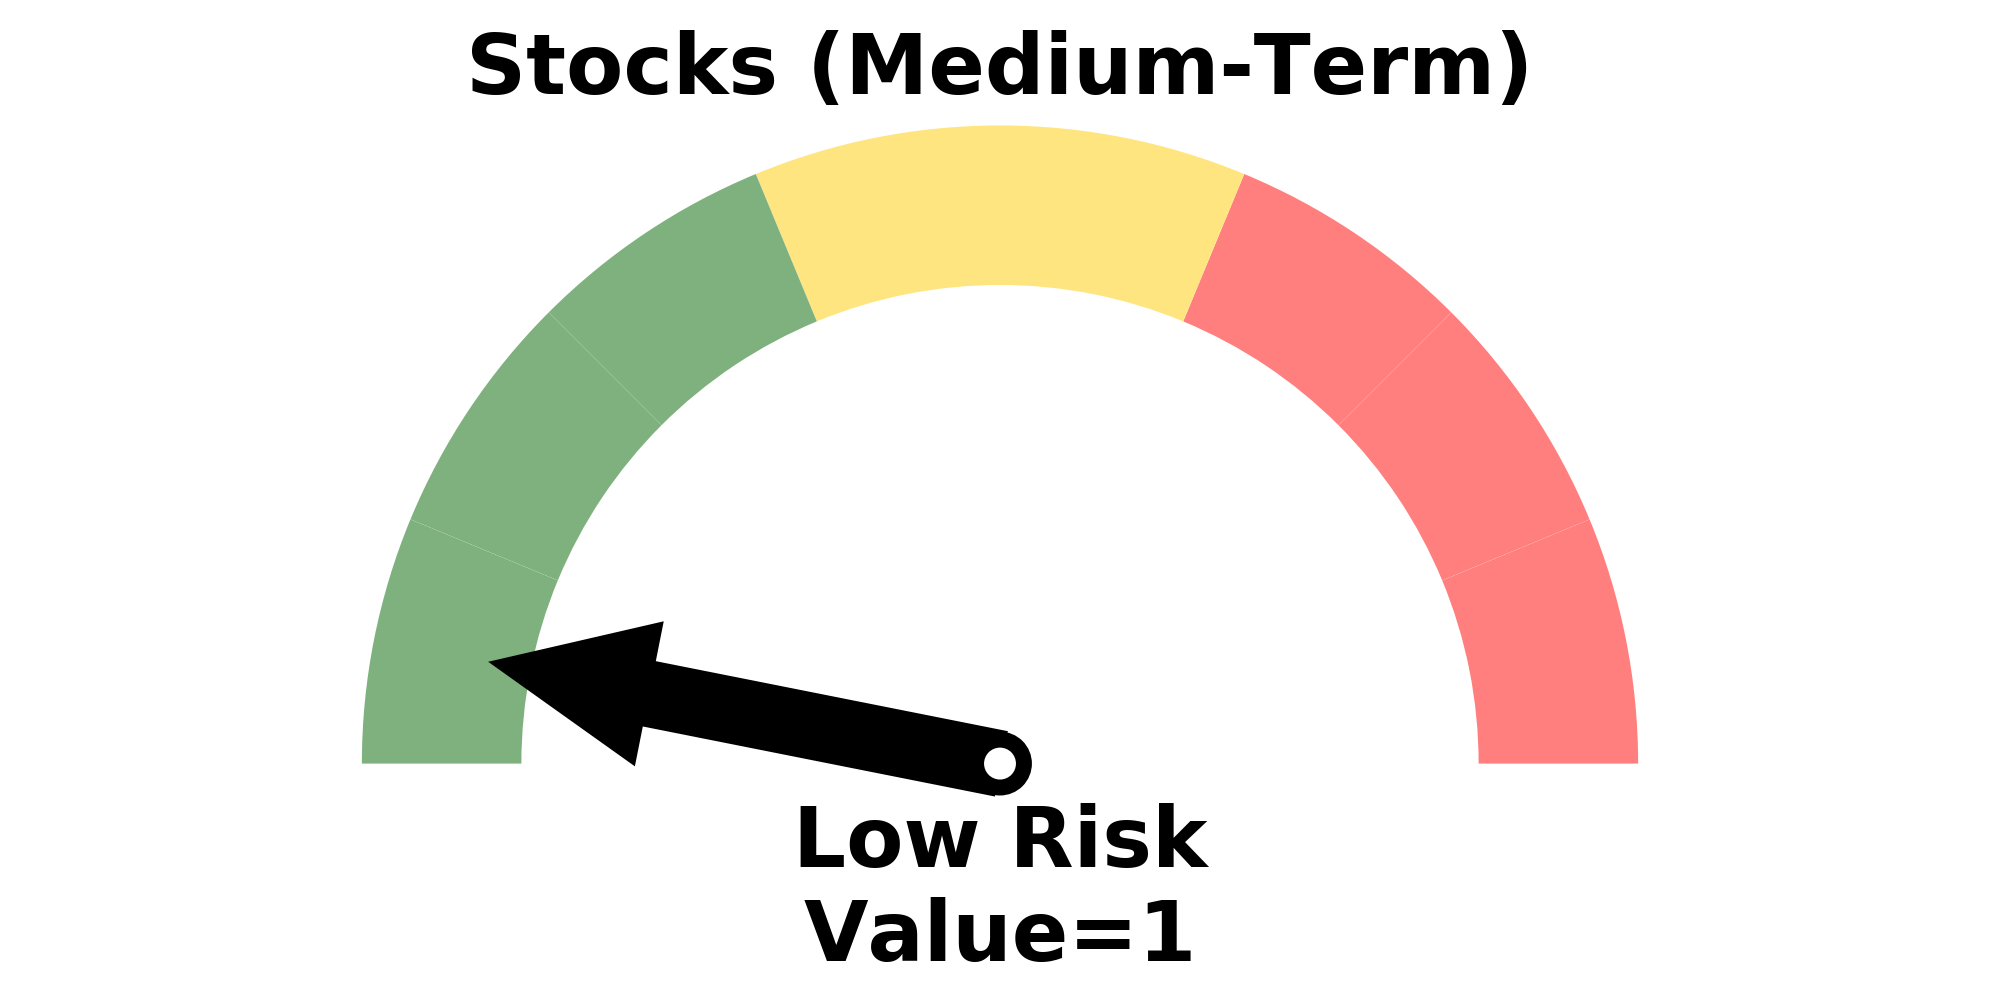
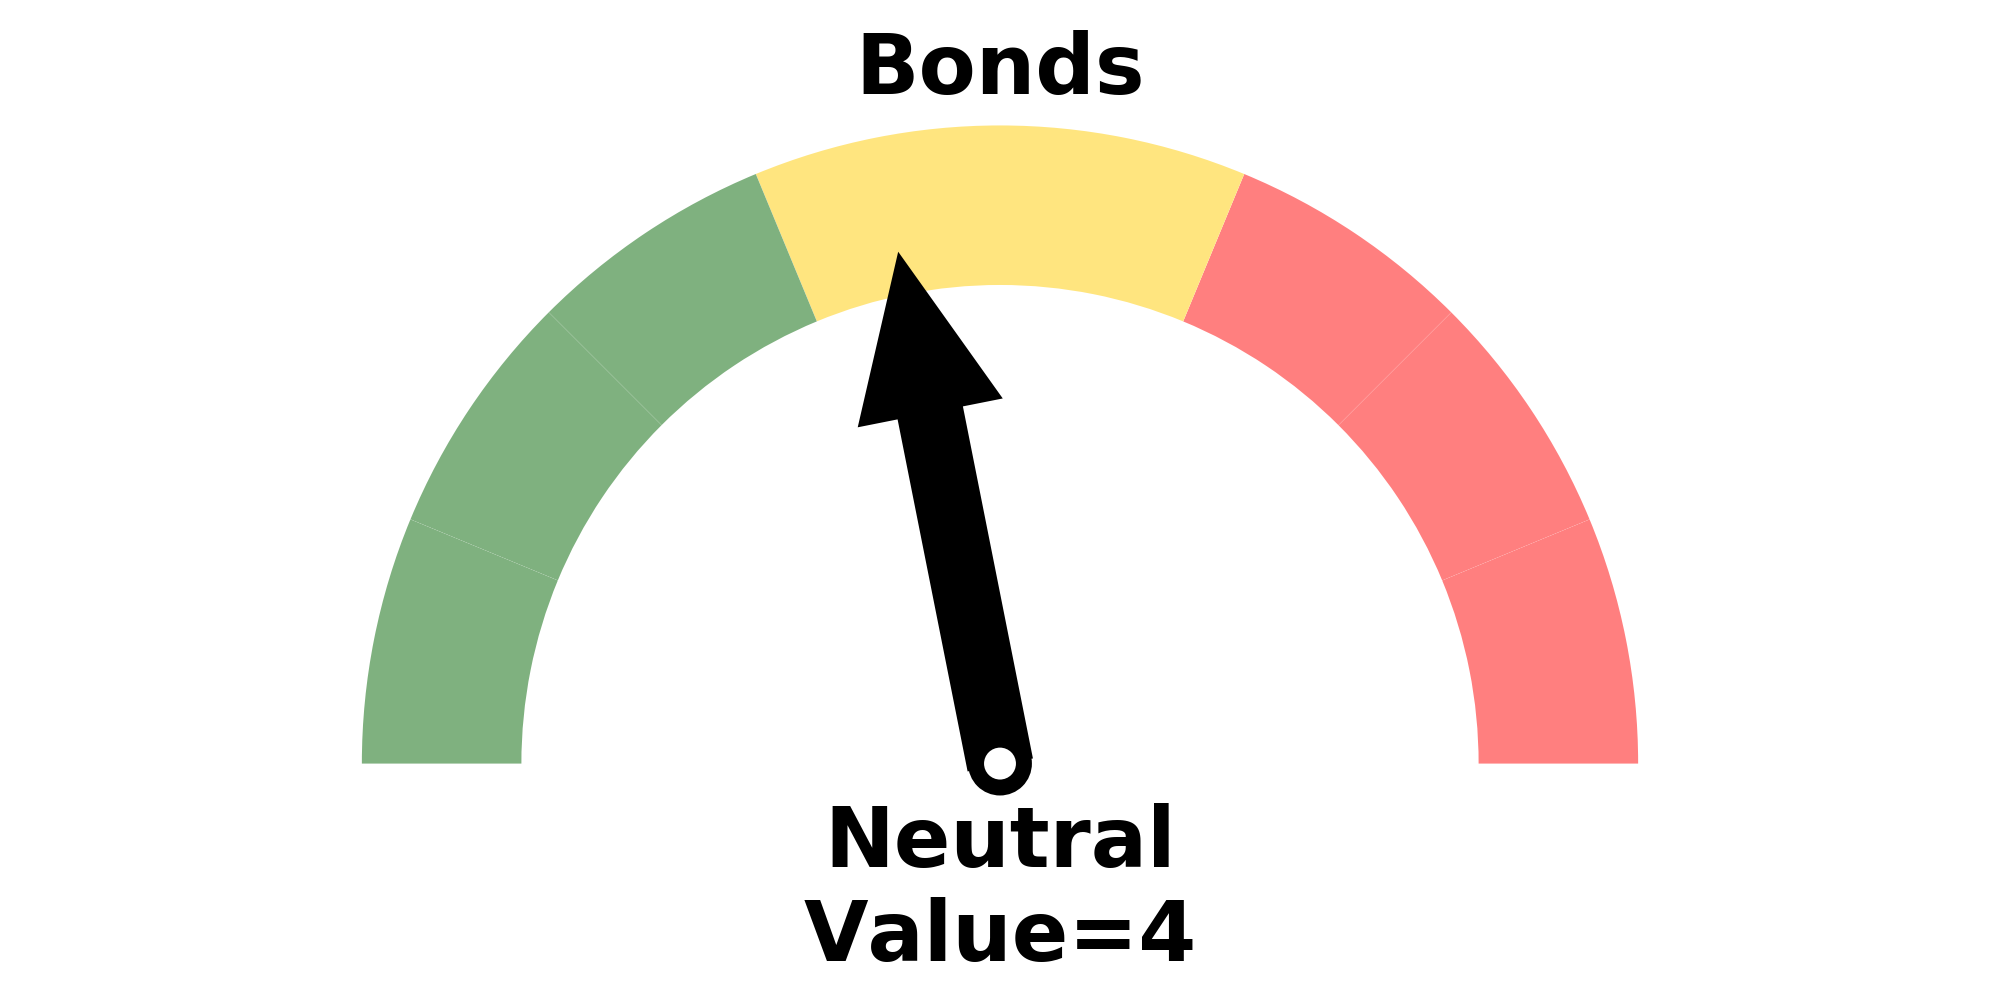
Risk Levels
Research
BOTTOM LINE
The S&P 500 has clawed back more than 30% of its decline, surpassing other post-crash retracements. And the past 3 sessions have seen a historic level of skewed buying pressure.
FORECAST / TIMEFRAME
SPY -- Up, Long-Term
|
When we look at rallies after a big decline, the daily ups and downs tend to generate the most attention. It's easy to lose track of how many "the biggest rallies happen in bear markets" comments there have been over the past few days.
Most investors are probably less entranced by big one-day jumps, and more so by how much of the decline has been erased. If stocks jump 5% and claw back half of the declines they suffered, then that will have more impact than a 5% gain that only claws back 10% of a decline.
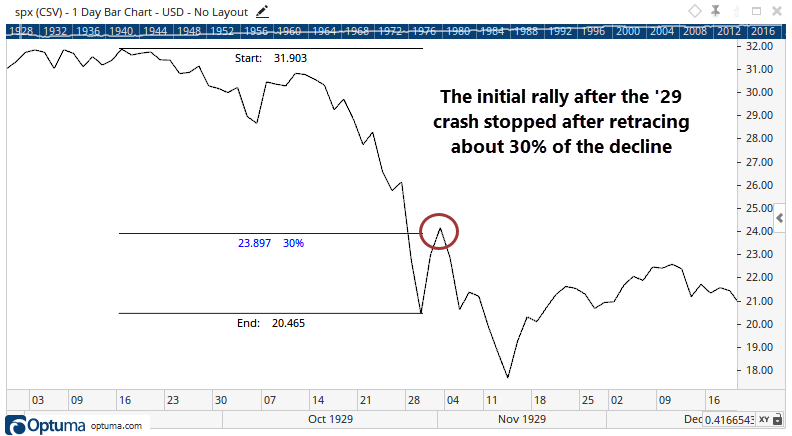
Once a market crashes, at some point those who were holding are going to see their moment to get out. In 1929, that happened after the S&P retraced a little over 30% of the decline.
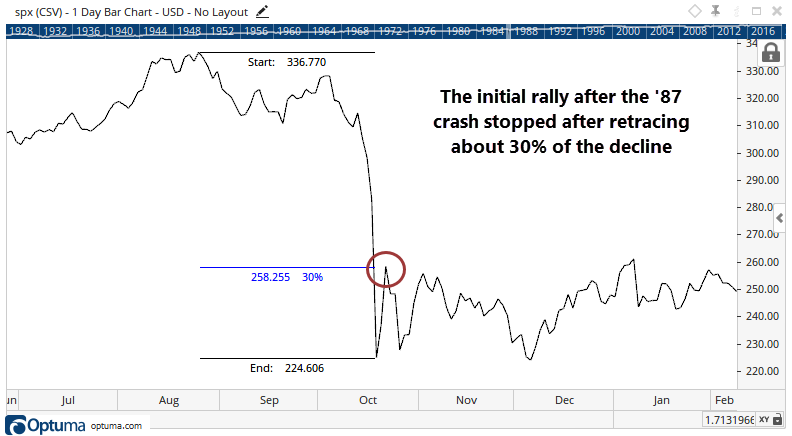
A very similar pattern occurred after the 1987 crash.
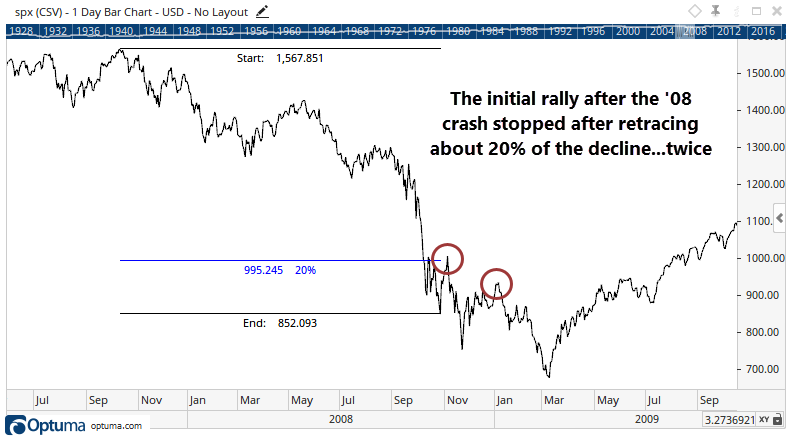
During the 2008 crash, the S&P only managed to retrace about 20% of the decline following the initial rebound from the panic in early October. The knee-jerk rally after the plunge into November also stopped at about the 20% retracement level.
This is interesting because we've just passed that post-crash threshold.
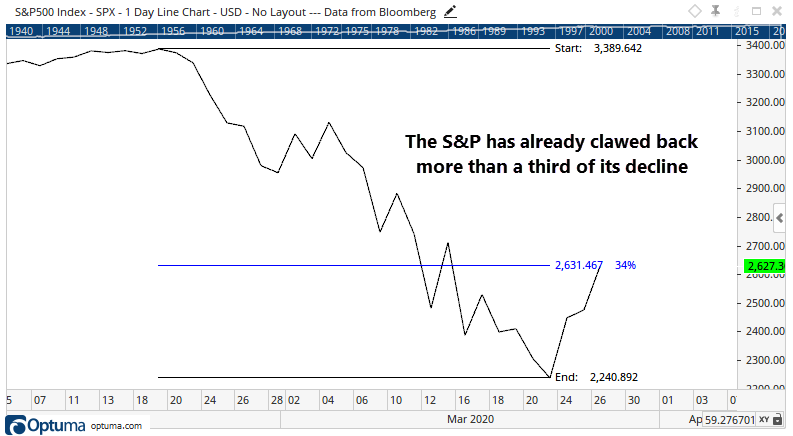
So far in this recovery, the S&P has clawed back more than a third of its decline, which surpasses the other post-crash scenarios. It suggests that this time is different, with more buying power behind the rebound.
And that buying power has been historic - potentially the best 3-day stretch since at least 1940. Each of the past three sessions has seen more than 80% of issues and volume skewed toward rising stocks.
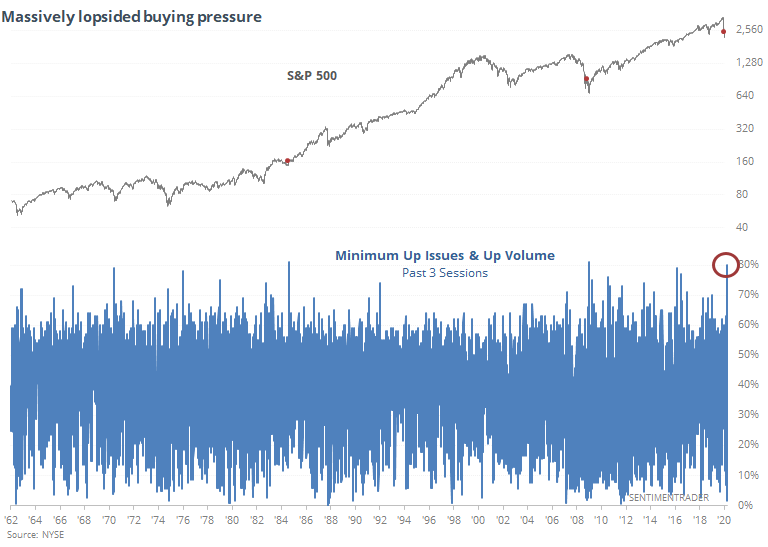
The only days that approached this were in August 1984 and January 2009, preceding the kick-off of massive bull markets (though it was early in 2009). If we relax the parameters to look for any 3-day stretch when the minimum Up Issues and Up Volume were at least 75%, then we get a few more signals.
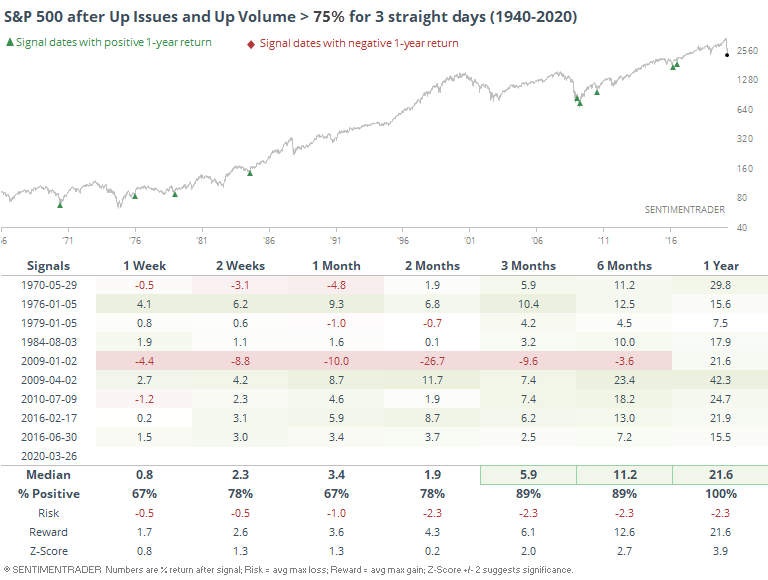
Like we've seen with the other buying thrust stats over the past couple of days, forward returns were impressive. That January 2009 signal certainly led to some shorter-term doubts, but the one-year return was still more than +20%.
If we look at the risk/reward table, then we can see just how little downside the signals preceded (again, except for Jan 2009).
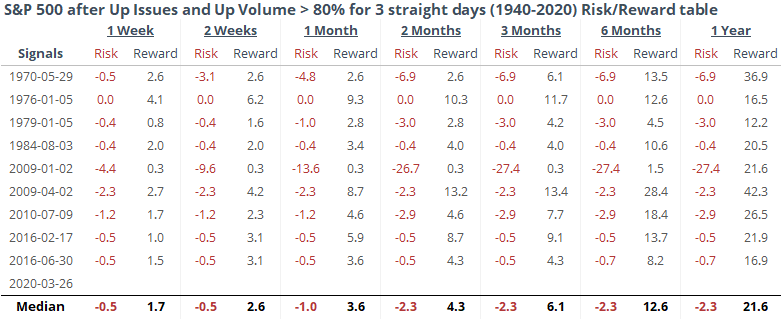
We already saw above why this signal is more impressive than January 2009 - that one couldn't make up any more than 20% of the decline, while this one has already exceeded 30%.
Buyers are doing what they need to do to change sentiment and increase the likelihood the worst has already been seen.
BOTTOM LINE
For the first time in over a month, the McClellan Oscillator has turned positive. That means that the long-term Summation Index has curled higher after hitting an extremely low value.
FORECAST / TIMEFRAME
SPY -- Up, Long-Term
SPY -- Down, Short-Term
|
During bear markets, the best returns are typically found by buying into bouts of periodic panic and then getting out on violent snapbacks. The trouble with that strategy is several-fold, including that most people are not quick-fingered traders, it's a gut-wrenching thing to do, and it doesn't always work. Witness energy stocks from a couple of weeks ago.
Those looking for a less ulcer-inducing strategy usually wait for some green shoots - evidence that markets are moving from bad to less bad. That helps avoid the "extreme can be more extreme" scenarios but it also means markets have already rebounded, and short-term volatility (and losses) are more likely, even while longer-term gains should become more consistent.
So, investors have been looking for signs that the panic has run its course and we've neared an inflection point. So far this month, we've seen selling pressure so intense that it rivals or exceeds anything in the past 60 years. Now, there has been a thaw.
For the first time in over a month, the McClellan Oscillator has turned positive.
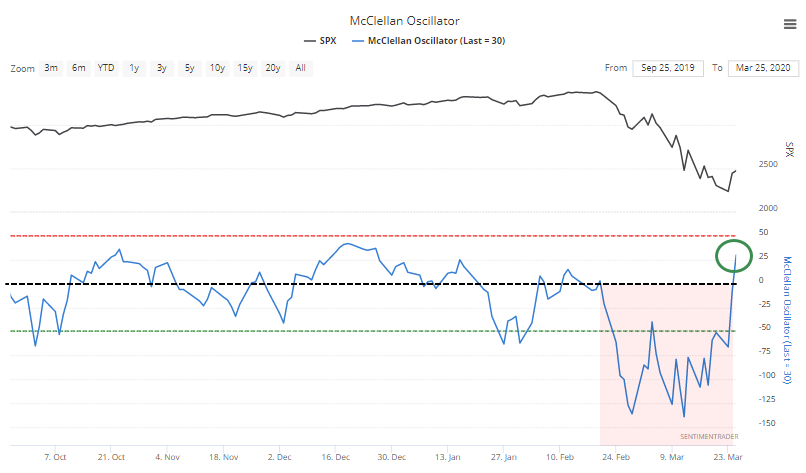
You have to squint to see it, but the positive Oscillator means the long-term Summation Index has curled higher after hitting an extremely low value.
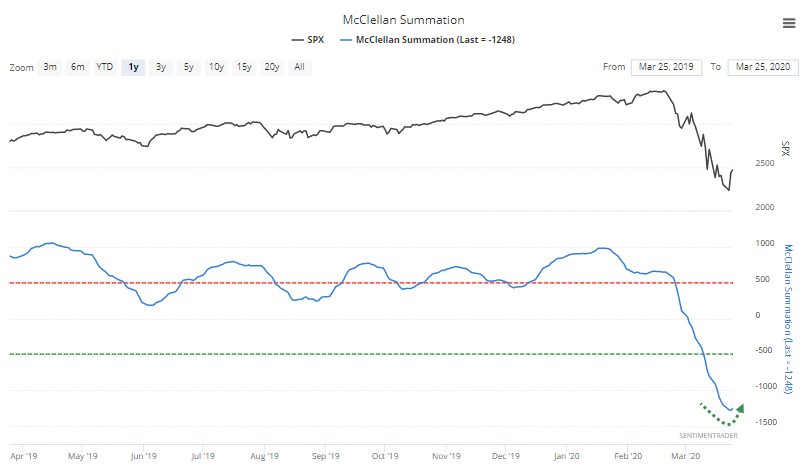
The Backtest Engine shows us that since 1962, there have been 24 times when the Summation Index has curled higher after falling below -1250. It's not a big surprise that short-term returns were bad, while longer-term ones were significantly better.
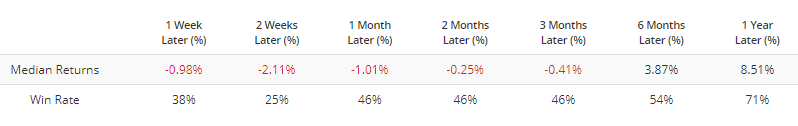
Some of those poor returns came during markets when breadth was very bad, but the indexes hadn't suffered heavy losses, unlike now. So if we stipulate that the S&P 500 must have lost at least 25% of its value at some point over the past couple of weeks, then we get the following.
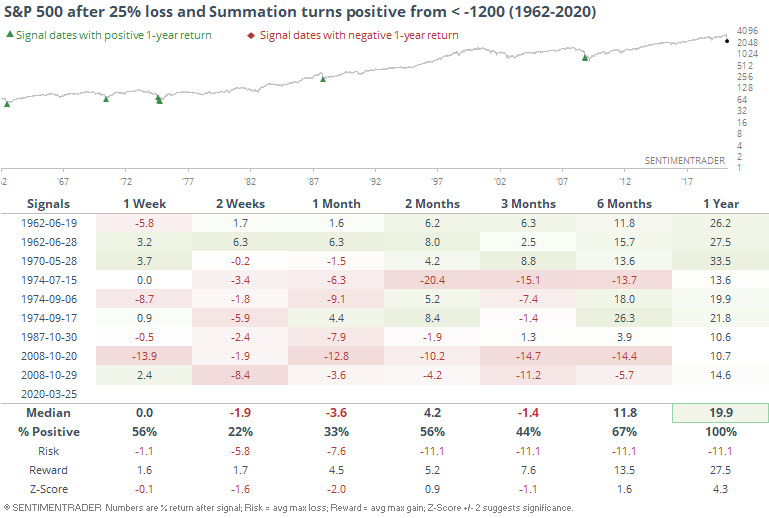
Shorter-term returns were still horrid, because this triggers after markets stage an initial rebound. And rebounds in bear markets tend to get hit by selling pressure as knife-catchers see a chance to get out.
But this also signified longer-term recoveries. When losses had been so bad, and breadth so horrid, these green shoots indicated that it was getting near a point when the final puke phase was either done or getting close.
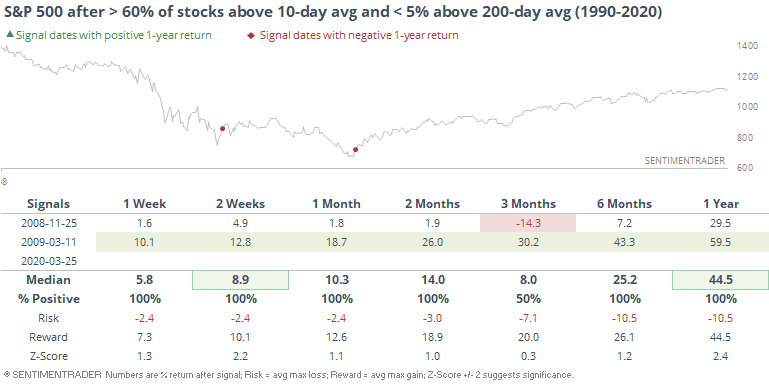
There has also been signs of a recovery in the percentage of stocks trading above their short-term moving averages. It jumped above 60% by Wednesday, even though the percentage trading above their long-term 200-day averages hasn't budged and remains extremely low.
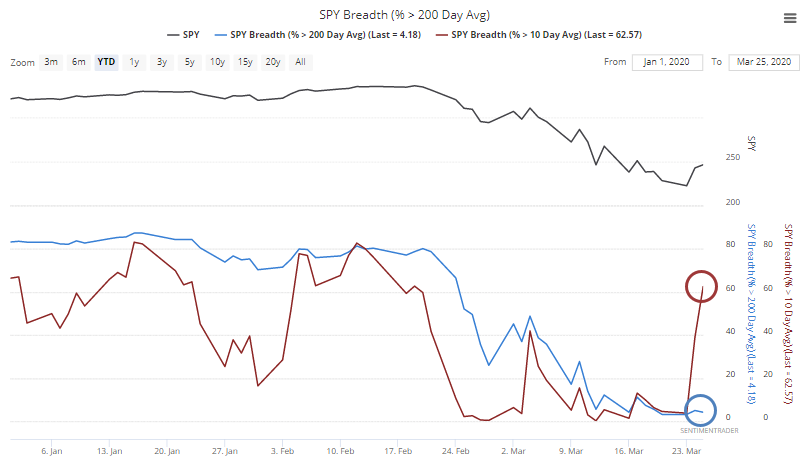
That's only happened twice since 1990, in November 2008 and March 2009.
The massive up volume days on Monday and Tuesday should go a ways to furthering that point and may limit the shorter-term losses that some of the previous signals witnessed.
Active Studies
| Time Frame | Bullish | Bearish | | Short-Term | 0 | 2 | | Medium-Term | 15 | 14 | | Long-Term | 30 | 3 |
|
Indicators at Extremes
Portfolio
| Position | Weight % | Added / Reduced | Date | | Stocks | 73.2 | Added 31.3% | 2020-03-17 | | Bonds | 0.0 | Reduced 6.7% | 2020-02-28 | | Commodities | 5.5 | Added 2.4%
| 2020-02-28 | | Precious Metals | 0.0 | Reduced 3.6% | 2020-02-28 | | Special Situations | 0.0 | Reduced 31.9% | 2020-03-17 | | Cash | 21.3 | | |
|
Updates (Changes made today are underlined)
In the first months of the year, we saw manic trading activity. From big jumps in specific stocks to historic highs in retail trading activity to record highs in household confidence to almost unbelievable confidence among options traders. All of that has come amid a market where the average stock can’t keep up with their indexes. There were signs of waning momentum in stocks underlying the major averages, which started triggering technical warning signs in late January. The kinds of extremes we saw in December and January typically take months to wear away, but the type of selling we’ve seen over the past month has gone a long way toward getting there. When we place the kind of moves we’ve seen over the past two weeks into the context of coming off an all-time high, there has been a high probability of a multi-month rebound. The volatility we’ve seen lately is extremely compelling from a medium-term point of view. Virtually everything we’ve looked at suggests a strong probability of gains over the next several months, even within the context of a potential bear market, and even from what had been higher prices. With an increasing sense that government entities will finally do anything it takes, and signs of progress in isolating and testing for the virus, I added to my exposure. I’m still holding 20% cash and don’t see that changing much at this point. Energy stocks. That was atrocious. The worst move I’ve ever made in this account. I’ve taken some very large sectors bets in this account over the years, like oil & gas explorers in 2016 and gold miners in 2018, and there is always some shorter-term discomfort because the news flow is so horrid. I don’t mind that in the least. But I do mind when stocks don’t do what they should. It didn’t help going large on these stocks right before what could be considered a true Black Swan, but so it goes. I’m more concerned that there has been no reaction since then and they continue to underperform despite…well, everything. They very well could rebound in the months ahead, but at this point I feel I have zero edge and don’t know what’s going on there, so I rotated out of that sector and into a general broad-market fund.
|
|
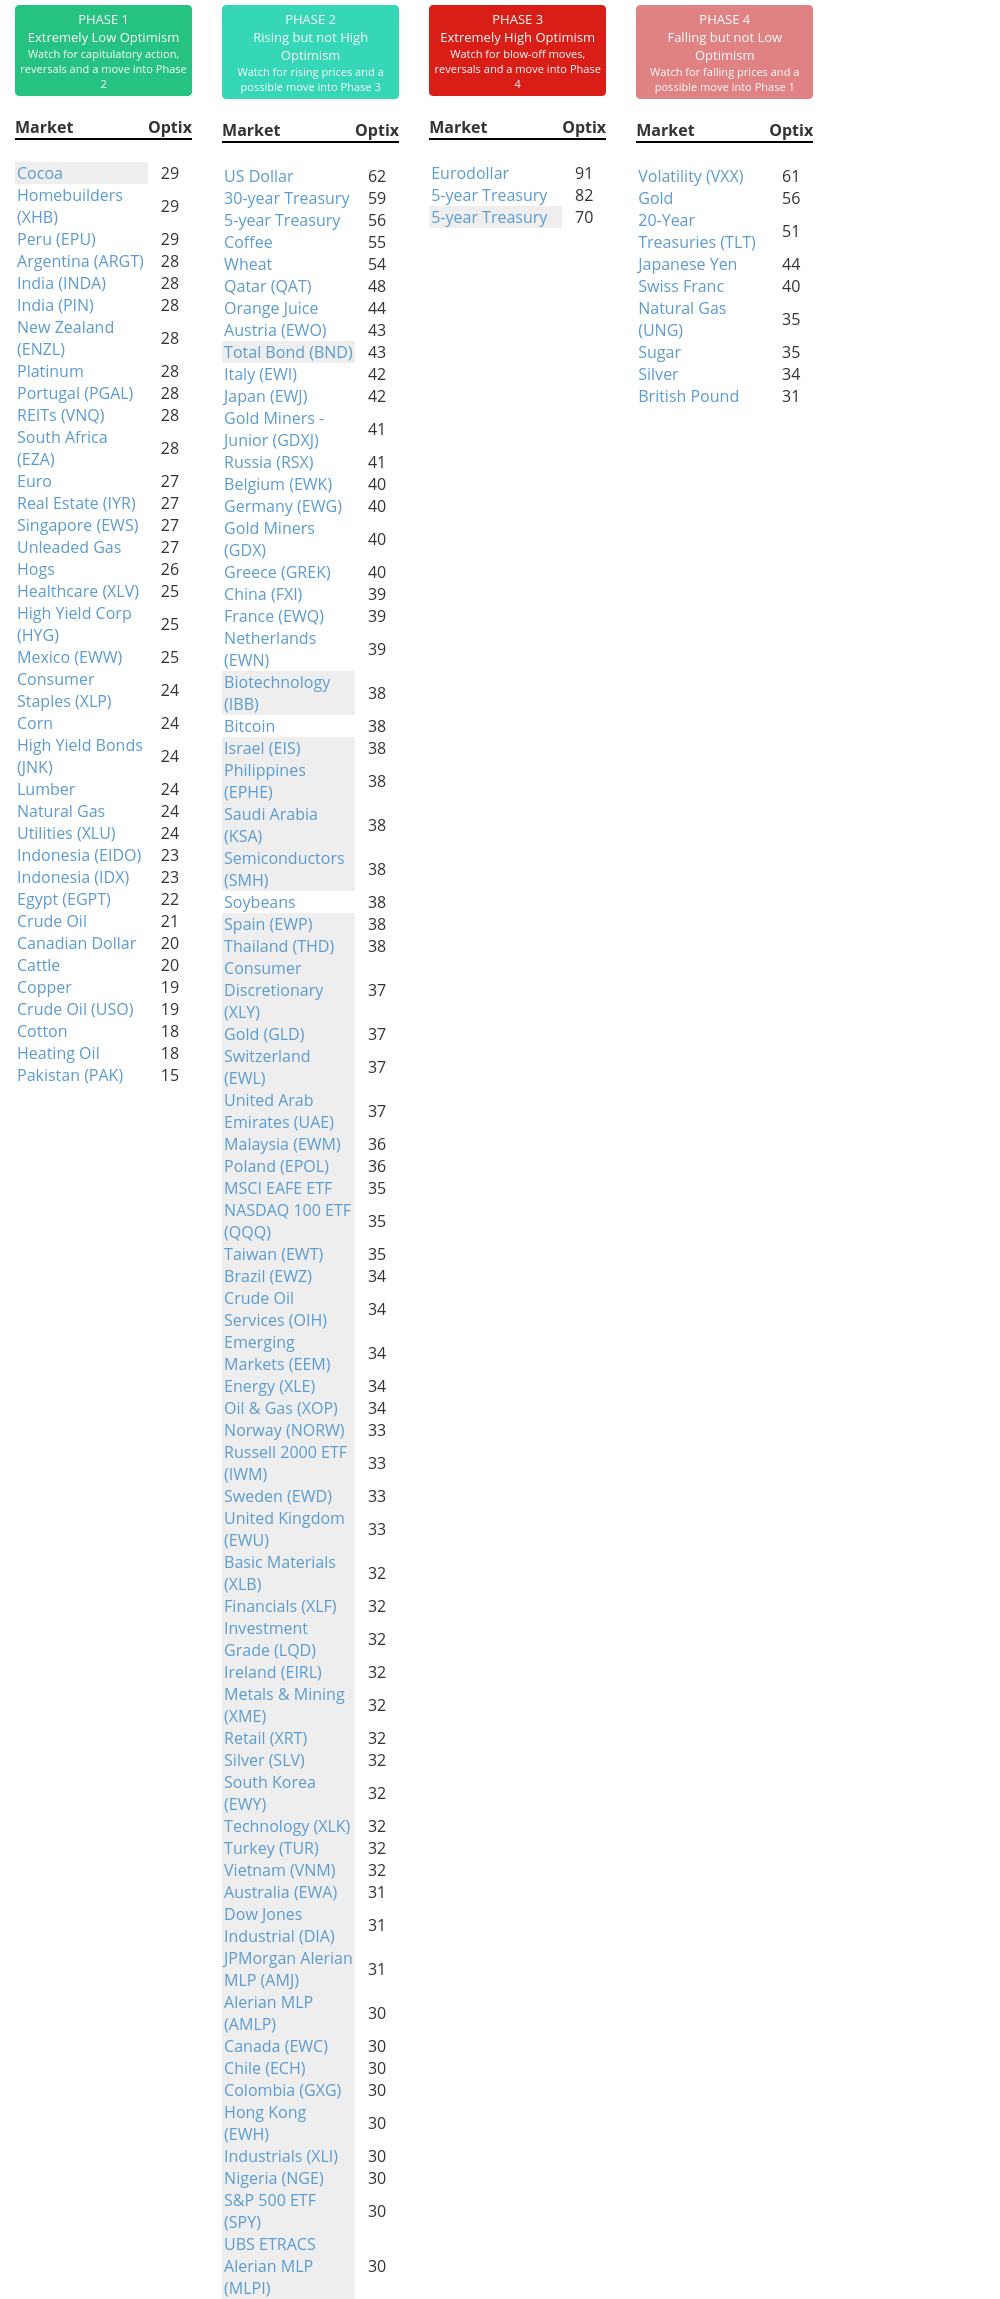
Phase Table
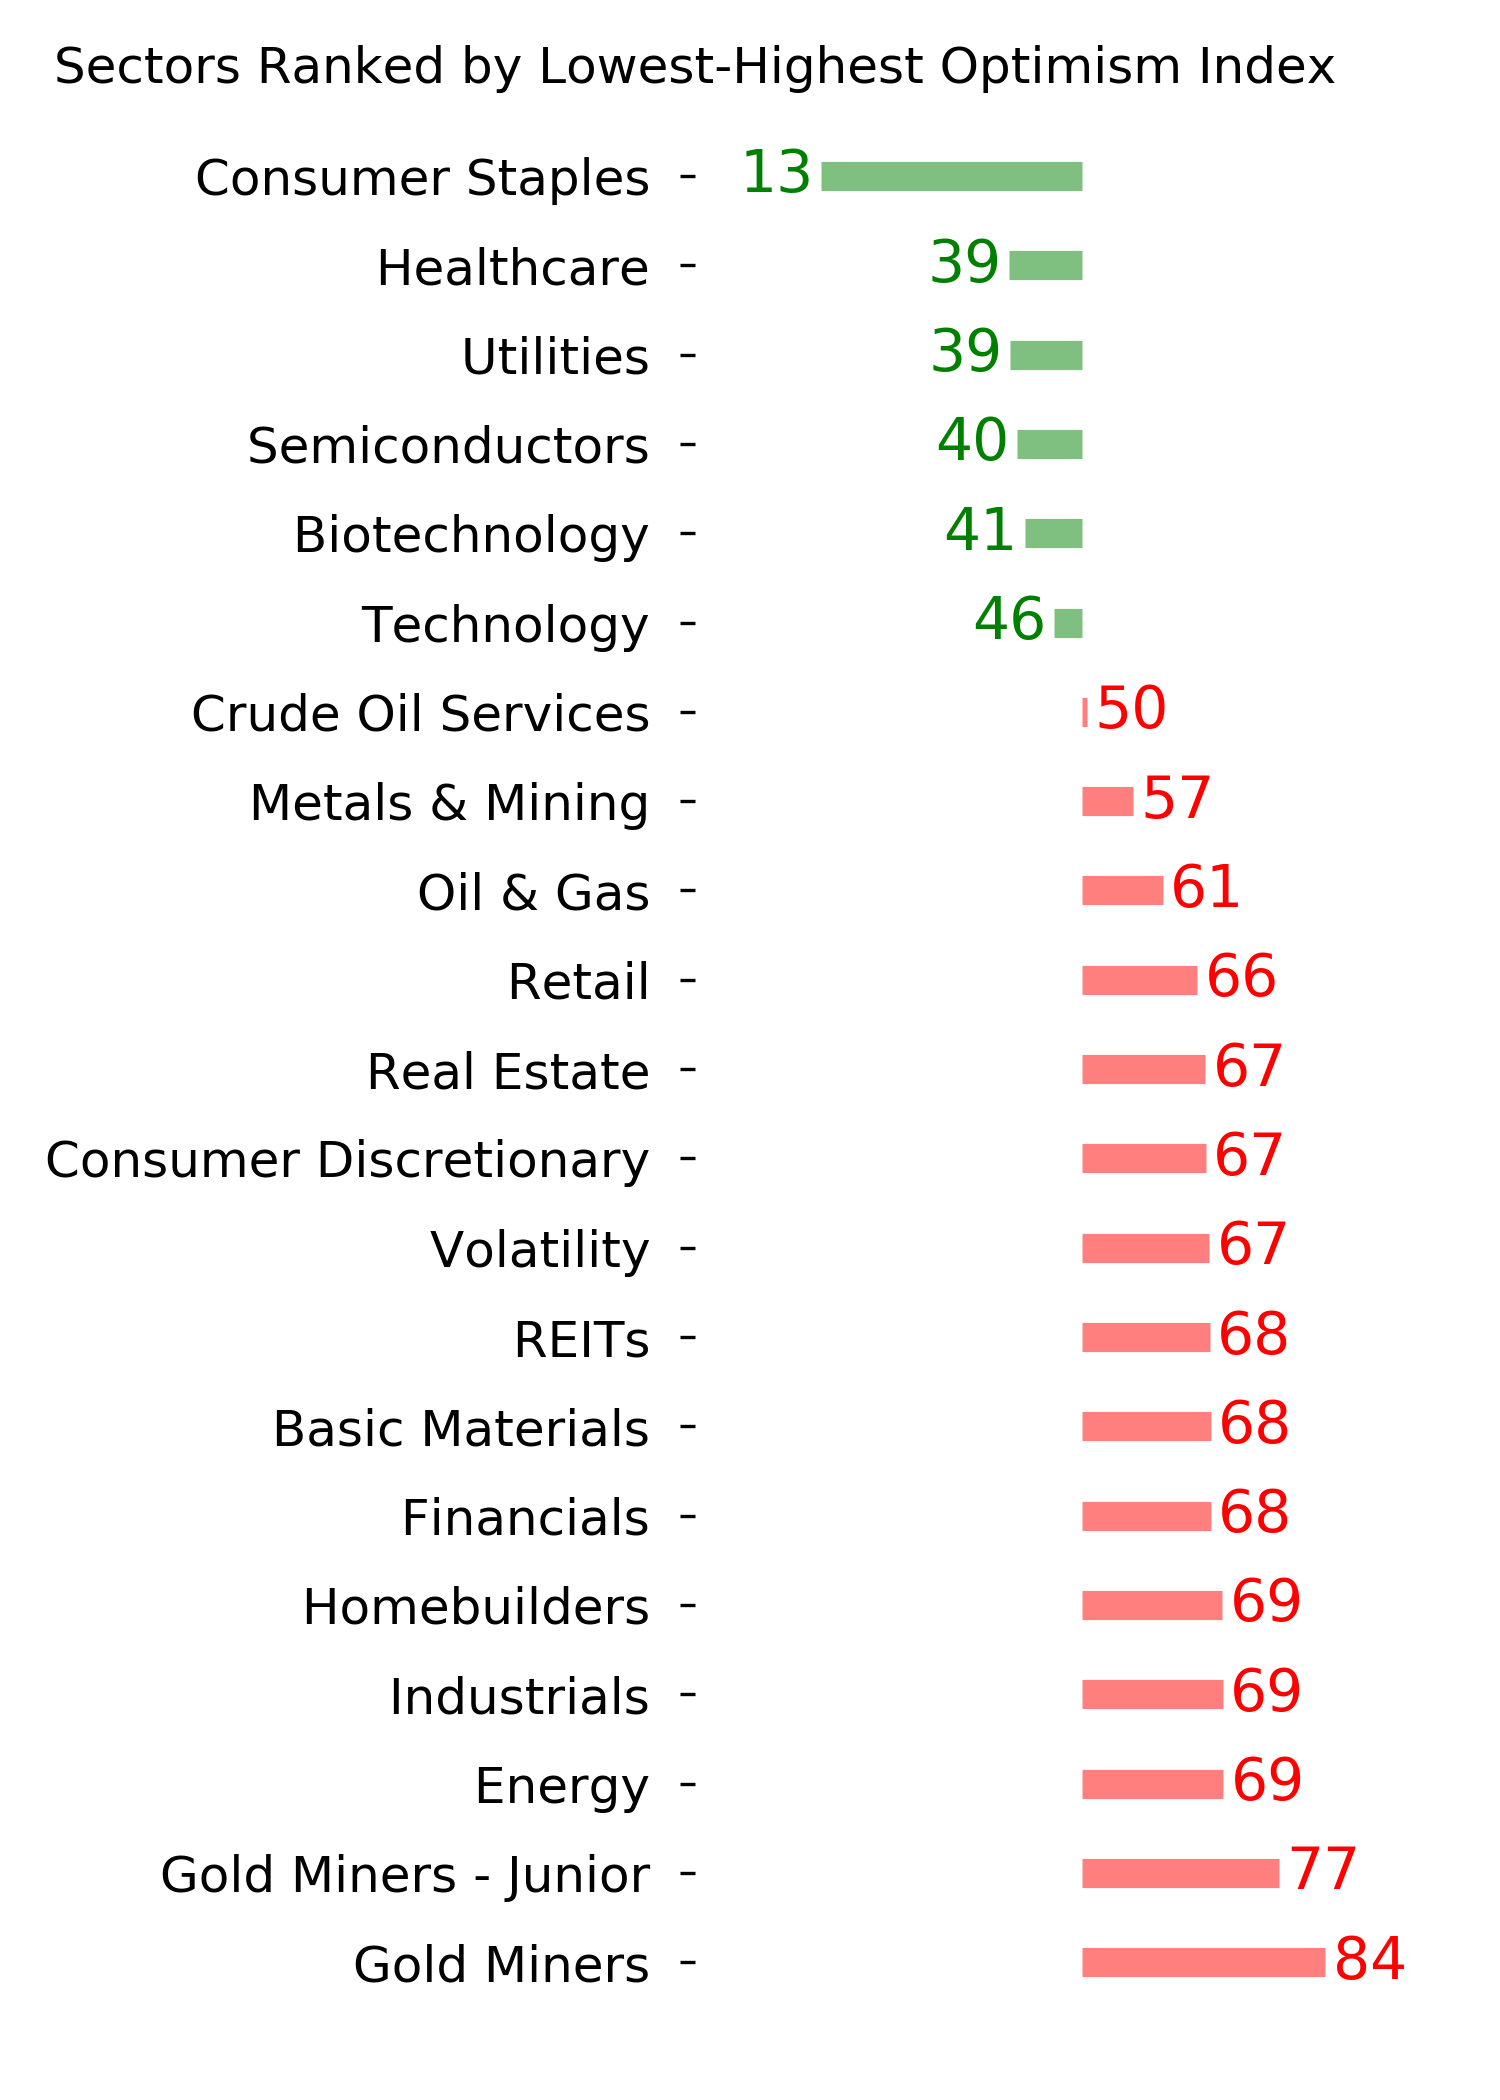
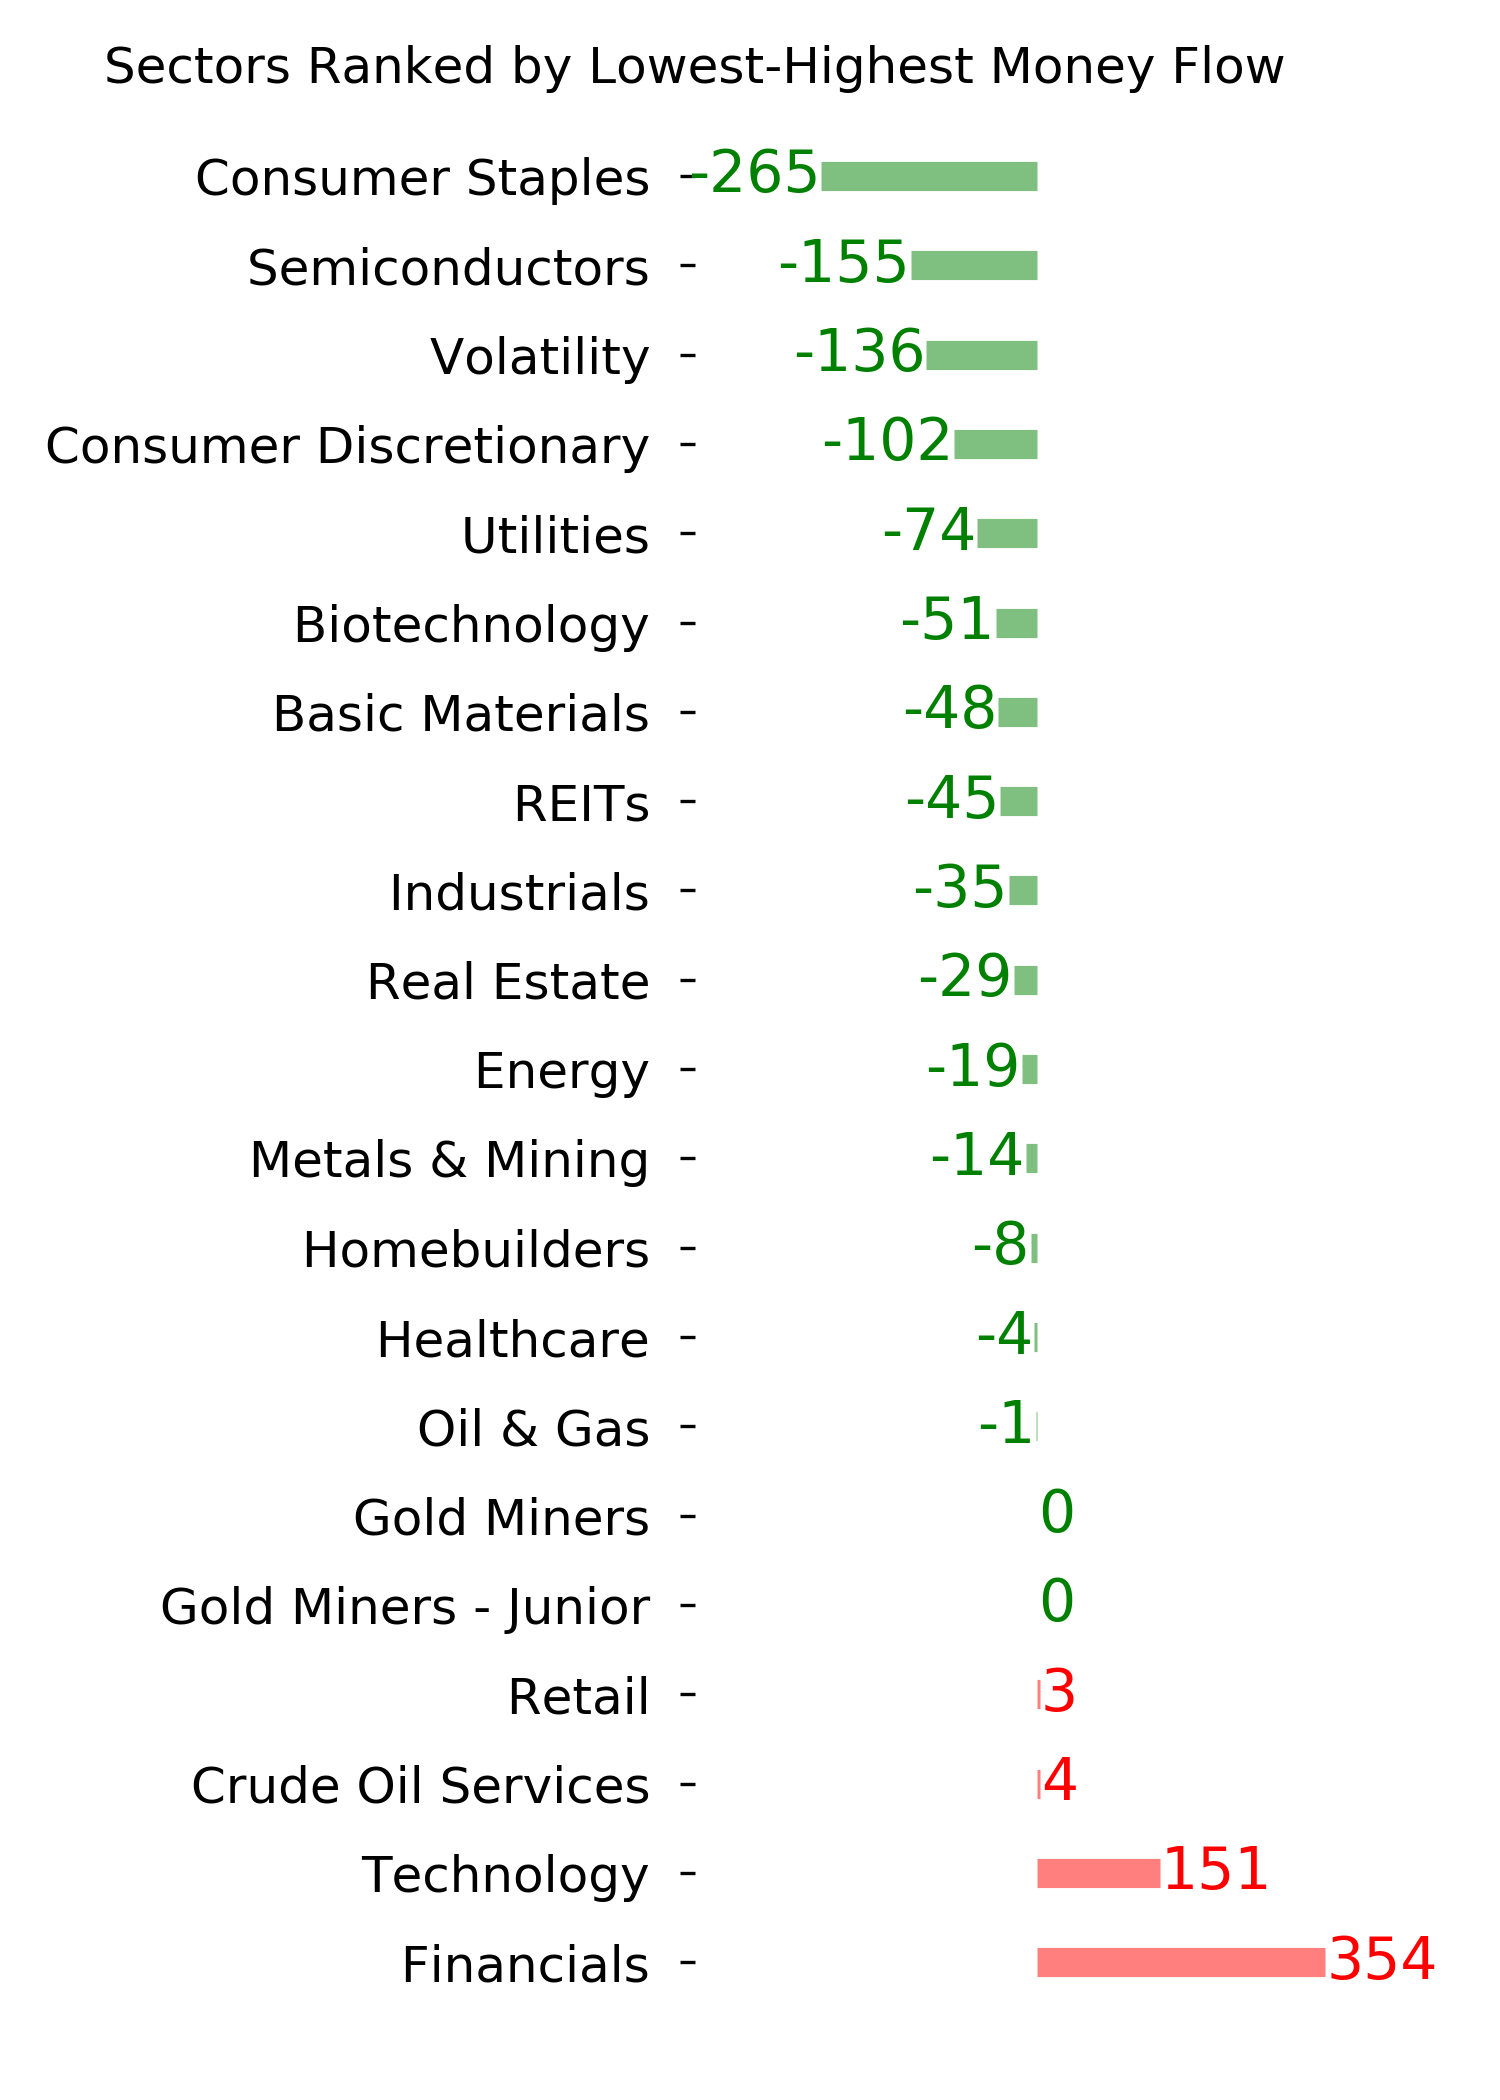
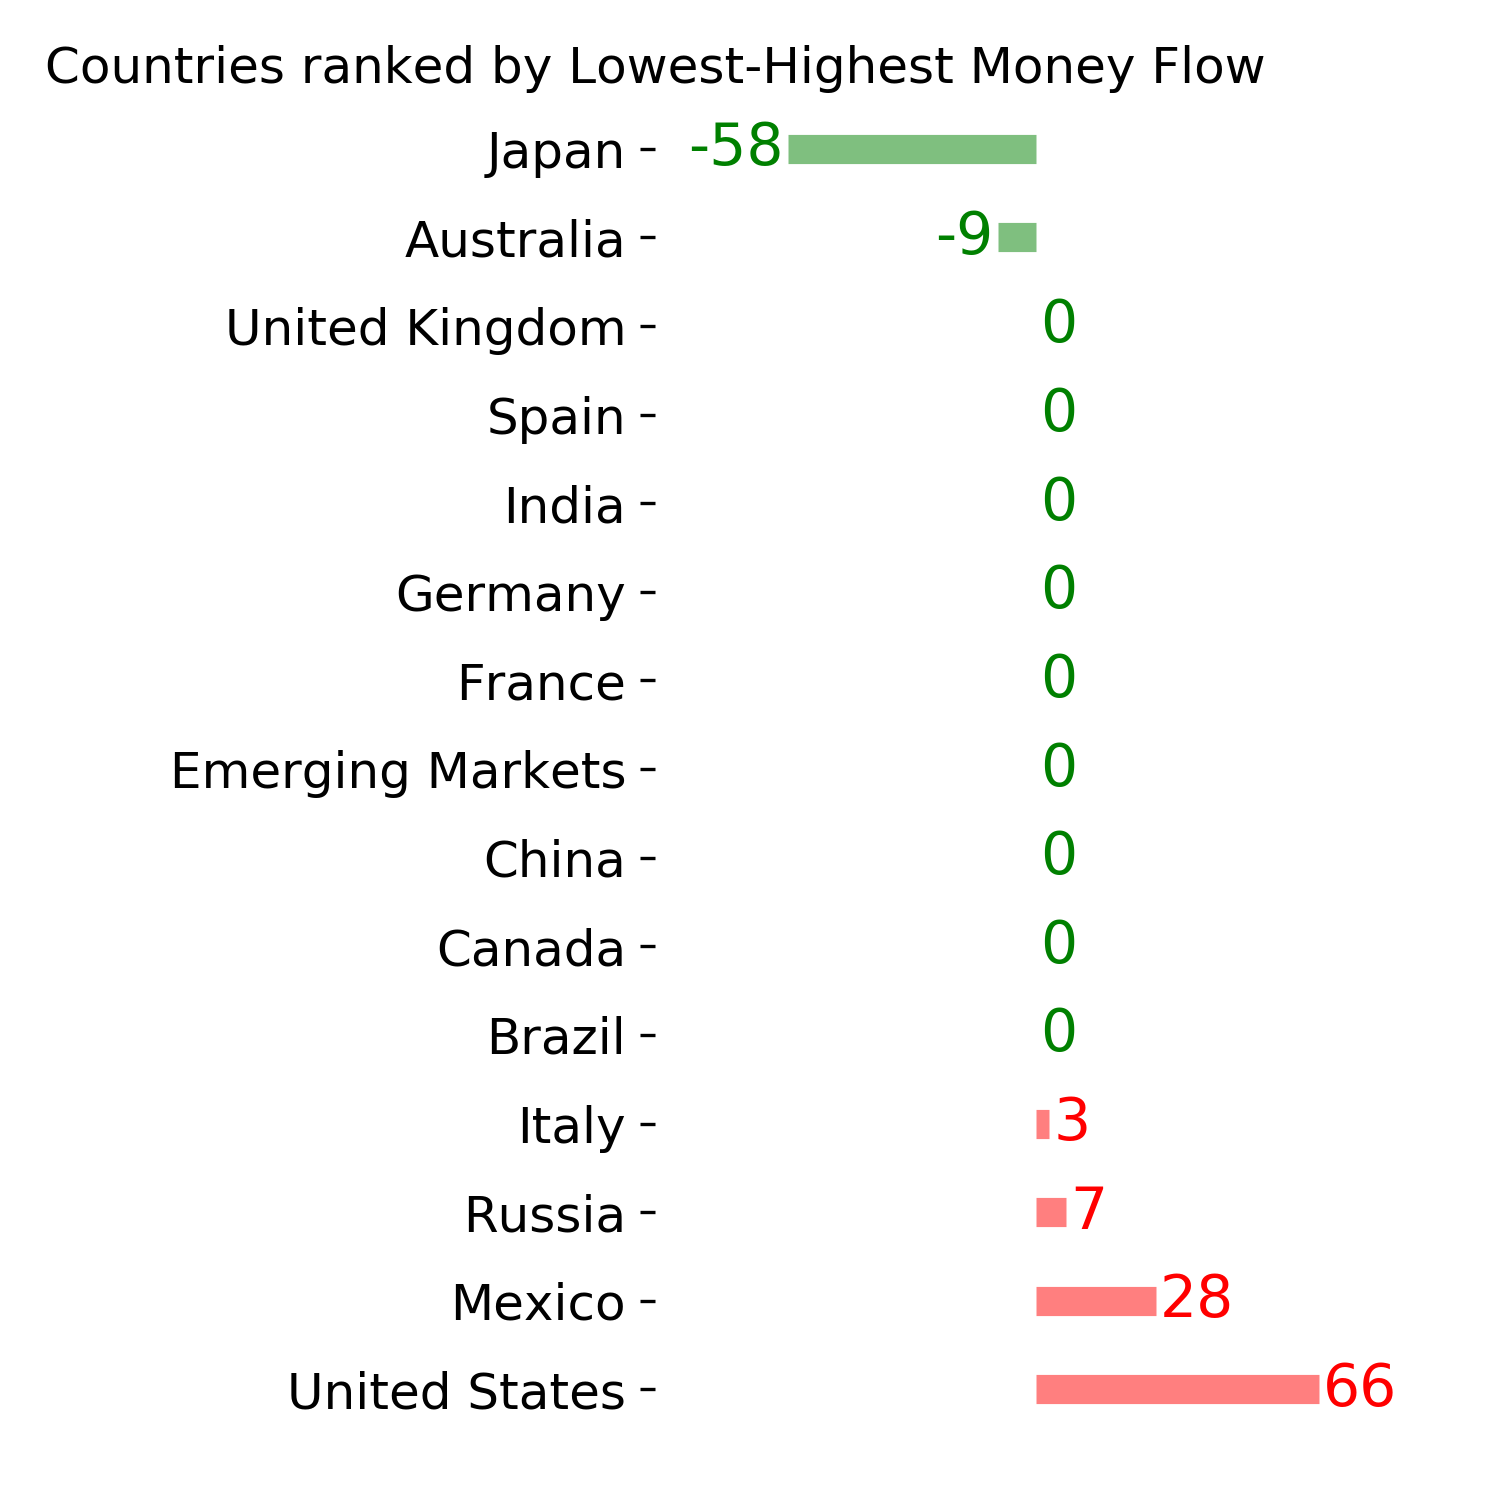
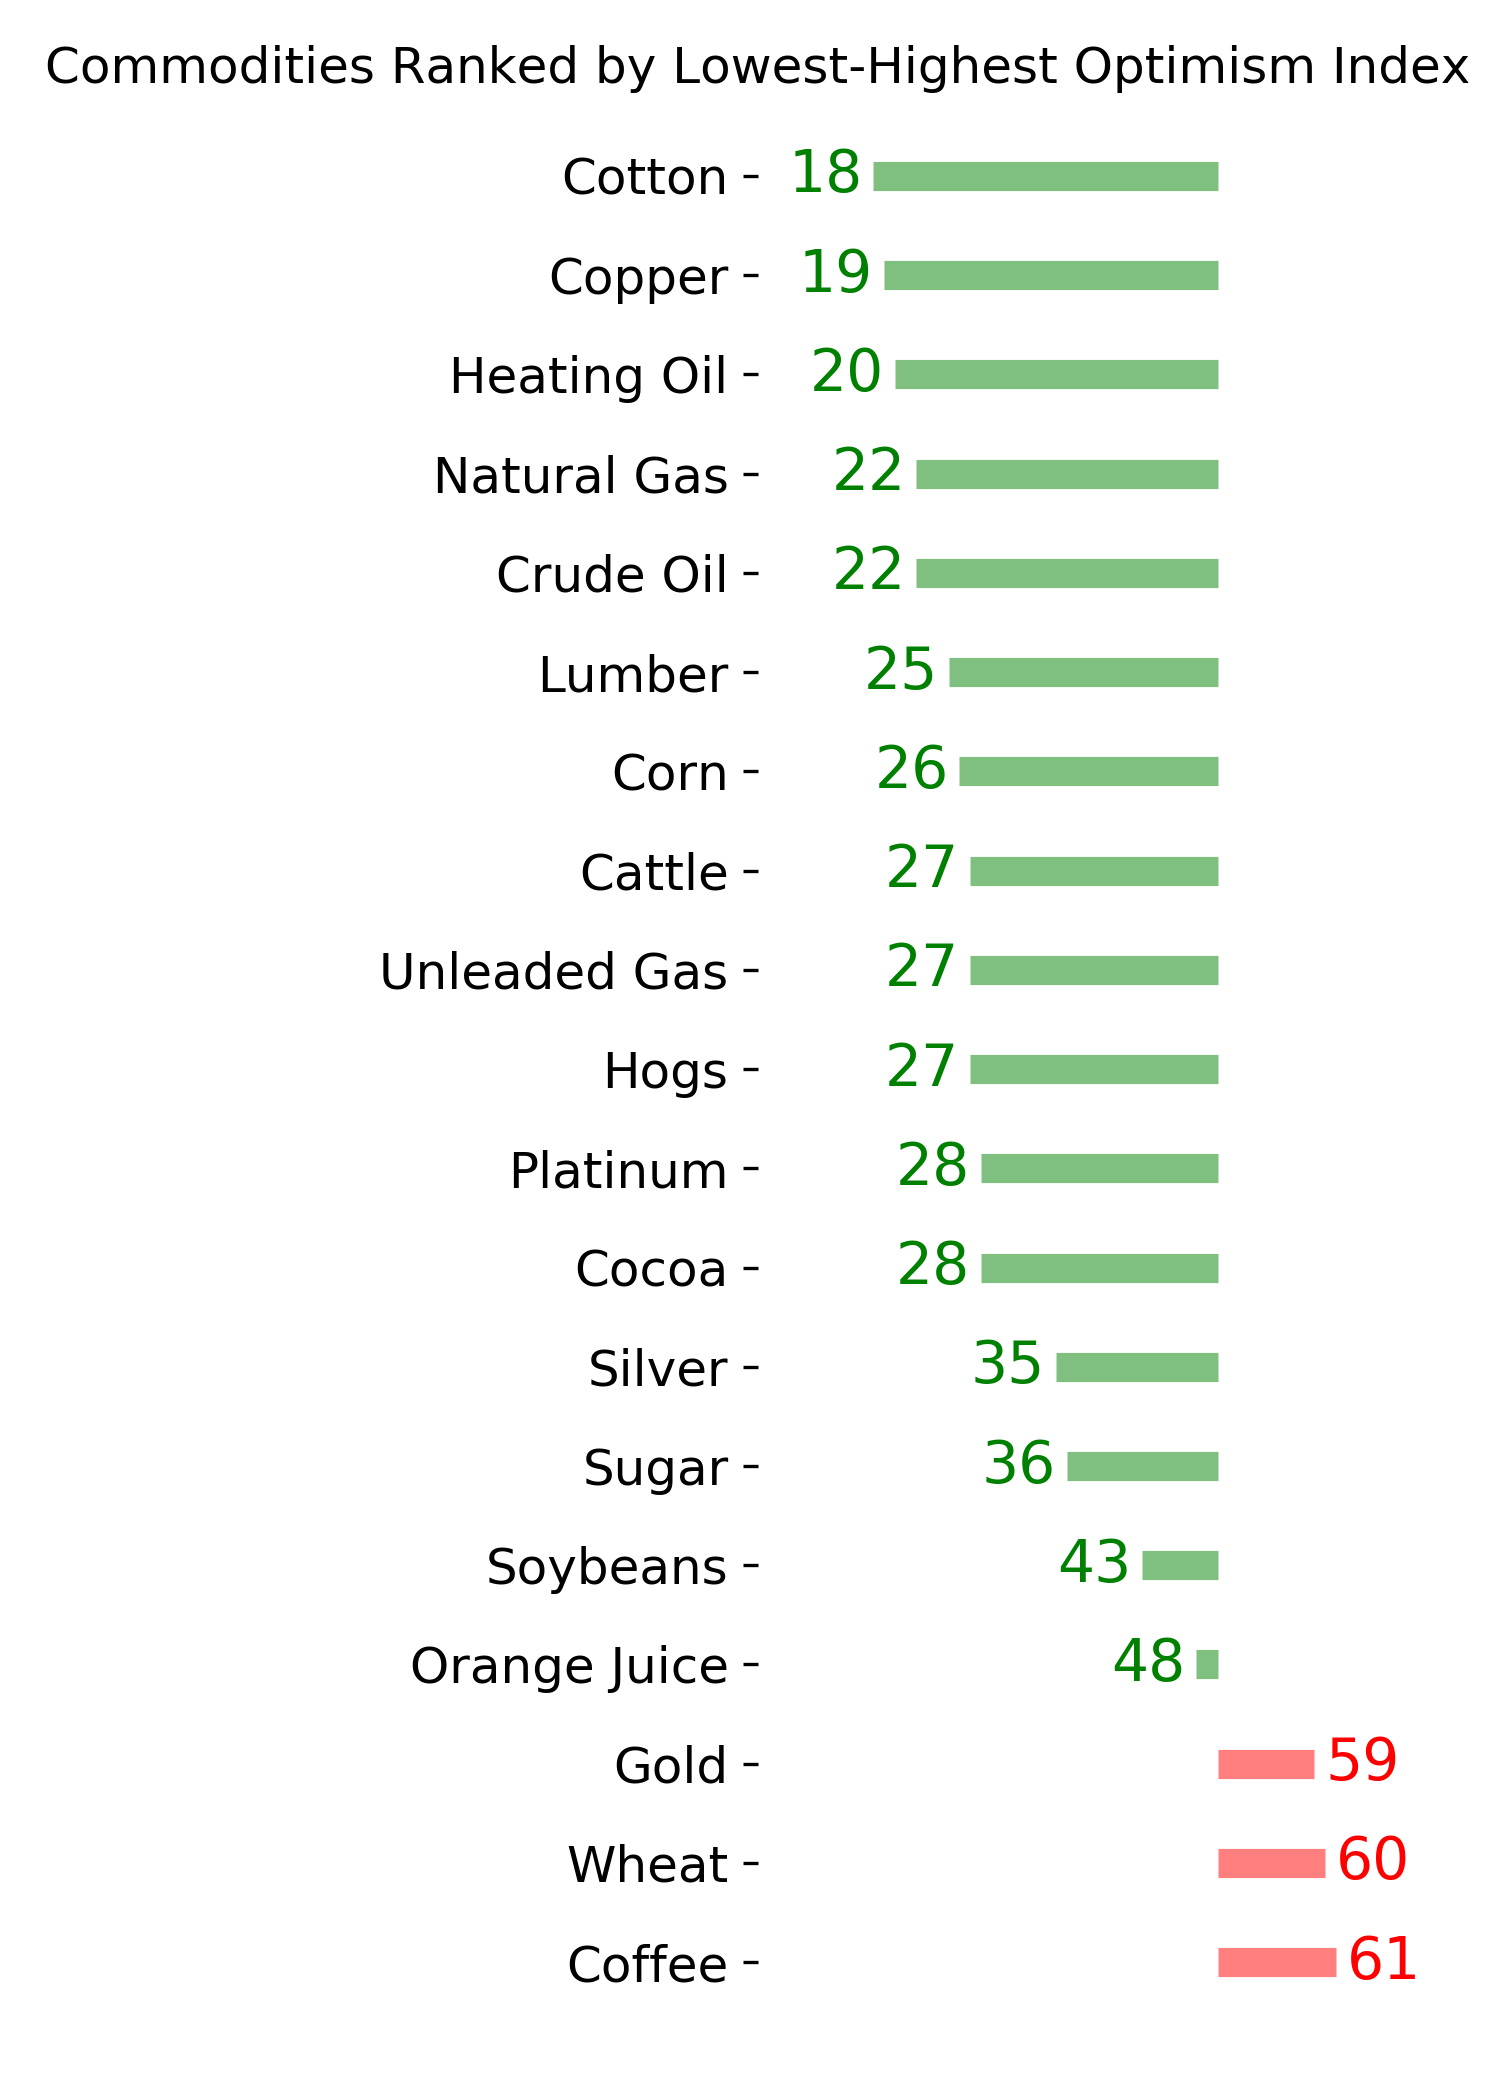
Ranks
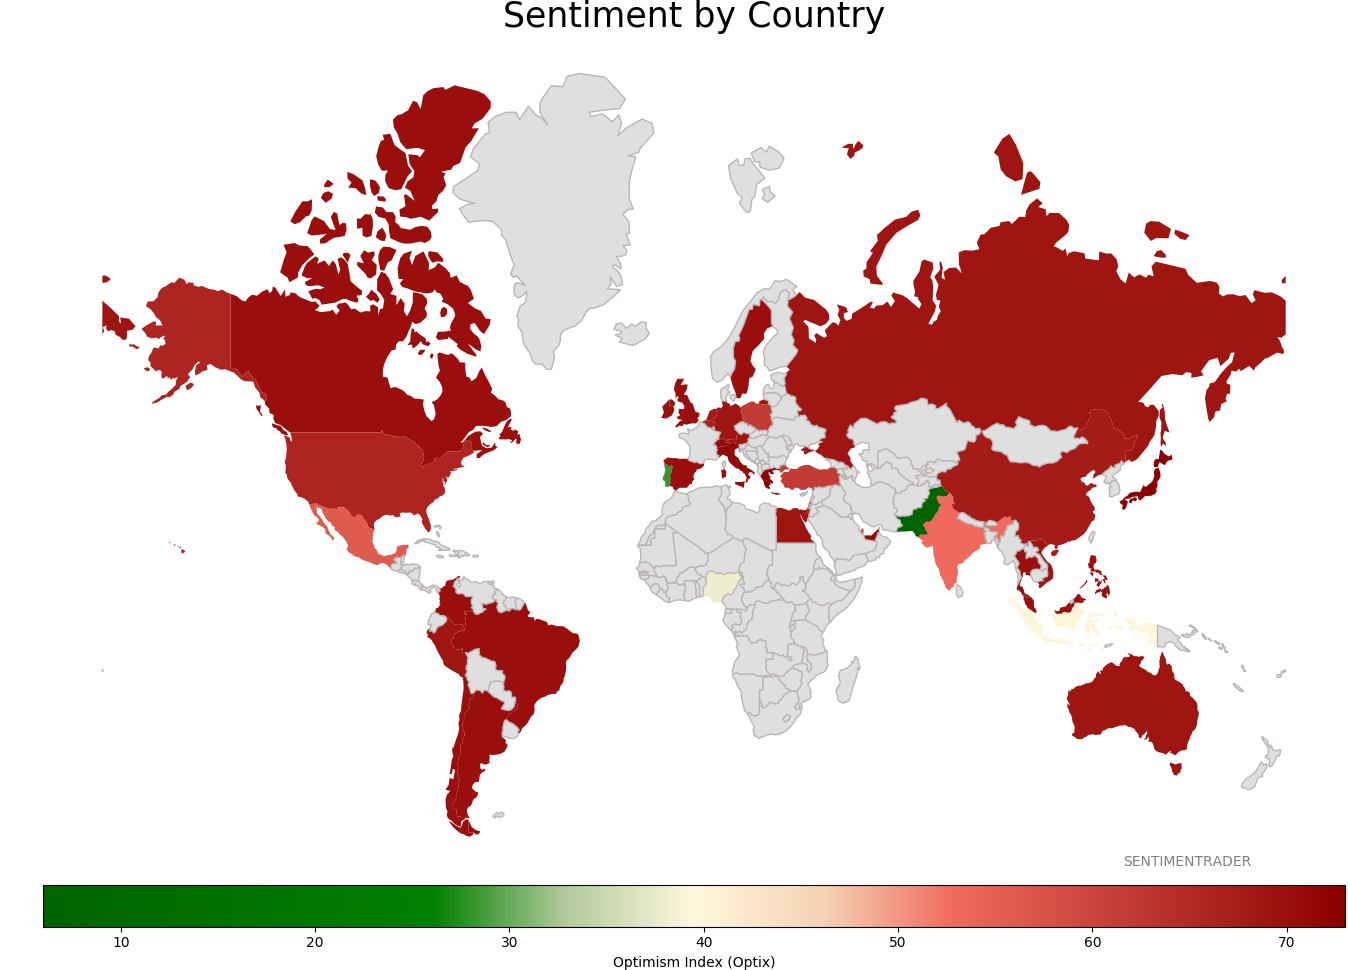
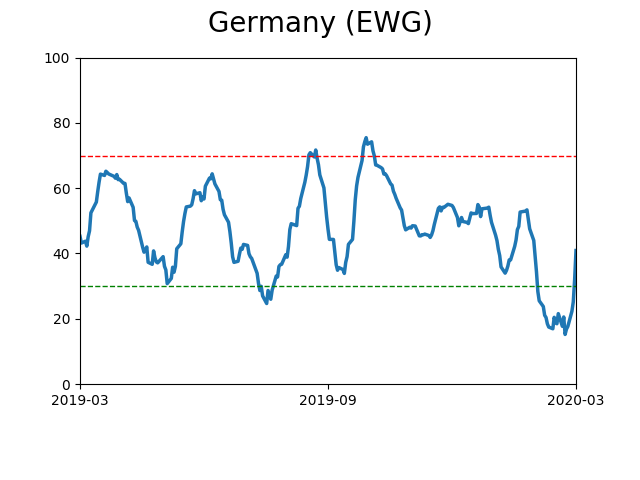
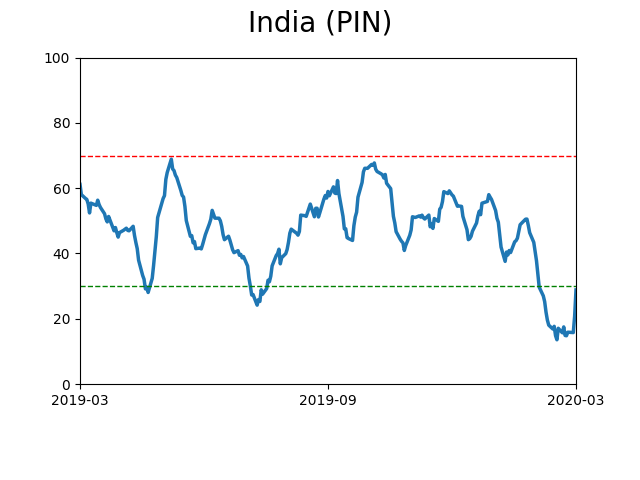
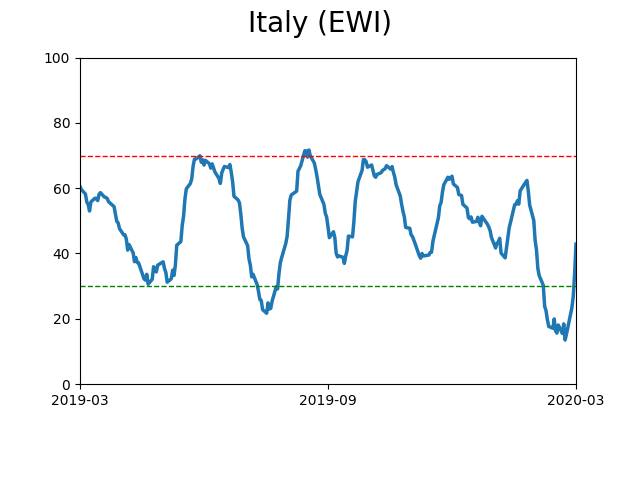
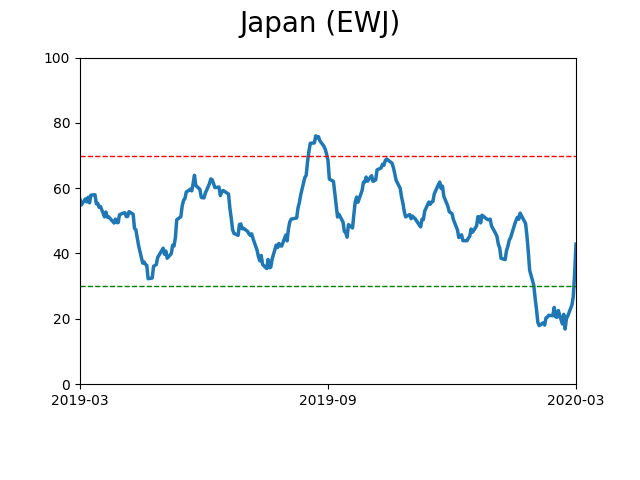
Sentiment Around The World
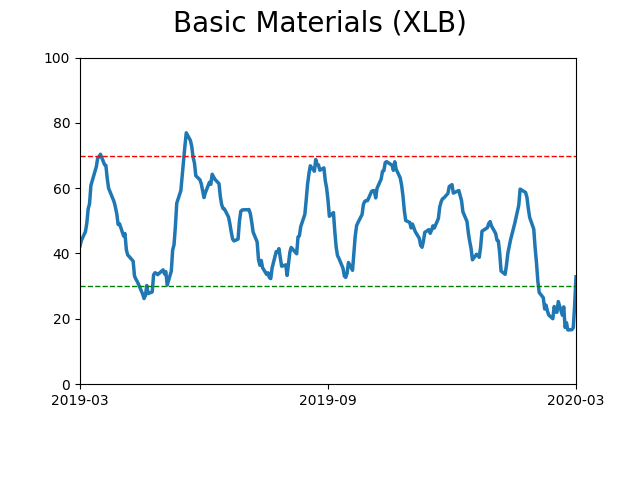
Optimism Index Thumbnails
|
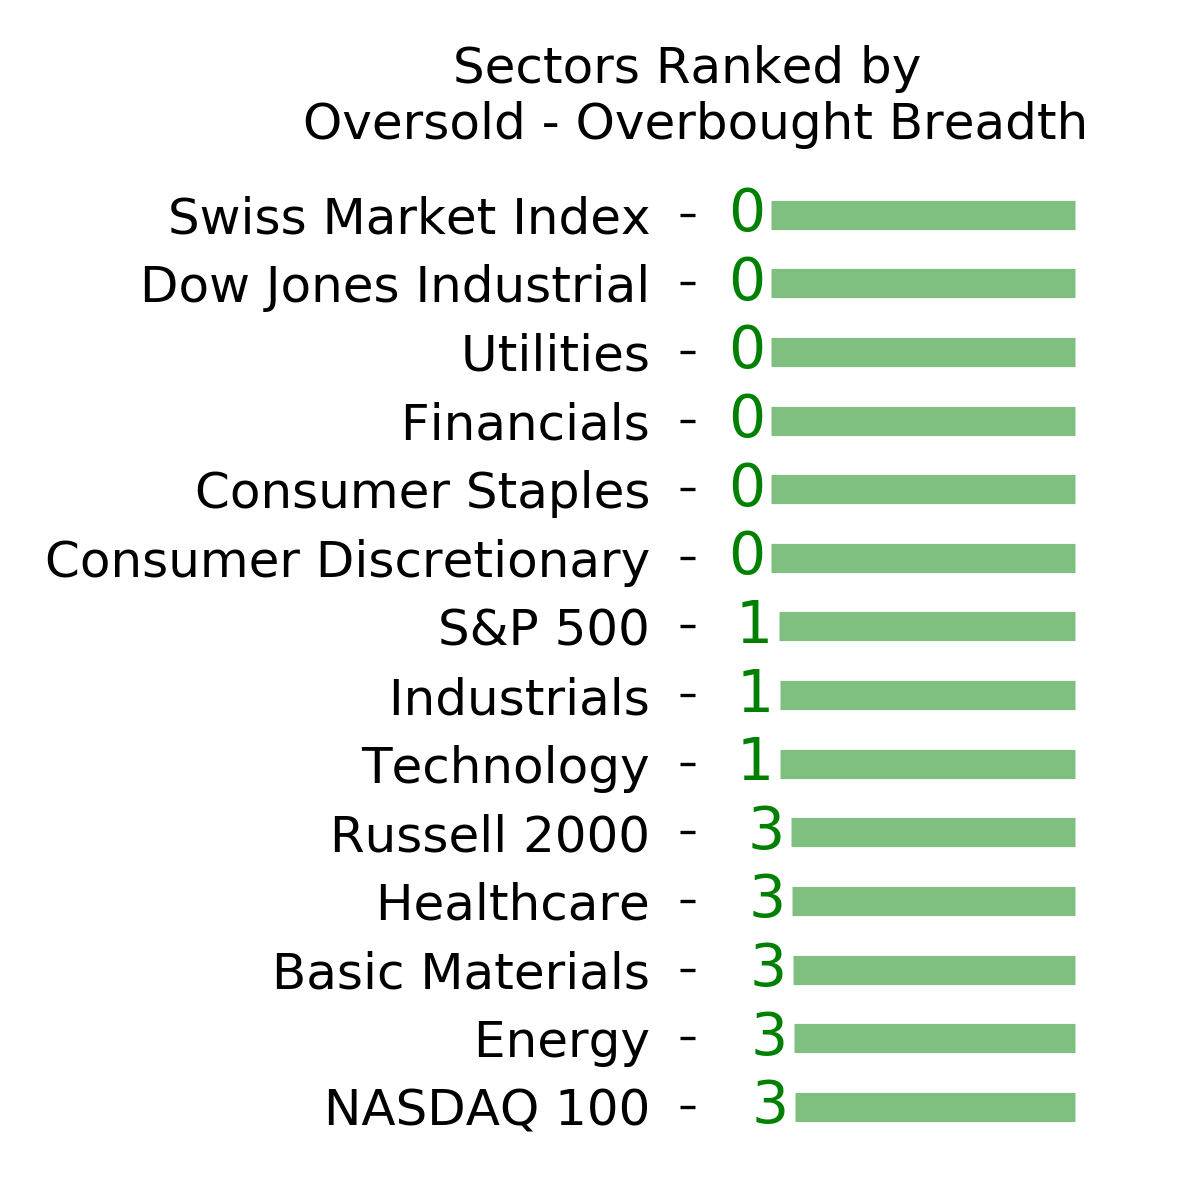
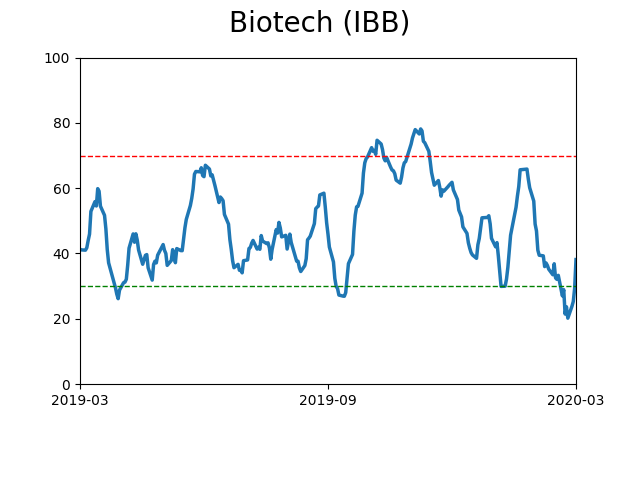
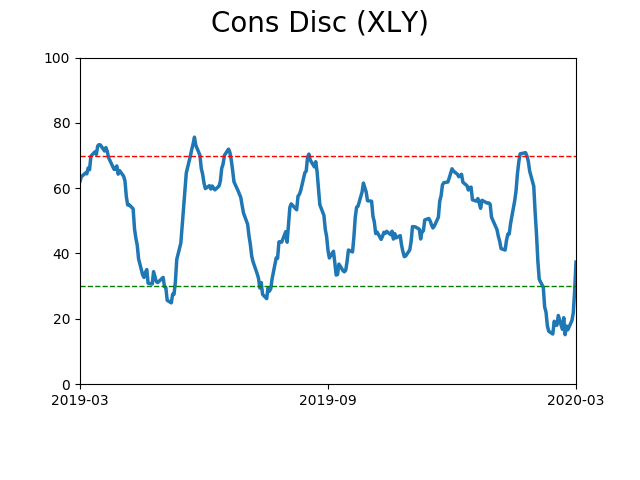
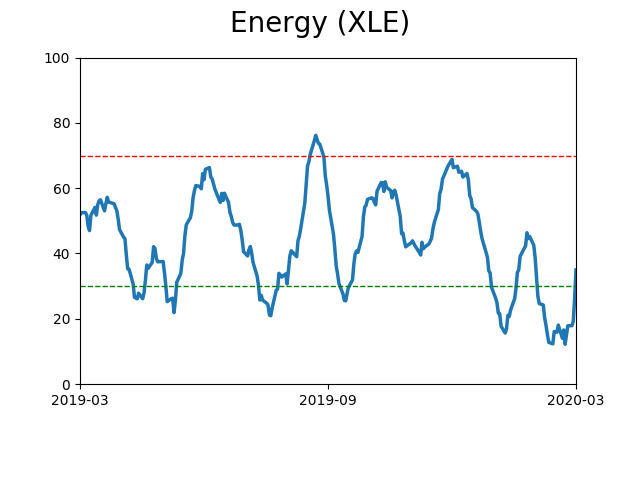
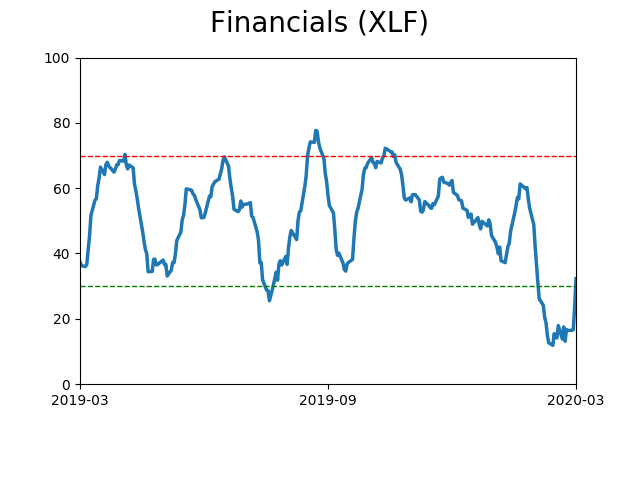
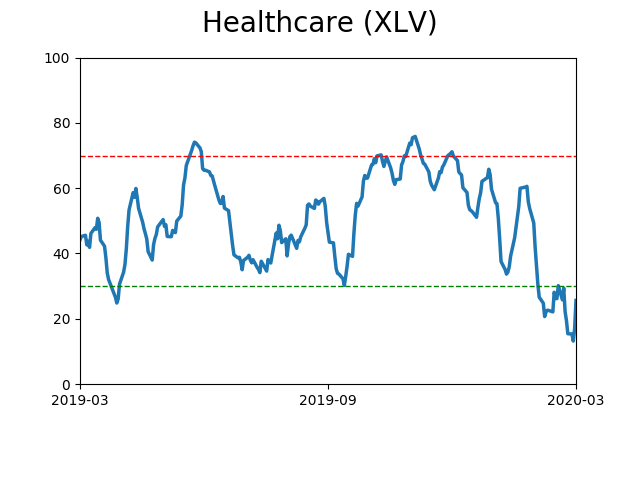
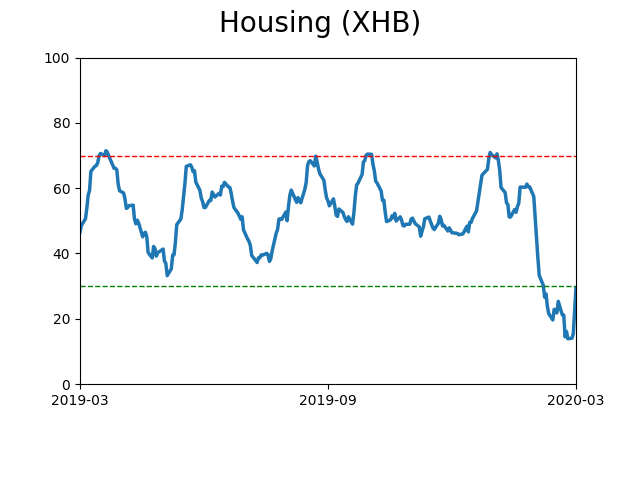
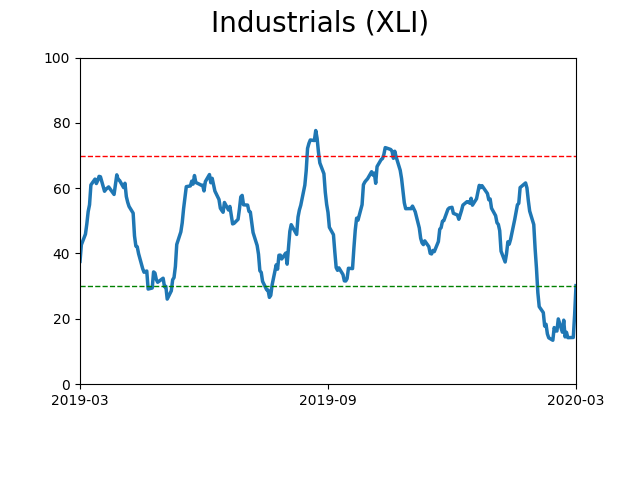
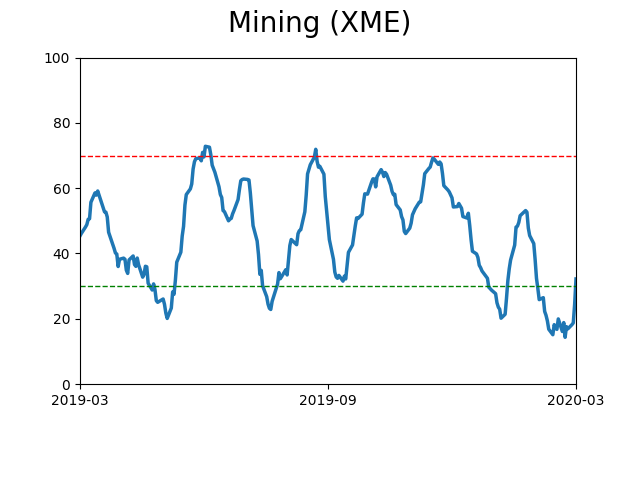
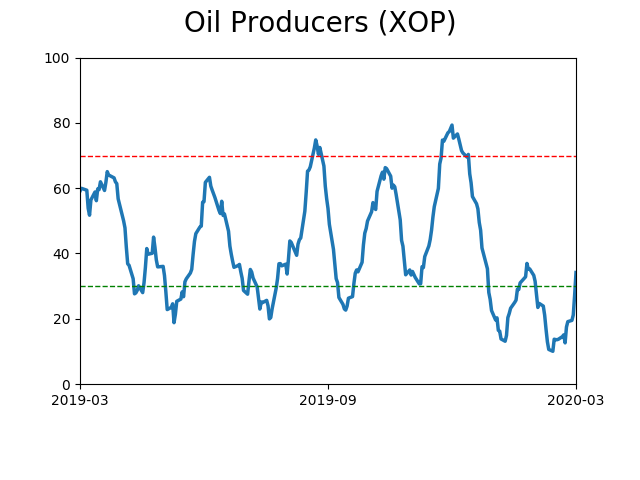
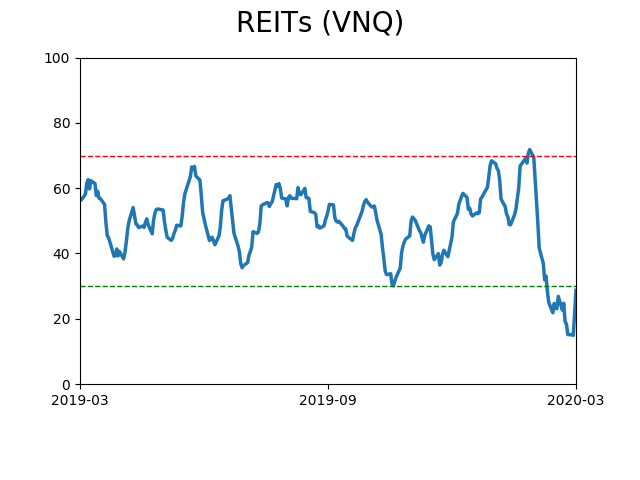
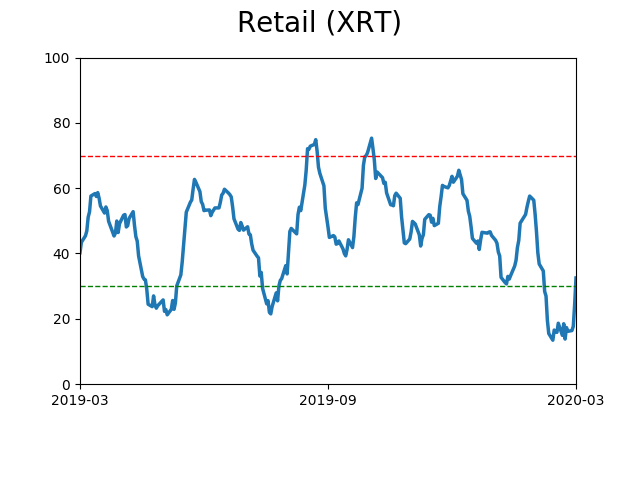
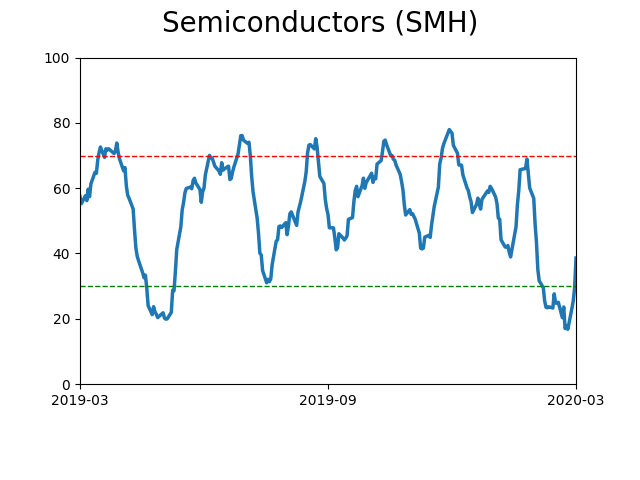
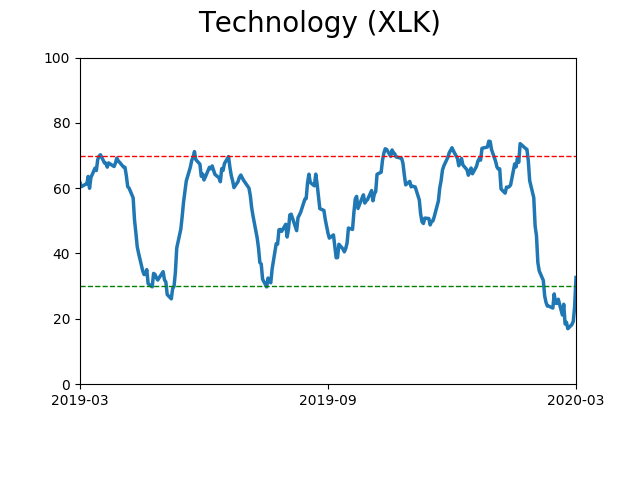
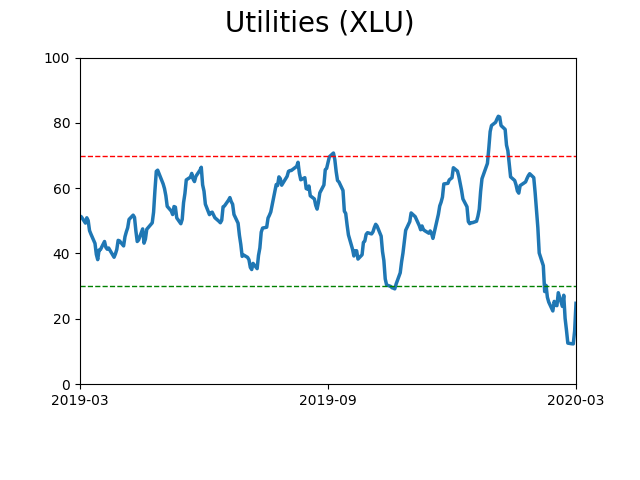
Sector ETF's - 10-Day Moving Average
|
|
|
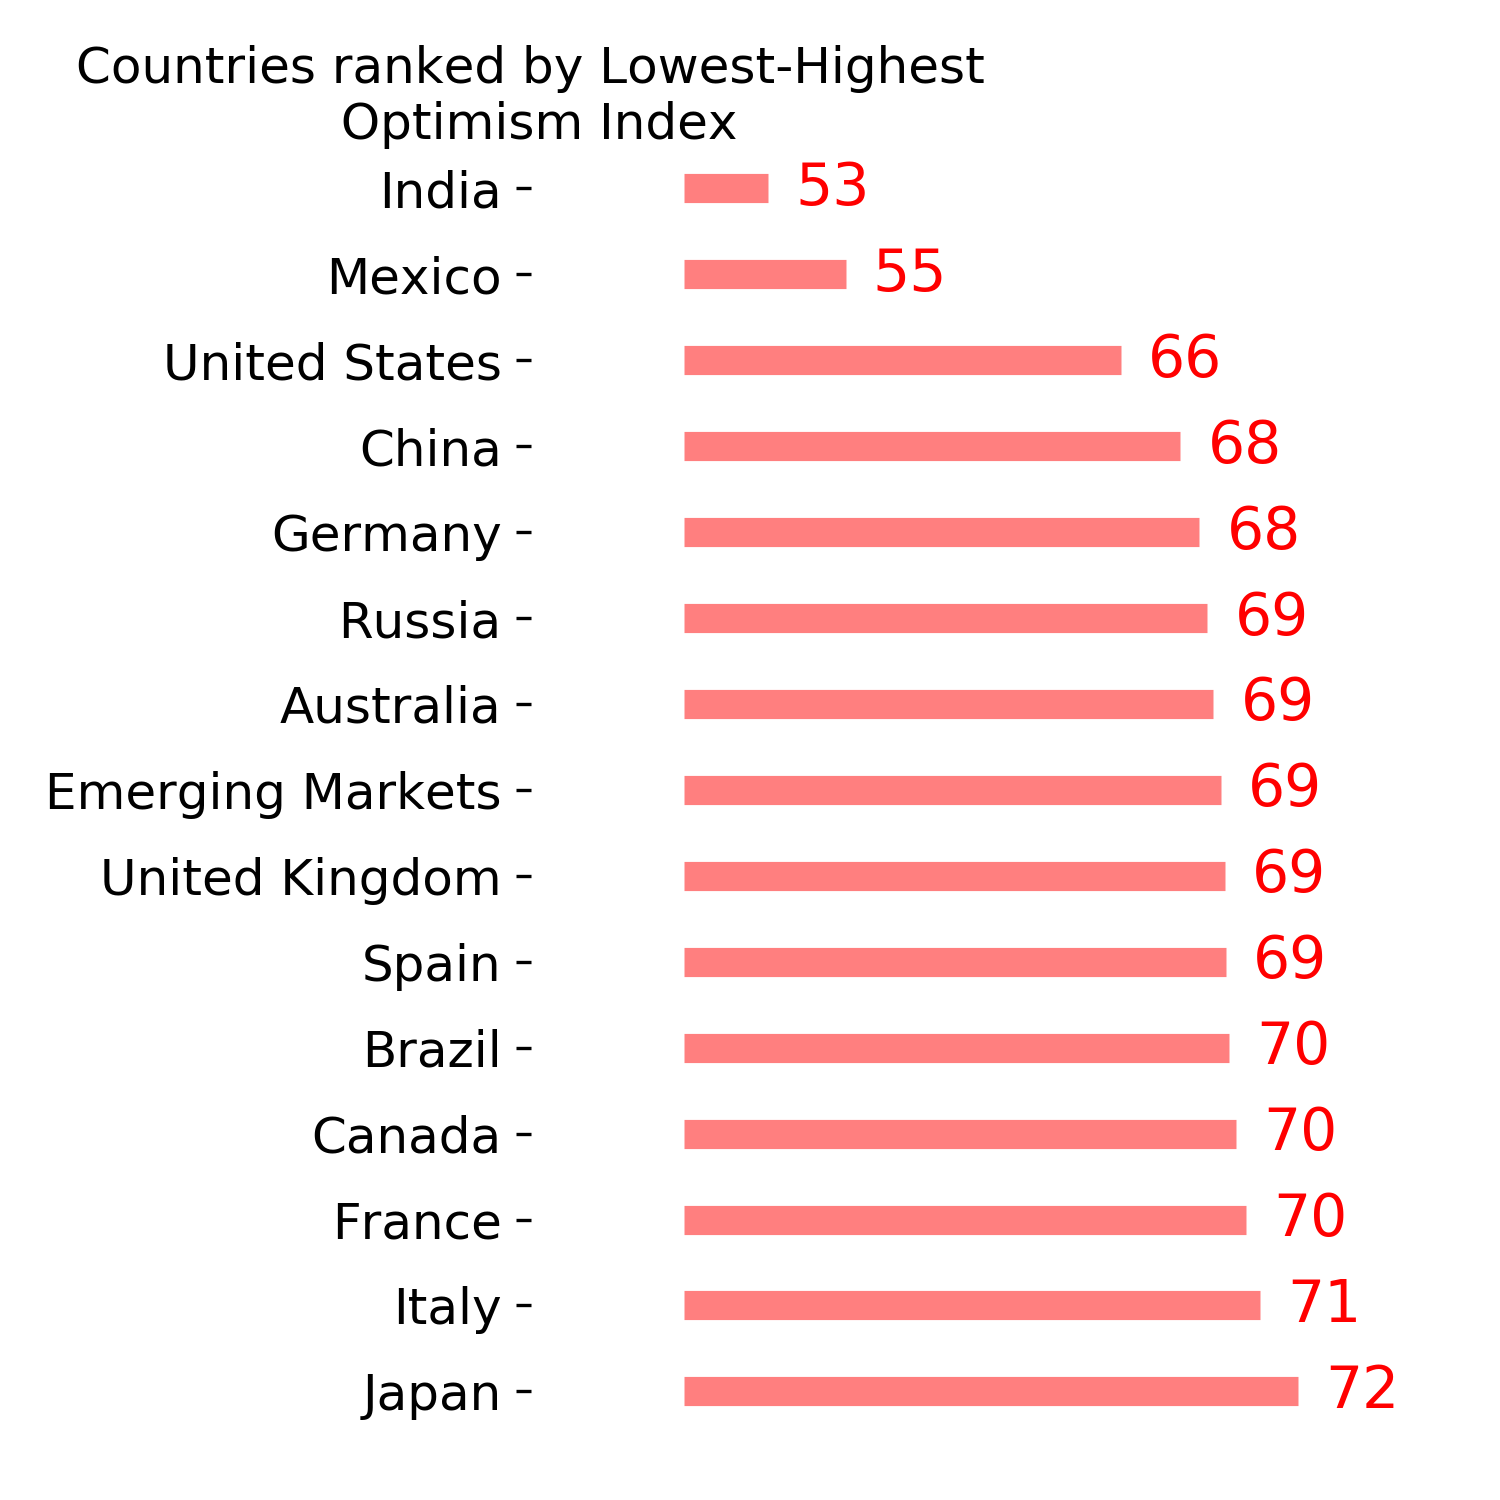
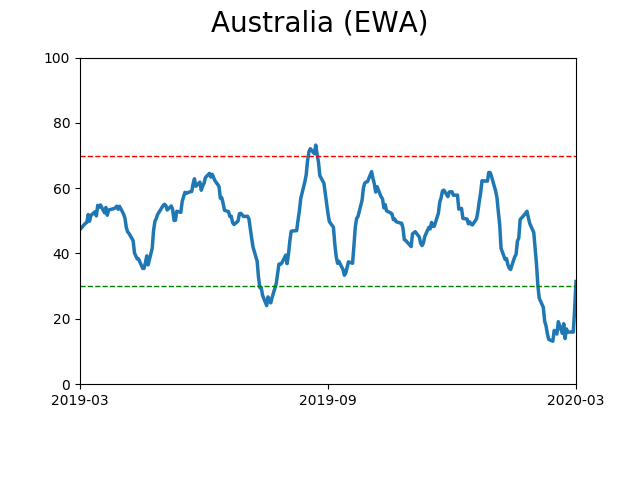
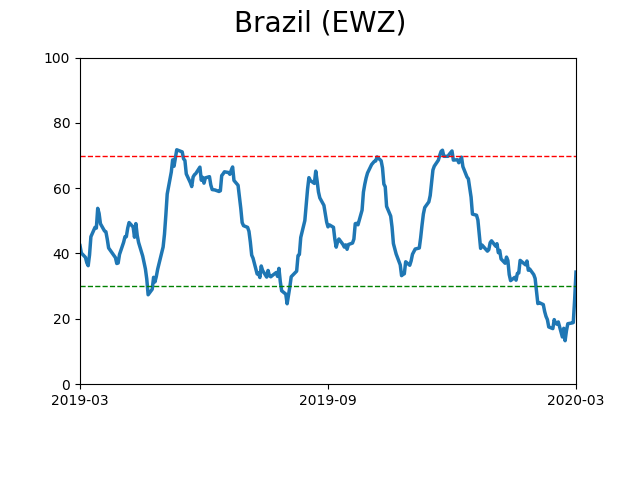
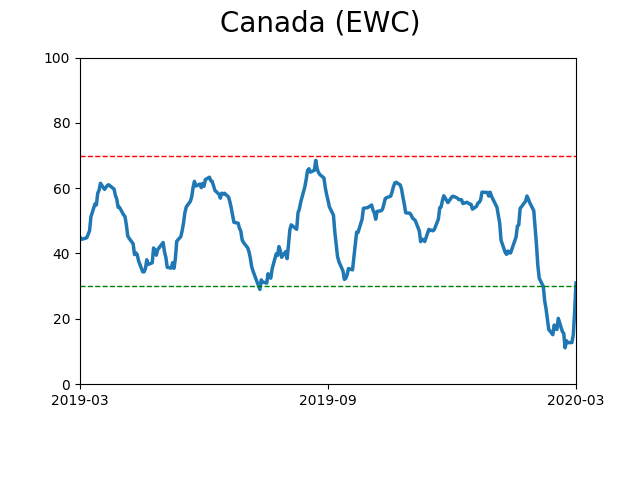
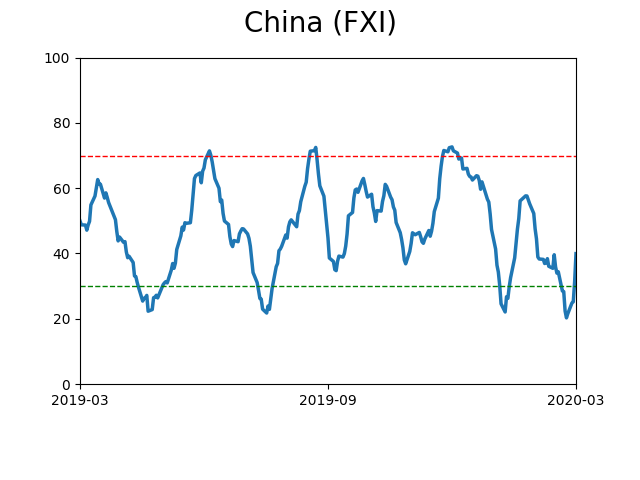
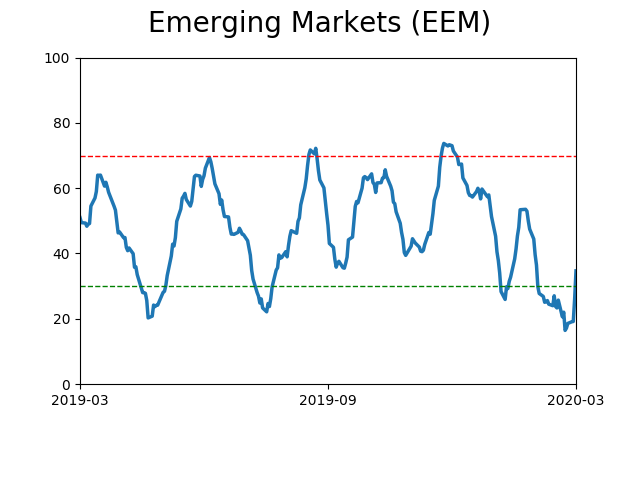
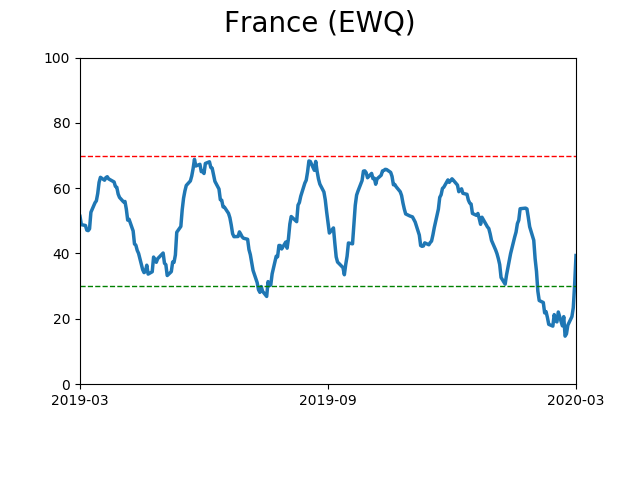
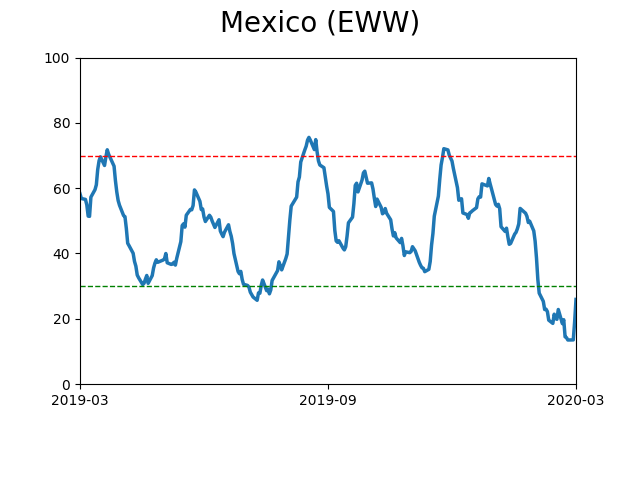
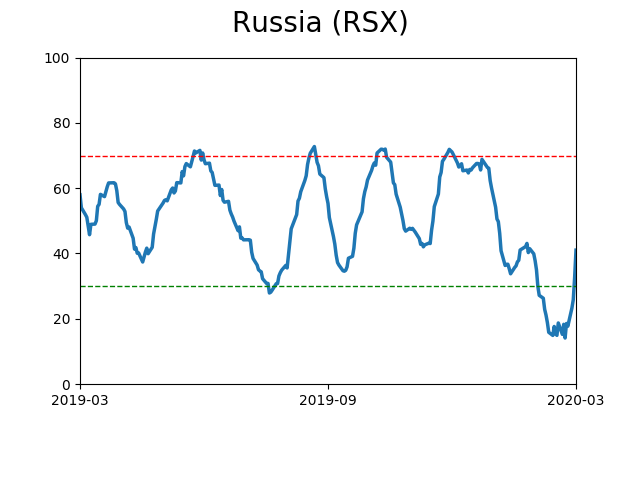
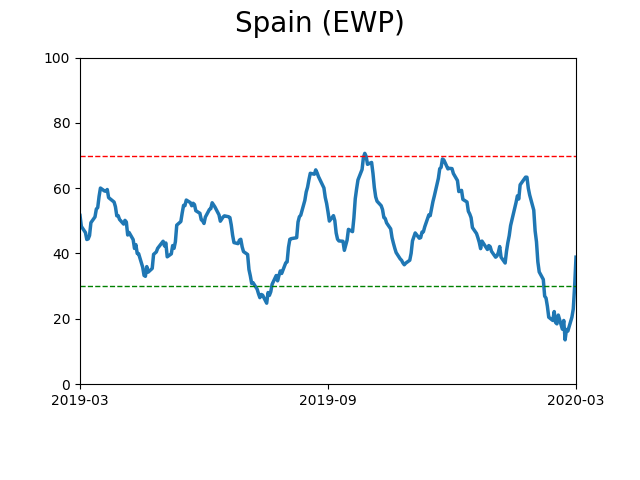
Country ETF's - 10-Day Moving Average
|
|
|
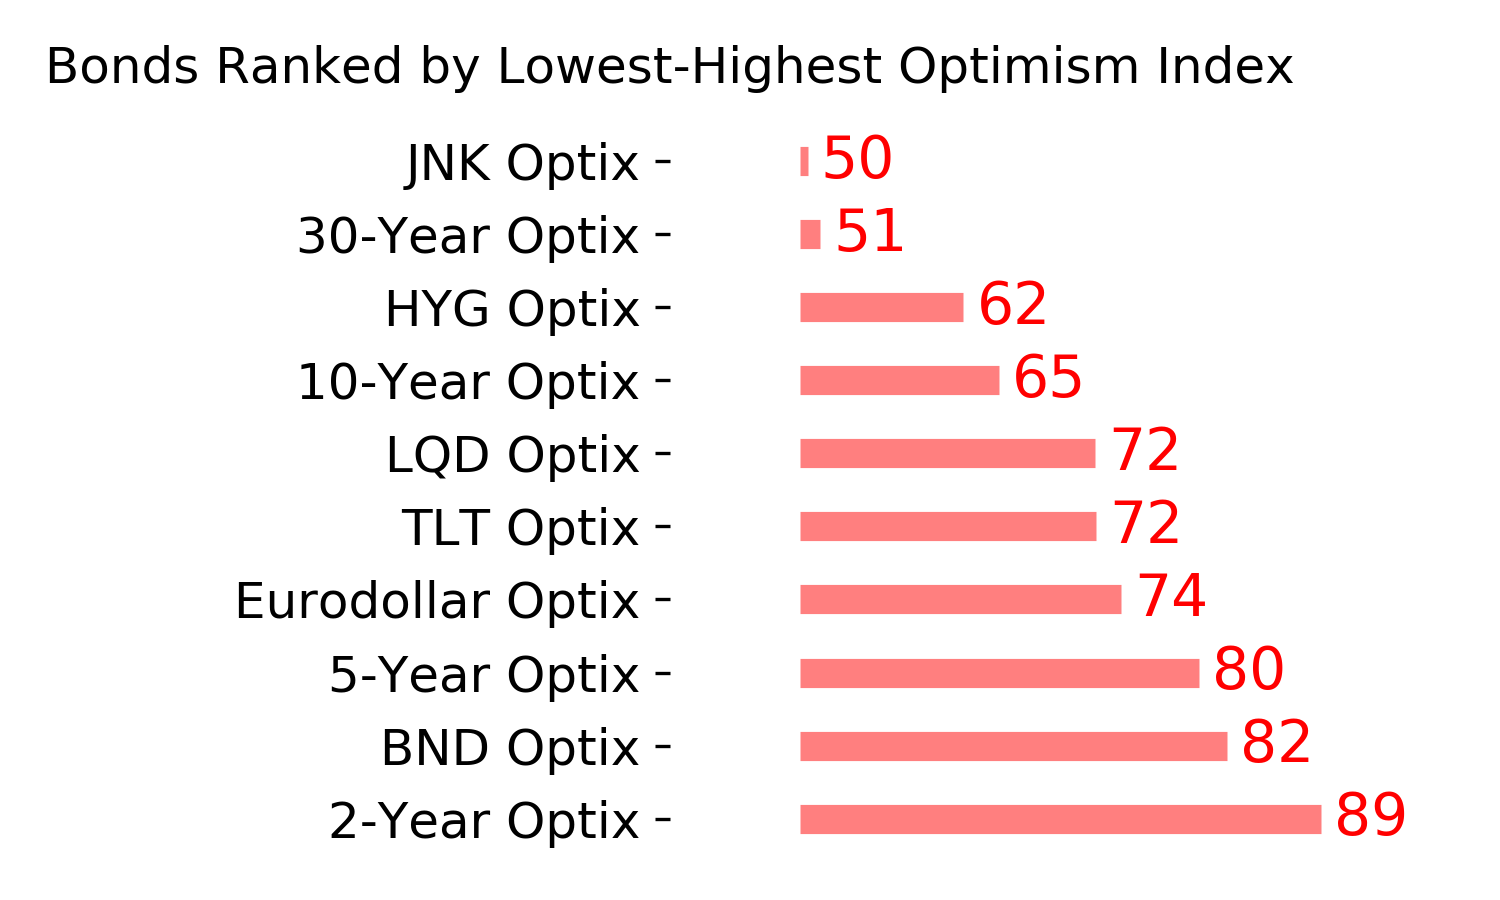
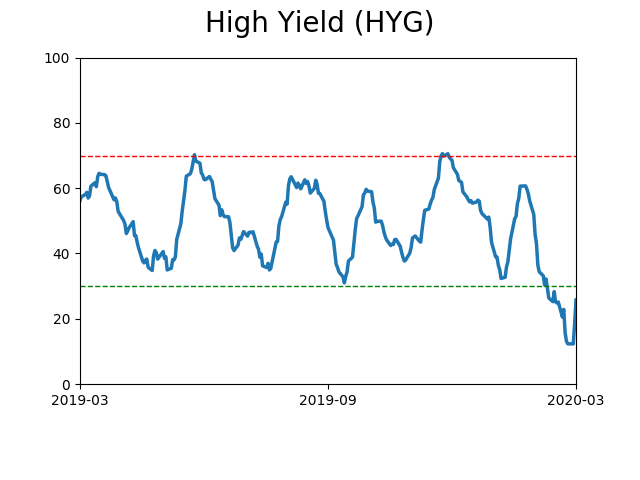
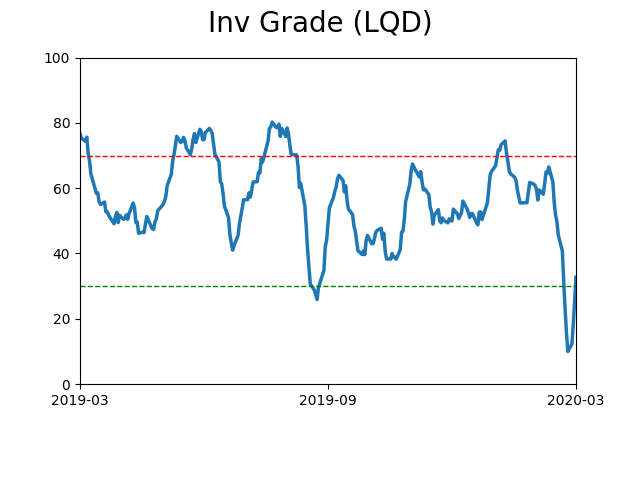
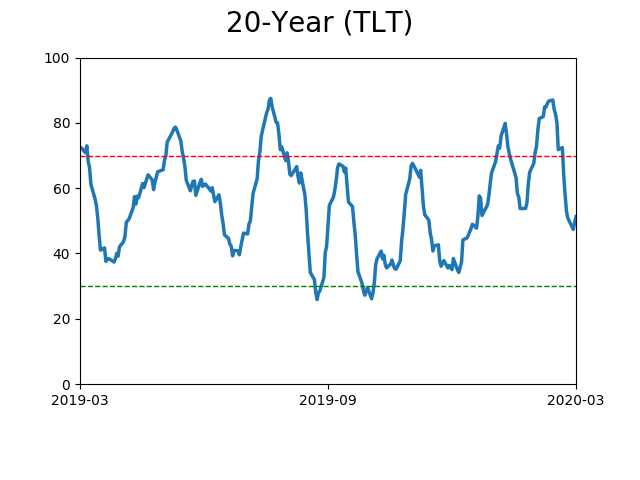
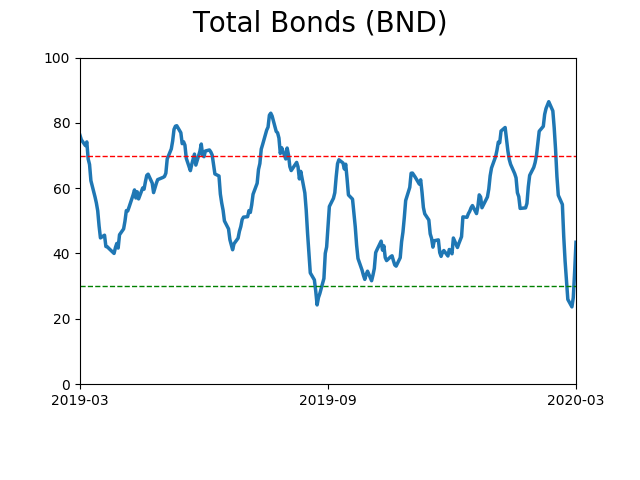
Bond ETF's - 10-Day Moving Average
|
|
|
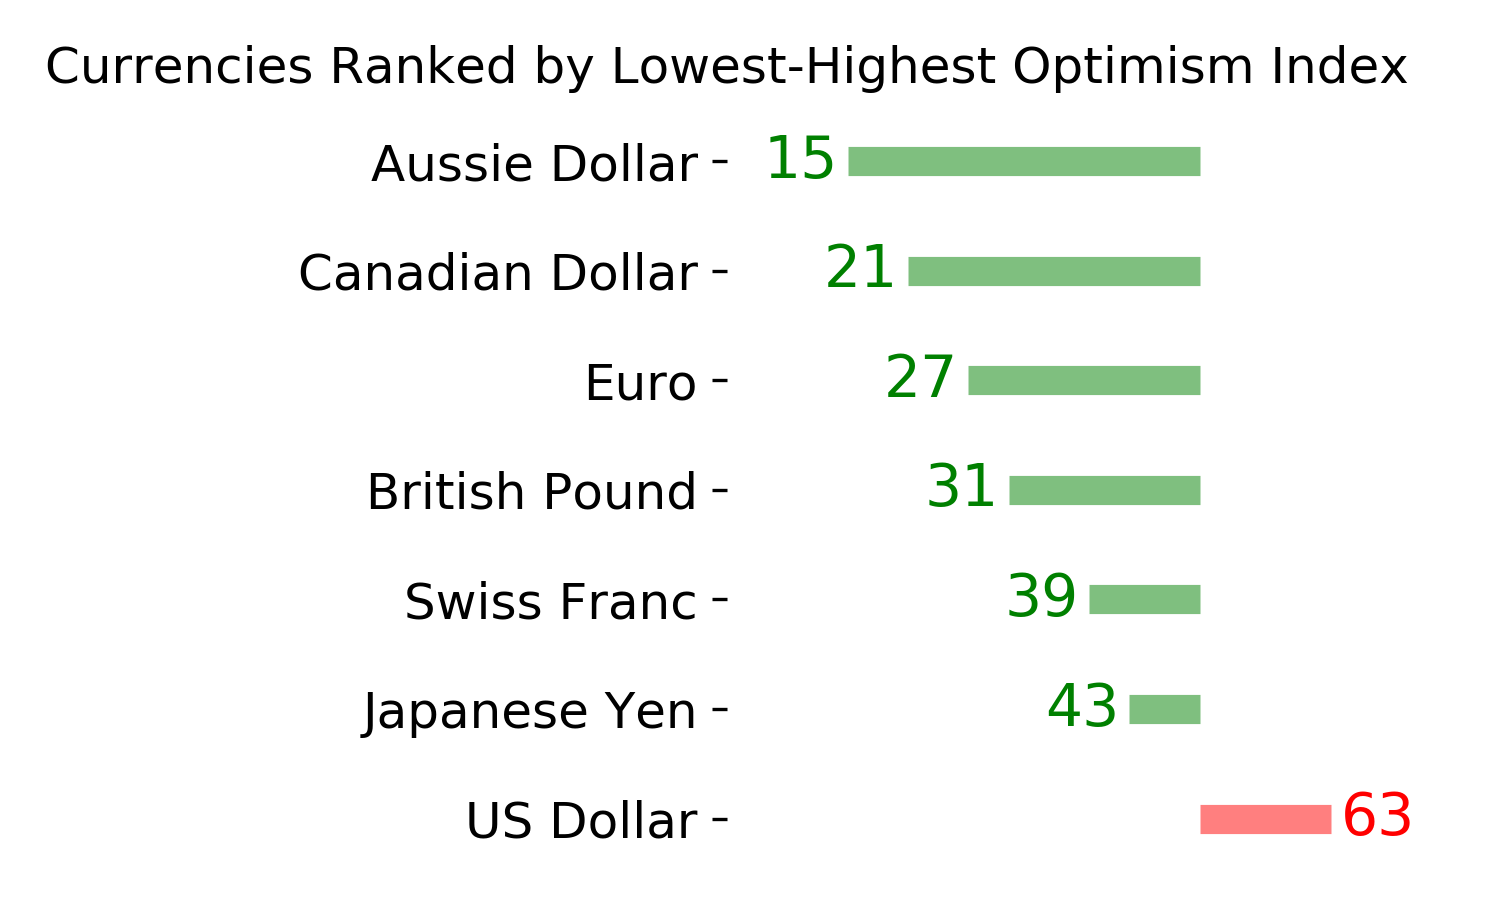
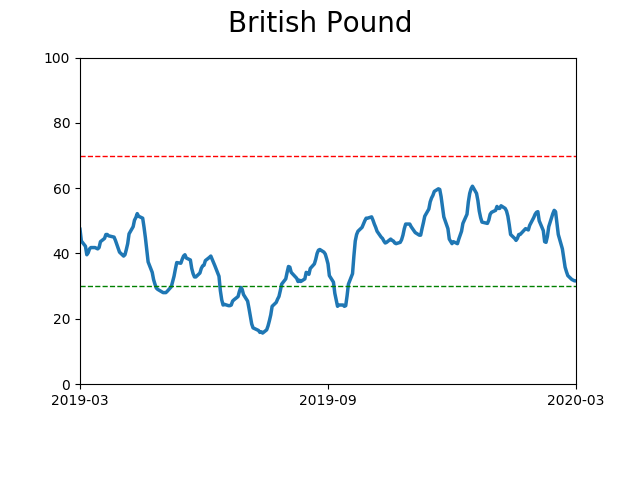
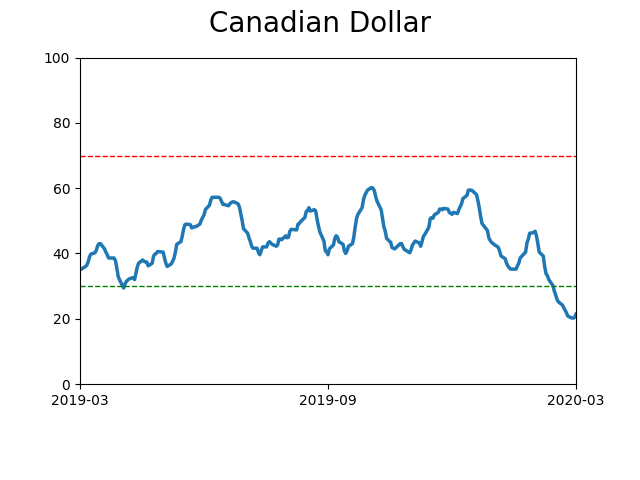
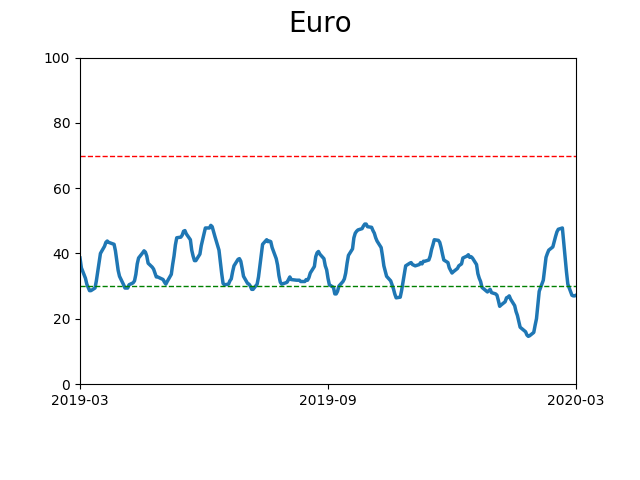
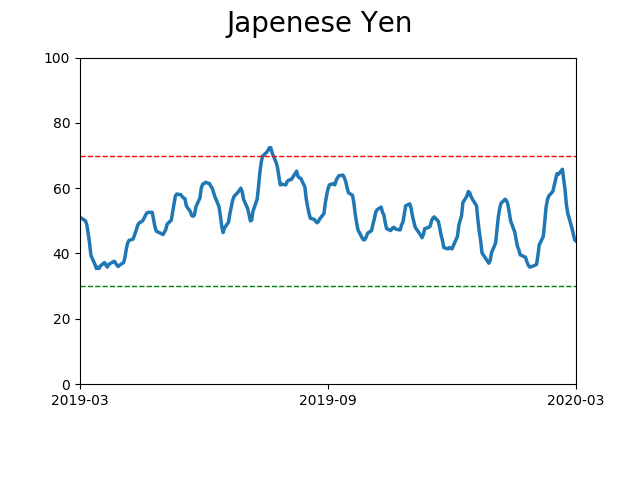
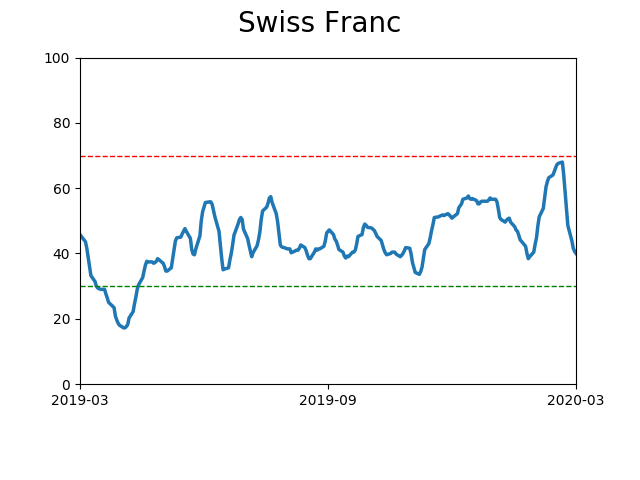
Currency ETF's - 5-Day Moving Average
|
|
|
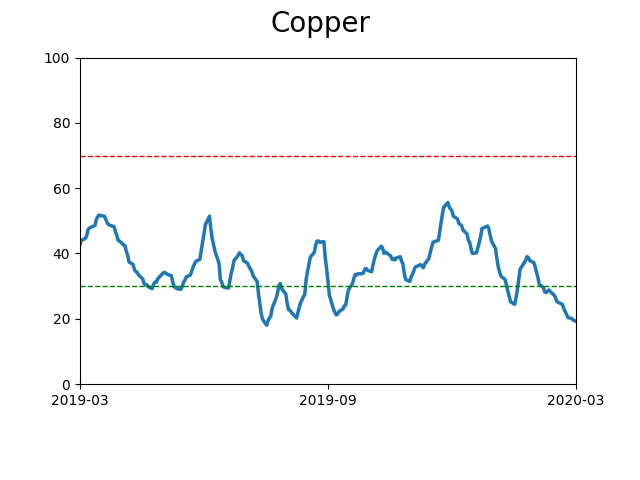
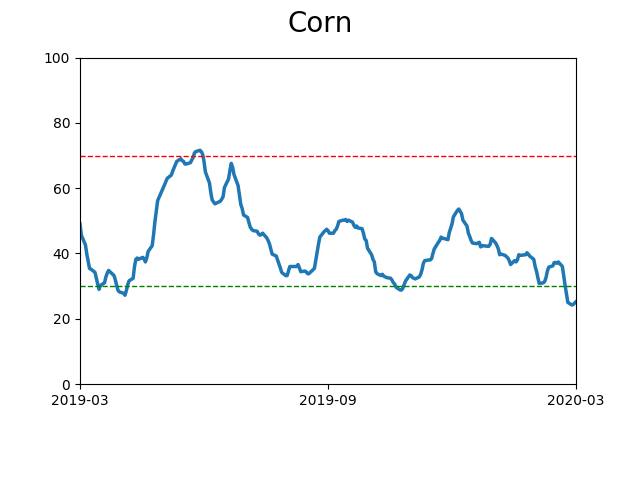
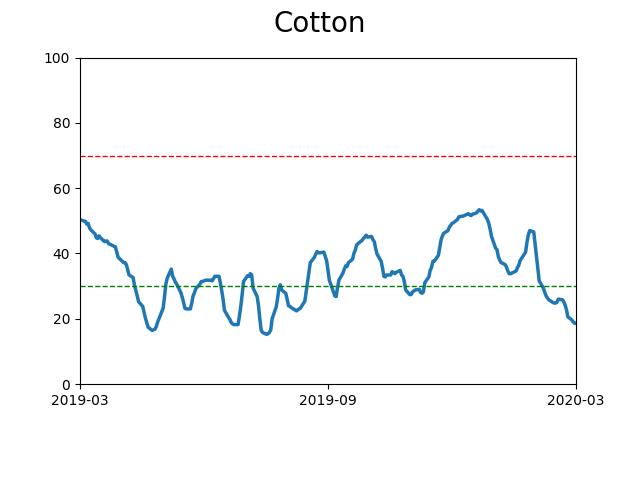
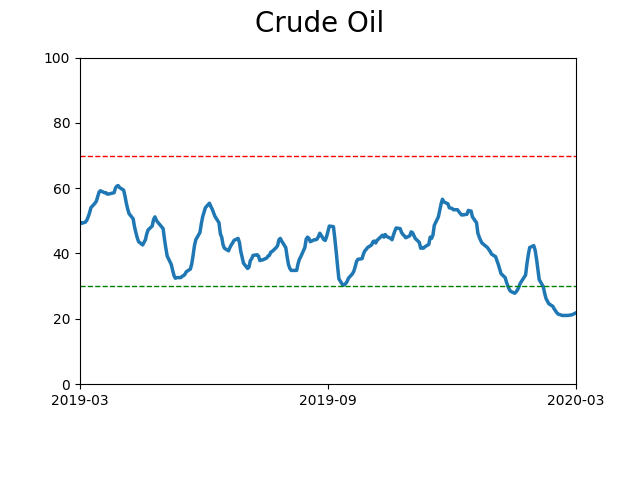
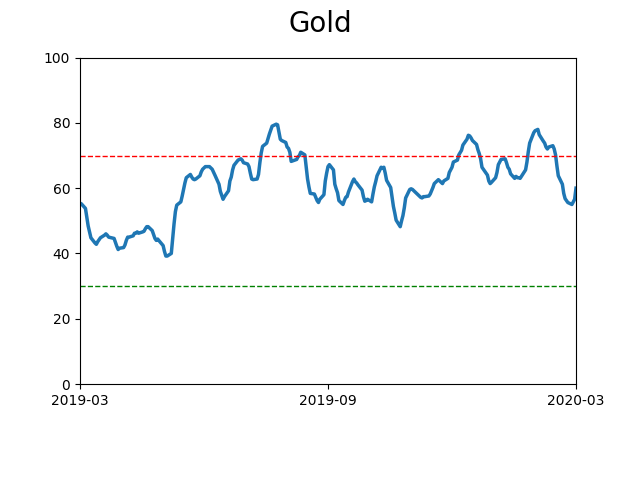
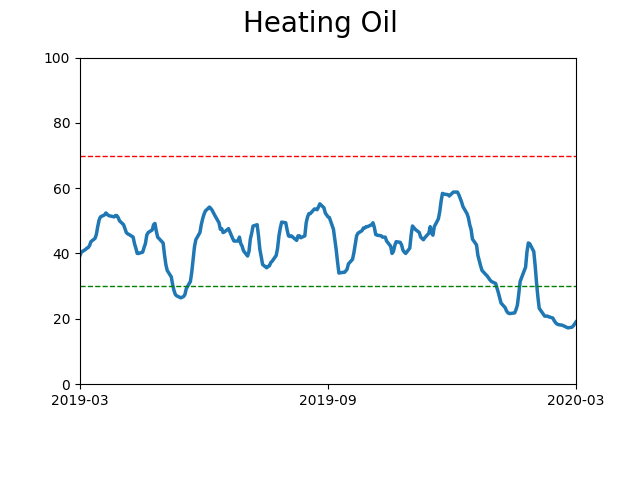
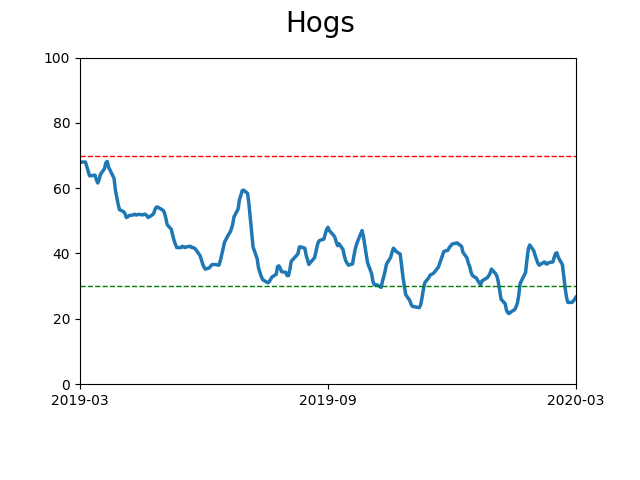
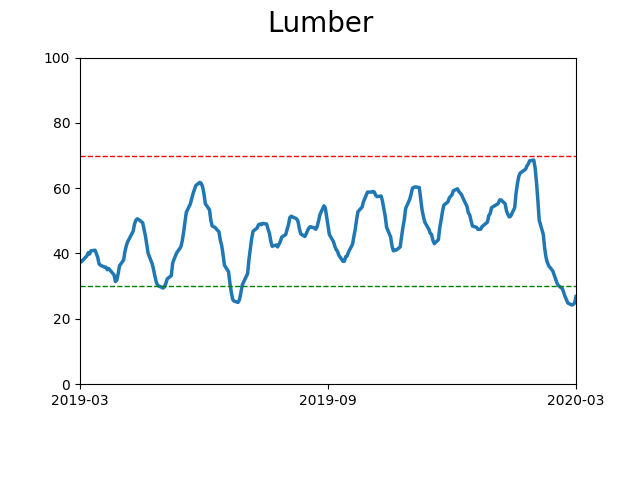
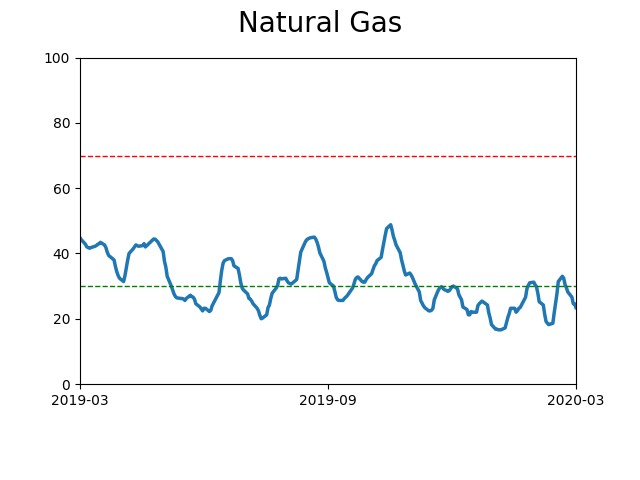
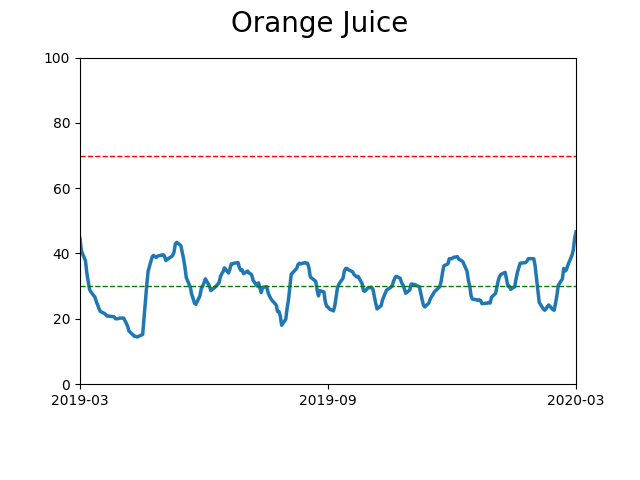
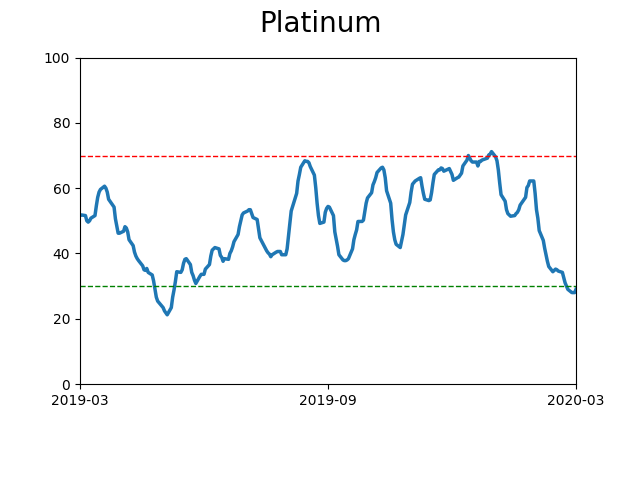
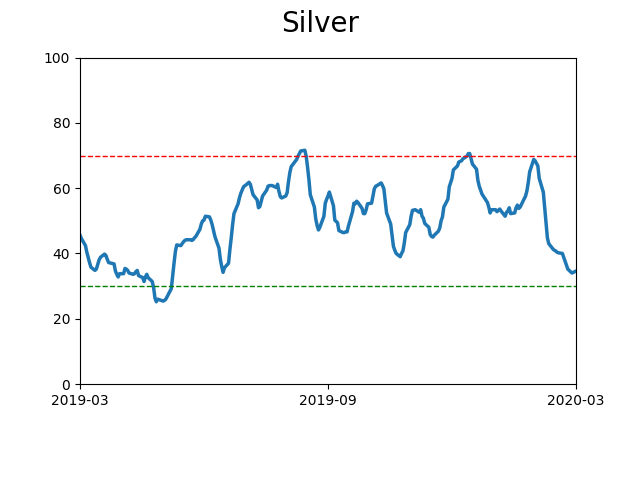
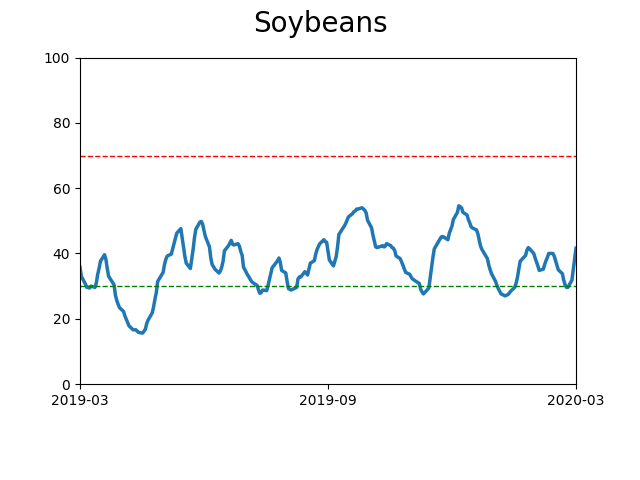
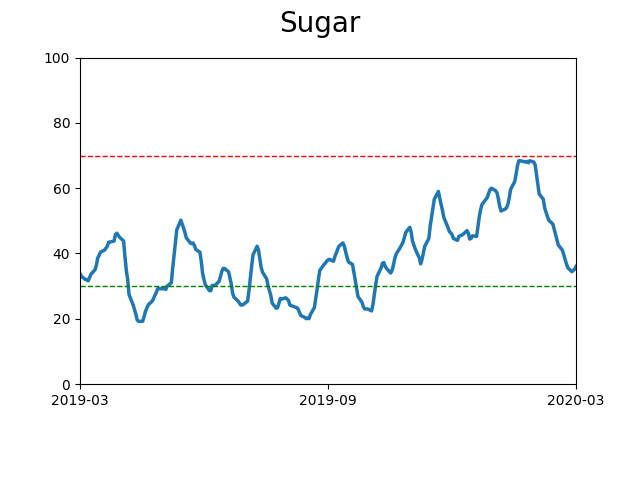
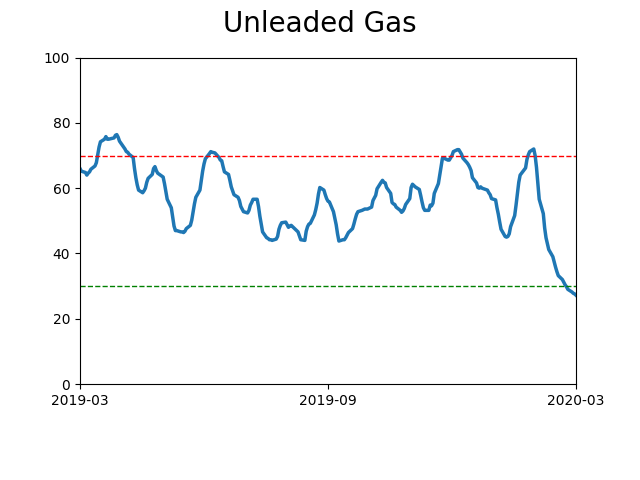
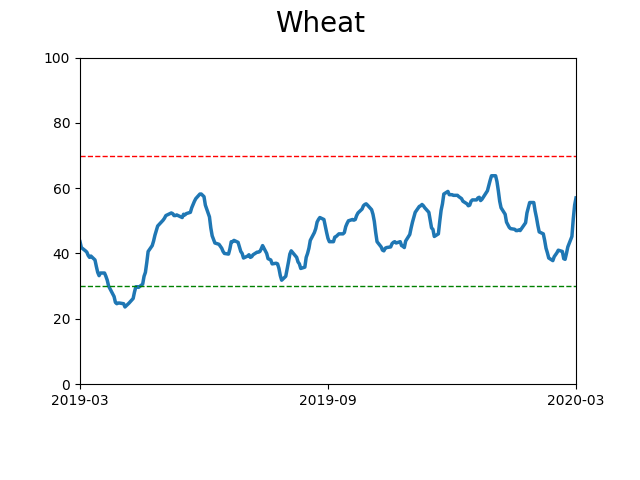
Commodity ETF's - 5-Day Moving Average
|
|