Headlines
|
|
IPO mania continues, with a caveat:
There has been a record amount of initial public offerings, almost solely due to the rise of SPACs. As a percentage of total U.S. market capitalization, we've now passed the peaks in 2000 and 2007, but remain below the higher levels in the 1980s and 1990s.
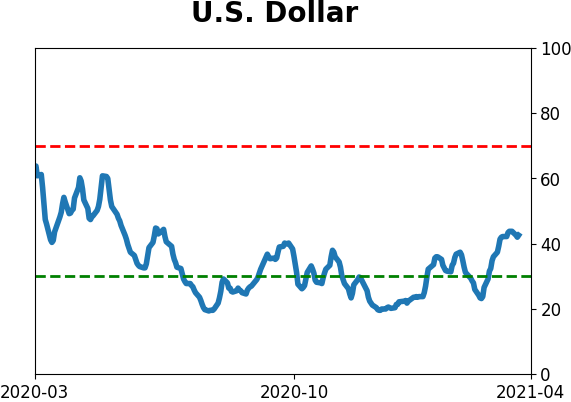
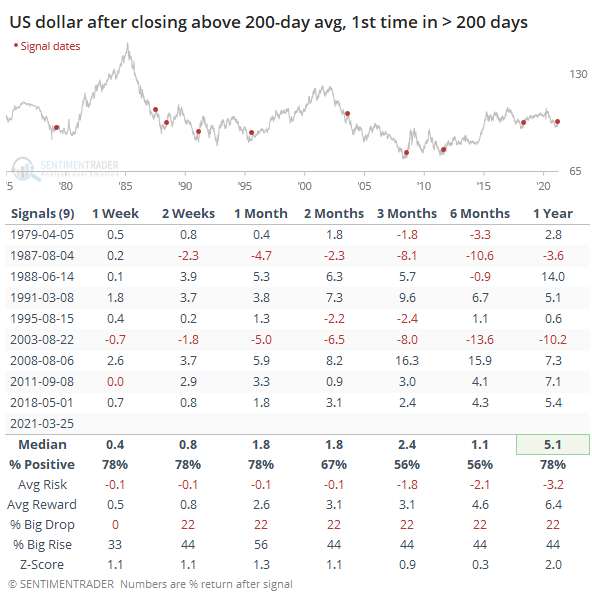
Dollar changes trend: Trends across markets and indexes have been falling this week as momentum shifts. The latest is the U.S. Dollar Index, which finally managed to climb above its 200-day moving average for the first time in more than 200 days. That ends its 9th-longest streak below the 200-day average since 1975. Other times it ended long downtrends, it tended to keep rising, with failures only in 1987 and 2003. This was not good for gold, which was higher a month later after only 2 of the 9 signals.
Bottom Line:
See the Outlook & Allocations page for more details on these summaries STOCKS: Weak sell
The extreme speculation registered in January and February is starting to get wrung out. Internal dynamics have mostly held up, so a return to neutral sentiment conditions would improve the forward risk/reward profile substantially. We're still a ways off from that. BONDS: Weak buy
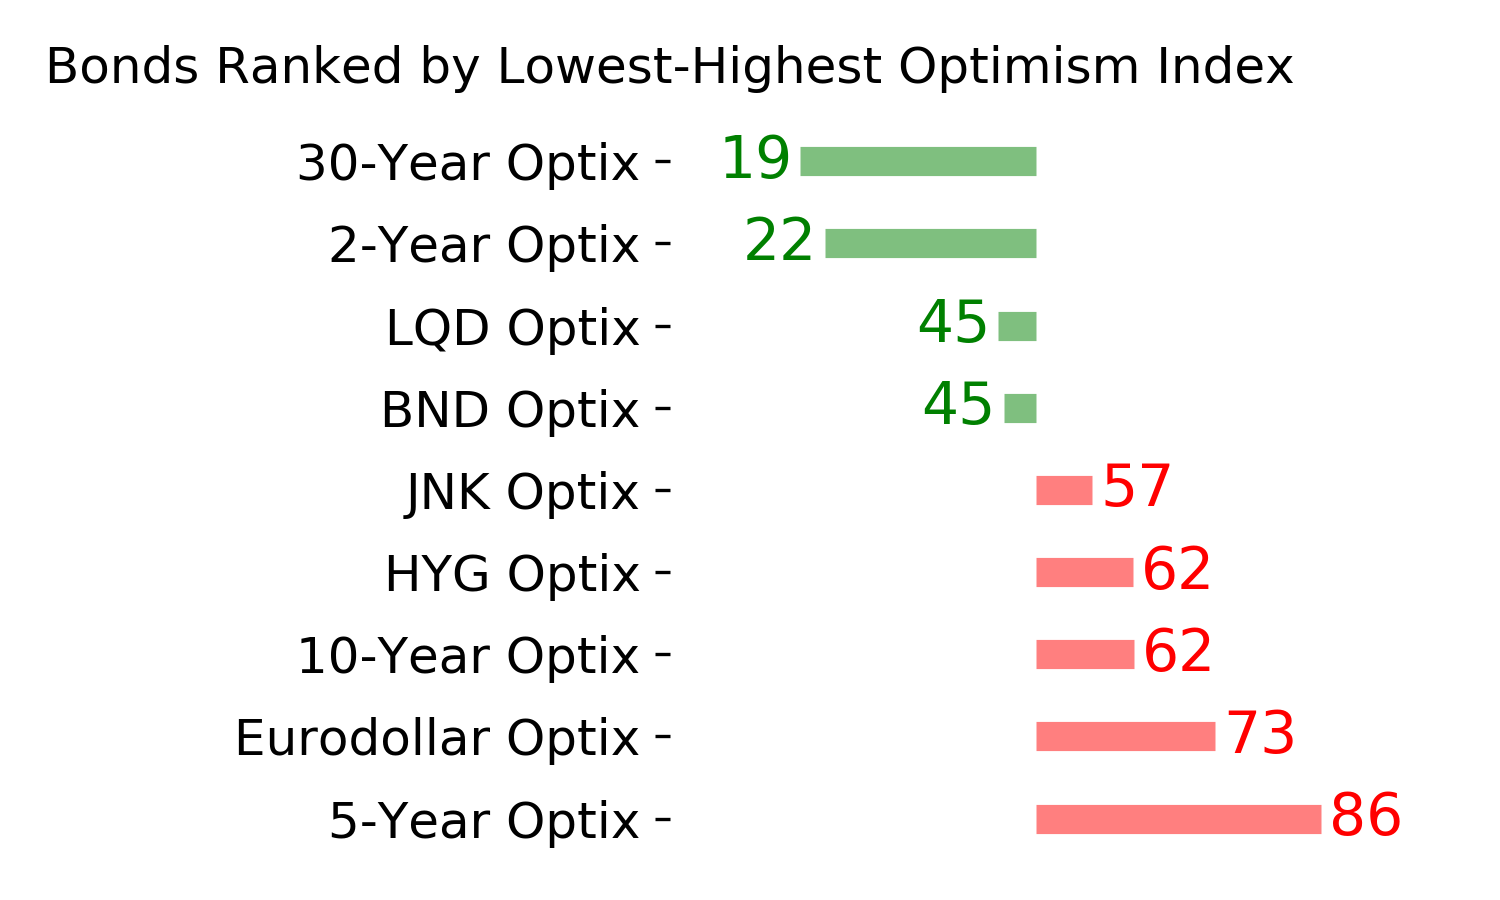
Various parts of the market have been hit in recent weeks, with mild oversold conditions. The Bond Optimism Index is now about as low as it gets during healthy bond market environments. Fixed income isn't responding well, so that needs to be monitored in case it's transitioning to a longer-term negative market environment. GOLD: Weak buy
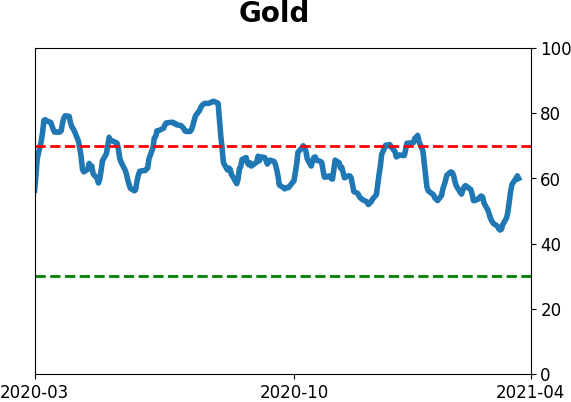
A dollar trying to rebound from a severe short position has weighed on gold and miners. The types of signals they've given in recent weeks, within the context of their recent surge, have usually resulted in higher prices over a medium- to long-term time frame. Like bonds, gold and miners aren't responding very well, and this needs to be monitored.
|
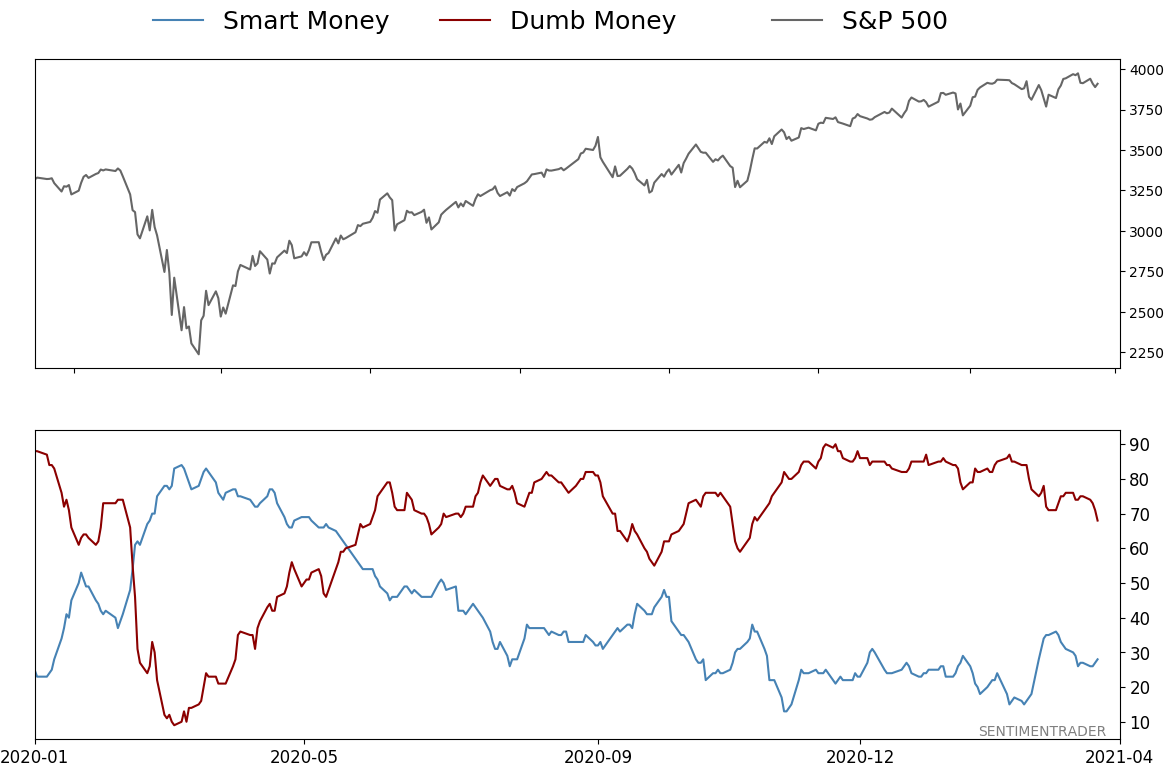
Smart / Dumb Money Confidence
|
Smart Money Confidence: 28%
Dumb Money Confidence: 68%
|
|
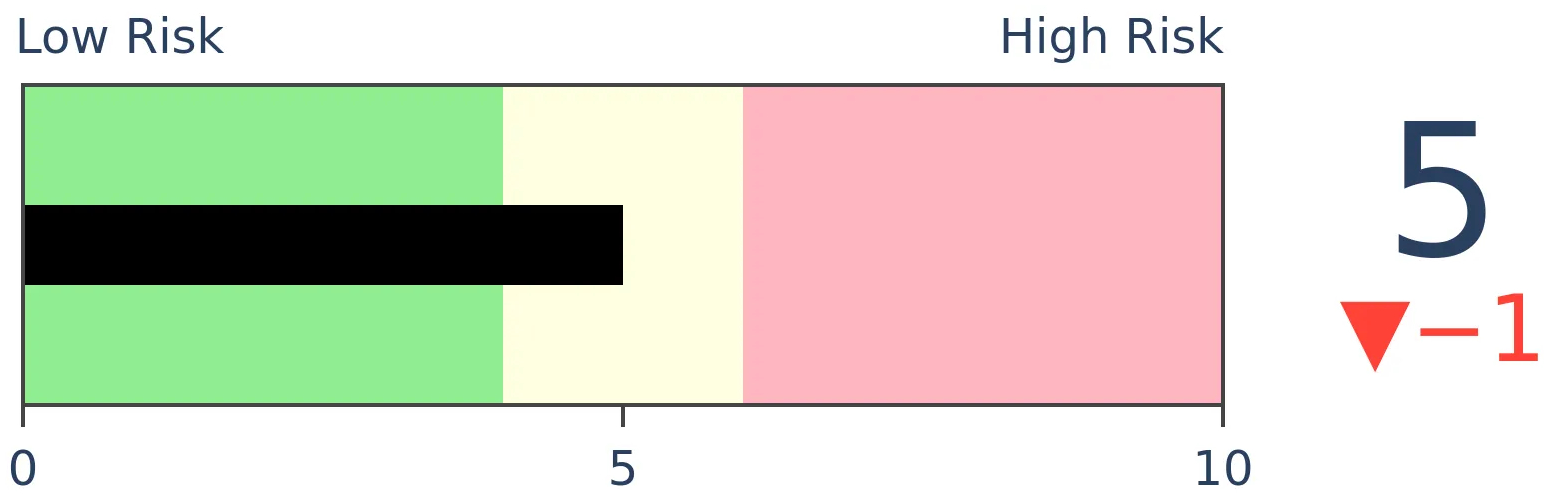
Risk Levels
Stocks Short-Term
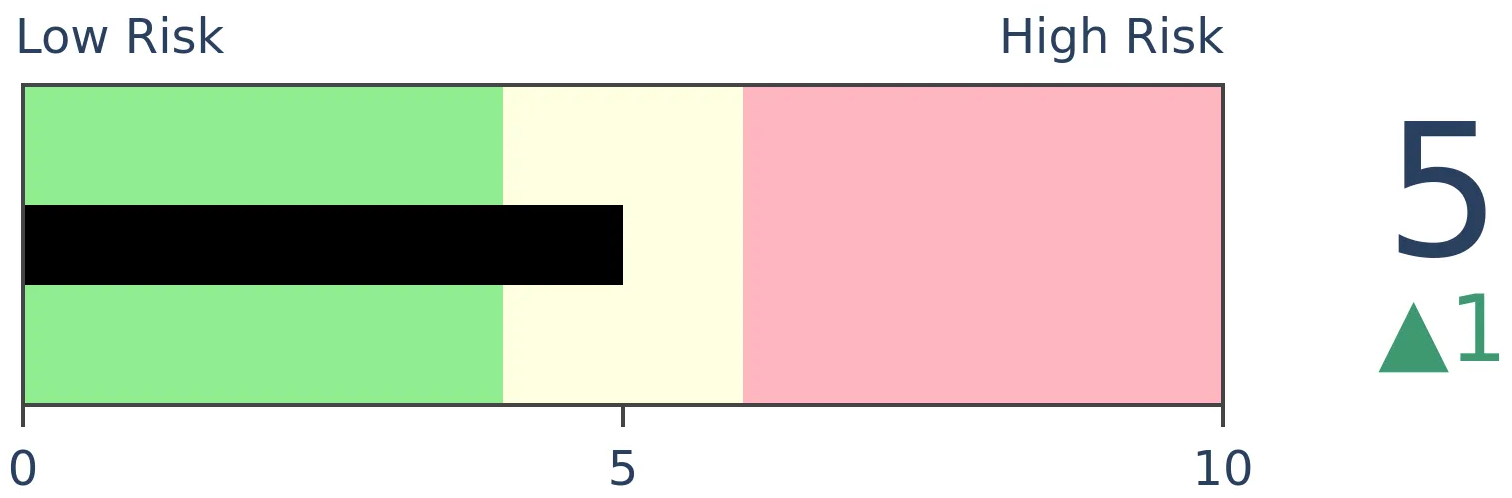
|
Stocks Medium-Term
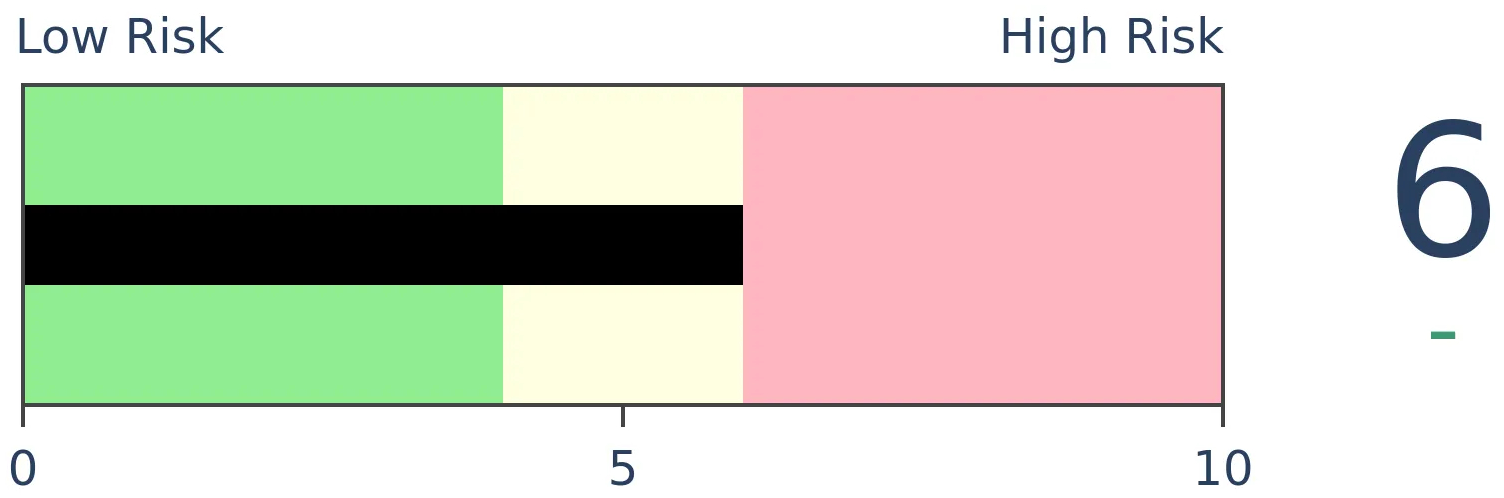
|
|
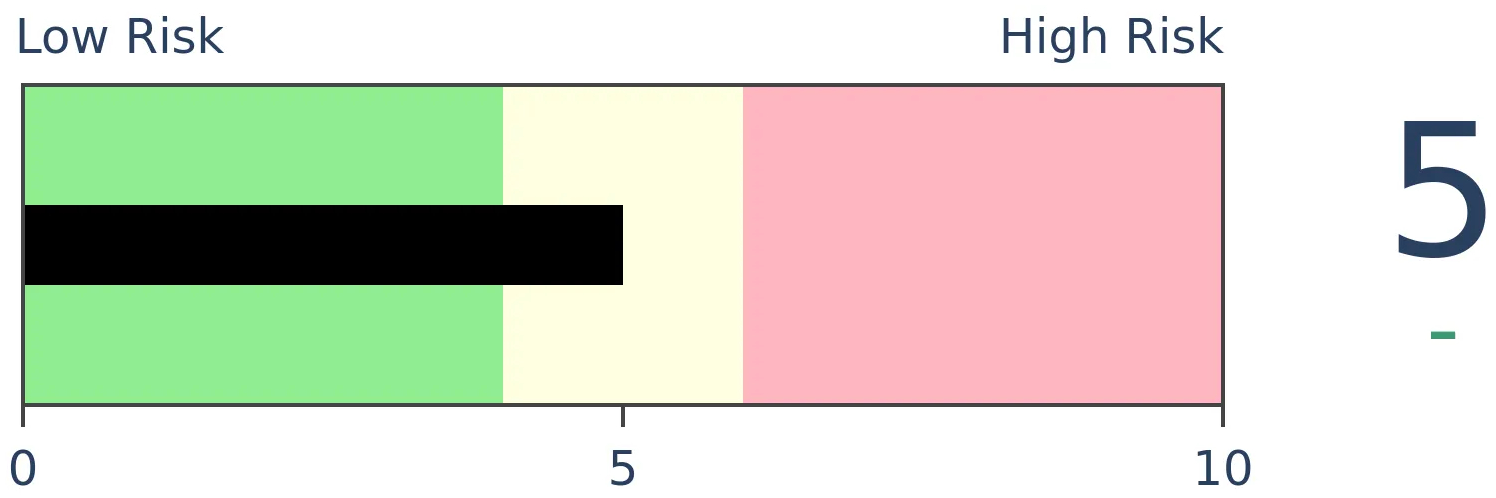
Bonds

|
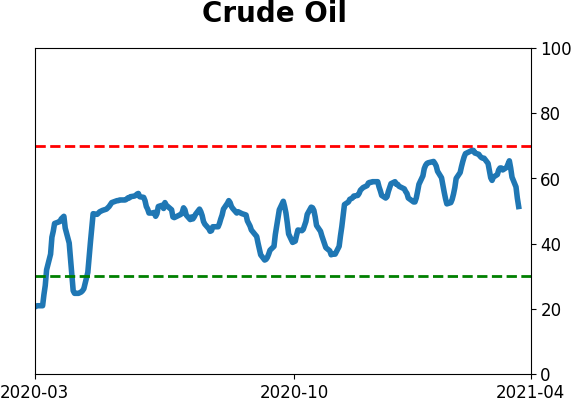
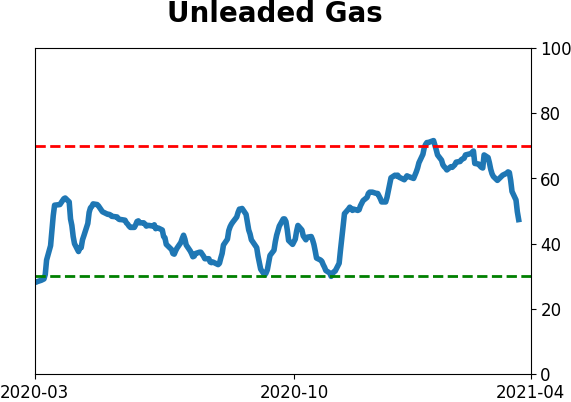
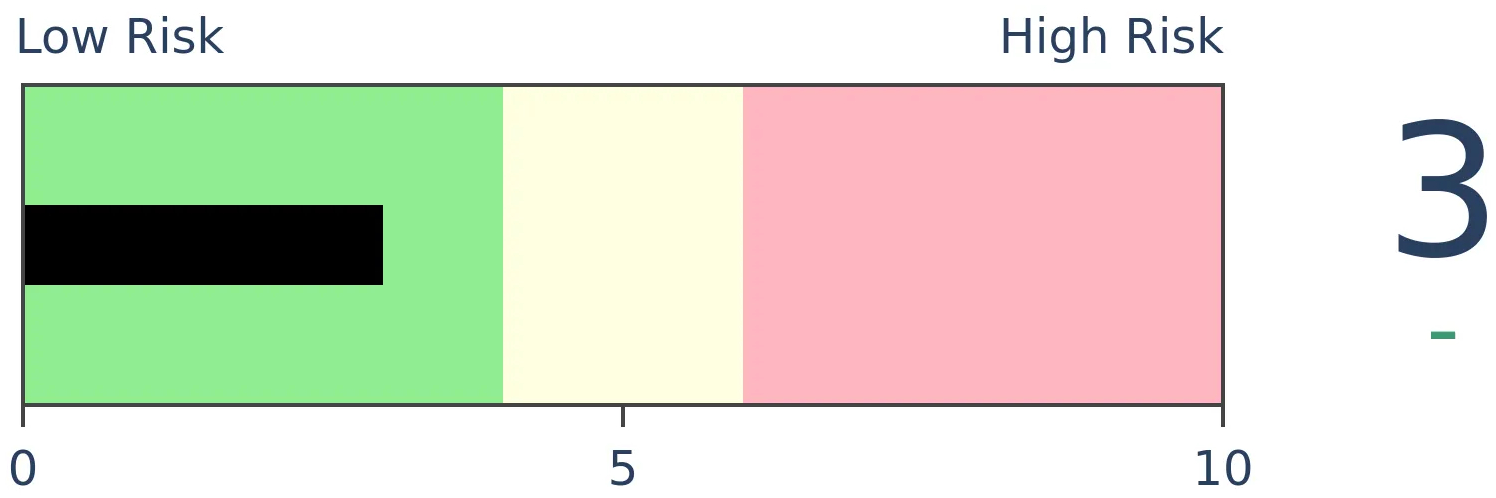
Crude Oil
|
|
Gold
|
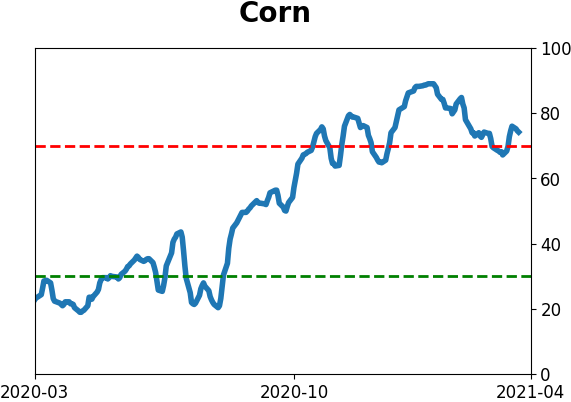
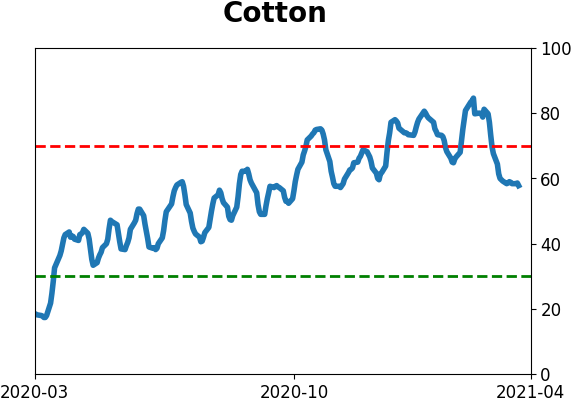
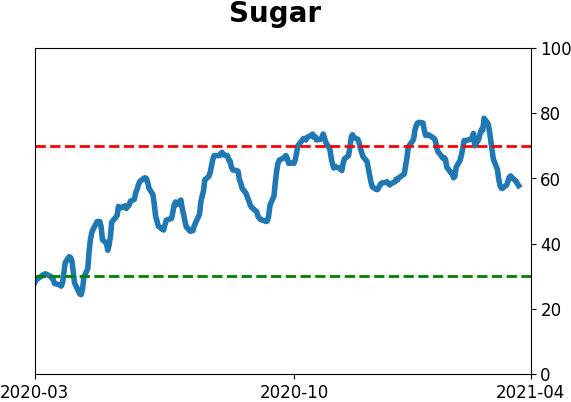
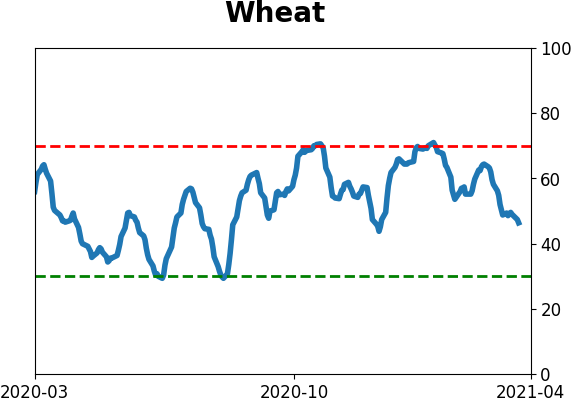
Agriculture
|
|
Research
BOTTOM LINE
There has been a record amount of initial public offerings, almost solely due to the rise of SPACs. As a percentage of total U.S. market capitalization, we've now passed the peaks in 2000 and 2007, but remain below the higher levels in the 1980s and 1990s.
FORECAST / TIMEFRAME
None
|
One of the most visible and discussed aspects of the current welcoming environment for investors is the plethora of new offerings. Whatever form they take, whether blank-check companies or traditional investment bank-led, we've never seen the market absorb so much in new shares.
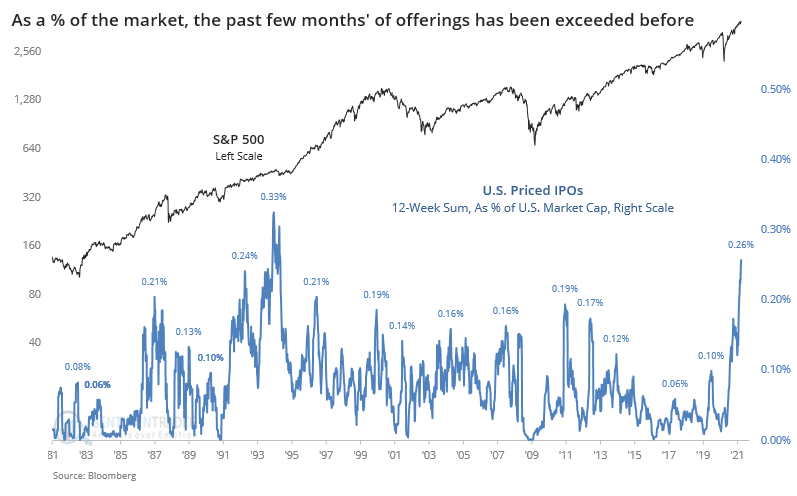
According to Bloomberg data, there has now been $114 billion in U.S. initial public offerings that were priced over the past 12 weeks.
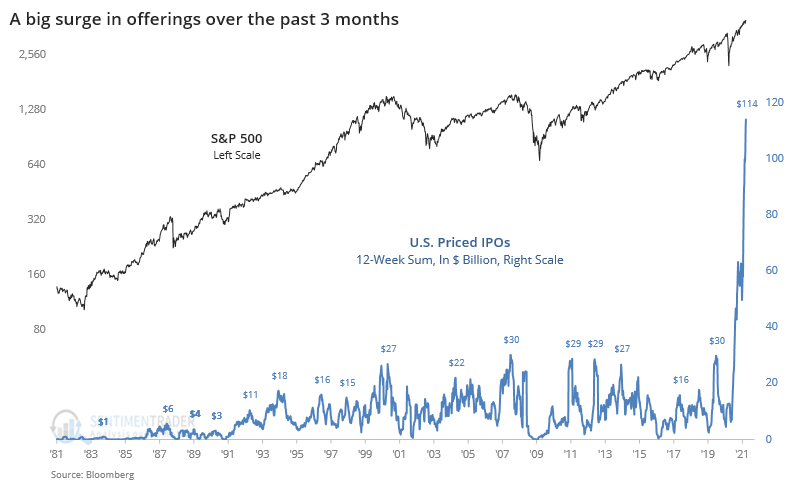
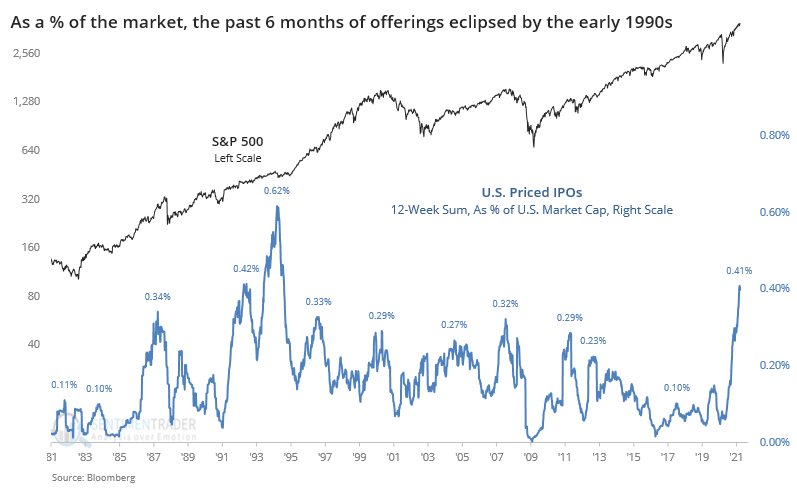
The parabolic nature of the chart looks just as egregious over a 6-month time frame.
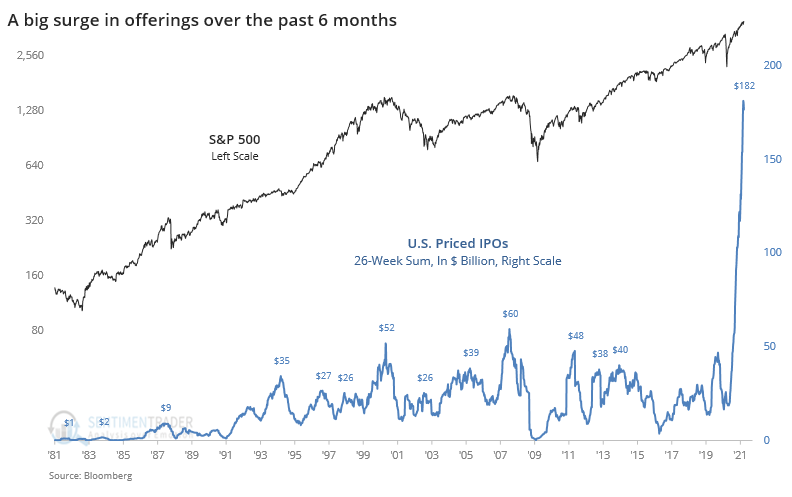
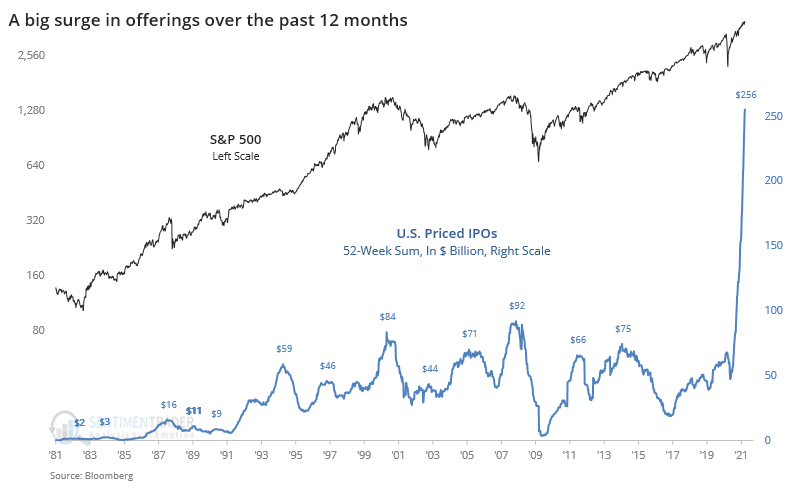
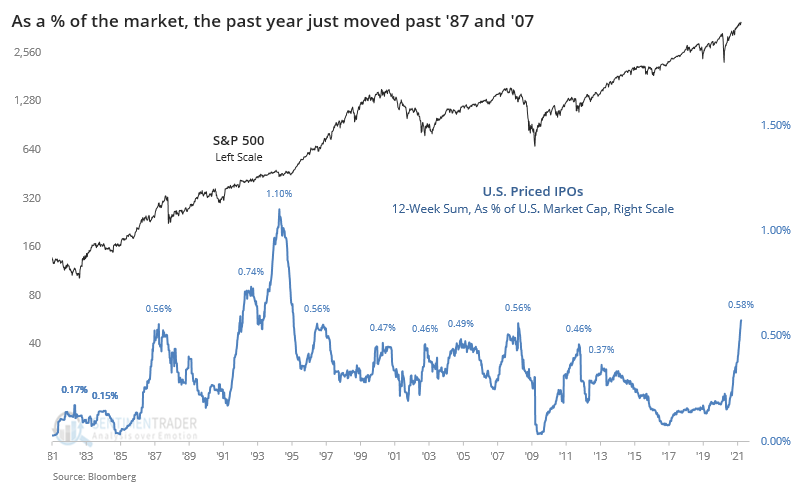
And over the past year with $256 billion in offerings compared to a previous high of $92 billion in 2007 and $84 billion in 2000.
As we've discussed before, though, those are all distorted due to the larger size of the market for stocks. When we account for that, the current extreme shows quite a bit of shrinkage. At 0.26% of the entire market capitalization of U.S. stocks, this is the most in more than 25 years, but below the peak in the early 1990s.
It becomes a little more clear when using a 6-month time frame, but with the same general conclusion.
Over the past year, the current surge just eclipsed the extremes from 1987 and 2007 but still remains well below the early 1990s.
There are more salient worries about these offerings, like the average age of a company going public (again, thanks to SPACs) the pop that they've enjoyed when hitting the market, and how many of them are losing money. The sheer number and size of new issues is certainly extreme, but it took quite a while before that mattered to the market in the mid-80s and early 90s.
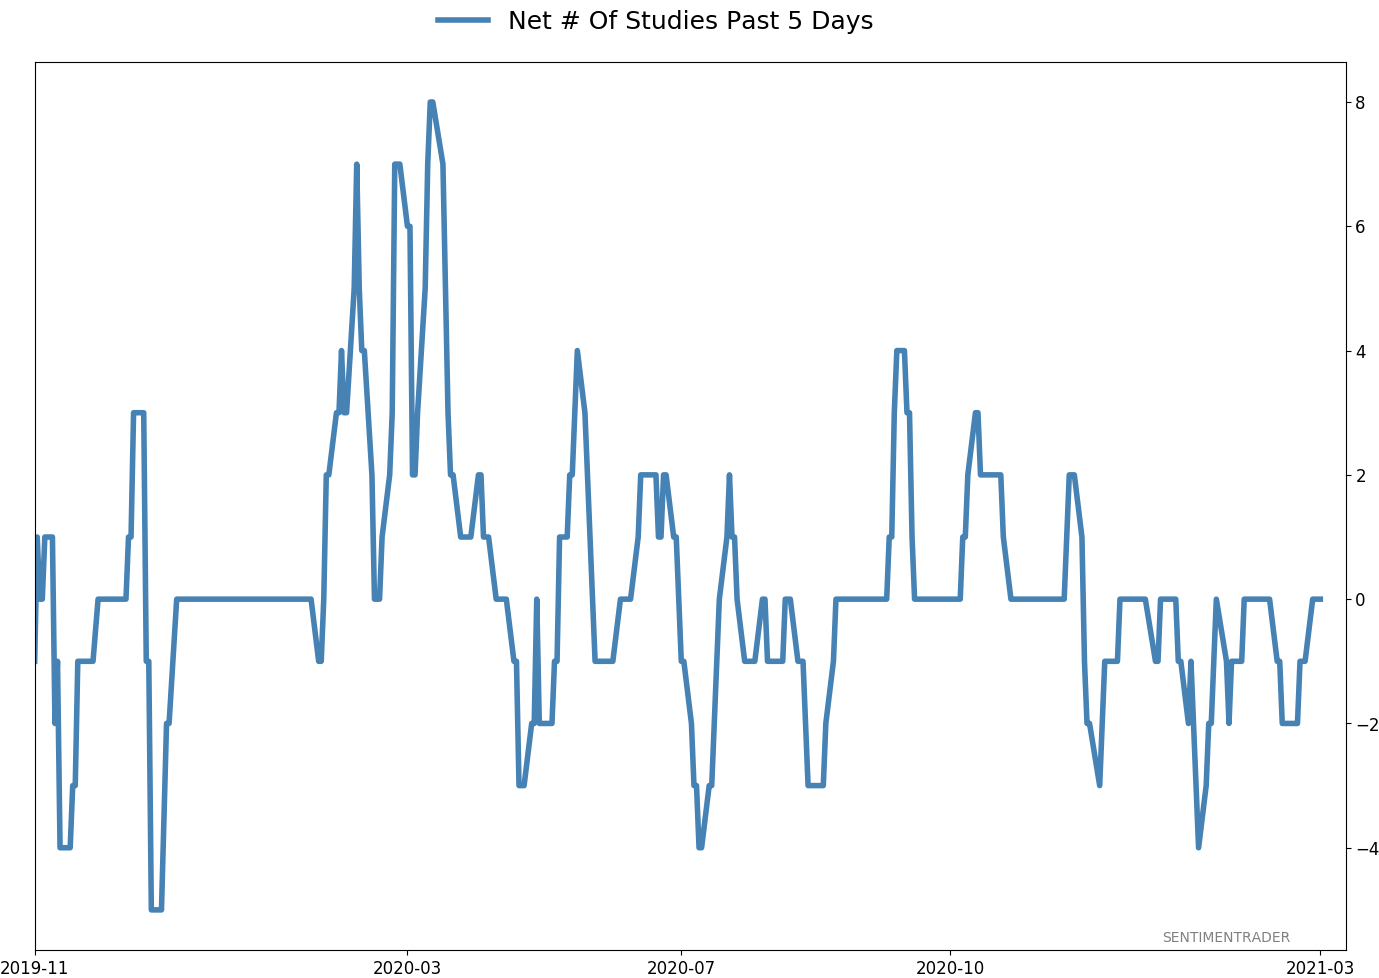
Active Studies
| Time Frame | Bullish | Bearish | | Short-Term | 0 | 0 | | Medium-Term | 2 | 10 | | Long-Term | 16 | 4 |
|
Indicators at Extremes
Portfolio
| Position | Description | Weight % | Added / Reduced | Date | | Stocks | RSP | 4.9 | Reduced 4% | 2021-02-09 | | Bonds | 30.0% BND, 8.8% SCHP | 38.8 | Added 15.1% | 2021-02-18 | | Commodities | GCC | 2.3 | Reduced 2.1%
| 2020-09-04 | | Precious Metals | GDX | 9.0 | Added 0.1% | 2021-02-18 | | Special Situations | 7.3% XLE, 4.8% PSCE | 12.1 | Reduced 5.6% | 2021-02-18 | | Cash | | 32.8 | | |
|
Updates (Changes made today are underlined)
With a market that has seen the kinds of broad participation and big breath thrusts like we did in the fall, it's hard to become too negative. Those kinds of conditions have consistently preceded higher returns over the next 6-12 months. It's the interim that's more of an issue. Even conditions like that haven't prevented some shorter-term pullbacks. And when we combine an environment where speculation is rampant and recent days have seen an increase in cracks under the surface of the indexes, it's enough to become more defensive over a short- to medium-term time frame. We still don't have much confirmation from the price action in the indexes, so those who are more conservative would likely wait before increasing cash levels. I've decreased risk exposure a bit more, mainly in terms of energy stocks and the ANGL fund, while adding more to the broader bond market. RETURN YTD: 5.6% 2020: 8.1%, 2019: 12.6%, 2018: 0.6%, 2017: 3.8%, 2016: 17.1%, 2015: 9.2%, 2014: 14.5%, 2013: 2.2%, 2012: 10.8%, 2011: 16.5%, 2010: 15.3%, 2009: 23.9%, 2008: 16.2%, 2007: 7.8%
|
|
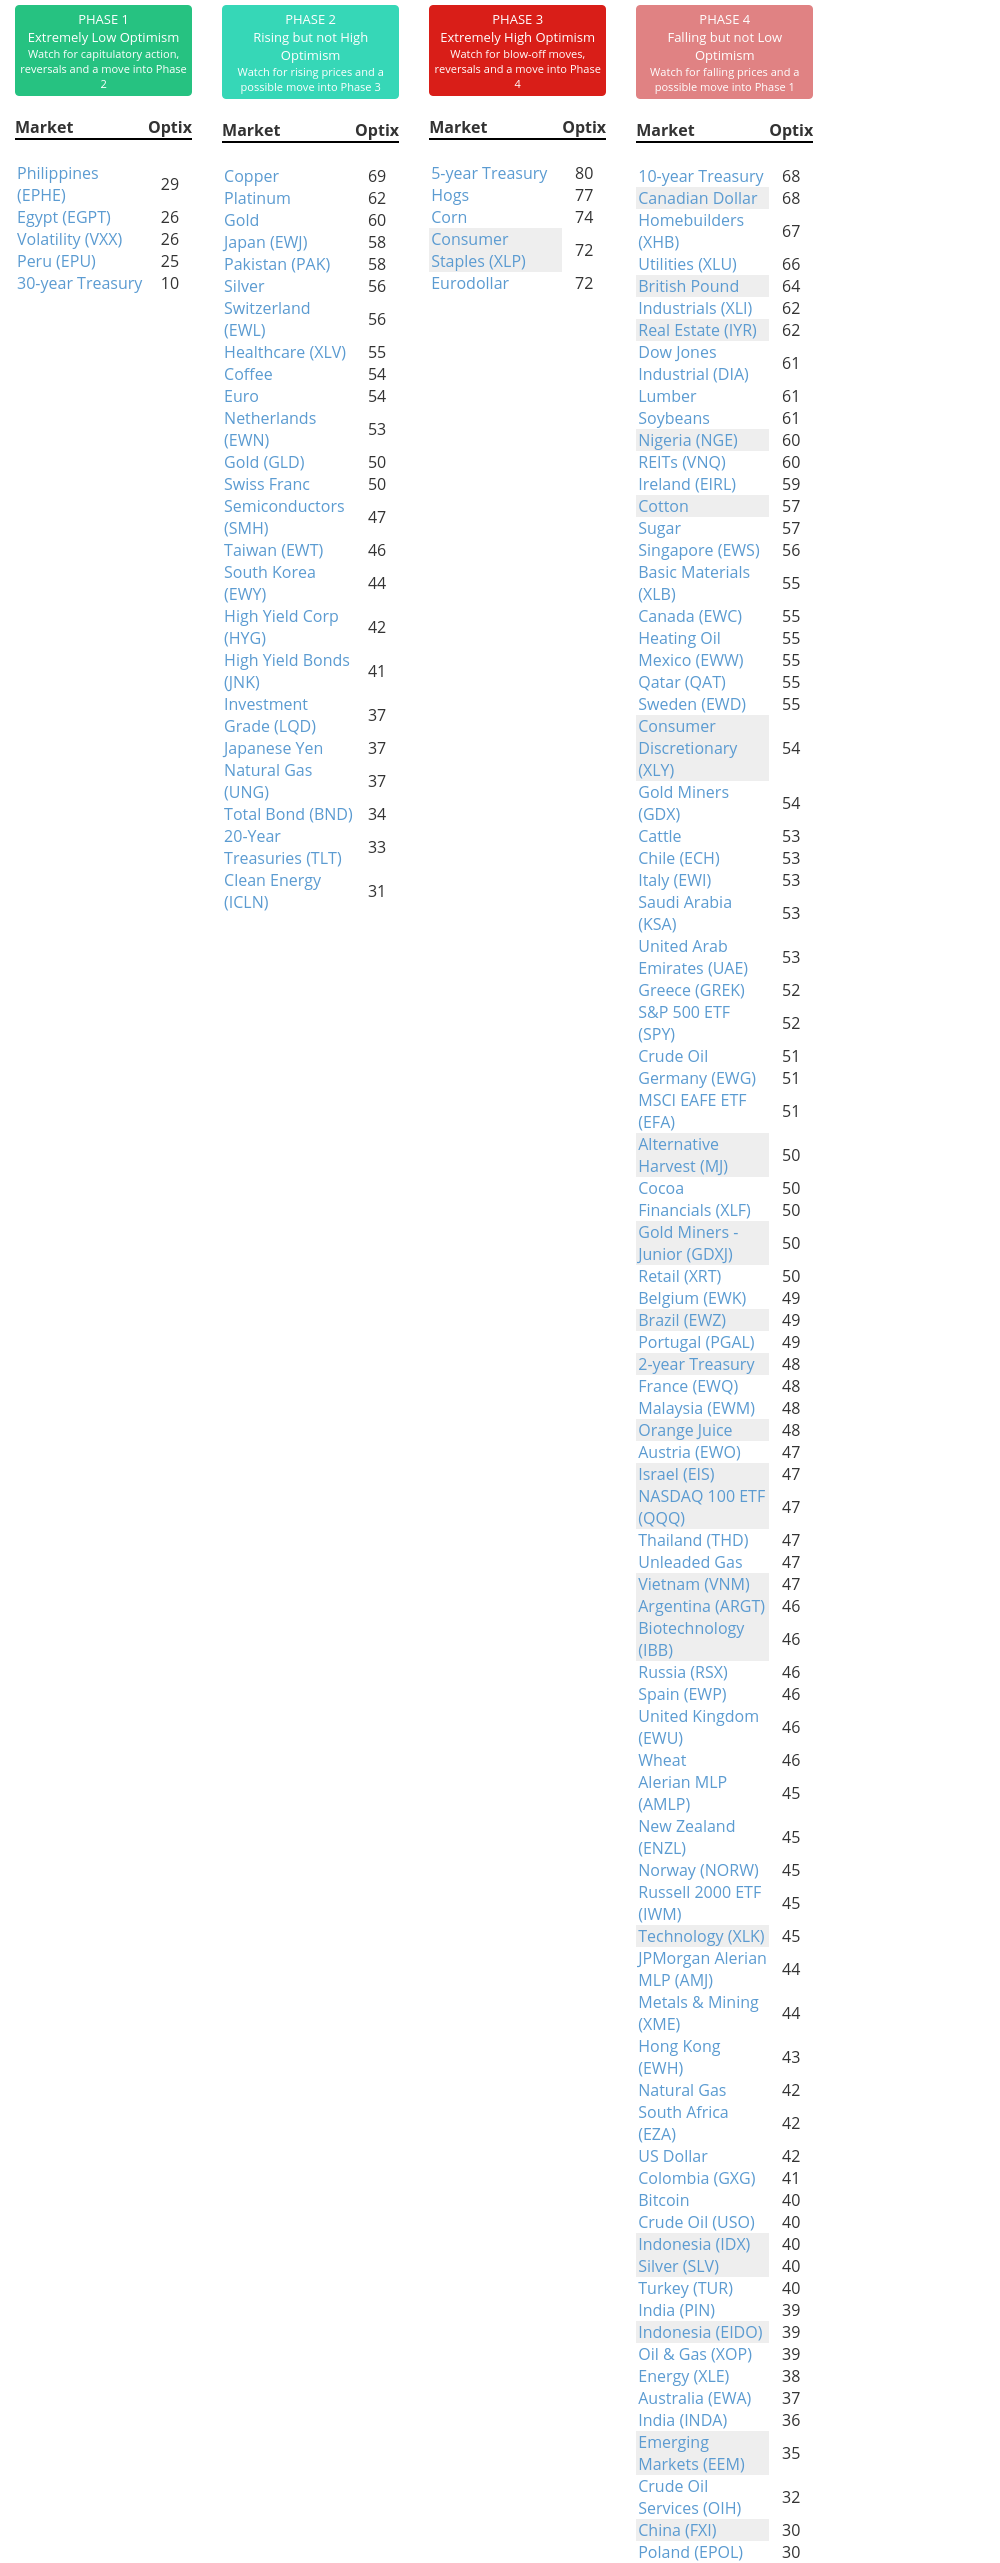
Phase Table
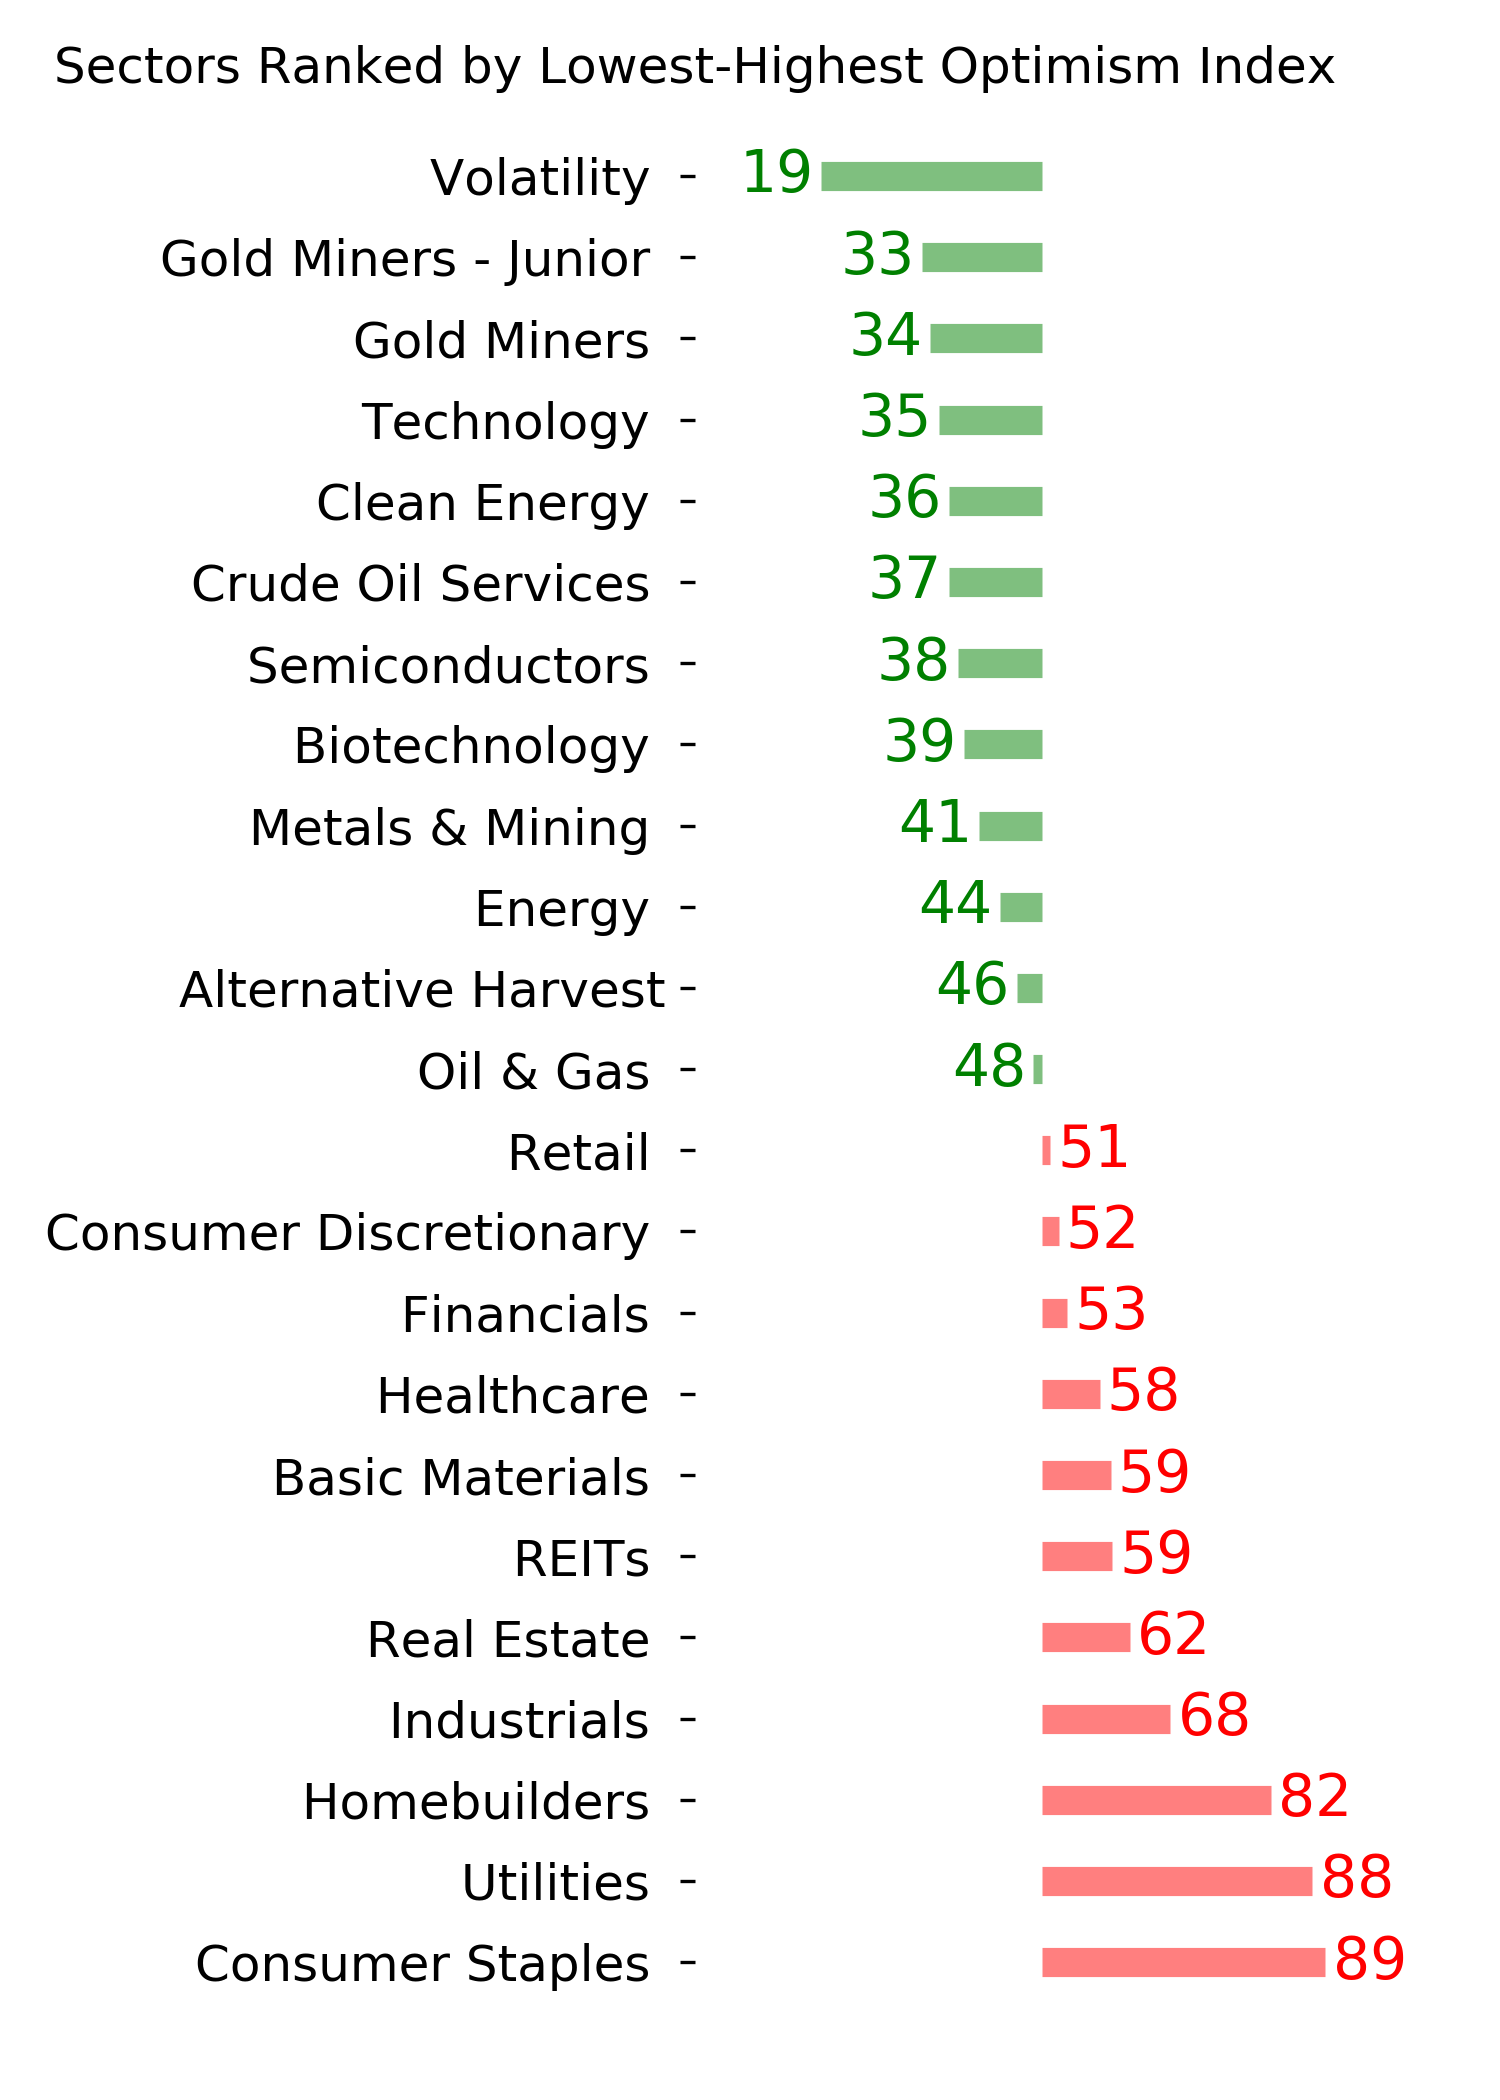
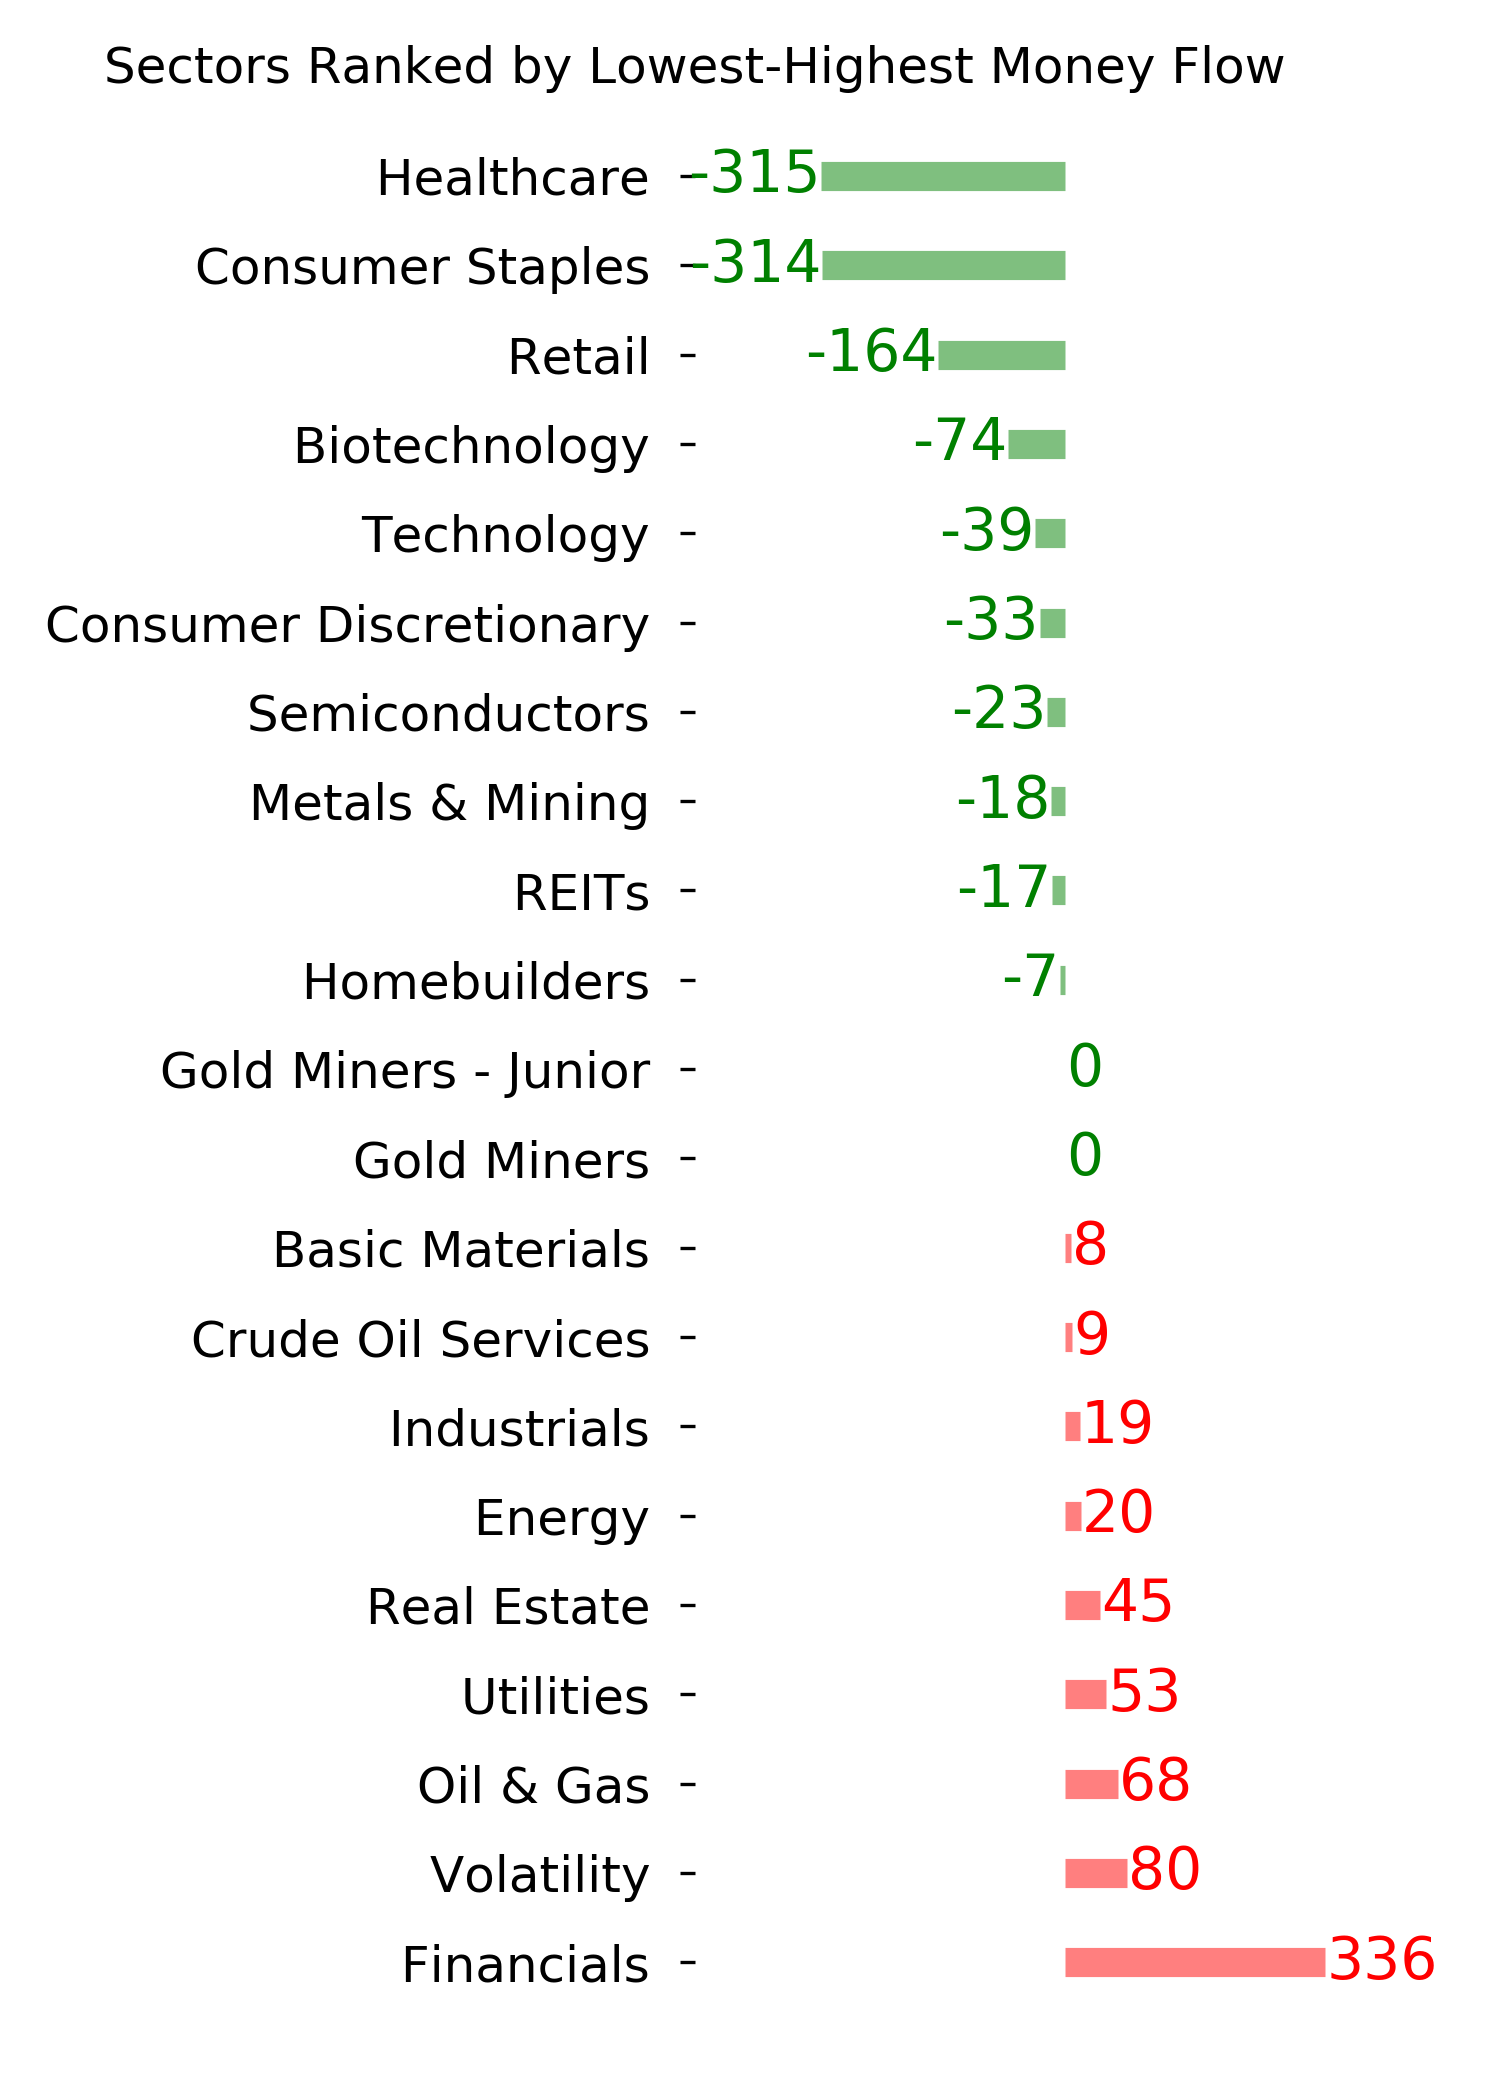
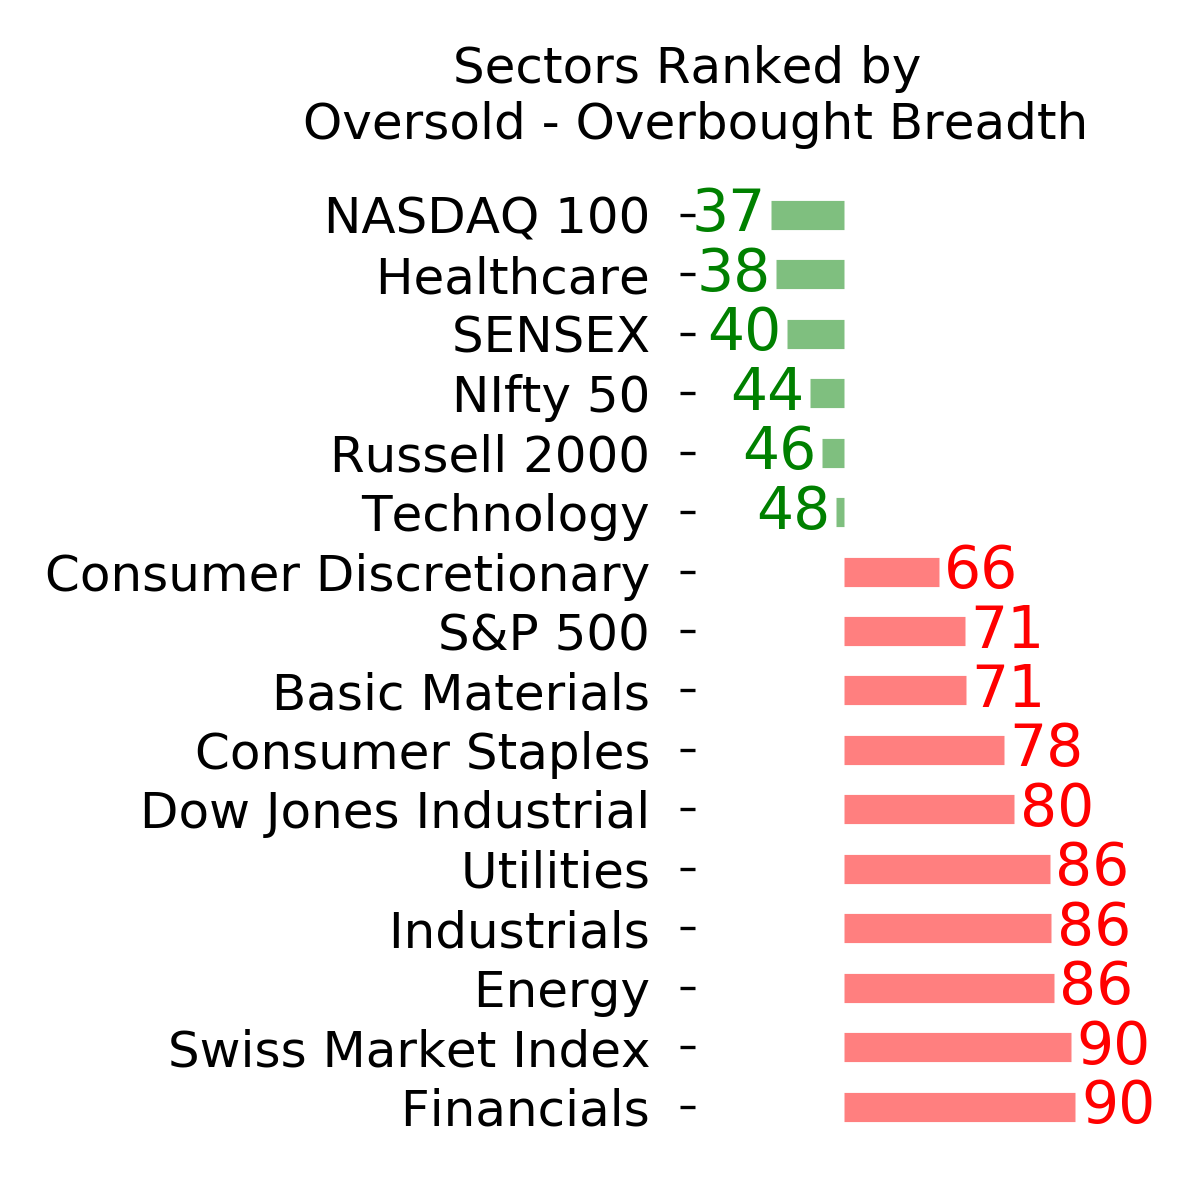
Ranks
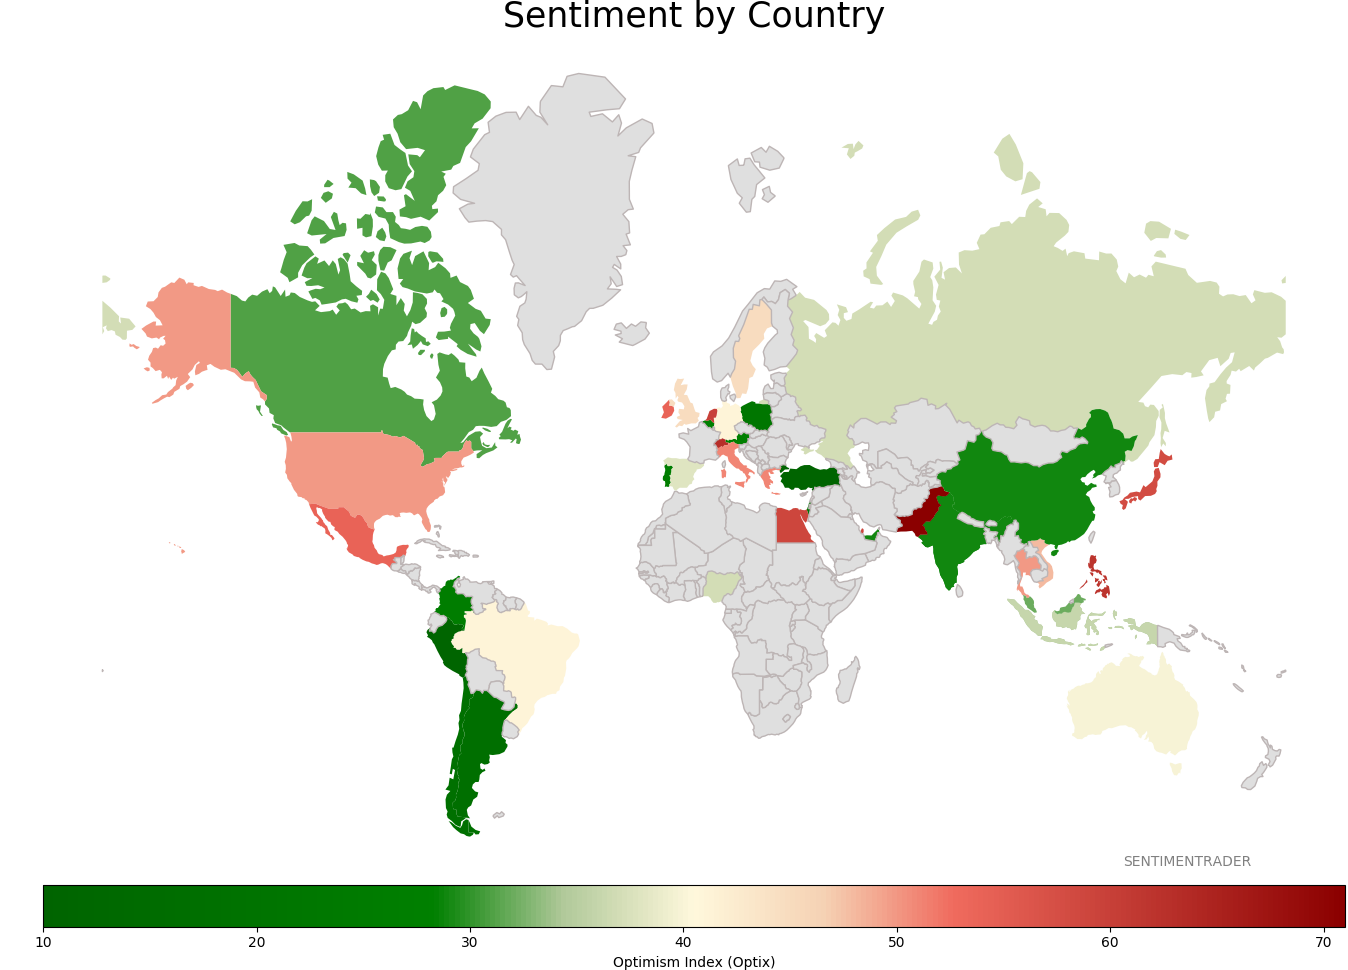
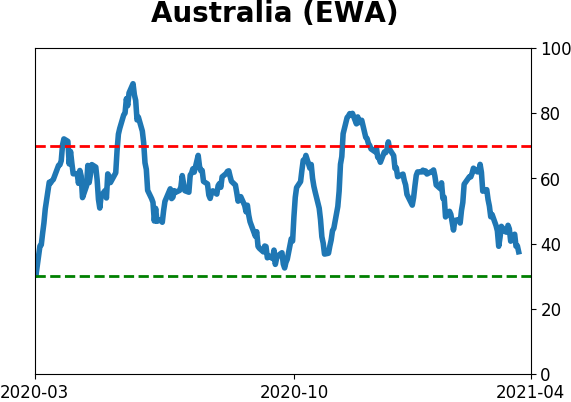
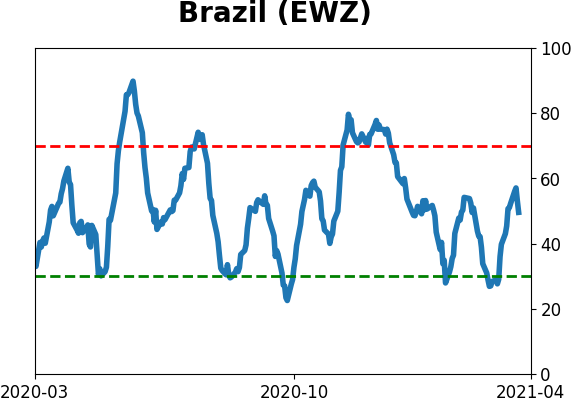
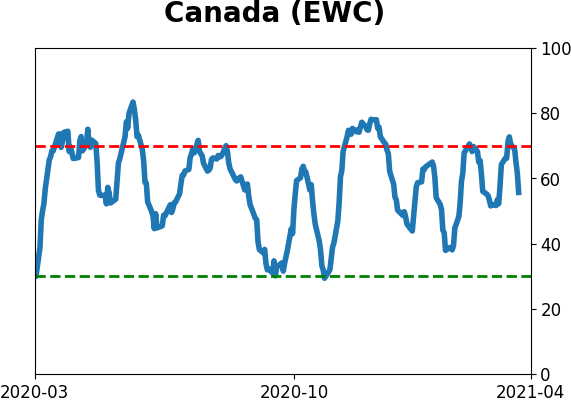
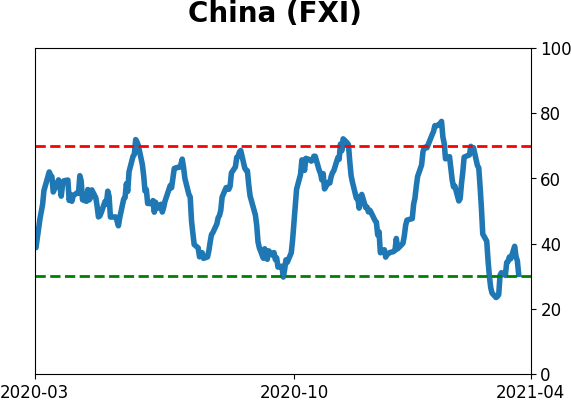
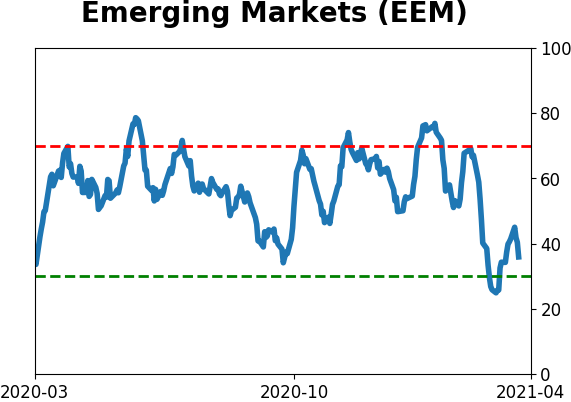
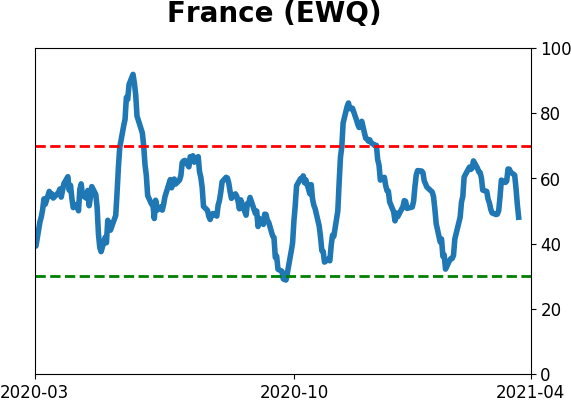
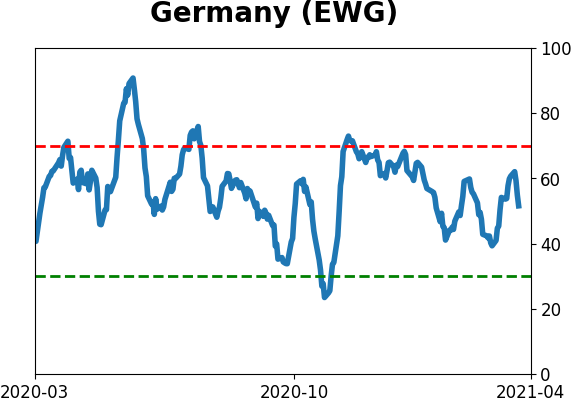
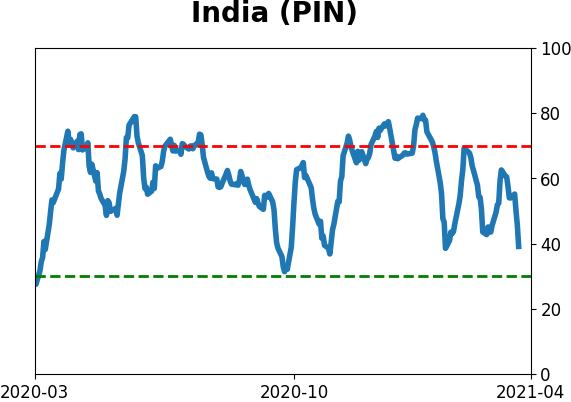
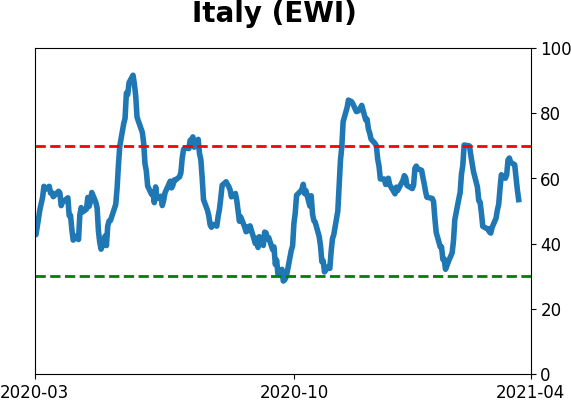
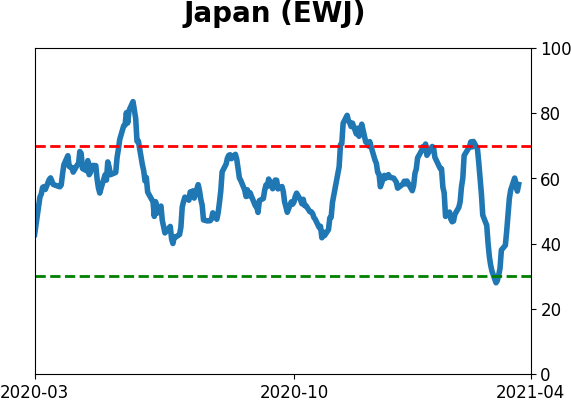
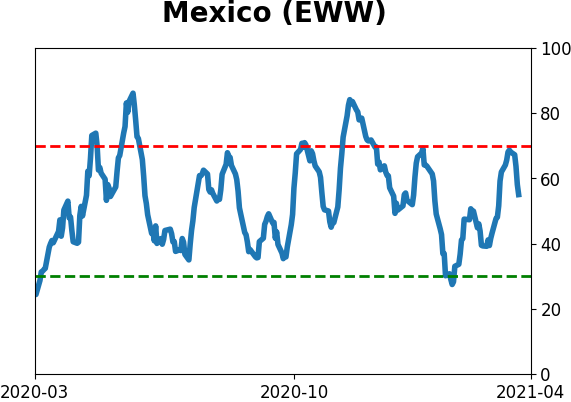
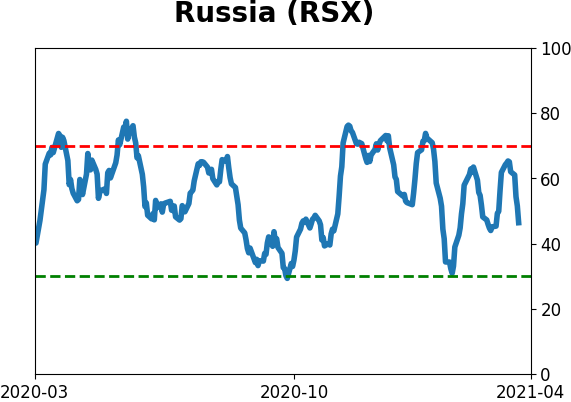
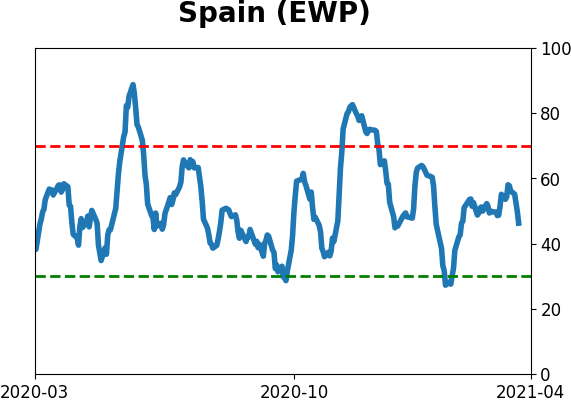
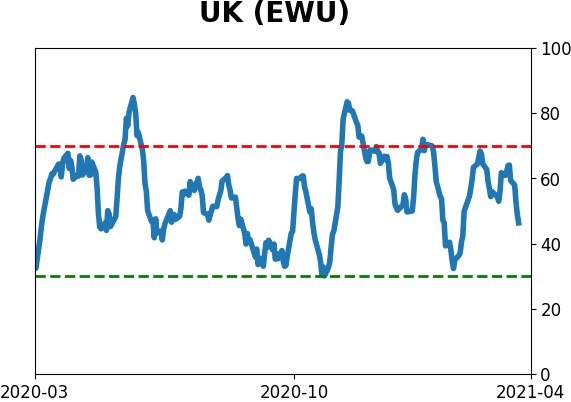
Sentiment Around The World
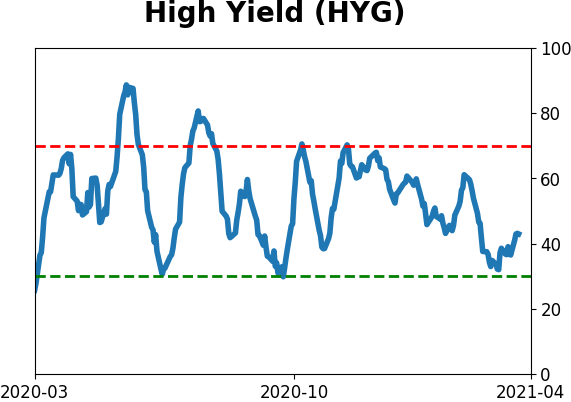
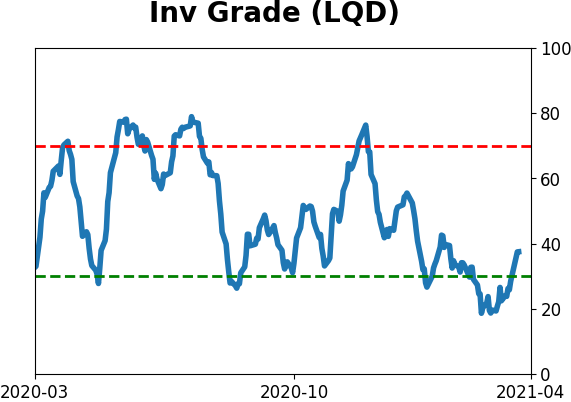
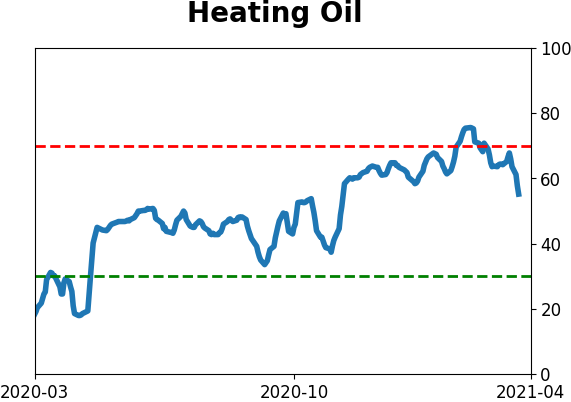
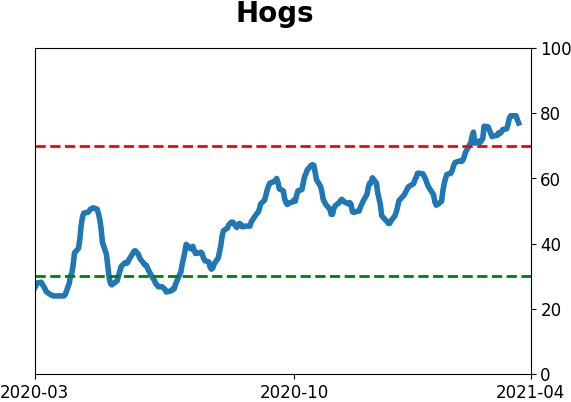
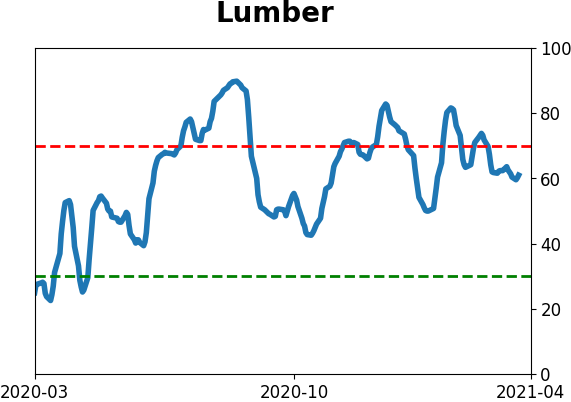
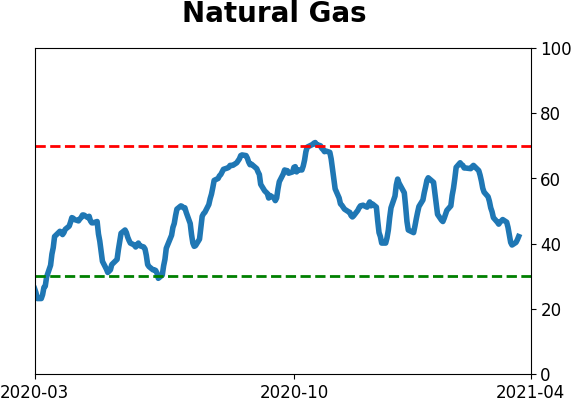
Optimism Index Thumbnails
|
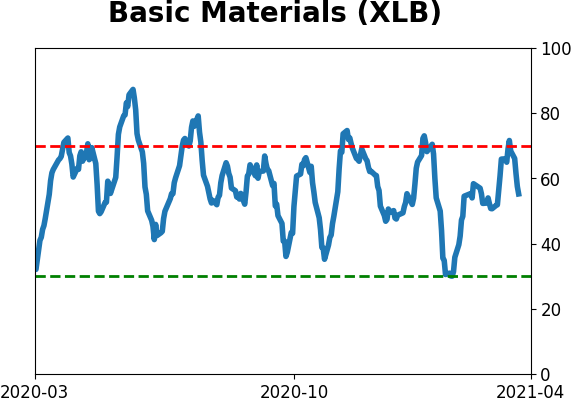
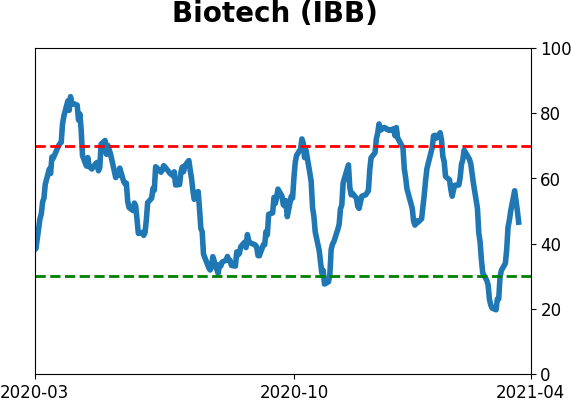
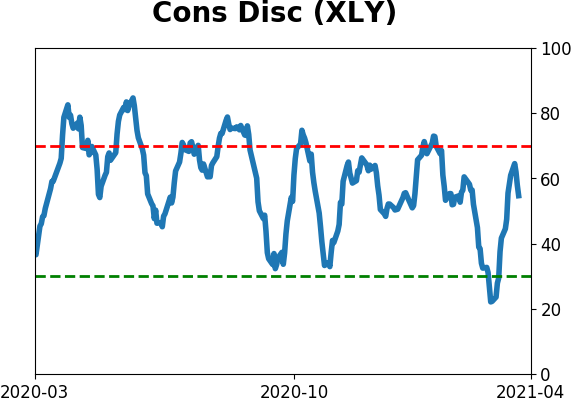
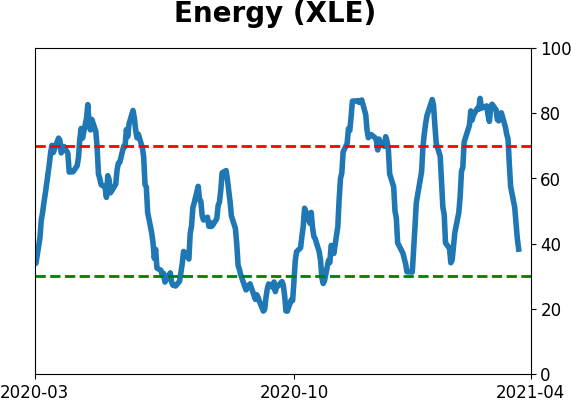
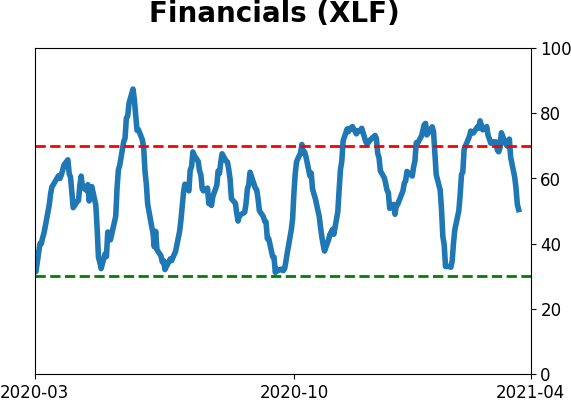
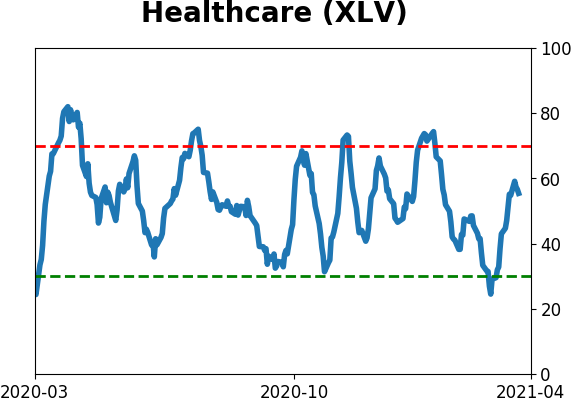
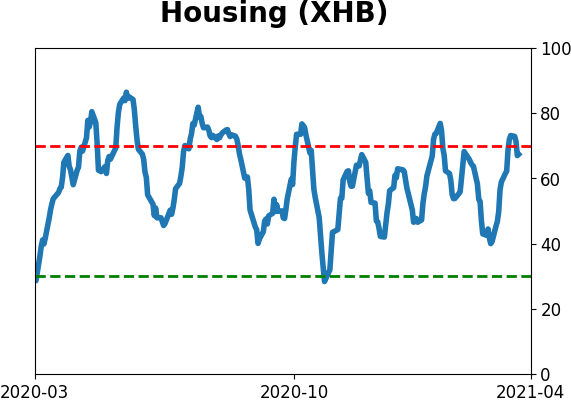
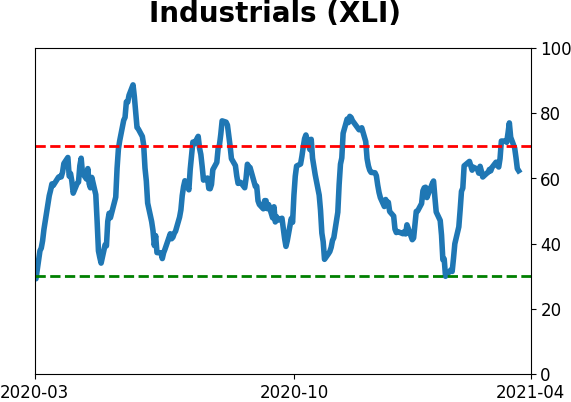
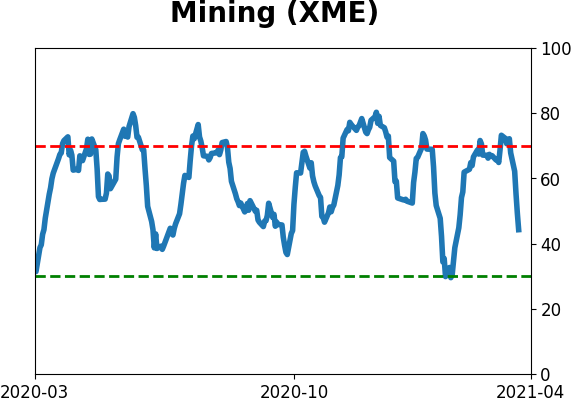
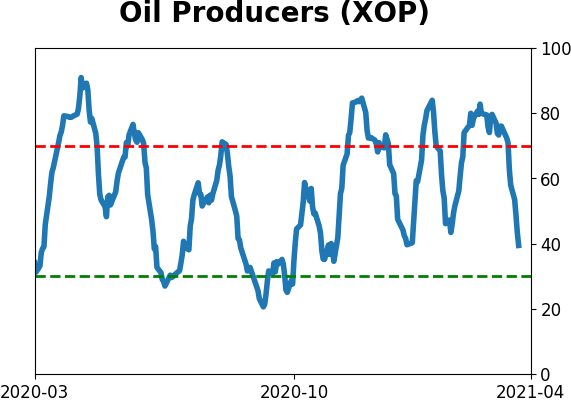
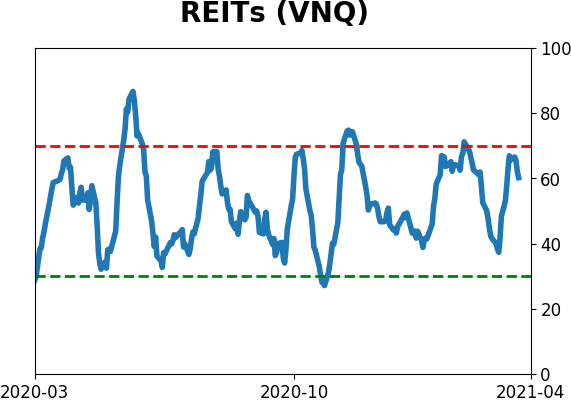
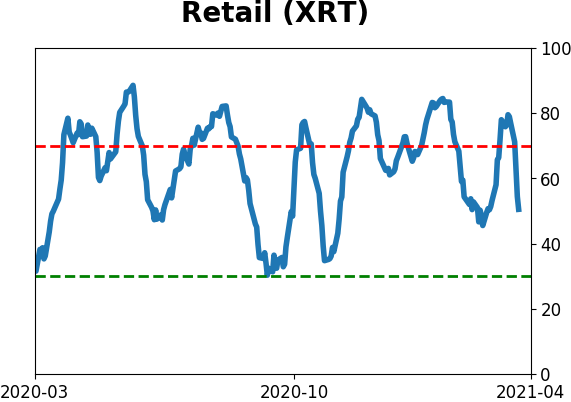
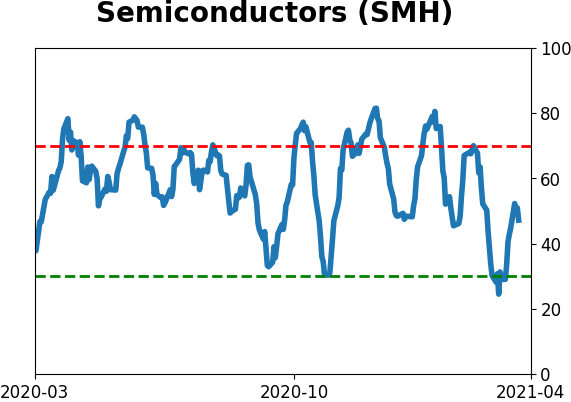
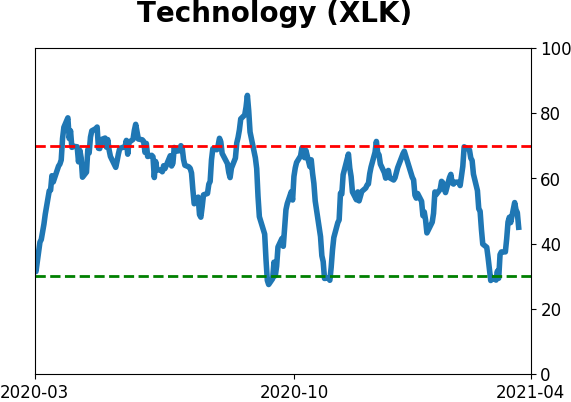
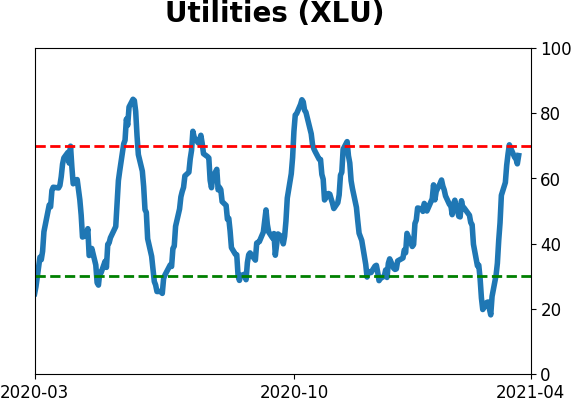
Sector ETF's - 10-Day Moving Average
|
|
|
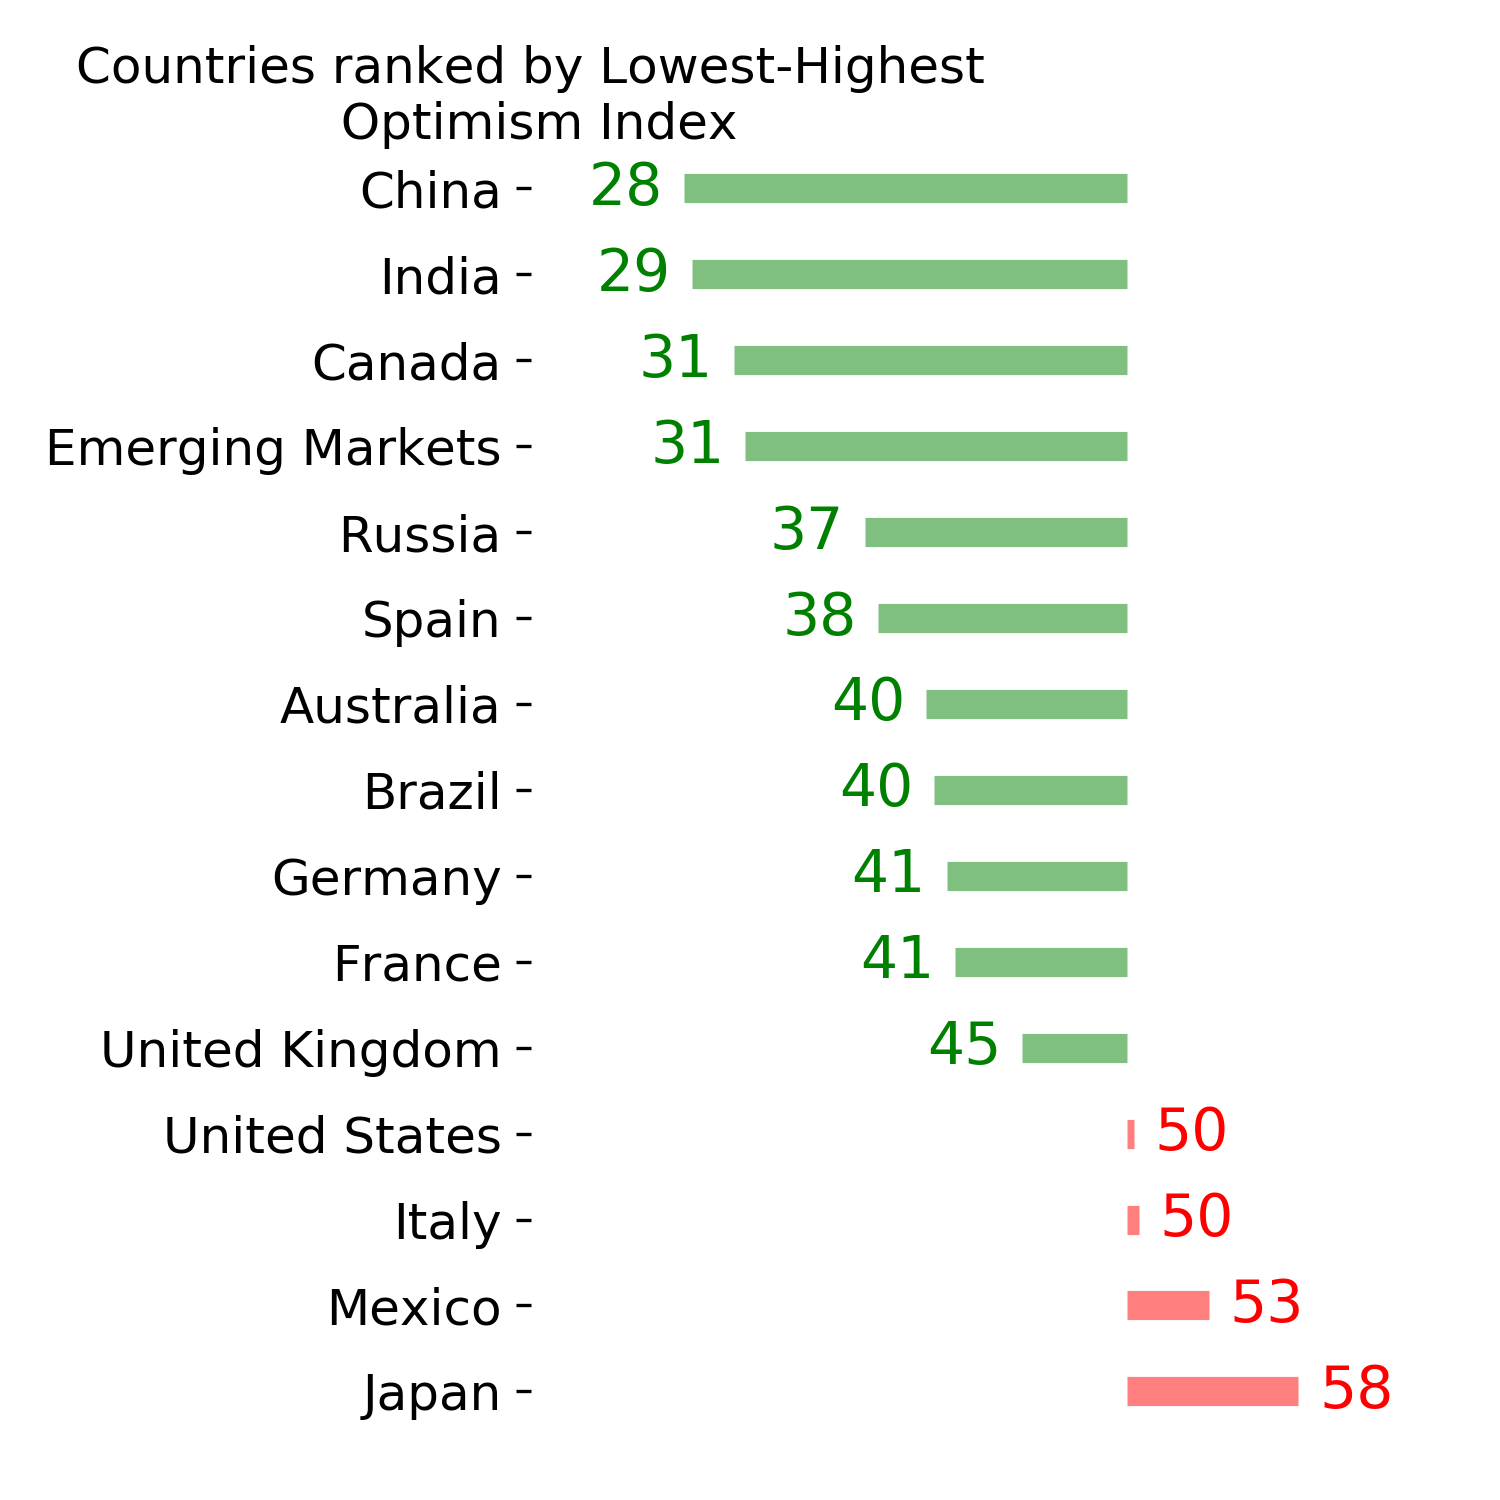
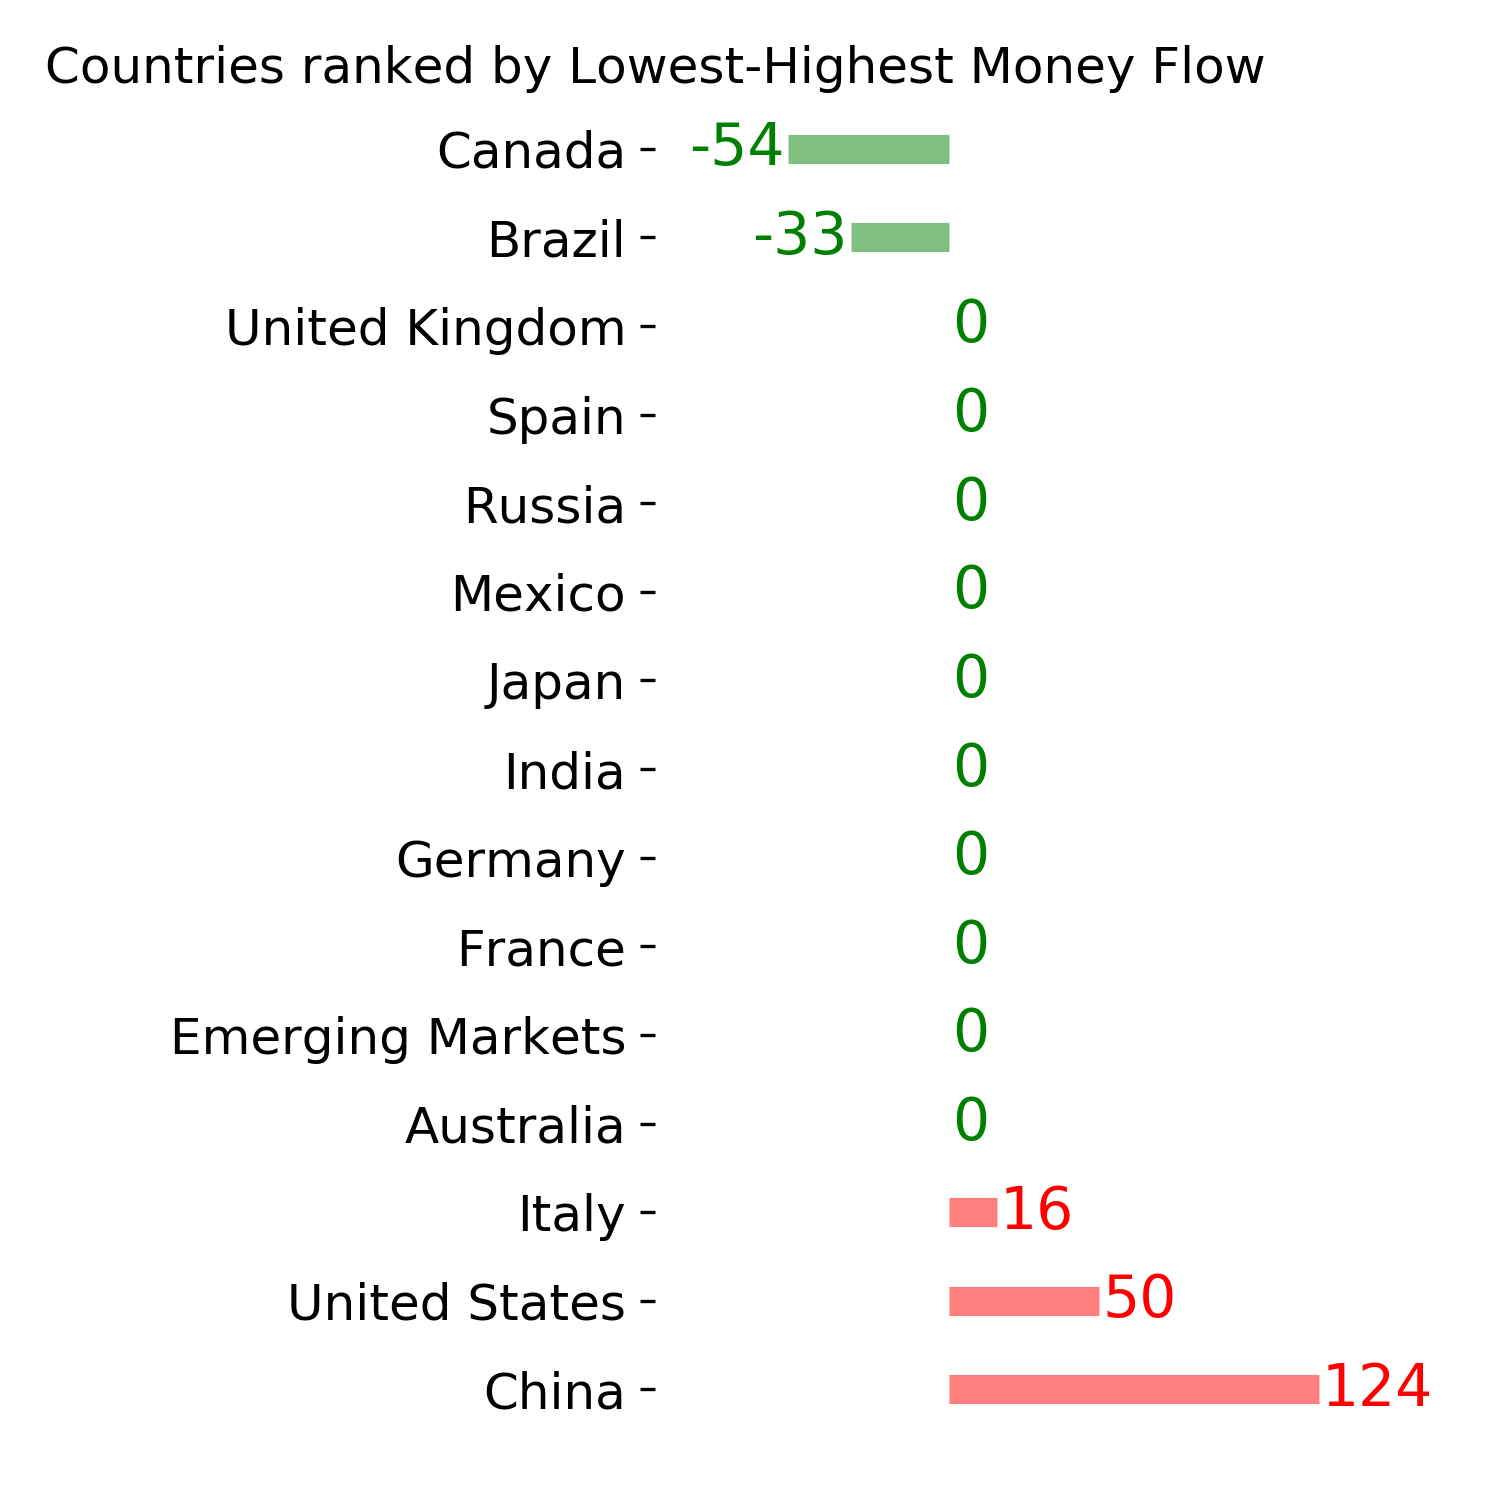
Country ETF's - 10-Day Moving Average
|
|
|
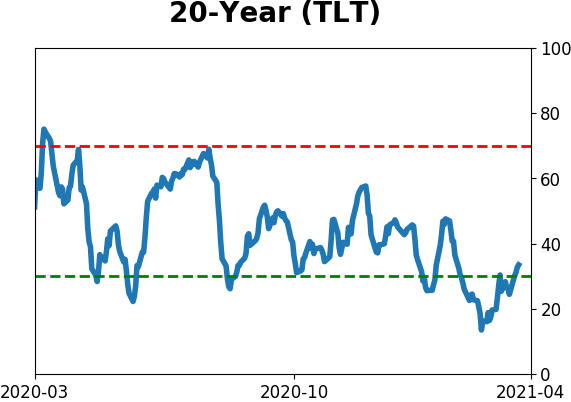
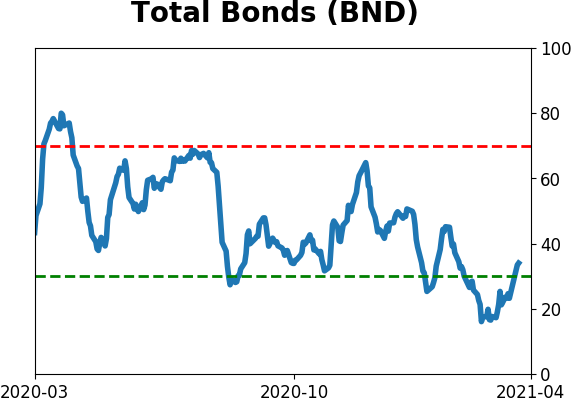
Bond ETF's - 10-Day Moving Average
|
|
|
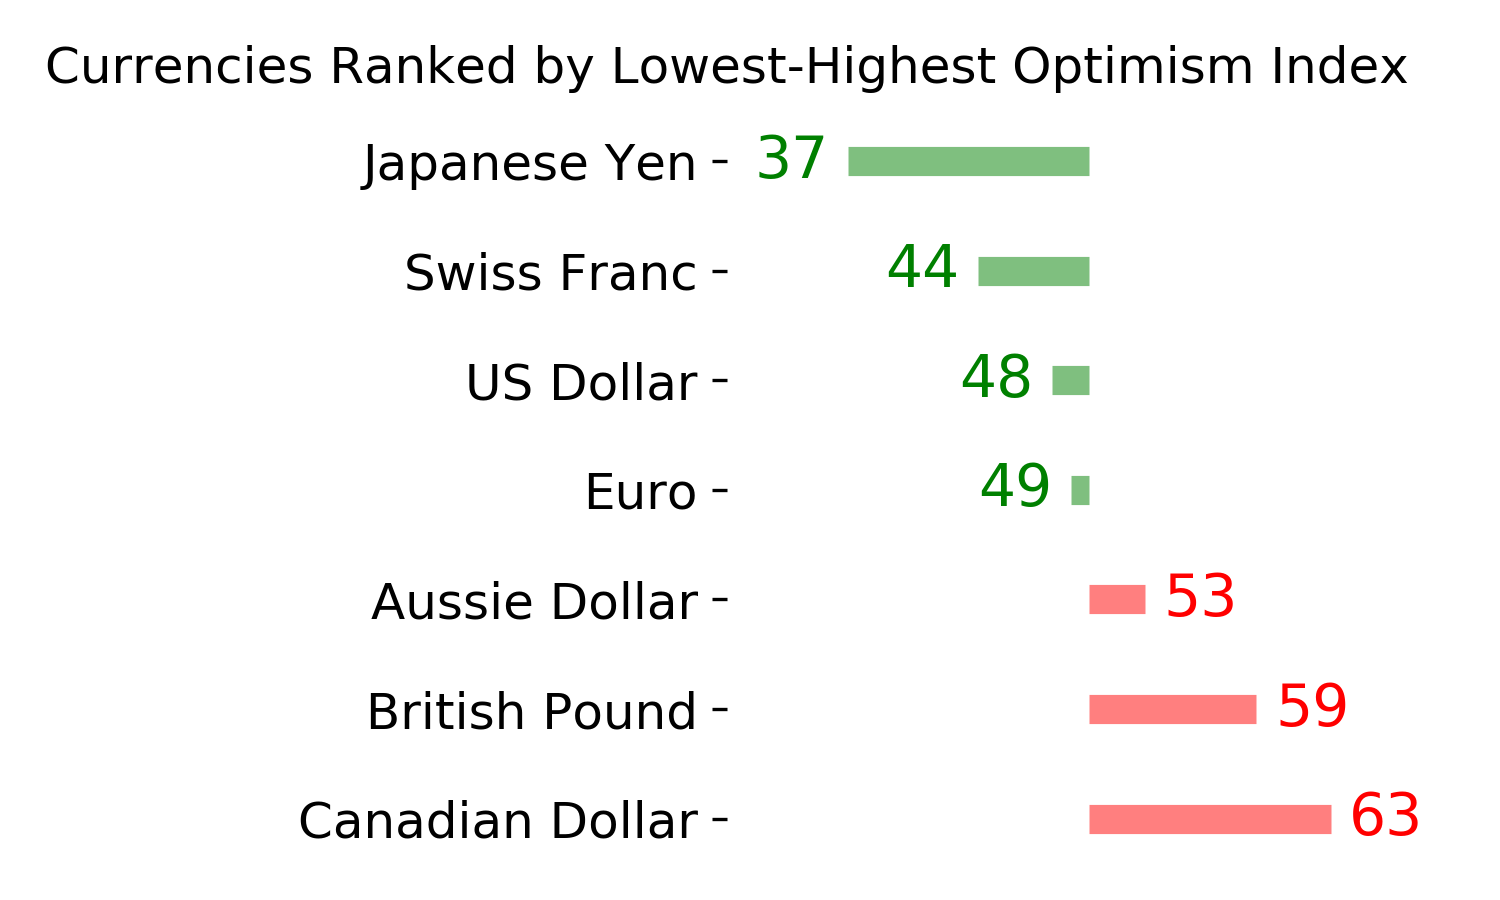
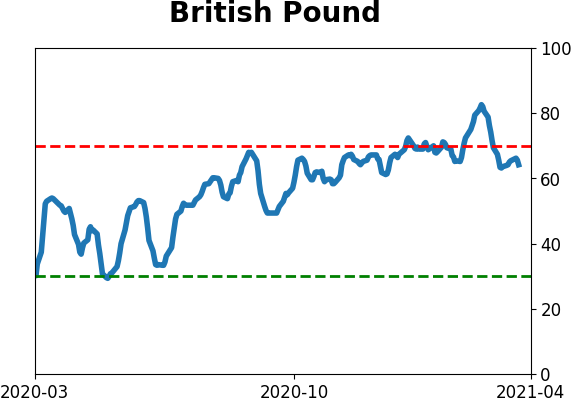
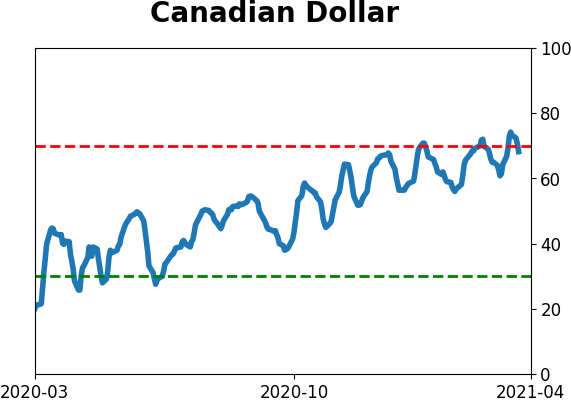
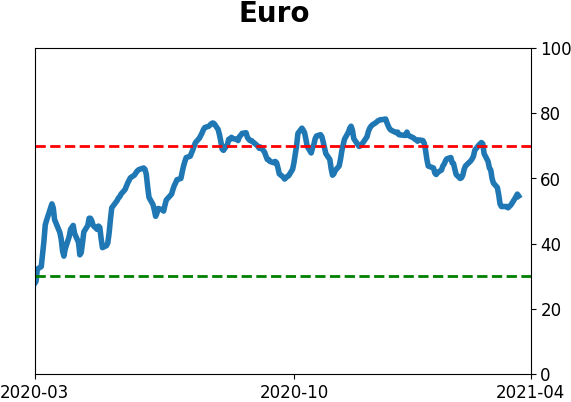
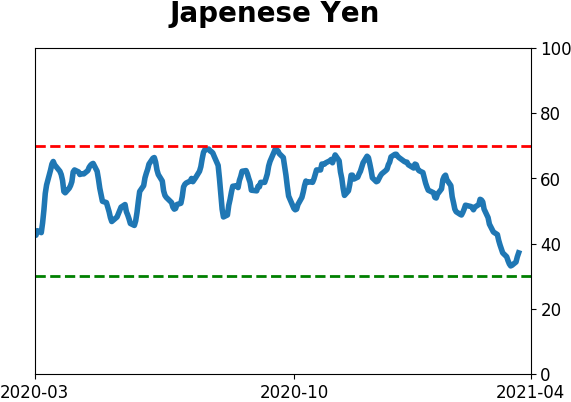
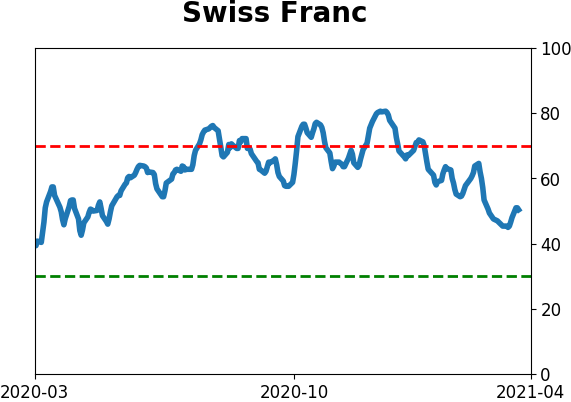
Currency ETF's - 5-Day Moving Average
|
|
|
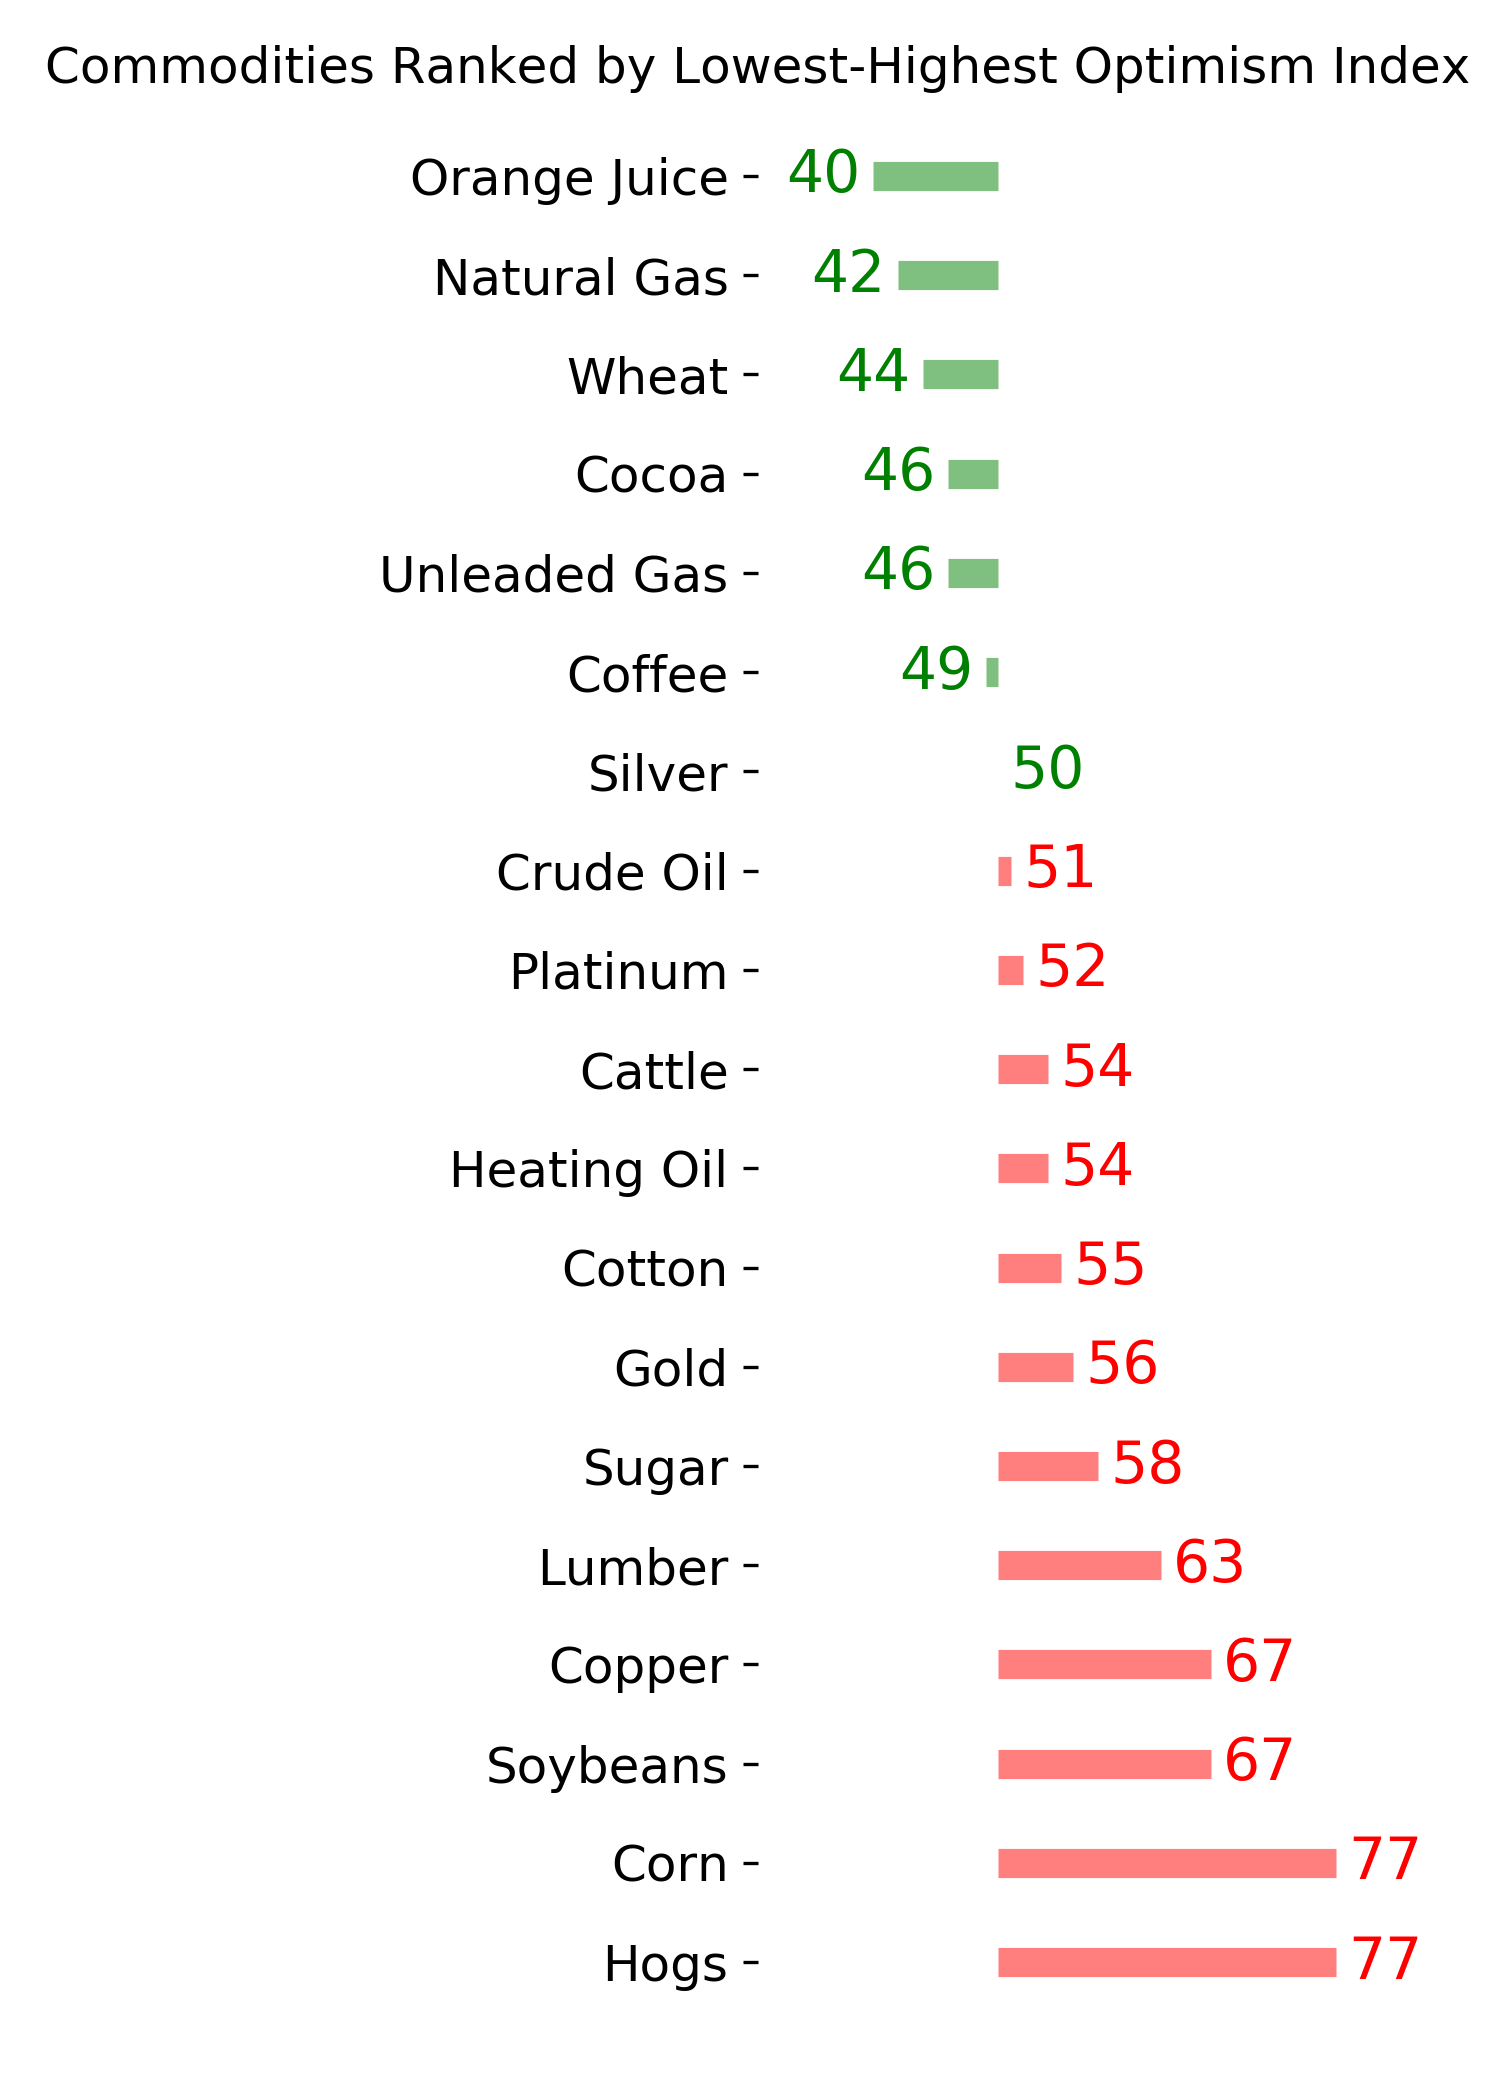
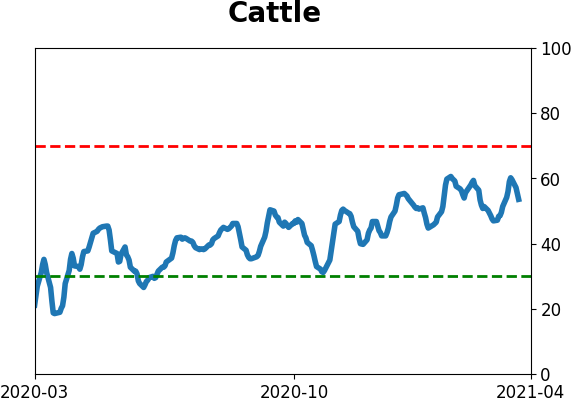
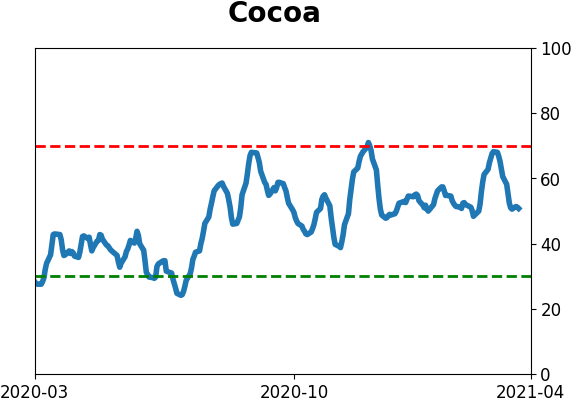
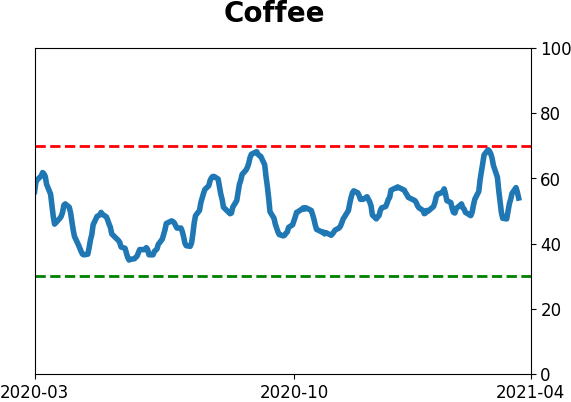
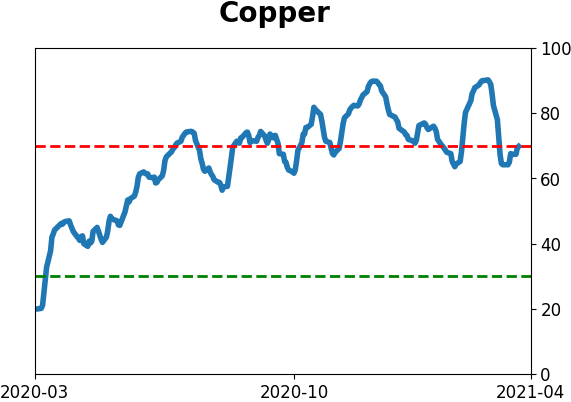
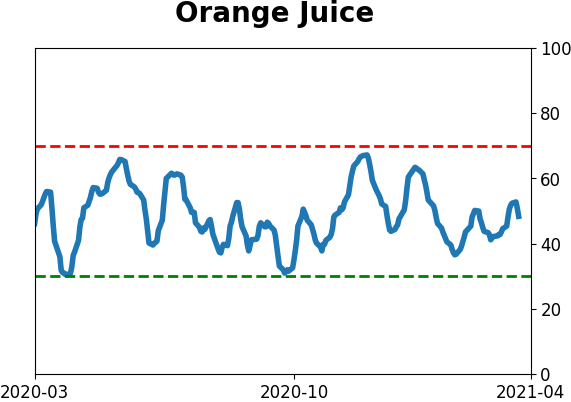
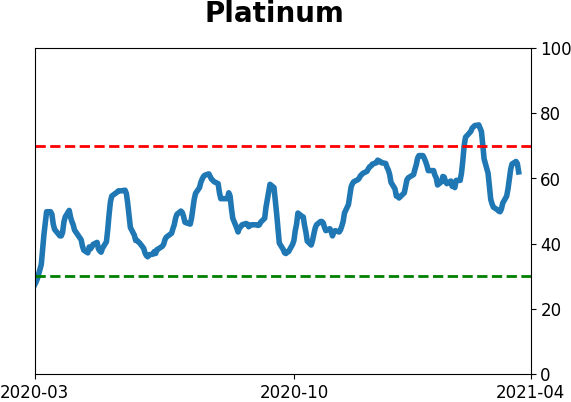
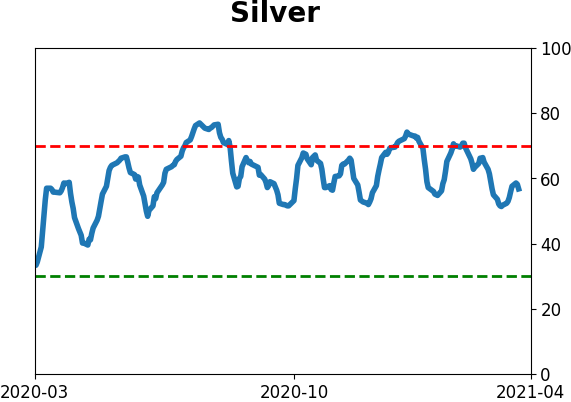
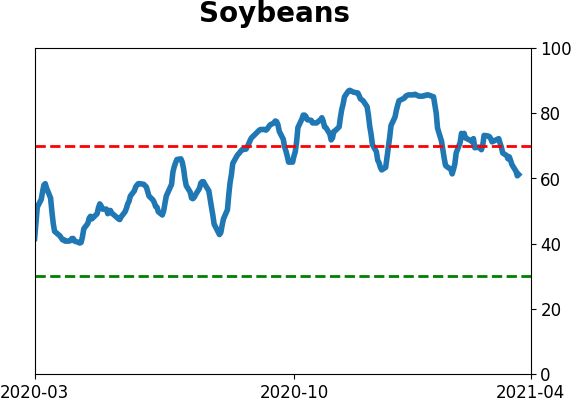
Commodity ETF's - 5-Day Moving Average
|
|