Headlines
|
|
Back to back buying thrust:
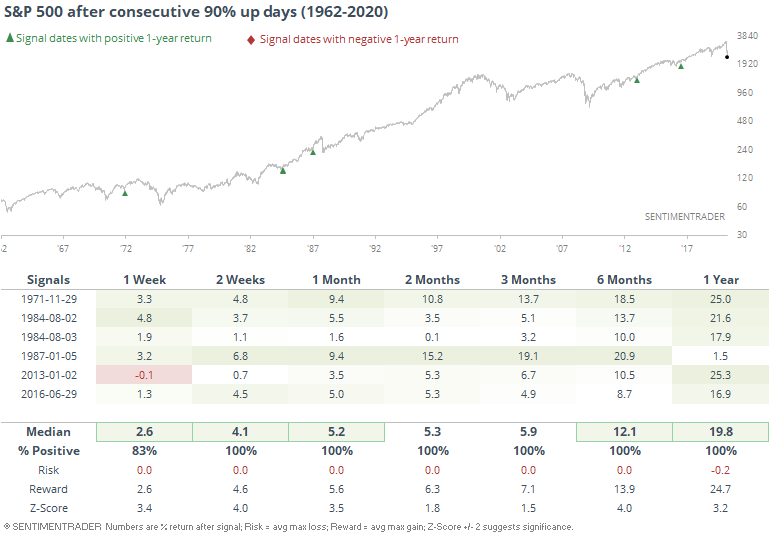
Barring a collapse into the close, we're on track for back-to-back 90% up volume days on the NYSE. When we get consecutive 90% up days - with that being the only condition - gains were remarkable.
HiLo Logic Index suggests the wash out is about done:
In late January, there were a lot of technical warning signs that had been building. Now, we're seeing the opposite. The HLLI for the NYSE and Nasdaq have both dropped to an extremely low level and should start to recover, suggesting that the market is washed out.
Premium Note: Newsletters give up:
Despite the tumult in markets in recent weeks, the I.I. survey hadn't shown much give-up. Now, for the first time in well over a year, the Bull Ratio (Bulls / (Bulls + Bears)) dropped below 50%.
Premium Note: Everything is rallying:
Almost every issue on the NYSE rallied during one of the biggest 1 day rallies in market history.
Premium Note: Will the S&P break this trend?:
While global markets rallied significantly on Tuesday, it's yet to be seen while this trend can be sustained. Thusfar the S&P has been unable to sustain even a 2 day rally.
Premium Note: Long term trend:
The speed of the recent stock market crash was so fast that many traditional long term trend following indicators are only starting to become bearish now.
Premium Note: Valuations: price to book:
P/E ratios around the world are low, but not as low as during prior bear market bottoms. On the other hand, Price/Book ratios are much lower.
|
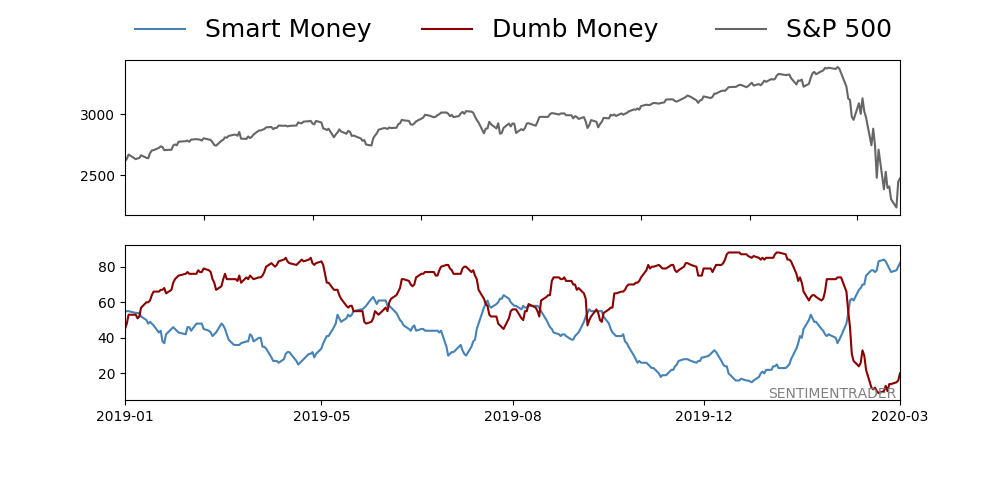
Smart / Dumb Money Confidence
|
Smart Money Confidence: 82.0%
Dumb Money Confidence: 20.0%
|
|
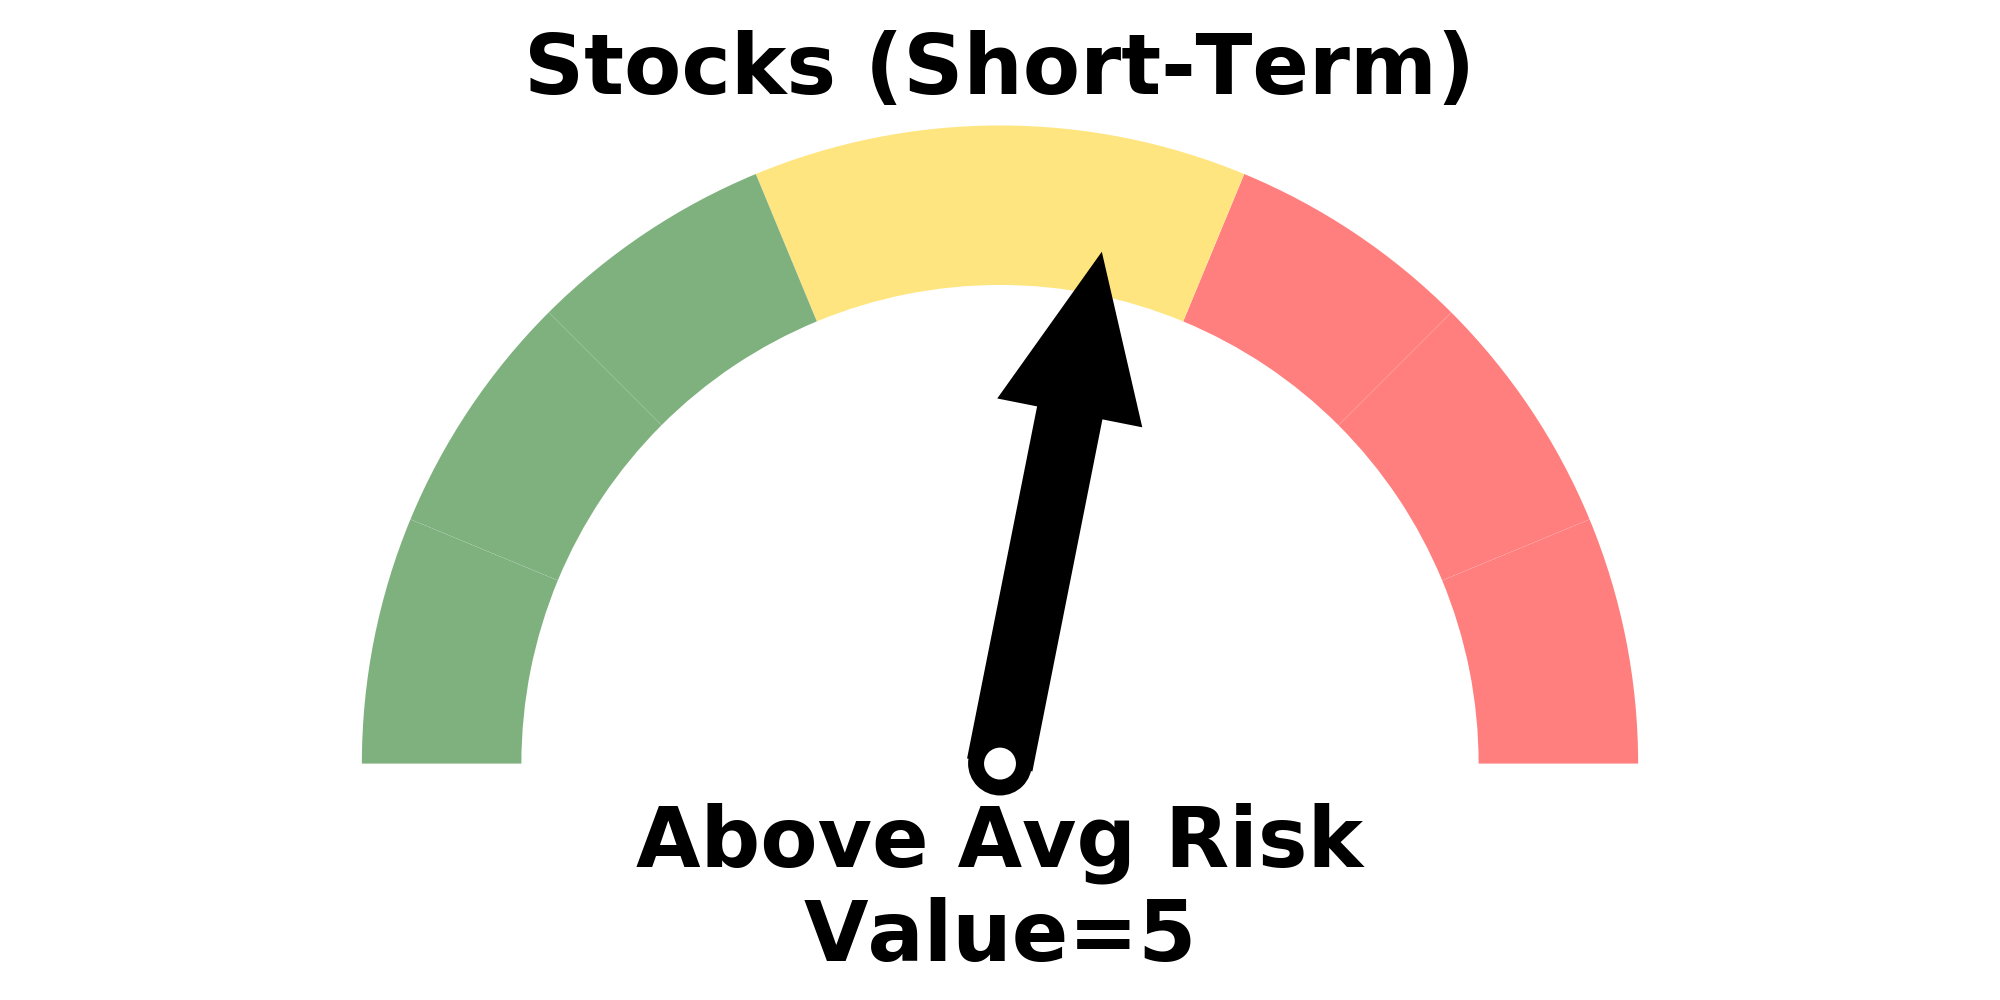
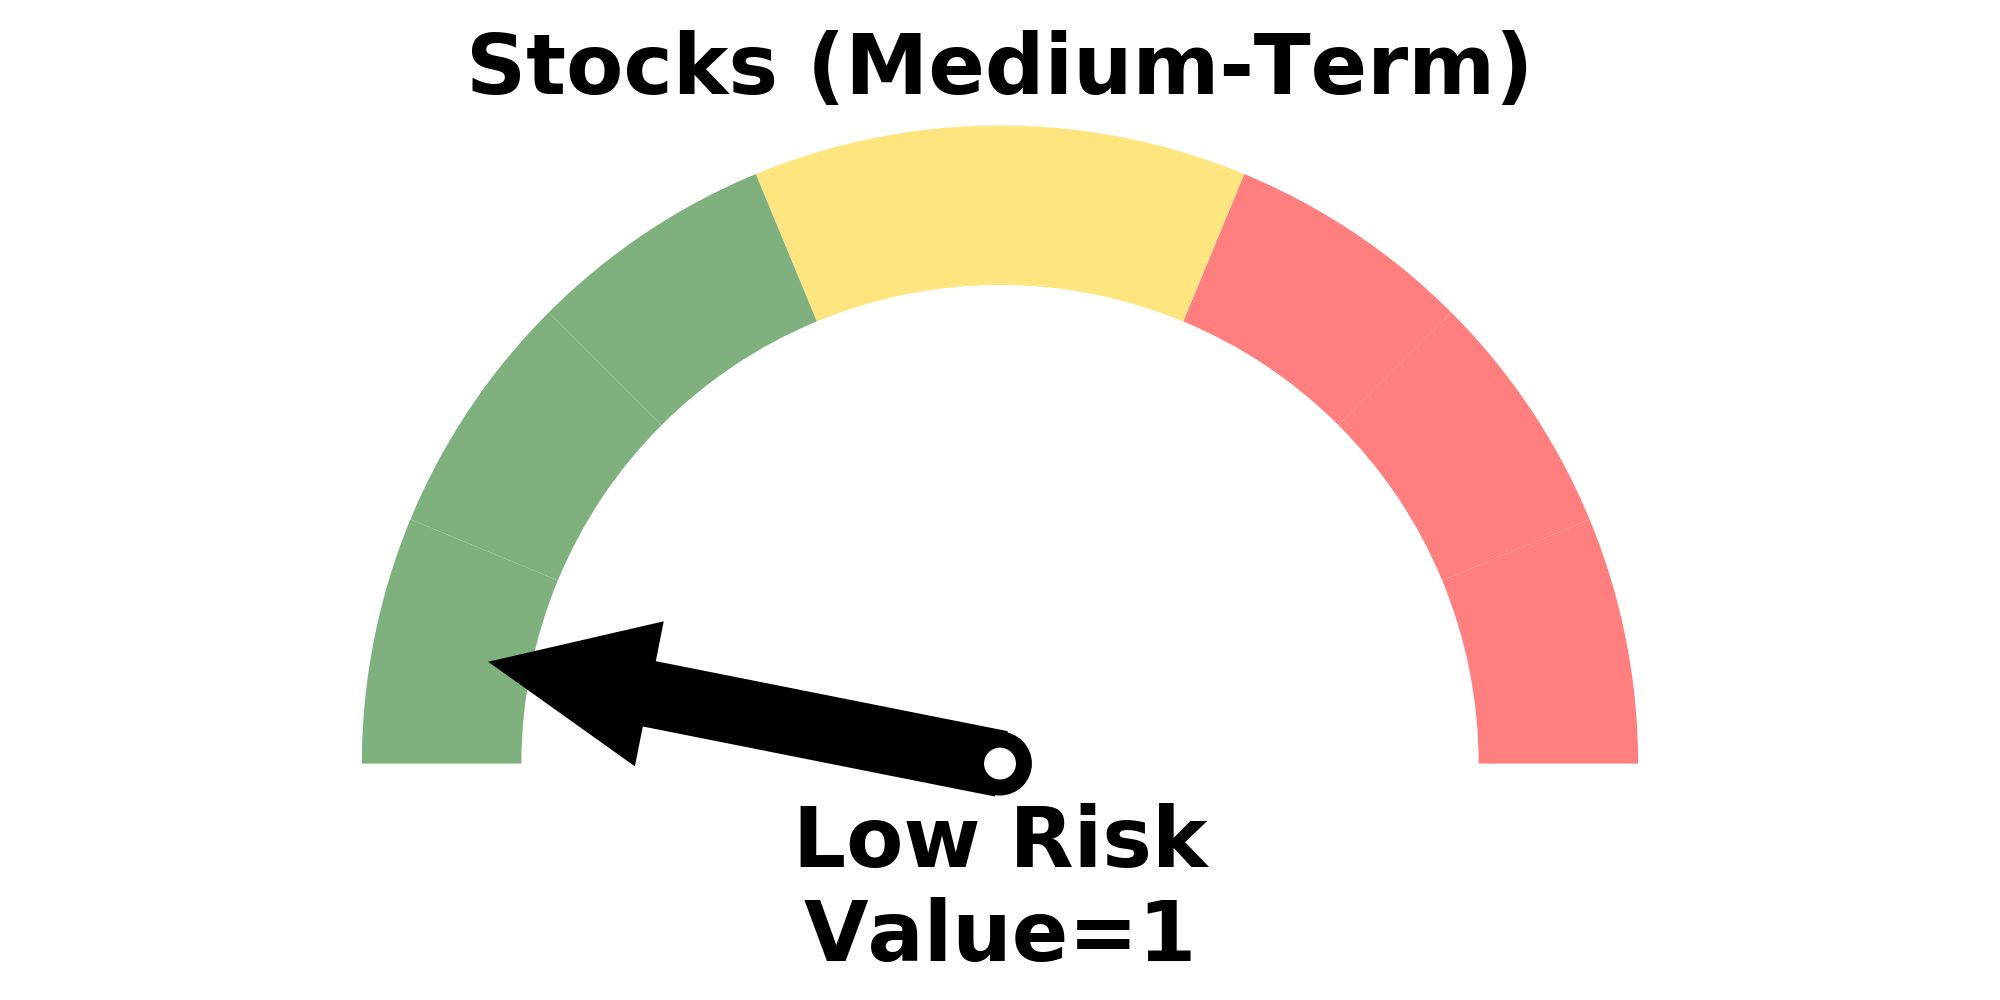
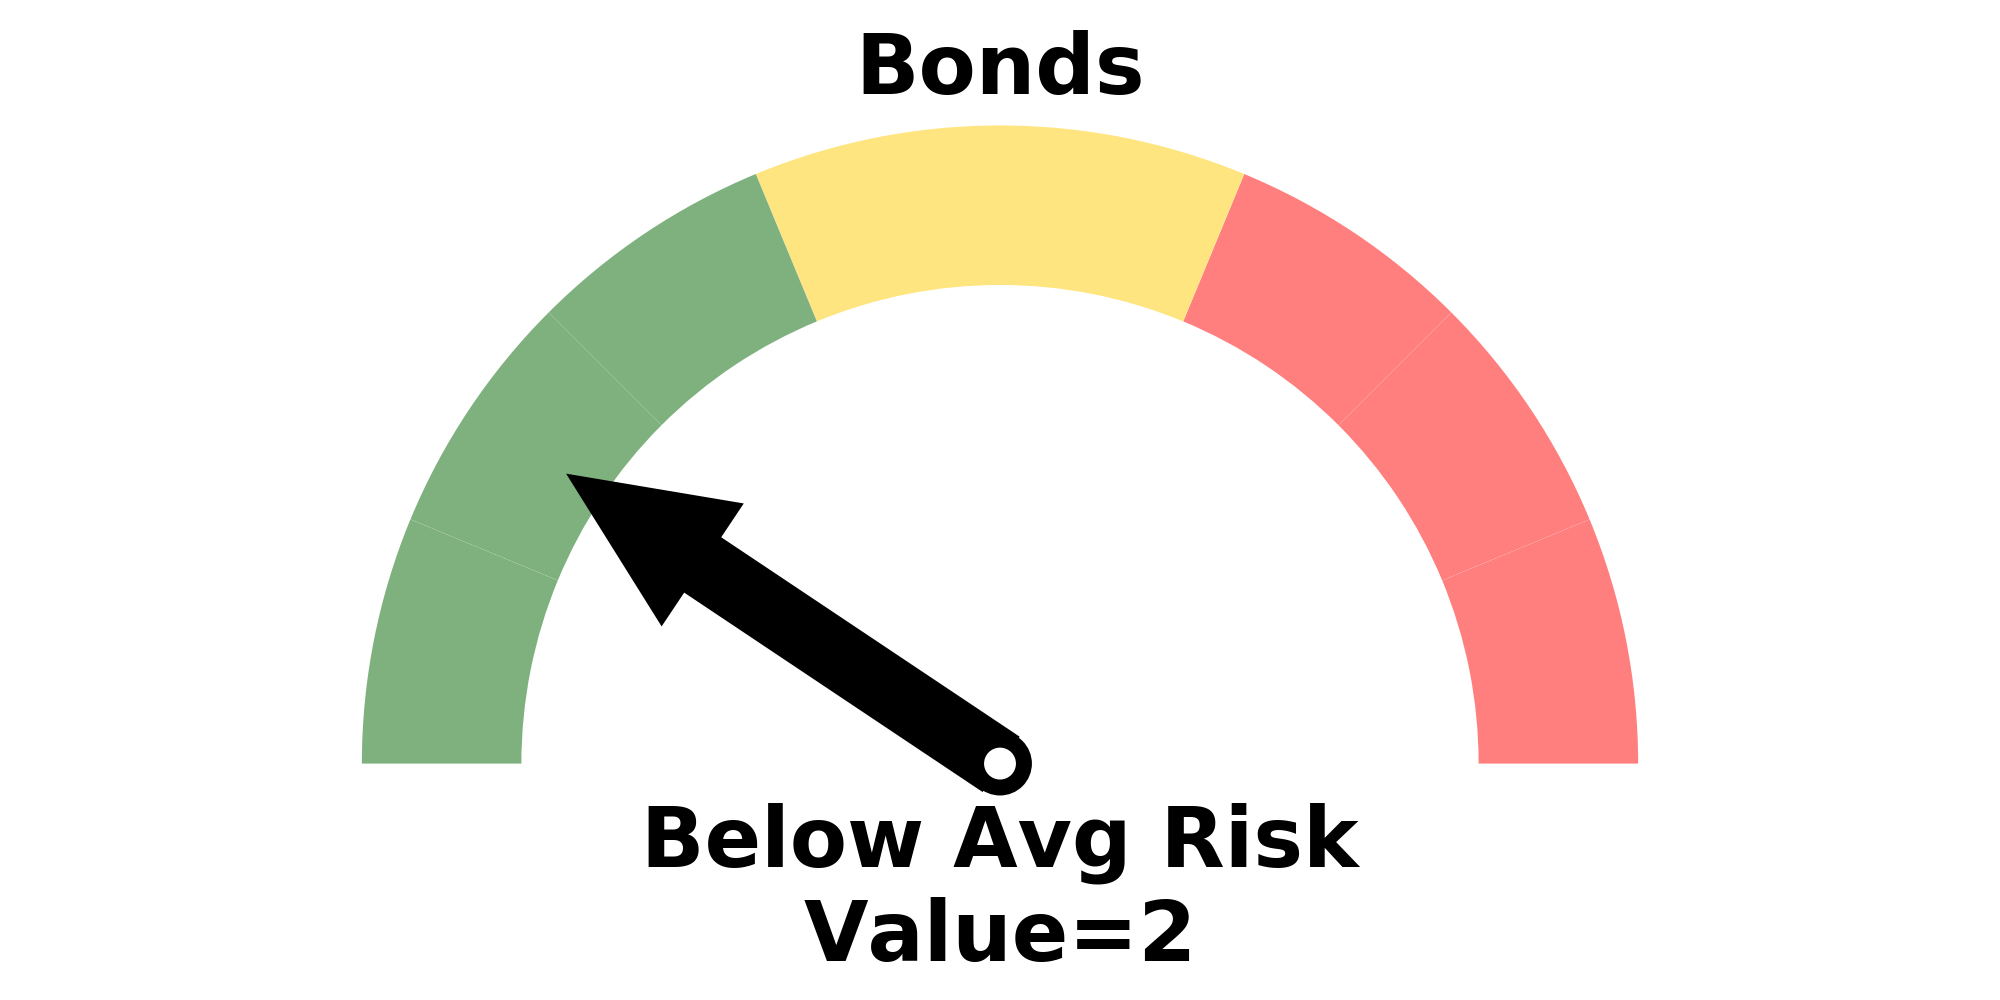
Risk Levels
Research
BOTTOM LINE
Barring a collapse into the close, we're on track for back-to-back 90% up volume days on the NYSE. When we get consecutive 90% up days - with that being the only condition - gains were remarkable.
FORECAST / TIMEFRAME
SPY -- Up, Long-Term
|
Barring a collapse into the close, we were on track for back-to-back 90% up volume days on the NYSE. An hour before the close, 93% of NYSE volume was concentrated on issues with a higher price than yesterday's close.
With stocks backing off in the final half-hour due to political posturing, up volume made up "only" a little more than 80% of total volume.
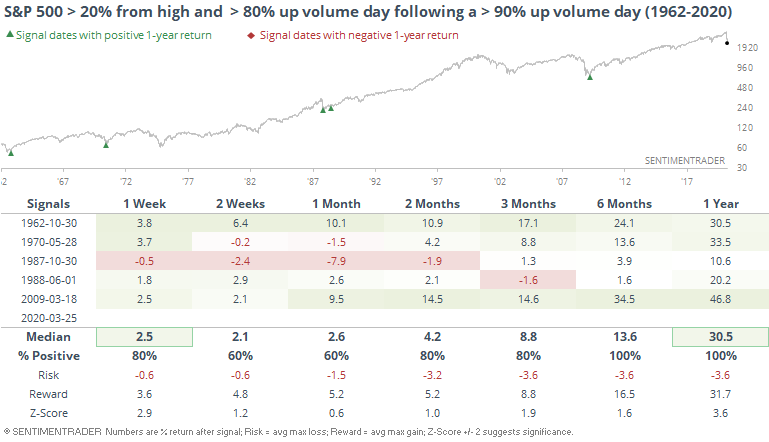
A single 90% up day when coming off of a low has preceded gains as we saw yesterday. Troy noted in a premium note earlier today that even an 85% up day led to longer-term gains every time when the S&P had been at least 20% below its high at the time.
And when we get consecutive 90% up days - with that being the only condition - gains were remarkable. This did not trigger due to the late selloff, but it's at least worth noting given how trading had developed until the last half hour.
Even though selling pressure picked up, we still saw more than 80% up volume, on the heels of the 90% up volume day from Monday.
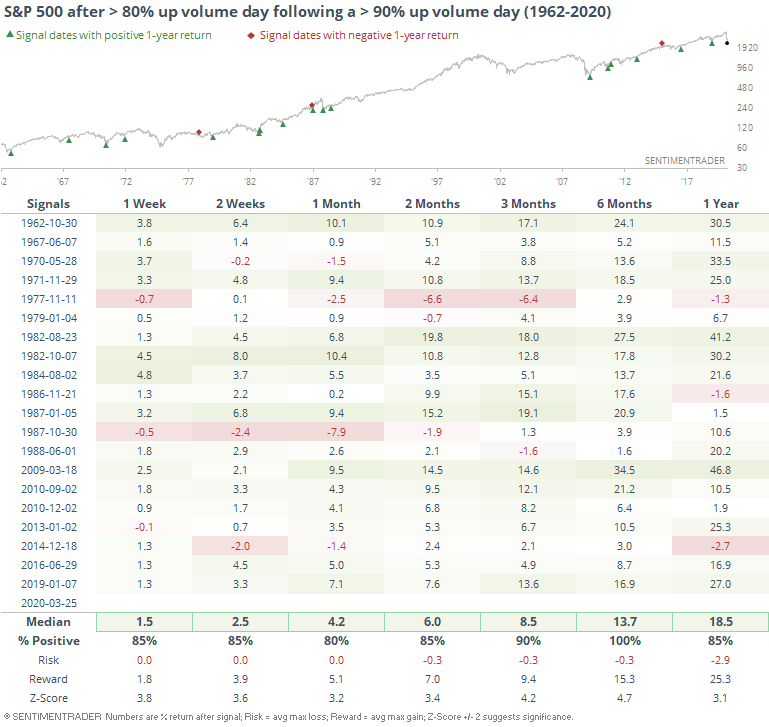
Even though many of these triggered in the midst of bear markets, future returns were excellent. Over the next six months, there wasn't a single loss, and the risk/reward was heavily skewed to the upside.
When these triggered while the S&P was more than 20% off of its 52-week high, it returned a median 30.5% over the next year (tiny sample size, though).
So far, buyers are doing what they need to in order to preserve the idea that we've seen an important inflection point.
BOTTOM LINE
In late January, there were a lot of technical warning signs that had been building. Now, we're seeing the opposite. The HLLI for the NYSE and Nasdaq have both dropped to an extremely low level and should start to recover, suggesting that the market is washed out.
FORECAST / TIMEFRAME
SPY -- Up, Long-Term
QQQ -- Up, Long-Term
|
In late January, there were a lot of technical warning signs that had been building. Granted, they had triggered the prior November as well, and failed to precede any weakness, so it was a little harder to trust them when they triggered again in January and early February.
One of the primary warnings was that even though stock indexes were rising, the stocks that were underlying the indexes were becoming split. By the end of January, there were so many stocks hitting 52-week highs and stocks hitting 52-week lows that it caused the HiLo Logic Index (HLLI) to exceed its warning threshold. That has consistently preceded very poor medium-term returns.
Now, we're seeing the opposite.
The HLLI for the NYSE and Nasdaq have both dropped to an extremely low level. This happens when there is either an overwhelming number of securities hitting new highs or new lows. One side of the market is dominant. We already know that right now, there have been a lot of 52-week lows, so it suggests that the market is washed out.
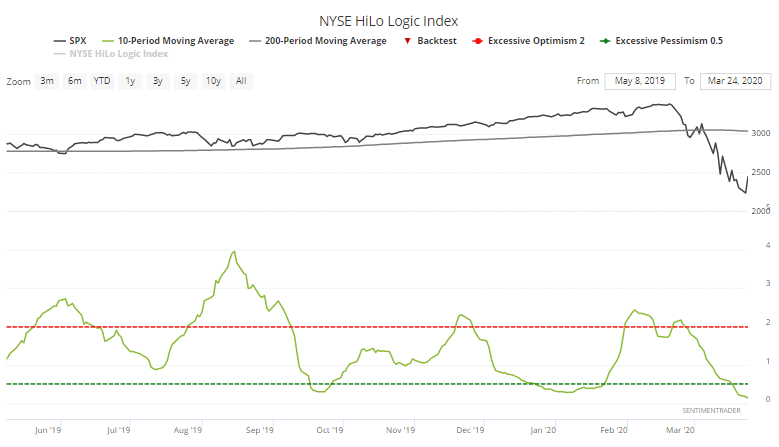
What we're looking for is green shoots - when markets go from really bad to less bad. In the coming days, the HLLI for both the NYSE and Nasdaq will almost certainly turn higher, giving the first hints that we're entering the "less bad" phase.
On the NYSE, the 10-day average of the HLLI is close to bottoming out below 0.25, one of the lowest readings on record, due to the overwhelming number of 52-week lows over the past couple of weeks.
We can use the Backtest Engine to see what happened in prior cycles once the 10-day HLLI reached an extremely low level and turned up. We want to test similar environments, so we'll restrict the test to those times when the S&P 500 was below a downward sloping 200-day average.
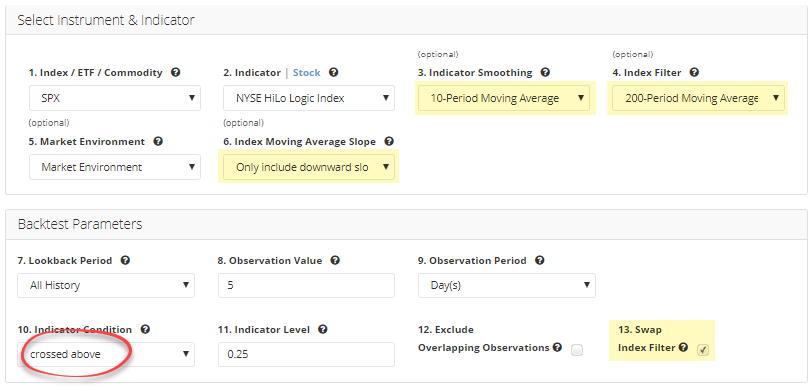
We want to see times when the indicator started to recover, so we'll select "crossed above" to find times when the moving average started to turn higher. To run this test, just click this link then the Run Backtest button.
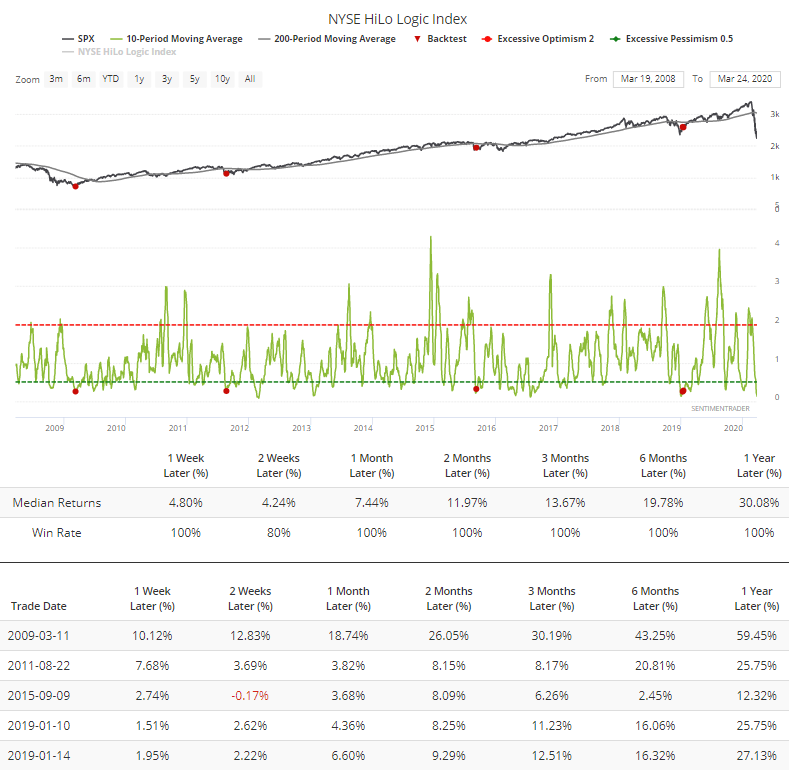
When we do that, the Multi-Timeframe Results tab shows very good longer-term returns. A year later, there were only 2 losses.
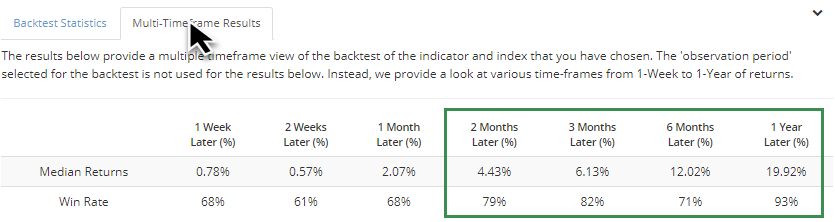
There haven't been too many recent occurrences, but in the past 20 years, results were pristine.
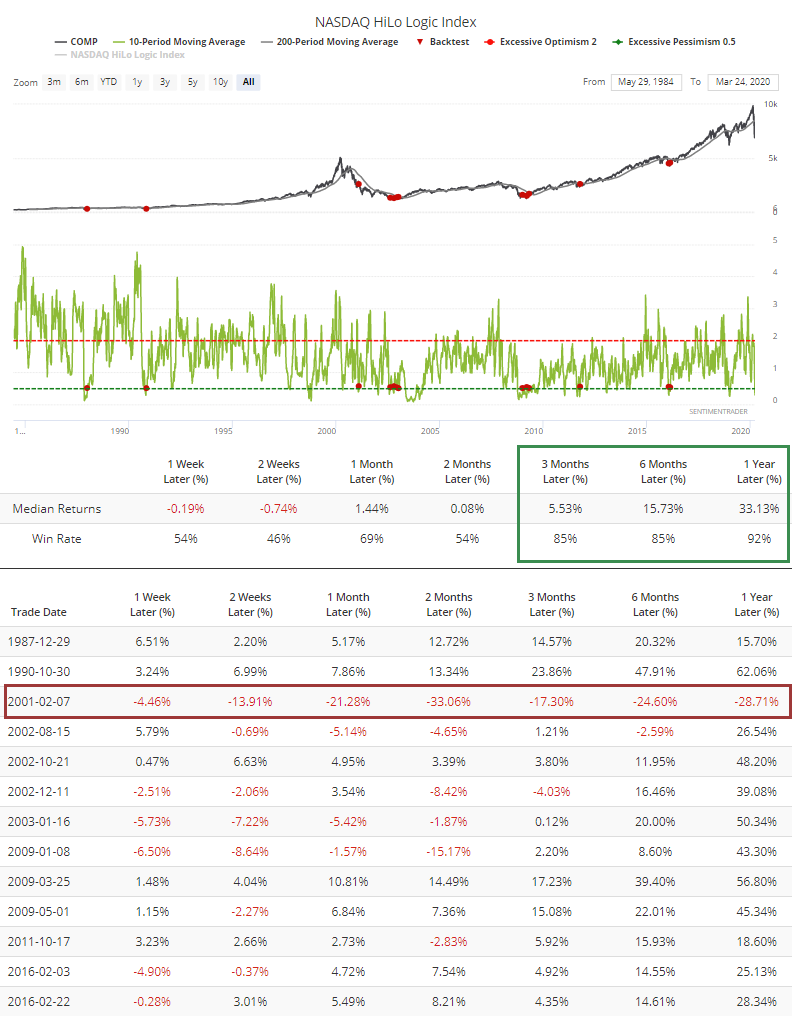
If we perform a similar test on the Nasdaq's HLLI, then we get similar results. A year later, the Composite averaged a return of more than 33%, though there was a big loss in early 2001.
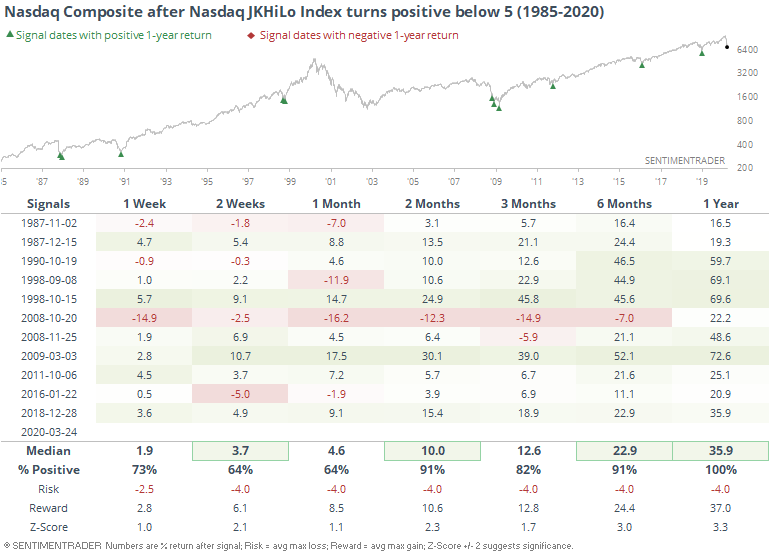
Author and portfolio manager Jay Kaeppel often has unique twists on various methodologies, and he noted that a custom combination of the HiLo Logic Index with a similar index from Gerald Appel just gave a buy signal on the Nasdaq.
We get slightly different results, but most of the dates are the same, and one-year forward returns were impressive, to say the least. It did cause some shorter-term indigestion a few times, so it took some fortitude to hold out longer-term.
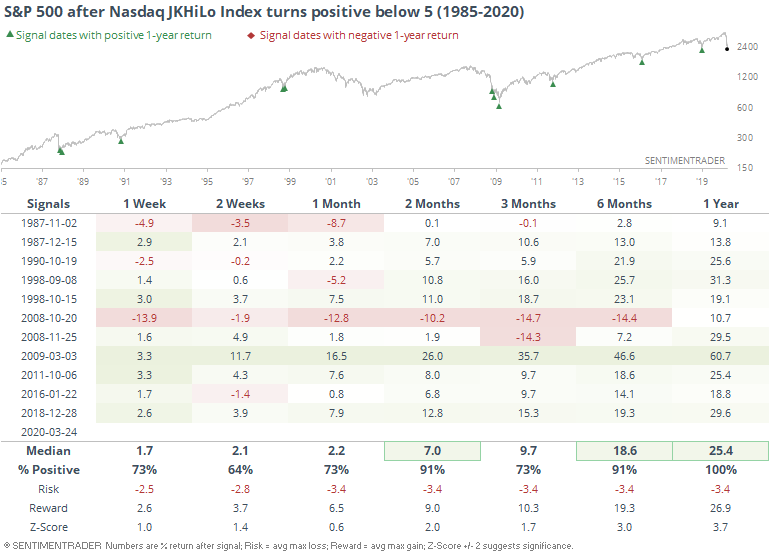
Returns were also impressive for the S&P 500 after these signals.
Extreme can always get more extreme, and cautious investors tend to wait until there is some sign of recovery once indicators get stretched. That can improve the win rate, but it also tends to lower the average returns and often increases shorter-term volatility. While it's still a little early, there are signs that sentiment - and breadth - is just starting to recover from extremely washed out levels, and that has been a longer-term positive.
Active Studies
| Time Frame | Bullish | Bearish | | Short-Term | 0 | 1 | | Medium-Term | 15 | 14 | | Long-Term | 28 | 3 |
|
Indicators at Extremes
Portfolio
| Position | Weight % | Added / Reduced | Date | | Stocks | 73.2 | Added 31.3% | 2020-03-17 | | Bonds | 0.0 | Reduced 6.7% | 2020-02-28 | | Commodities | 5.5 | Added 2.4%
| 2020-02-28 | | Precious Metals | 0.0 | Reduced 3.6% | 2020-02-28 | | Special Situations | 0.0 | Reduced 31.9% | 2020-03-17 | | Cash | 21.3 | | |
|
Updates (Changes made today are underlined)
In the first months of the year, we saw manic trading activity. From big jumps in specific stocks to historic highs in retail trading activity to record highs in household confidence to almost unbelievable confidence among options traders. All of that has come amid a market where the average stock can’t keep up with their indexes. There were signs of waning momentum in stocks underlying the major averages, which started triggering technical warning signs in late January. The kinds of extremes we saw in December and January typically take months to wear away, but the type of selling we’ve seen over the past month has gone a long way toward getting there. When we place the kind of moves we’ve seen over the past two weeks into the context of coming off an all-time high, there has been a high probability of a multi-month rebound. The volatility we’ve seen lately is extremely compelling from a medium-term point of view. Virtually everything we’ve looked at suggests a strong probability of gains over the next several months, even within the context of a potential bear market, and even from what had been higher prices. With an increasing sense that government entities will finally do anything it takes, and signs of progress in isolating and testing for the virus, I added to my exposure. I’m still holding 20% cash and don’t see that changing much at this point. Energy stocks. That was atrocious. The worst move I’ve ever made in this account. I’ve taken some very large sectors bets in this account over the years, like oil & gas explorers in 2016 and gold miners in 2018, and there is always some shorter-term discomfort because the news flow is so horrid. I don’t mind that in the least. But I do mind when stocks don’t do what they should. It didn’t help going large on these stocks right before what could be considered a true Black Swan, but so it goes. I’m more concerned that there has been no reaction since then and they continue to underperform despite…well, everything. They very well could rebound in the months ahead, but at this point I feel I have zero edge and don’t know what’s going on there, so I rotated out of that sector and into a general broad-market fund.
|
|
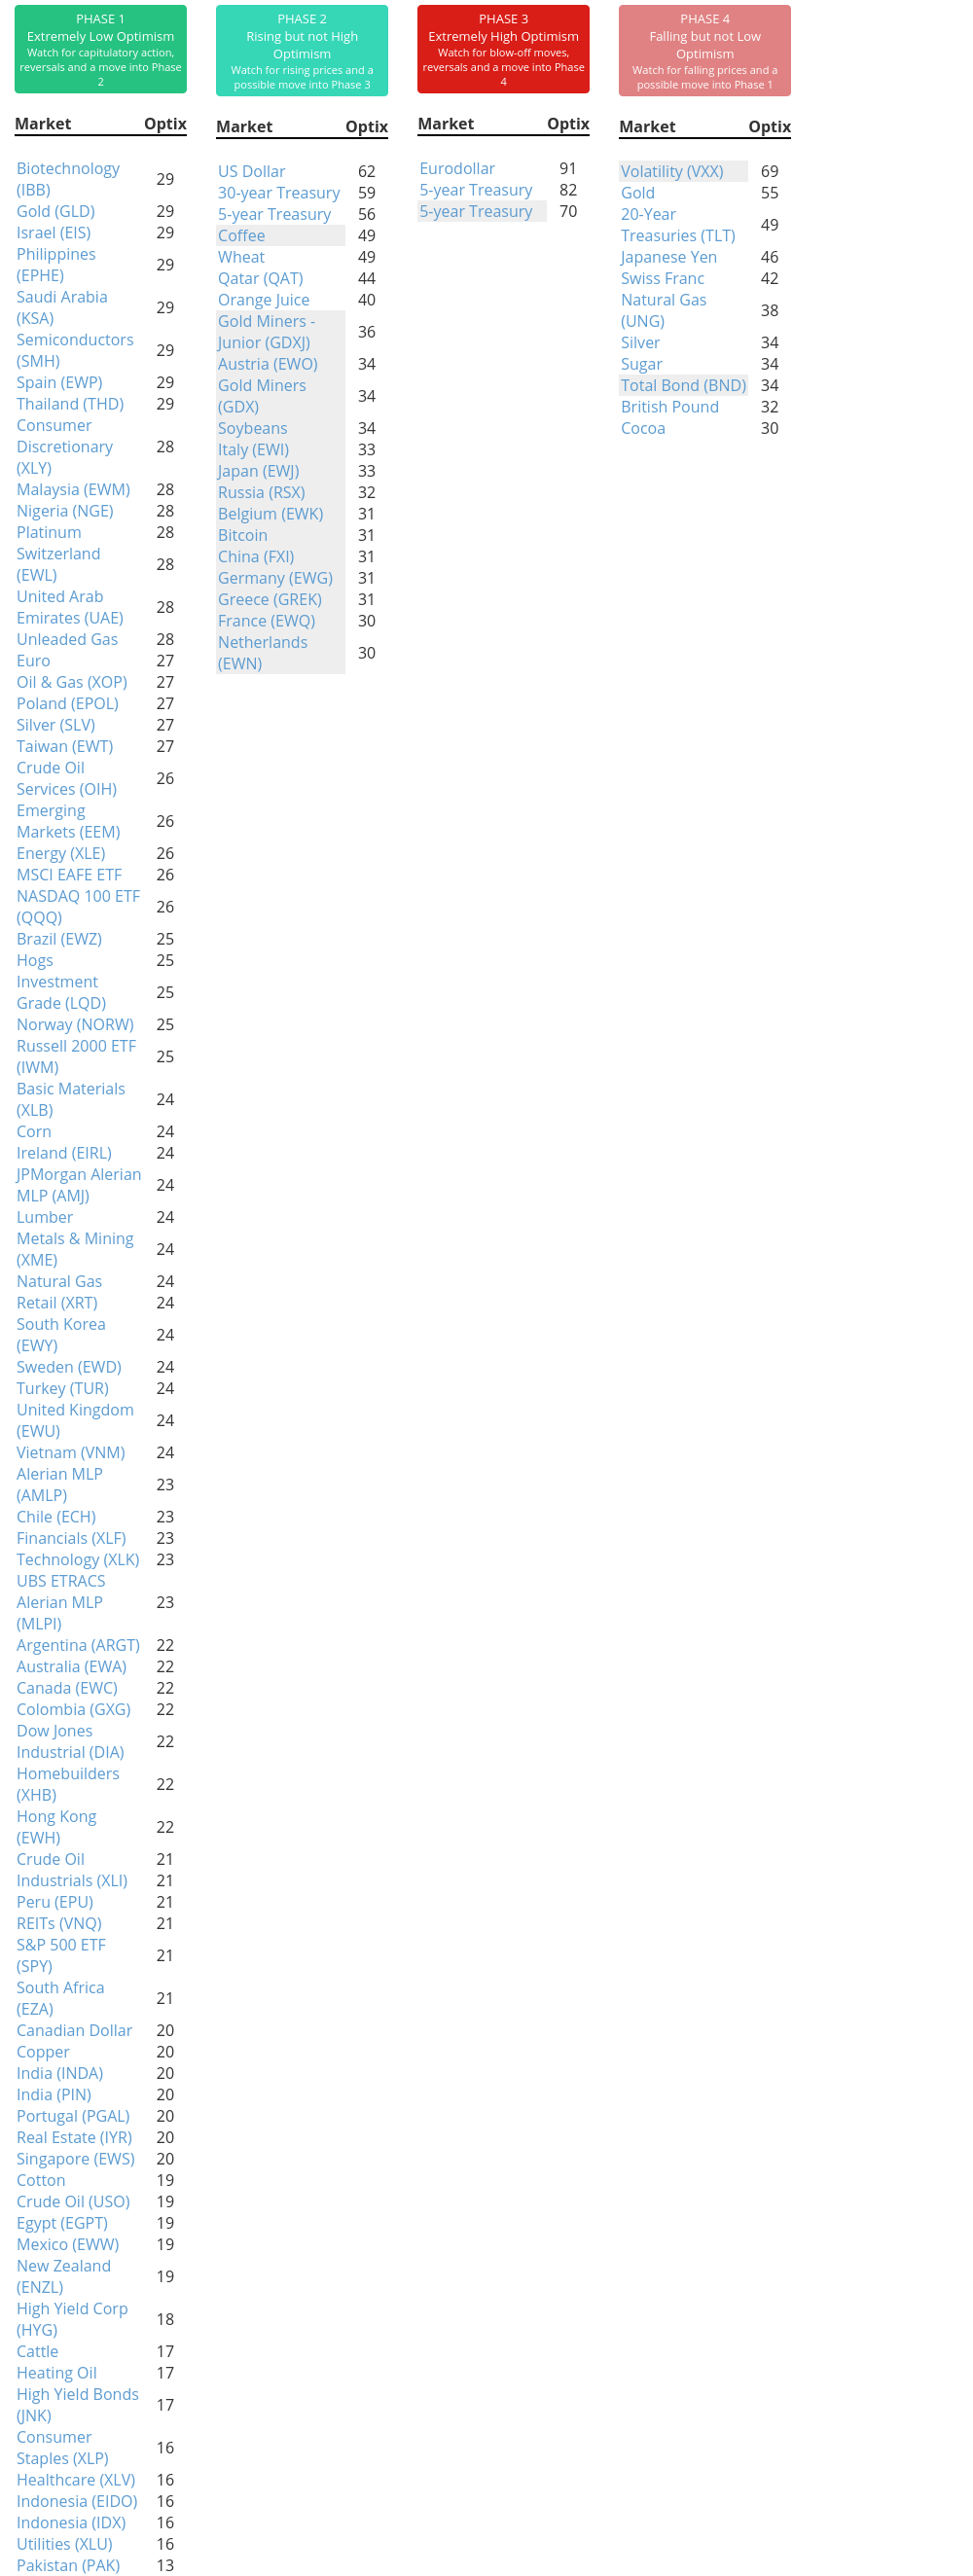
Phase Table
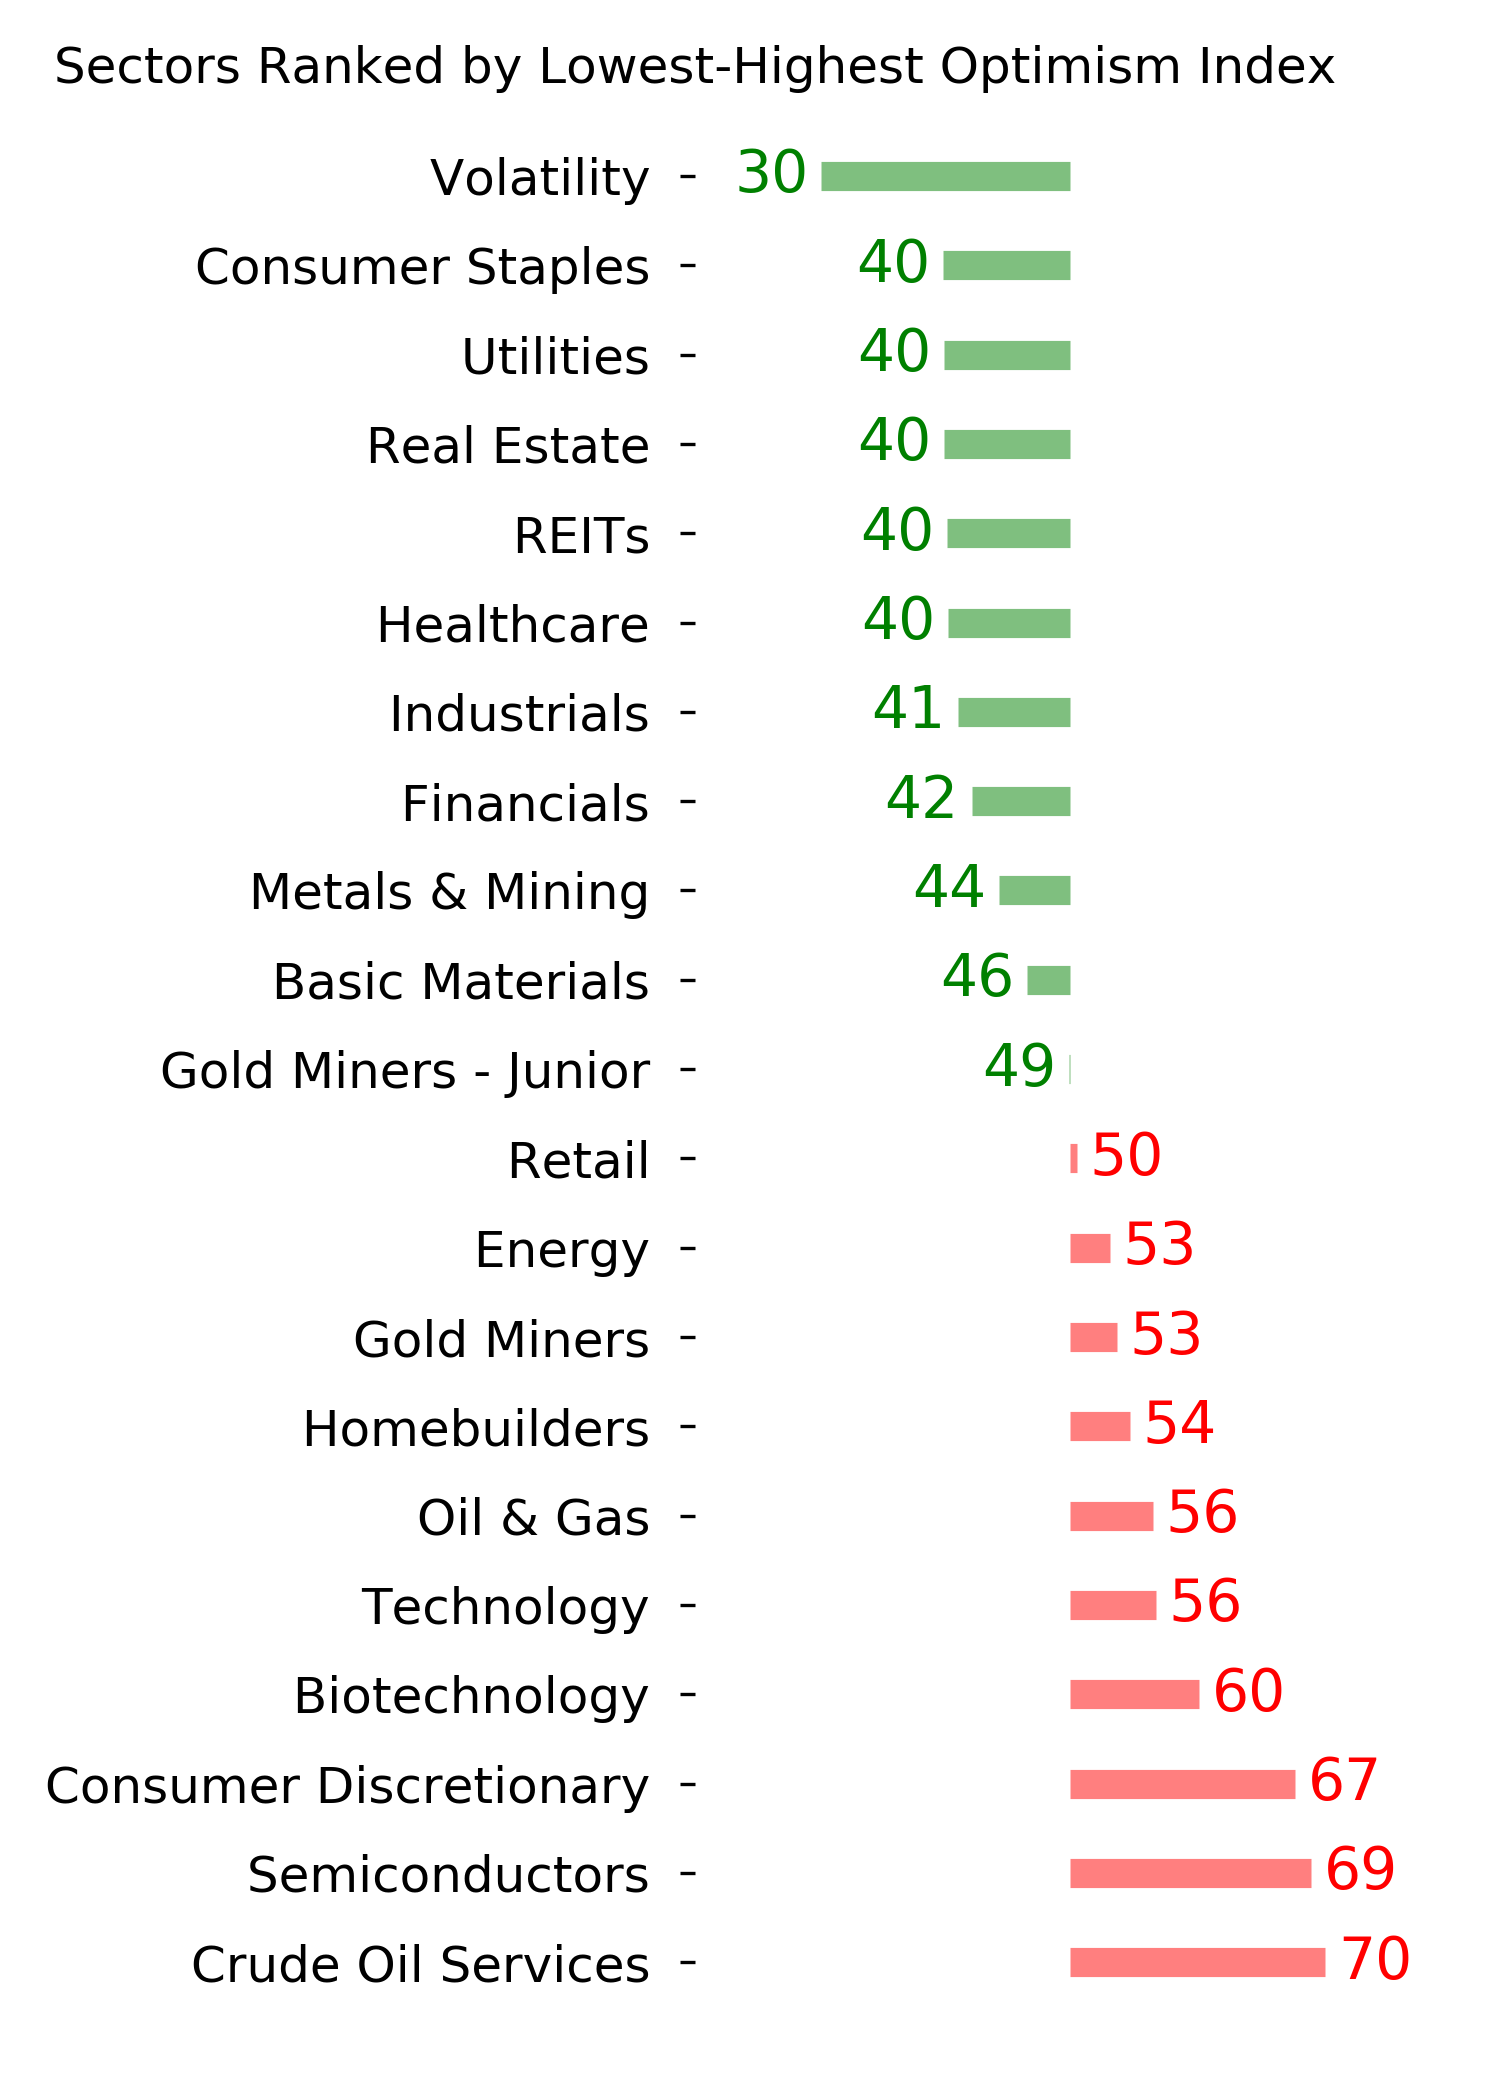
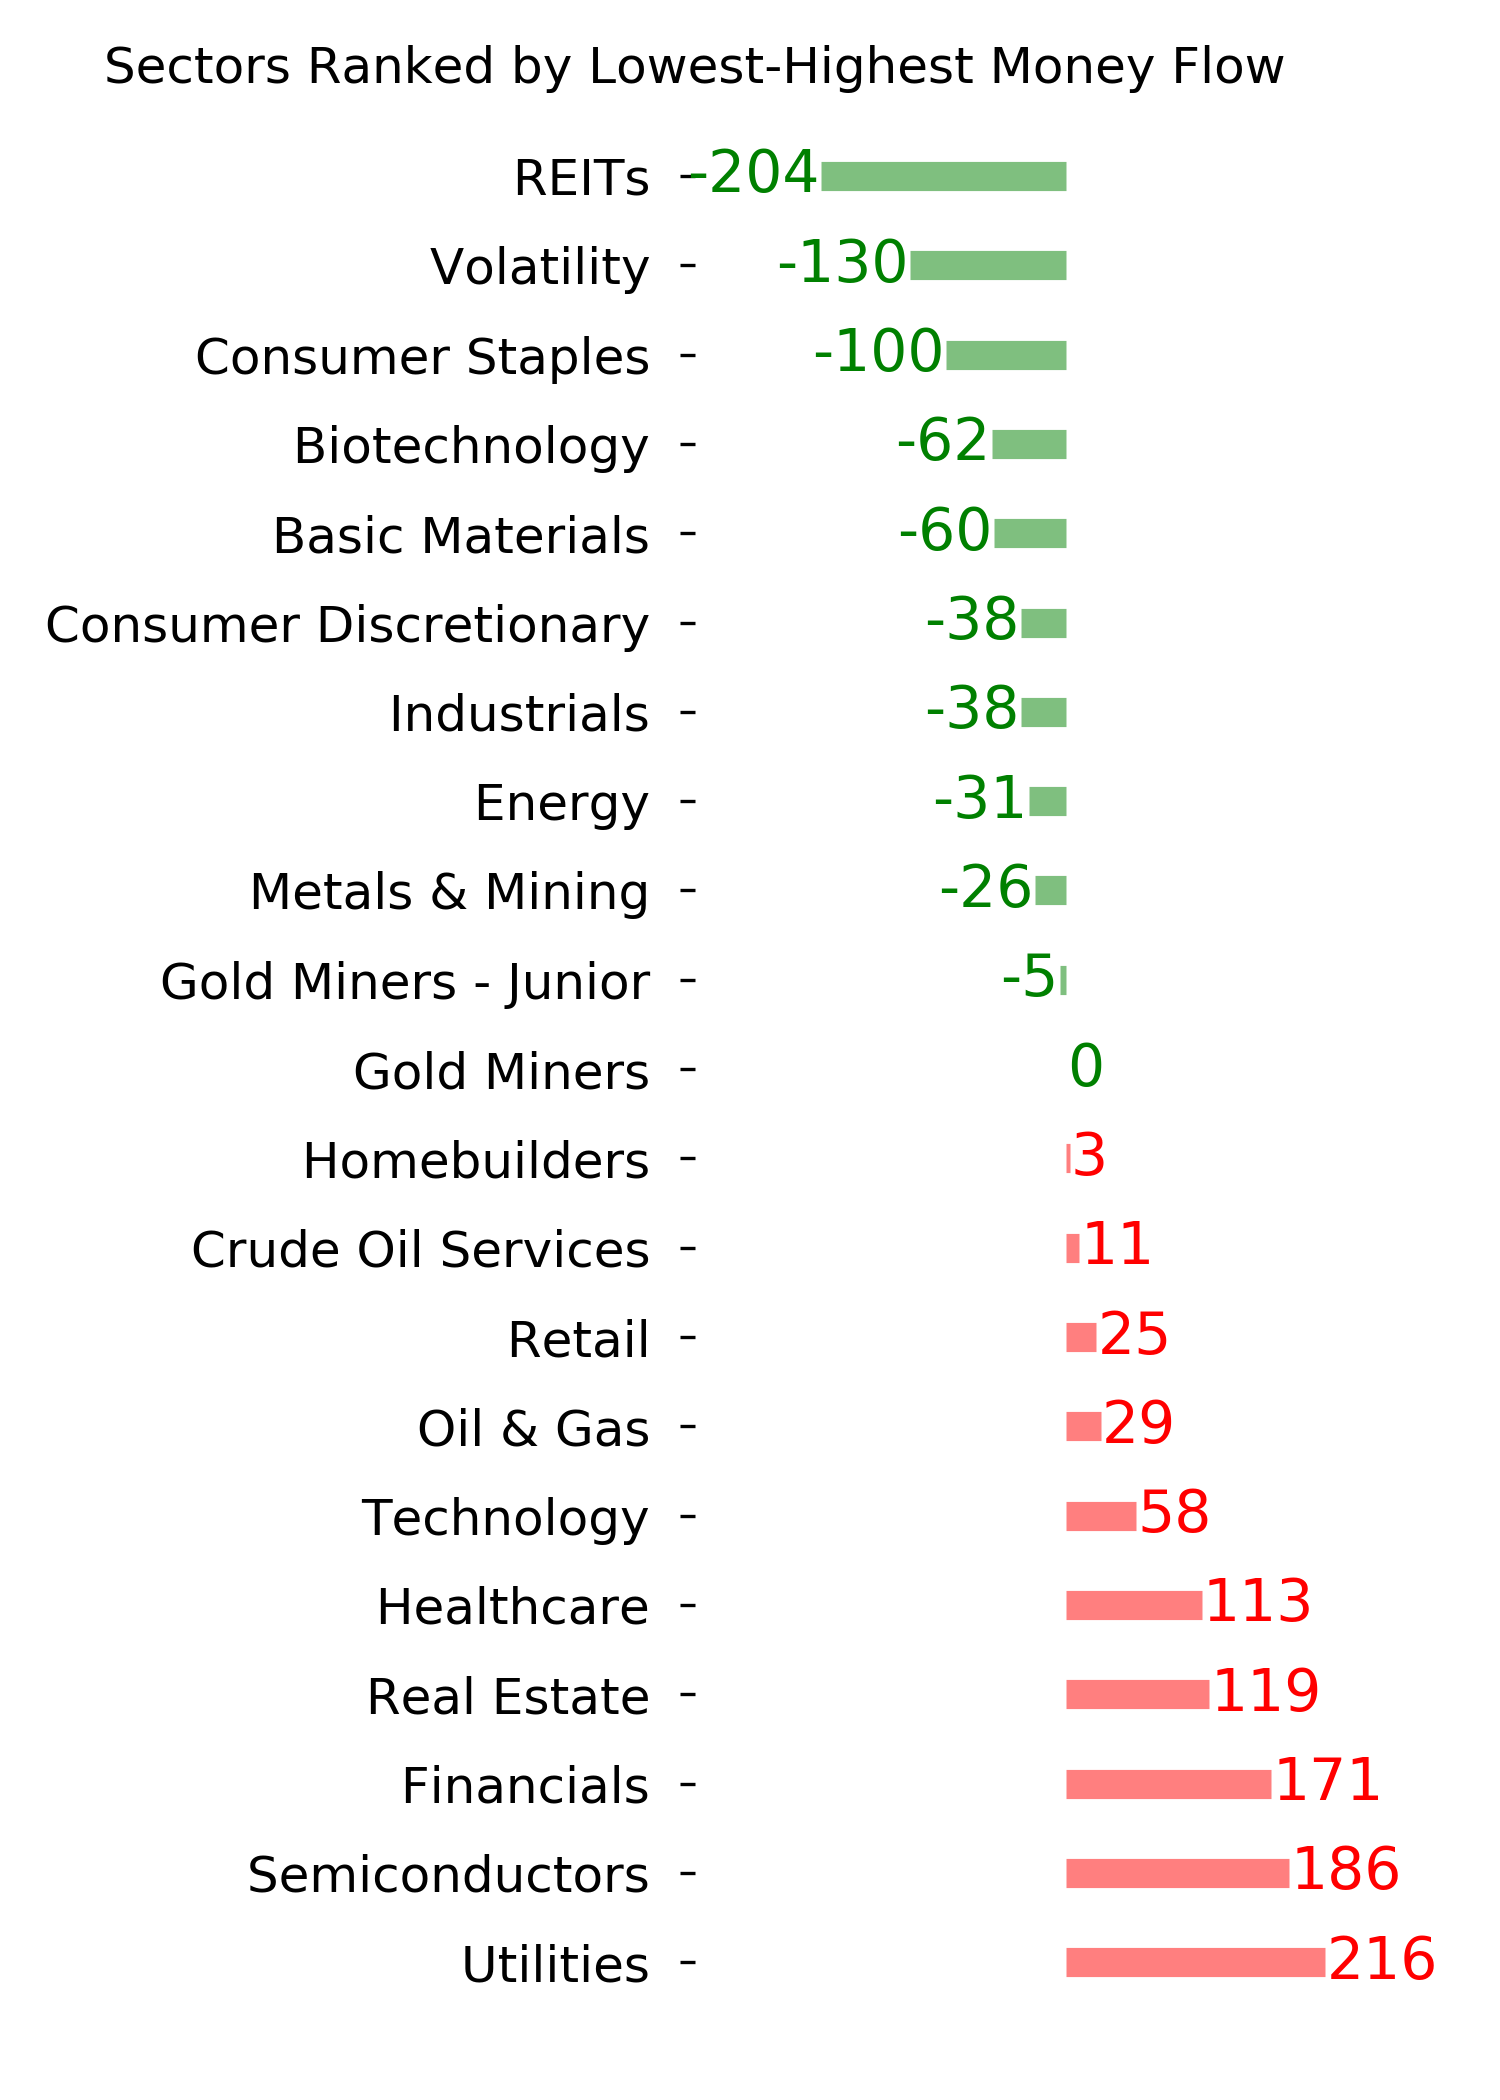
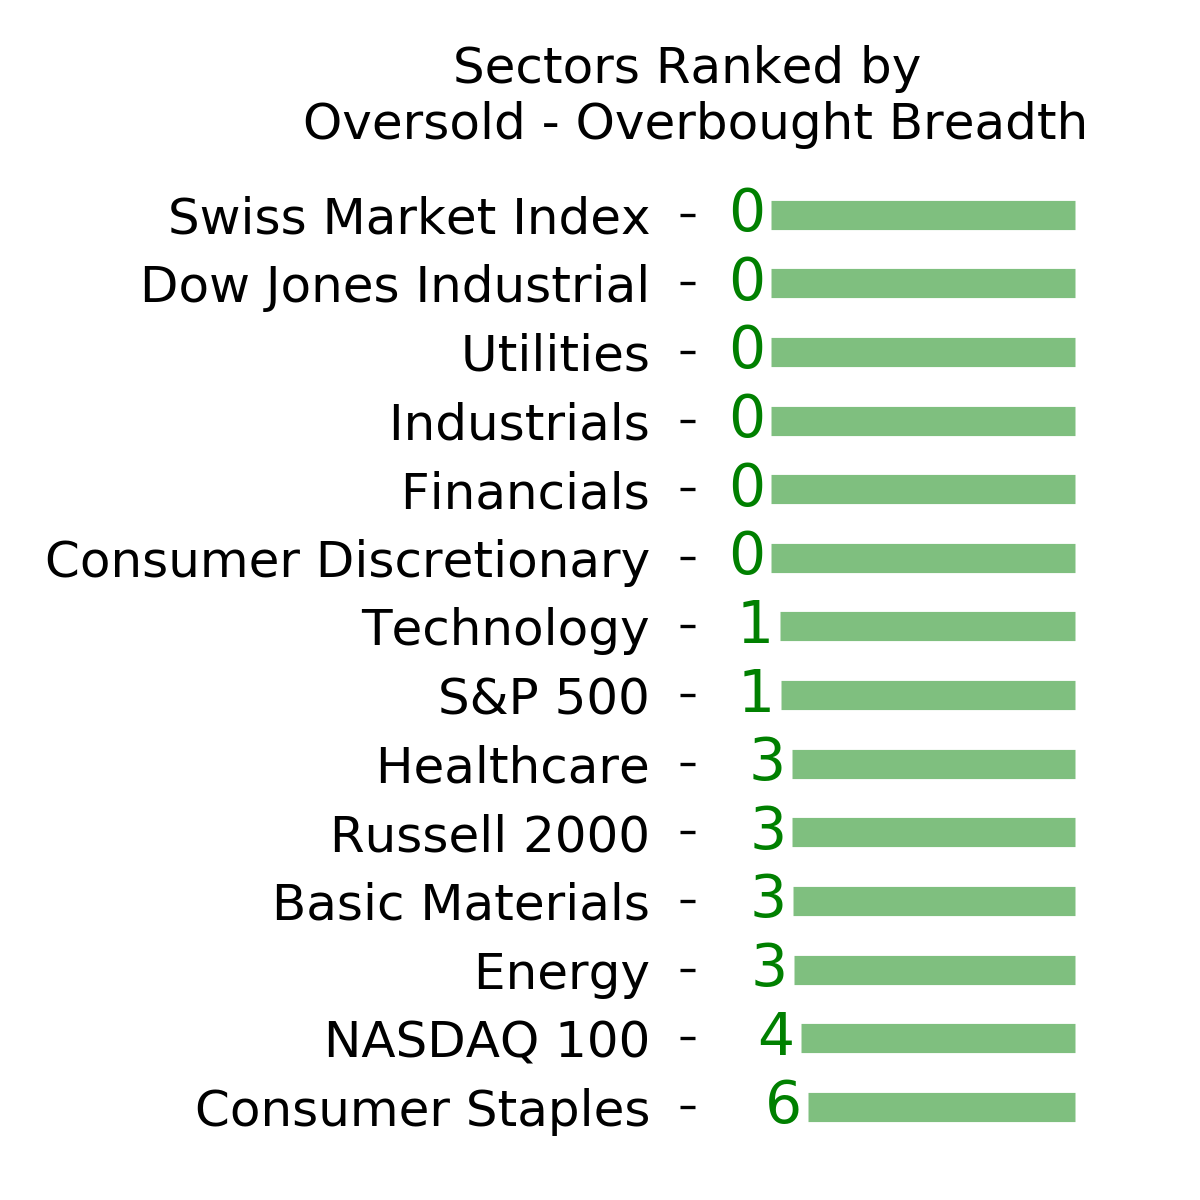
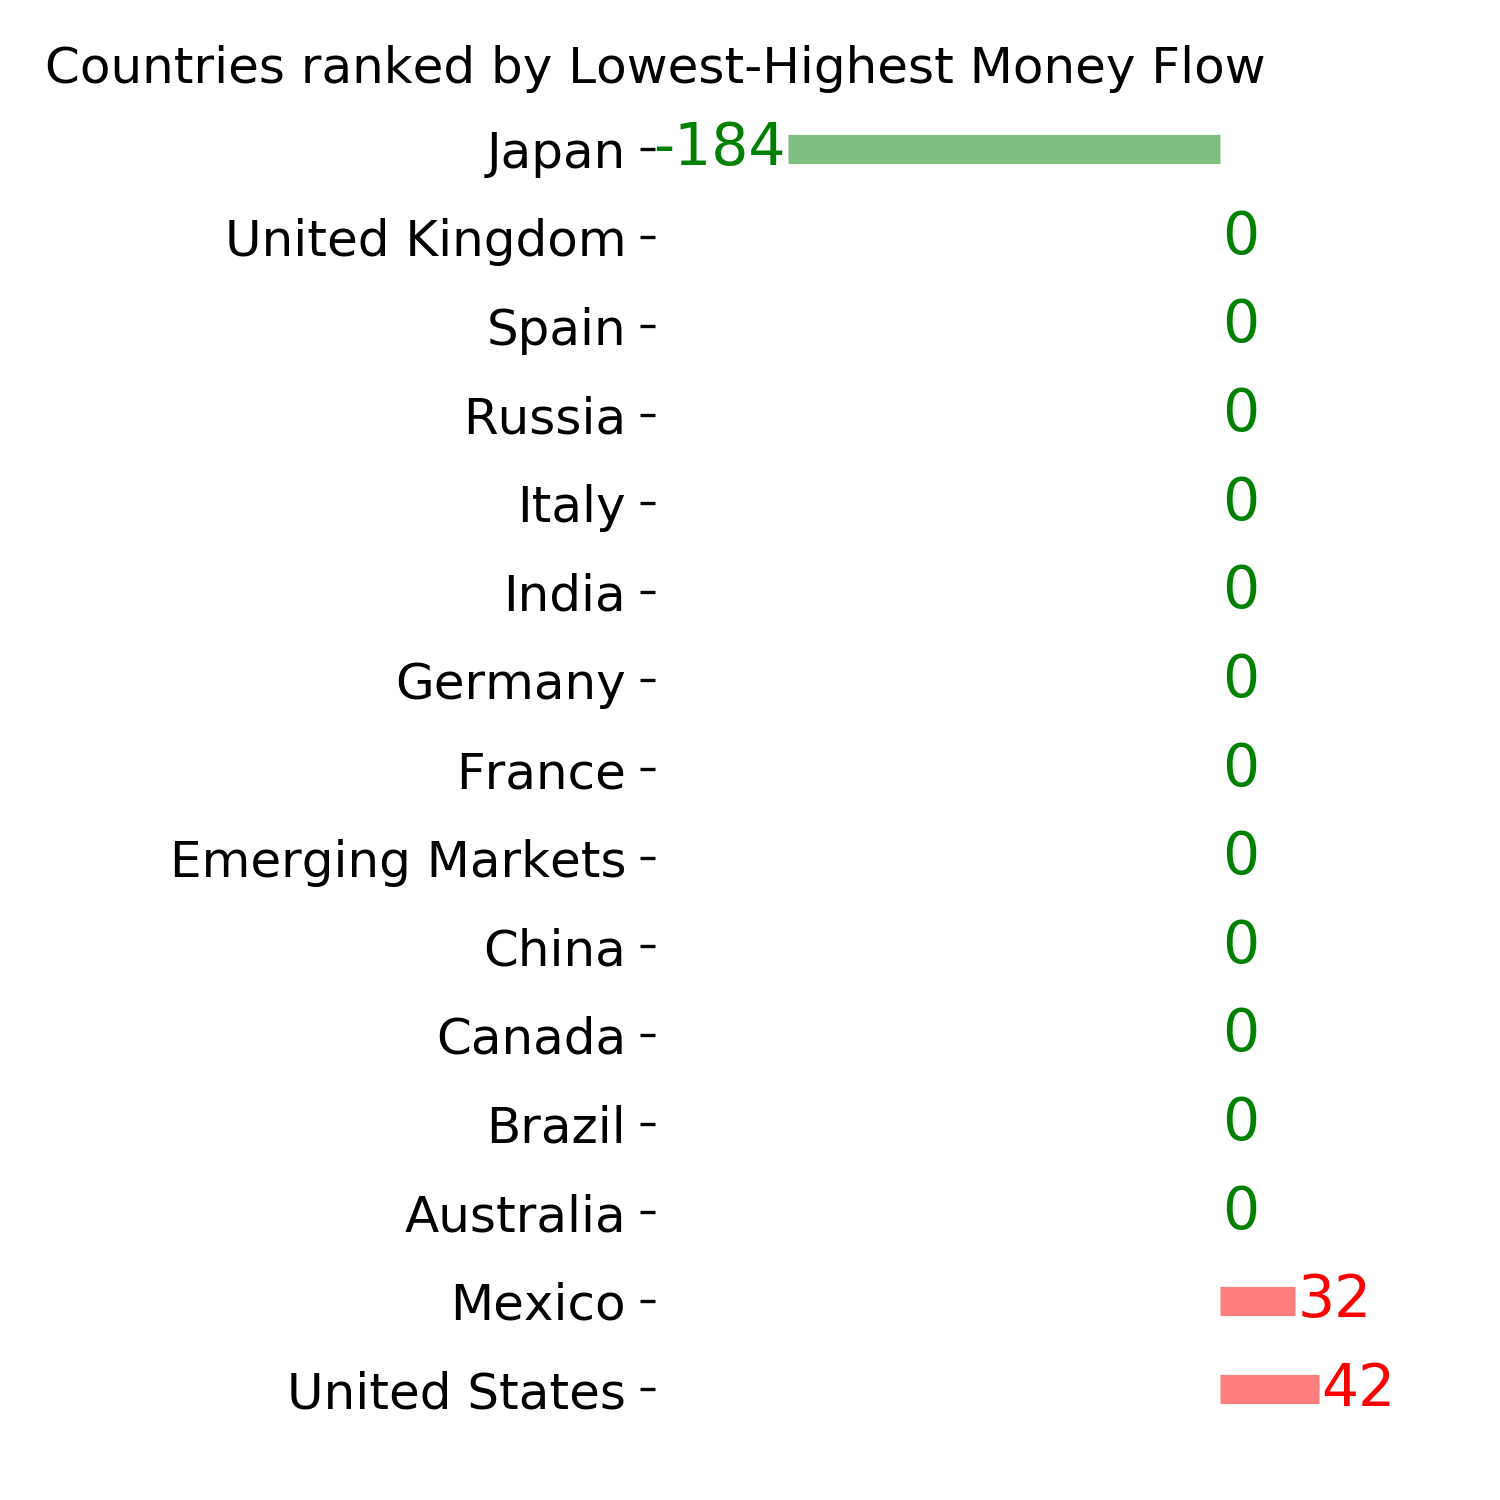
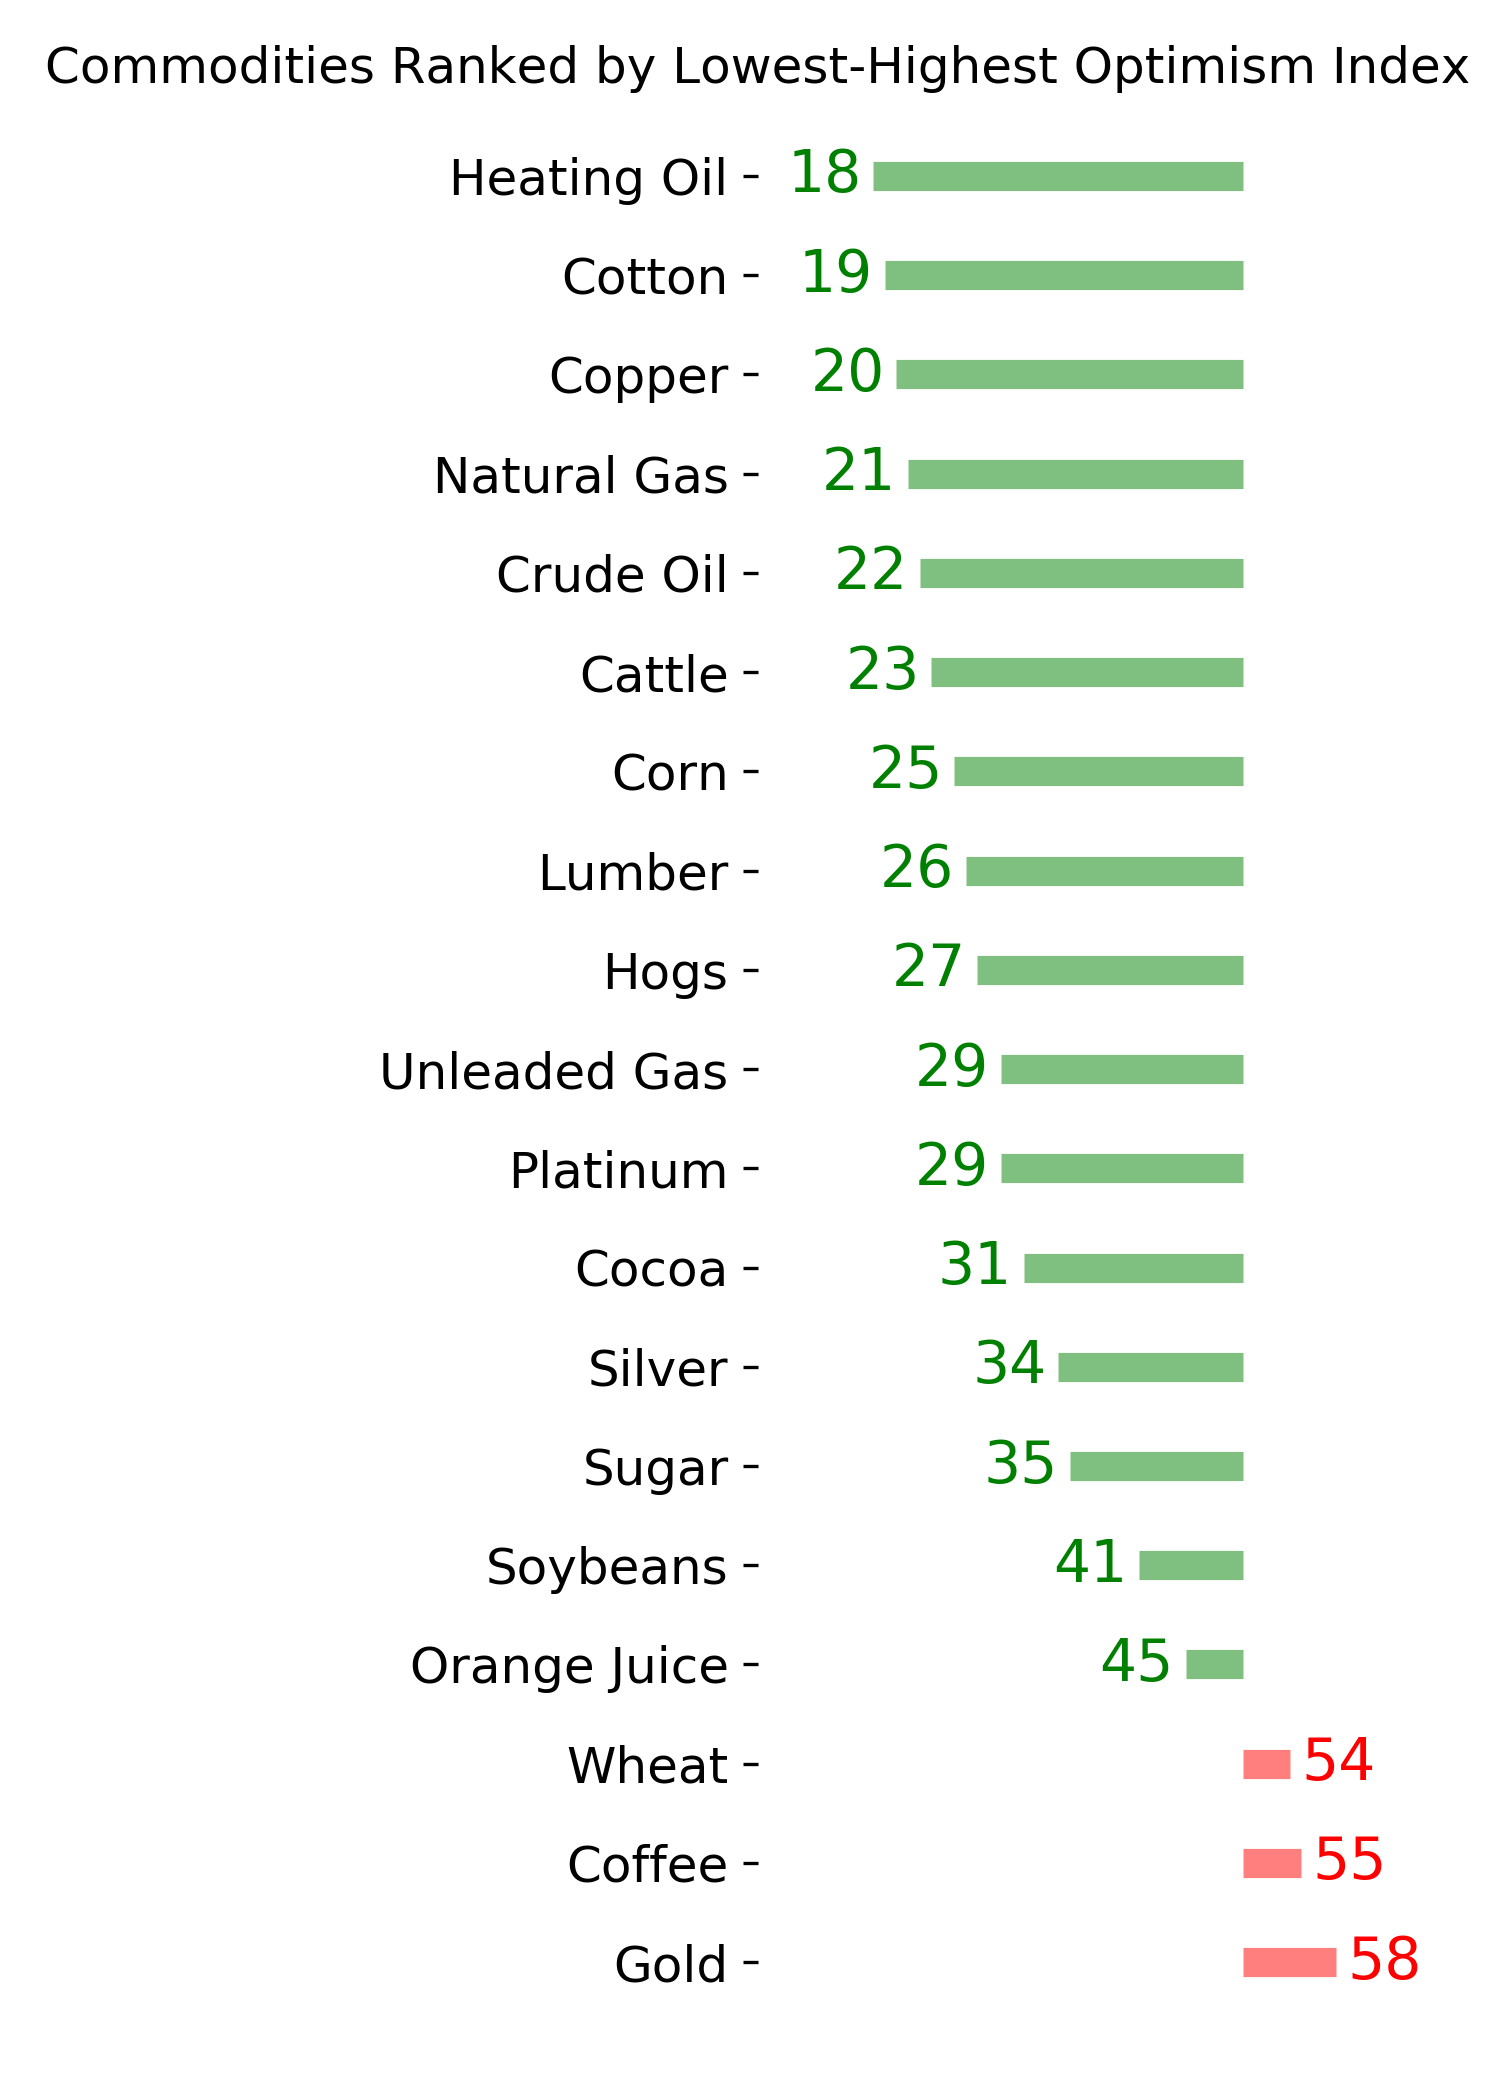
Ranks
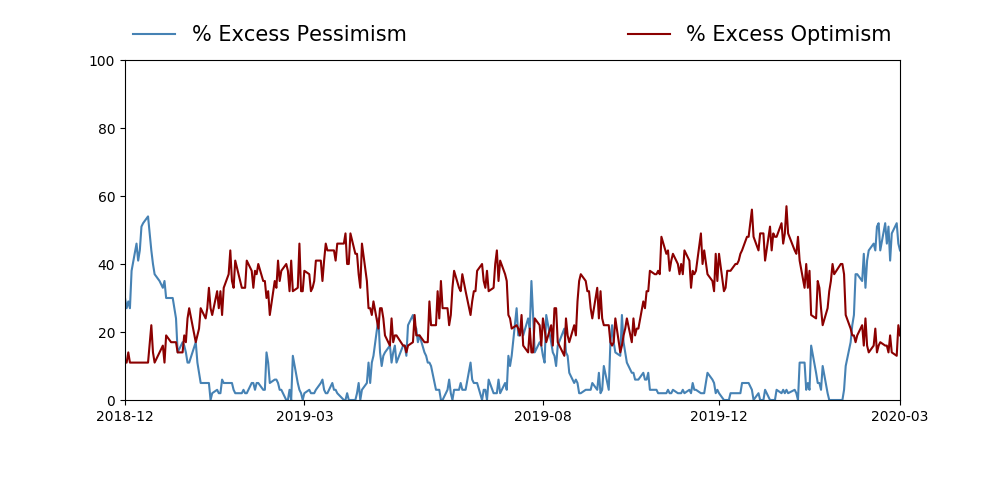
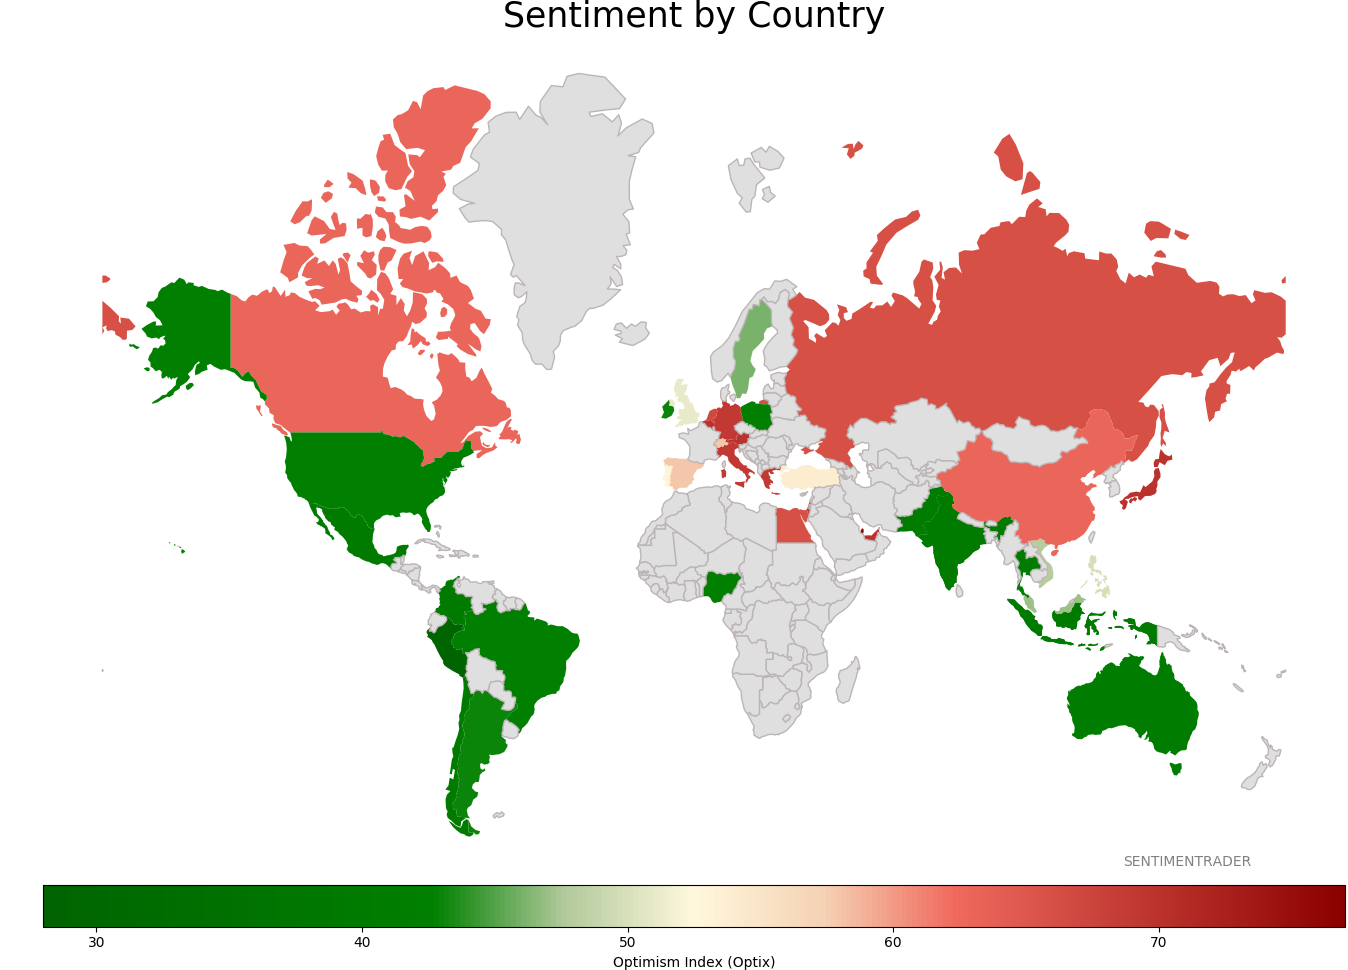
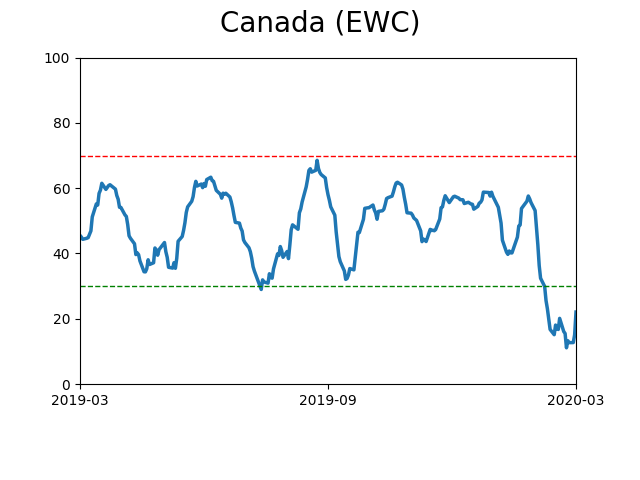
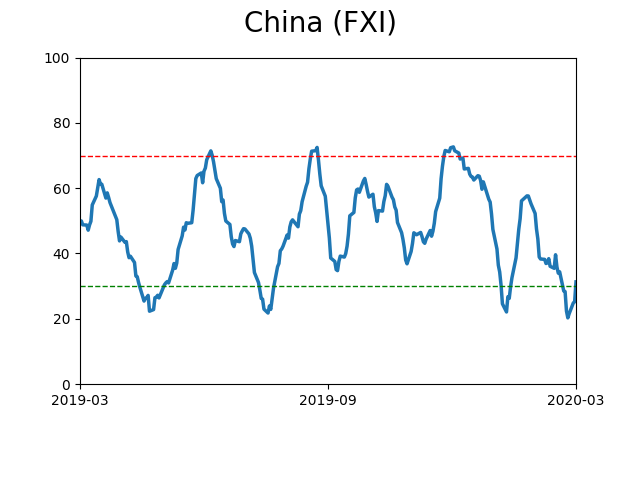
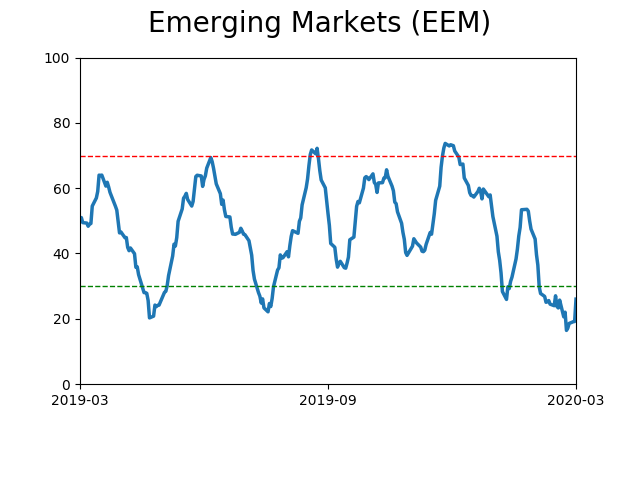
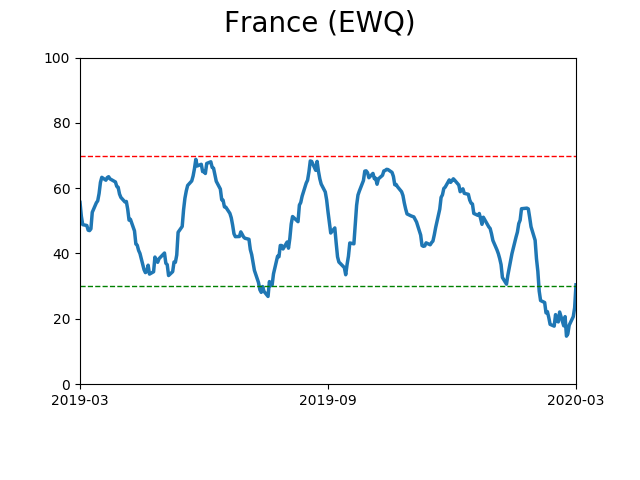
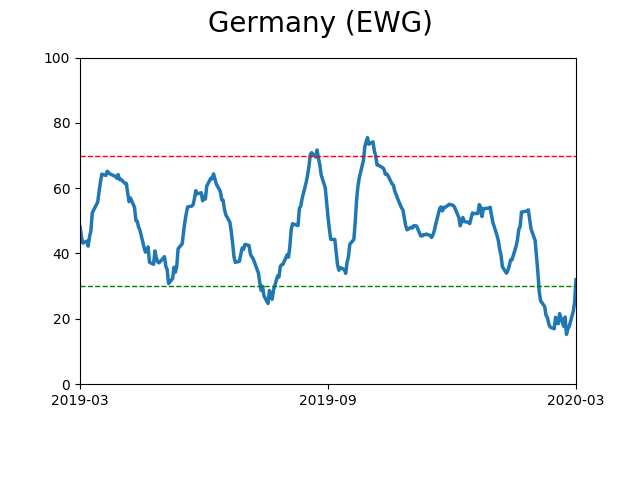
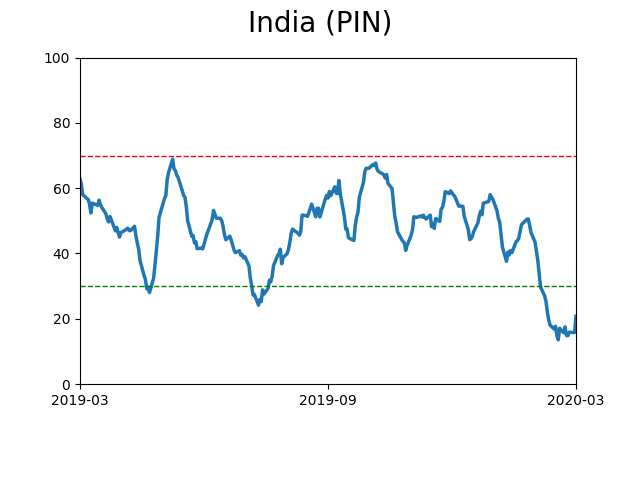
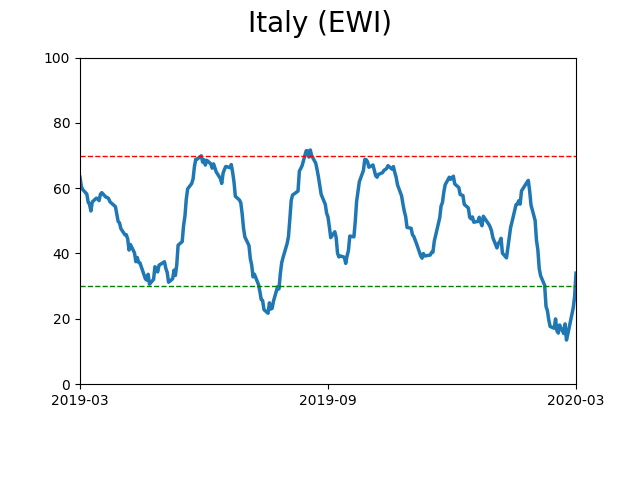
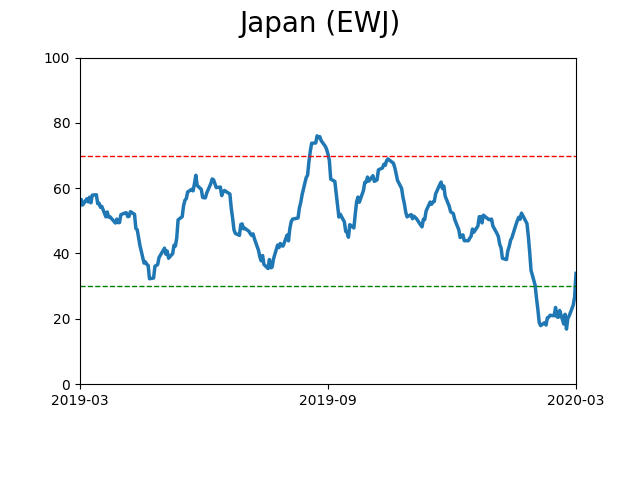
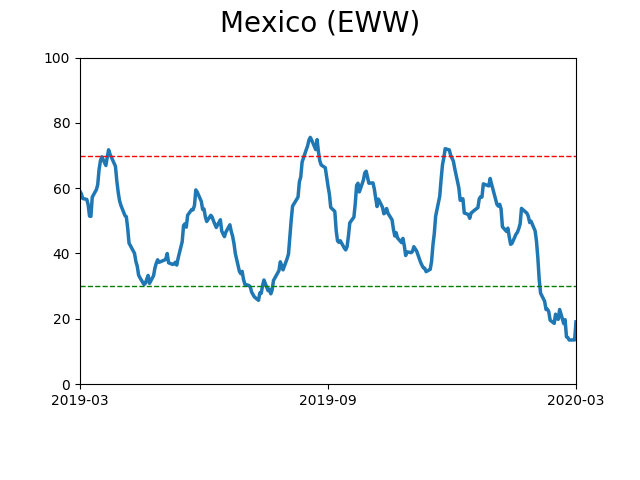
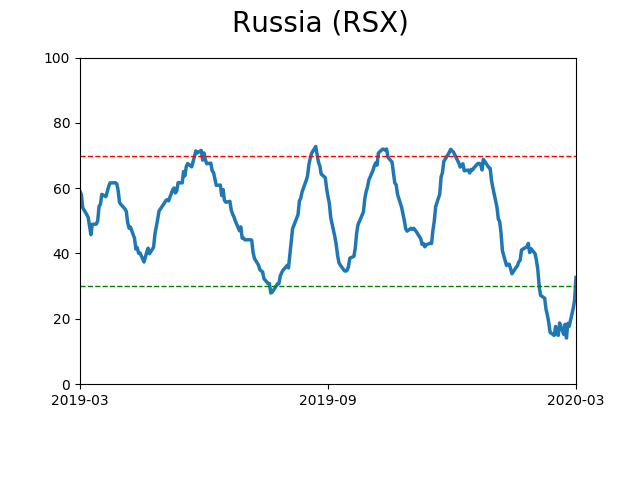
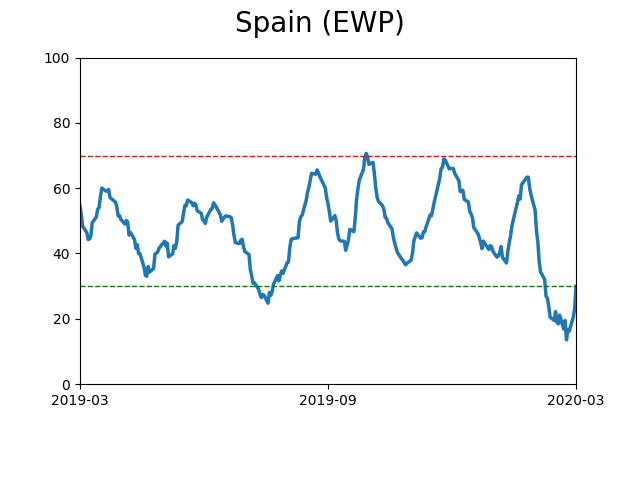
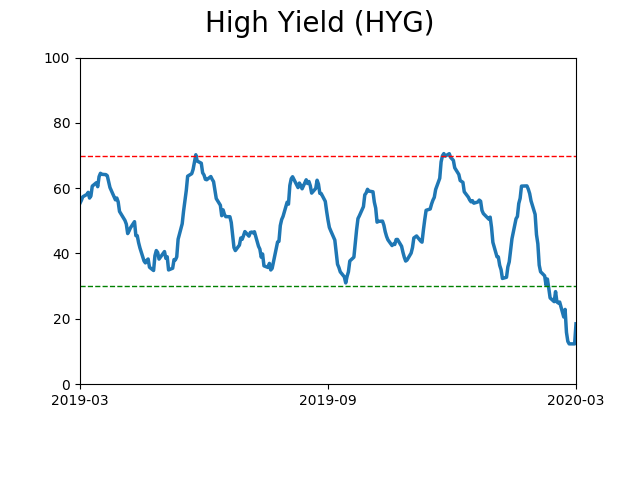
Sentiment Around The World
Optimism Index Thumbnails
|
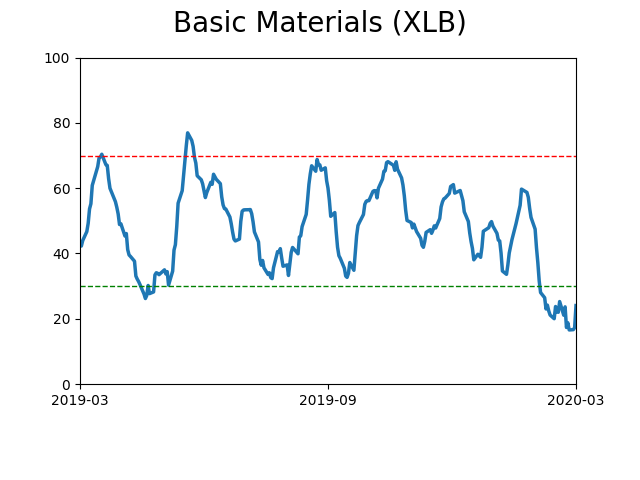
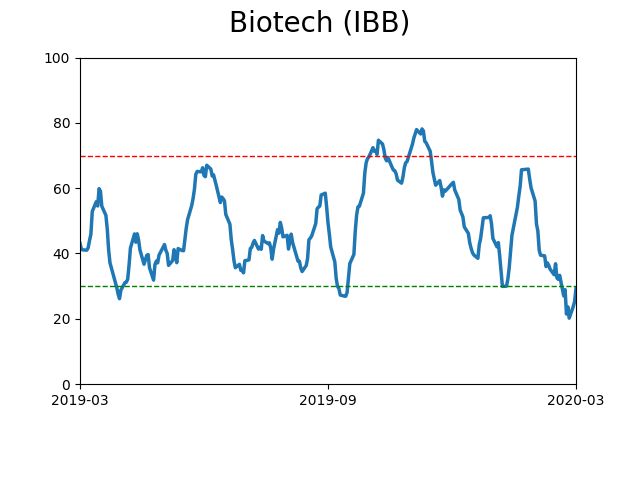
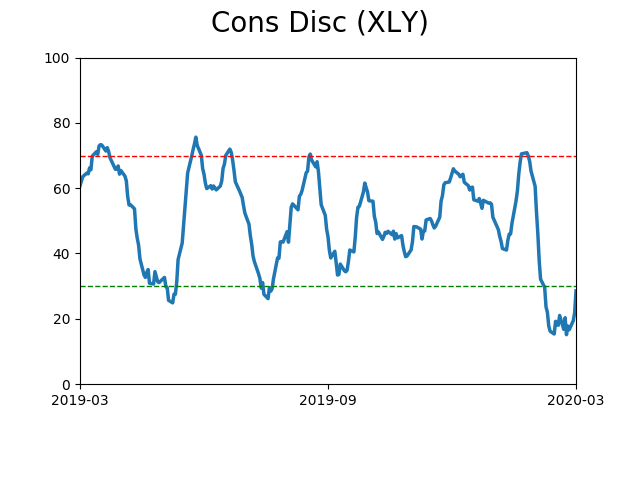
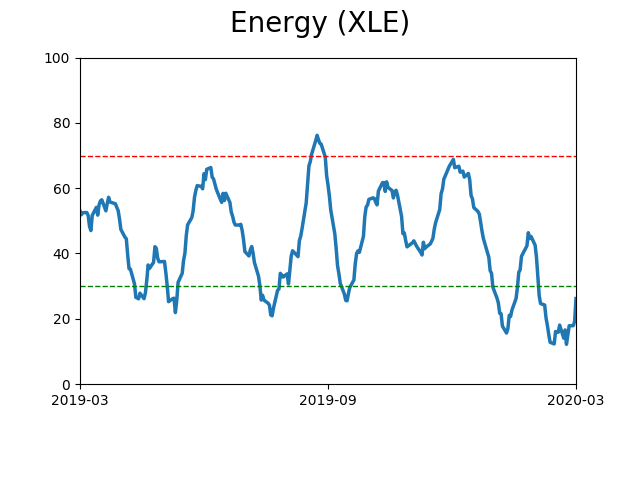
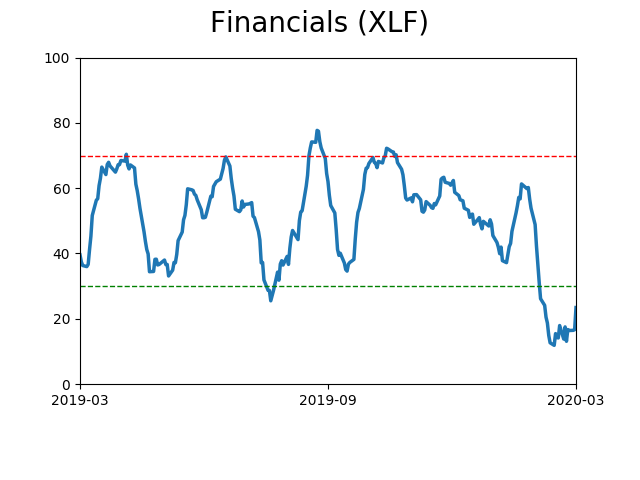
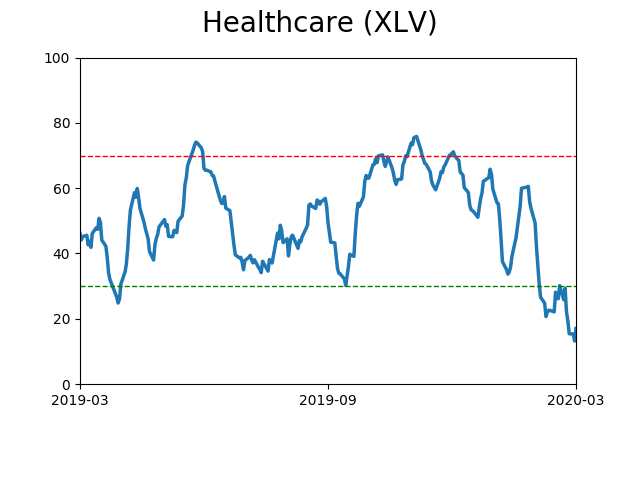
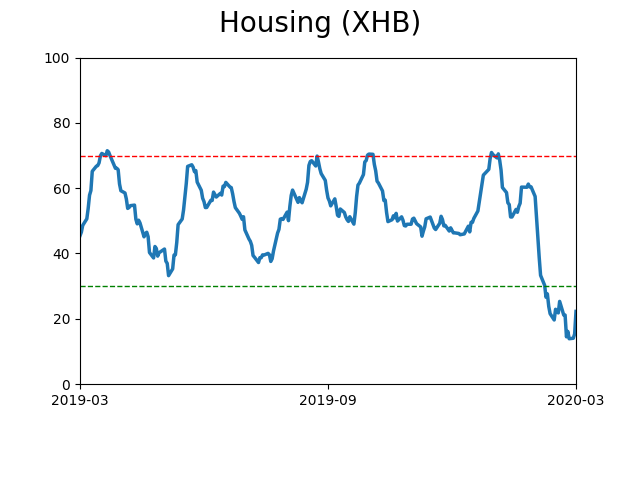
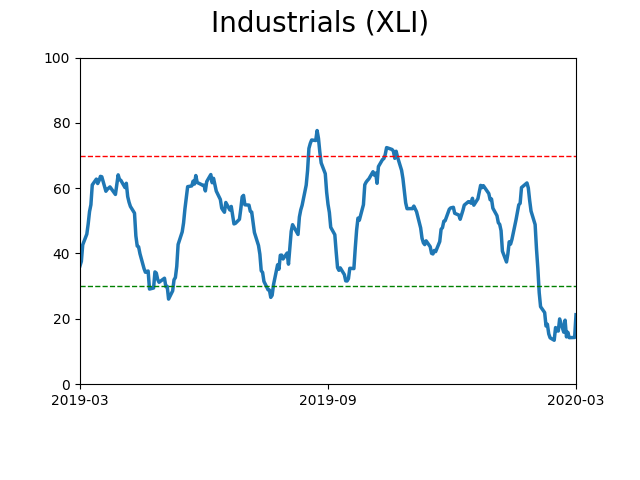
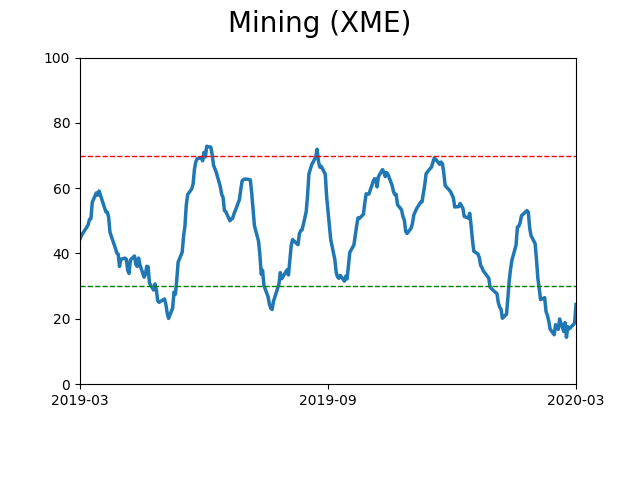
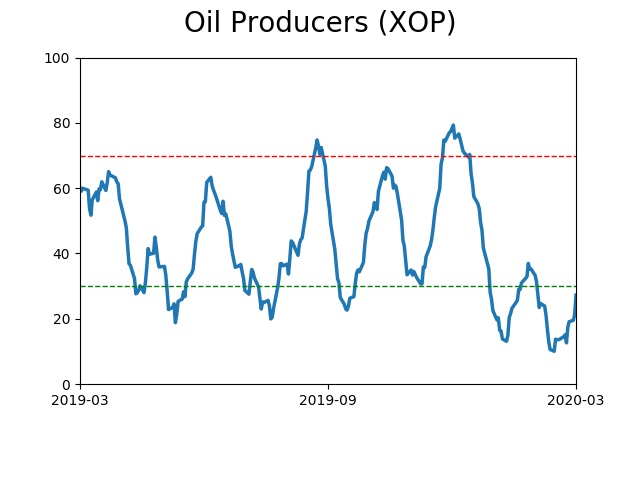
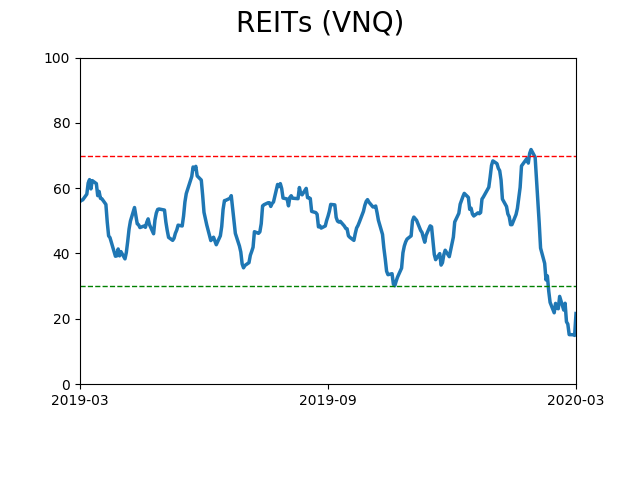
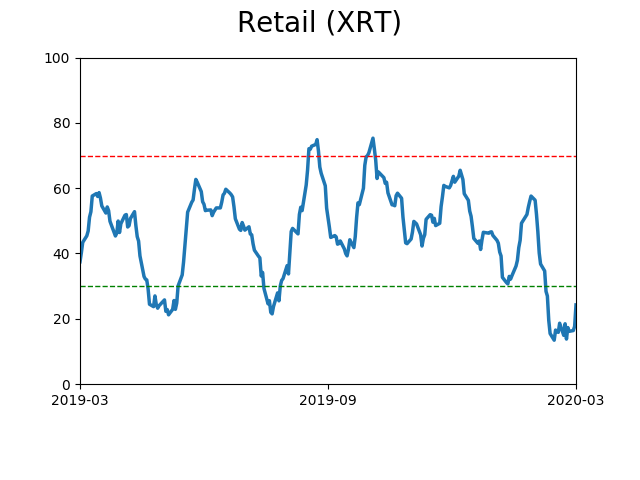
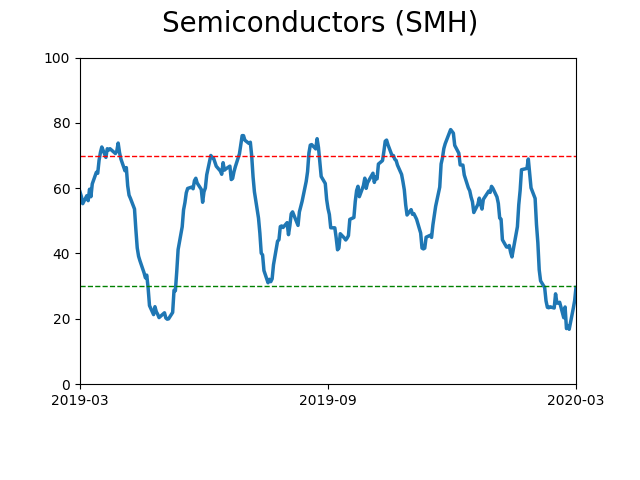
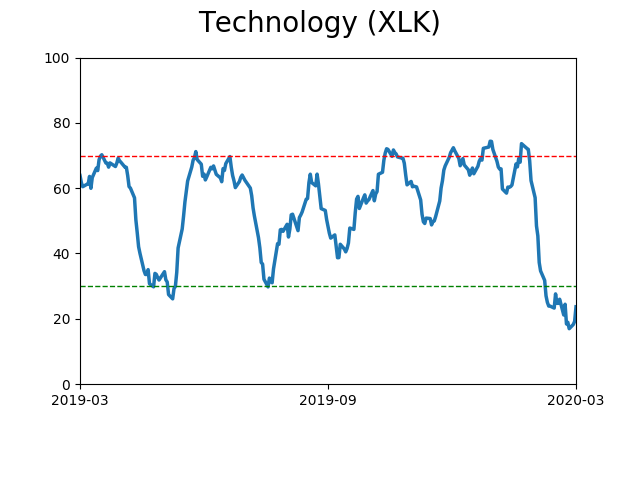
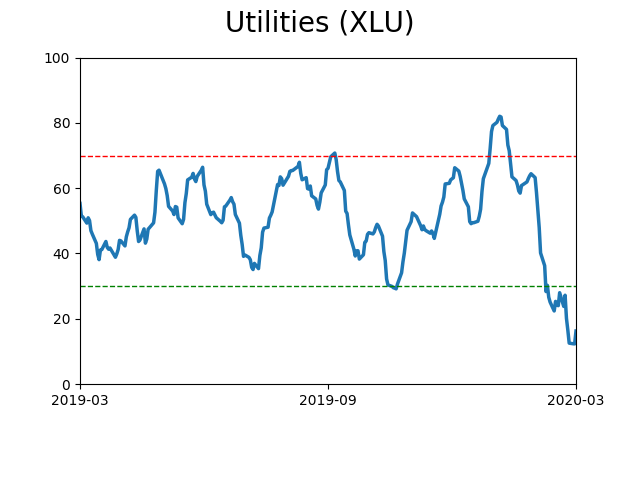
Sector ETF's - 10-Day Moving Average
|
|
|
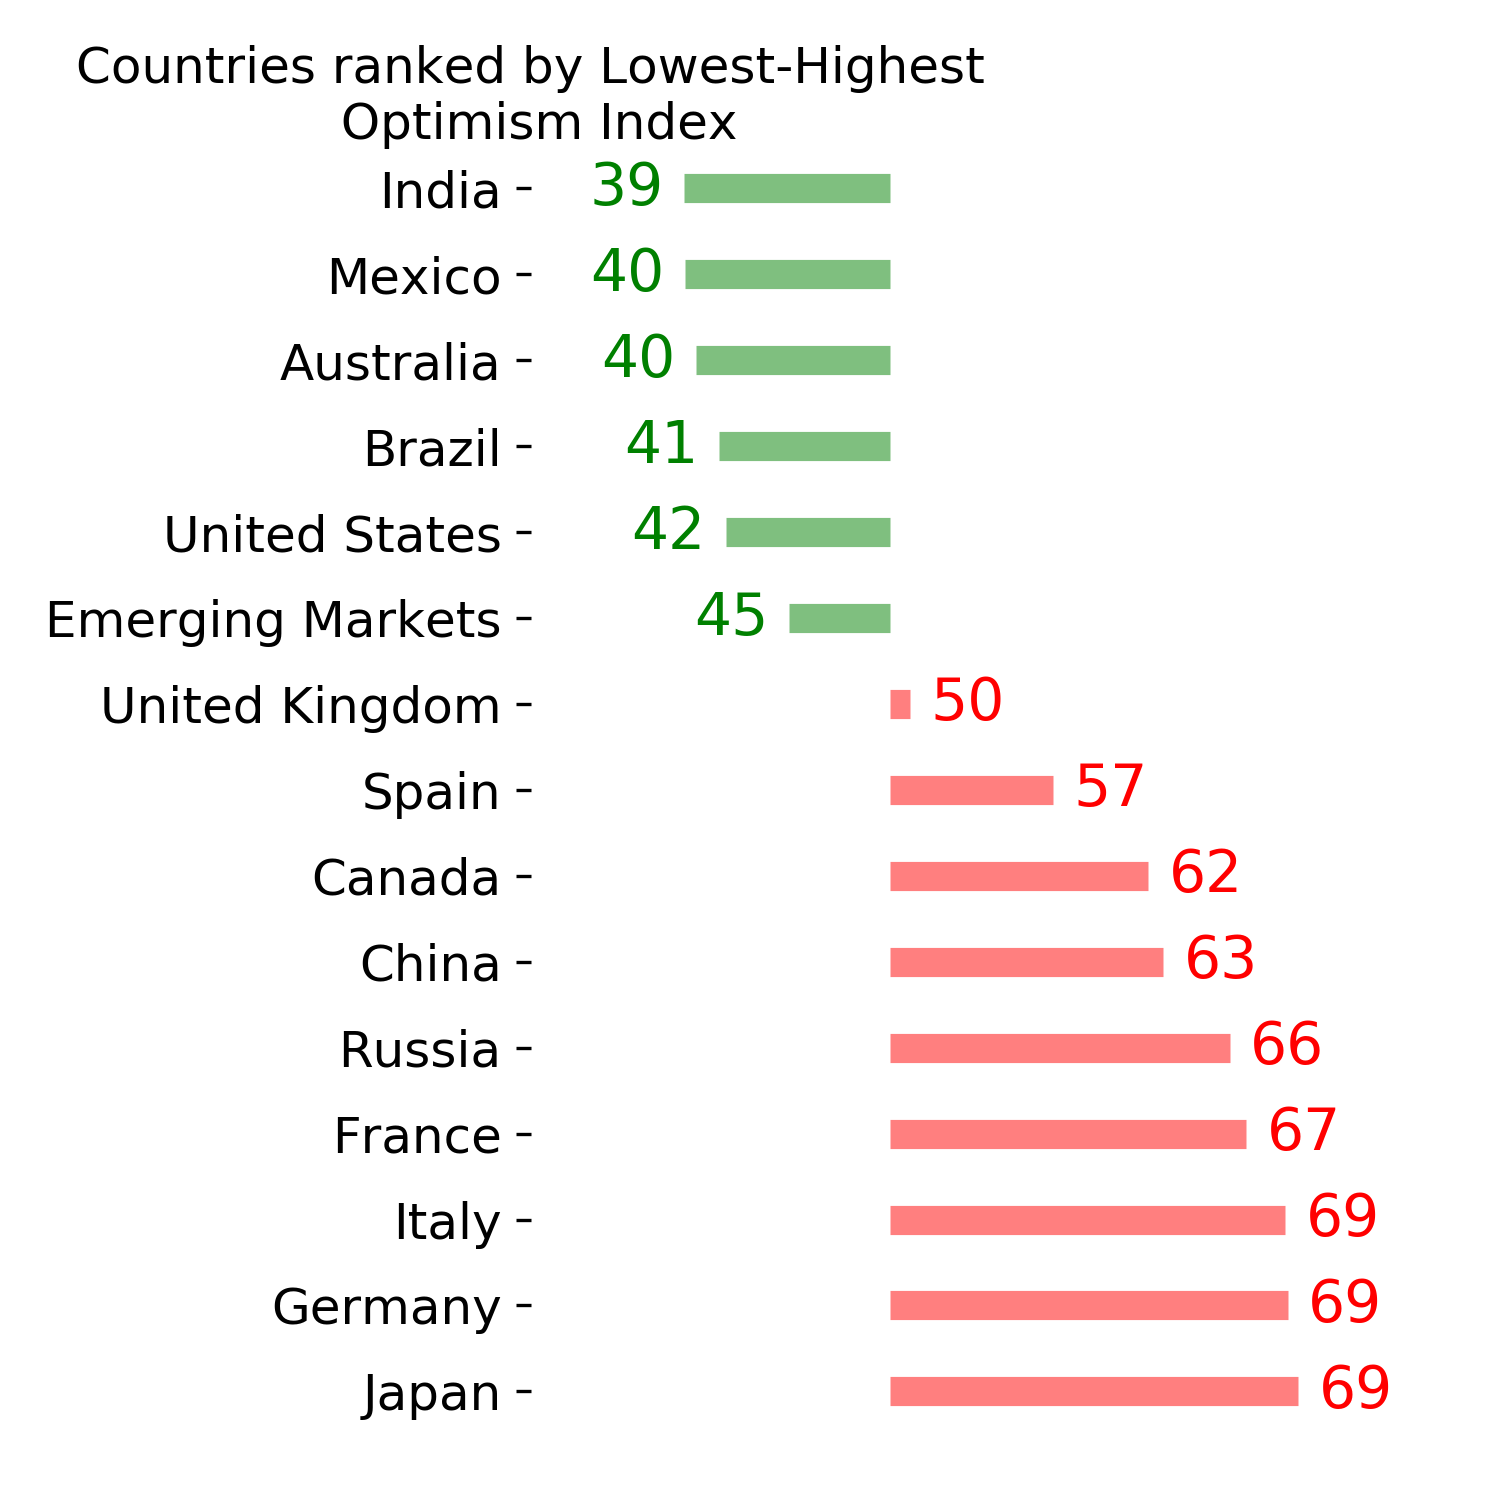
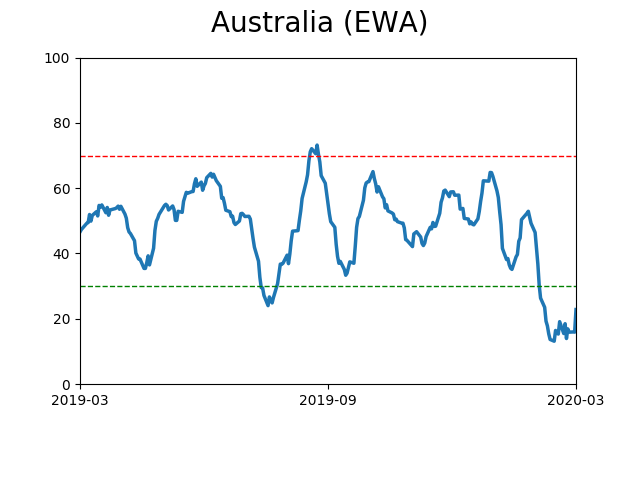
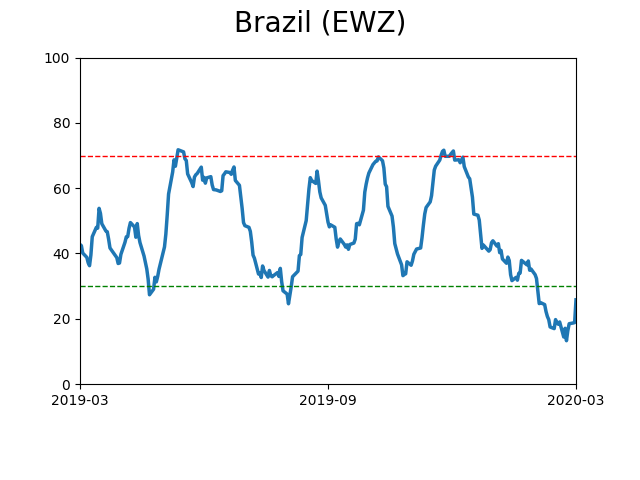
Country ETF's - 10-Day Moving Average
|
|
|
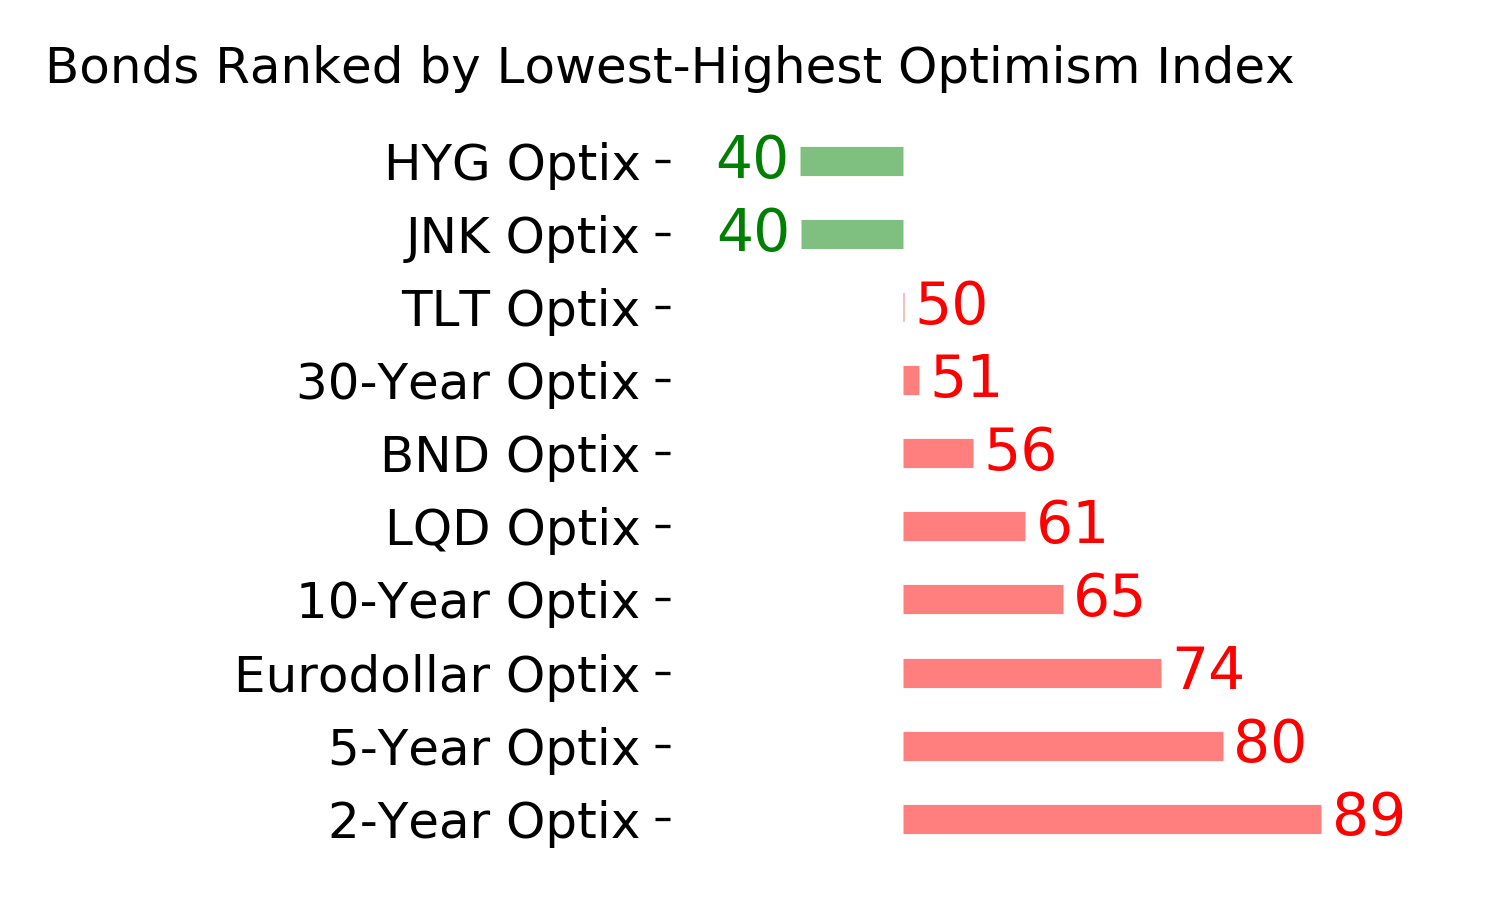
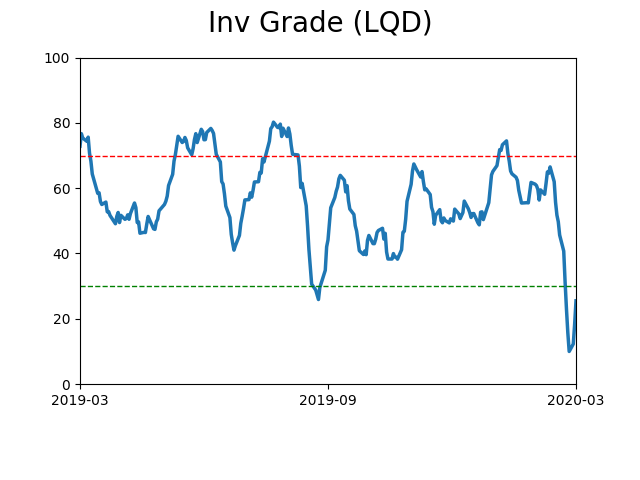
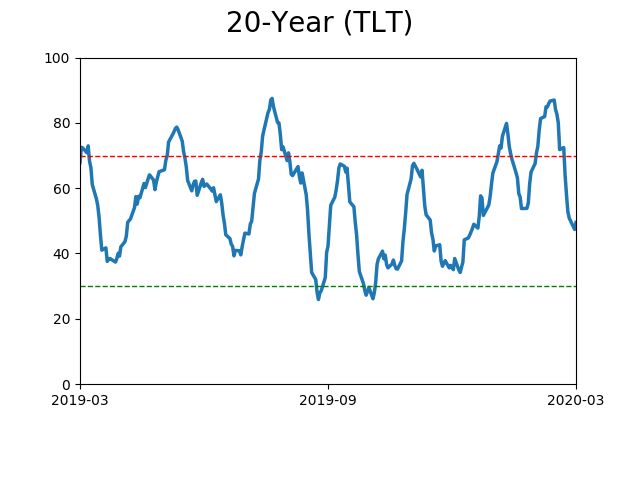
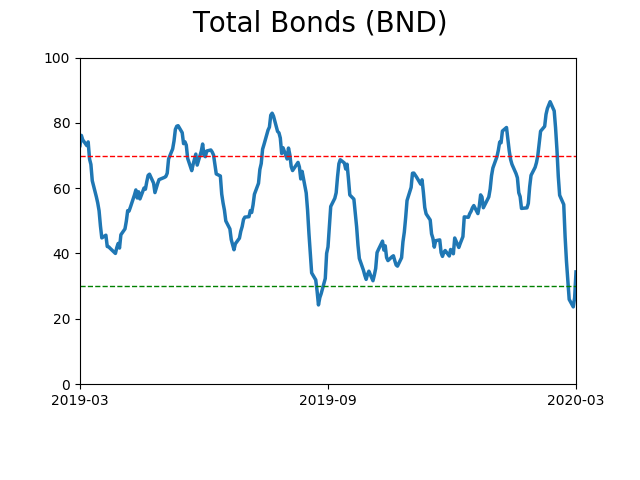
Bond ETF's - 10-Day Moving Average
|
|
|
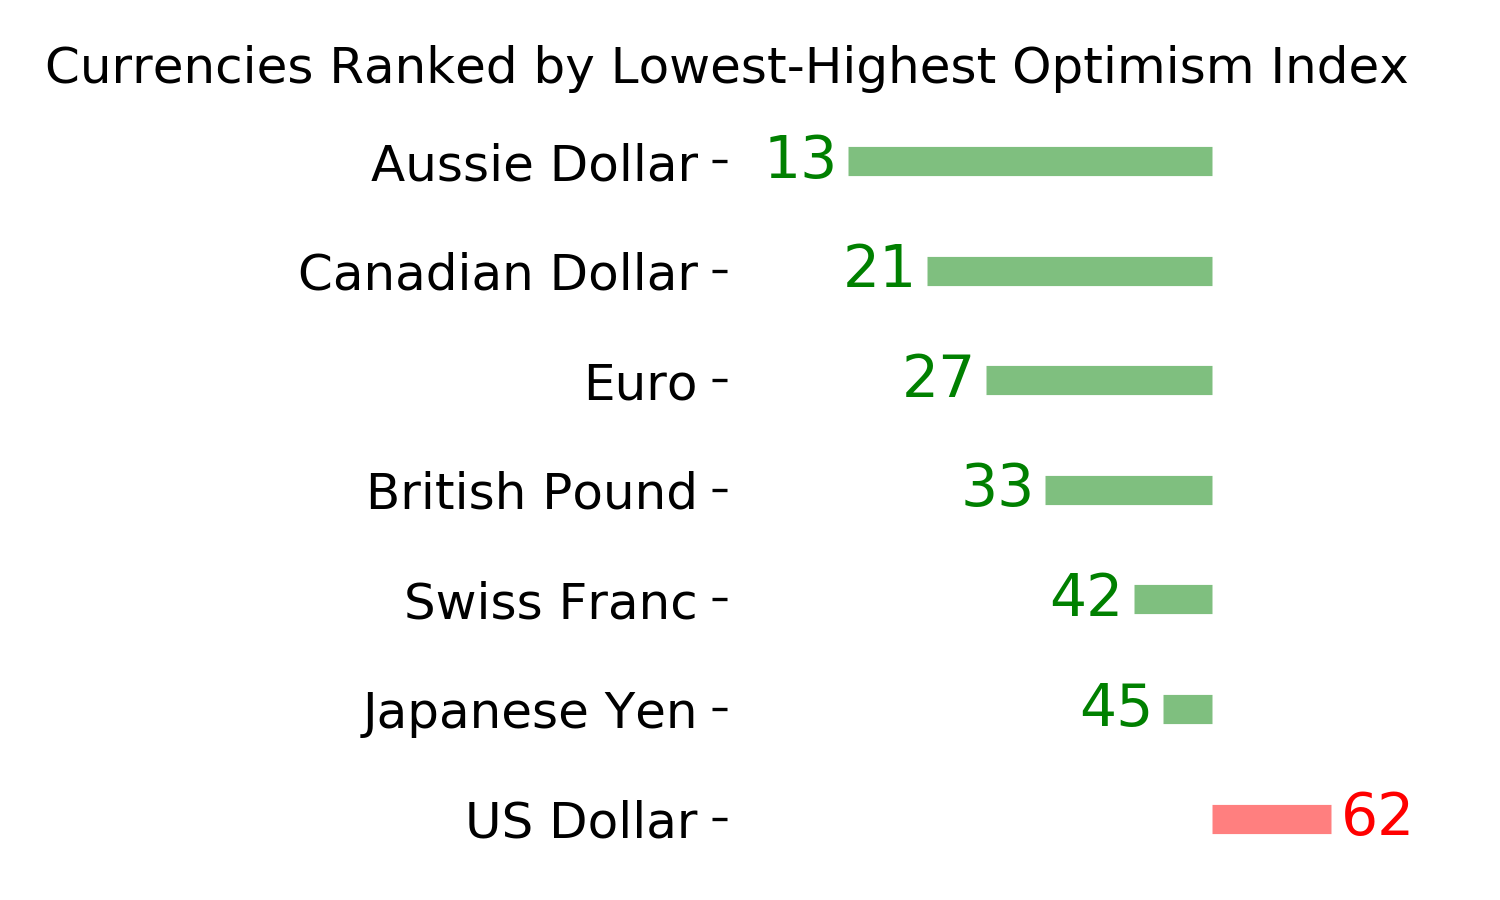
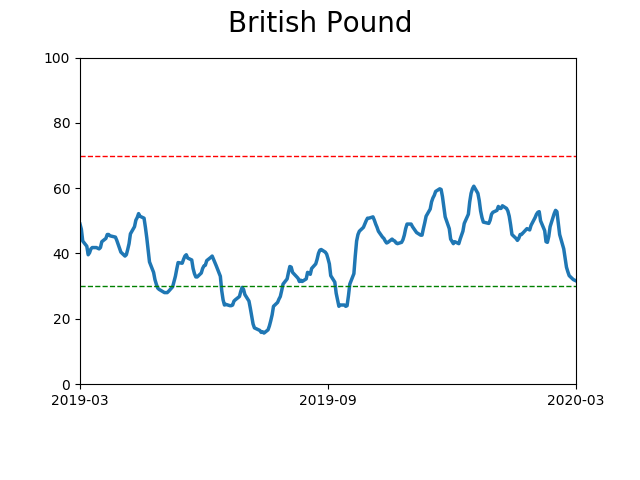
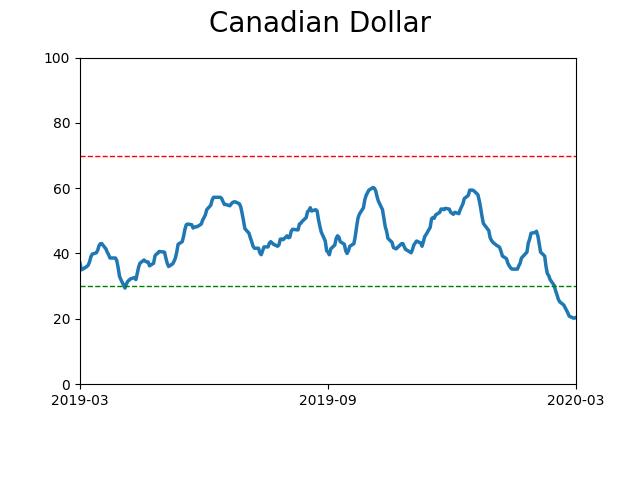
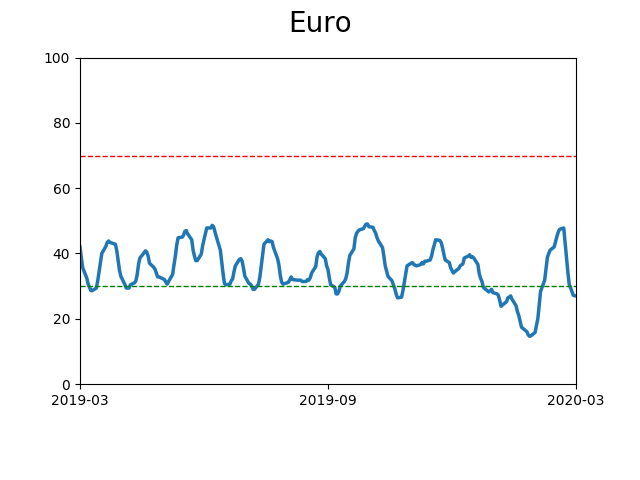
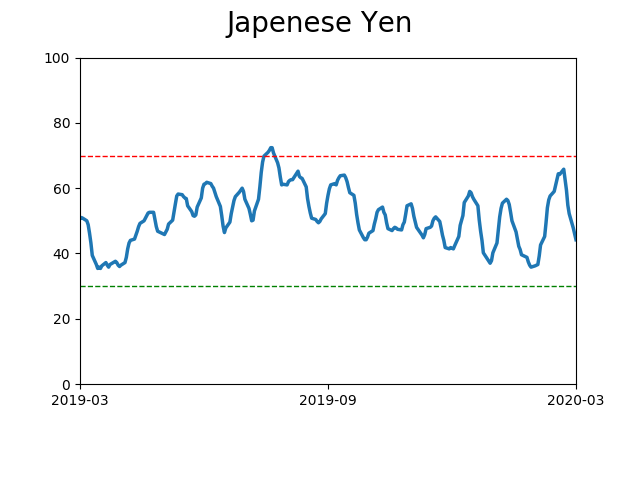
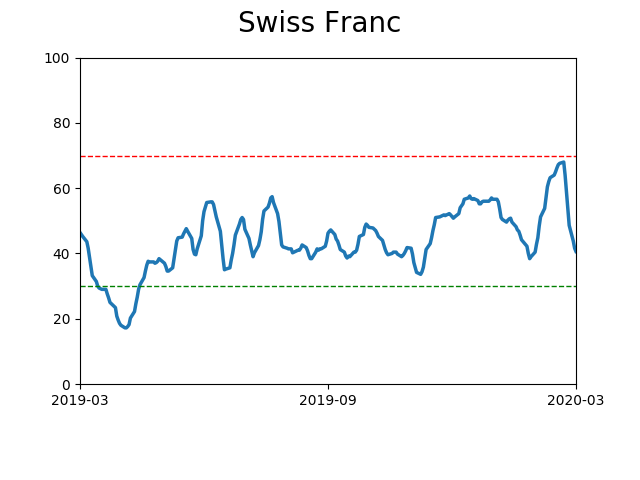
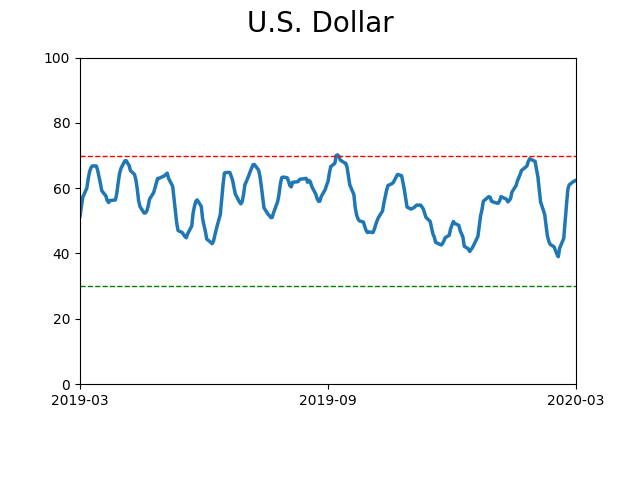
Currency ETF's - 5-Day Moving Average
|
|
|
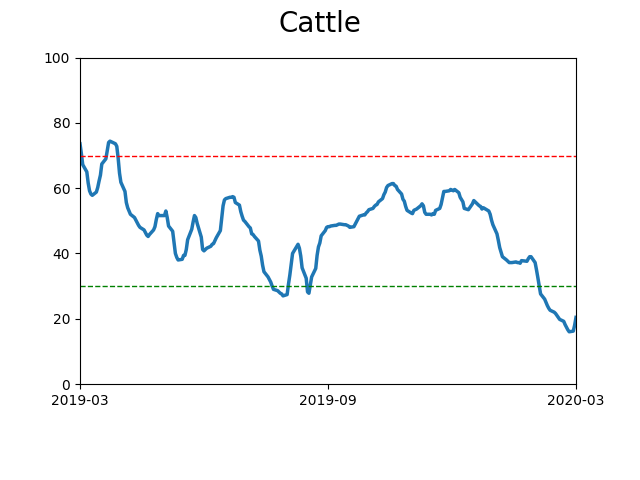
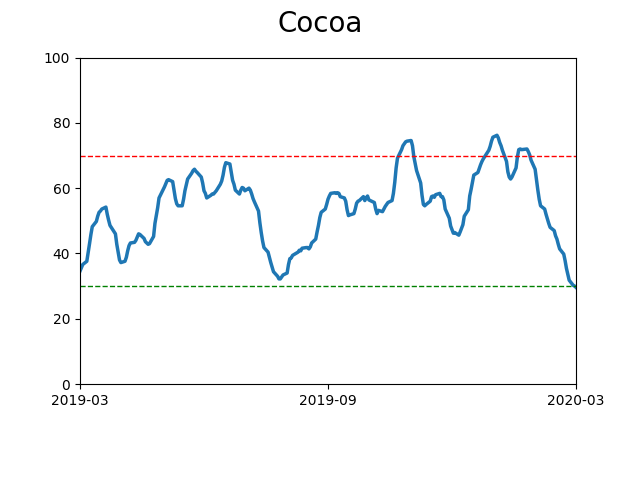
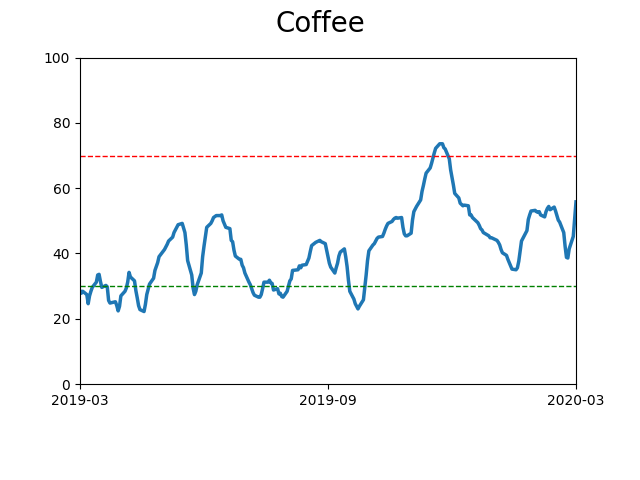
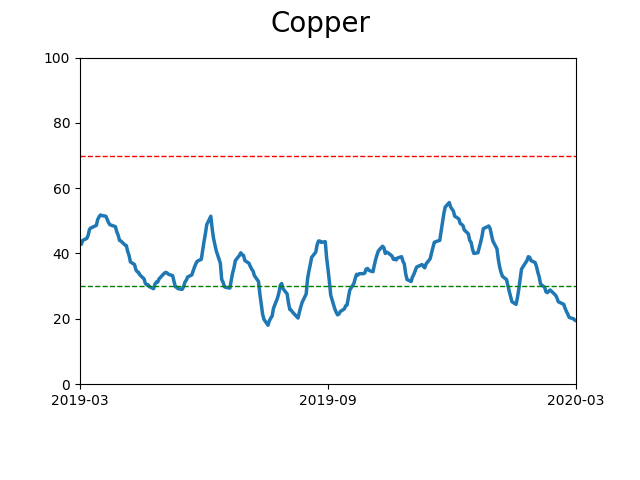
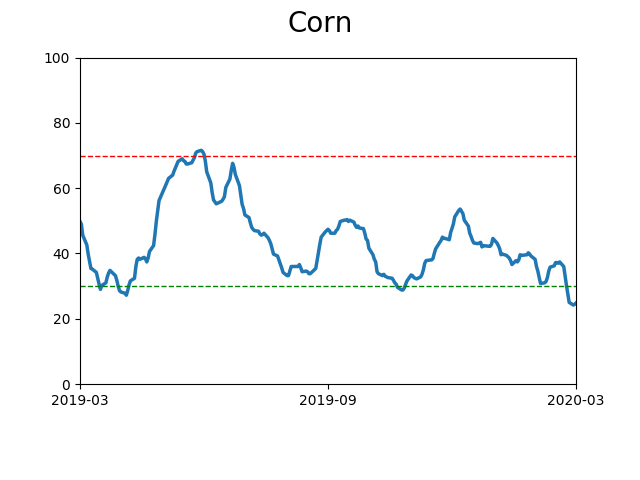
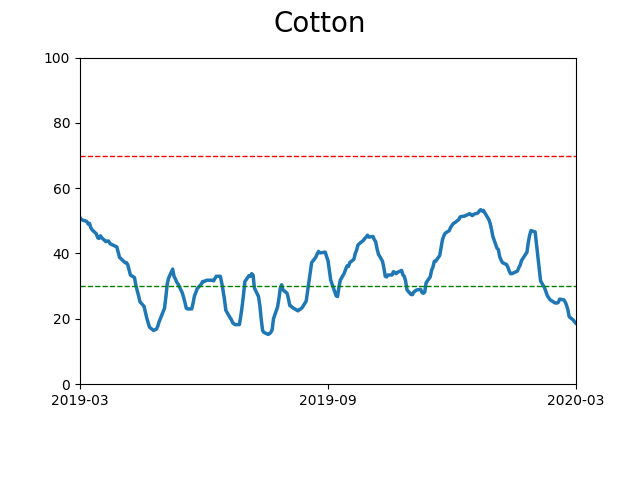
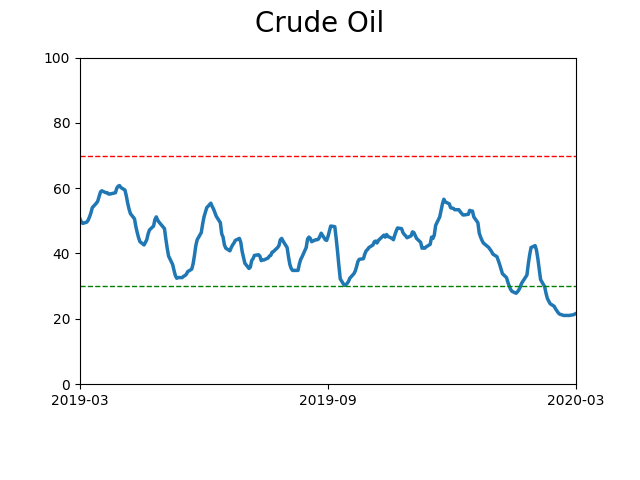
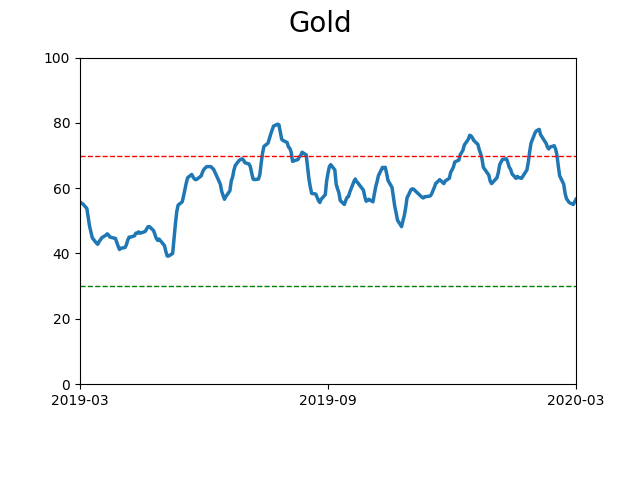
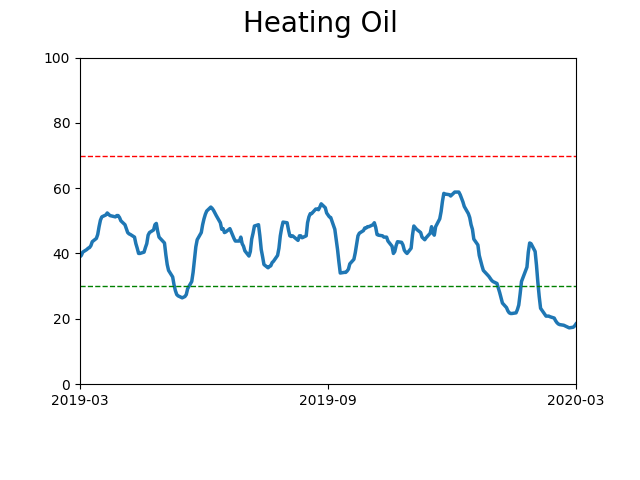
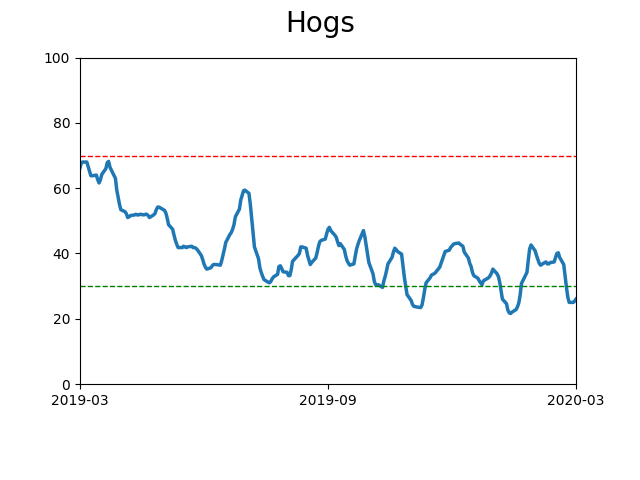
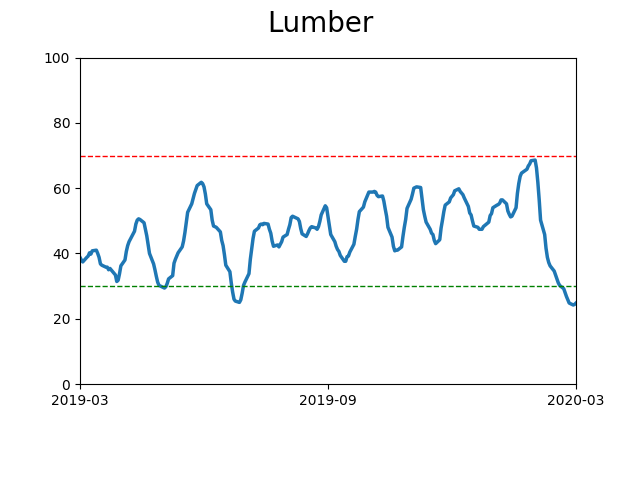
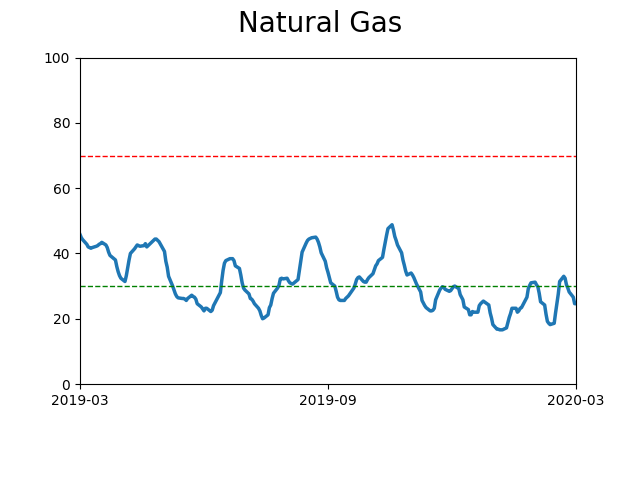
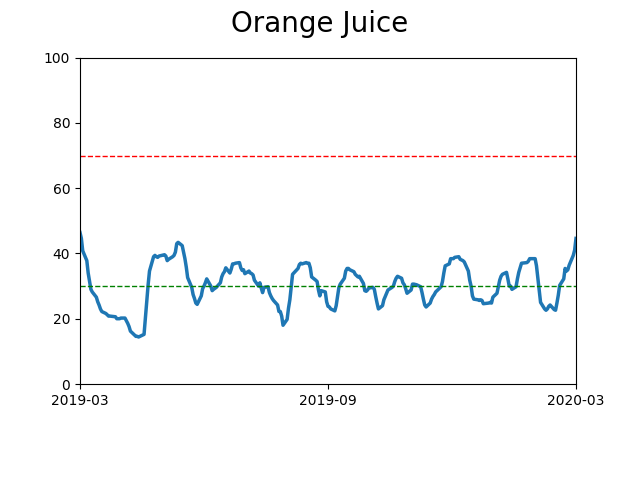
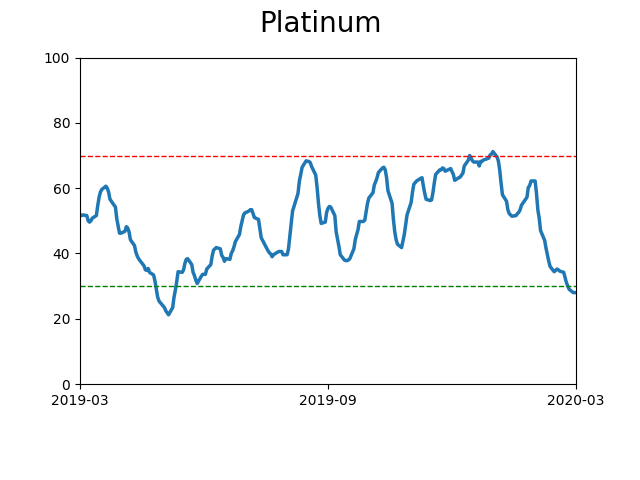
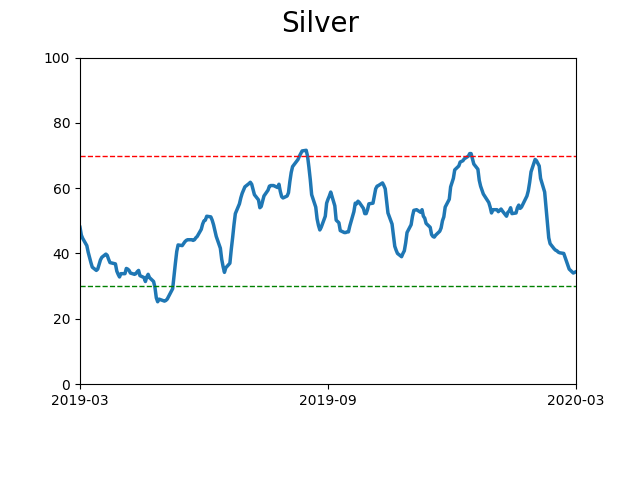
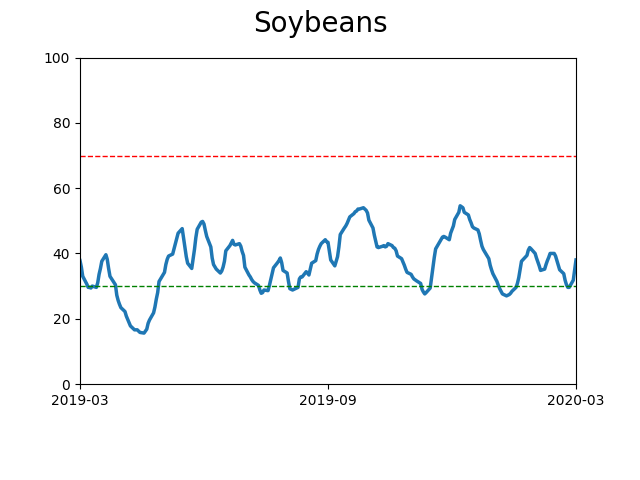
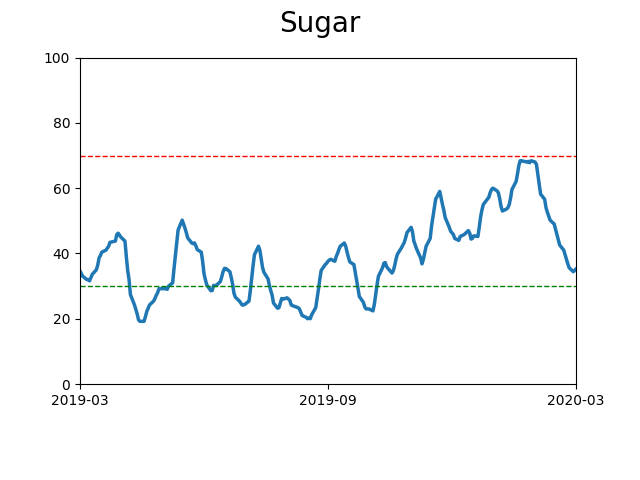
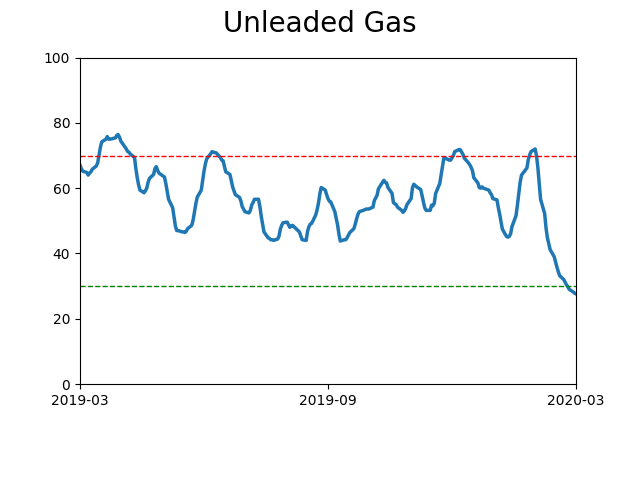
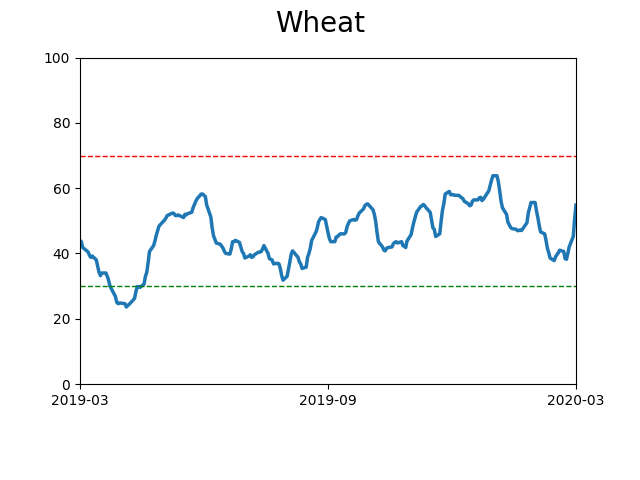
Commodity ETF's - 5-Day Moving Average
|
|