Headlines
|
|
Signs of a surge:
After the attempts at a rally failed yet again on Monday, Tuesday was a welcome relief for many bulls. While every up day in recent weeks has soon been squashed (and may yet again), there were some initial signs that this time is different.
TICK shows record buying pressure:
At the open on Tuesday, we saw a potential switch in sentiment. More than 1,800 securities traded on an uptick, a huge surge from recent sessions and a record high.
Premium Note: Looking for an intraday change:
How traders react after the first pullback from a big gap up open has been a good guide in recent weeks.
Premium Note: Extremely high volume:
Volatility drives volume. As stocks fluctuate significantly every day, volume for various countries' ETFs has also exploded.
Premium Note: Insane volatility across countries:
Volatility in equities across the world over the past month has gone through the roof. In many ways this can only be compared to 1929, 1987, 2001-2002, and 2008.
|
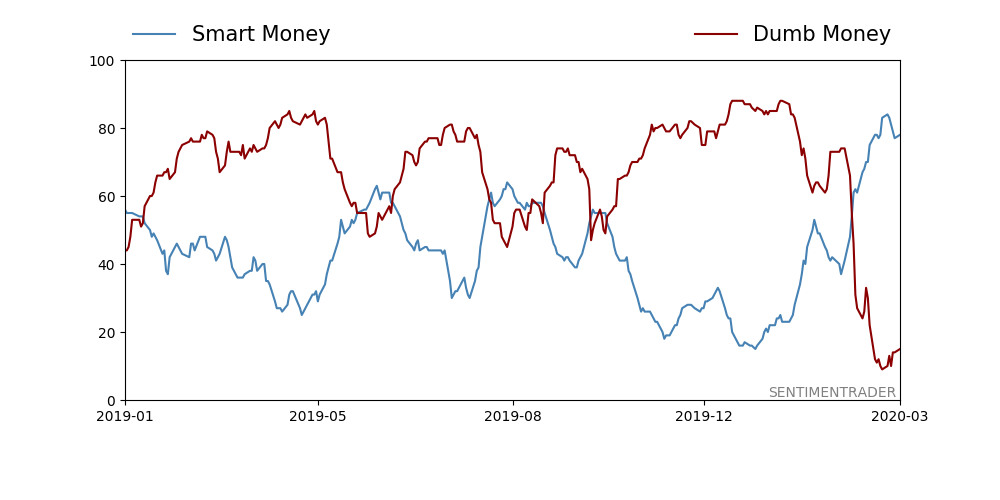
Smart / Dumb Money Confidence
|
Smart Money Confidence: 78.0%
Dumb Money Confidence: 15.0%
|
|
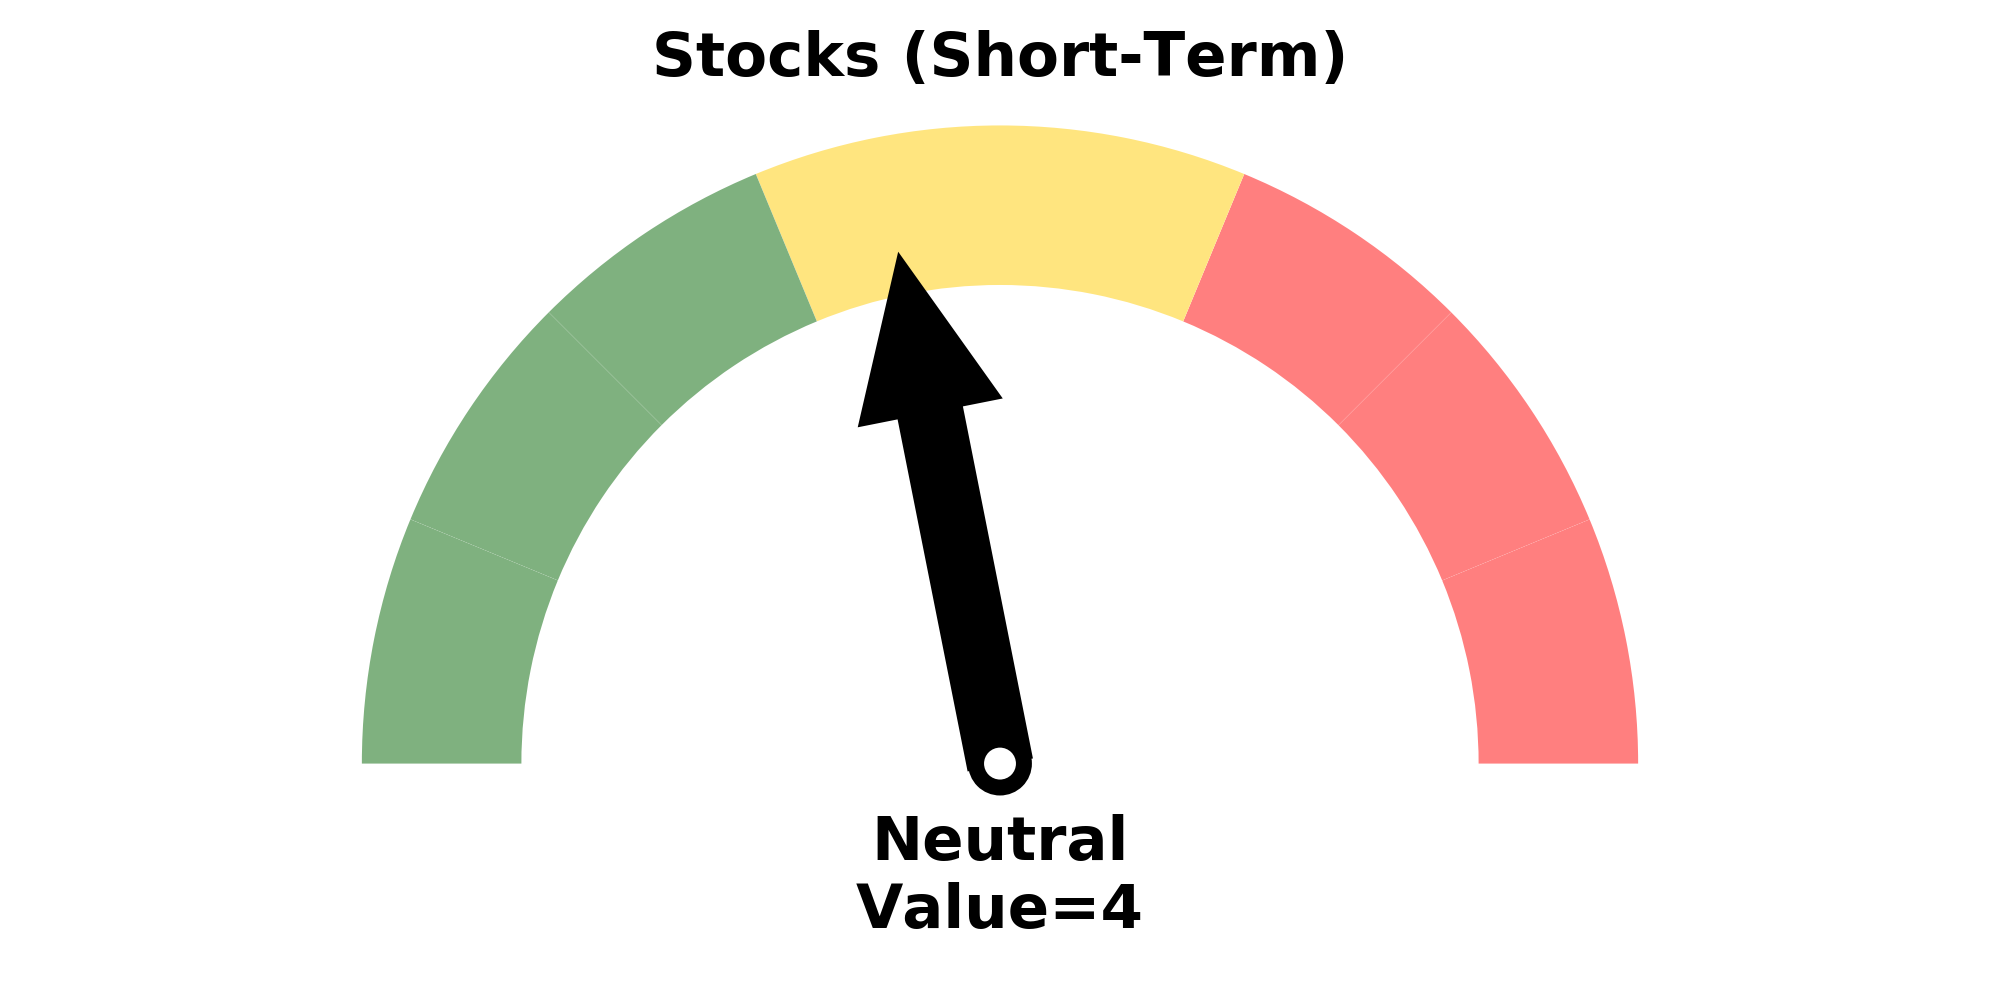
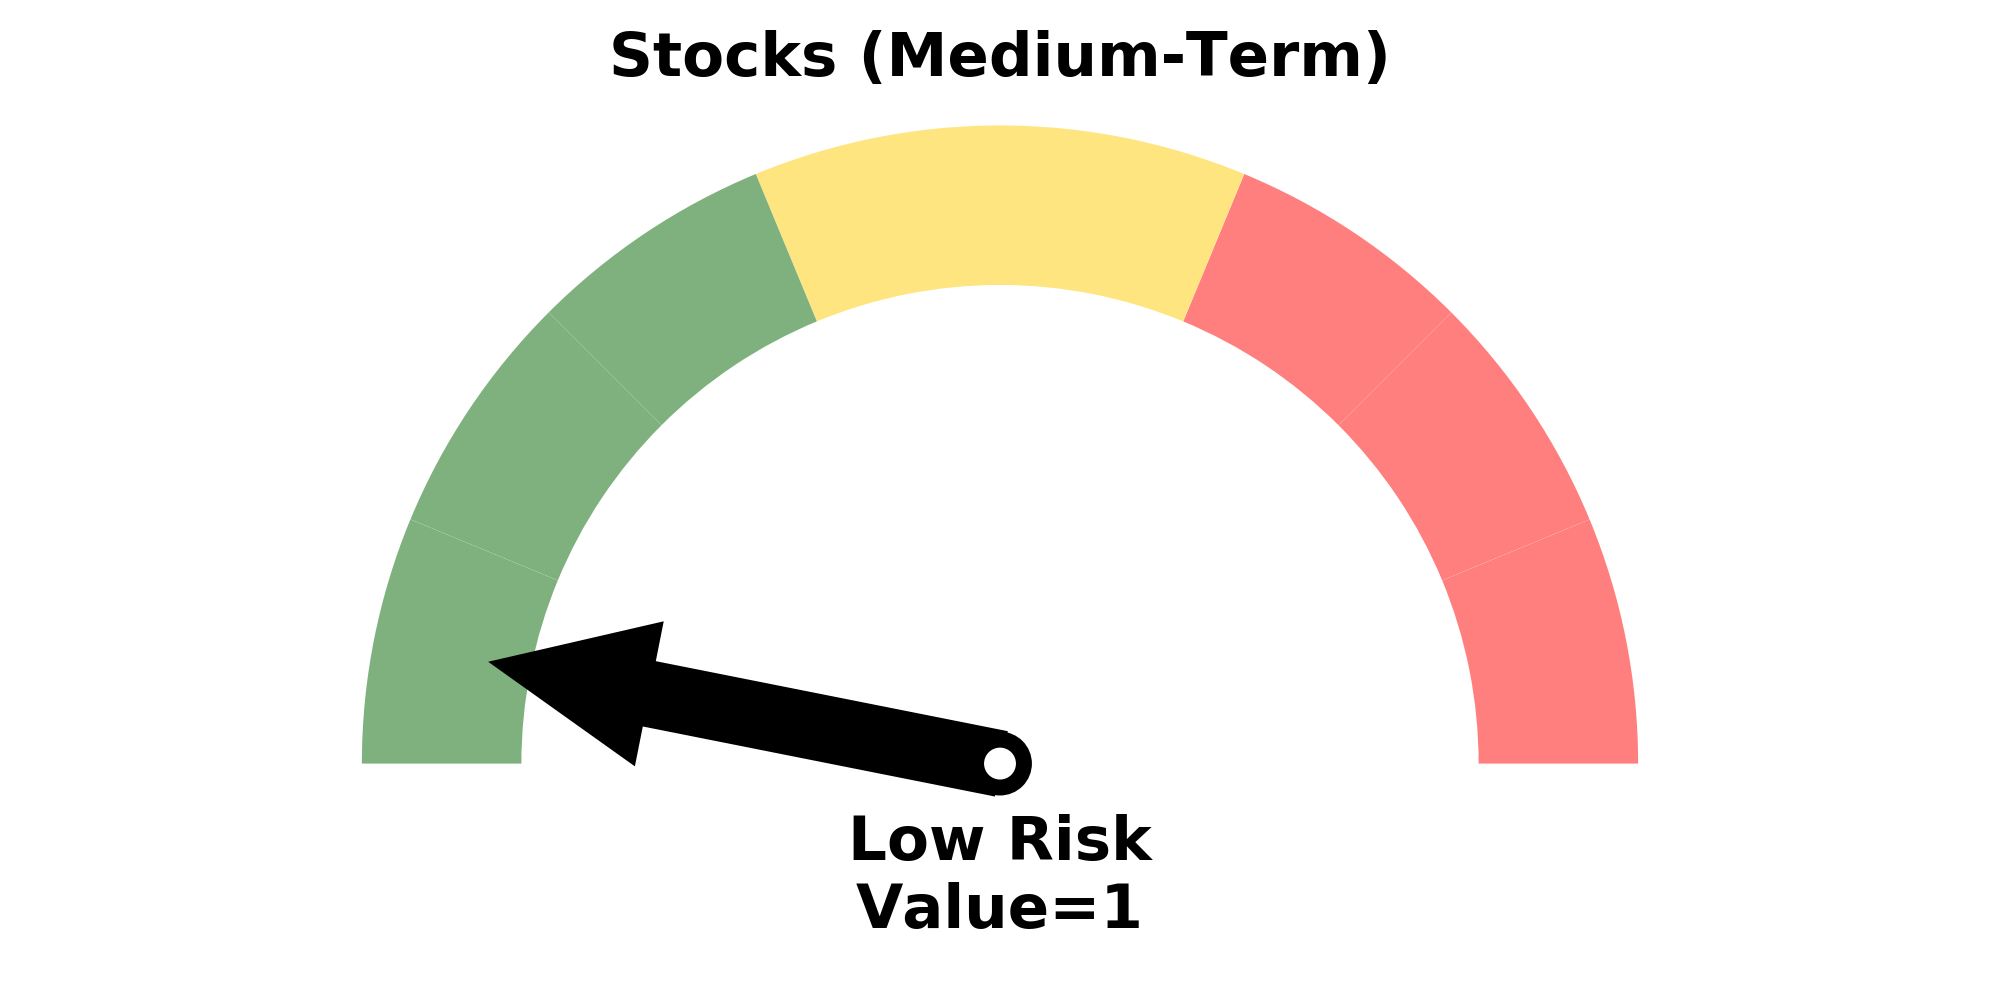
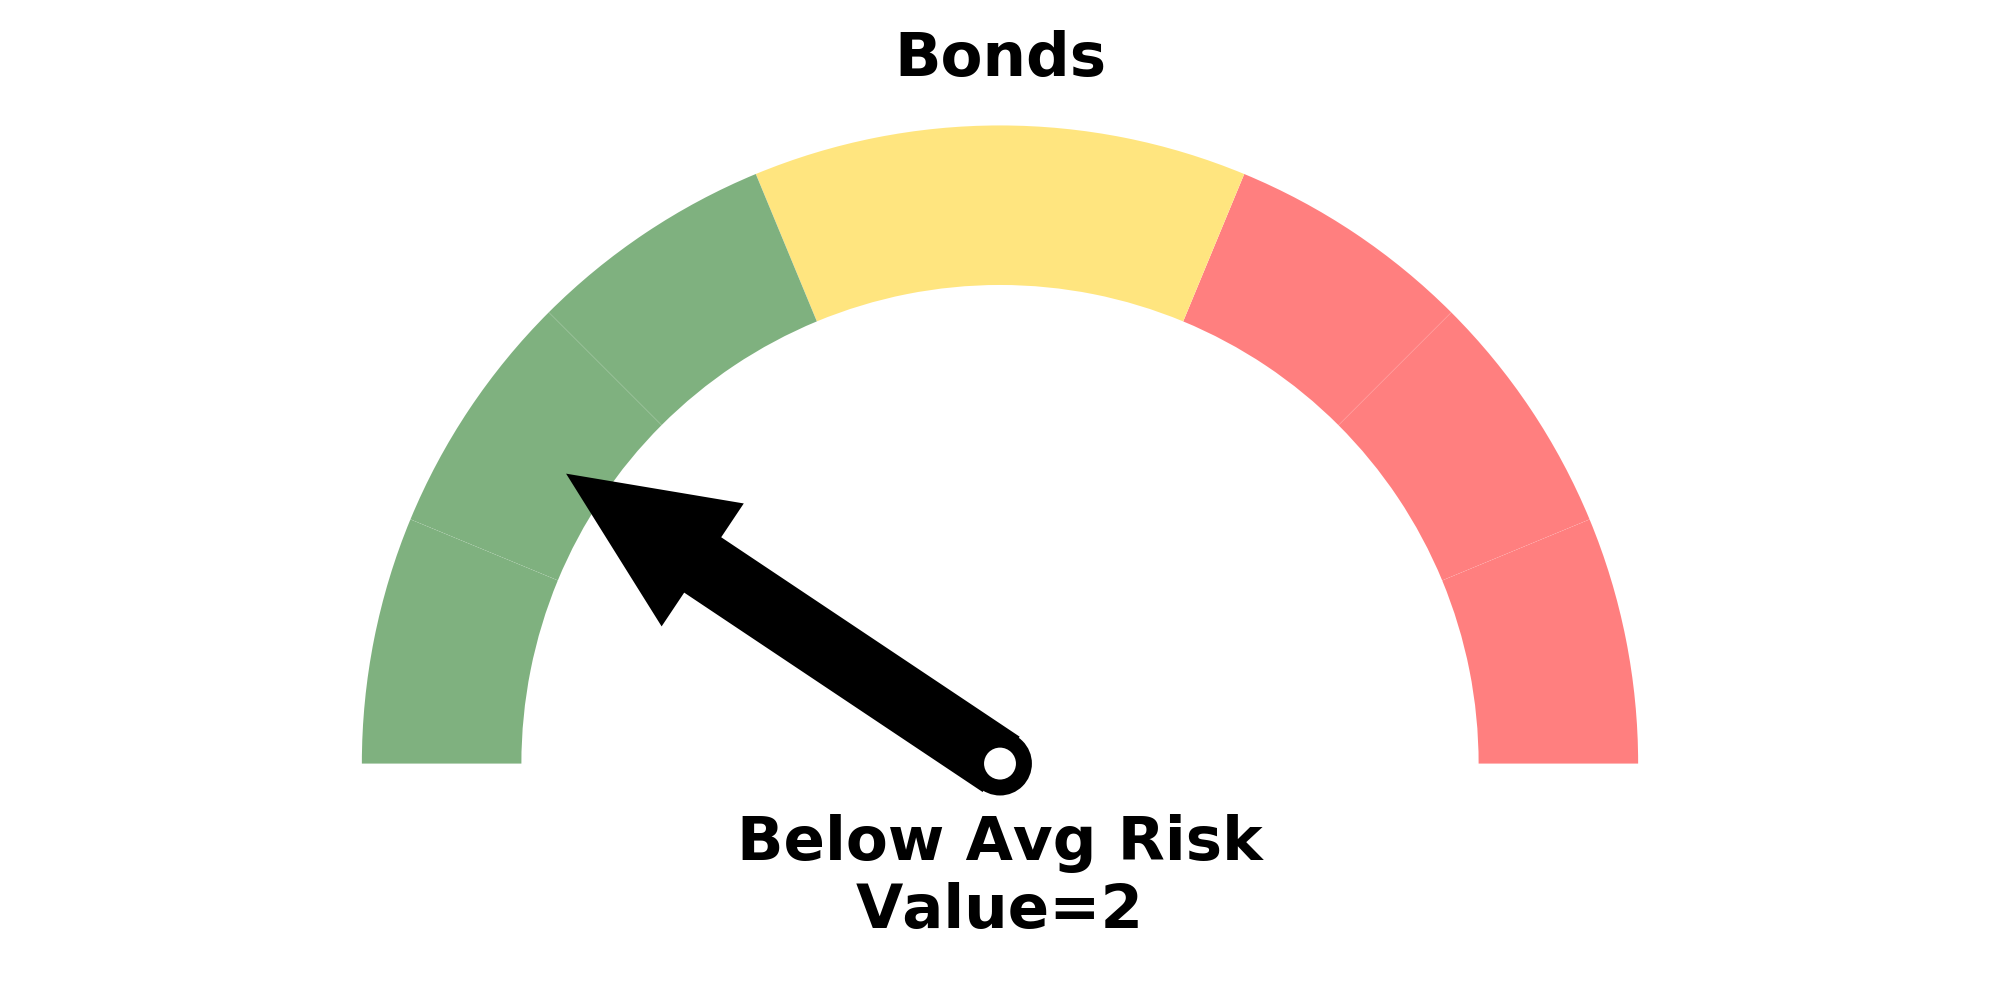
Risk Levels
Research
BOTTOM LINE
At the open on Tuesday, we saw a potential switch in sentiment. More than 1,800 securities traded on an uptick, a huge surge from recent sessions and a record high.
FORECAST / TIMEFRAME
|
Earlier this month, we saw how the selling pressure was massive - historic, even. In some respects, we'd never seen selling intensity that heavy. One of those respects was the tendency to see more than half of the securities on the NYSE trade on a downtick at the same time.
At the open on Tuesday, we finally saw some potential of a switch in sentiment (or computer algorithms, at least). More than 1,800 securities traded on an uptick, a huge surge from recent sessions.
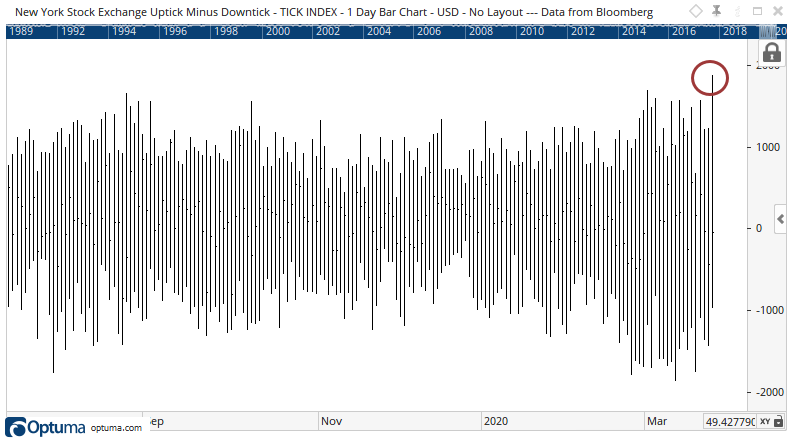
Not just recent sessions, though. It was also the most skewed positive TICK ever.
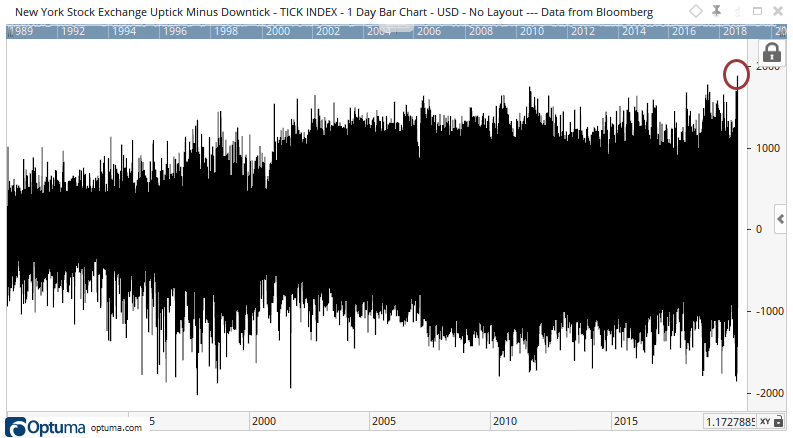
Regardless of what happens into the close, we at least know that today's intraday high TICK accounted for more than 60% of all issues traded (also a record high). Since this is coming on the heels of a 52-week low on Monday, it has the potential to shift sentiment, which historically is what happened, even when looking at smaller TICK readings.
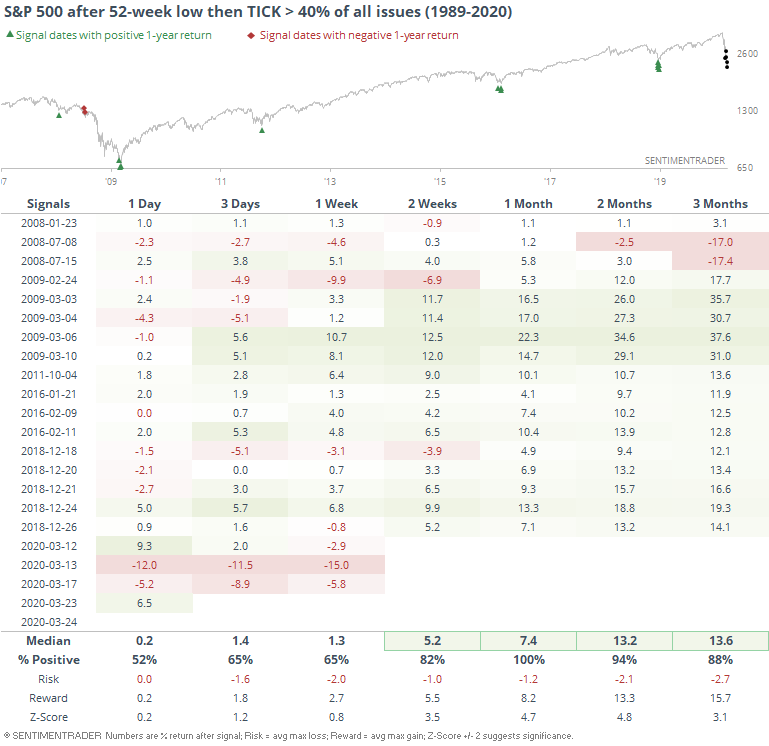
This never happened prior to 2008, even though the data goes back to 1990ish.
A month after every one of the dates when it did manage to trigger, the S&P 500 showed a positive return. A few in 2008 had some extreme volatility, but showed at least a modest gain over the next month. A couple from July that year then quickly failed.
The most distressing part of this is that it also triggered four other times just this month, and every one of those have shown a loss over the next week. We're in a whole other ballgame when it comes to volatility. It seems like Tuesday's surge should be enough to make short-sellers fearful, but we still have to break the pattern of the past few weeks when every green shoot immediately gets trampled.
BOTTOM LINE
After the attempts at a rally failed yet again on Monday, Tuesday was a welcome relief for many bulls. While every up day in recent weeks has soon been squashed (and may yet again), there were some initial signs that this time is different.
FORECAST / TIMEFRAME
SPY -- Up, Long-Term
|
After the attempts at a rally failed yet again on Monday, Tuesday was a welcome relief for many bulls. While every up day in recent weeks has soon been squashed (and may yet again), there were some initial signs that this time is different.
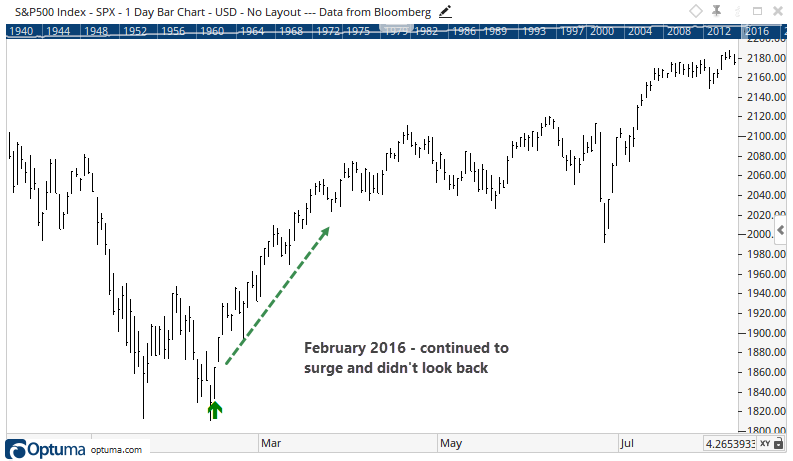
For one, the S&P 500 cycled from a multi-year low to erase at least a few days' worth of losses. The other big up days recently didn't have enough oomph to do that.
This was usually a decent sign going forward, with 1932 and 2008 being the big exceptions.
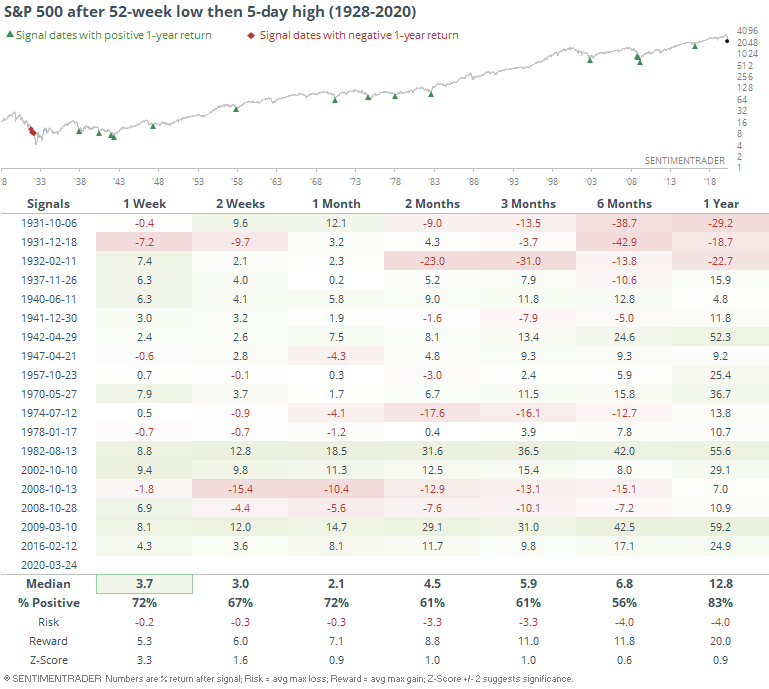
If we just take the 1930s out of the picture (a sin, I know), then the one-year returns improve dramatically, with no losses.
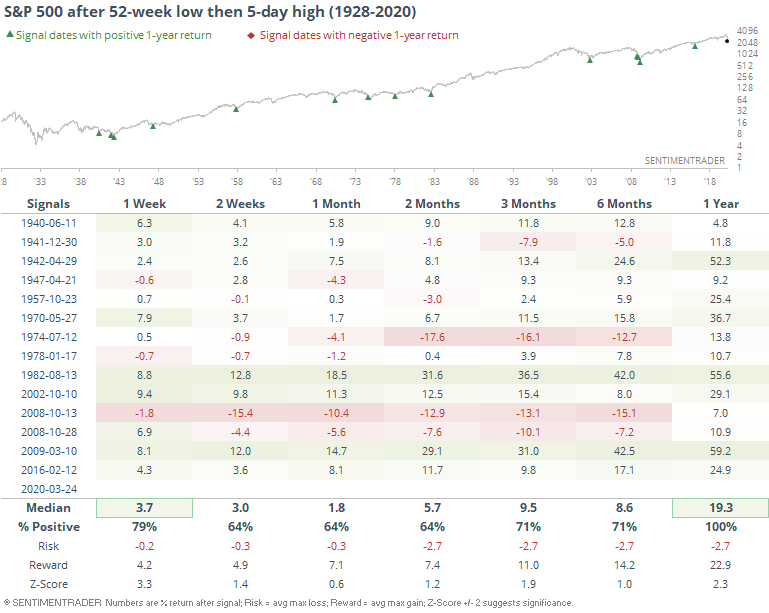
The signals over the past 20 years mostly took off and never looked back, except for those two in 2008. We'll look at those last.
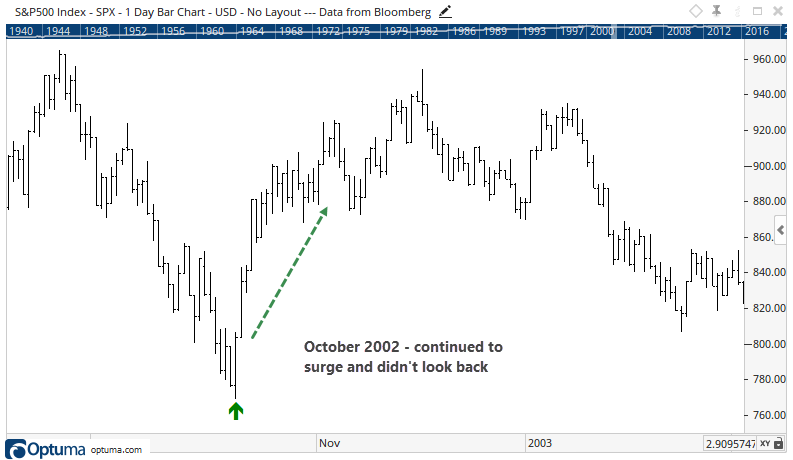
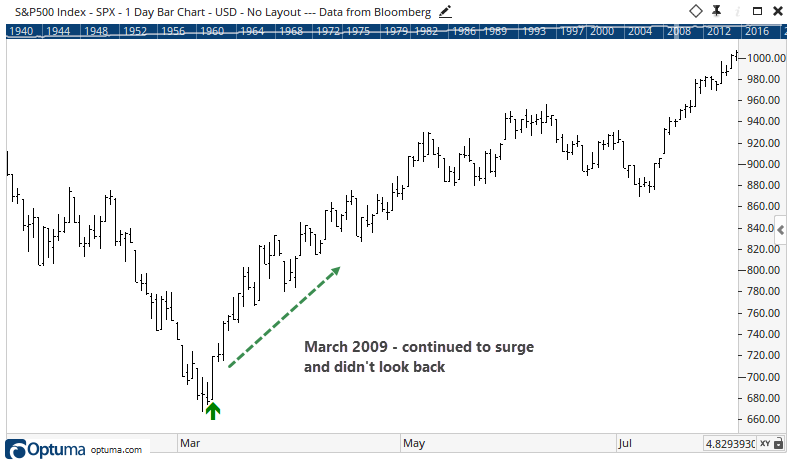
Those two failures in 2008 looked a lot different. Relatively soon after the surge, prices fell back well into the range of the big up day.
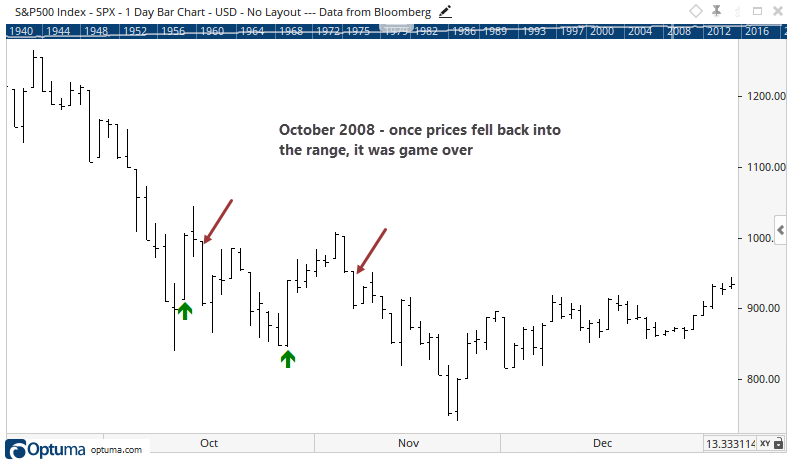
Granted, we're dealing with a tiny sample size as usual lately, but it suggests that bulls do not want to see buyers give up the ghost now. If they have enough power to keep pushing higher, it bodes well.
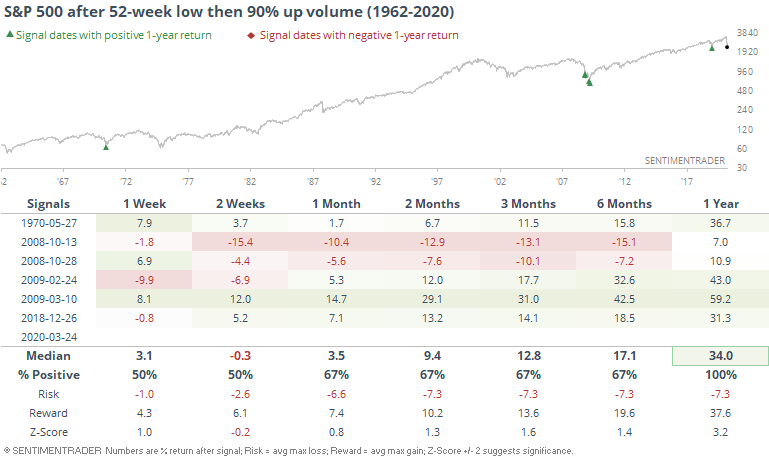
It's also notable that activity on Tuesday was heavily skewed toward winners. For the first time in this cycle, there was a 90% up volume day after stocks had just hit a fresh low.
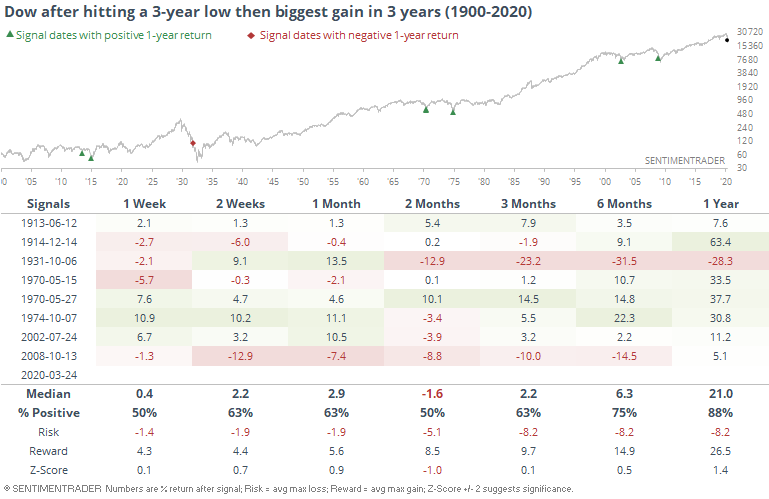
That should be the case on a day stocks make a historic jump. For the Dow Industrials, it was one of the biggest gains since 1900.
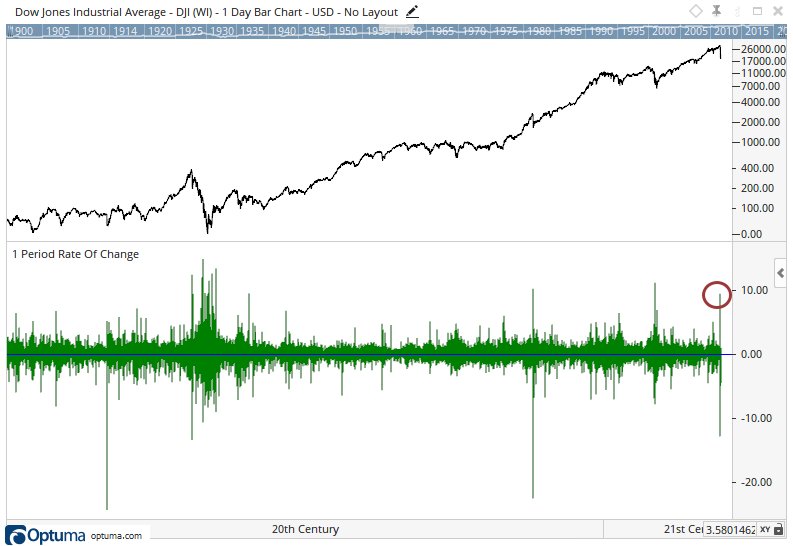
Big gains themselves were not necessarily an all-clear sign, especially short-term, for the Dow. But a year later, the index showed gains every time except for the 1930s.
Overall, the buying interest and close at the highs on Tuesday could be enough to finally change sentiment enough to string together some up days. We'd have to in order to change the pattern over the past few weeks. And if buyers can do that, historical precedents argue strongly that the worst of the selling is behind us, at least for a couple of months.
Active Studies
| Time Frame | Bullish | Bearish | | Short-Term | 0 | 1 | | Medium-Term | 14 | 14 | | Long-Term | 25 | 3 |
|
Indicators at Extremes
Portfolio
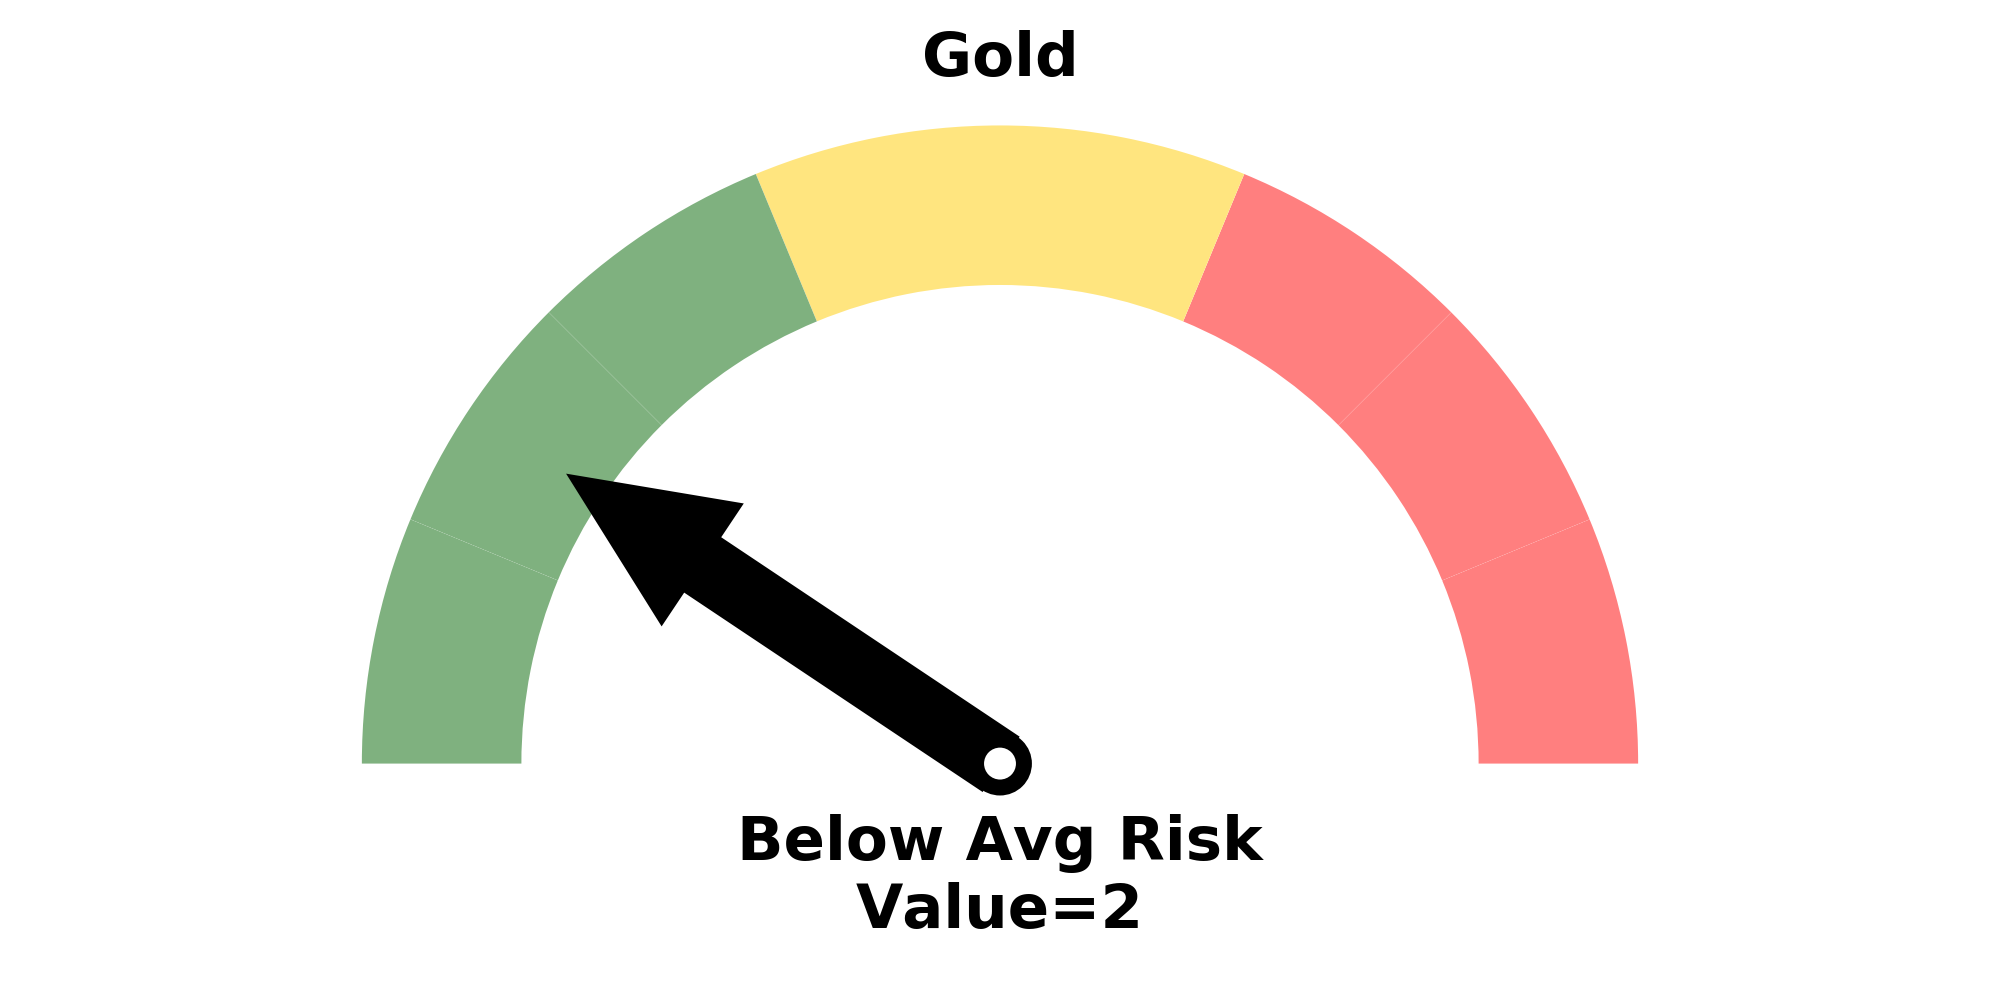
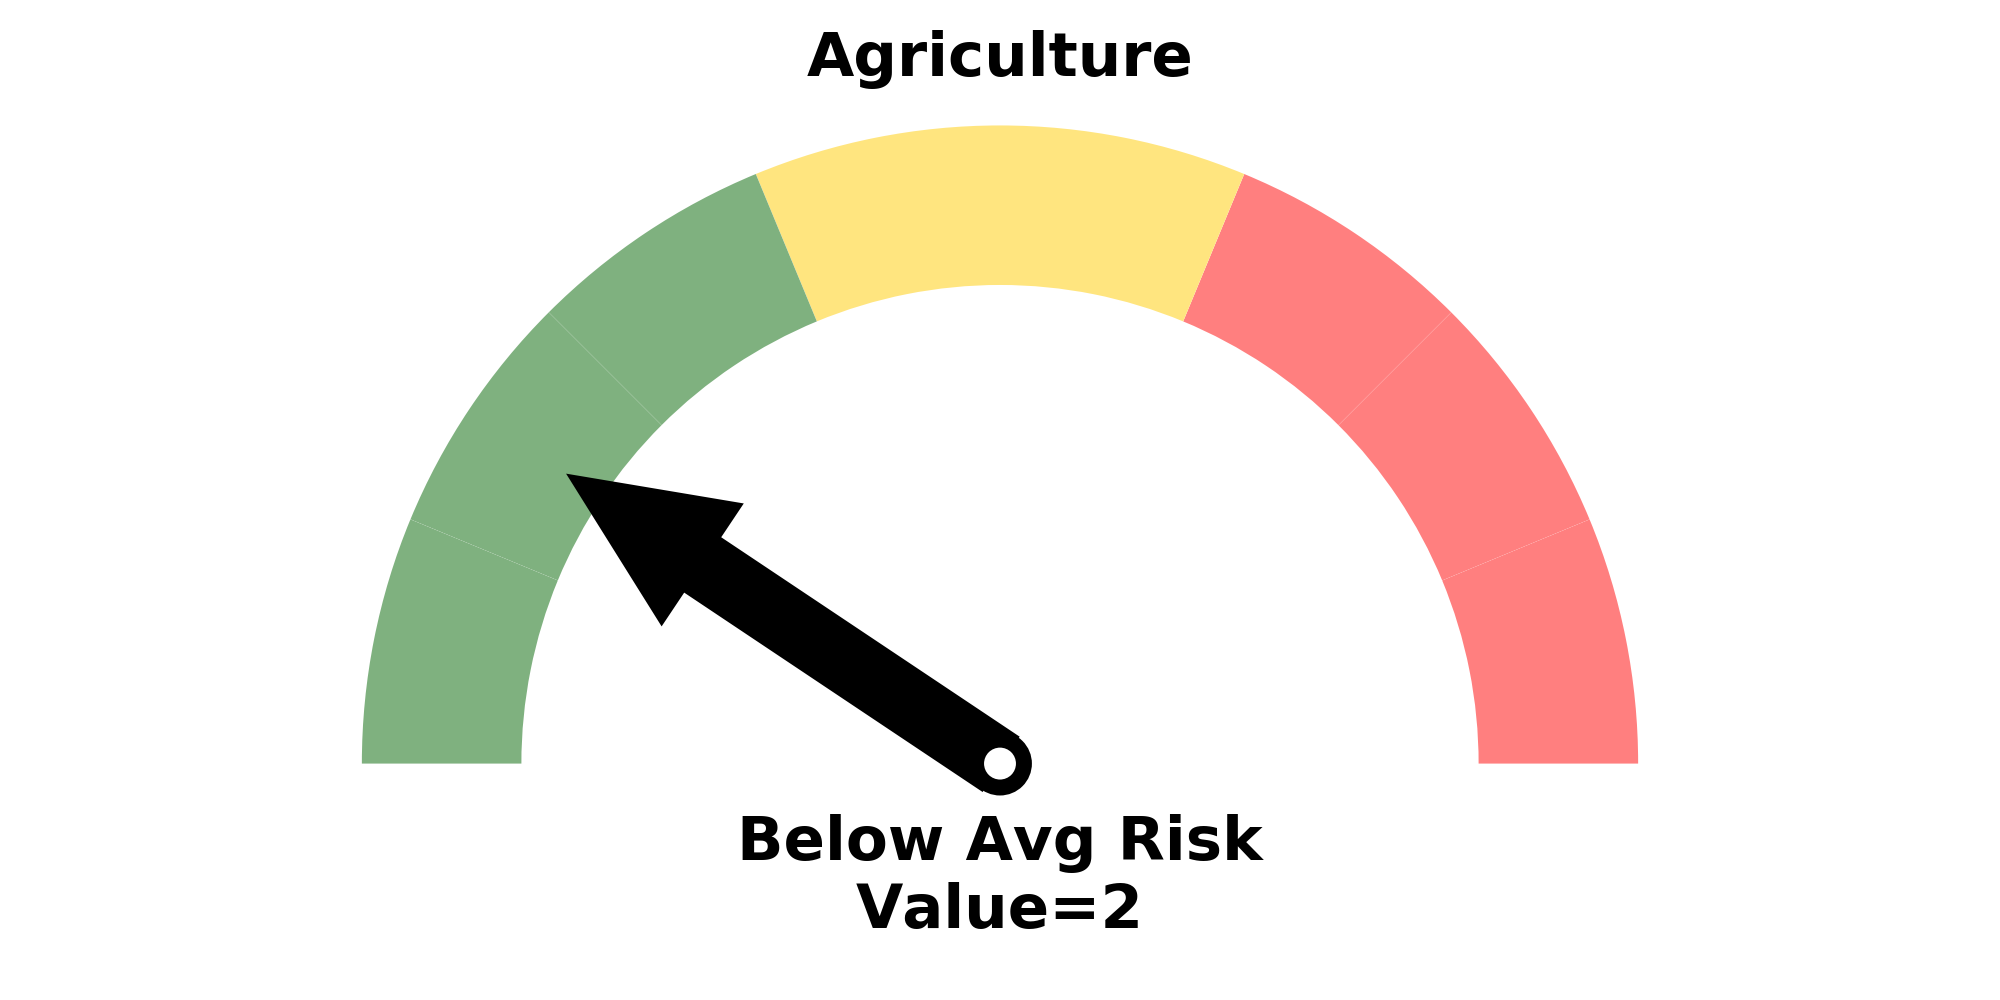
| Position | Weight % | Added / Reduced | Date | | Stocks | 73.2 | Added 31.3% | 2020-03-17 | | Bonds | 0.0 | Reduced 6.7% | 2020-02-28 | | Commodities | 5.5 | Added 2.4%
| 2020-02-28 | | Precious Metals | 0.0 | Reduced 3.6% | 2020-02-28 | | Special Situations | 0.0 | Reduced 31.9% | 2020-03-17 | | Cash | 21.3 | | |
|
Updates (Changes made today are underlined)
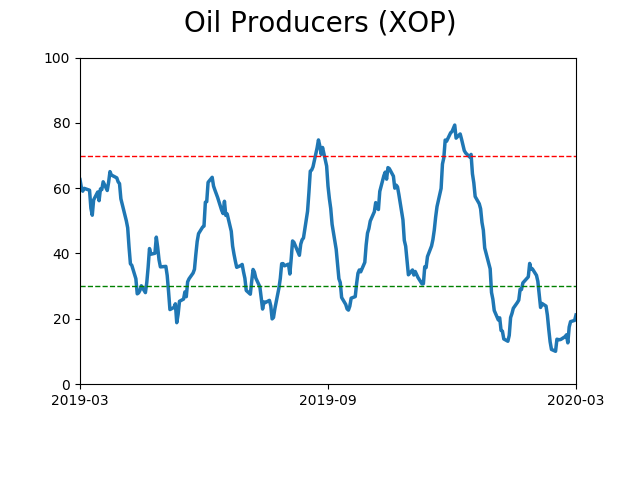
In the first months of the year, we saw manic trading activity. From big jumps in specific stocks to historic highs in retail trading activity to record highs in household confidence to almost unbelievable confidence among options traders. All of that has come amid a market where the average stock can’t keep up with their indexes. There were signs of waning momentum in stocks underlying the major averages, which started triggering technical warning signs in late January. The kinds of extremes we saw in December and January typically take months to wear away, but the type of selling we’ve seen over the past month has gone a long way toward getting there. When we place the kind of moves we’ve seen over the past two weeks into the context of coming off an all-time high, there has been a high probability of a multi-month rebound. The volatility we’ve seen lately is extremely compelling from a medium-term point of view. Virtually everything we’ve looked at suggests a strong probability of gains over the next several months, even within the context of a potential bear market, and even from what had been higher prices. With an increasing sense that government entities will finally do anything it takes, and signs of progress in isolating and testing for the virus, I added to my exposure. I’m still holding 20% cash and don’t see that changing much at this point. Energy stocks. That was atrocious. The worst move I’ve ever made in this account. I’ve taken some very large sectors bets in this account over the years, like oil & gas explorers in 2016 and gold miners in 2018, and there is always some shorter-term discomfort because the news flow is so horrid. I don’t mind that in the least. But I do mind when stocks don’t do what they should. It didn’t help going large on these stocks right before what could be considered a true Black Swan, but so it goes. I’m more concerned that there has been no reaction since then and they continue to underperform despite…well, everything. They very well could rebound in the months ahead, but at this point I feel I have zero edge and don’t know what’s going on there, so I rotated out of that sector and into a general broad-market fund.
|
|
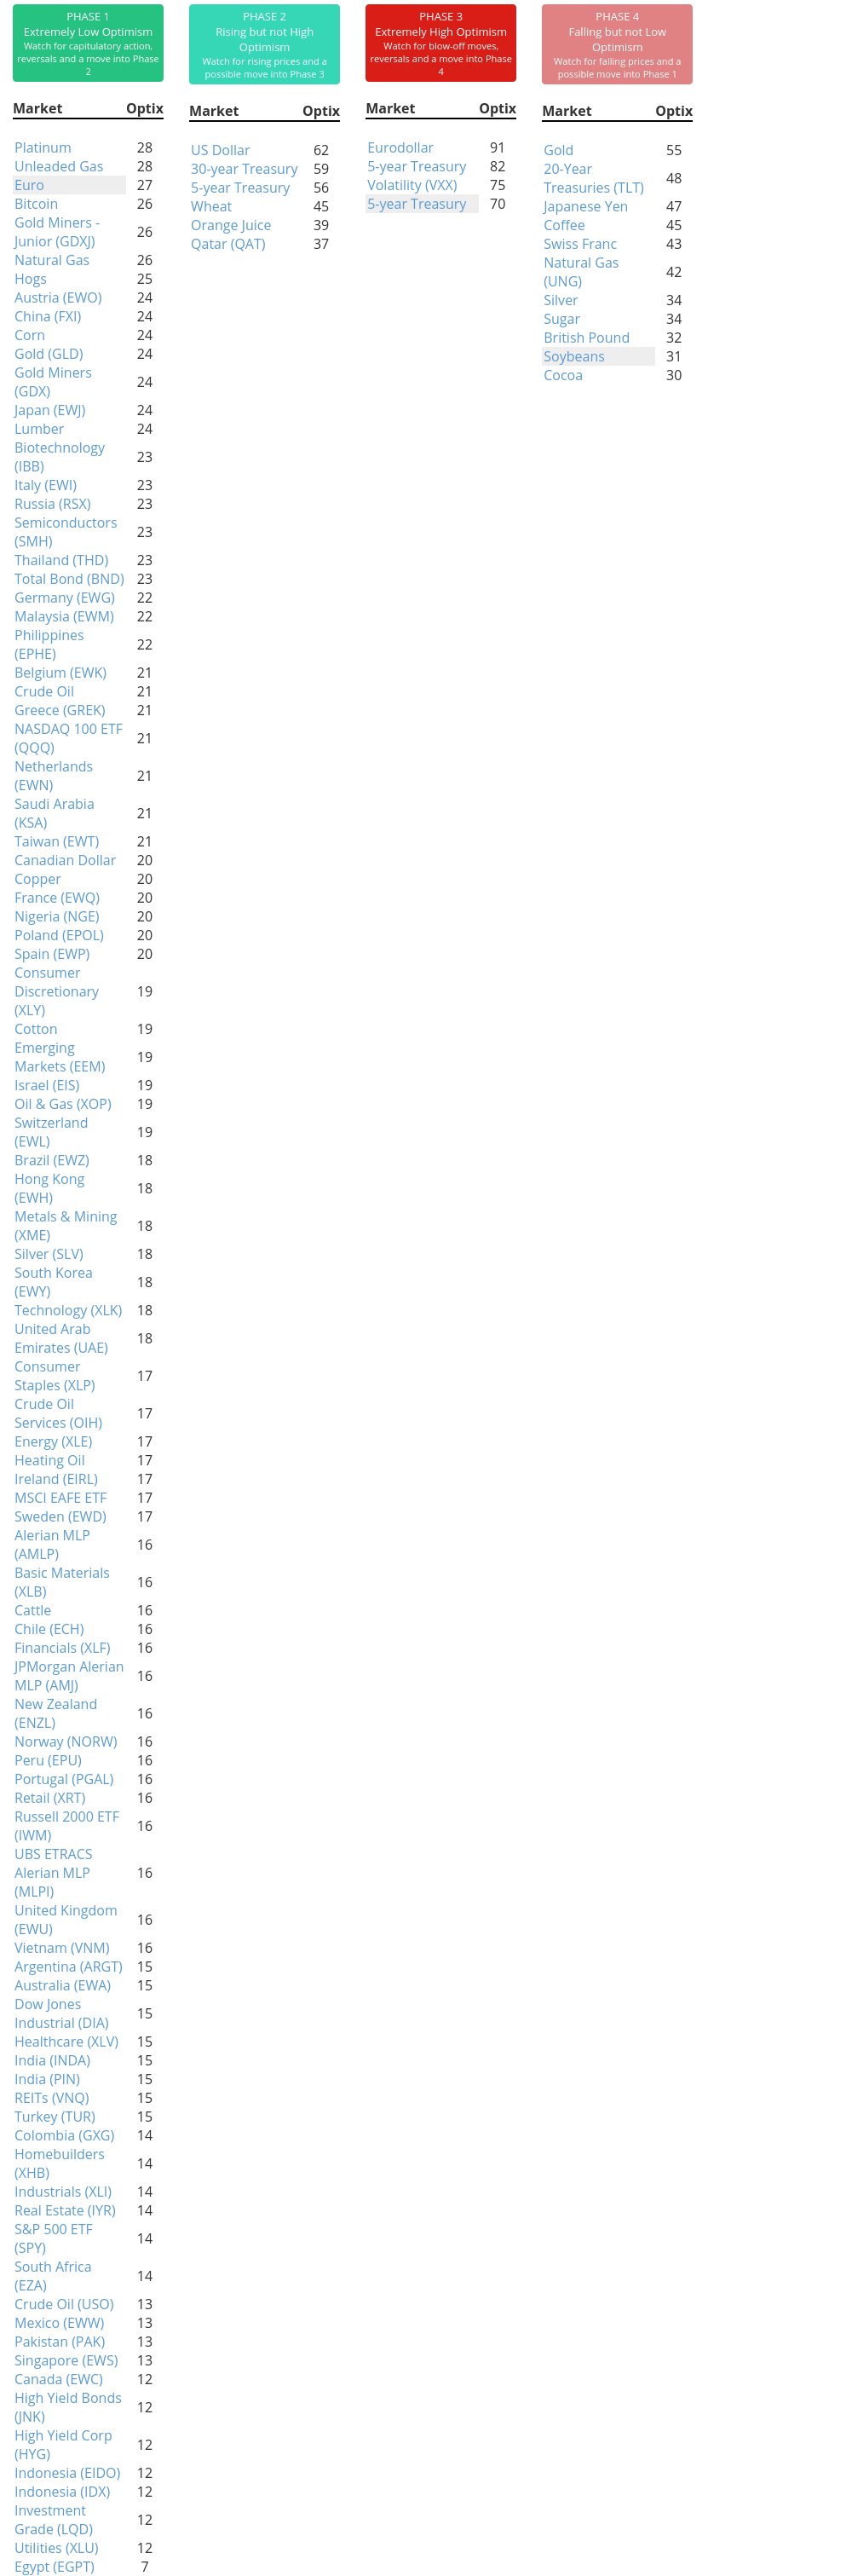
Phase Table
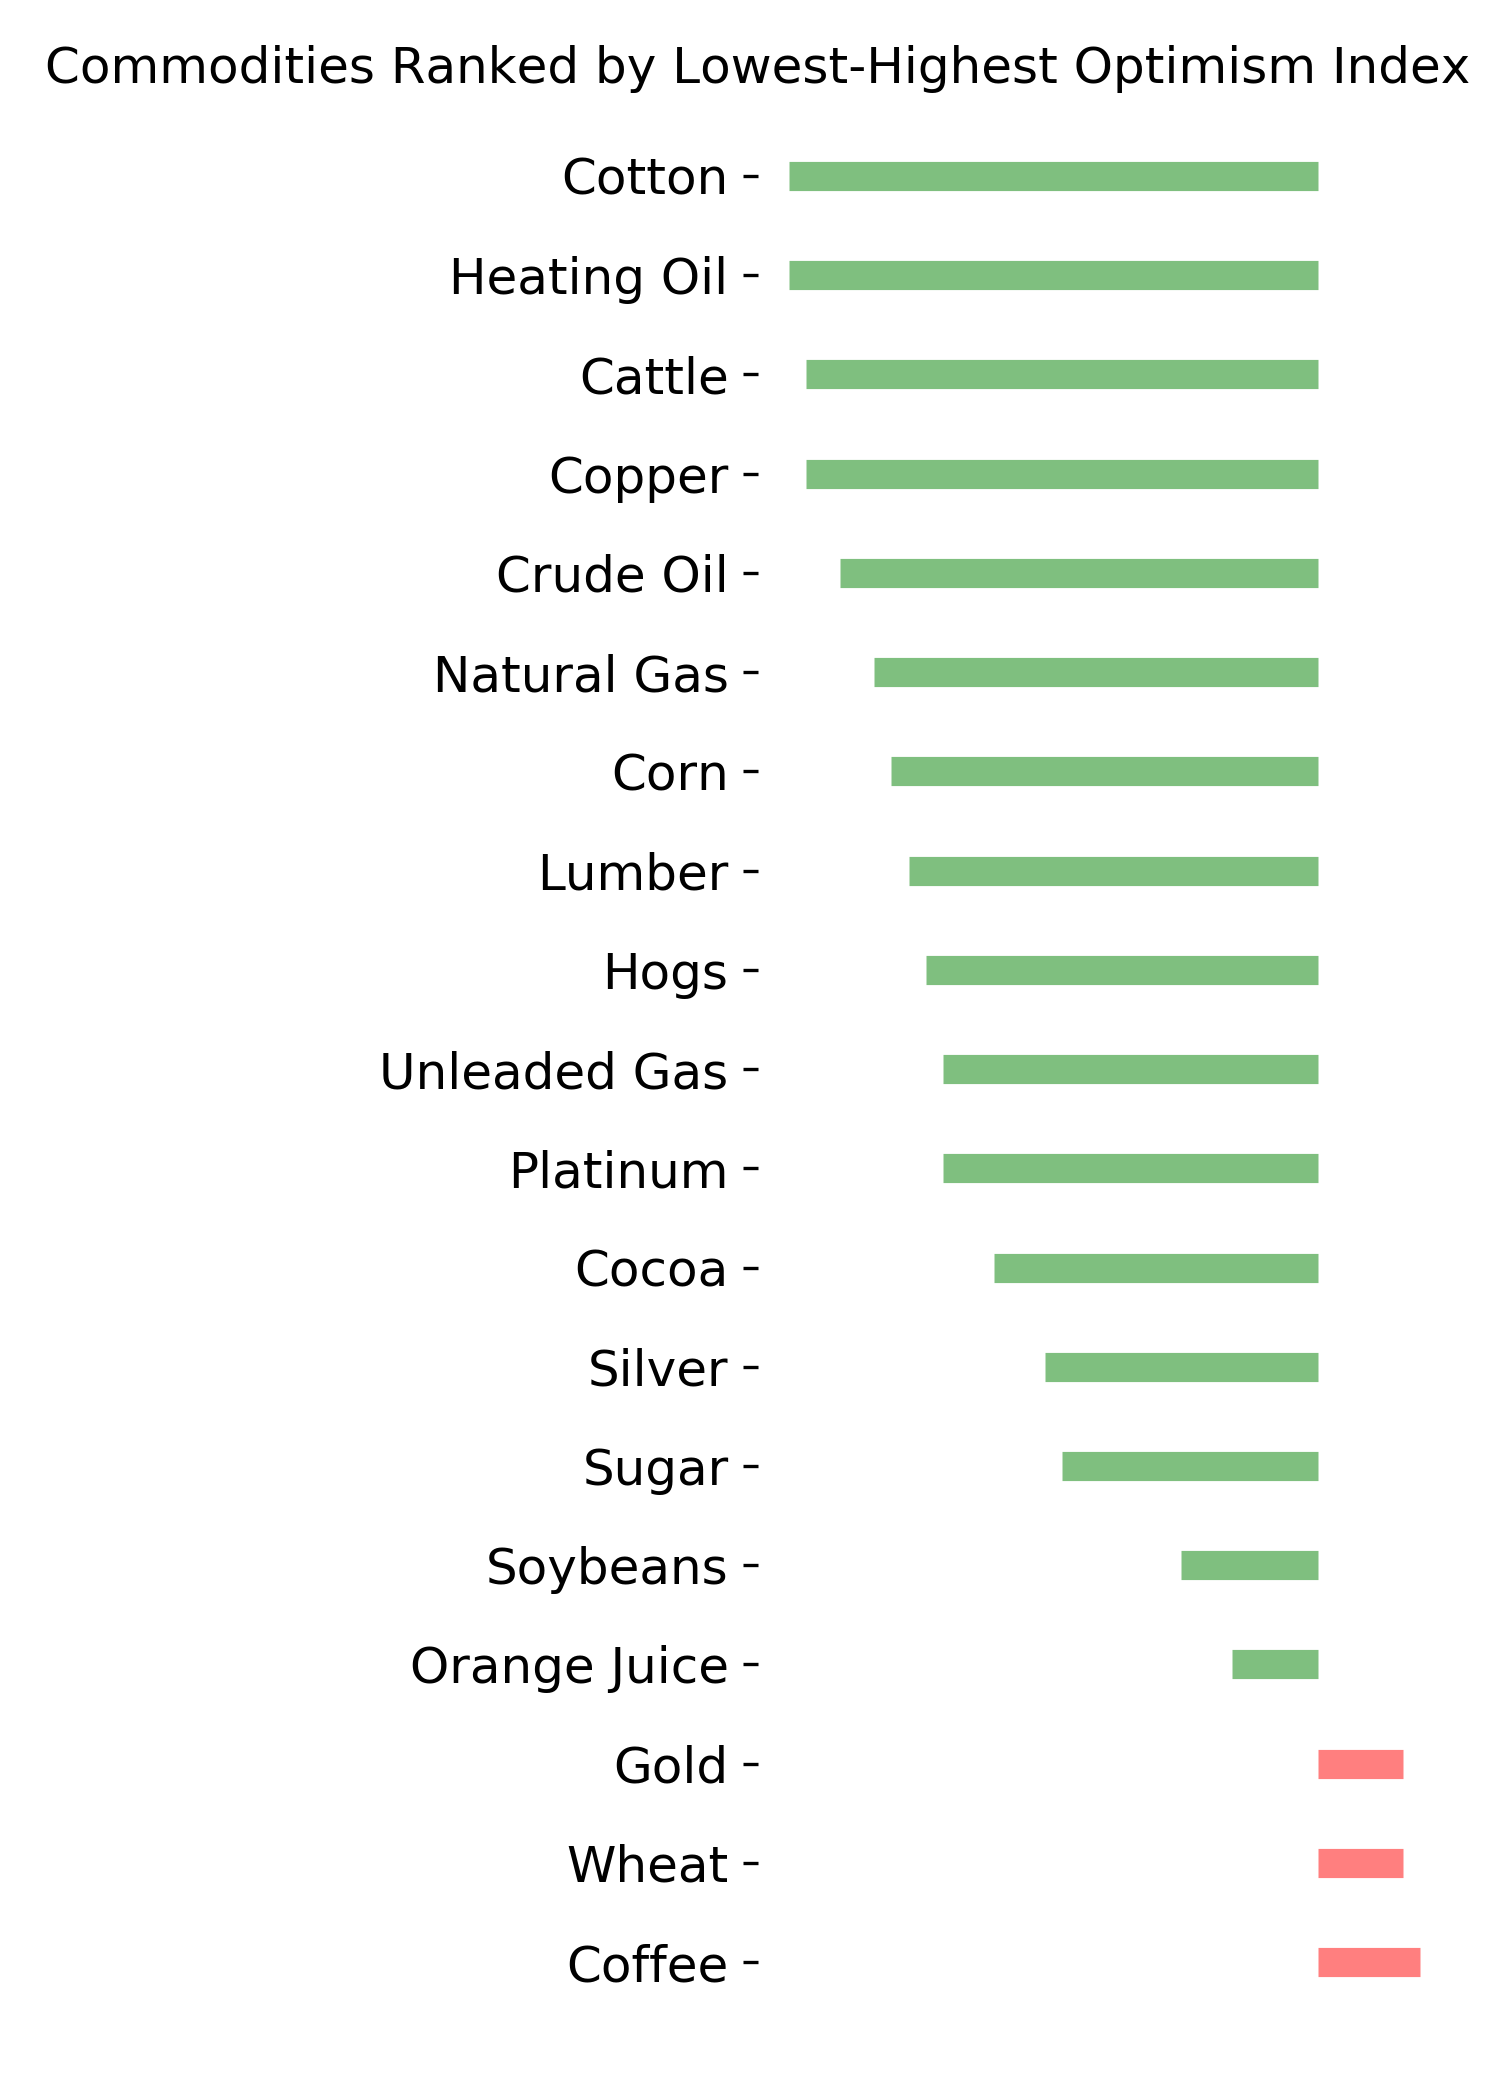
Ranks
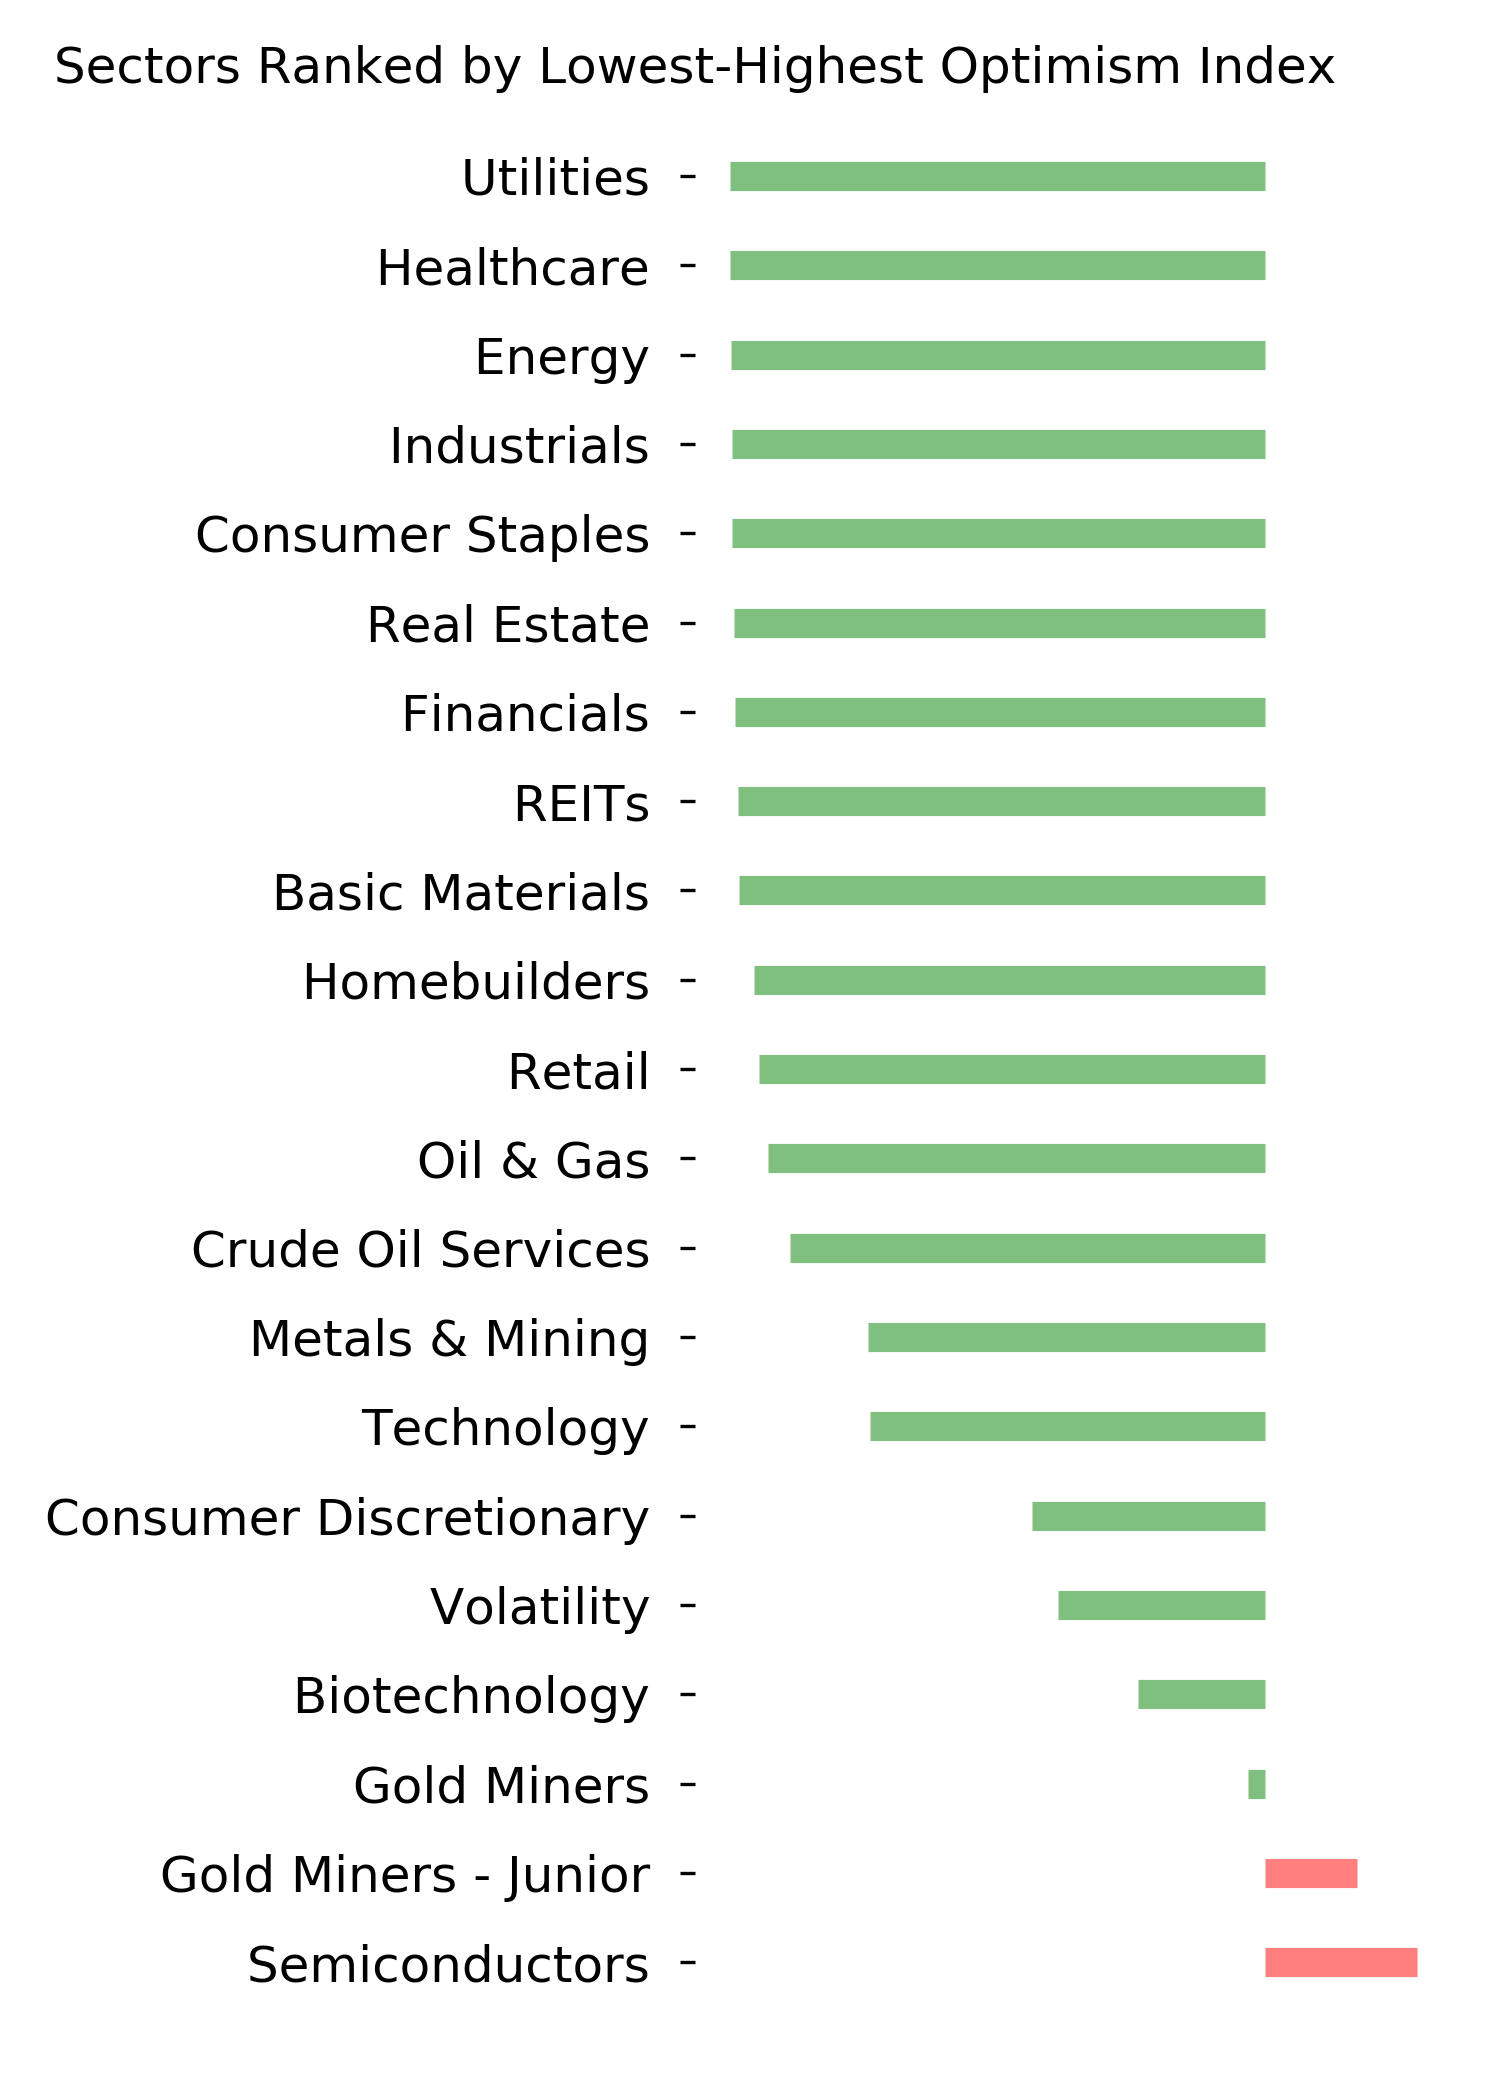
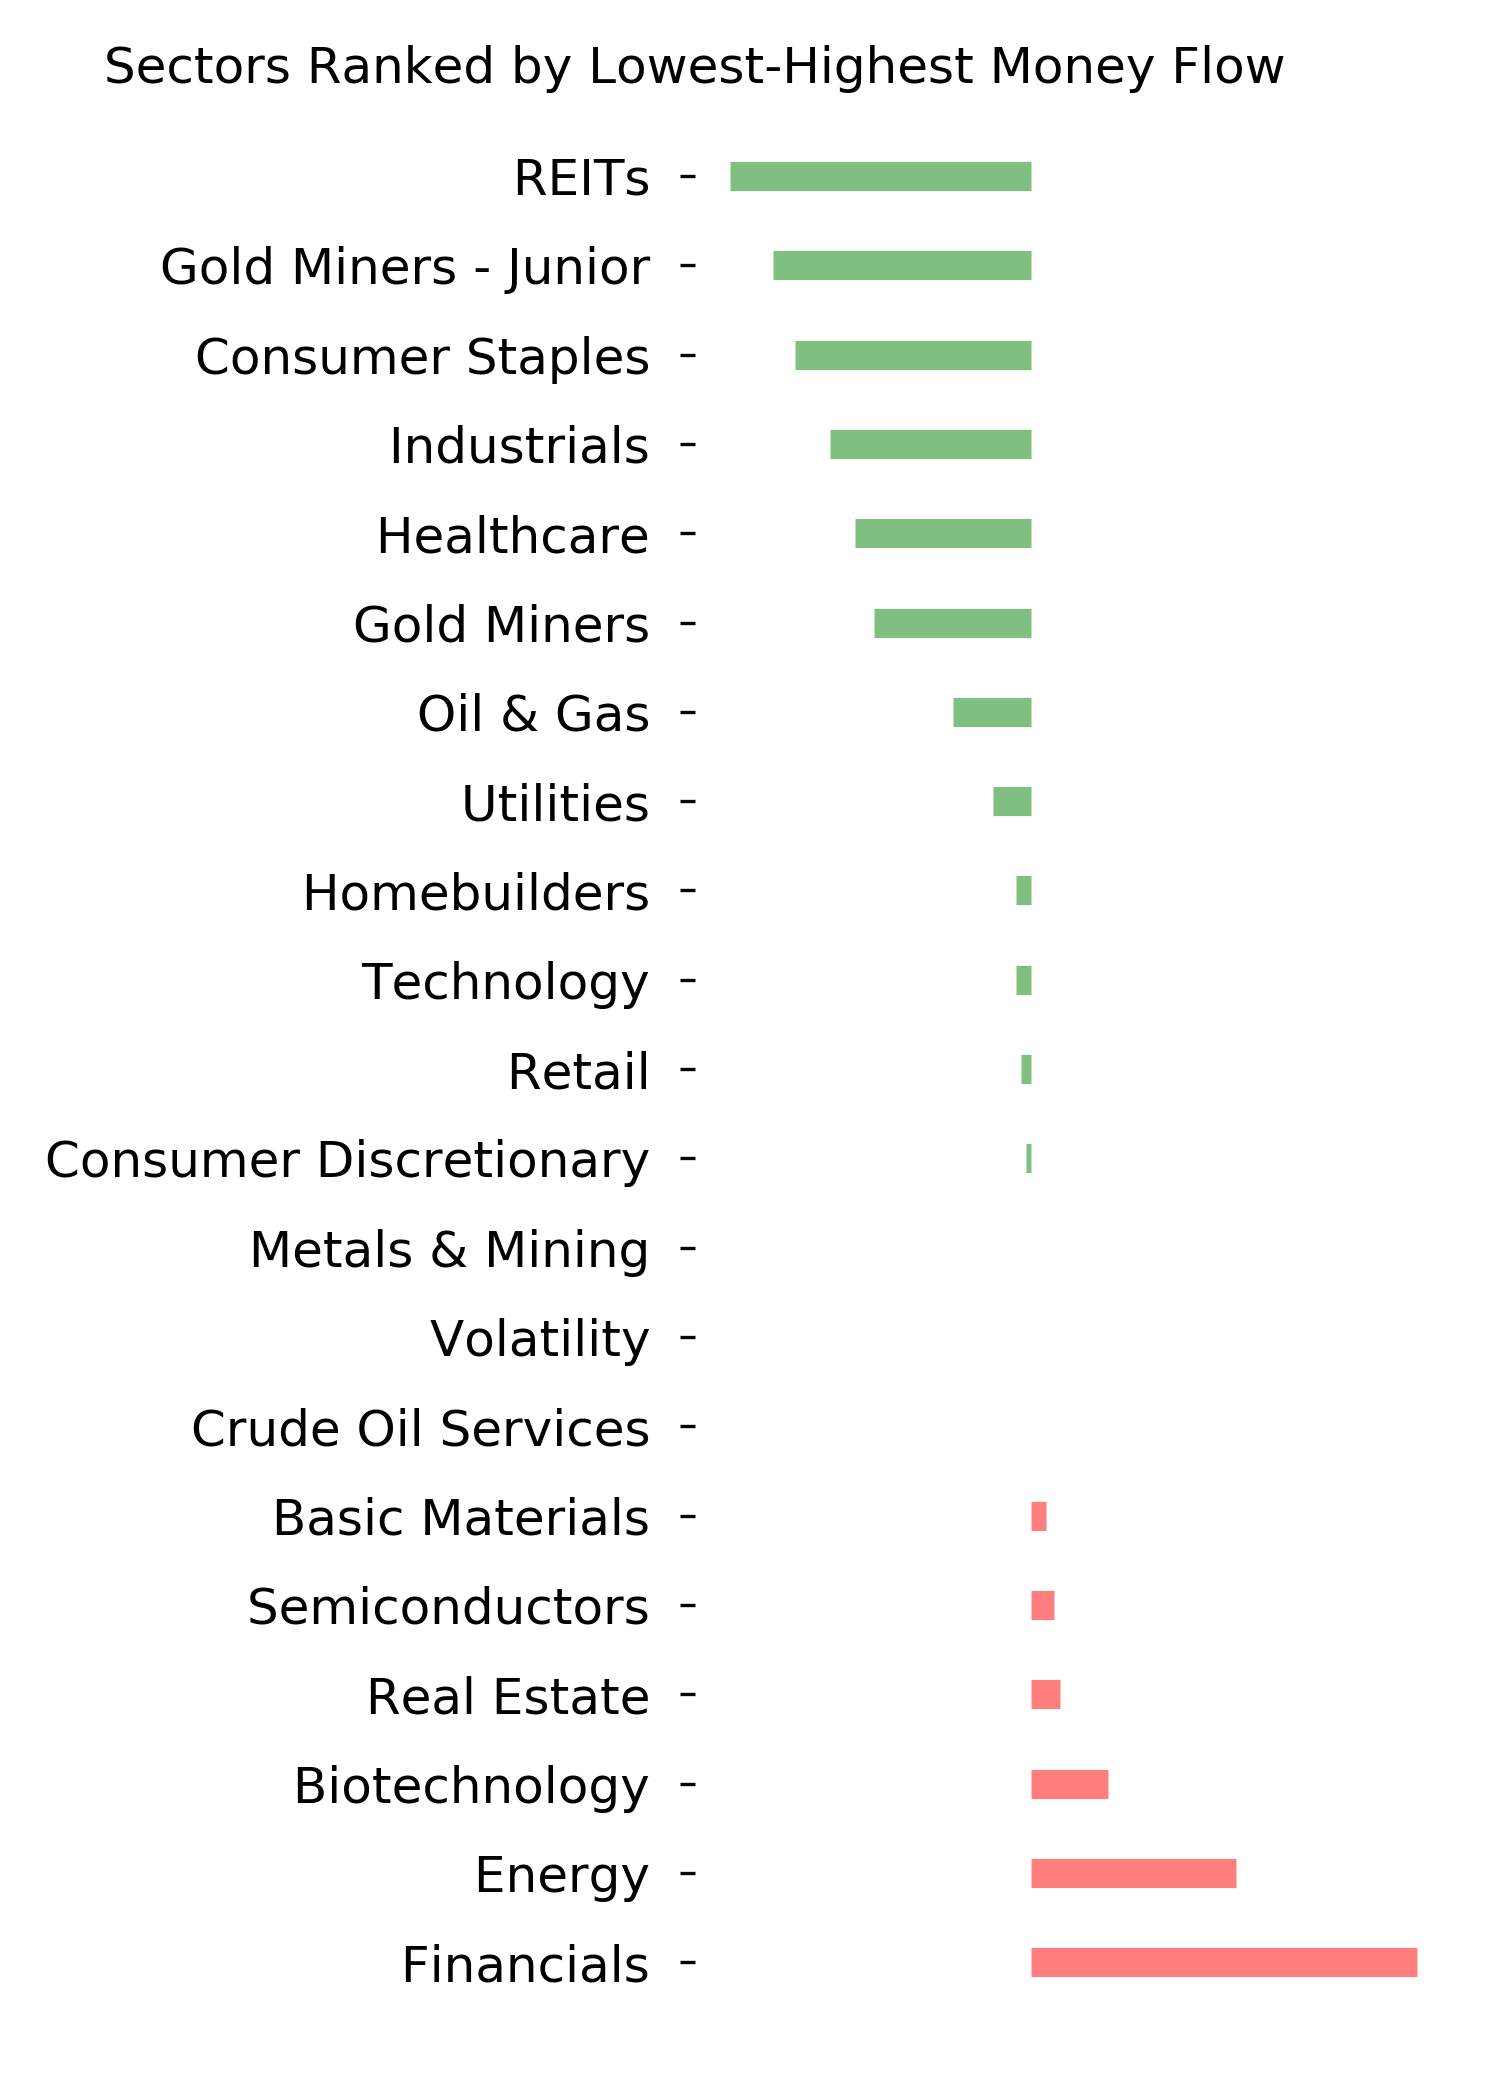
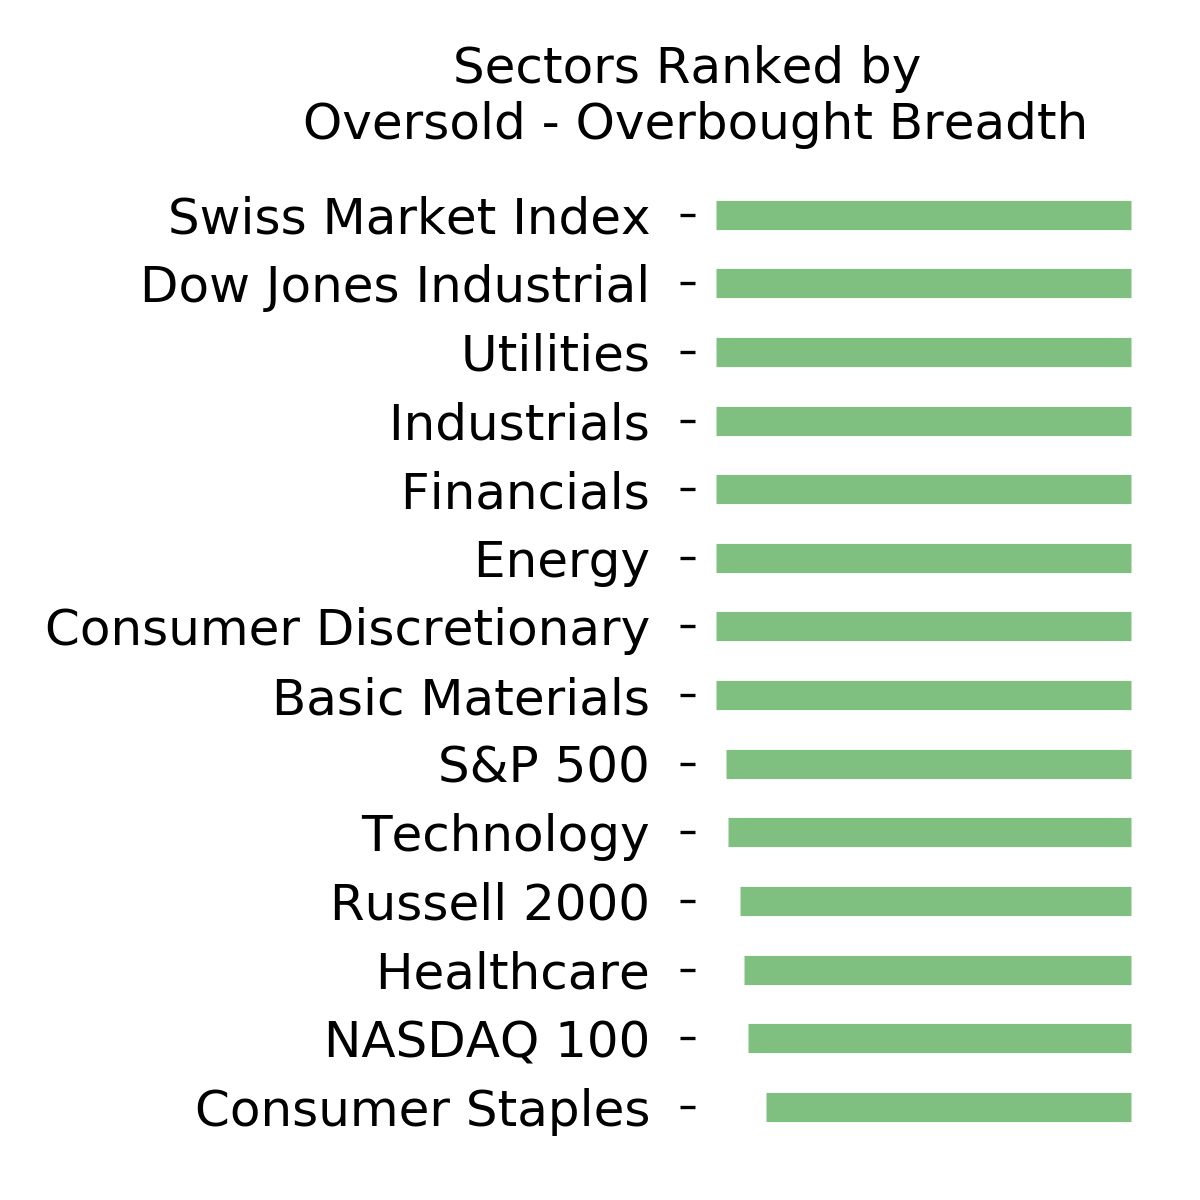
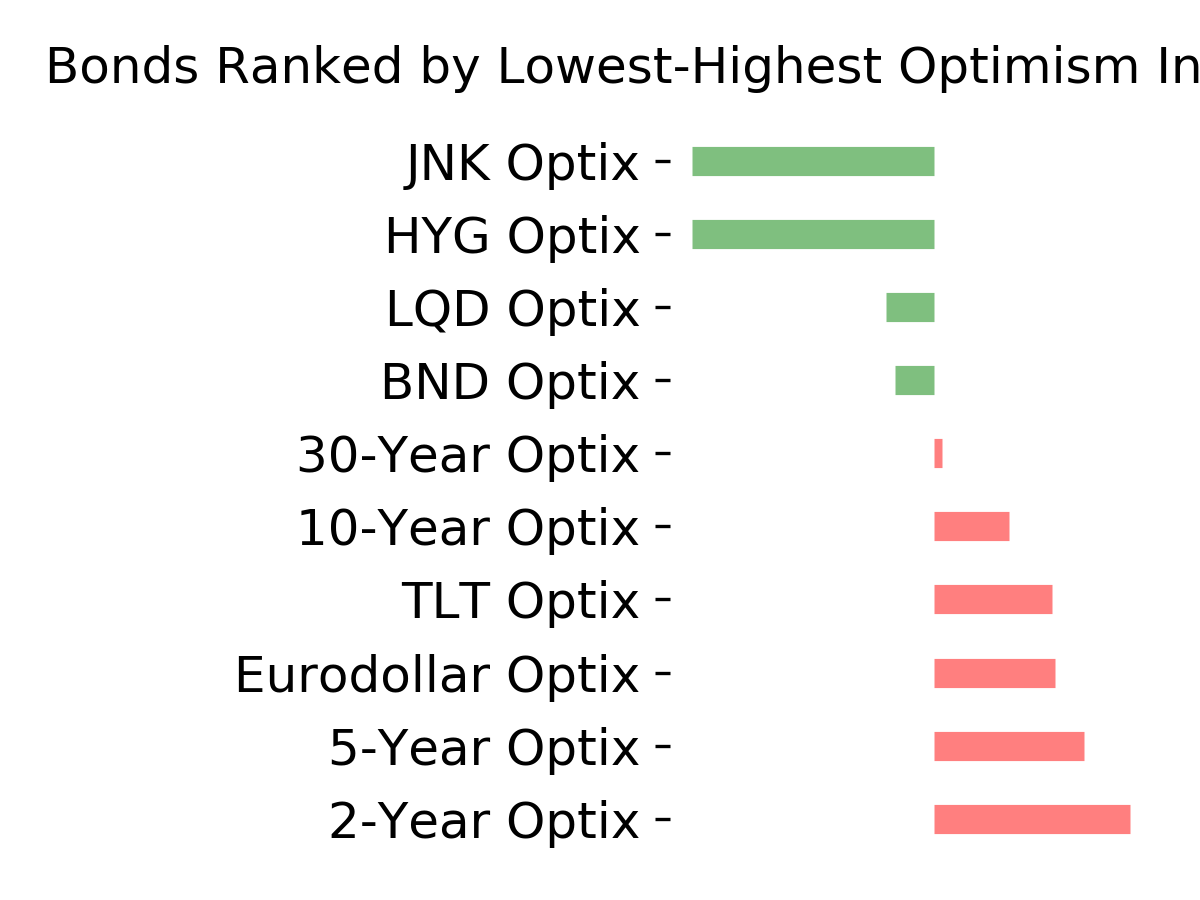
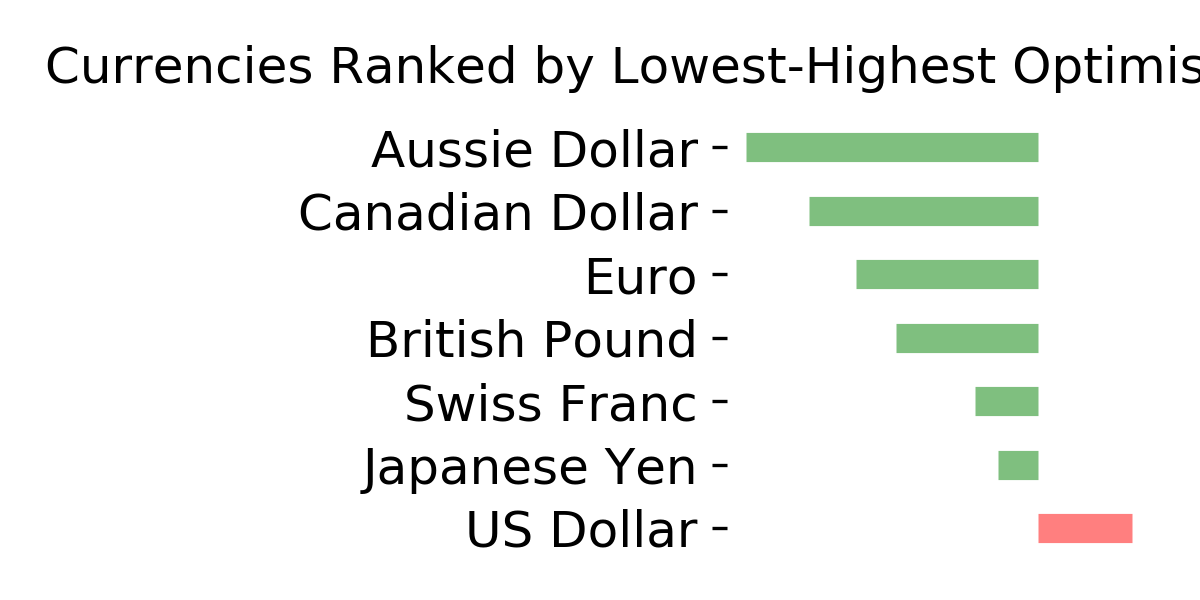
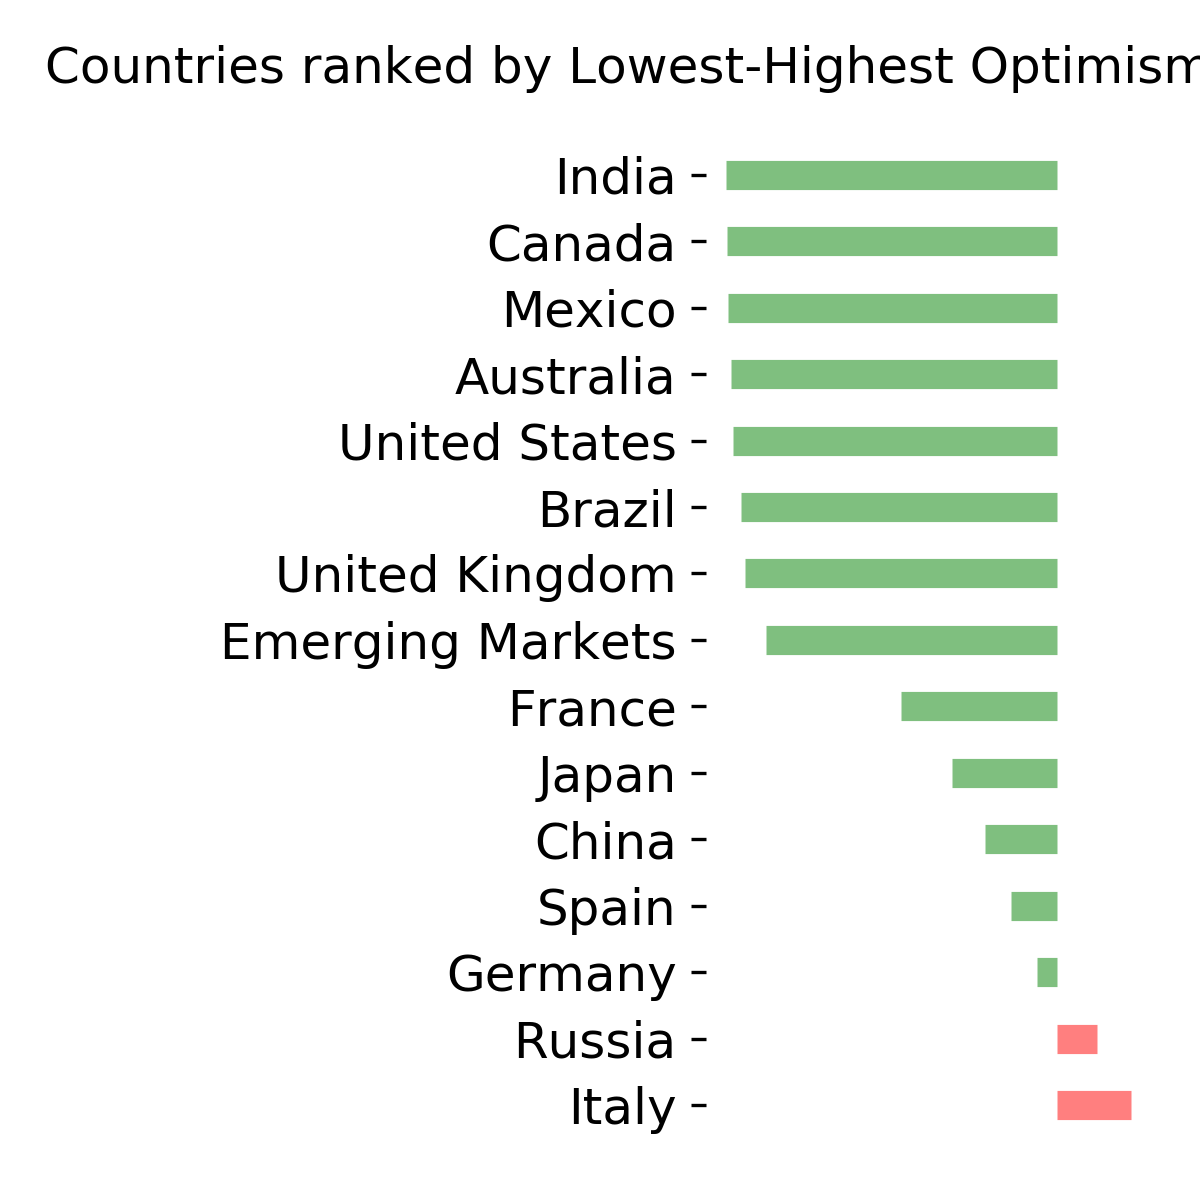
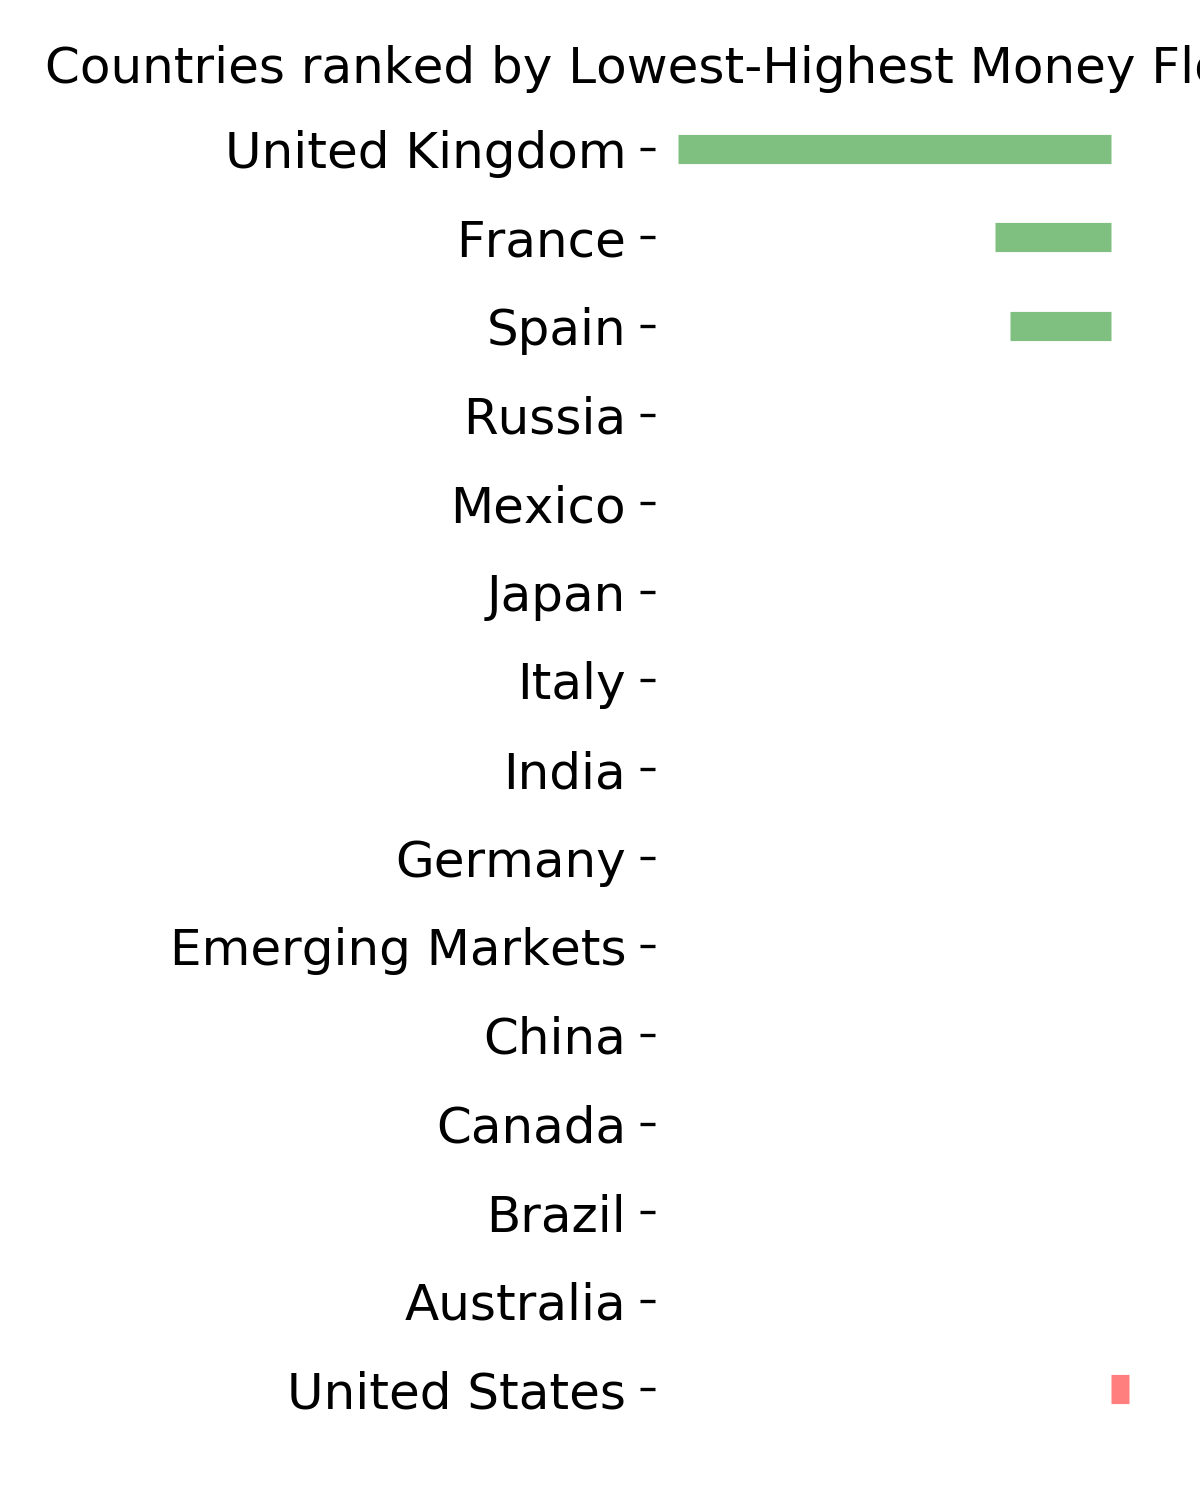
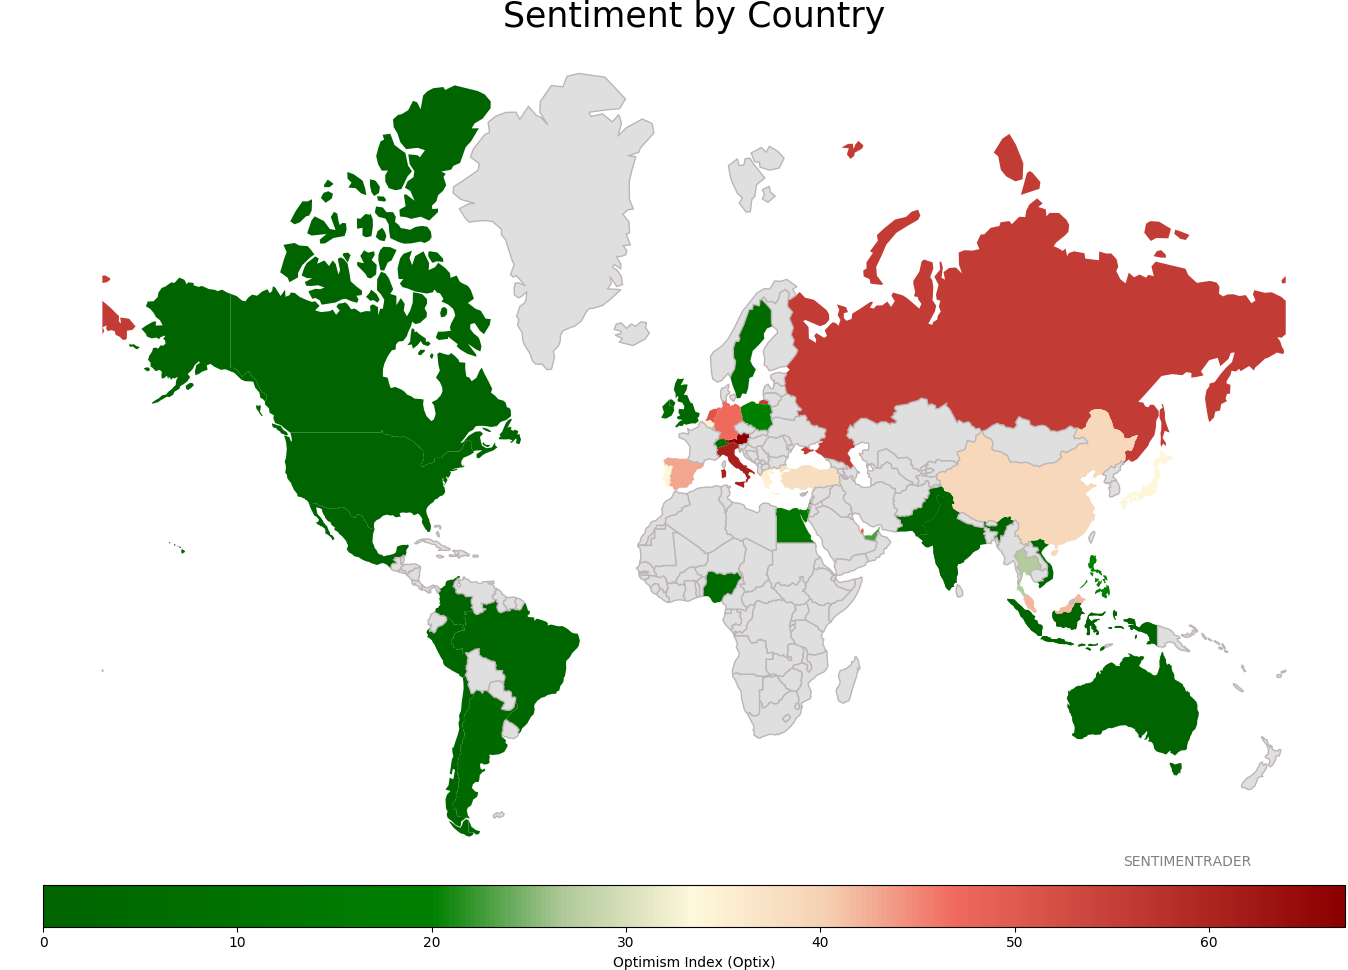
Sentiment Around The World
Optimism Index Thumbnails
|
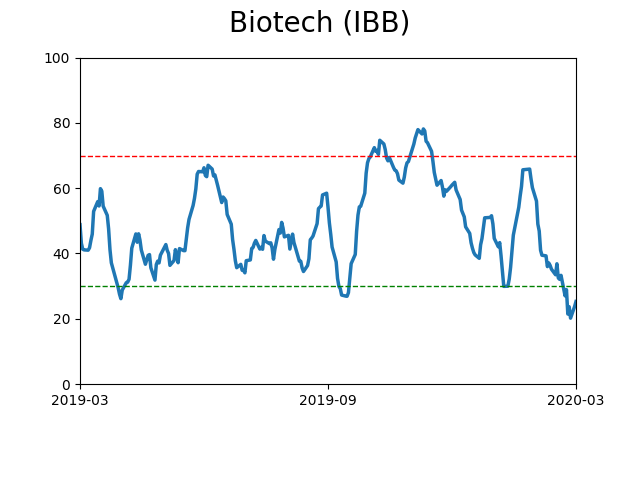
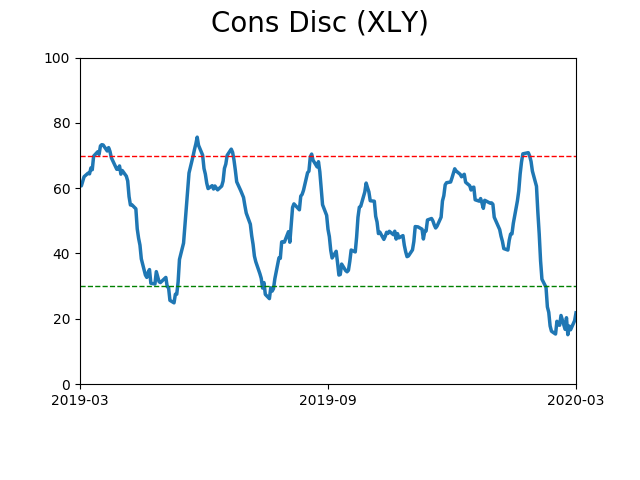
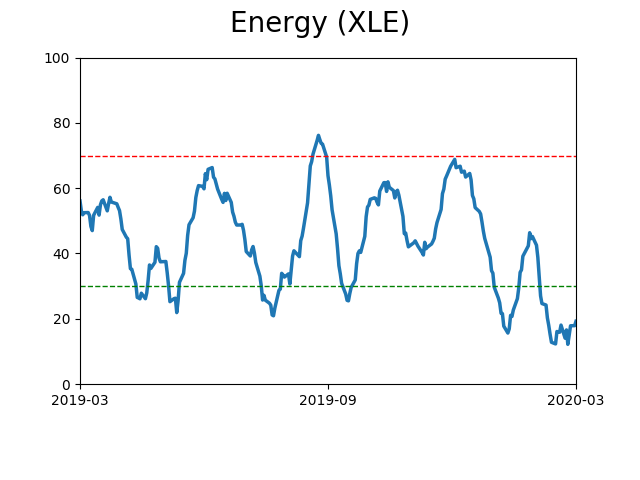
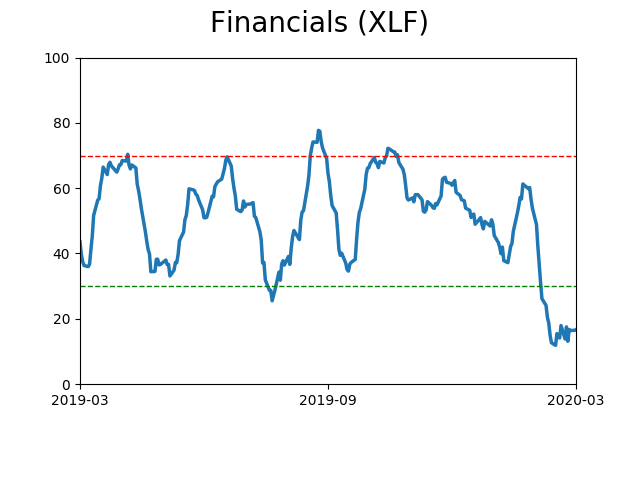
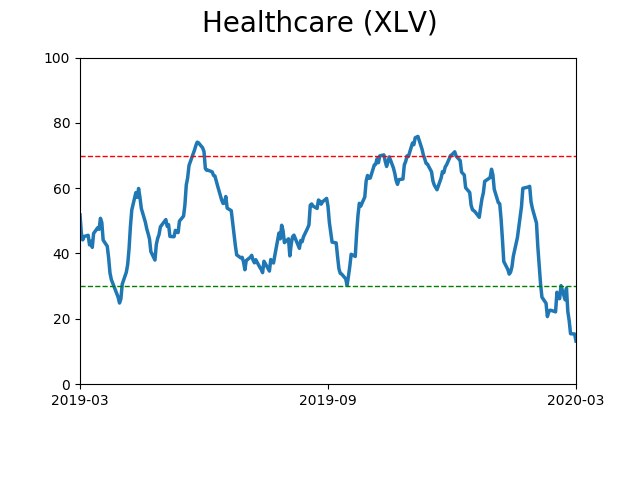
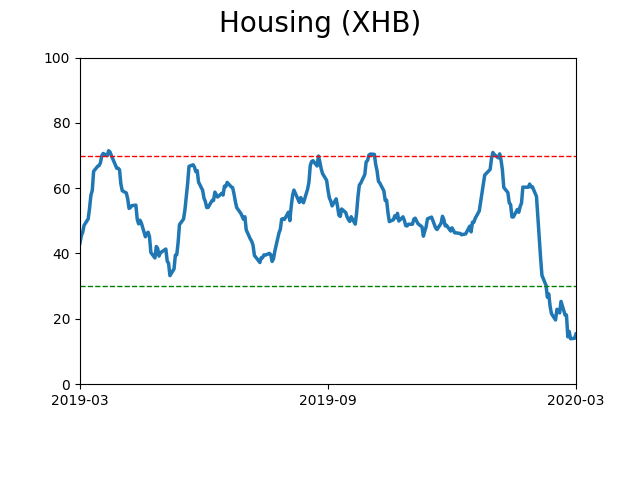
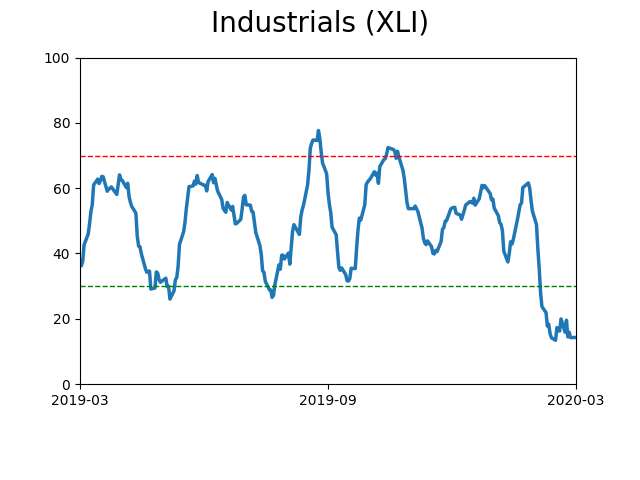
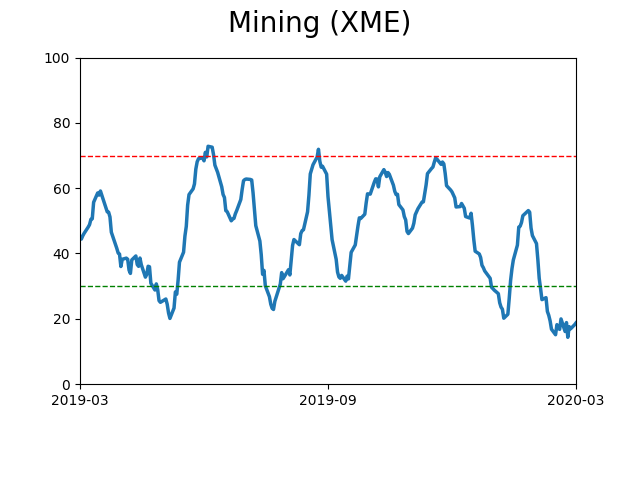
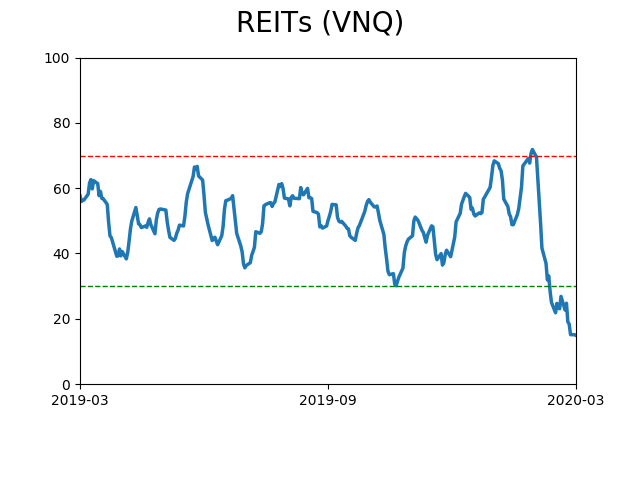
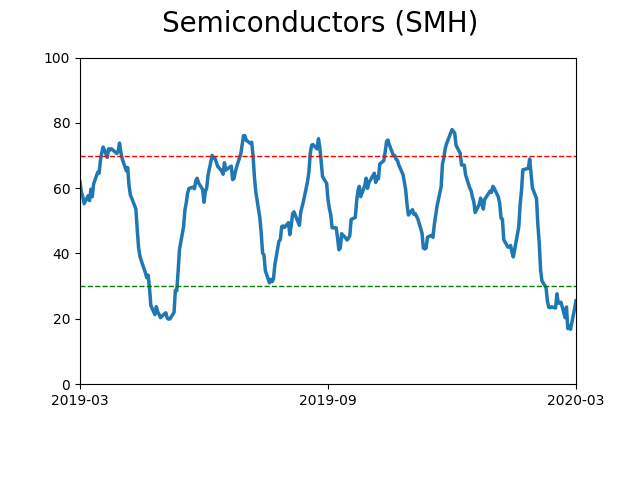
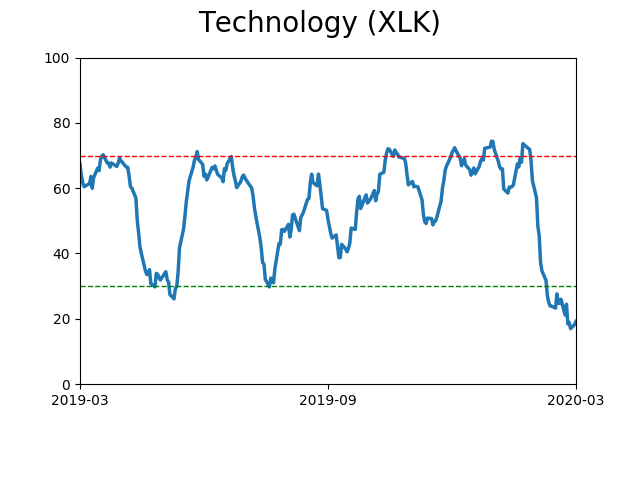
Sector ETF's - 10-Day Moving Average
|
|
|
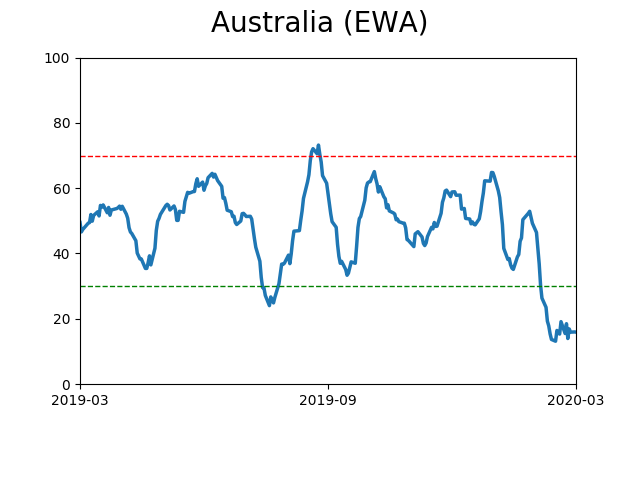
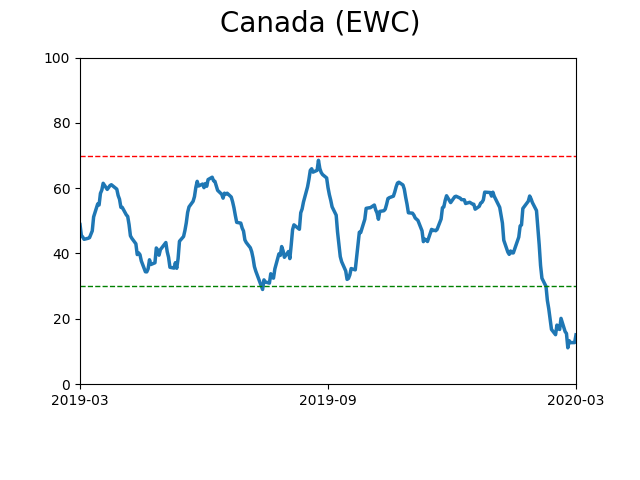
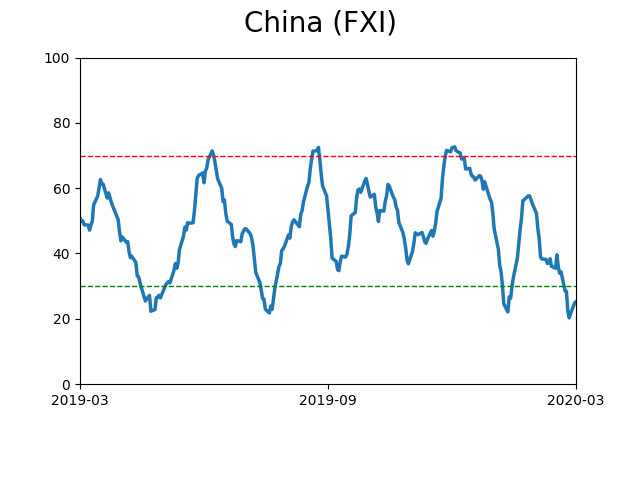
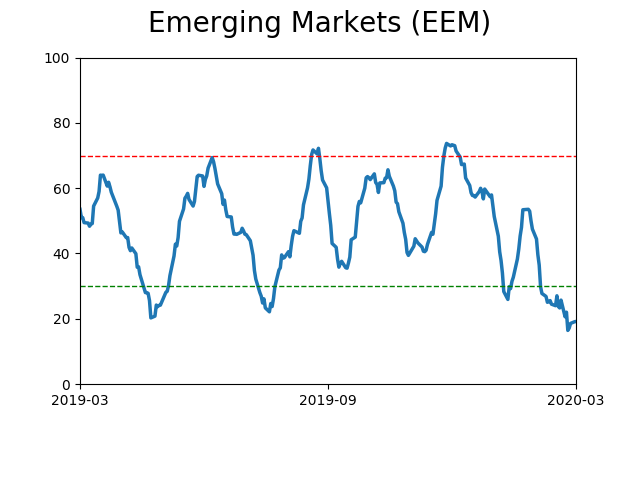
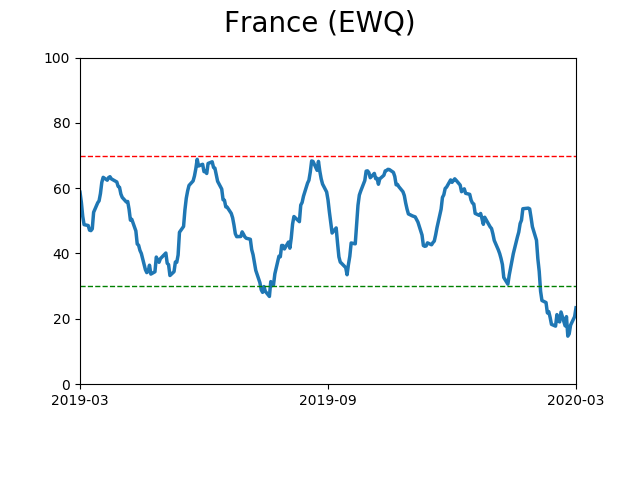
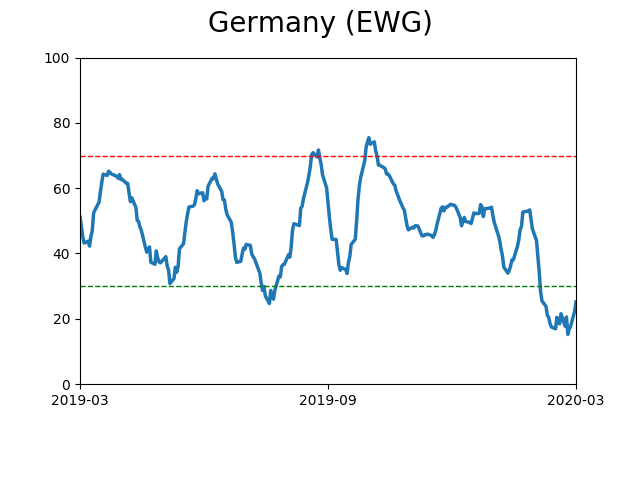
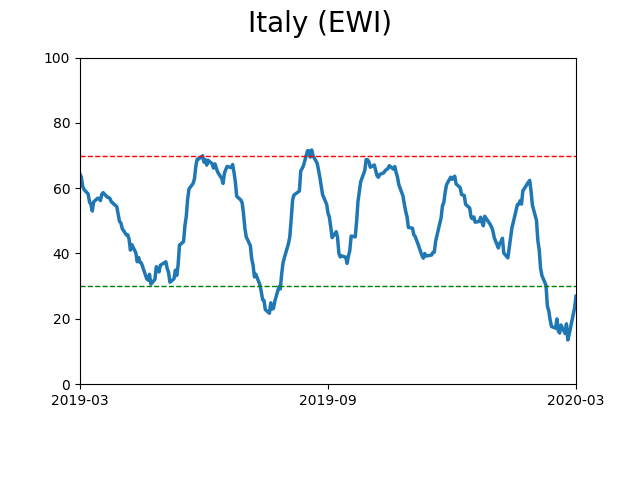
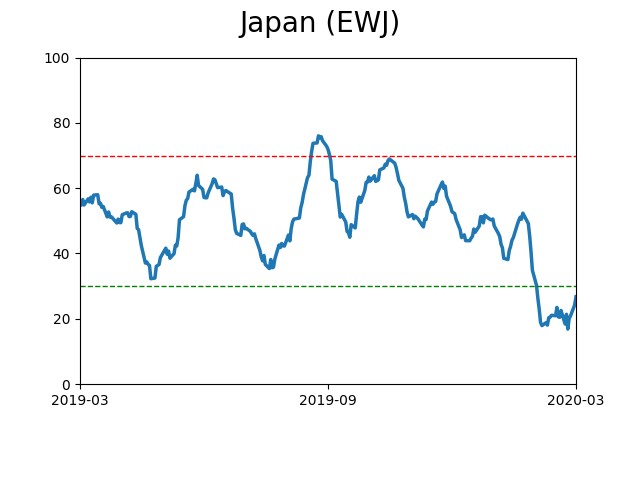
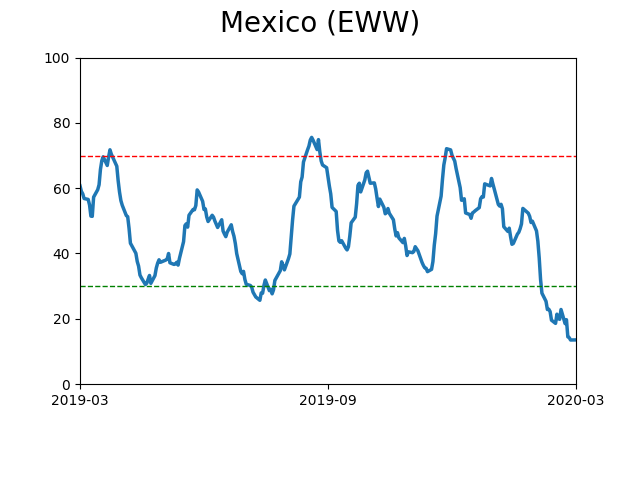
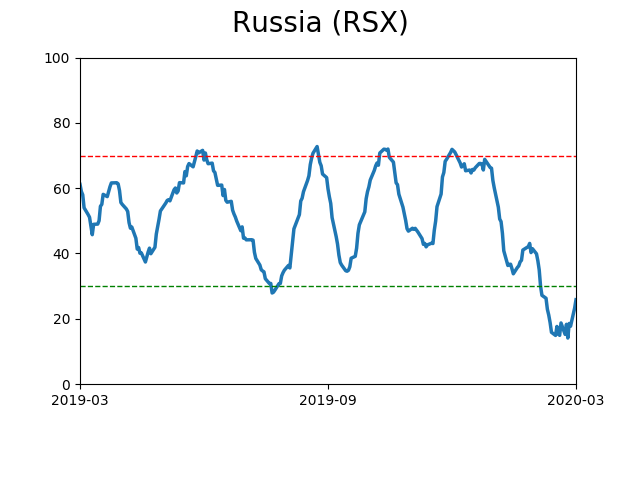
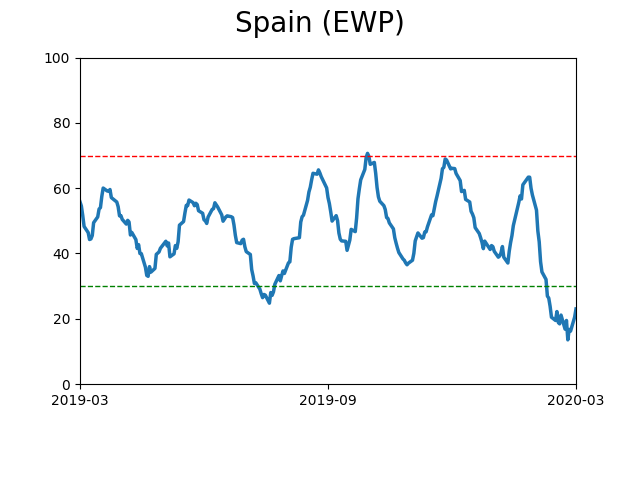
Country ETF's - 10-Day Moving Average
|
|
|
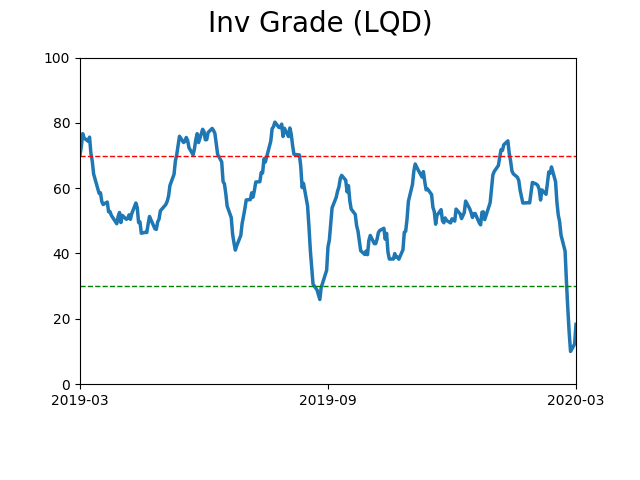
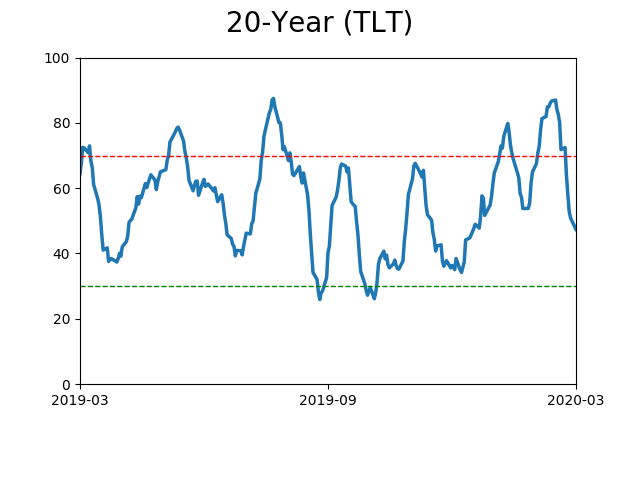
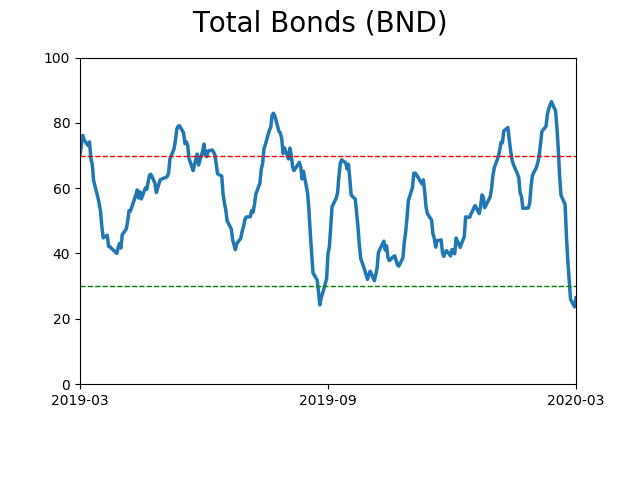
Bond ETF's - 10-Day Moving Average
|
|
|
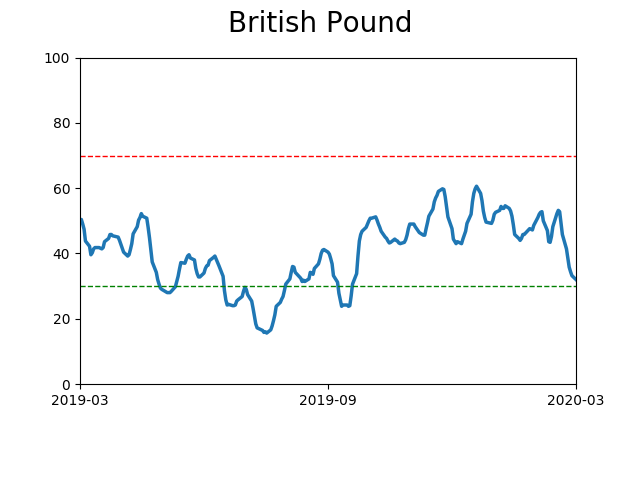
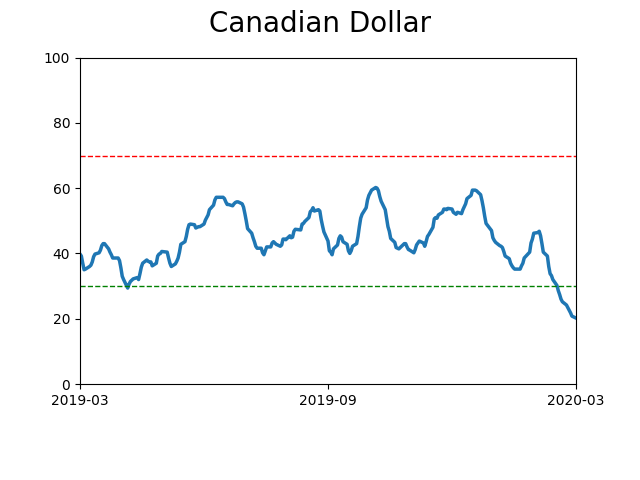
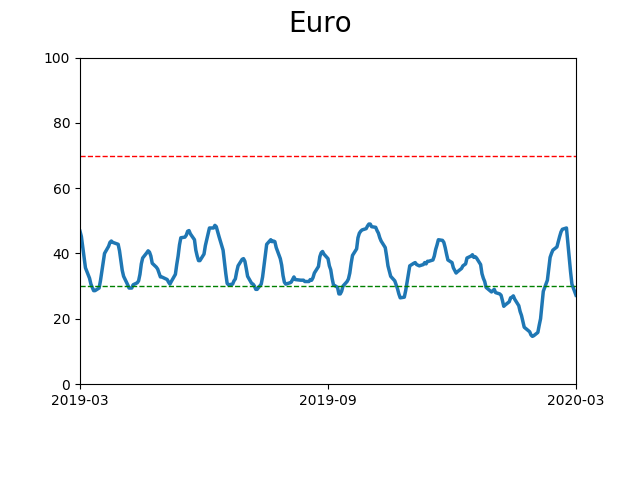
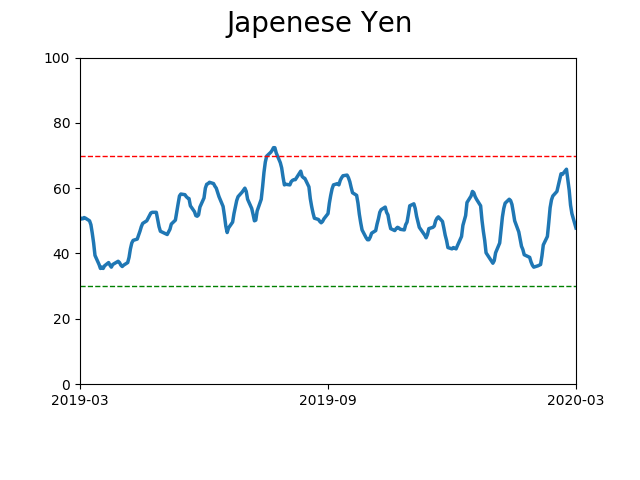
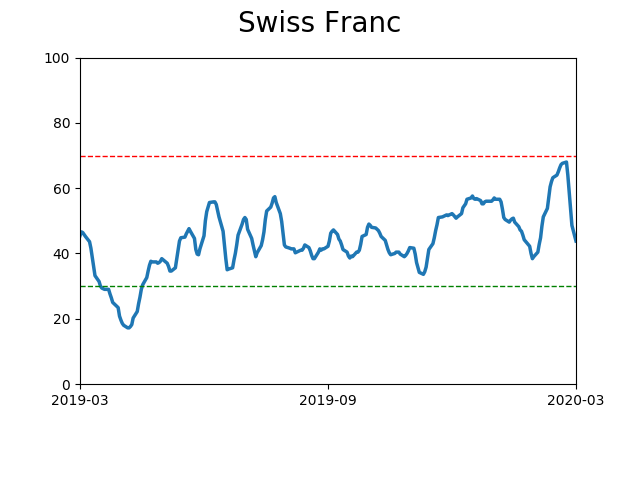
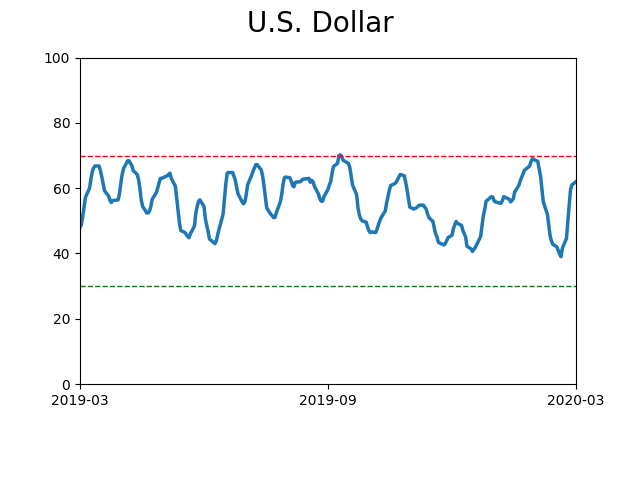
Currency ETF's - 5-Day Moving Average
|
|
|
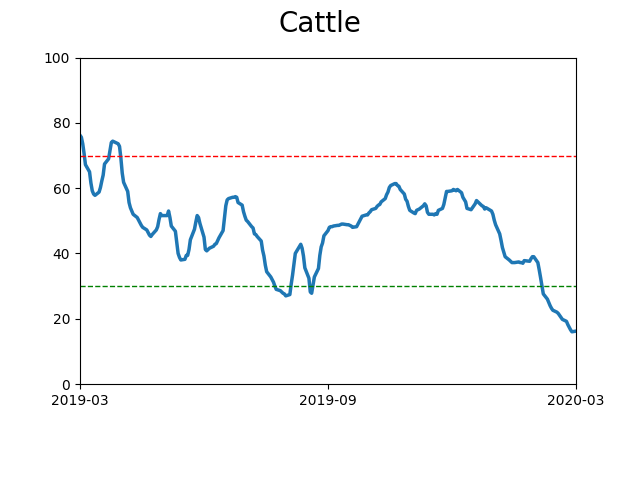
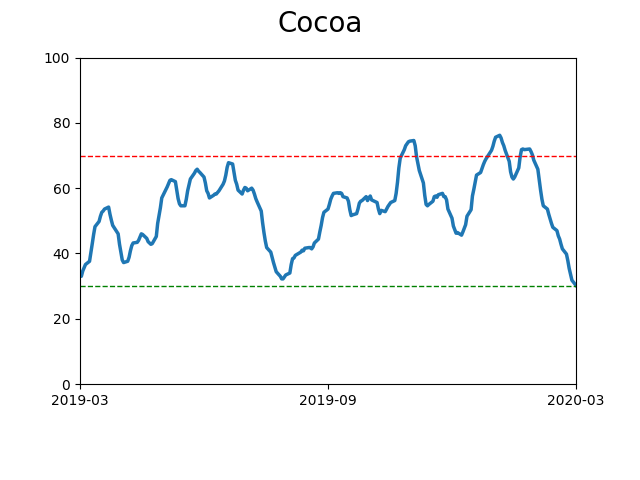
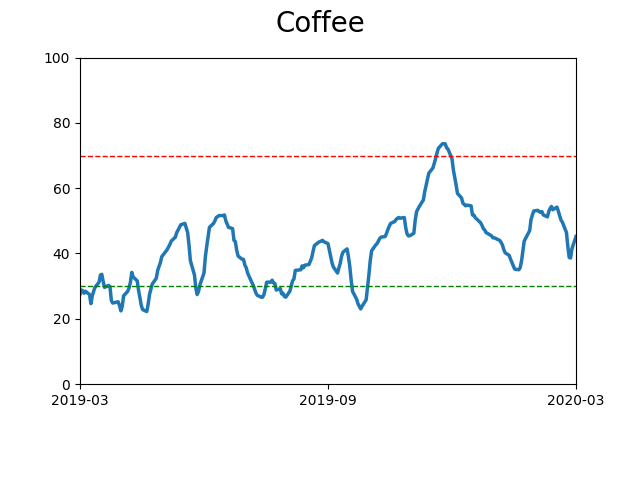
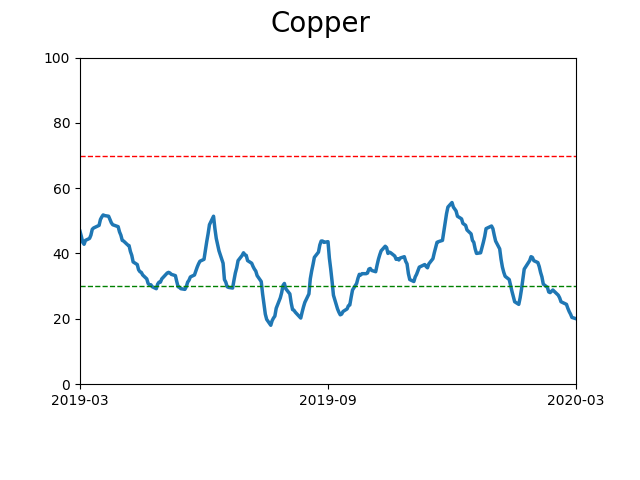
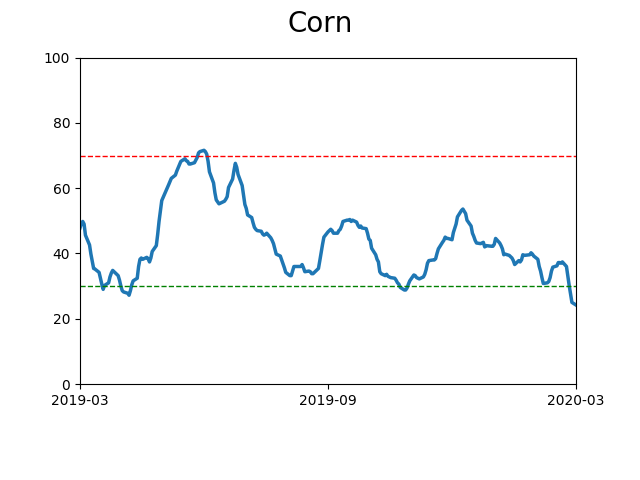
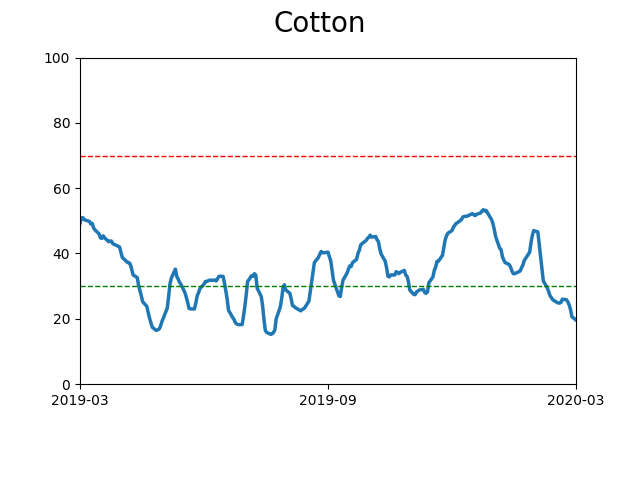
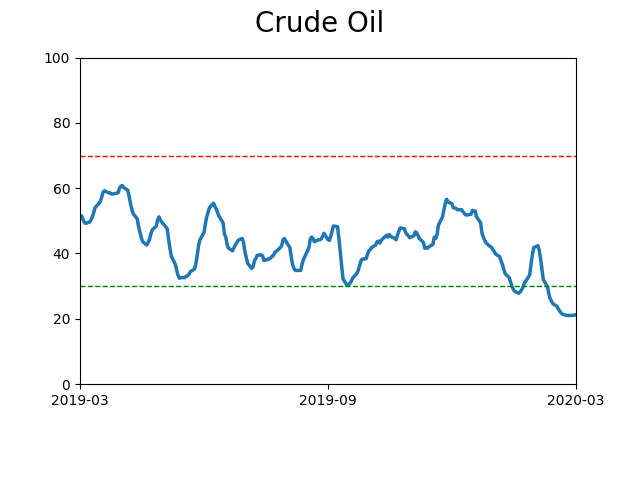
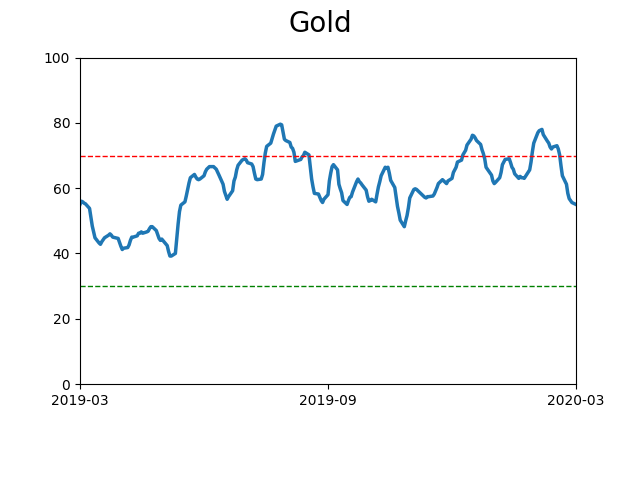
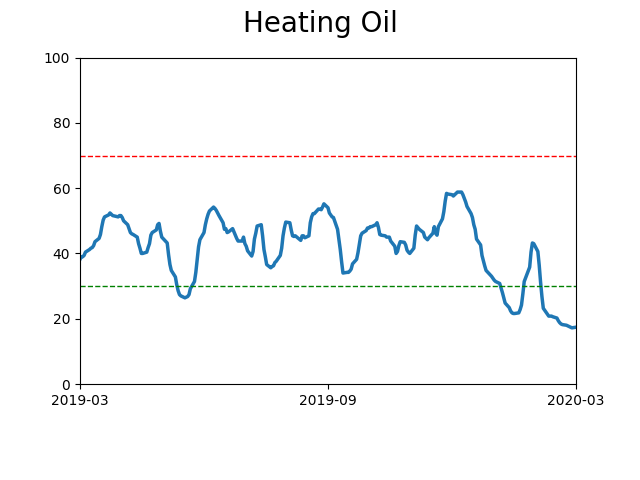
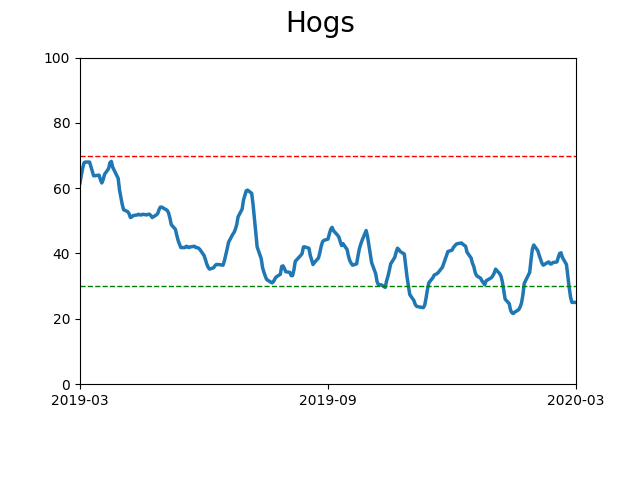
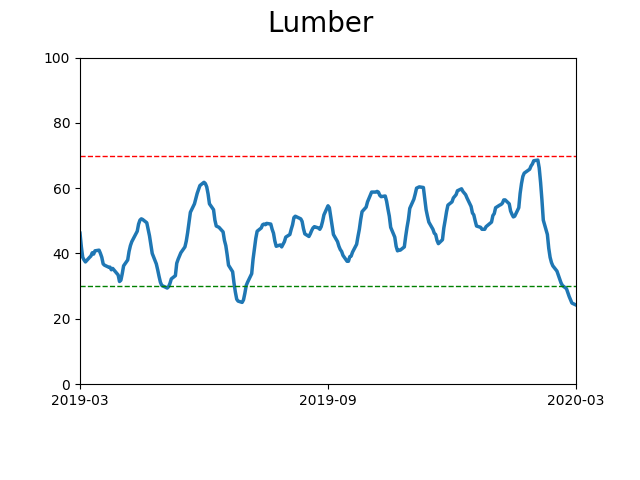
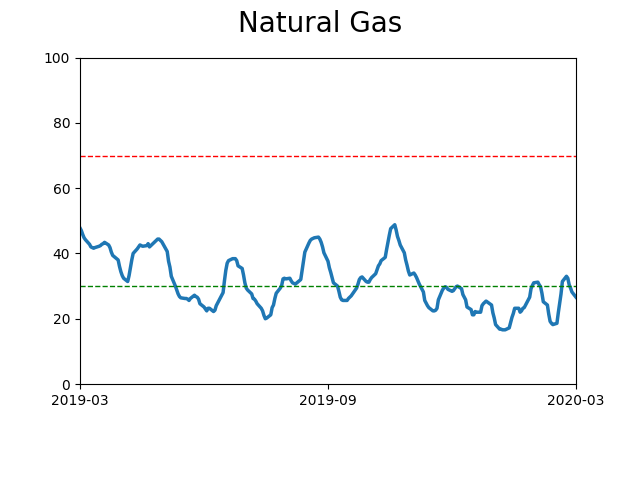
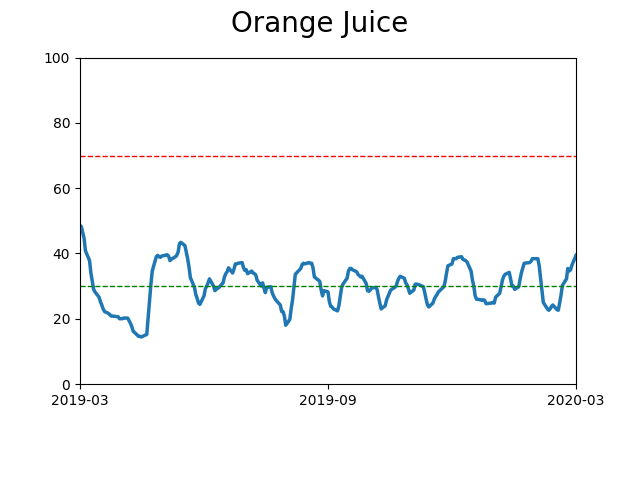
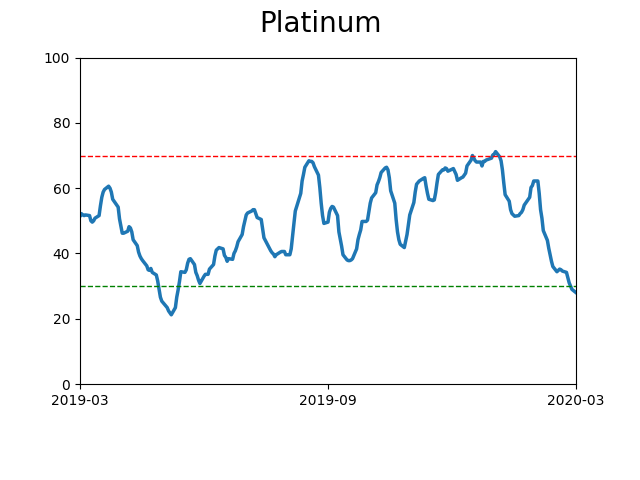
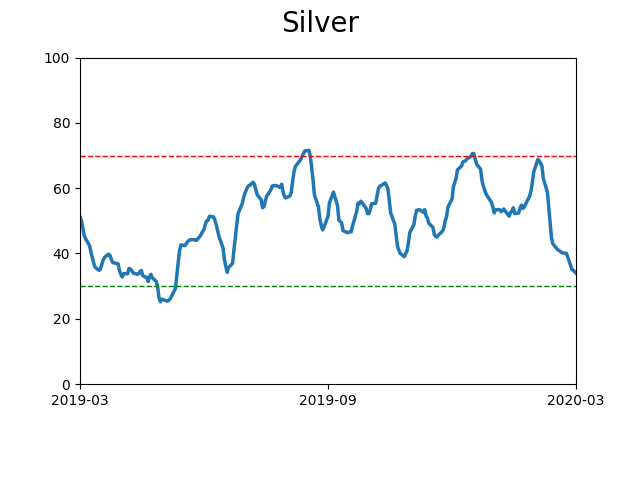
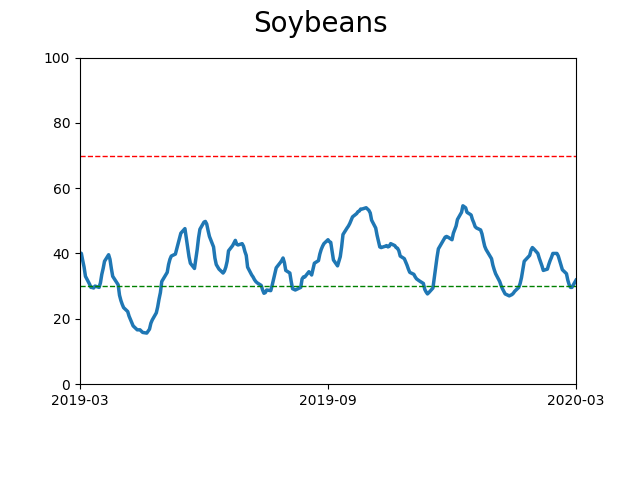
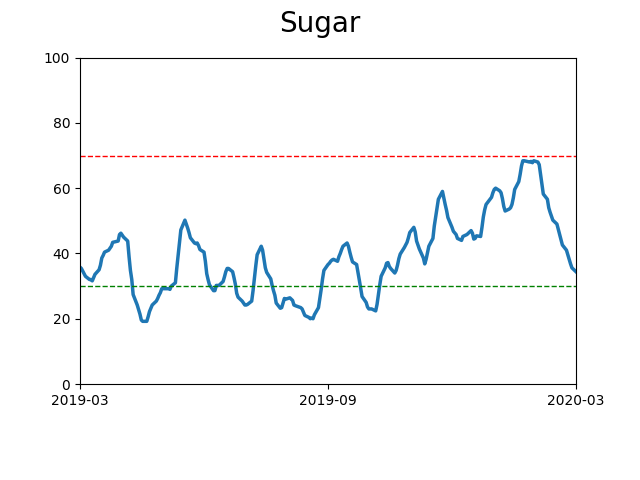
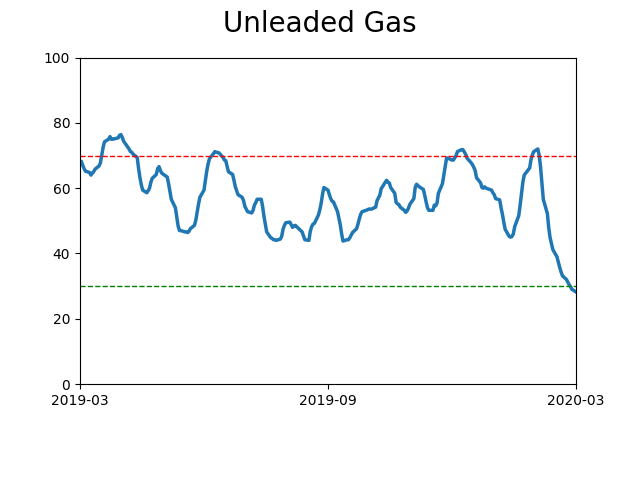
Commodity ETF's - 5-Day Moving Average
|
|