Headlines
|
|
Stocks and volatility drip lower:
Stocks dripped lower again on Monday. Oddly, so did implied volatility.
Equity Risk Premium back to extreme under-valuation:
The earnings and dividend yield on S&P 500 stocks is nearing a record high versus the yield investors can receive on Treasuries.
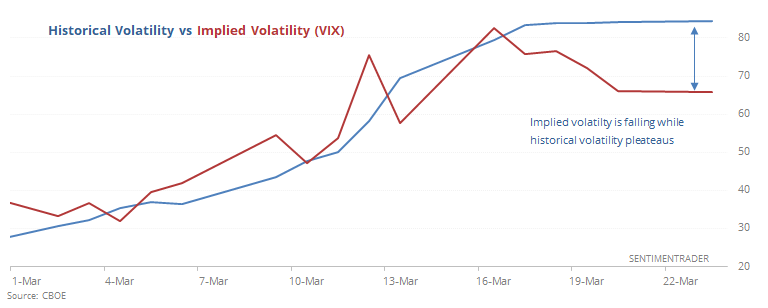
Historical vs implied volatility:
Historical volatility keeps rising even as the VIX dips.
Premium Note: This is (and isn't) like 2008:
This is like 2008 in terms of financial losses and severity of selling, but policies have been much more aggressive.
Premium Note: Largest reversals from a low:
Futures are on track for one of the largest-ever reversals.
Premium Note: Valuations across sectors & countries:
Over the weekend I wrote about the S&P 500's valuations. Let's look at valuations for other sectors and countries.
|
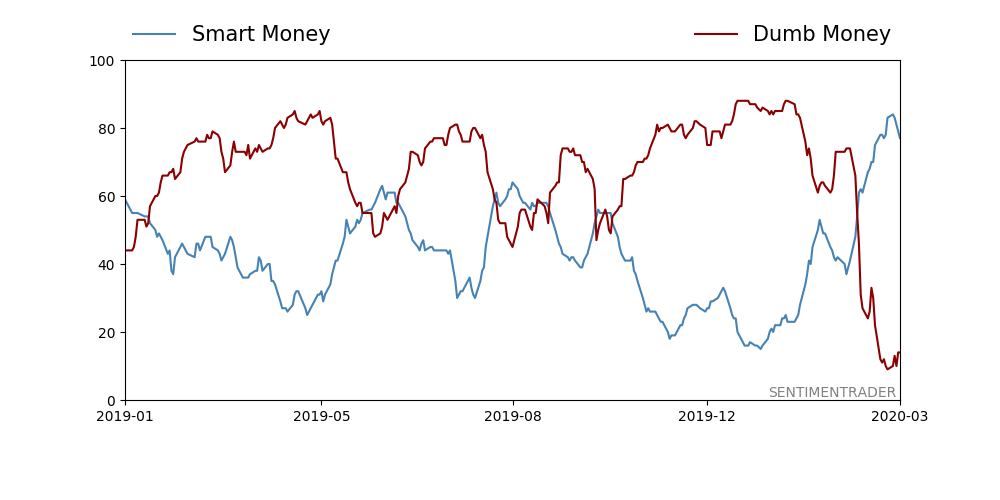
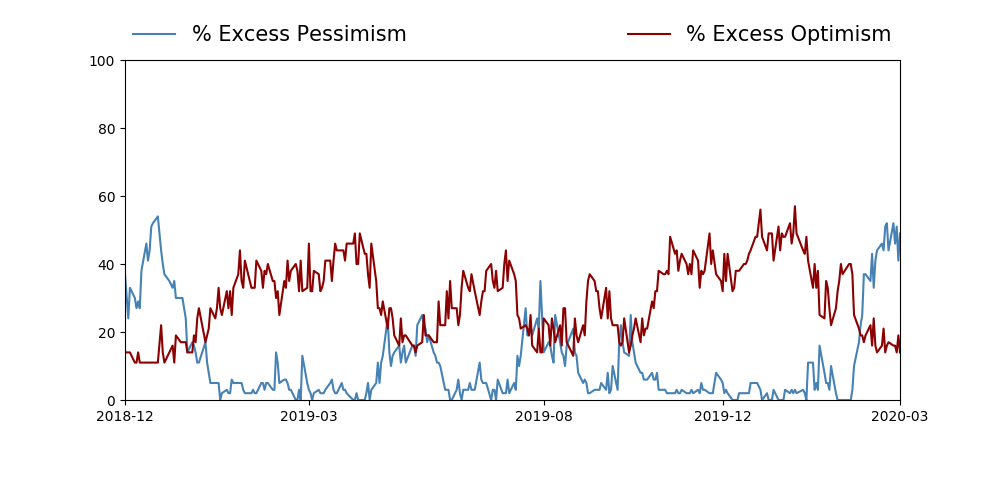
Smart / Dumb Money Confidence
|
Smart Money Confidence: 77.0%
Dumb Money Confidence: 14.0%
|
|
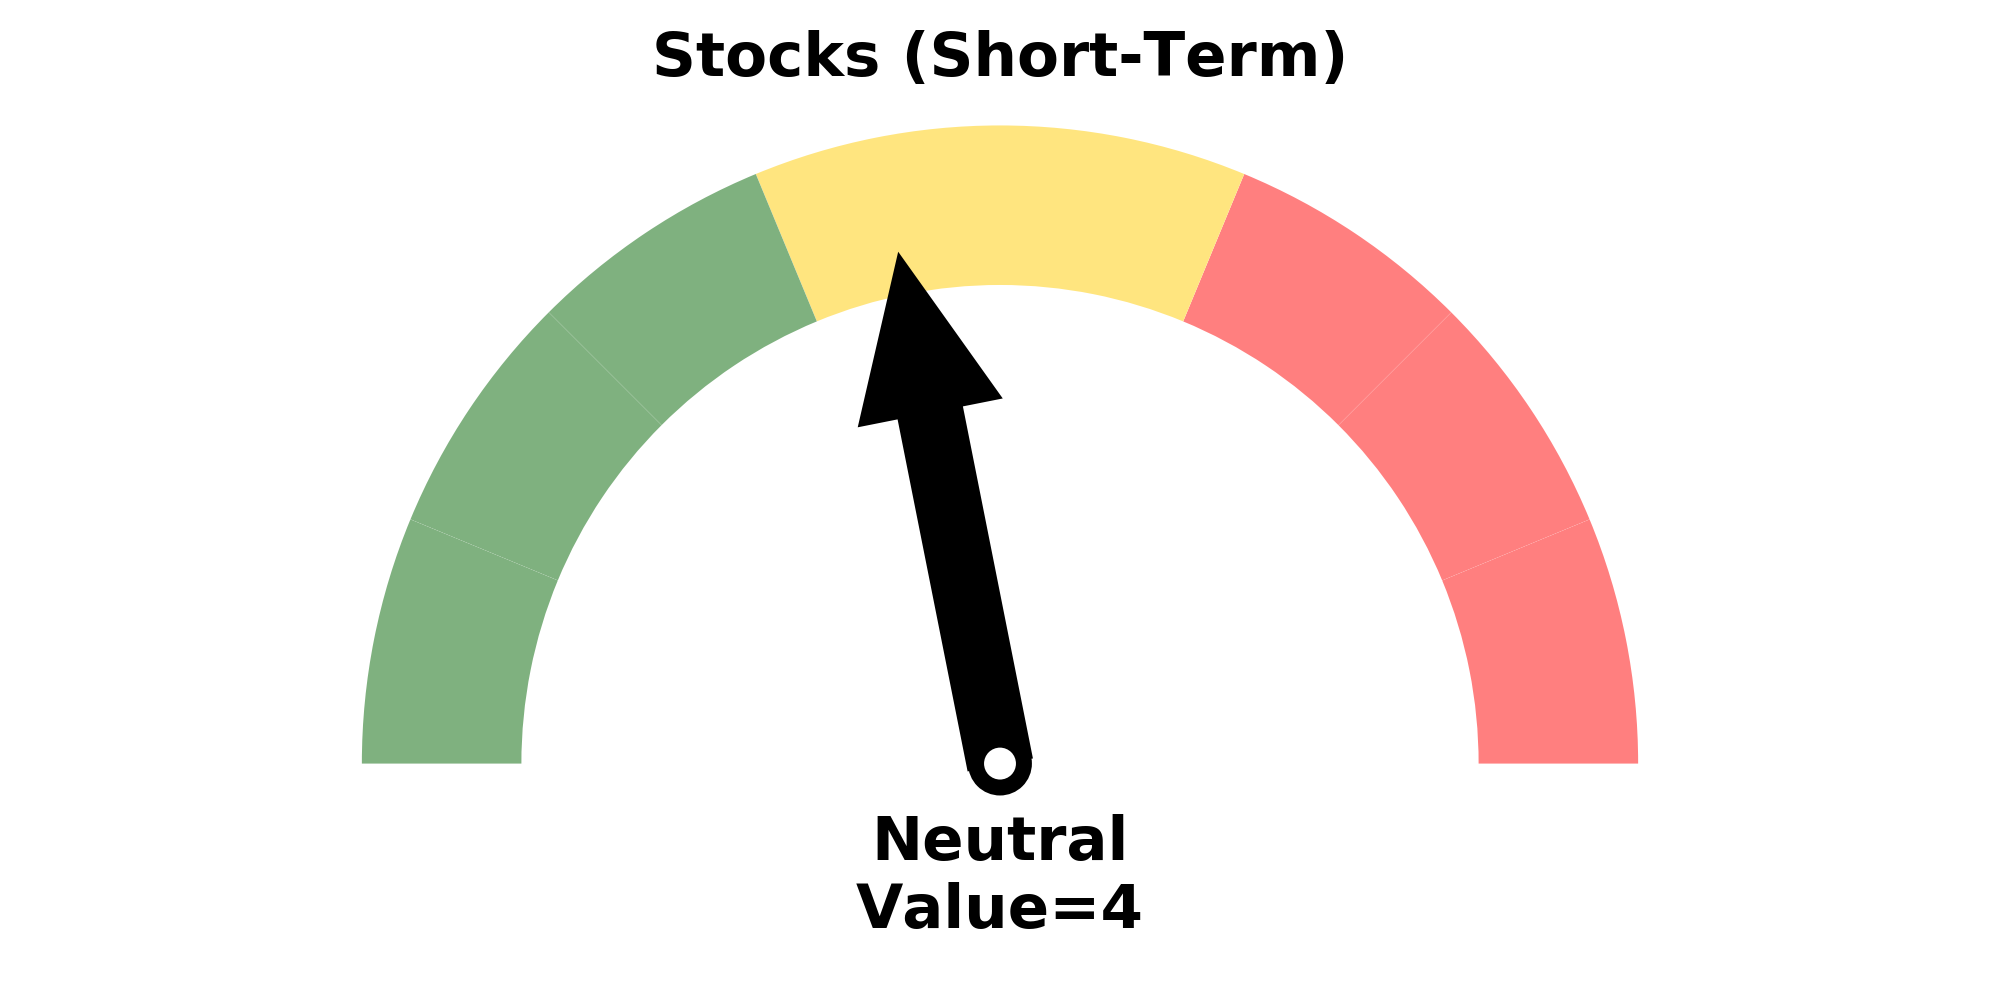
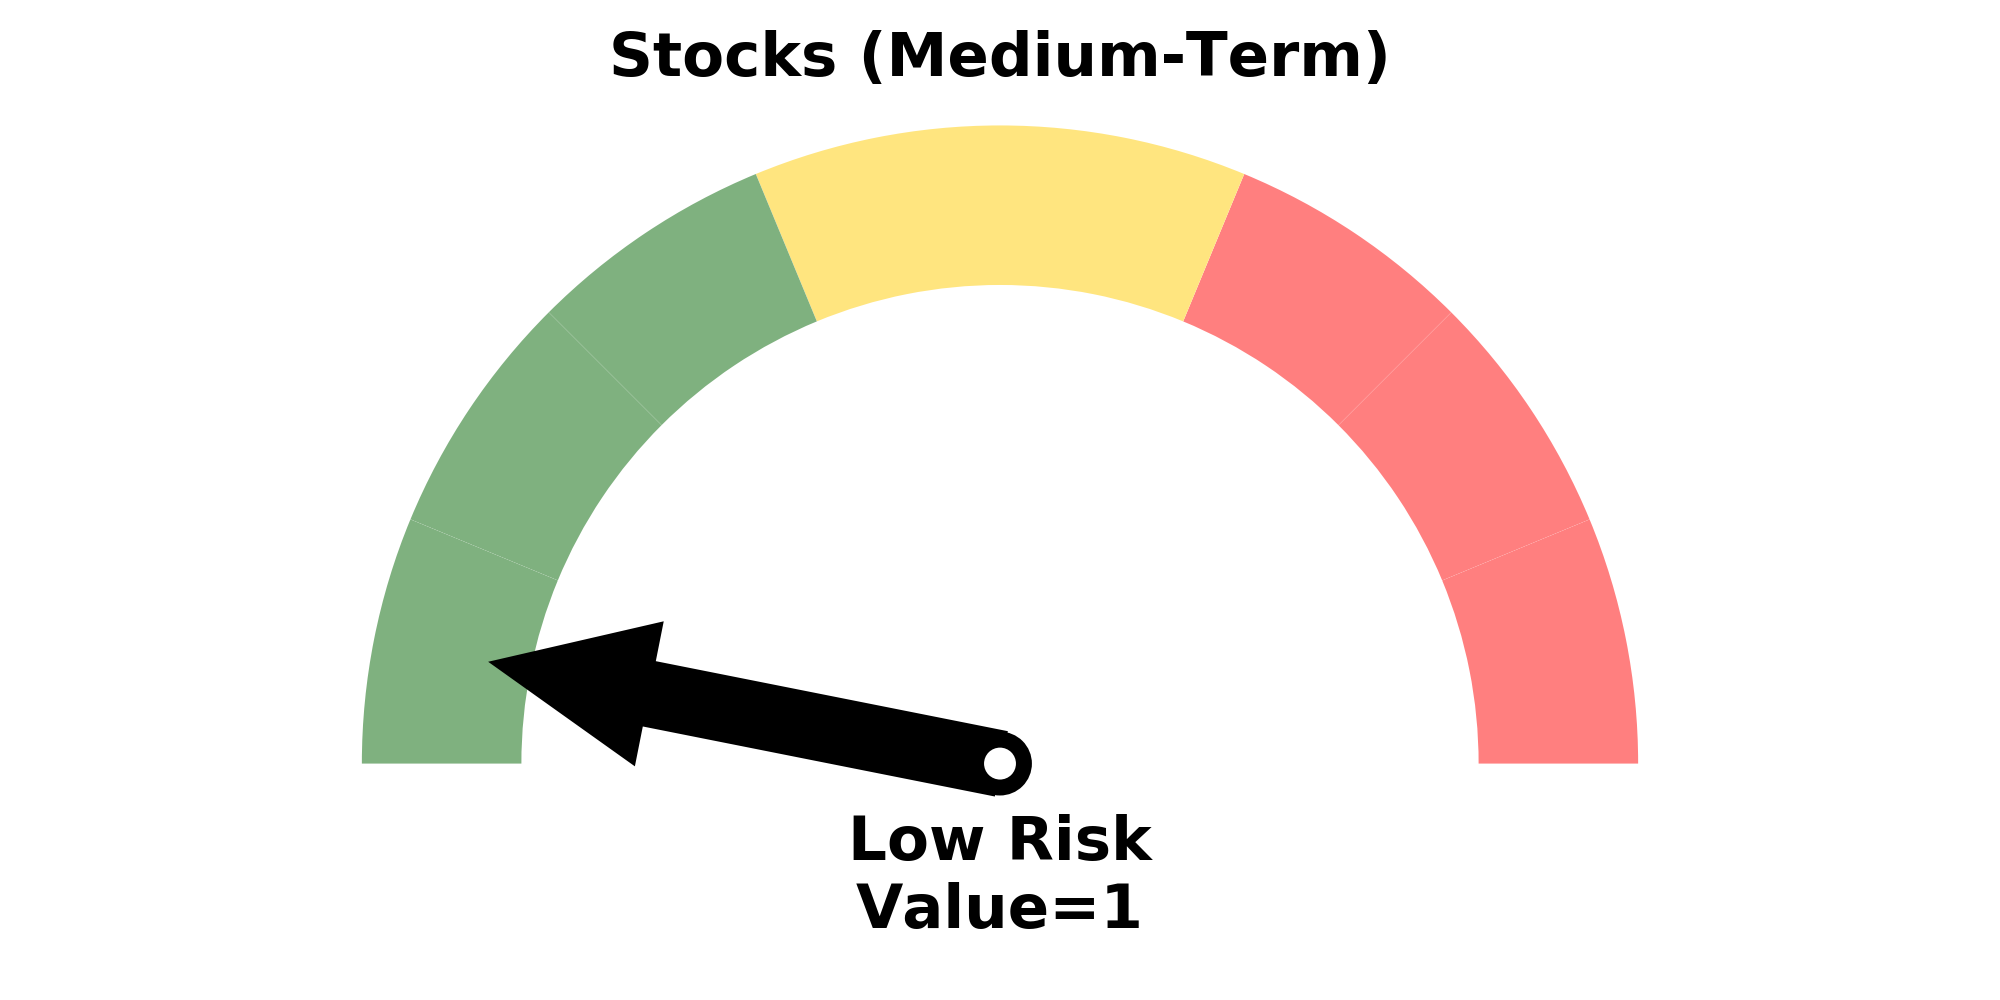
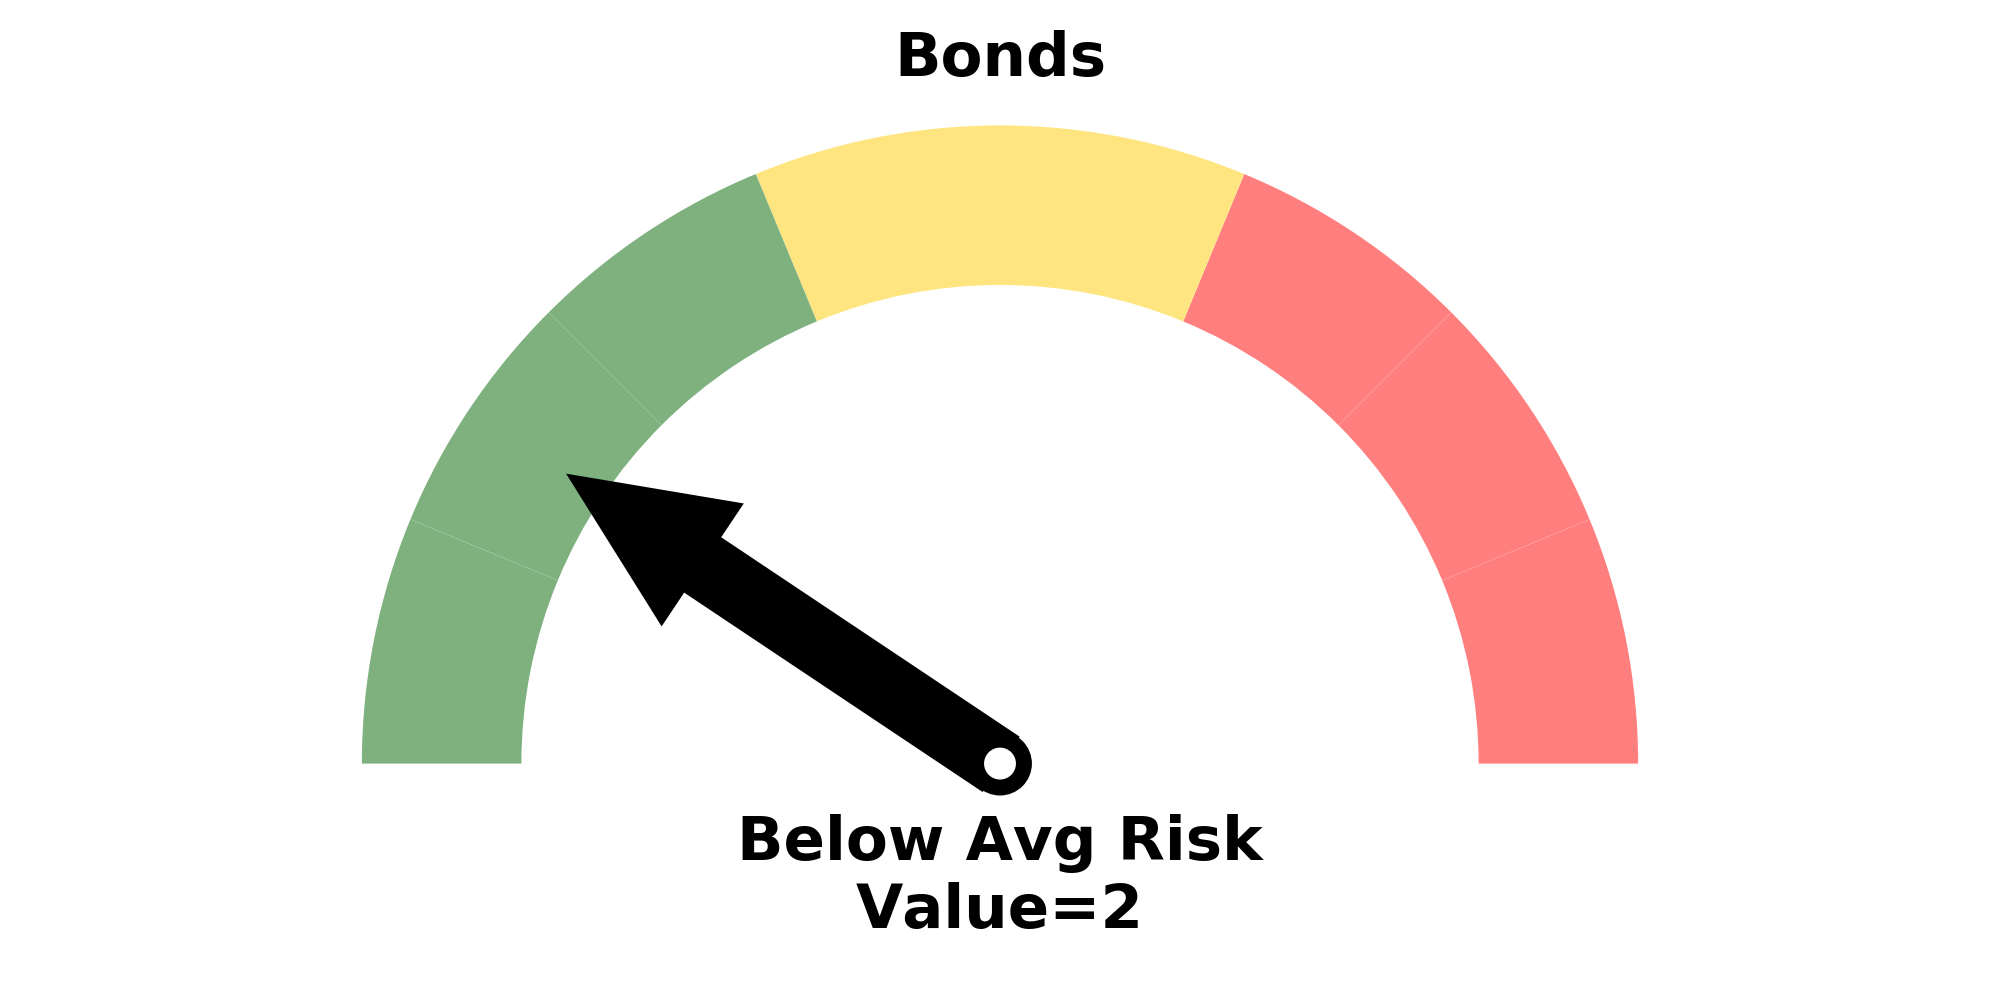
Risk Levels
Research
BOTTOM LINE
The earnings and dividend yield on S&P 500 stocks is nearing a record high versus the yield investors can receive on Treasuries.
FORECAST / TIMEFRAME
SPY -- Up, Long-Term
|
The concept of valuation is up in the air for now, since nobody knows how earnings are going to be impacted by the economic shutdowns. That's always the case in times of tumult, though the uncertainty now seems far beyond the typical.
Even though we know earnings will be dramatically lower, and dividends will also be cut, for now they're commanding a big premium over Treasuries.
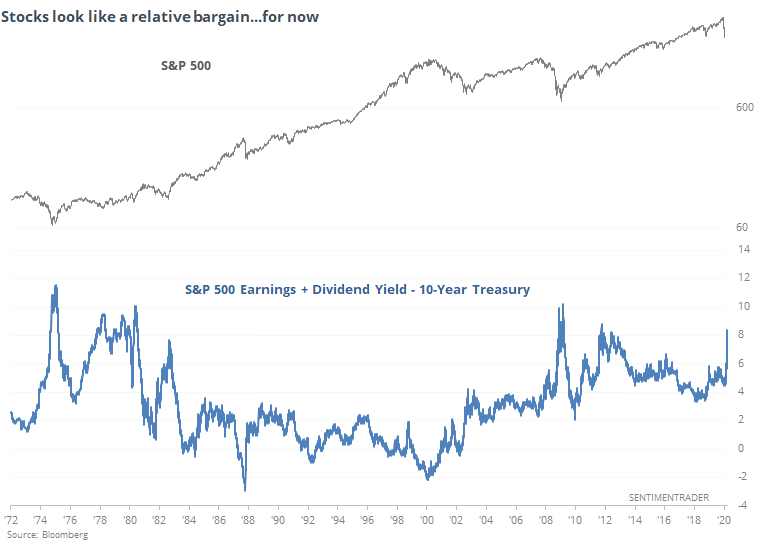
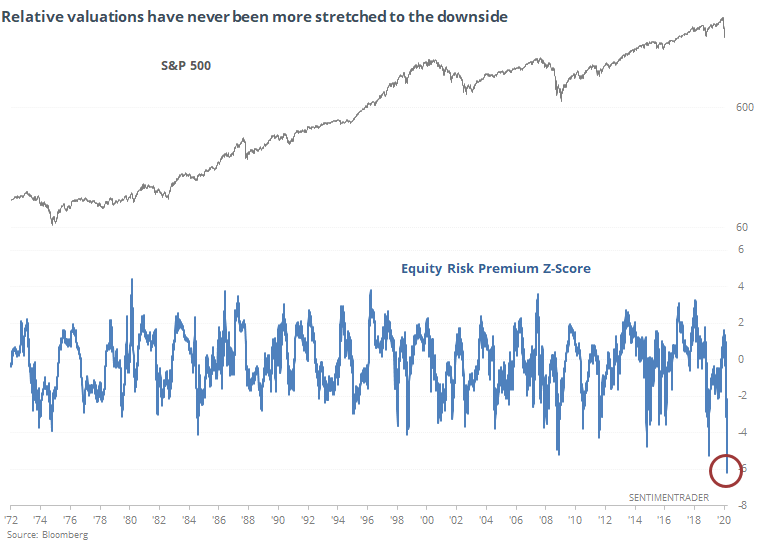
When we looked at this in December 2018, we viewed it as a z-score. At the time, the Equity Risk Premium had eclipsed 4 standard deviations. Recently, it moved beyond 6 and at a record extreme. The scale is inverted to better line up with periods of over- and under-valuation.
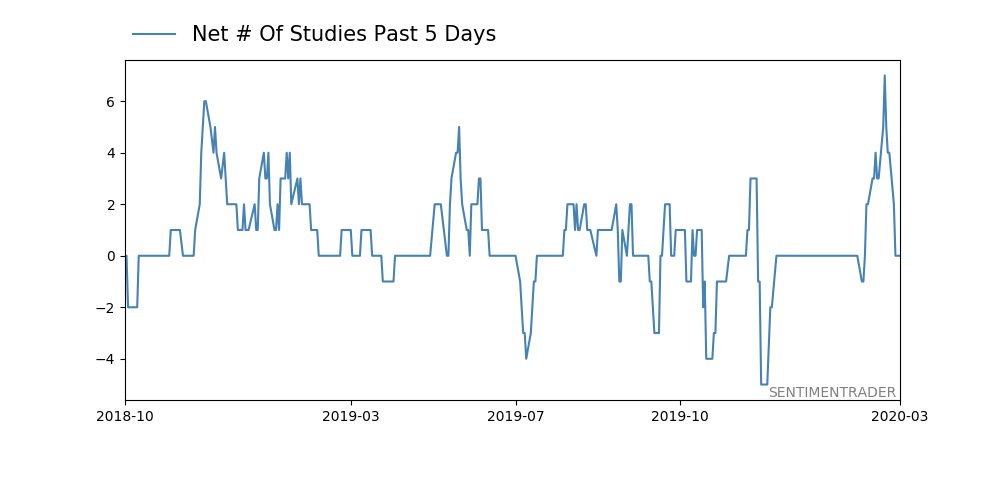
This indicator troughed a week ago. if we look at other times it exceeded -4 then didn't set a new low for a week, we get the following.
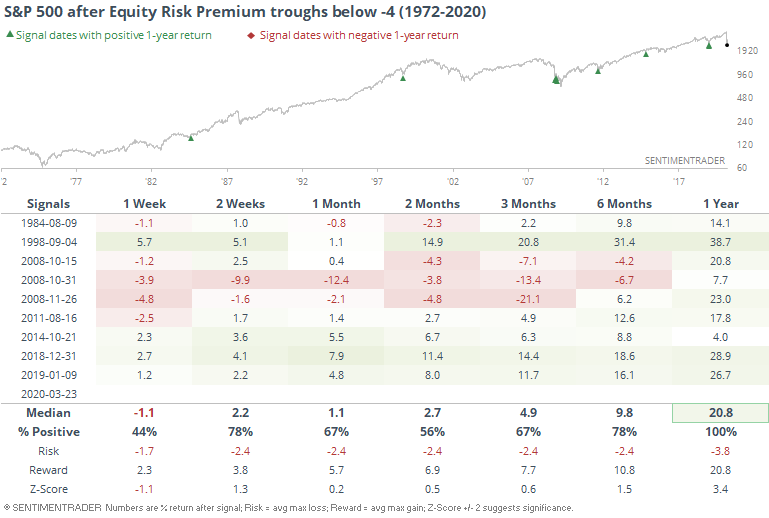
This proved to be a false bottom a couple of times in 2008 as the extreme volatility caused it to swing back and forth, and shorter-term risk was still high. But over the next year, all the signals showed a positive return, and well above average. Even with the 2008 gyrations, the overall risk/reward was still skewed heavily to the upside over the longer-term.
Clearly, earnings and dividends will drop, and probably significantly. Using the trailing 12 months, which is what we use here, it's possible that yields won't dip too much if we get a quick recovery in Q3 and Q4. Even so, we've likely seen the trough for this Equity Risk Premium, and it's been a good long-term sign when hitting such an extreme.
BOTTOM LINE
Historical volatility keeps rising even as the VIX dips.
FORECAST / TIMEFRAME
|
The VIX tends to get hyper-attention as a sentiment indicator. Which is why it's confusing that over the past week the VIX has been falling even while stocks remain extremely volatile, hitting new lows on Monday.
The historical volatility measure we calculate continues to climb and just reached 84.5. The VIX, meanwhile, peaked above 80 a week ago and has been dropping.
This has only happened twice before, which probably isn't much of a surprise.
After the height of the panic in 2008, stocks were swinging wildly in both directions, but options traders were starting to price in lower volatility going forward. We tend to see that when there is more two-sided volatility instead of just a constant decline.
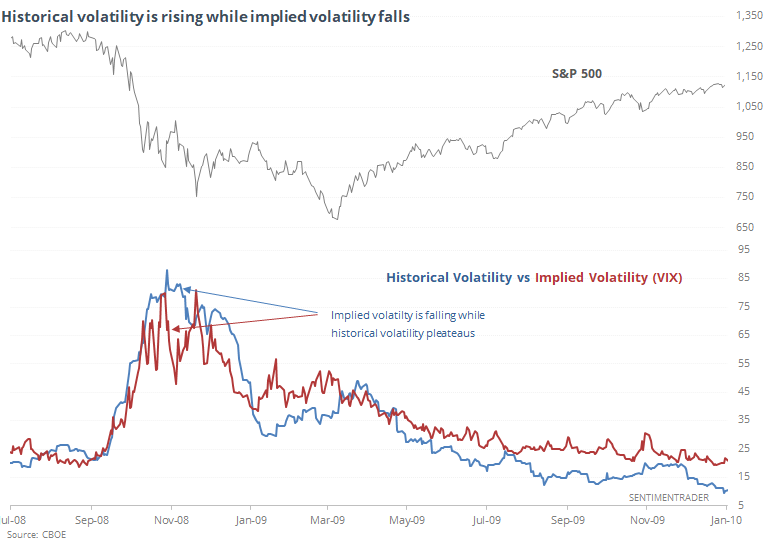
It was too early to call a bottom then, though. Even though stocks managed to string together a few up days, it wasn't the end of the decline - just the end of the worst of one-sided volatility.
In 1987, there was a more severe and immediate drop-off in the VIX, while historical volatility kept climbing.
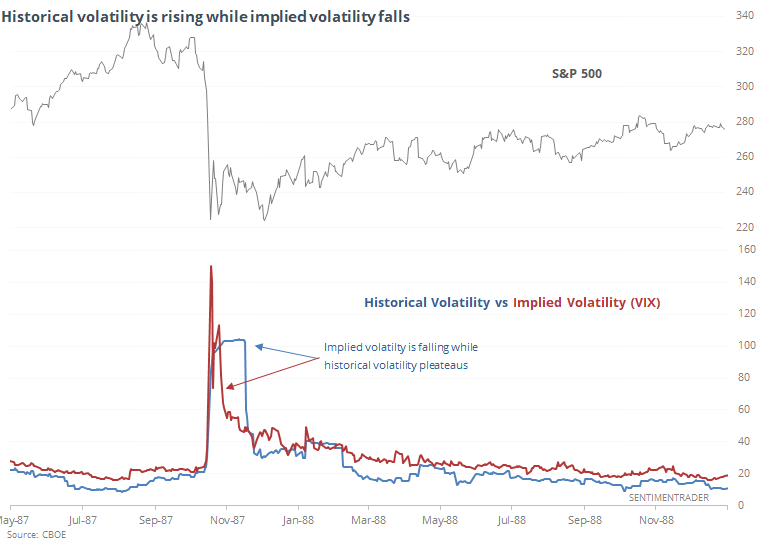
It's worth noting that both times, stocks suffered another leg (at least) lower after the worst of the panic subsided.
The best and most consistent gains didn't come until historical volatility dropped below the VIX and stayed there consistently. At the rate we're going now, that would take weeks - we'd need to see the daily price swings calm down substantially while options traders remain somewhat nervous.
BOTTOM LINE
Stocks dripped lower again on Monday. Oddly, so did implied volatility.
FORECAST / TIMEFRAME
|
Stocks dripped lower again on Monday. Oddly, so did implied volatility. We saw earlier that options traders are pricing in lower volatility ahead even though historical volatility continues to rise, but even so this is not something we've seen before.
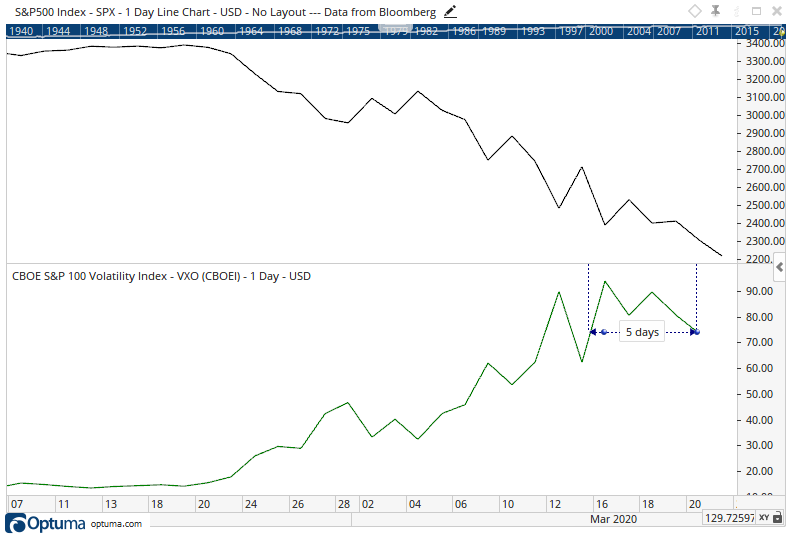
Until Friday (and again today), the VIX or VXO (the old VIX calculation) had never closed at a 5-day low on a day the S&P 500 closed at a 52-week low. Or even a 26-week low.
There have been a few times the S&P closed at a 12-week low then the VIX or VXO sunk to its lowest level in a week.
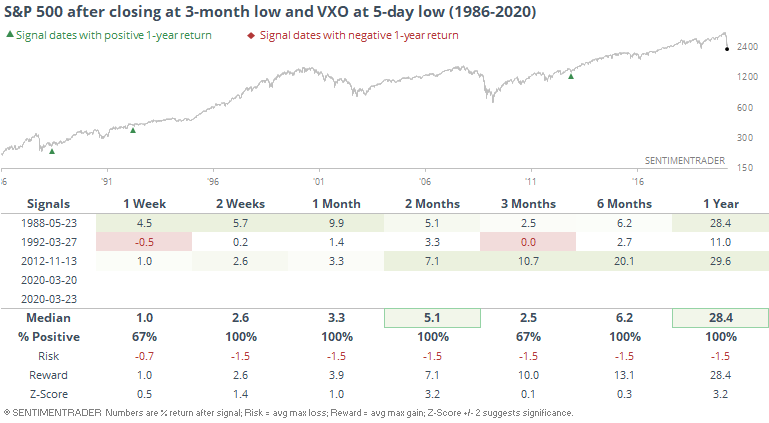
It's getting hard to find any precedents with more than n=3 lately, so it's hard to put a lot of weight on the signals. Generally, it's a good sign to see implied volatility tick lower, so it should be a positive.
Active Studies
| Time Frame | Bullish | Bearish | | Short-Term | 0 | 1 | | Medium-Term | 14 | 14 | | Long-Term | 24 | 3 |
|
Indicators at Extremes
Portfolio
| Position | Weight % | Added / Reduced | Date | | Stocks | 73.2 | Added 31.3% | 2020-03-17 | | Bonds | 0.0 | Reduced 6.7% | 2020-02-28 | | Commodities | 5.5 | Added 2.4%
| 2020-02-28 | | Precious Metals | 0.0 | Reduced 3.6% | 2020-02-28 | | Special Situations | 0.0 | Reduced 31.9% | 2020-03-17 | | Cash | 21.3 | | |
|
Updates (Changes made today are underlined)
In the first months of the year, we saw manic trading activity. From big jumps in specific stocks to historic highs in retail trading activity to record highs in household confidence to almost unbelievable confidence among options traders. All of that has come amid a market where the average stock can’t keep up with their indexes. There were signs of waning momentum in stocks underlying the major averages, which started triggering technical warning signs in late January. The kinds of extremes we saw in December and January typically take months to wear away, but the type of selling we’ve seen over the past month has gone a long way toward getting there. When we place the kind of moves we’ve seen over the past two weeks into the context of coming off an all-time high, there has been a high probability of a multi-month rebound. The volatility we’ve seen lately is extremely compelling from a medium-term point of view. Virtually everything we’ve looked at suggests a strong probability of gains over the next several months, even within the context of a potential bear market, and even from what had been higher prices. With an increasing sense that government entities will finally do anything it takes, and signs of progress in isolating and testing for the virus, I added to my exposure. I’m still holding 20% cash and don’t see that changing much at this point. Energy stocks. That was atrocious. The worst move I’ve ever made in this account. I’ve taken some very large sectors bets in this account over the years, like oil & gas explorers in 2016 and gold miners in 2018, and there is always some shorter-term discomfort because the news flow is so horrid. I don’t mind that in the least. But I do mind when stocks don’t do what they should. It didn’t help going large on these stocks right before what could be considered a true Black Swan, but so it goes. I’m more concerned that there has been no reaction since then and they continue to underperform despite…well, everything. They very well could rebound in the months ahead, but at this point I feel I have zero edge and don’t know what’s going on there, so I rotated out of that sector and into a general broad-market fund.
|
|
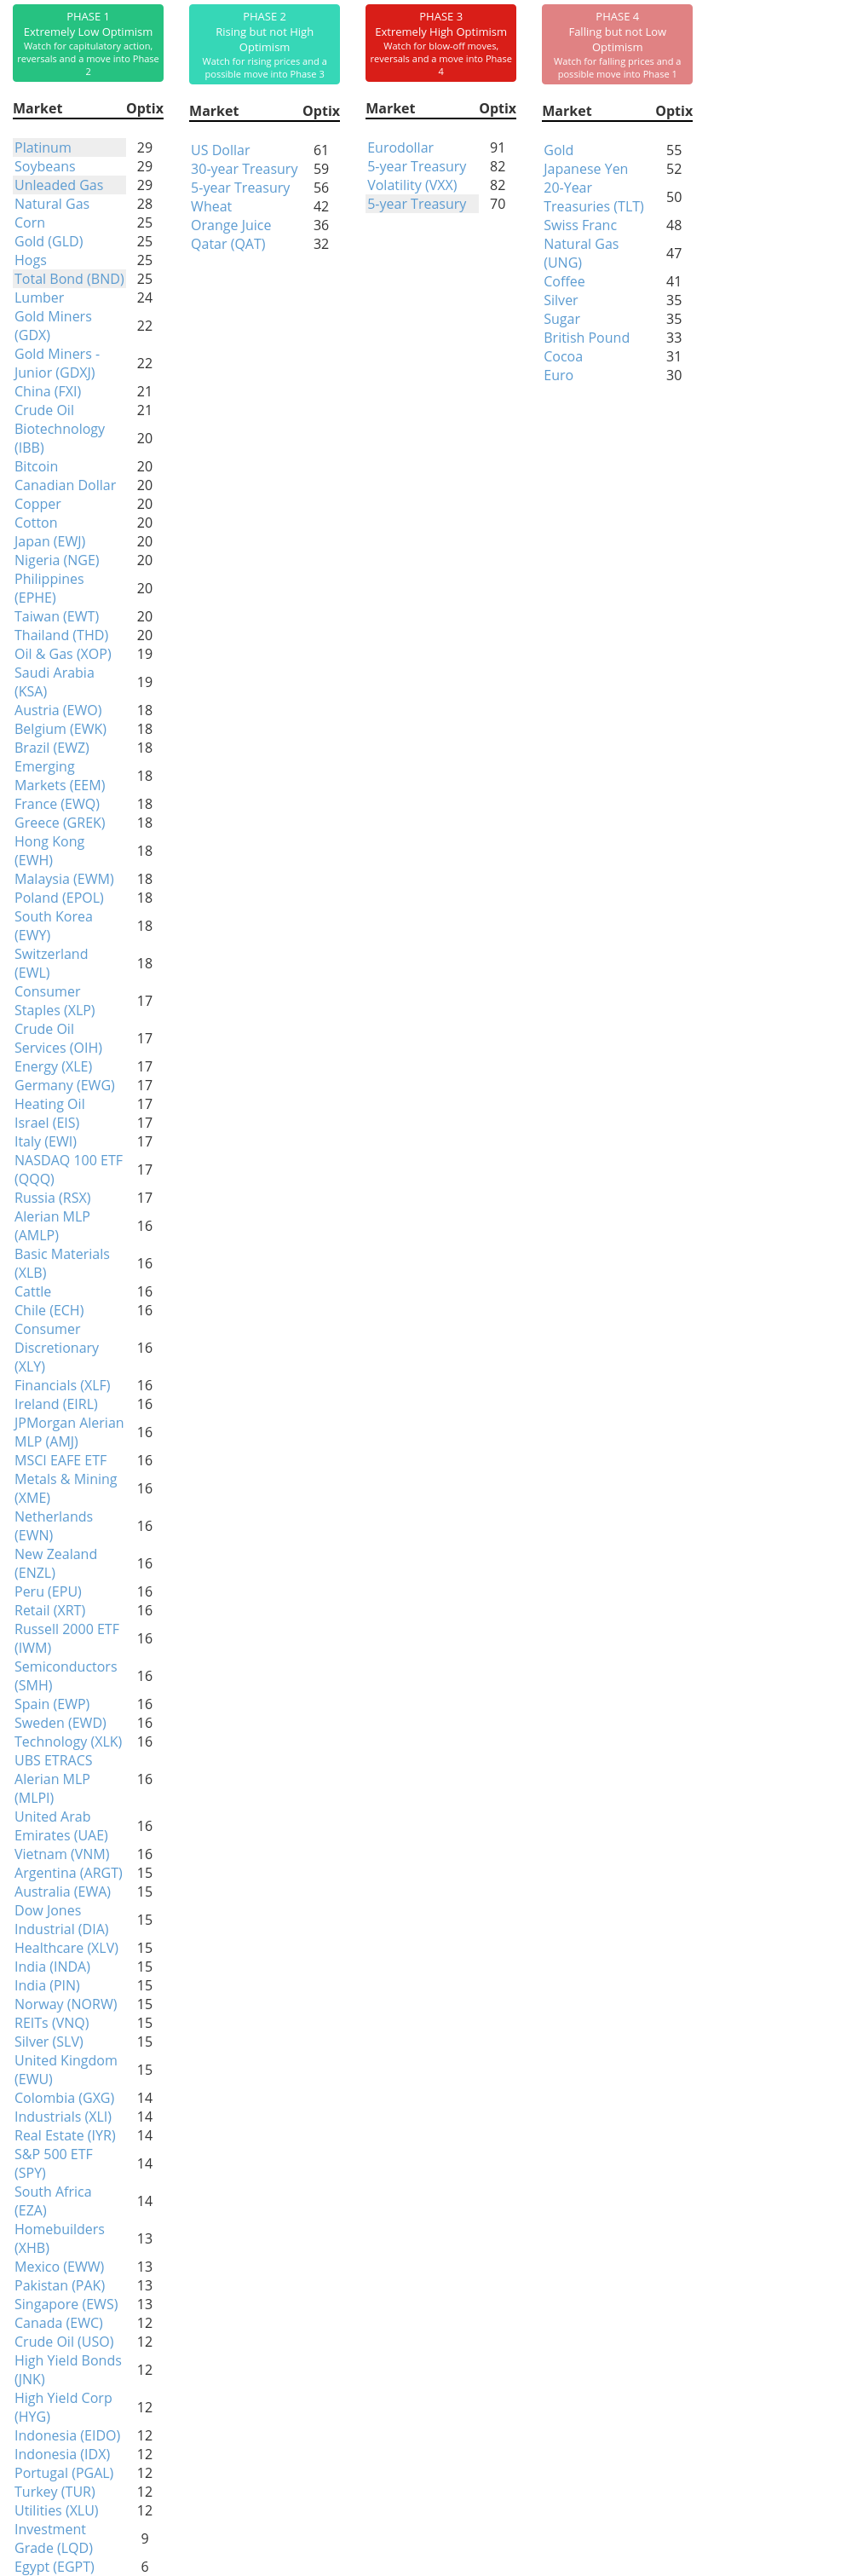
Phase Table
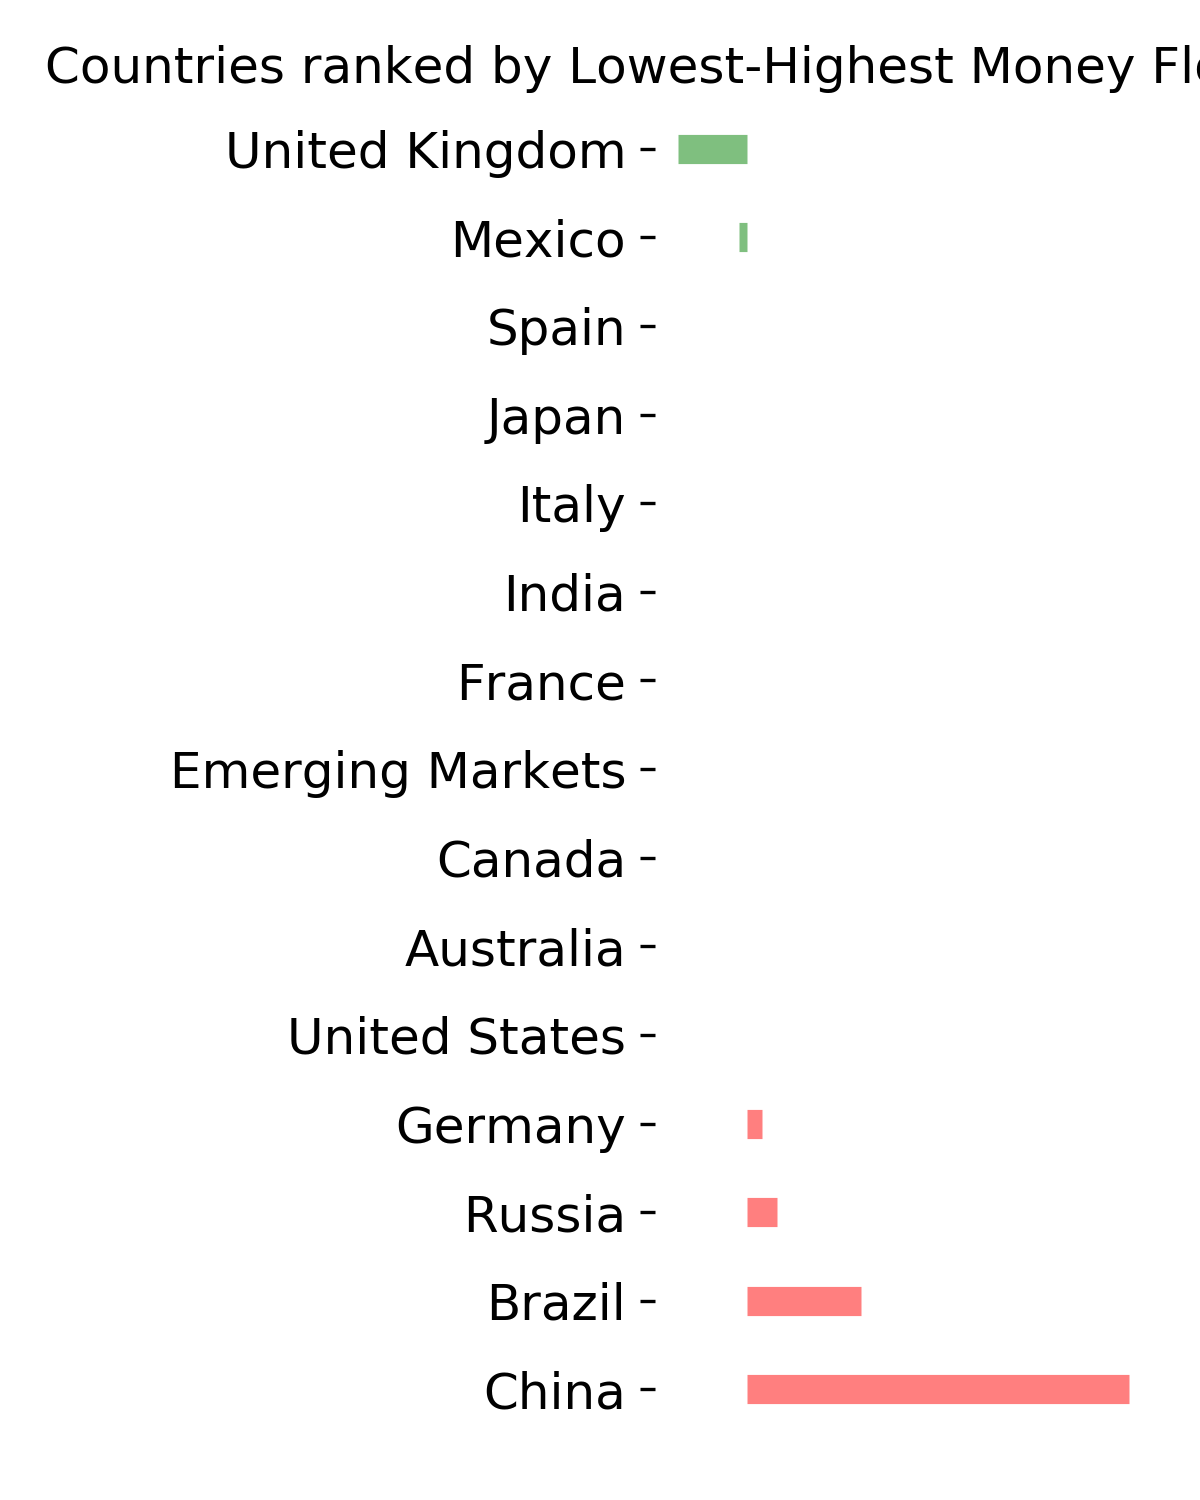
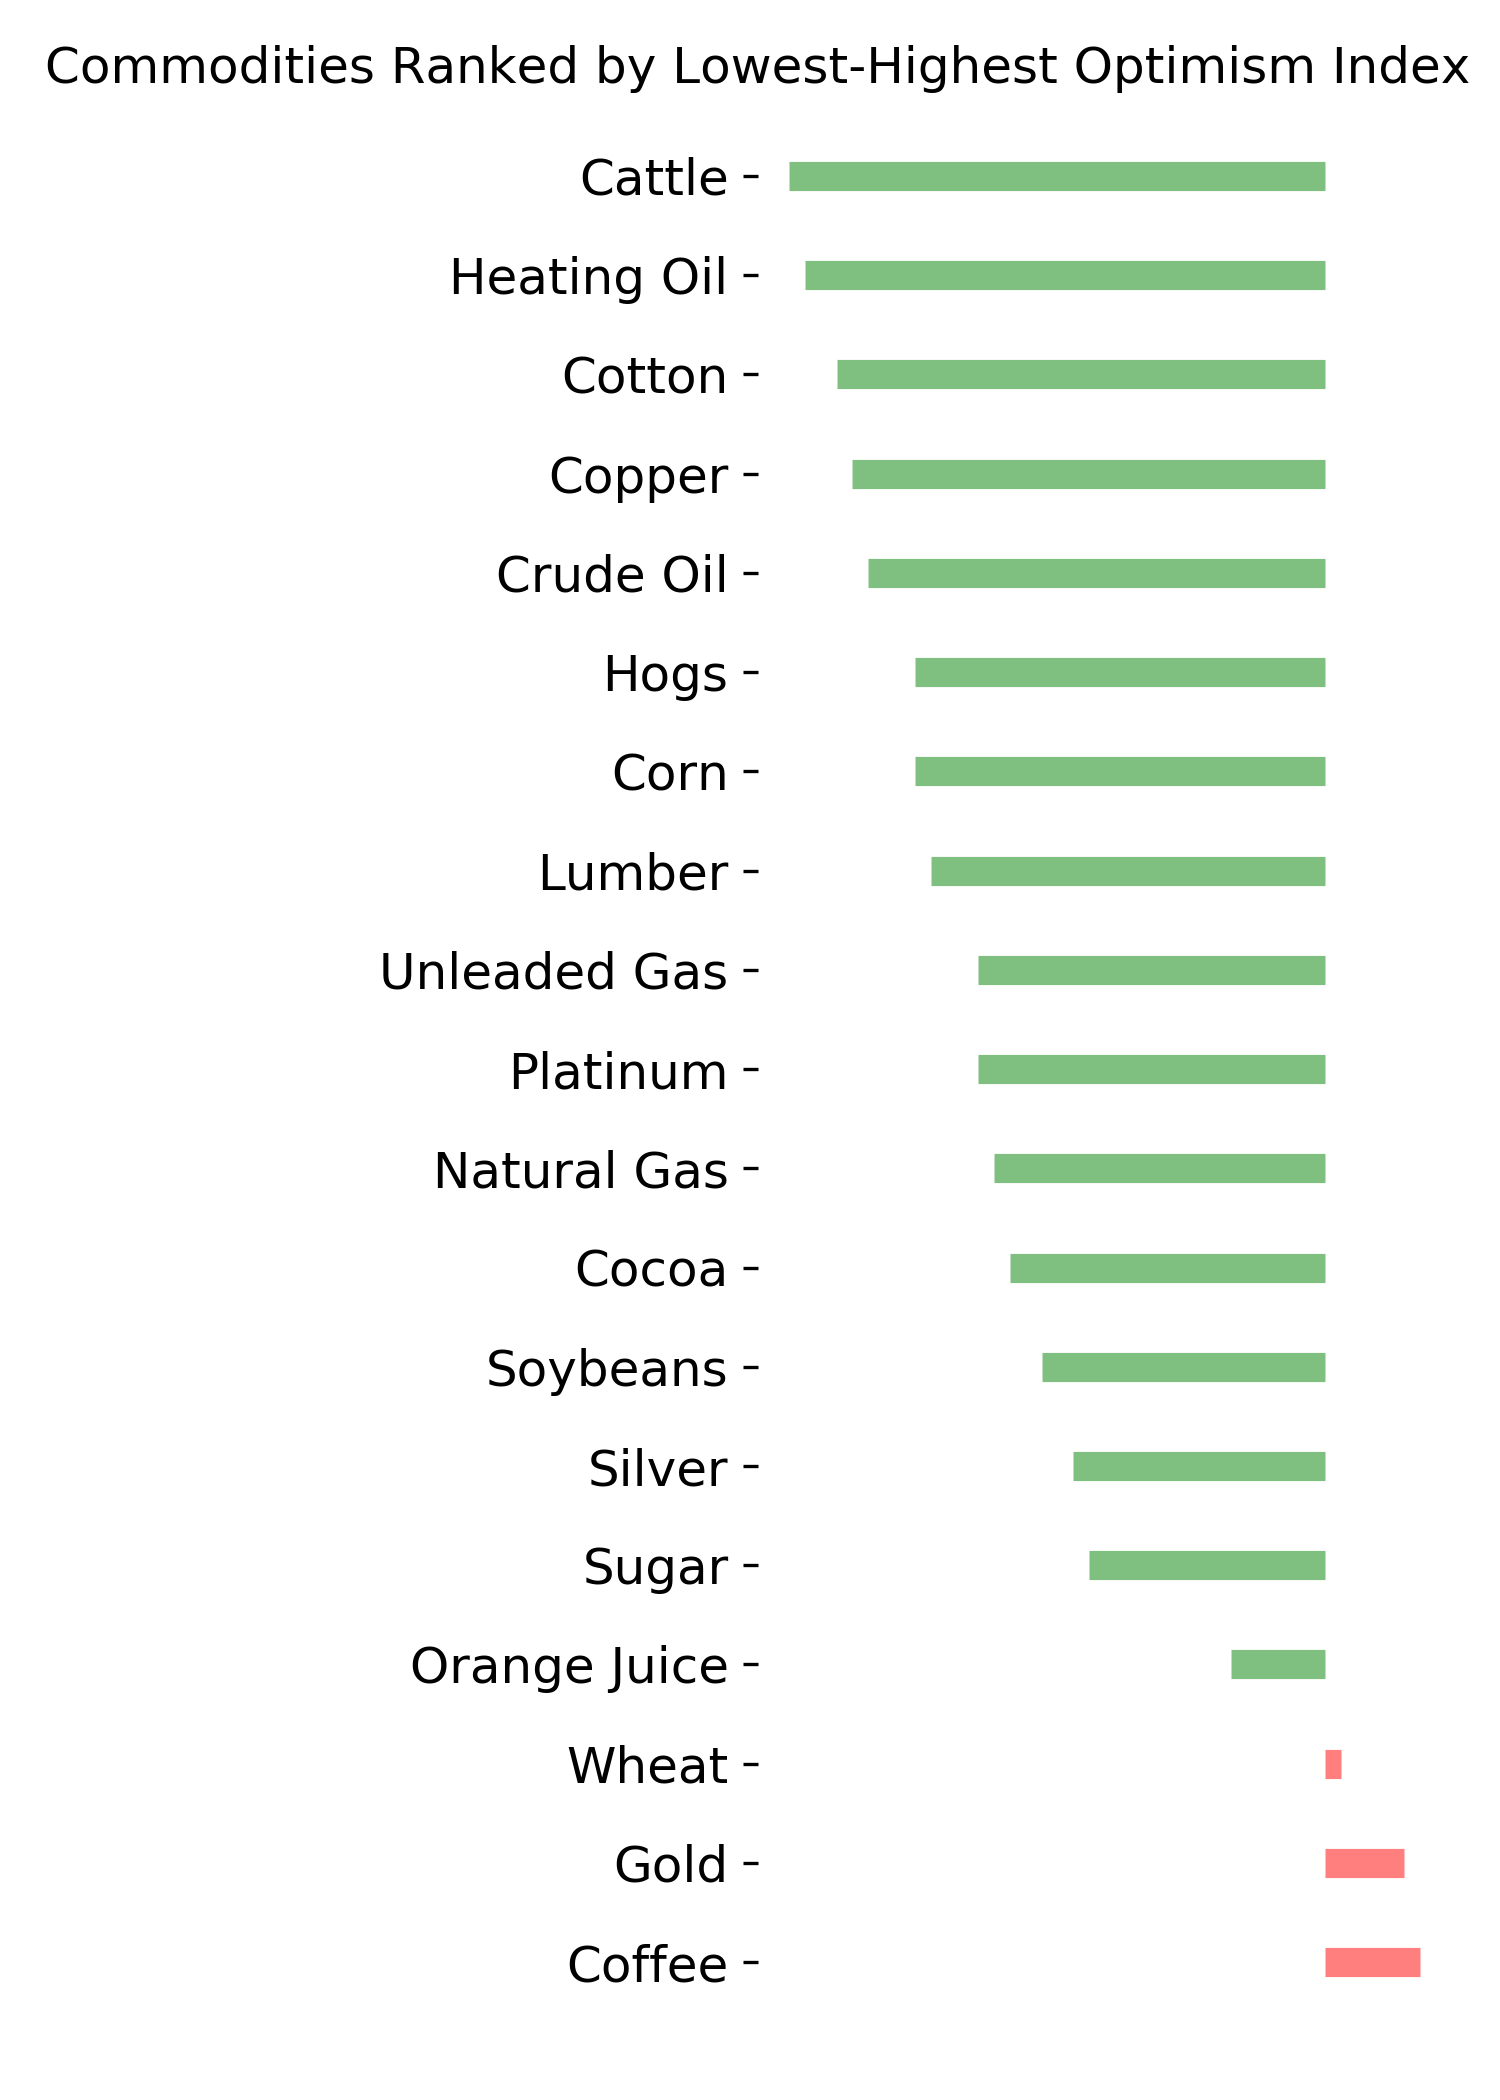
Ranks
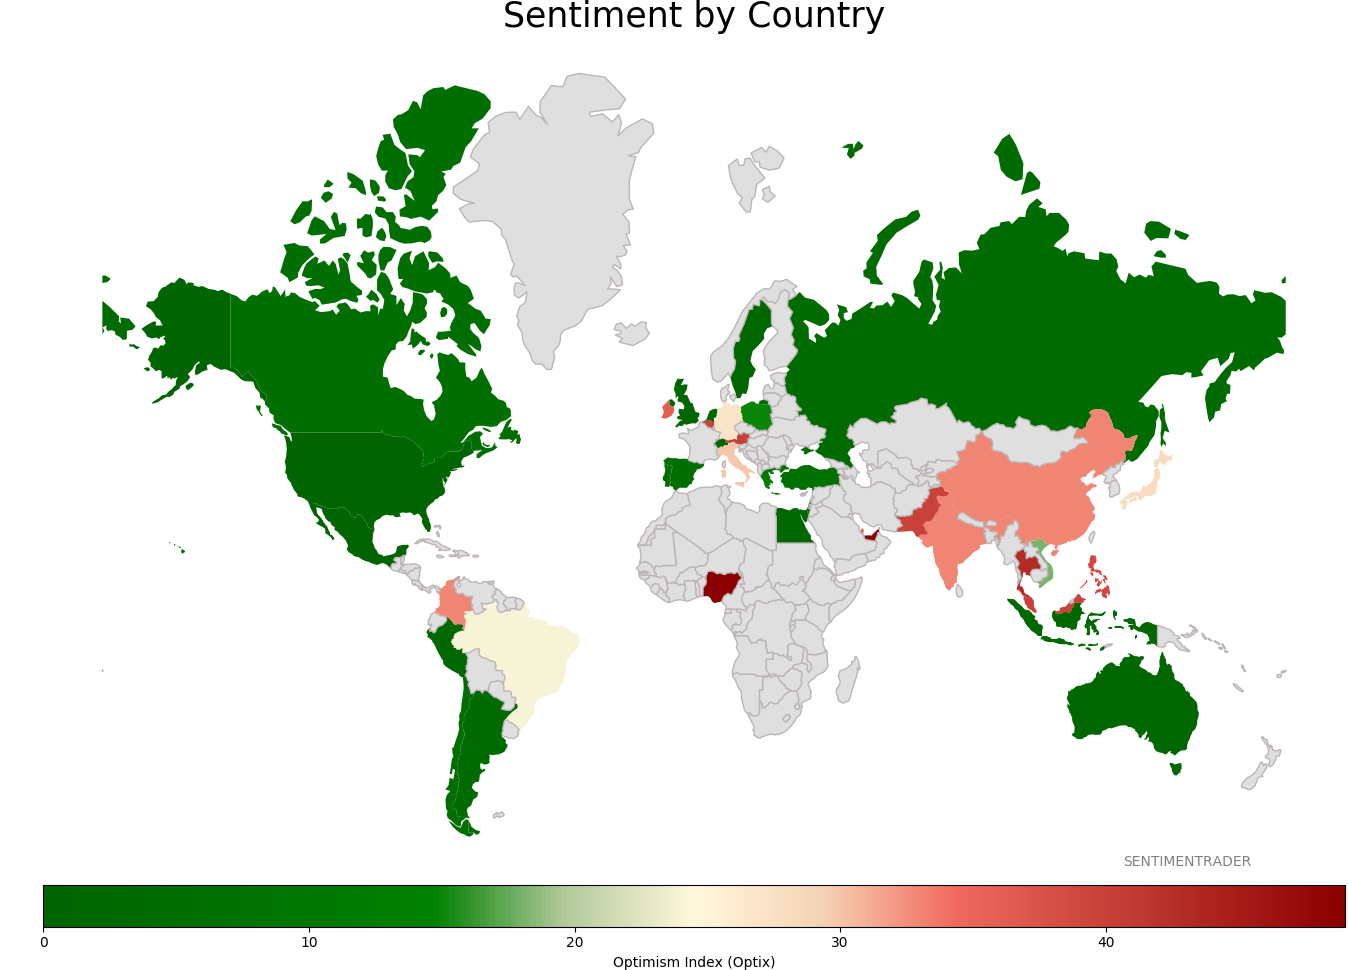
Sentiment Around The World
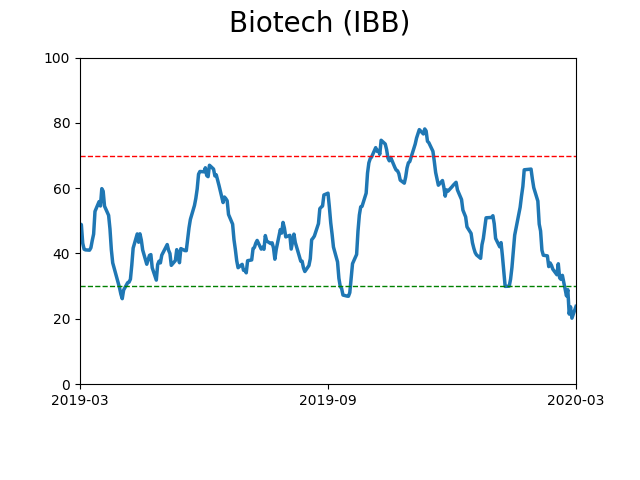
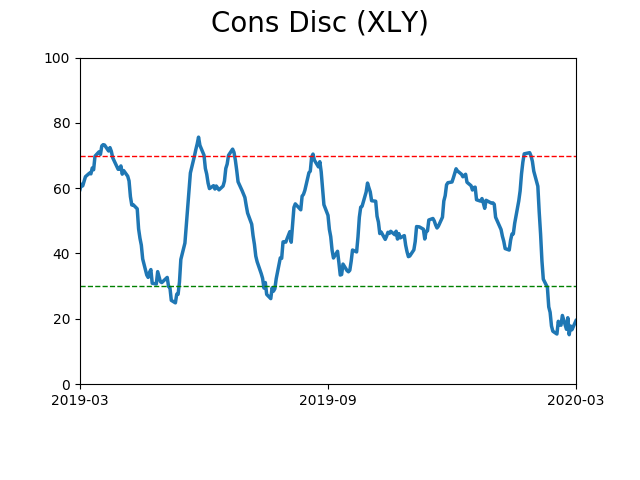
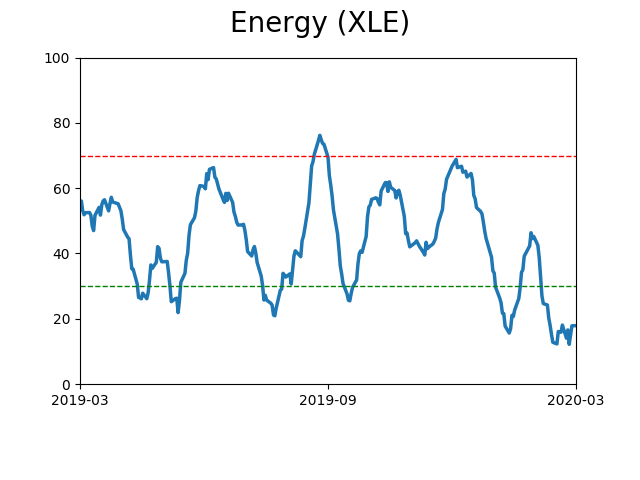
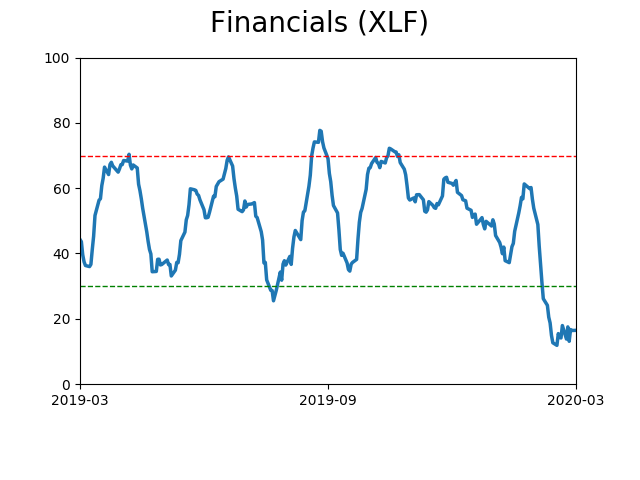
Optimism Index Thumbnails
|
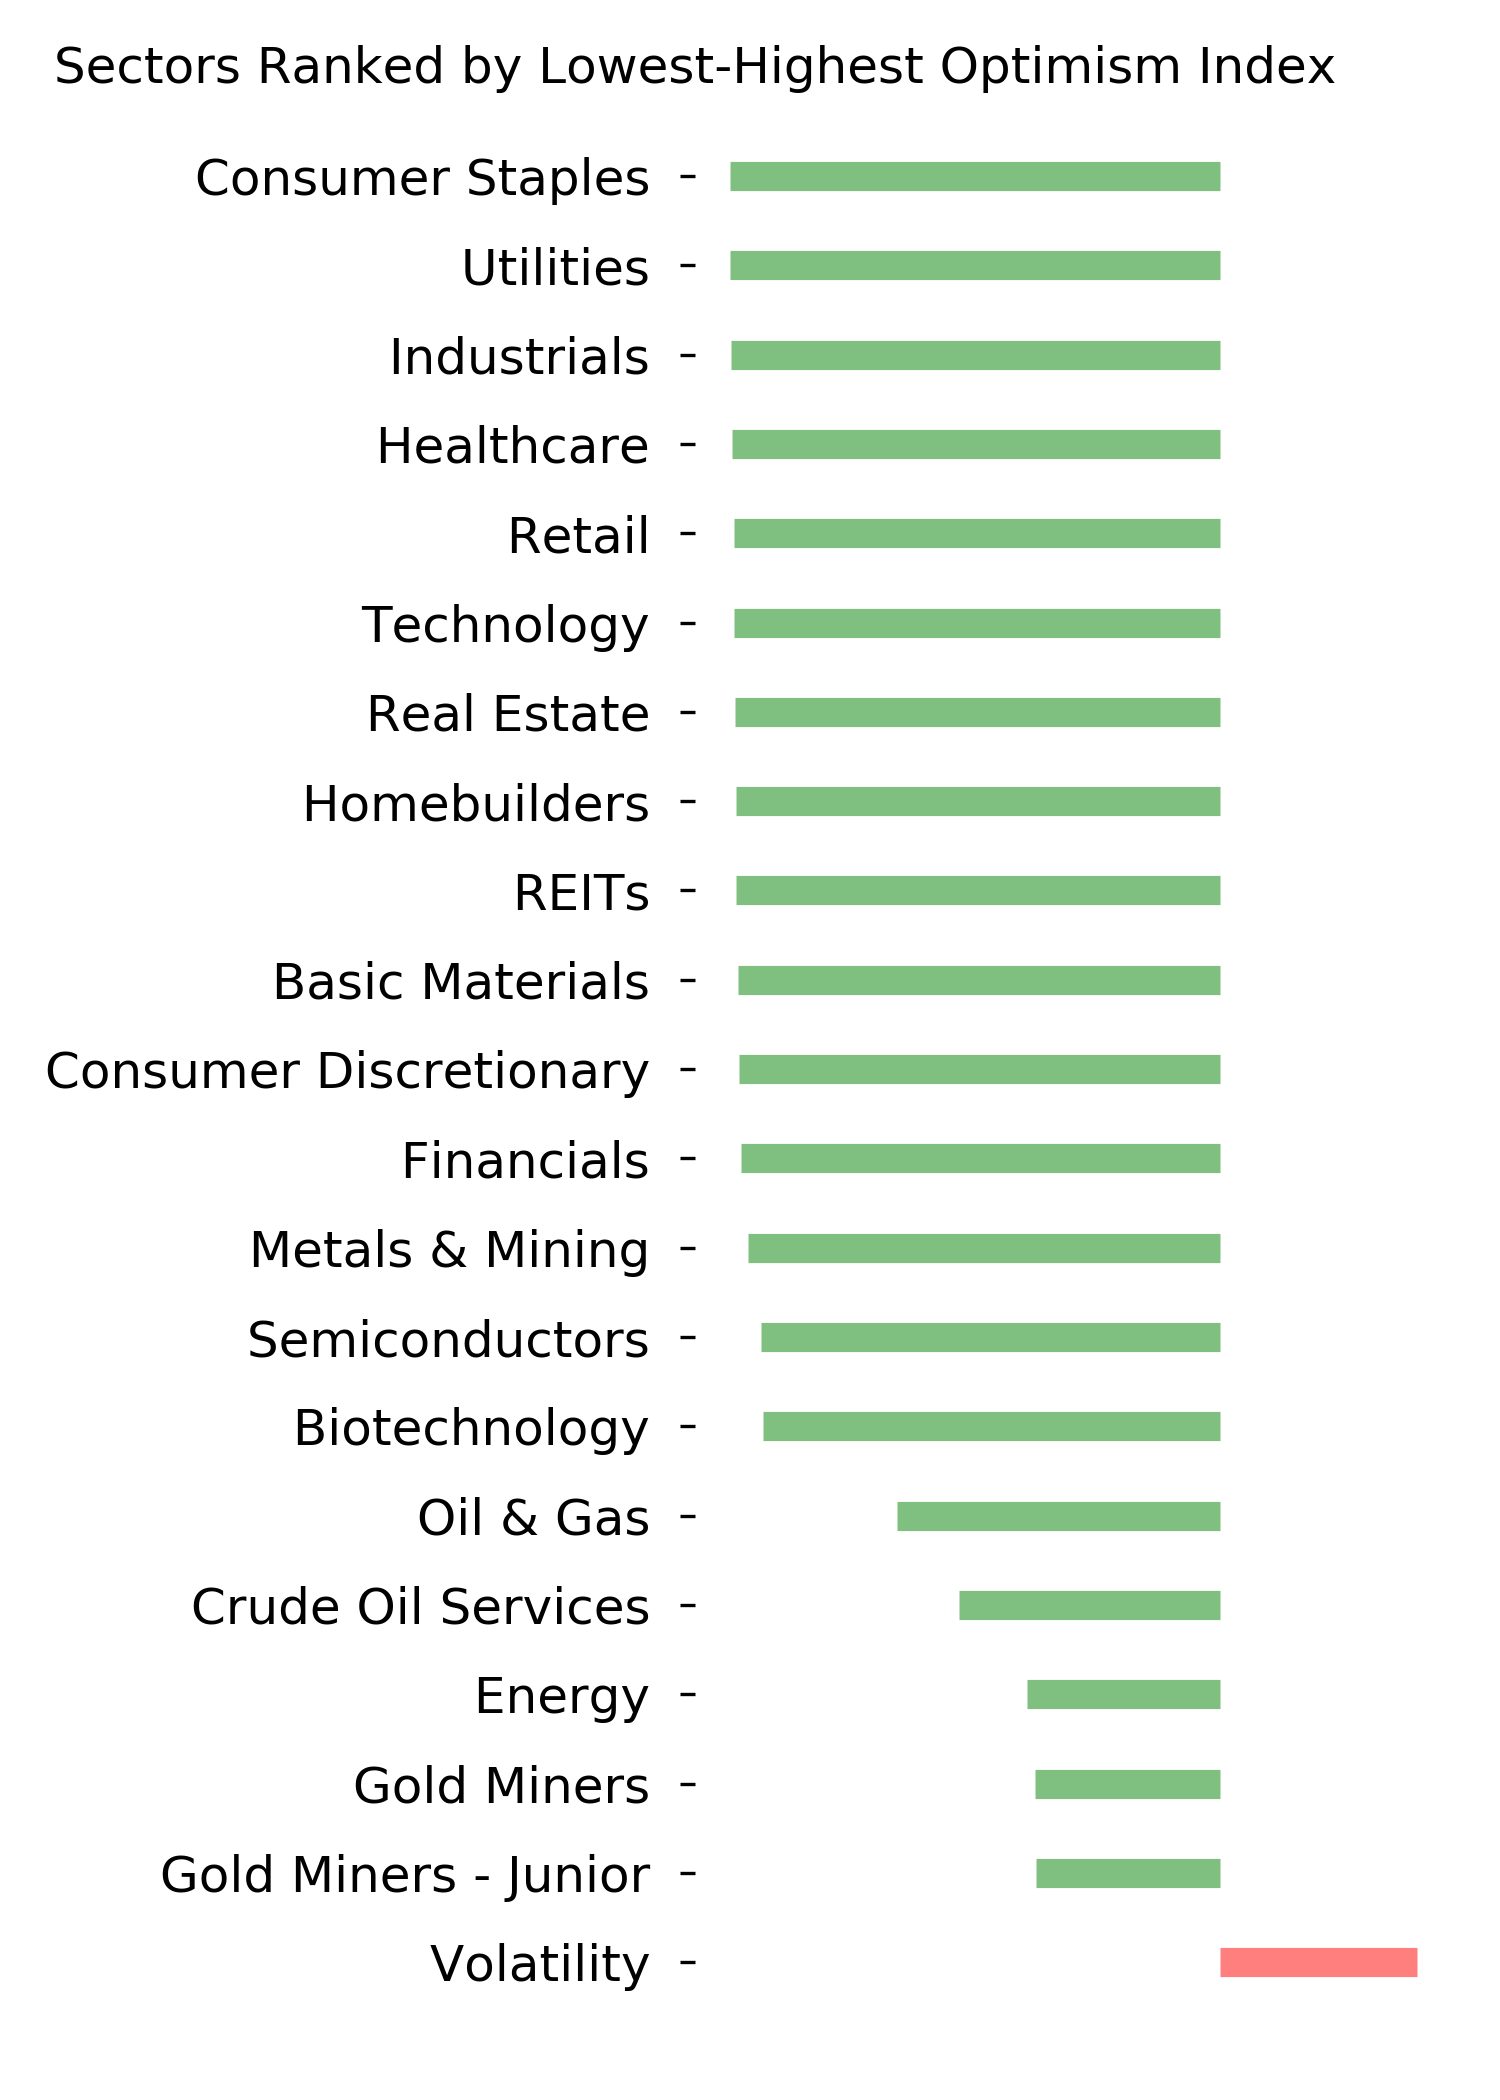
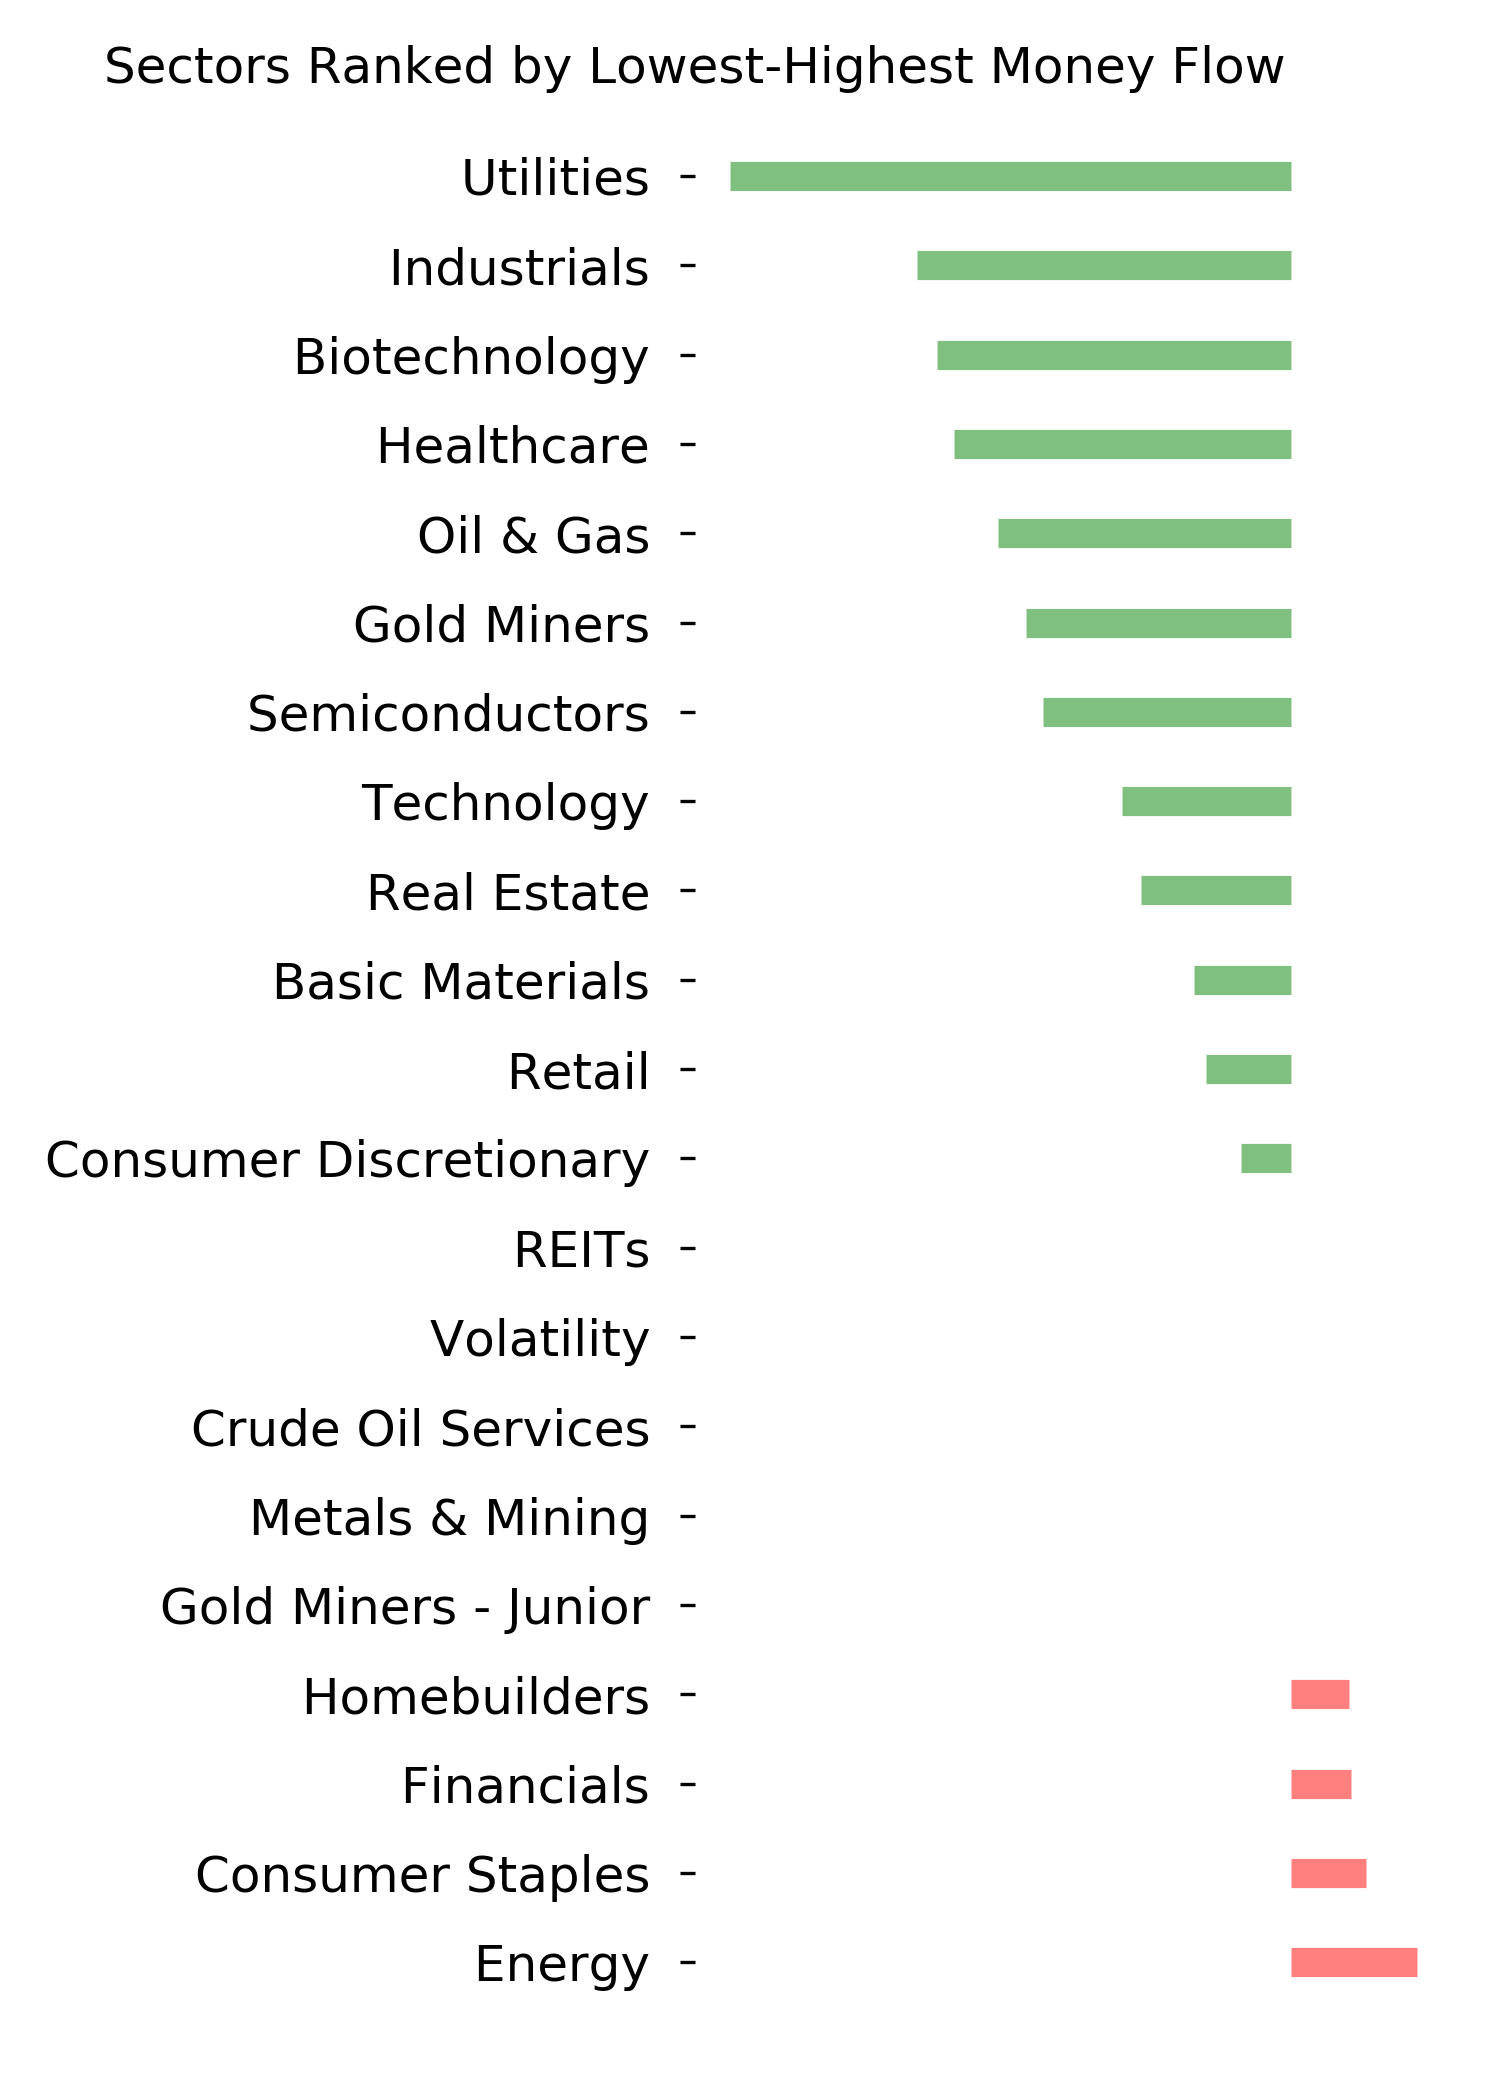
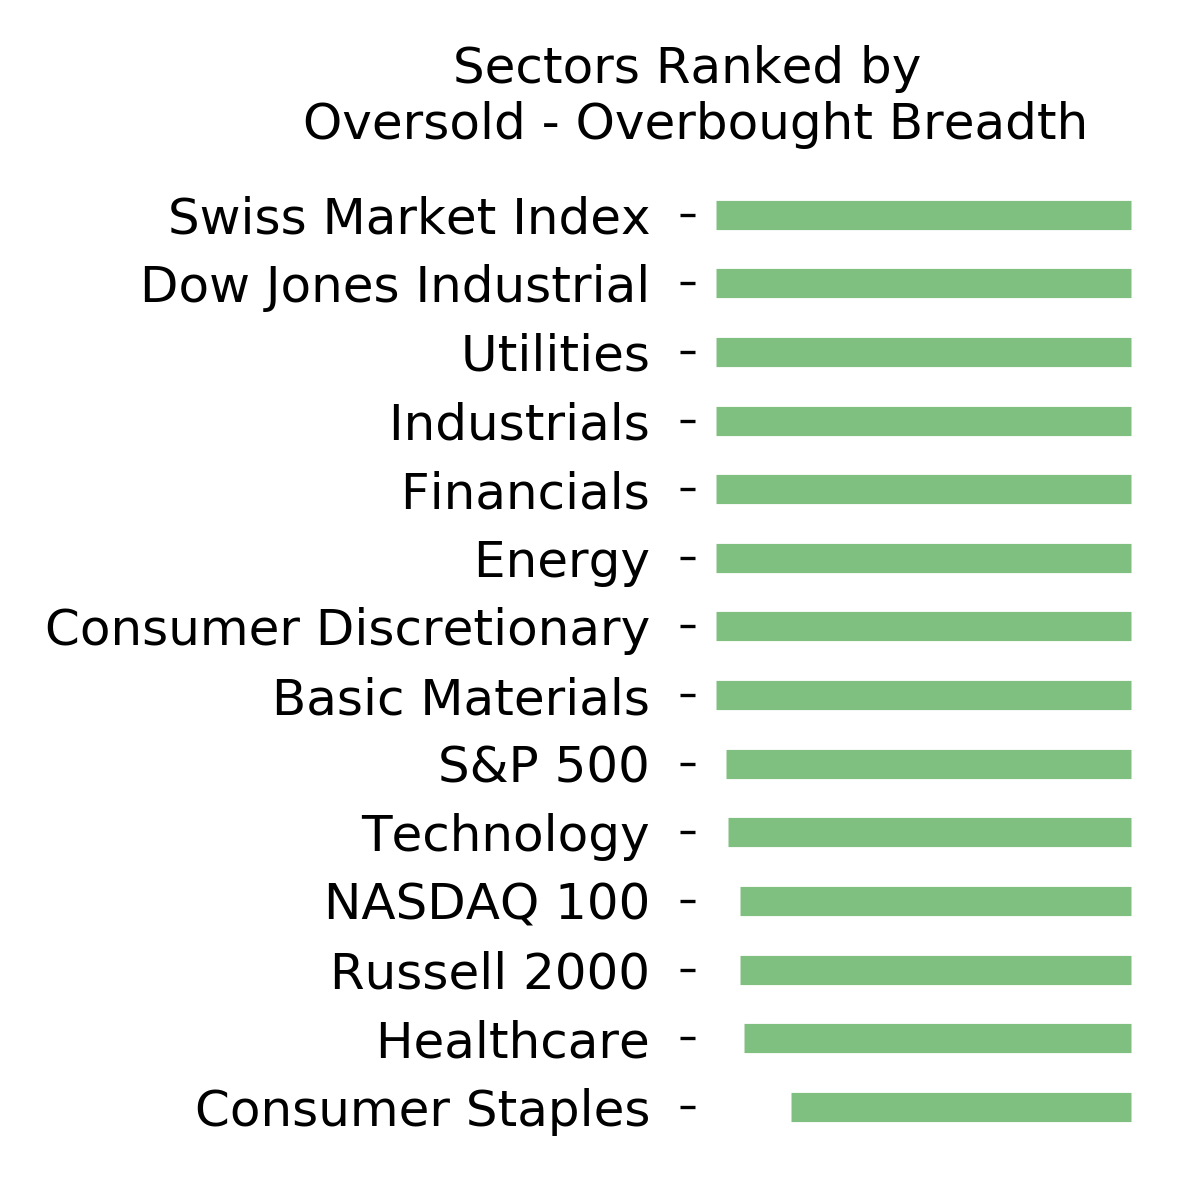
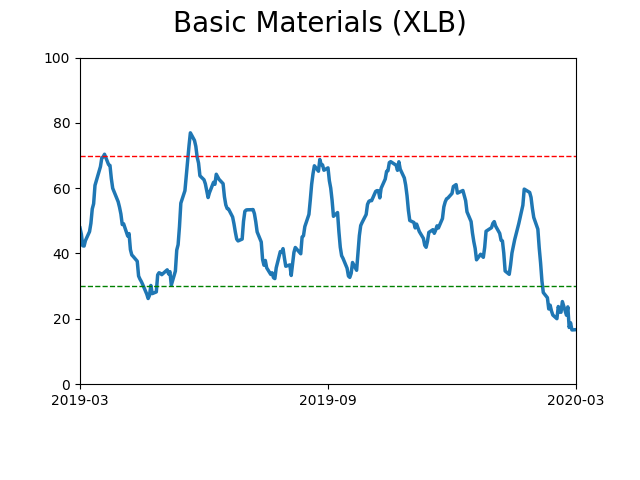
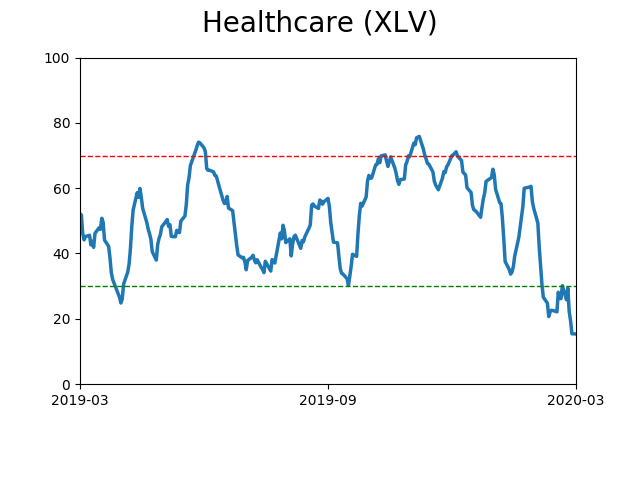
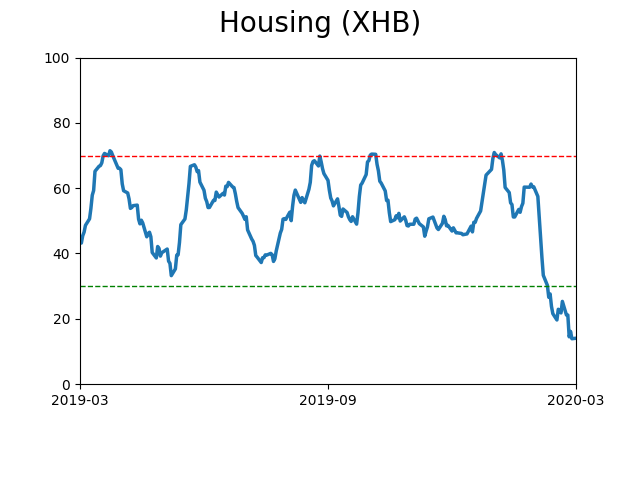
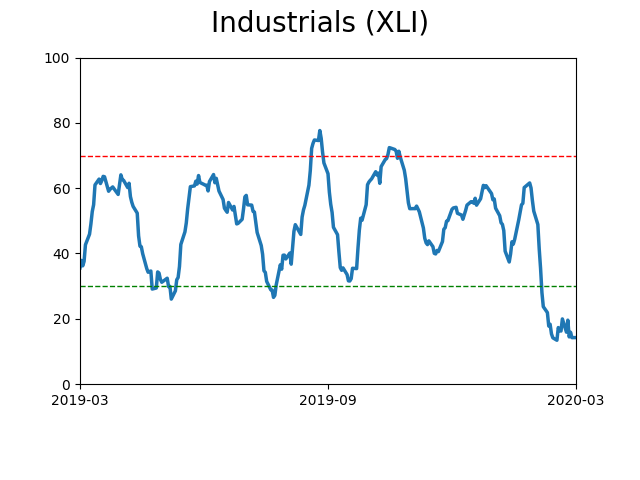
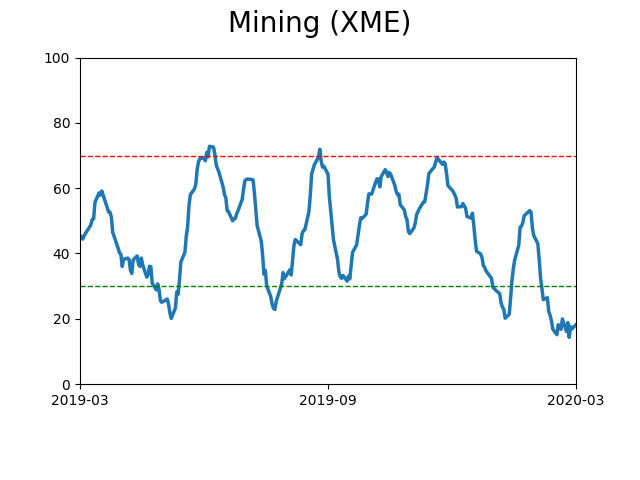
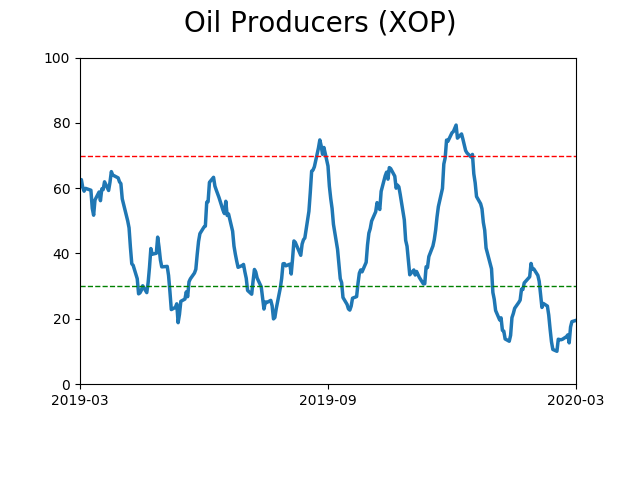
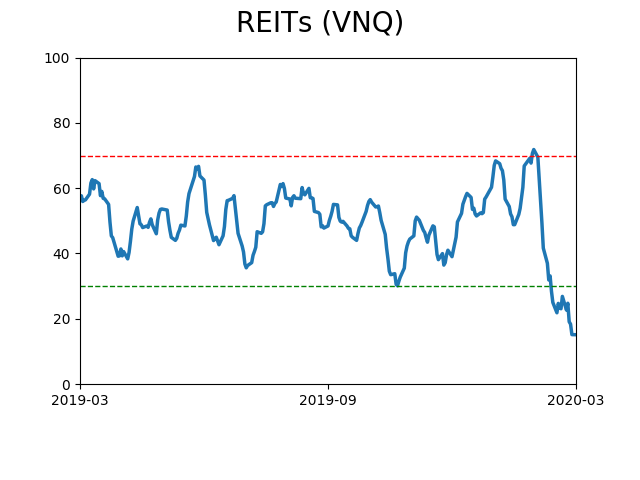
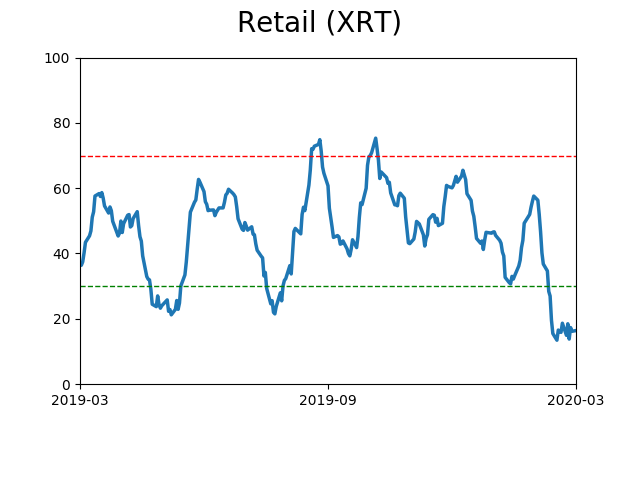
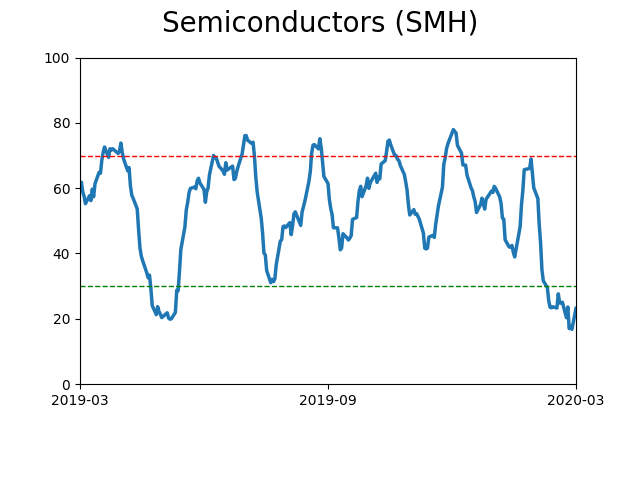
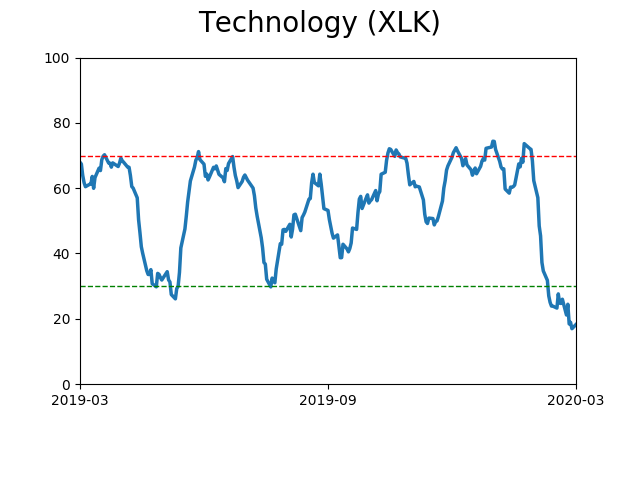
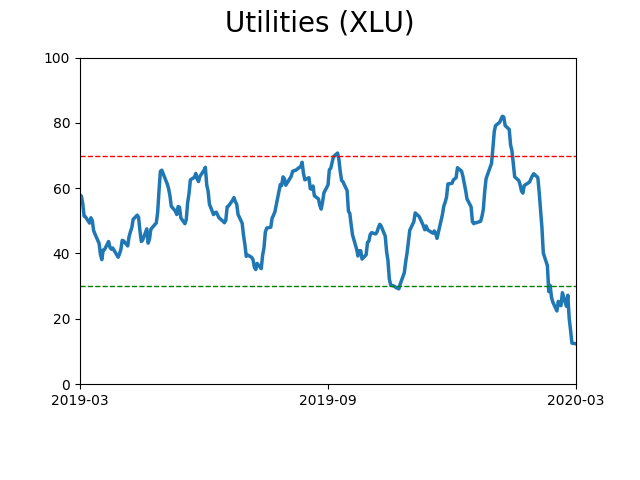
Sector ETF's - 10-Day Moving Average
|
|
|
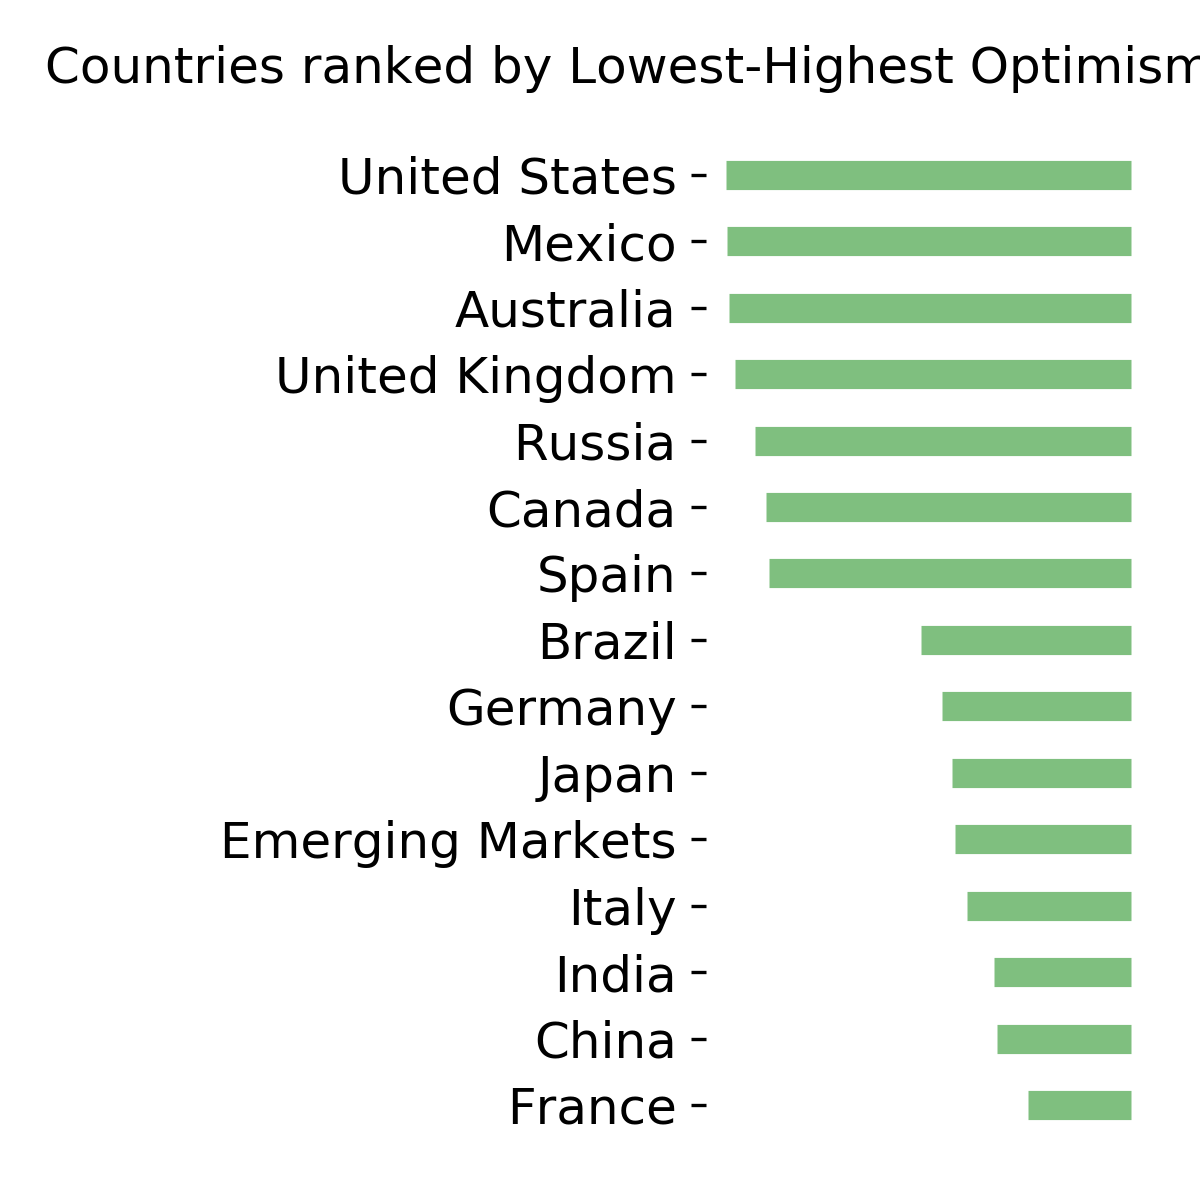
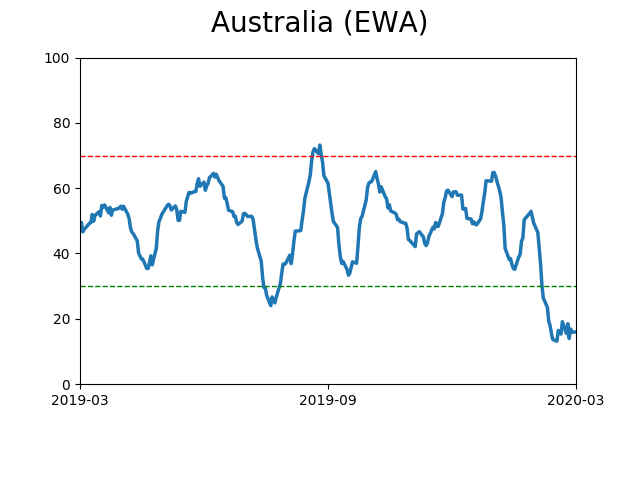
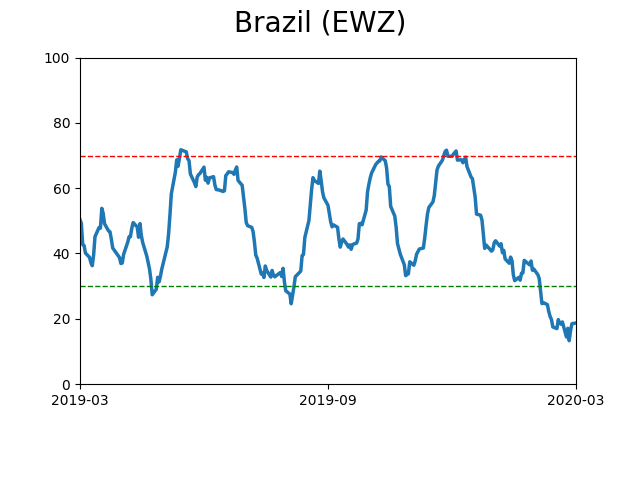
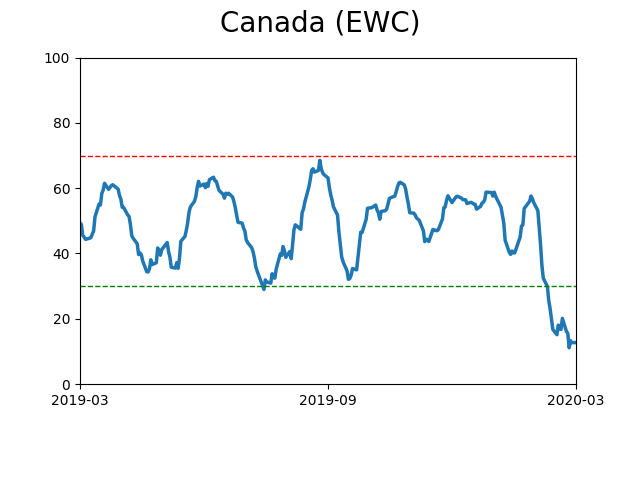
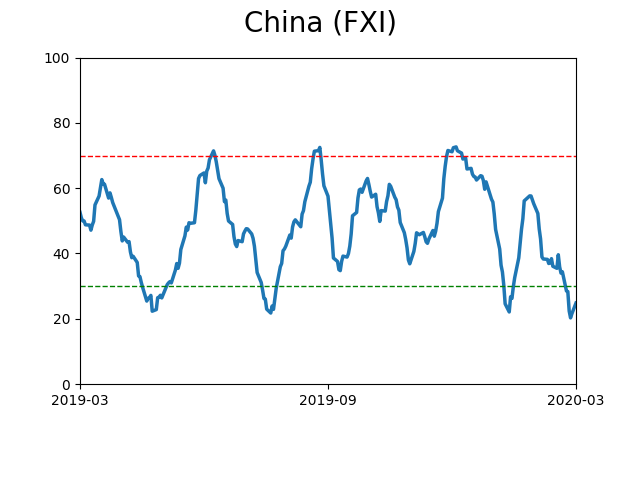
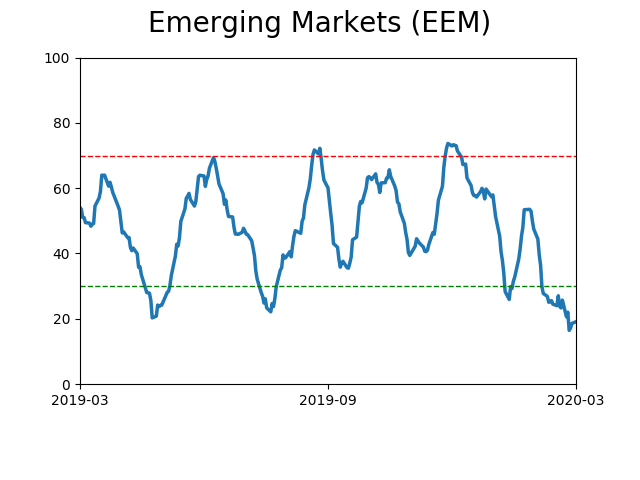
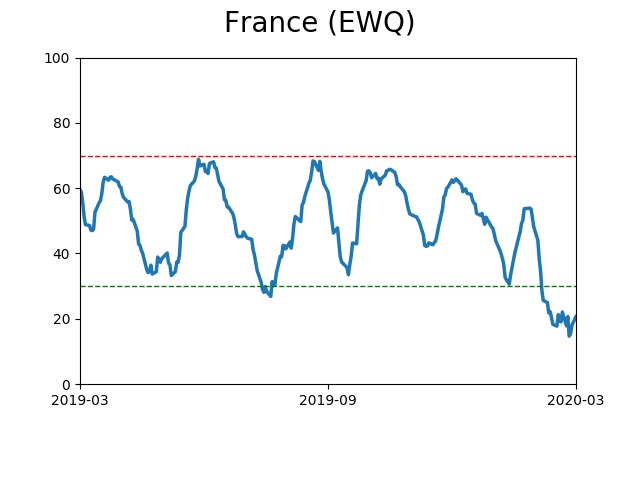
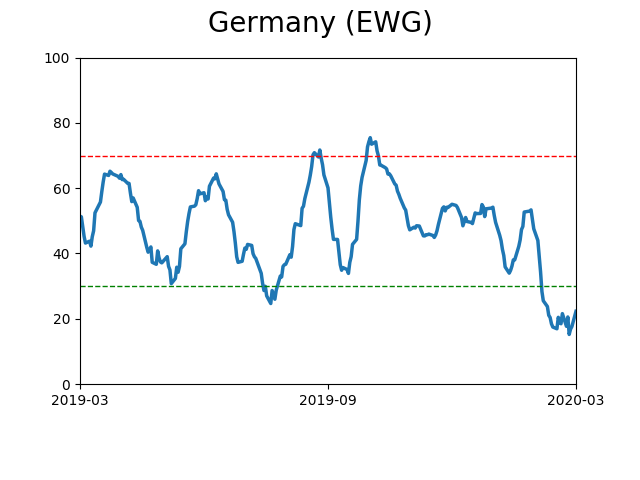
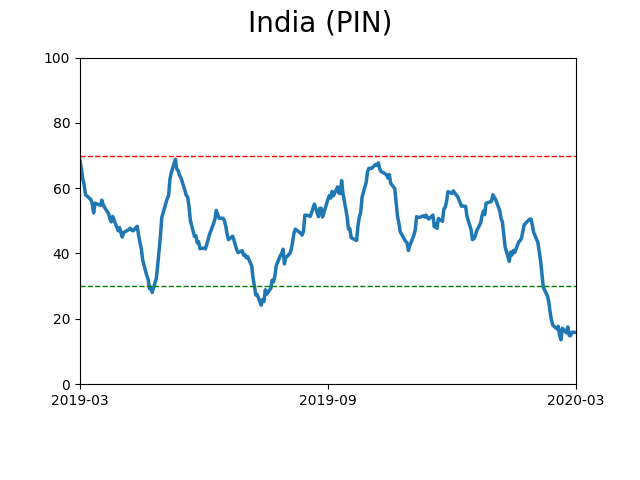
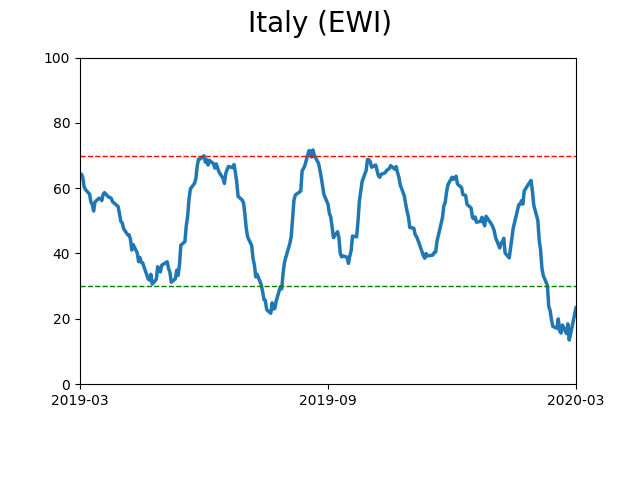
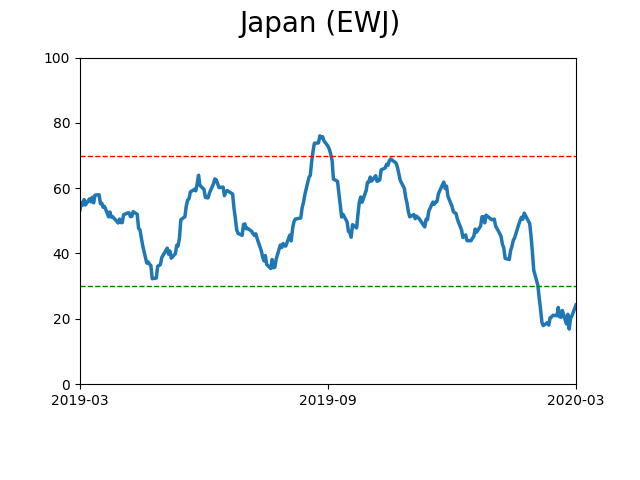
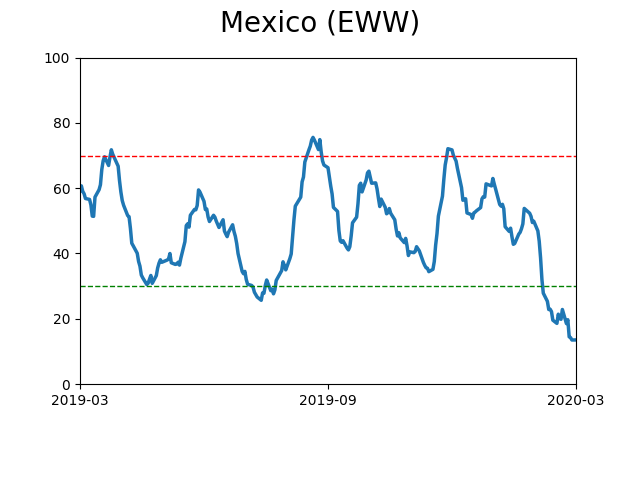
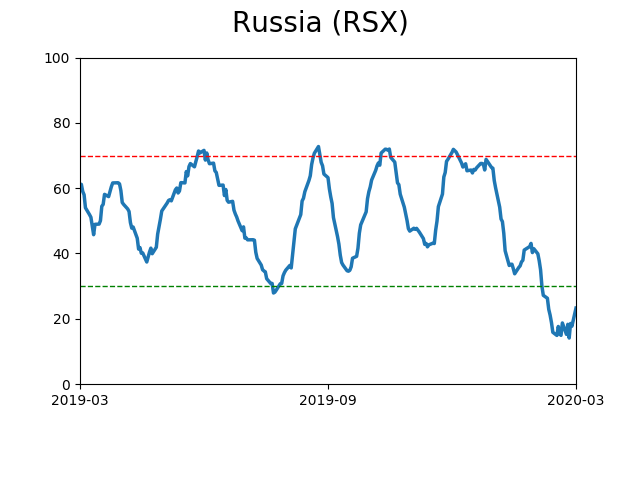
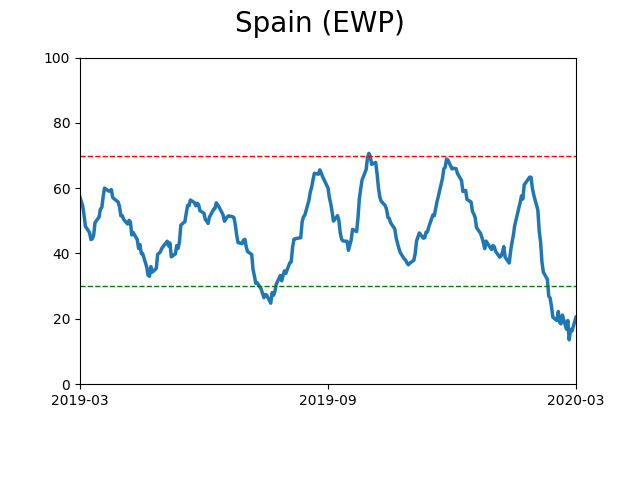
Country ETF's - 10-Day Moving Average
|
|
|
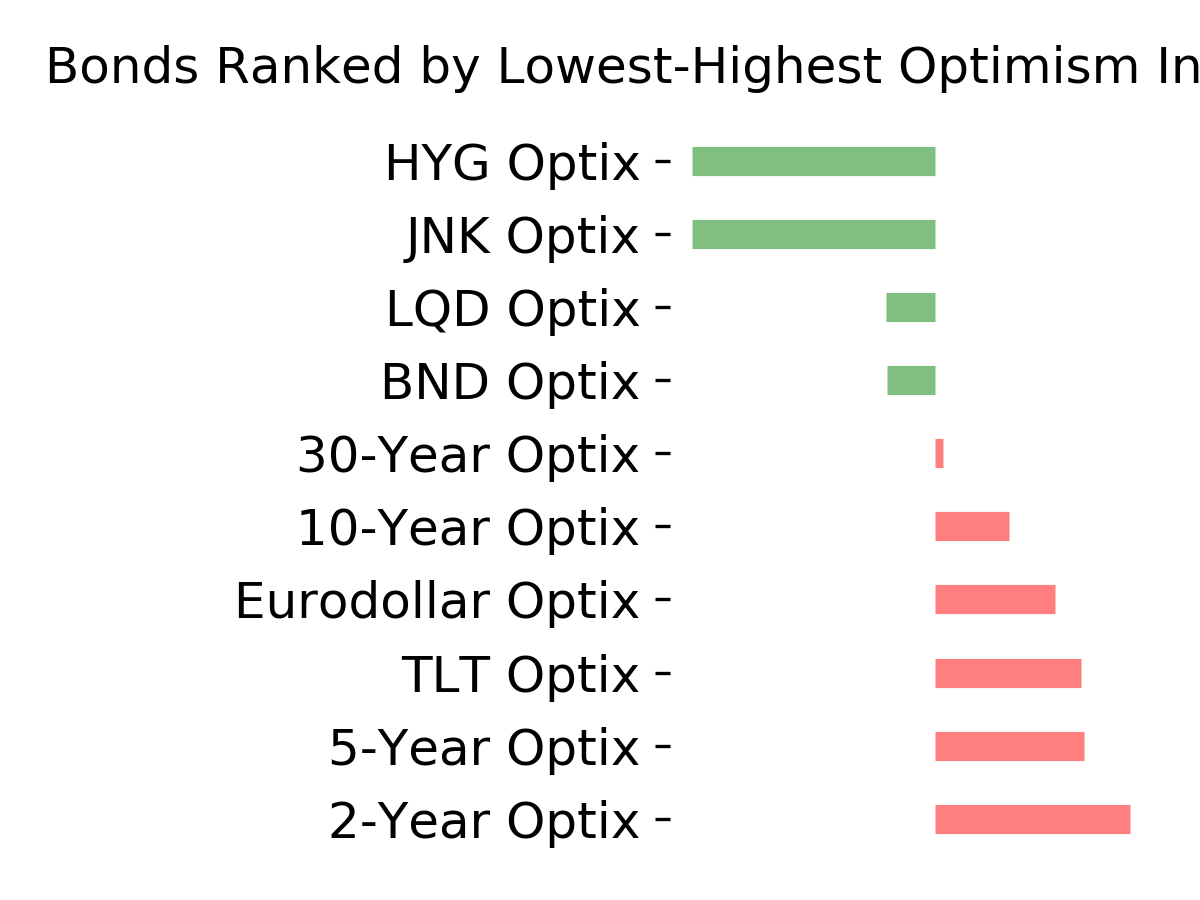
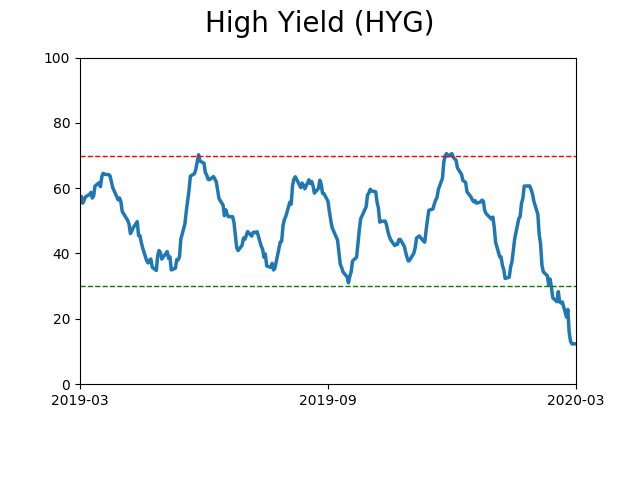
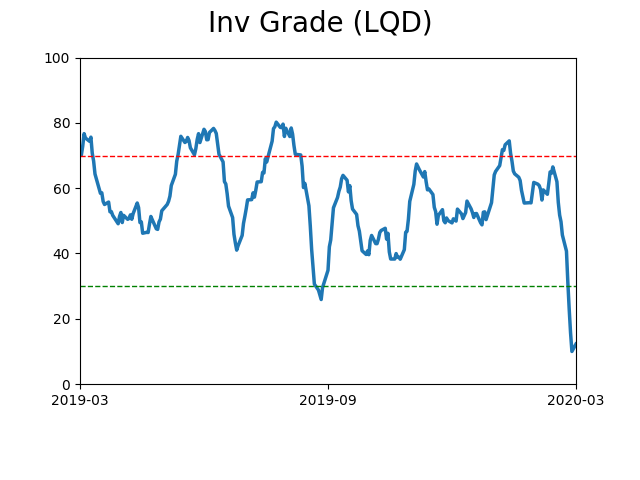
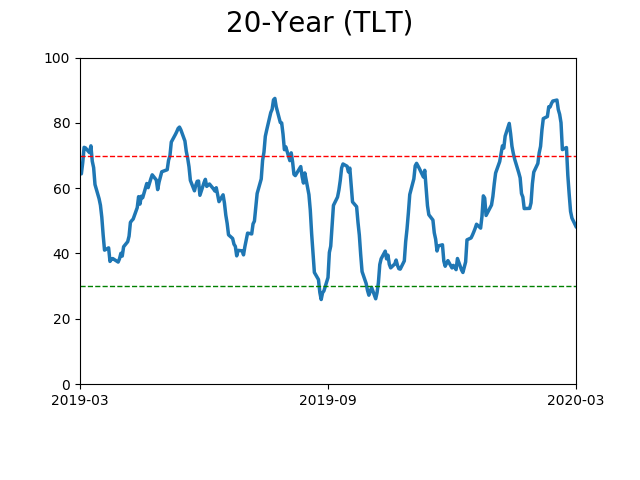
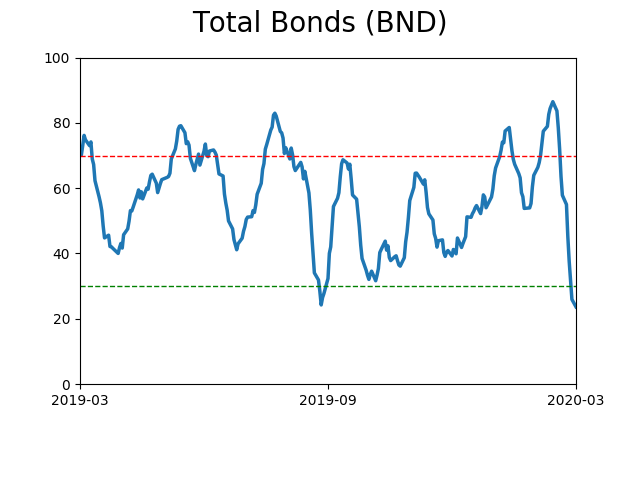
Bond ETF's - 10-Day Moving Average
|
|
|
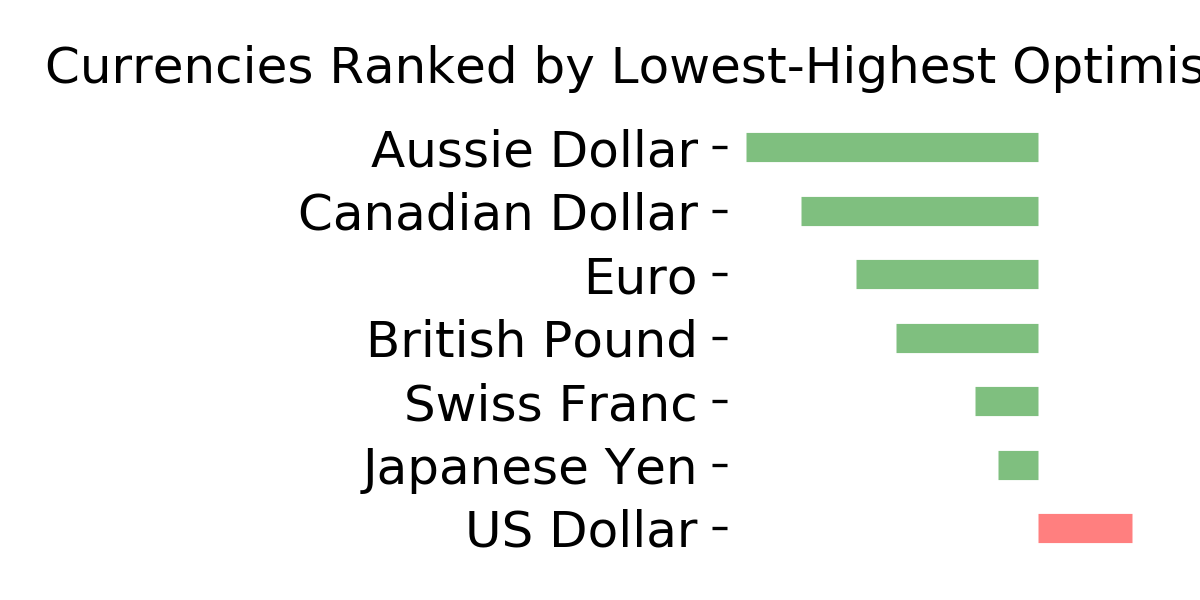
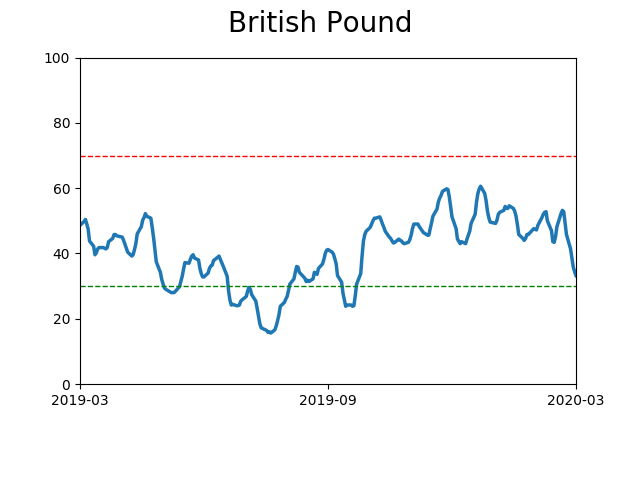
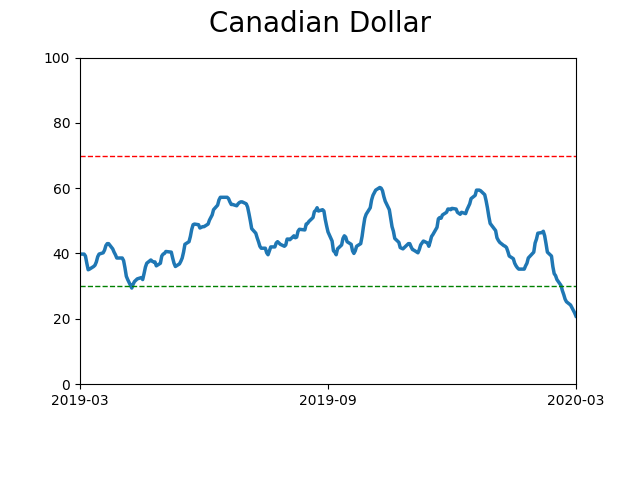
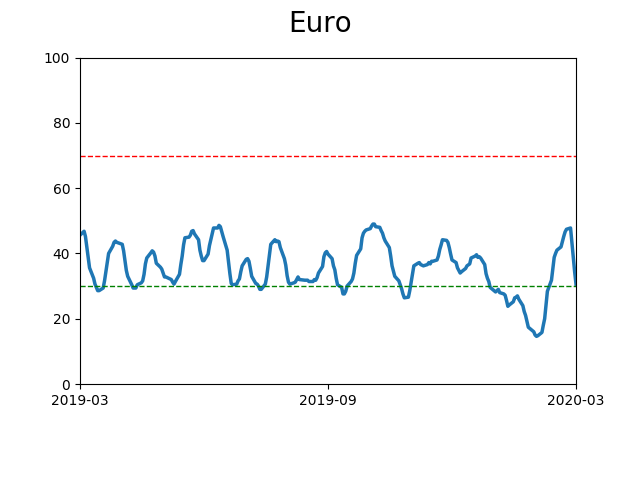
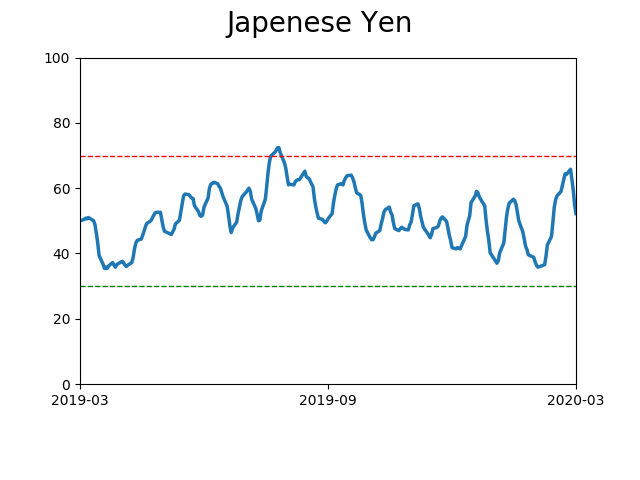
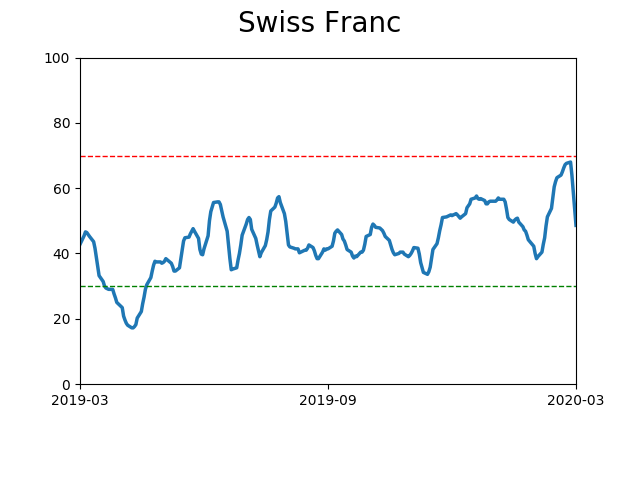
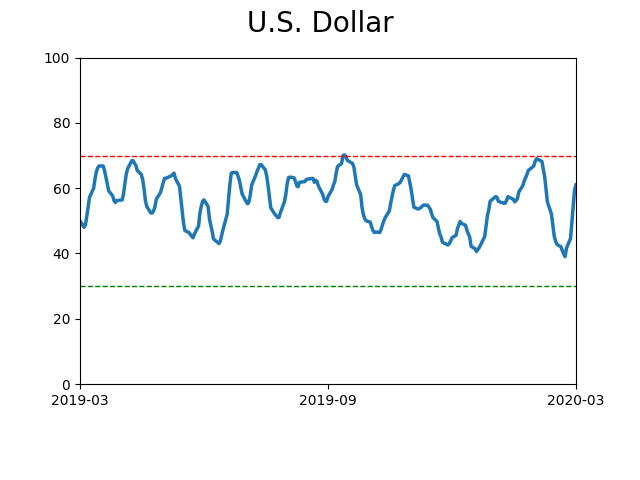
Currency ETF's - 5-Day Moving Average
|
|
|
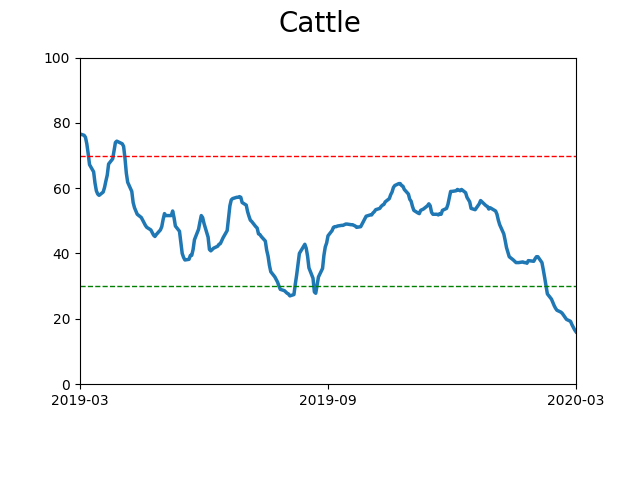
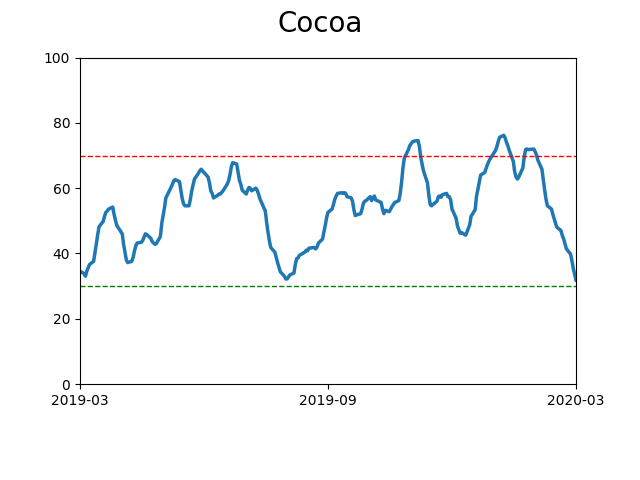
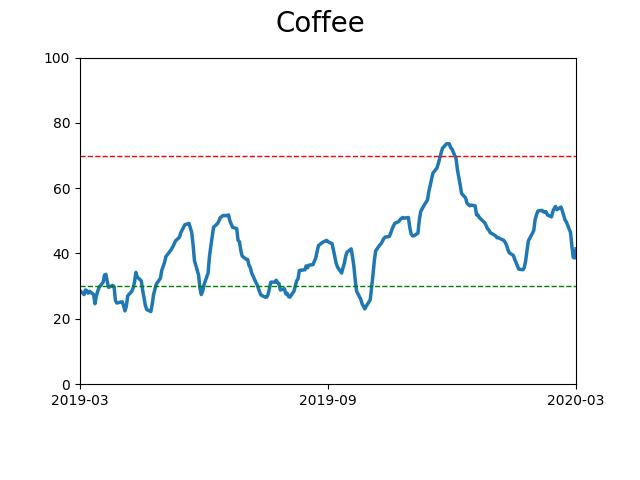
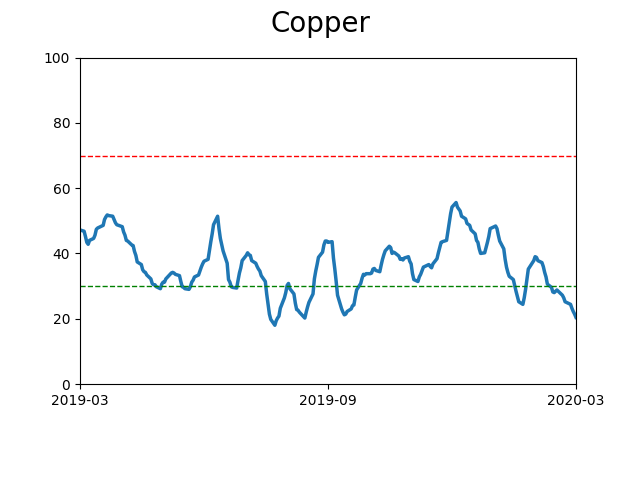
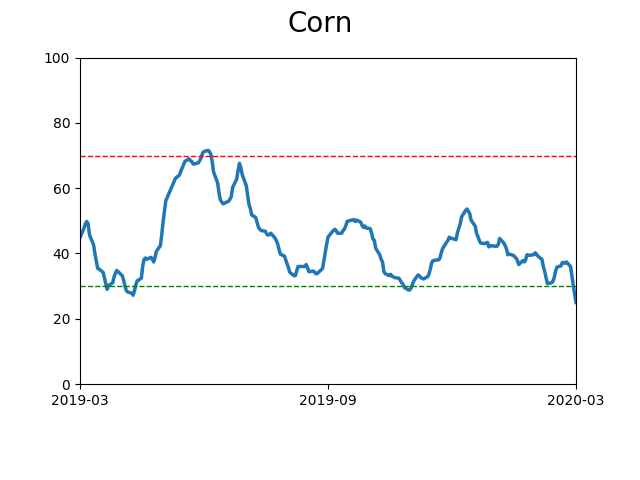
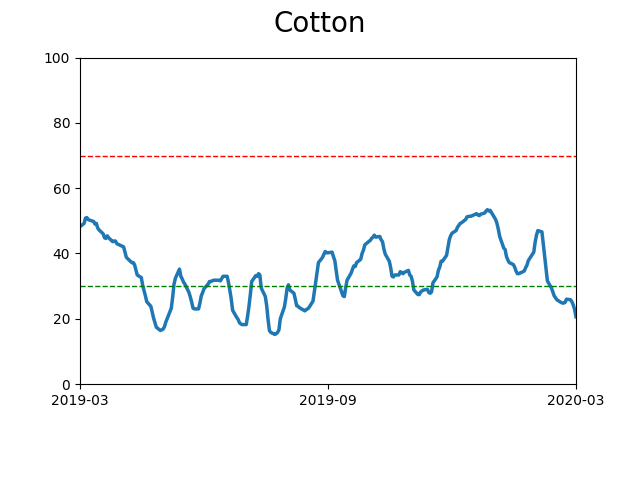
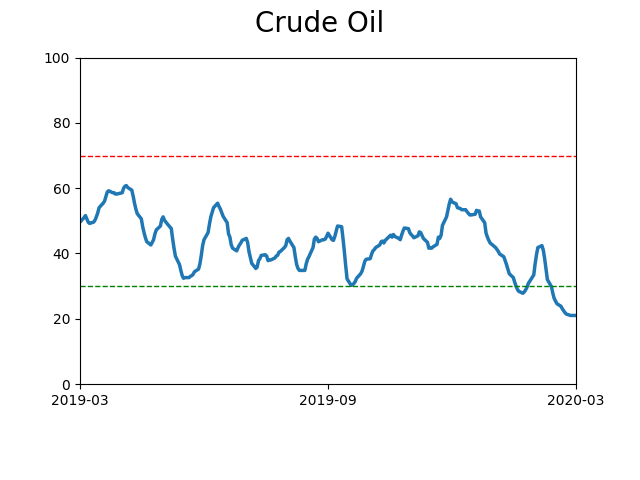
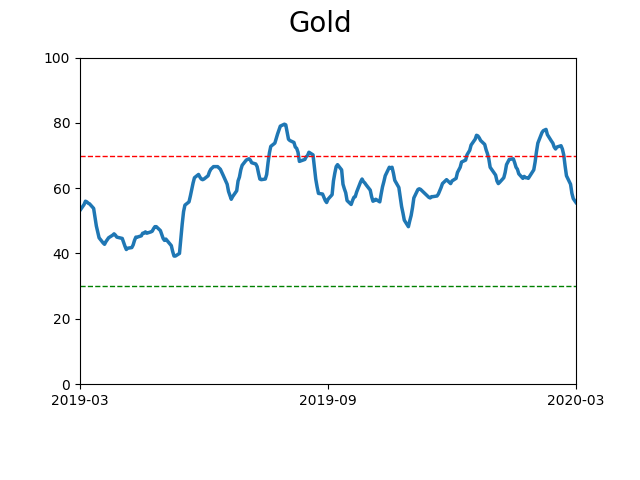
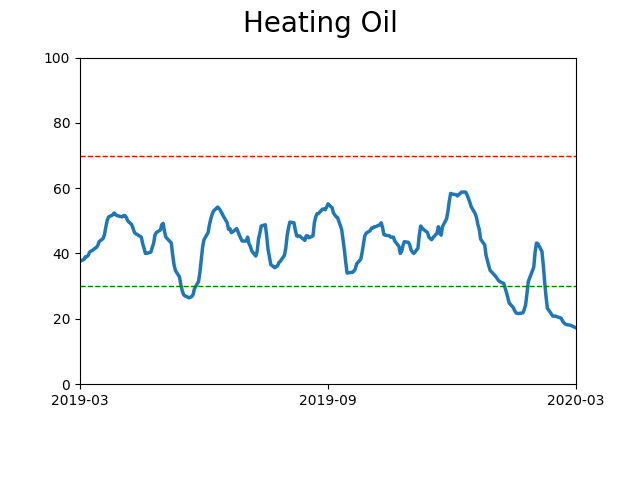
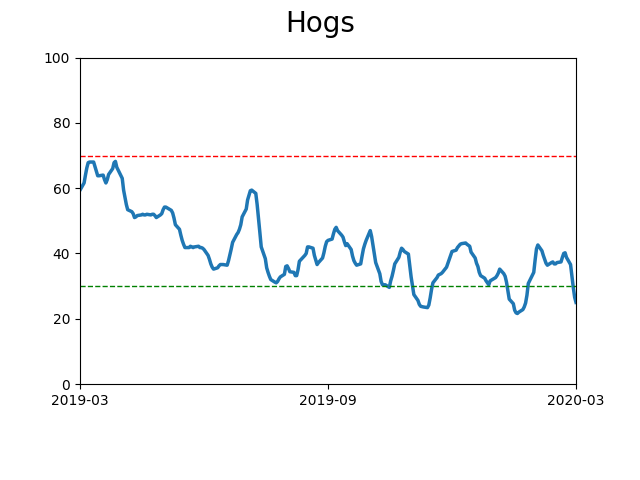
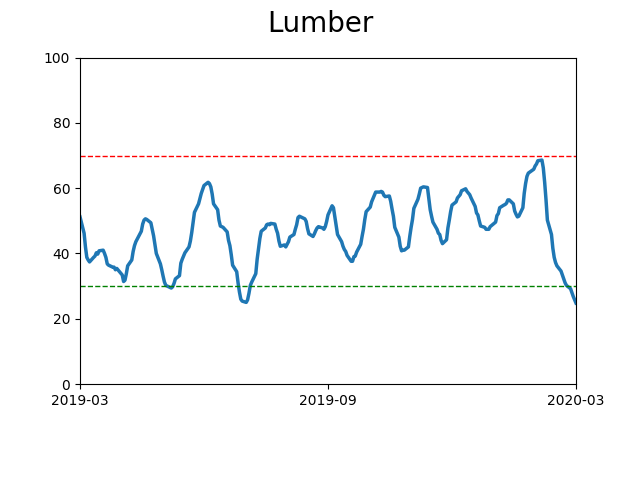
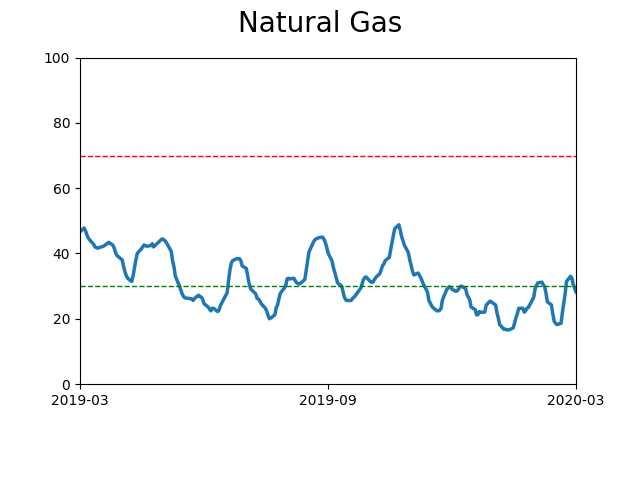
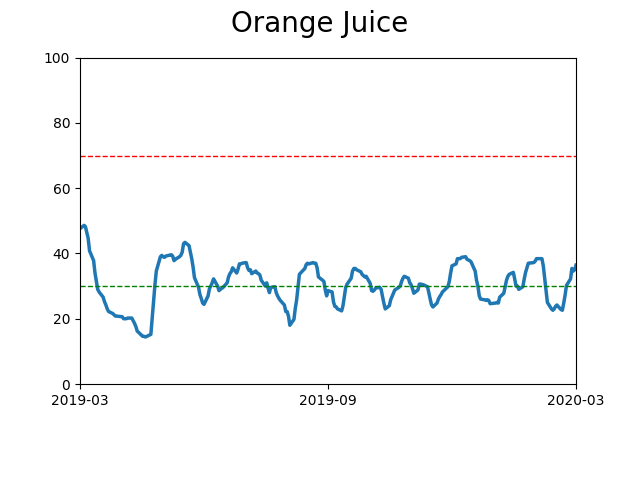
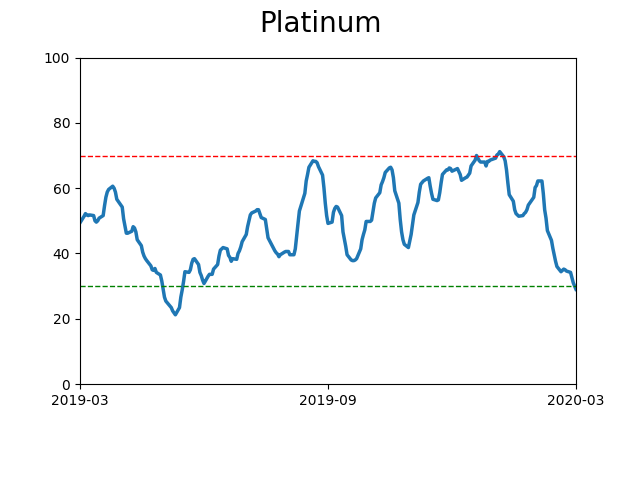
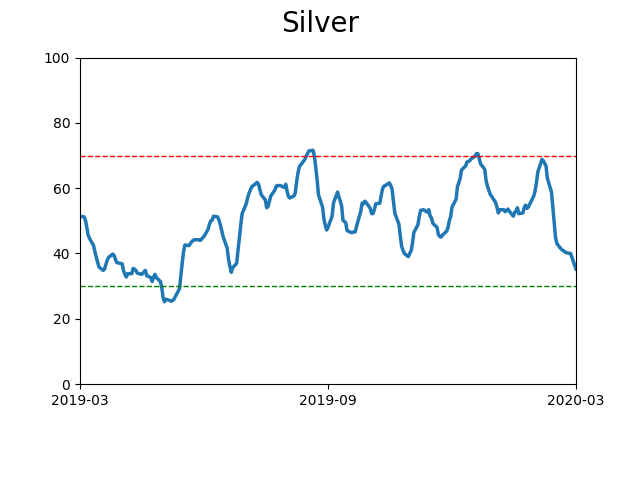
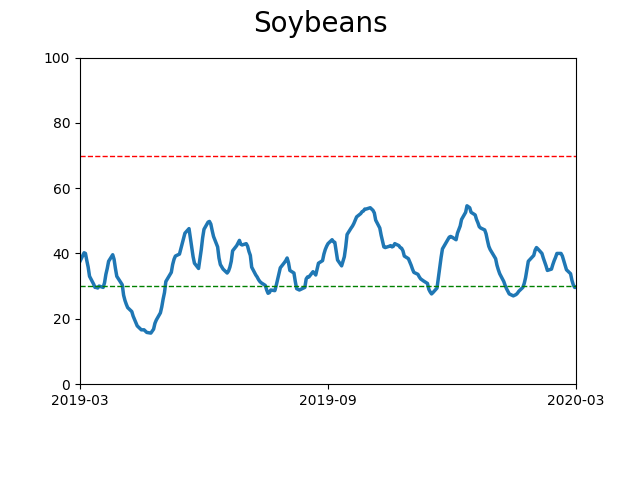
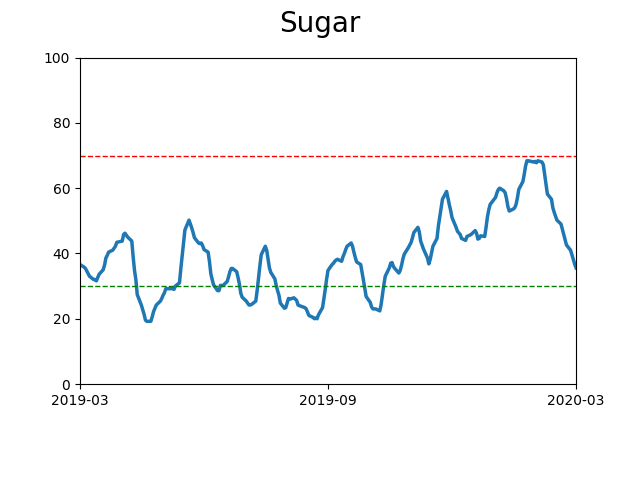
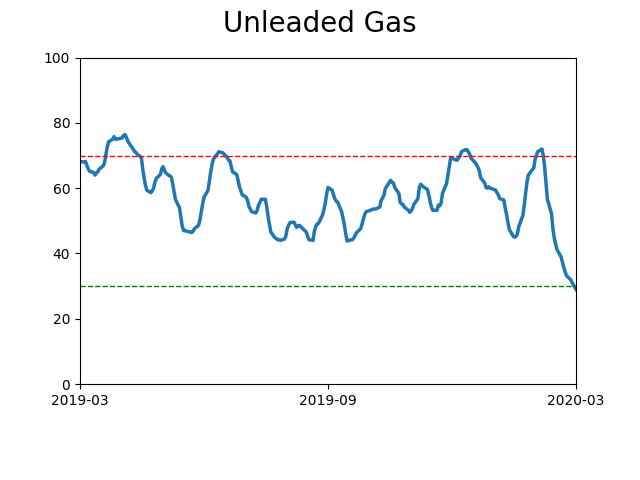
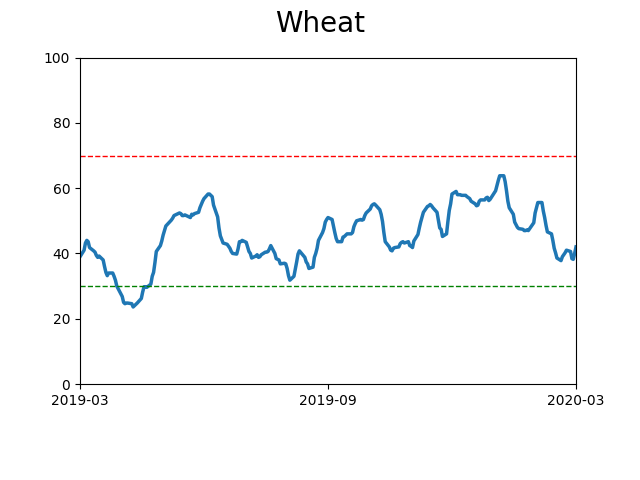
Commodity ETF's - 5-Day Moving Average
|
|