Headlines
|
|
A commodity super cycle with no losers:
Over the past year, all major commodity futures contracts are showing a gain. This is one of the few times in 40 years there has been such broad buying interest in commodities, leading to calls of a super cycle. Other times when most of them rose in price, though, they fell back in the months ahead.
Bottom Line:
See the Outlook & Allocations page for more details on these summaries STOCKS: Weak sell
The extreme speculation registered in January and February is starting to get wrung out. Internal dynamics have mostly held up, so a return to neutral sentiment conditions would improve the forward risk/reward profile substantially. We're still a ways off from that. BONDS: Weak buy
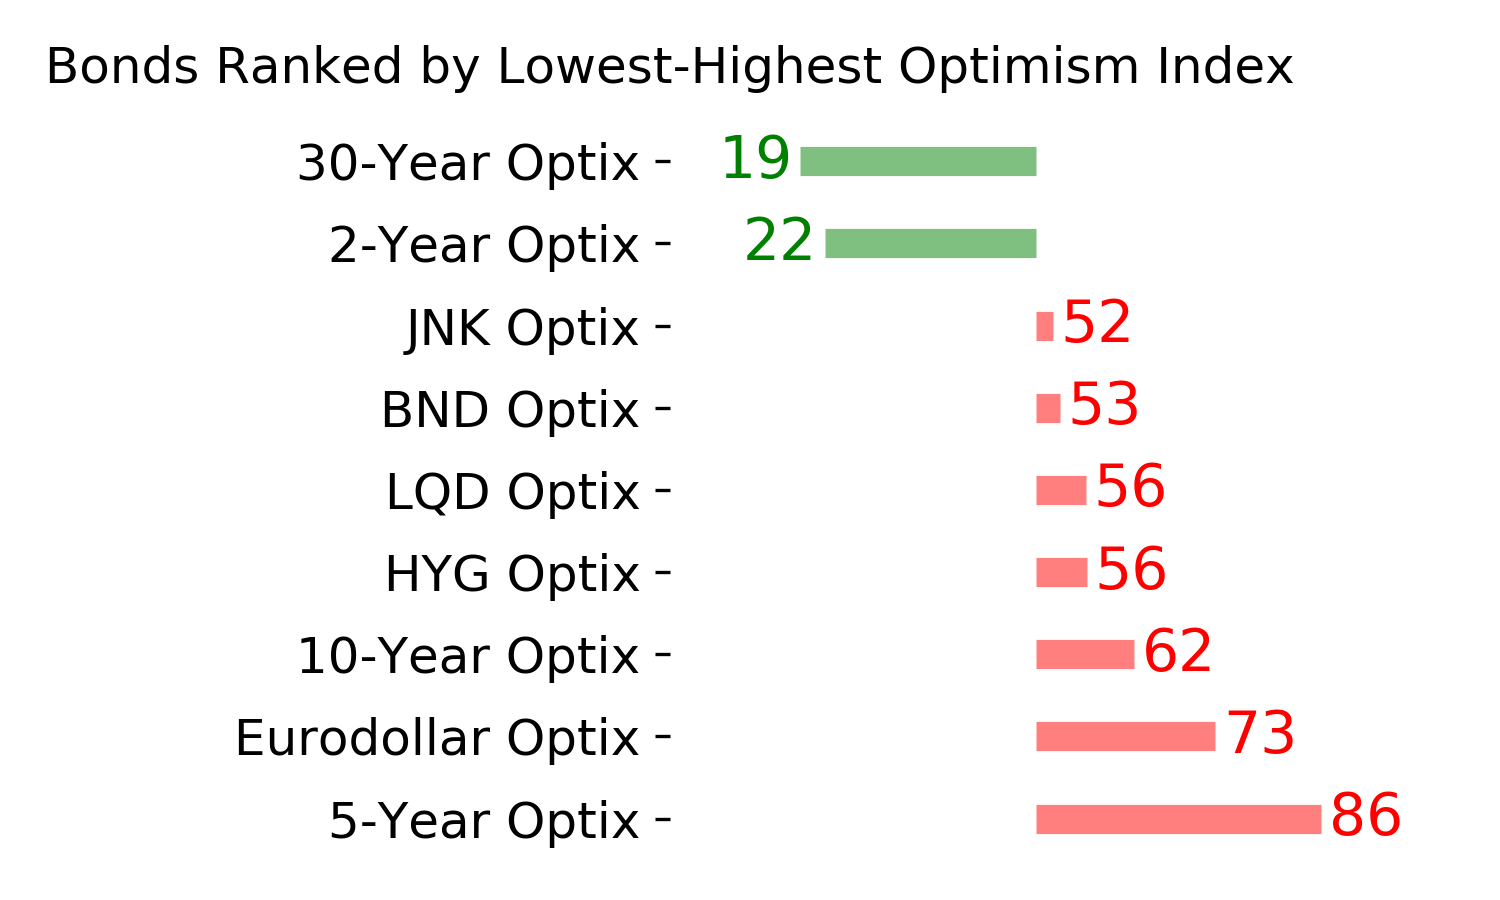
Various parts of the market have been hit in recent weeks, with mild oversold conditions. The Bond Optimism Index is now about as low as it gets during healthy bond market environments. Fixed income isn't responding well, so that needs to be monitored in case it's transitioning to a longer-term negative market environment. GOLD: Weak buy
A dollar trying to rebound from a severe short position has weighed on gold and miners. The types of signals they've given in recent weeks, within the context of their recent surge, have usually resulted in higher prices over a medium- to long-term time frame. Like bonds, gold and miners aren't responding very well, and this needs to be monitored.
|
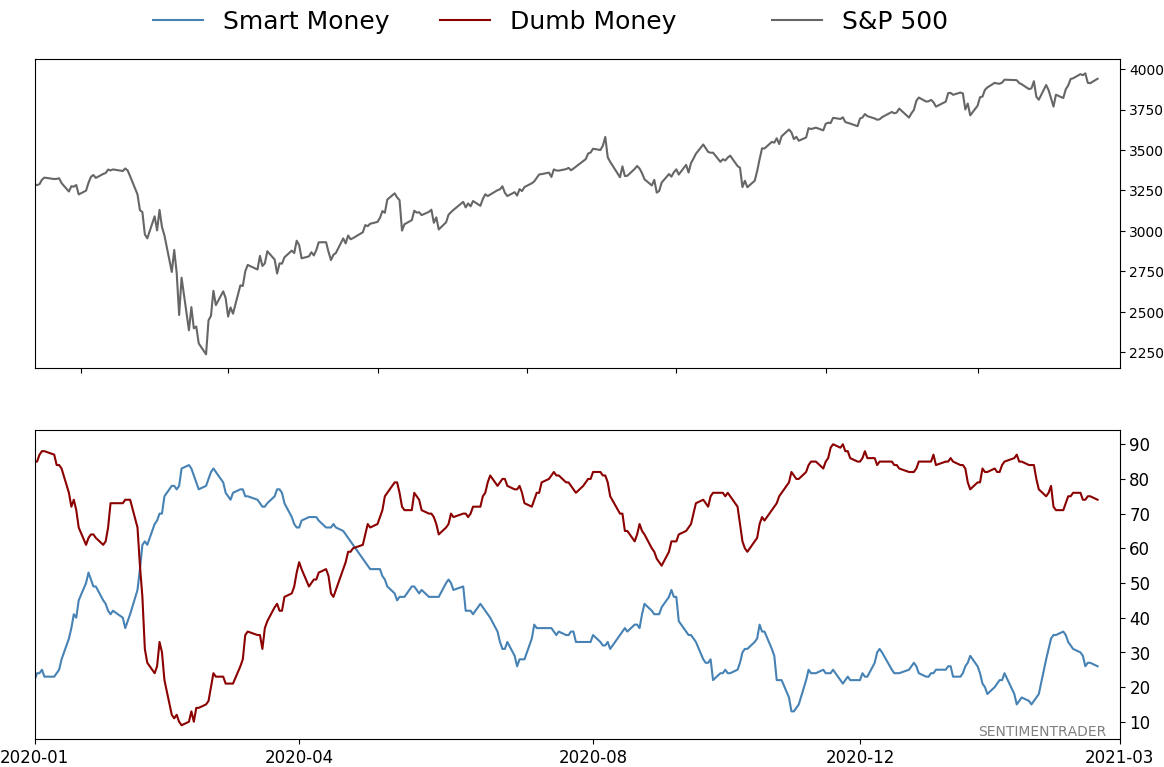
Smart / Dumb Money Confidence
|
Smart Money Confidence: 26%
Dumb Money Confidence: 74%
|
|
Risk Levels
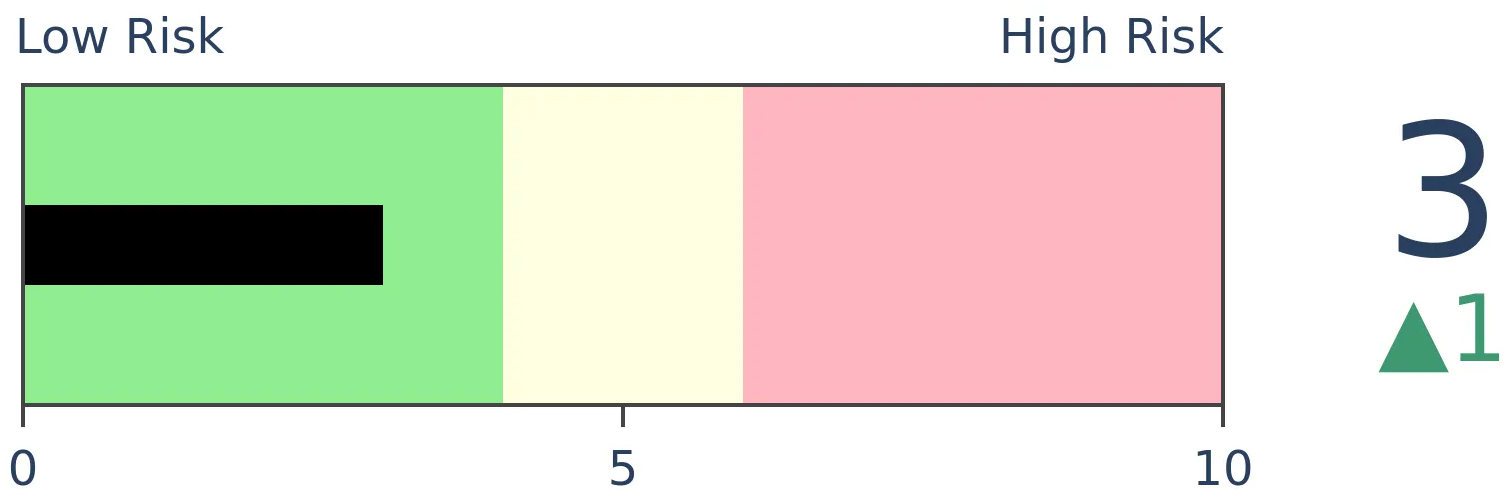
Stocks Short-Term
|
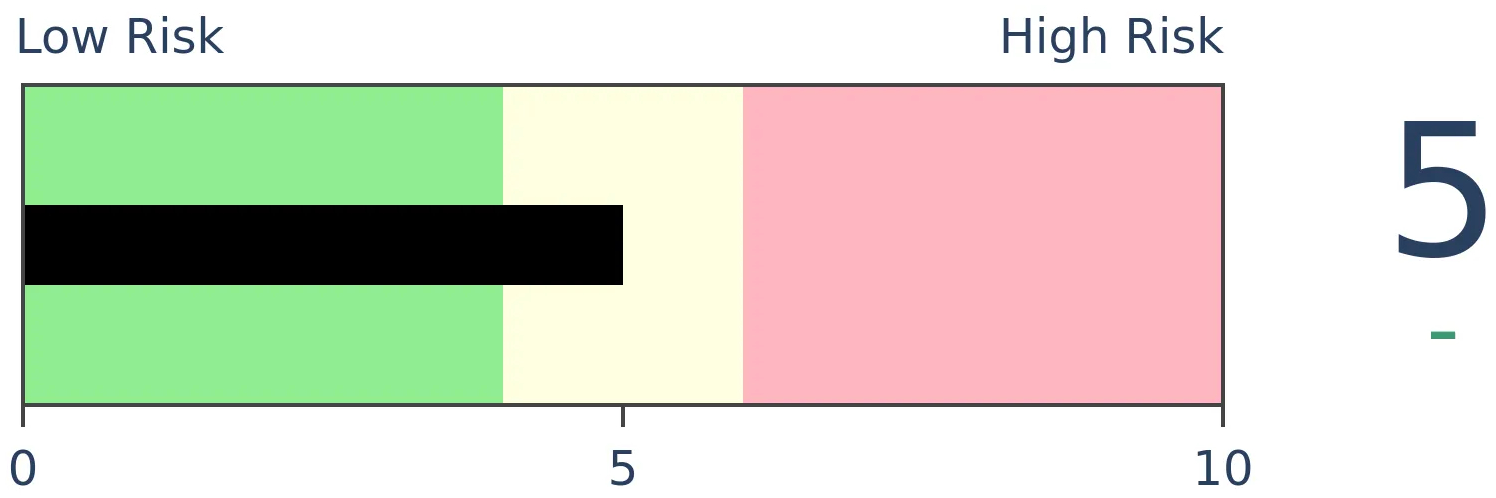
Stocks Medium-Term
|
|
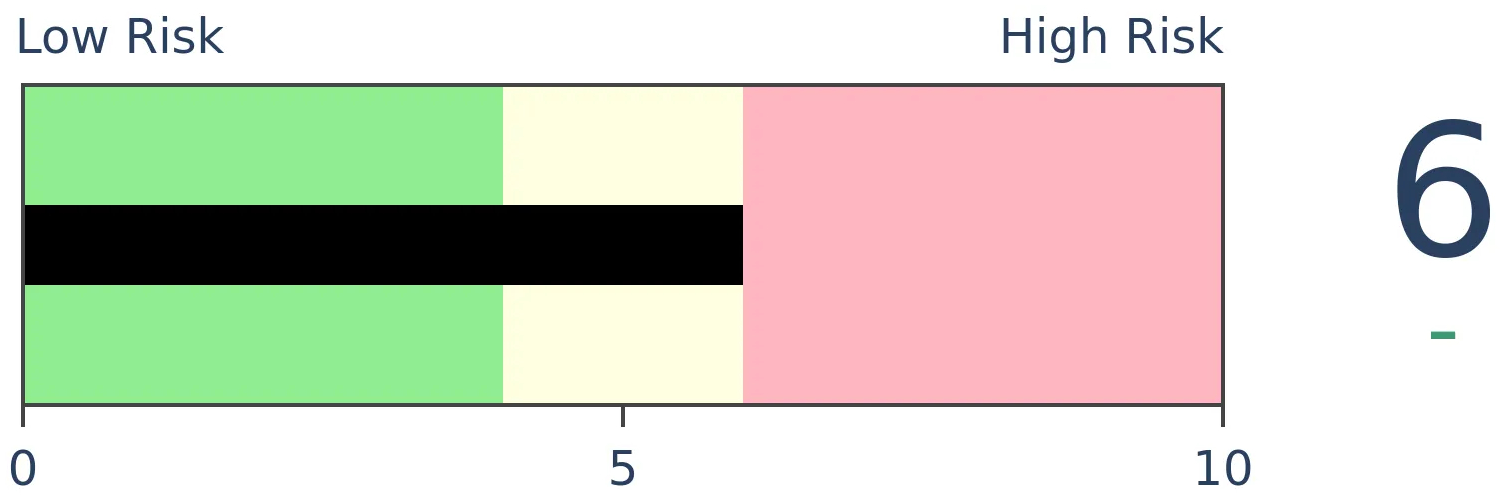
Bonds
|
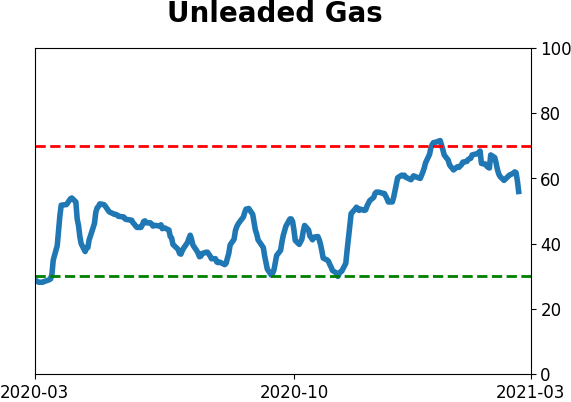
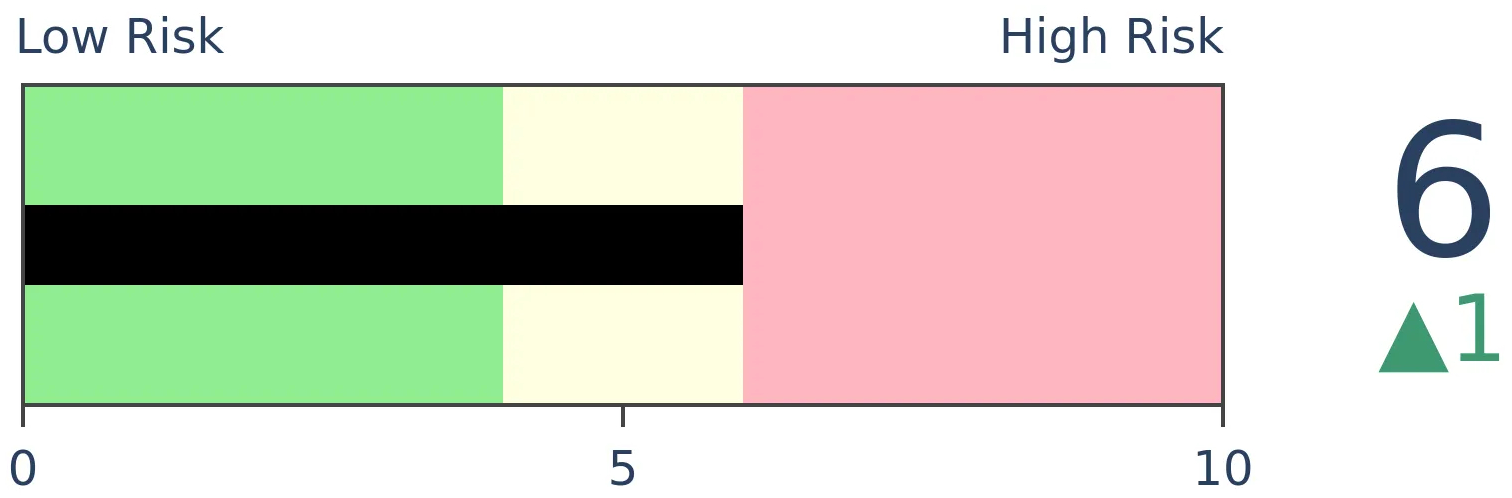
Crude Oil
|
|
Gold

|
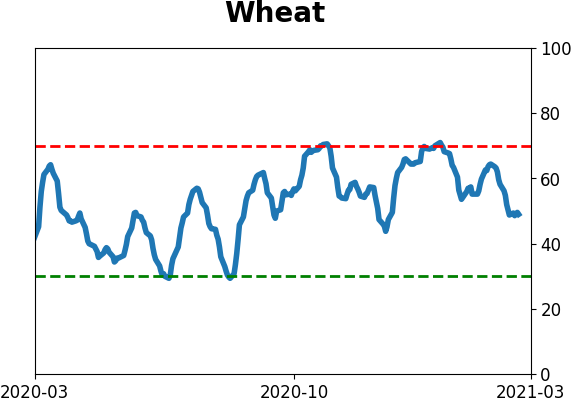
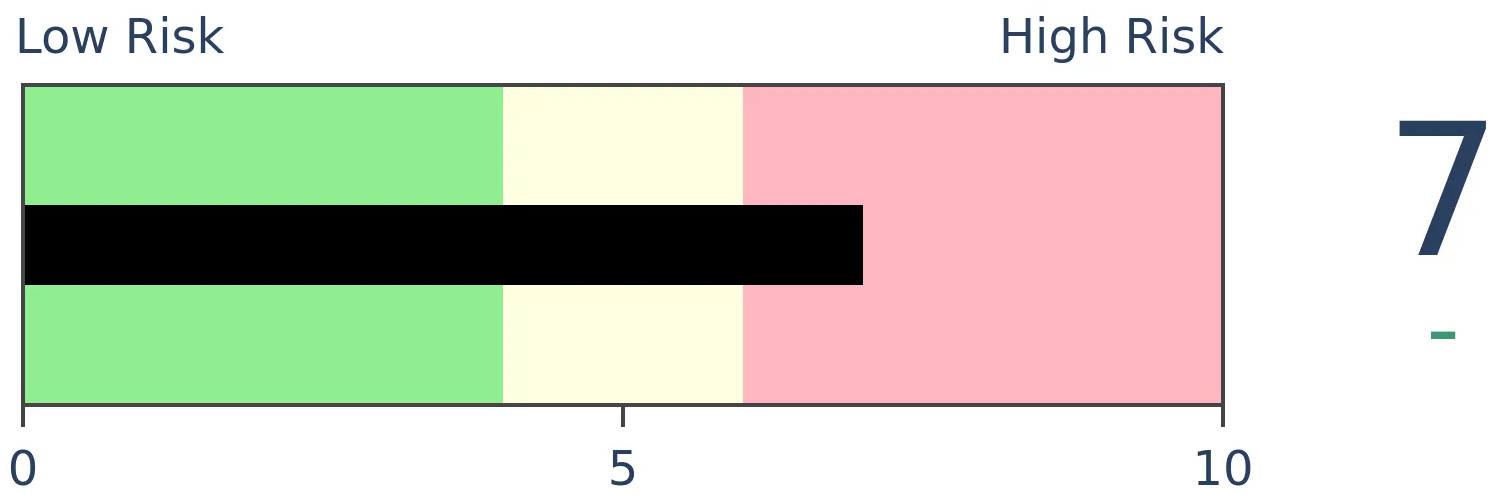
Agriculture
|
|
Research
BOTTOM LINE
Over the past year, all major commodity futures contracts are showing a gain. This is one of the few times in 40 years there has been such broad buying interest in commodities, leading to calls of a super cycle. Other times when most of them rose in price, though, they fell back in the months ahead.
FORECAST / TIMEFRAME
GCC -- Down, Medium-Term
|
It's been a heckuva run for most assets in recent months, even formerly left-for-dead ones like commodities.
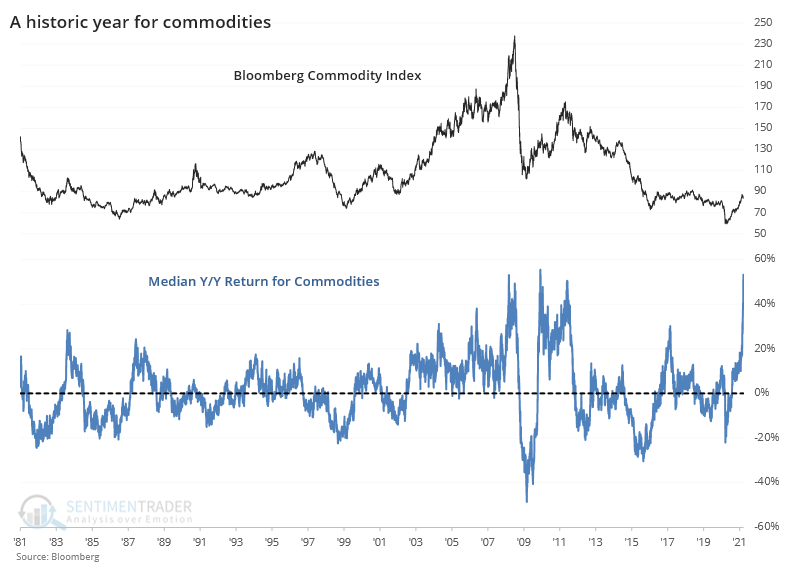
More and more, there are calls that we're in the beginning of a commodity super-cycle, those multi-year cycles when broad baskets of things that people pull out of the ground actually rise in price.
It's been a while since that concept wouldn't be laughed at. But for one of the few times in 40 years, every major commodity contract is now showing a year-over-year gain.
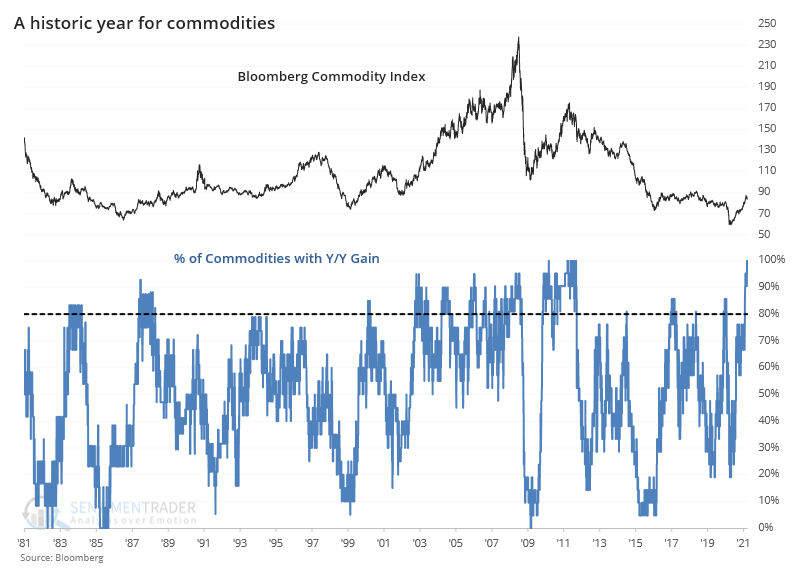
And those gains have been spectacular, with a median return of more than 50%. That's on the cusp of challenging the best median return in 40 years, with the only comparable thrust coming out of the financial crisis in 2009.
If we focus on the breadth of the price increases among commodity contracts, then we can look at other times when a majority of them were showing gains and see if it suggested a high probability that it was a new super cycle.
The table below shows each distinct occurrence since 1980, with forward returns in the Bloomberg Commodity Index.
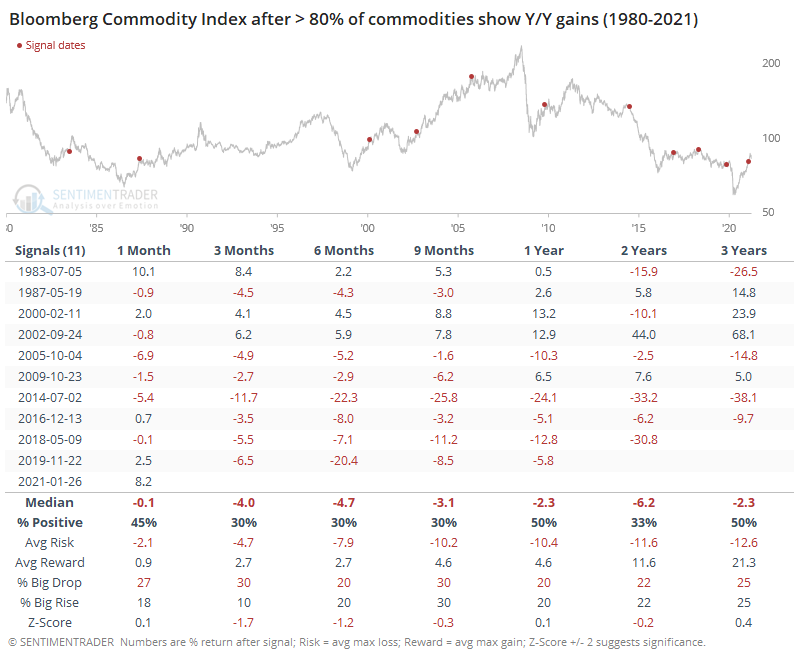
It's not encouraging to commodity traders. Most of these triggered near the peaks of swings in the broader commodity complex, and future returns were very poor, especially in recent years. That's not to say there weren't exceptions - it did precede consistent gains in 2002, and even in 2000, most of the time frames showed gains.
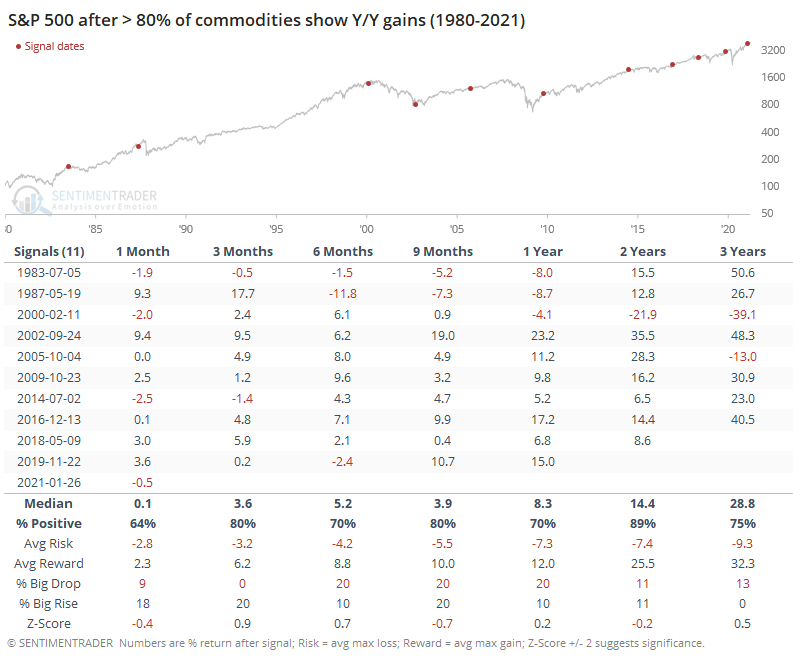
Notably, these commodity thrusts did, however, tend to lead to gains for stocks. Over the next 6 months, 10 out of the 11 signals preceded a gain in the S&P 500.
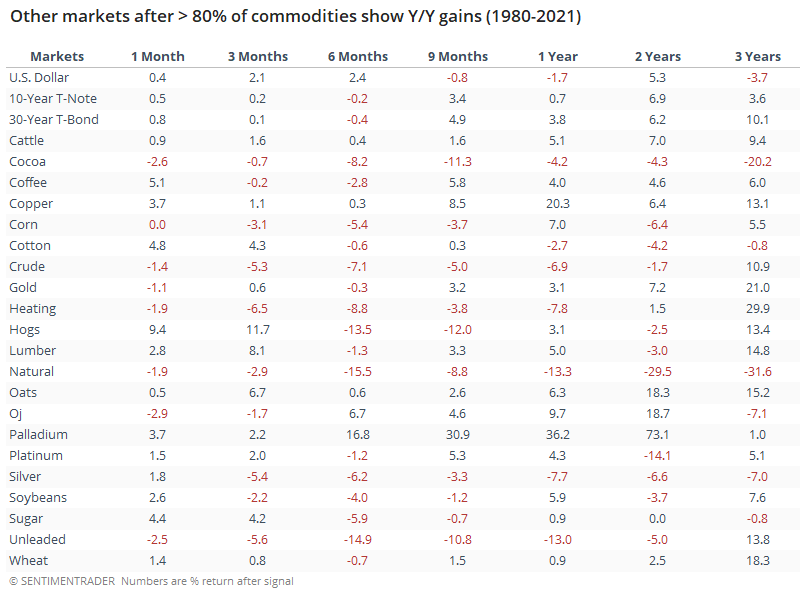
In terms of individual contracts, palladium tended to fare the best, with copper, gold, and platinum also (mostly) showing gains. Oats, wheat, cattle and orange juice showed the best returns among other contracts.
Whenever we see moves like this, there is a strong tendency to assign a narrative and make assumptions based on predictions about the future. Some of those will undoubtedly prove astute.
We focus much more attention on quantifying how investors tended to behave under similar market movements to glean insights on how they might react going forward. Based on that alone, the other times we saw broad-based and massive swings in commodity contracts, investors showed more of a tendency to pull back rather than press those bets, especially over the medium-term. Commodity bulls need to pin their hopes on the idea that this is more like 2002 and less like most other historical periods.
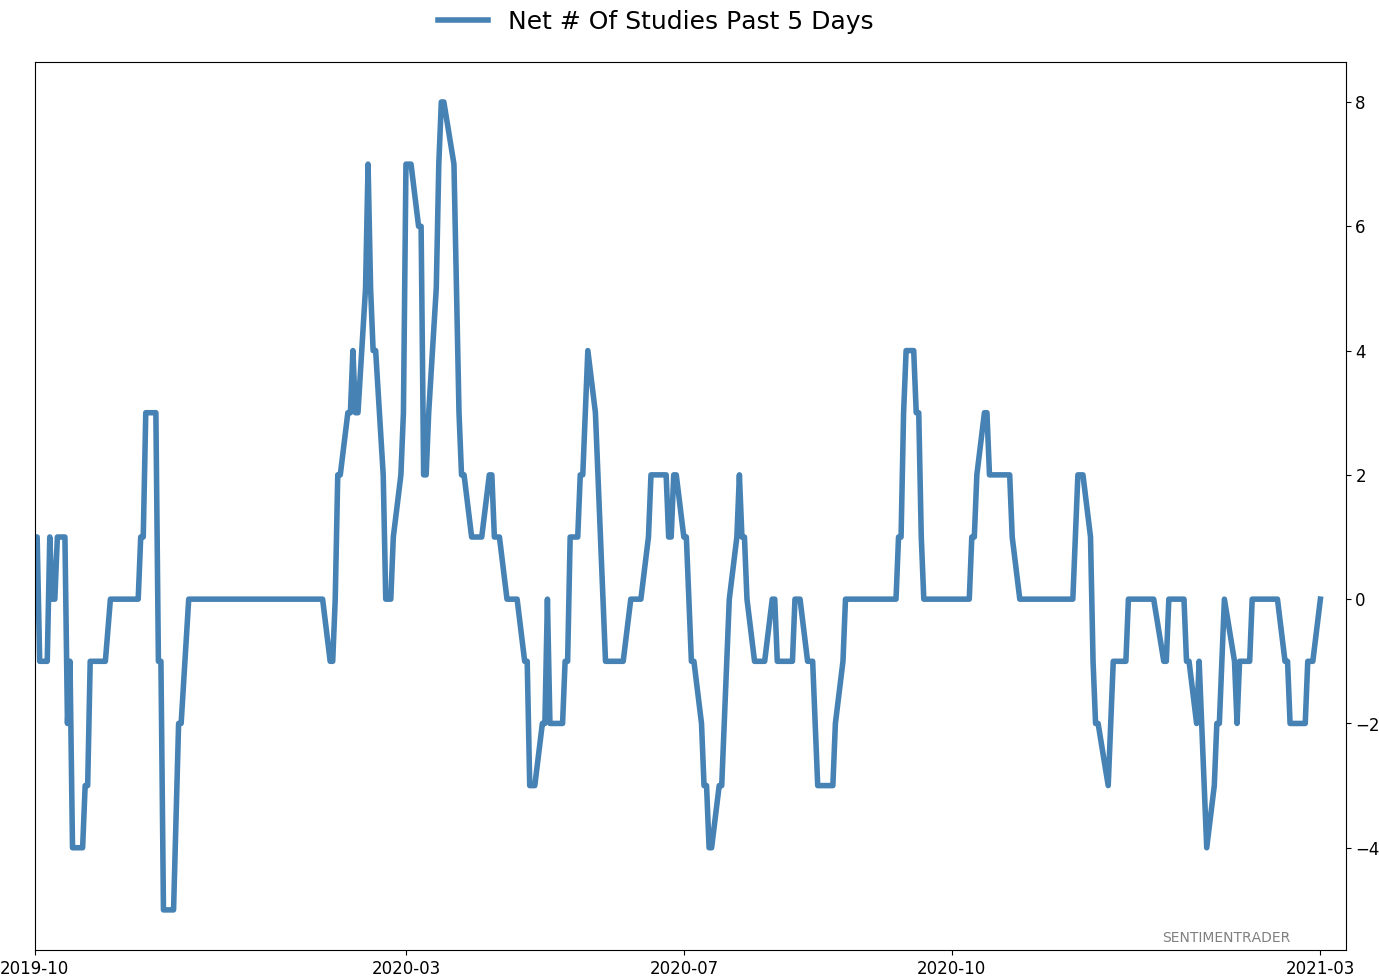
Active Studies
| Time Frame | Bullish | Bearish | | Short-Term | 0 | 0 | | Medium-Term | 2 | 10 | | Long-Term | 16 | 4 |
|
Indicators at Extremes
Portfolio
| Position | Description | Weight % | Added / Reduced | Date | | Stocks | RSP | 4.9 | Reduced 4% | 2021-02-09 | | Bonds | 30.0% BND, 8.8% SCHP | 38.8 | Added 15.1% | 2021-02-18 | | Commodities | GCC | 2.3 | Reduced 2.1%
| 2020-09-04 | | Precious Metals | GDX | 9.0 | Added 0.1% | 2021-02-18 | | Special Situations | 7.3% XLE, 4.8% PSCE | 12.1 | Reduced 5.6% | 2021-02-18 | | Cash | | 32.8 | | |
|
Updates (Changes made today are underlined)
With a market that has seen the kinds of broad participation and big breath thrusts like we did in the fall, it's hard to become too negative. Those kinds of conditions have consistently preceded higher returns over the next 6-12 months. It's the interim that's more of an issue. Even conditions like that haven't prevented some shorter-term pullbacks. And when we combine an environment where speculation is rampant and recent days have seen an increase in cracks under the surface of the indexes, it's enough to become more defensive over a short- to medium-term time frame. We still don't have much confirmation from the price action in the indexes, so those who are more conservative would likely wait before increasing cash levels. I've decreased risk exposure a bit more, mainly in terms of energy stocks and the ANGL fund, while adding more to the broader bond market. RETURN YTD: 5.8% 2020: 8.1%, 2019: 12.6%, 2018: 0.6%, 2017: 3.8%, 2016: 17.1%, 2015: 9.2%, 2014: 14.5%, 2013: 2.2%, 2012: 10.8%, 2011: 16.5%, 2010: 15.3%, 2009: 23.9%, 2008: 16.2%, 2007: 7.8%
|
|
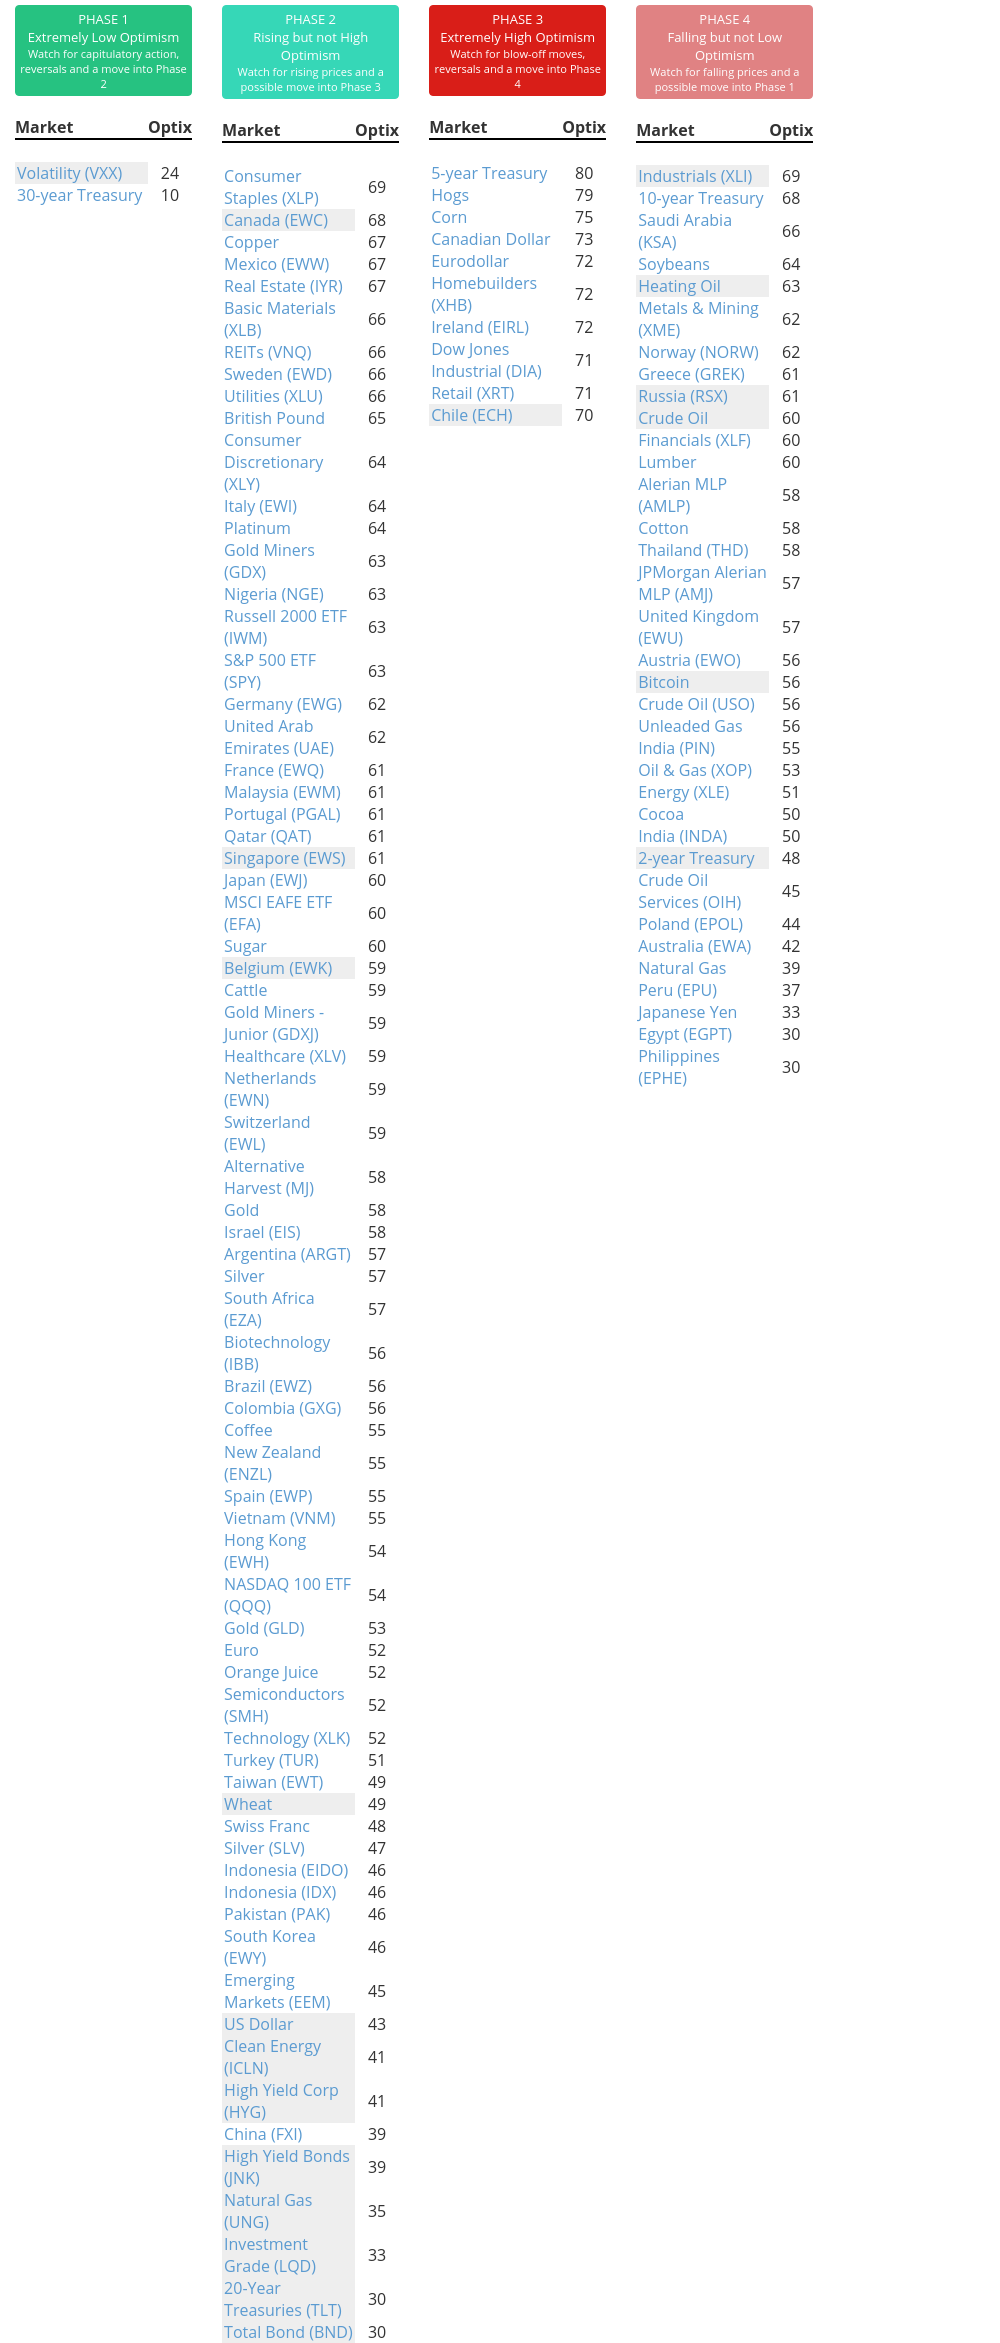
Phase Table
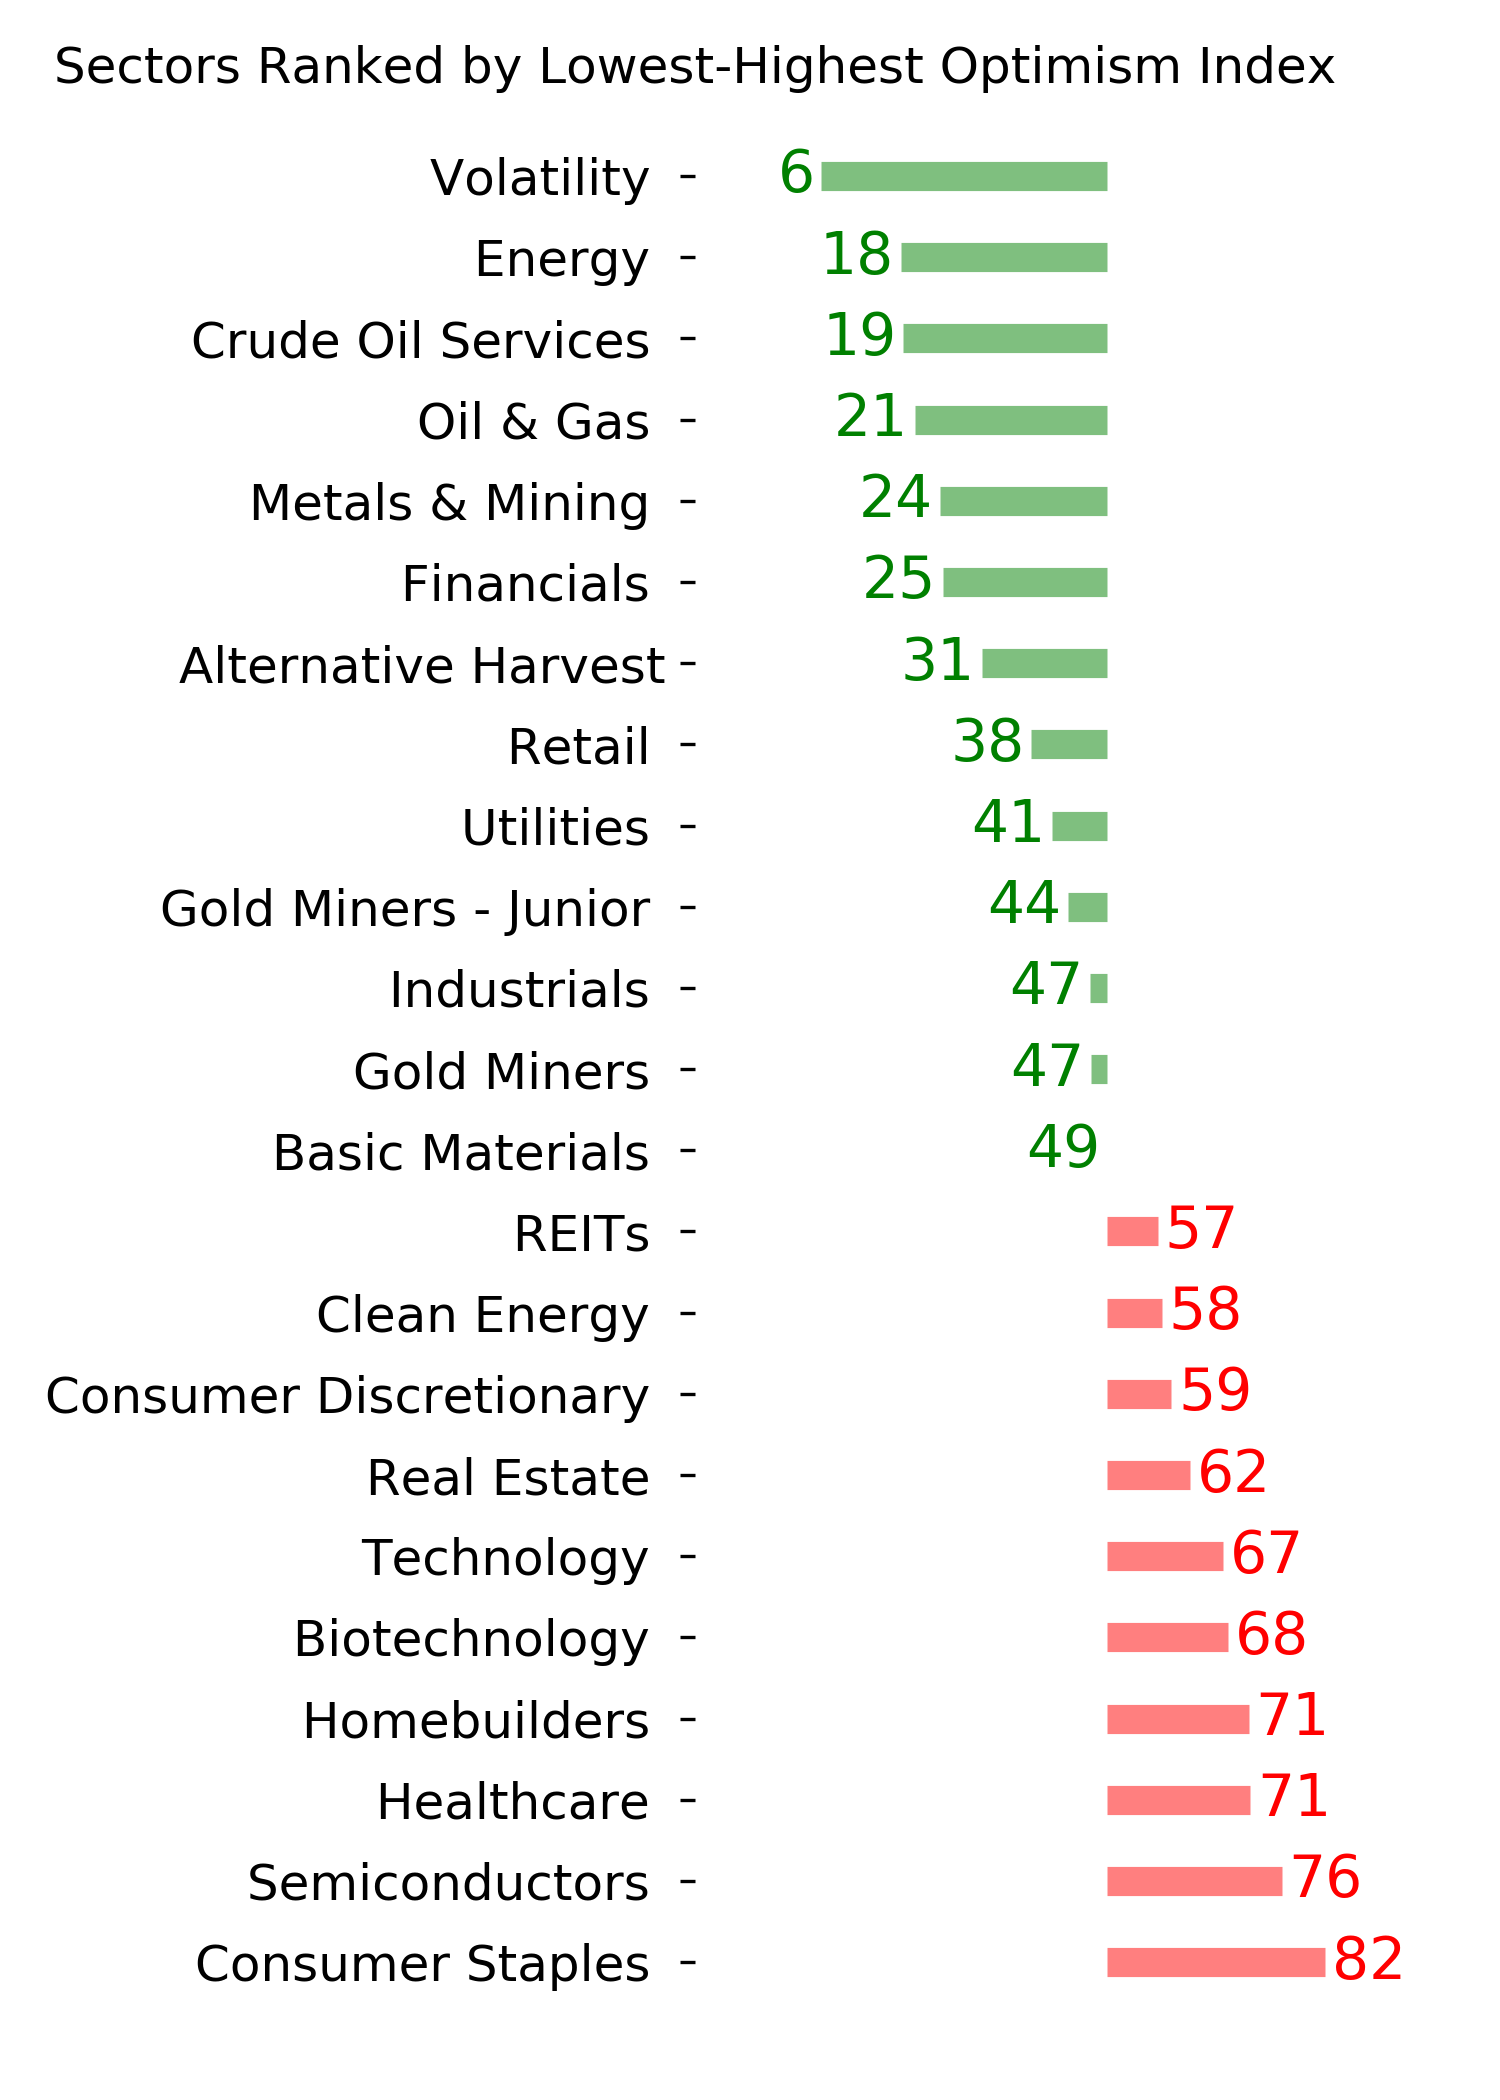
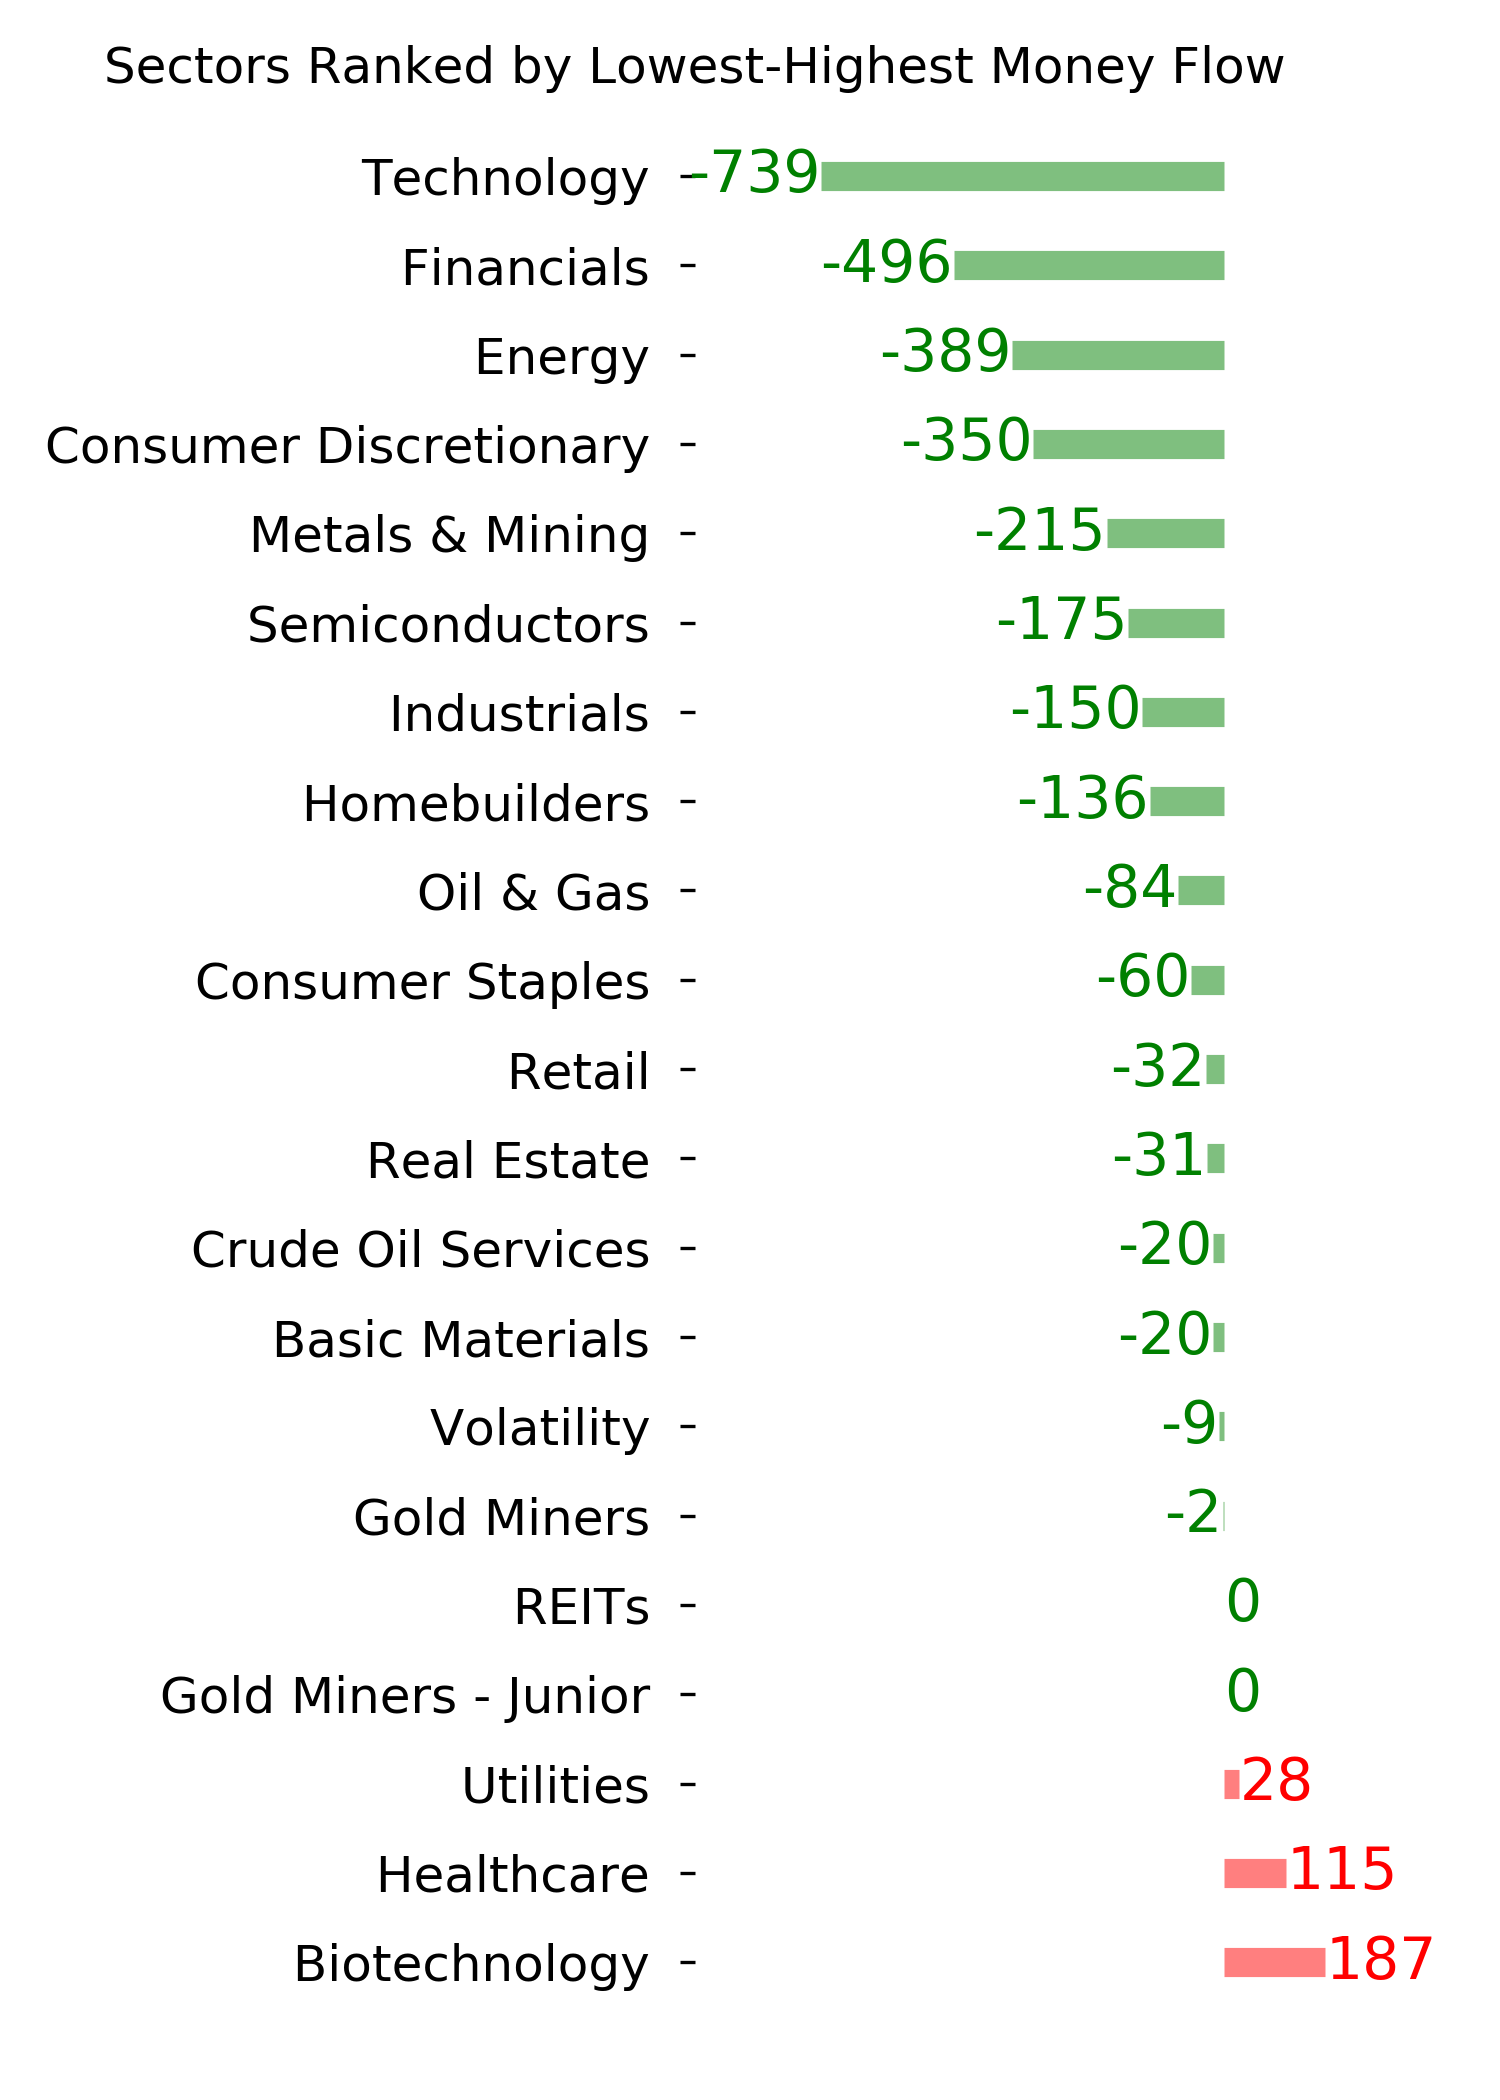
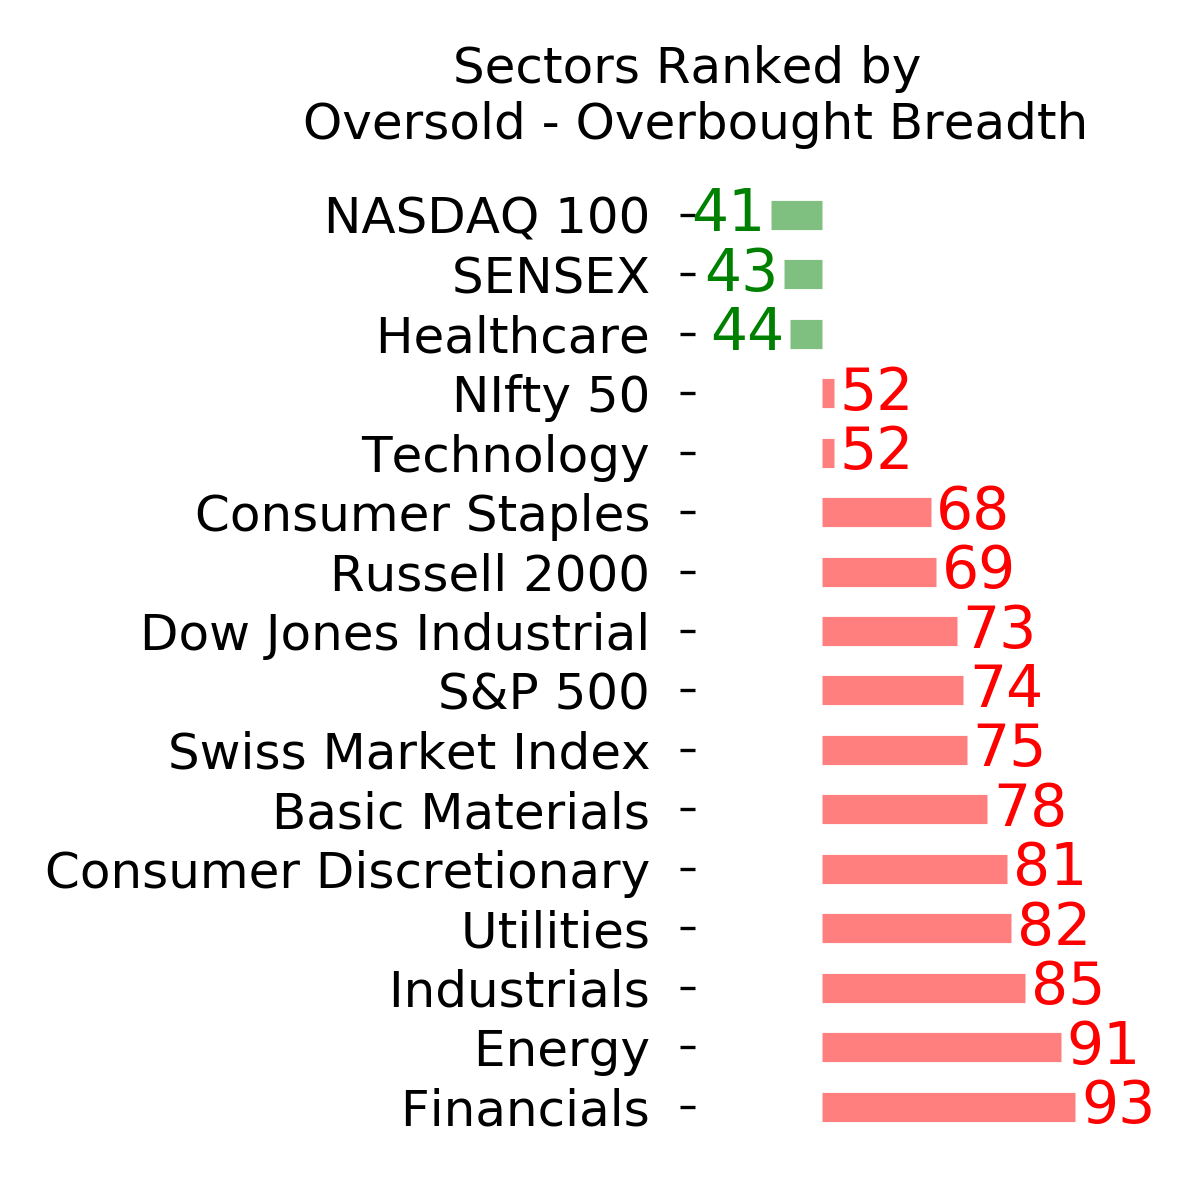
Ranks
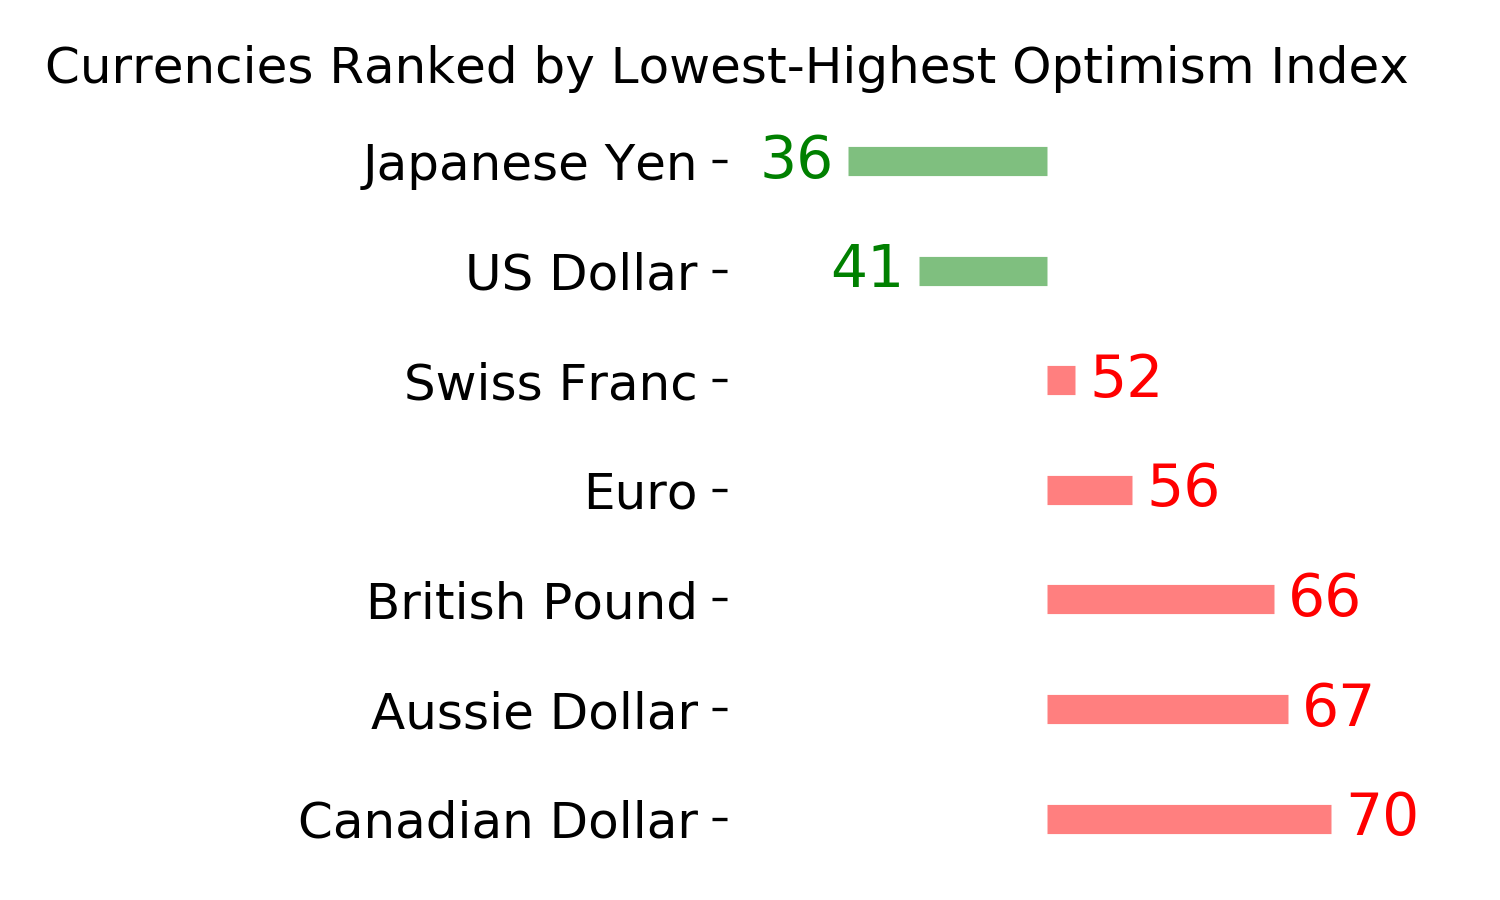
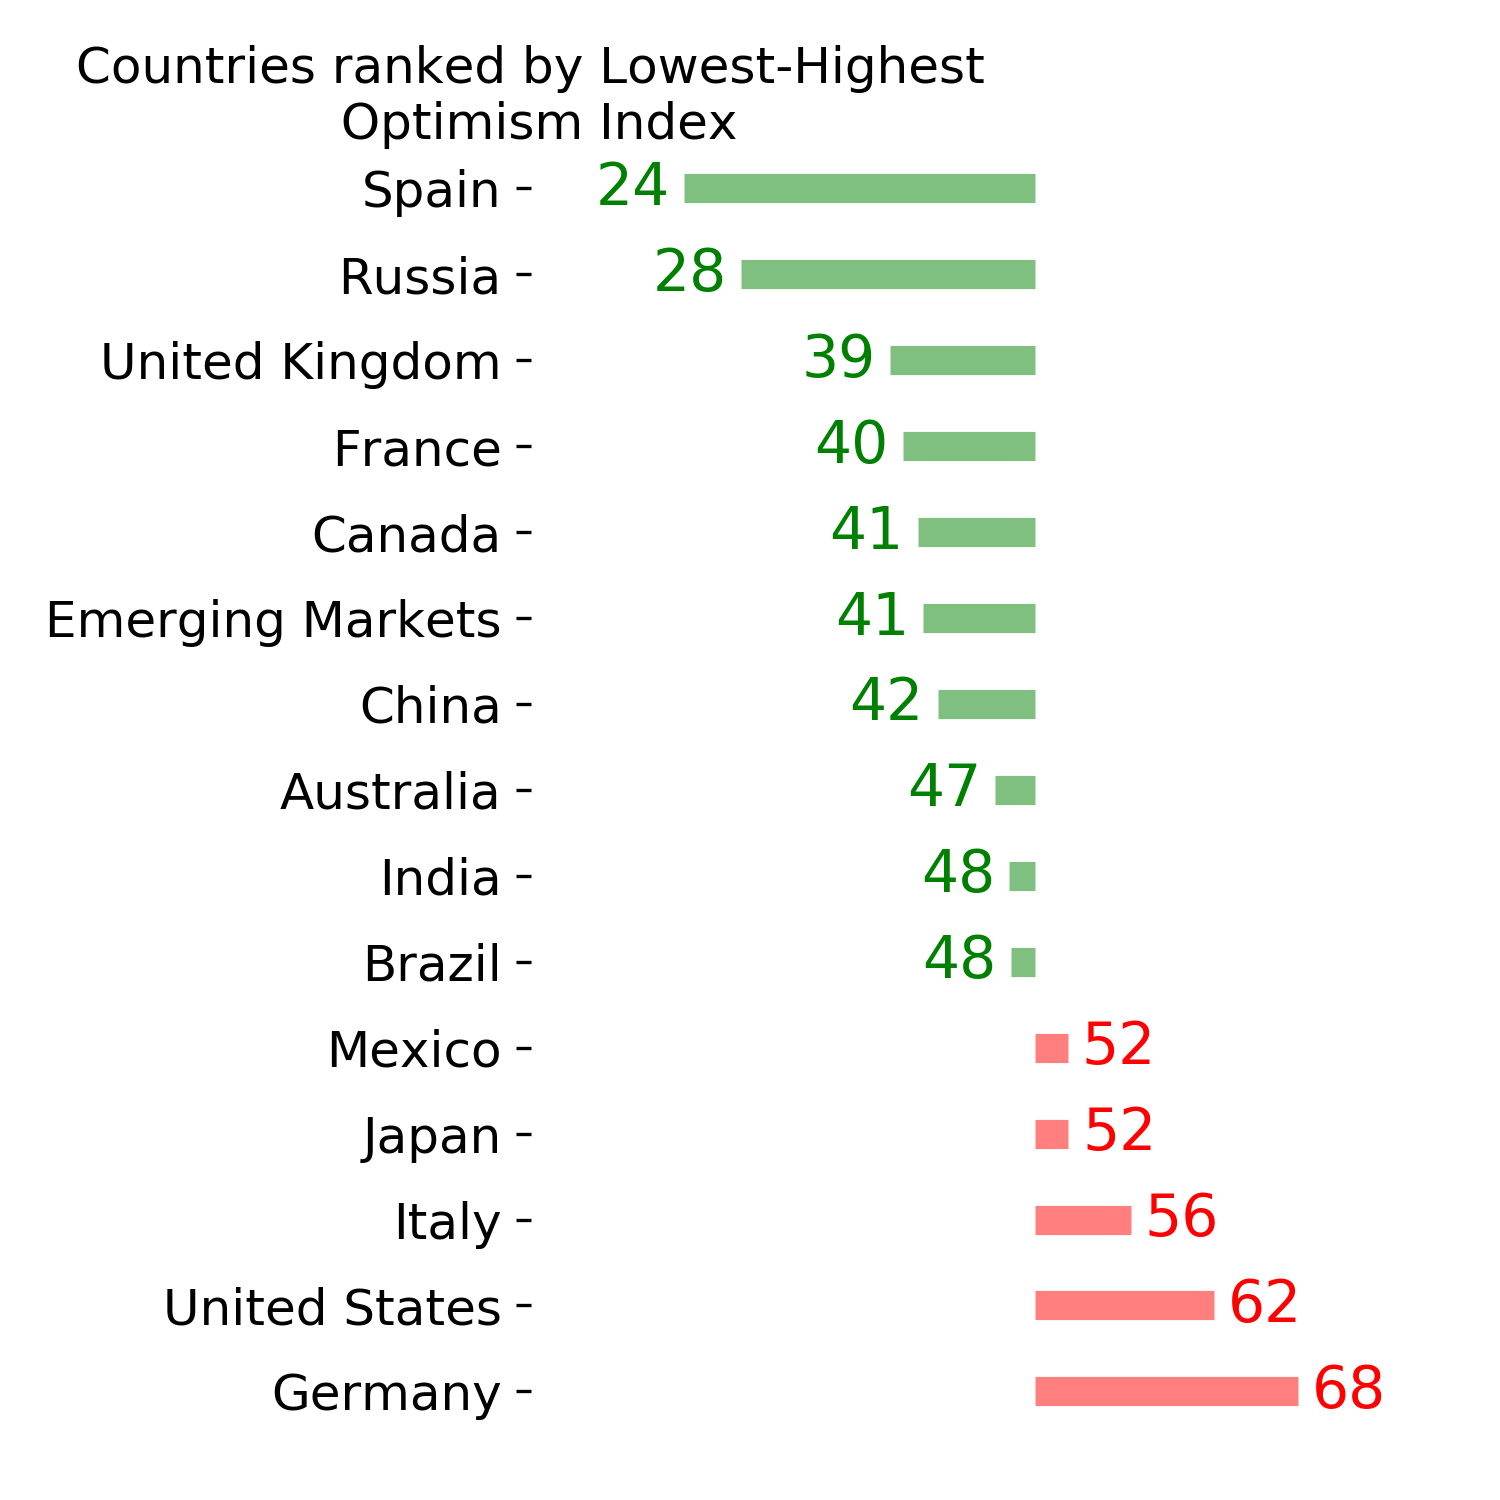
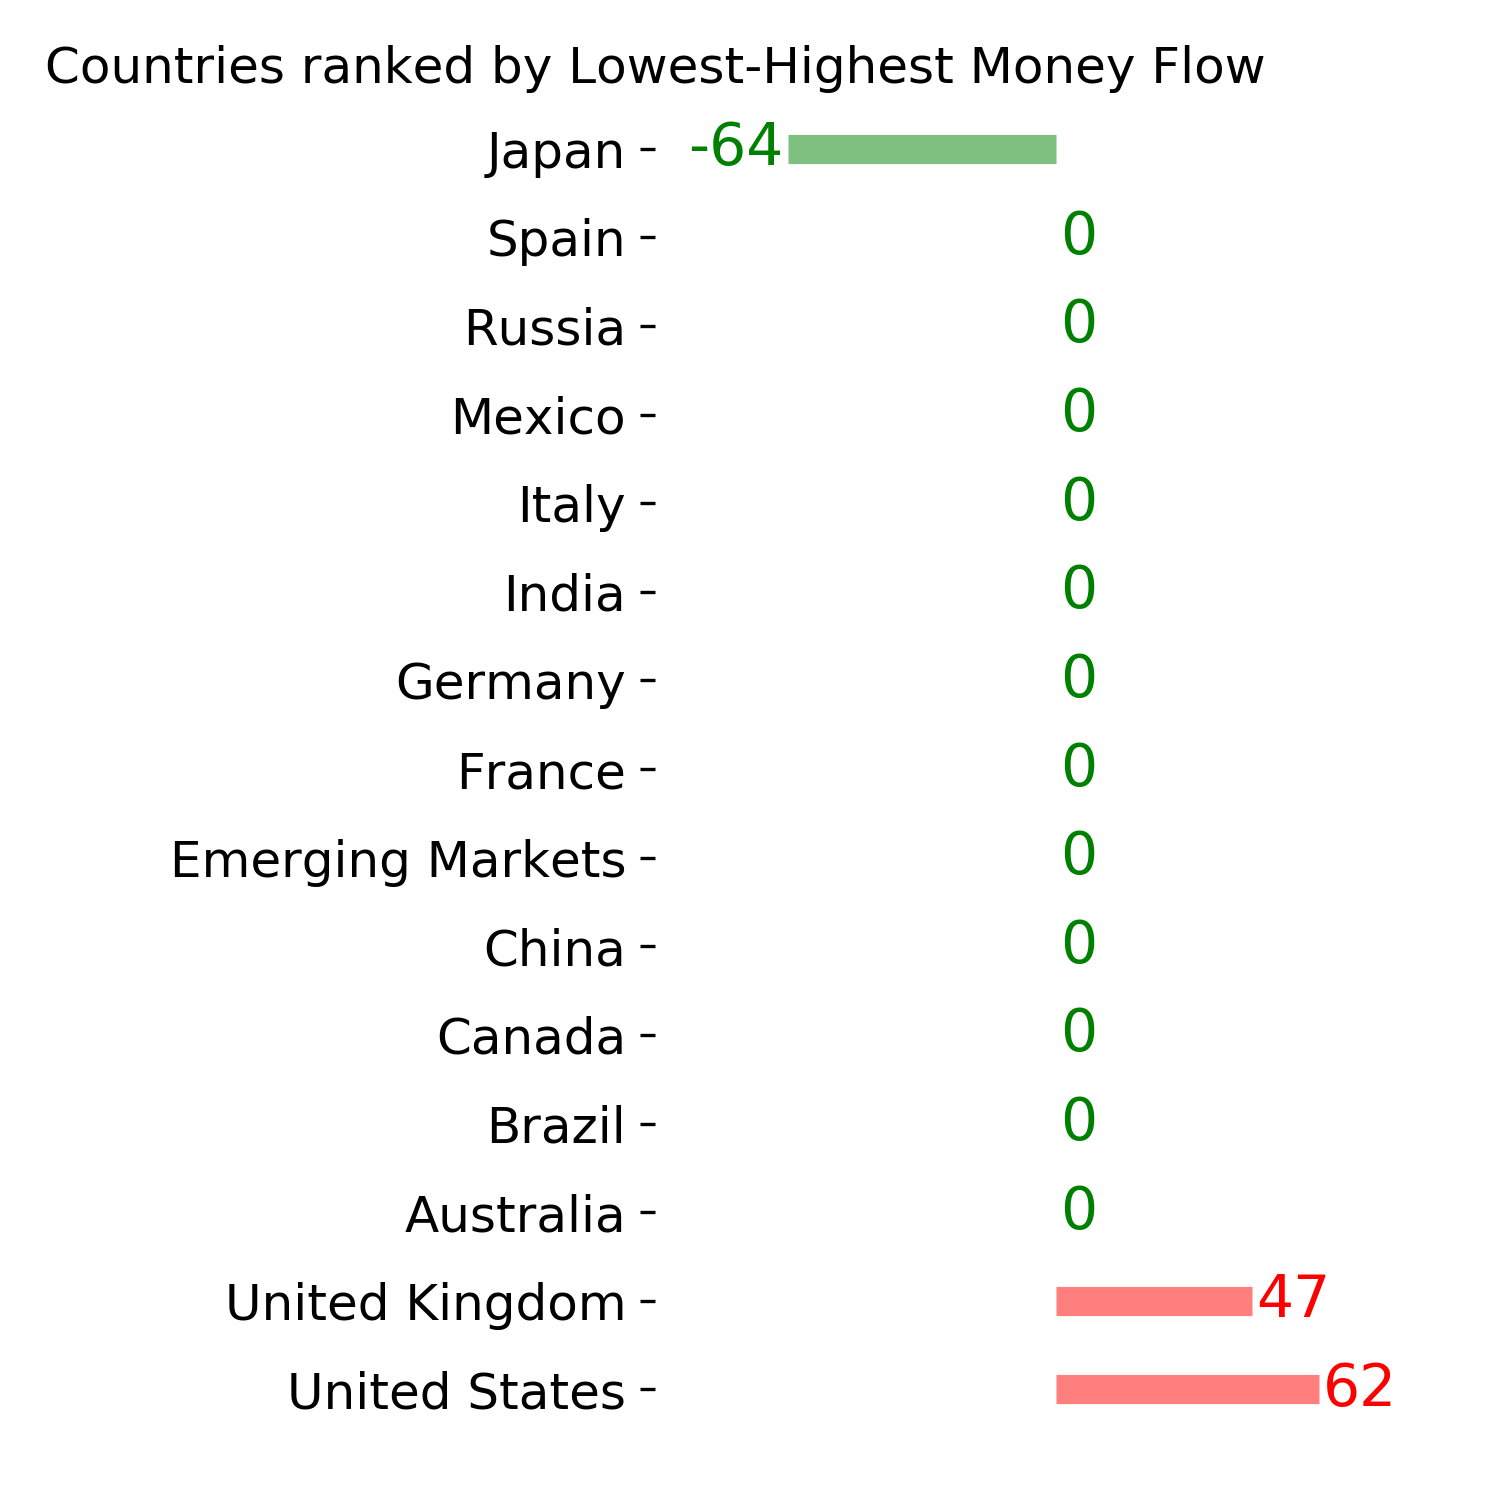
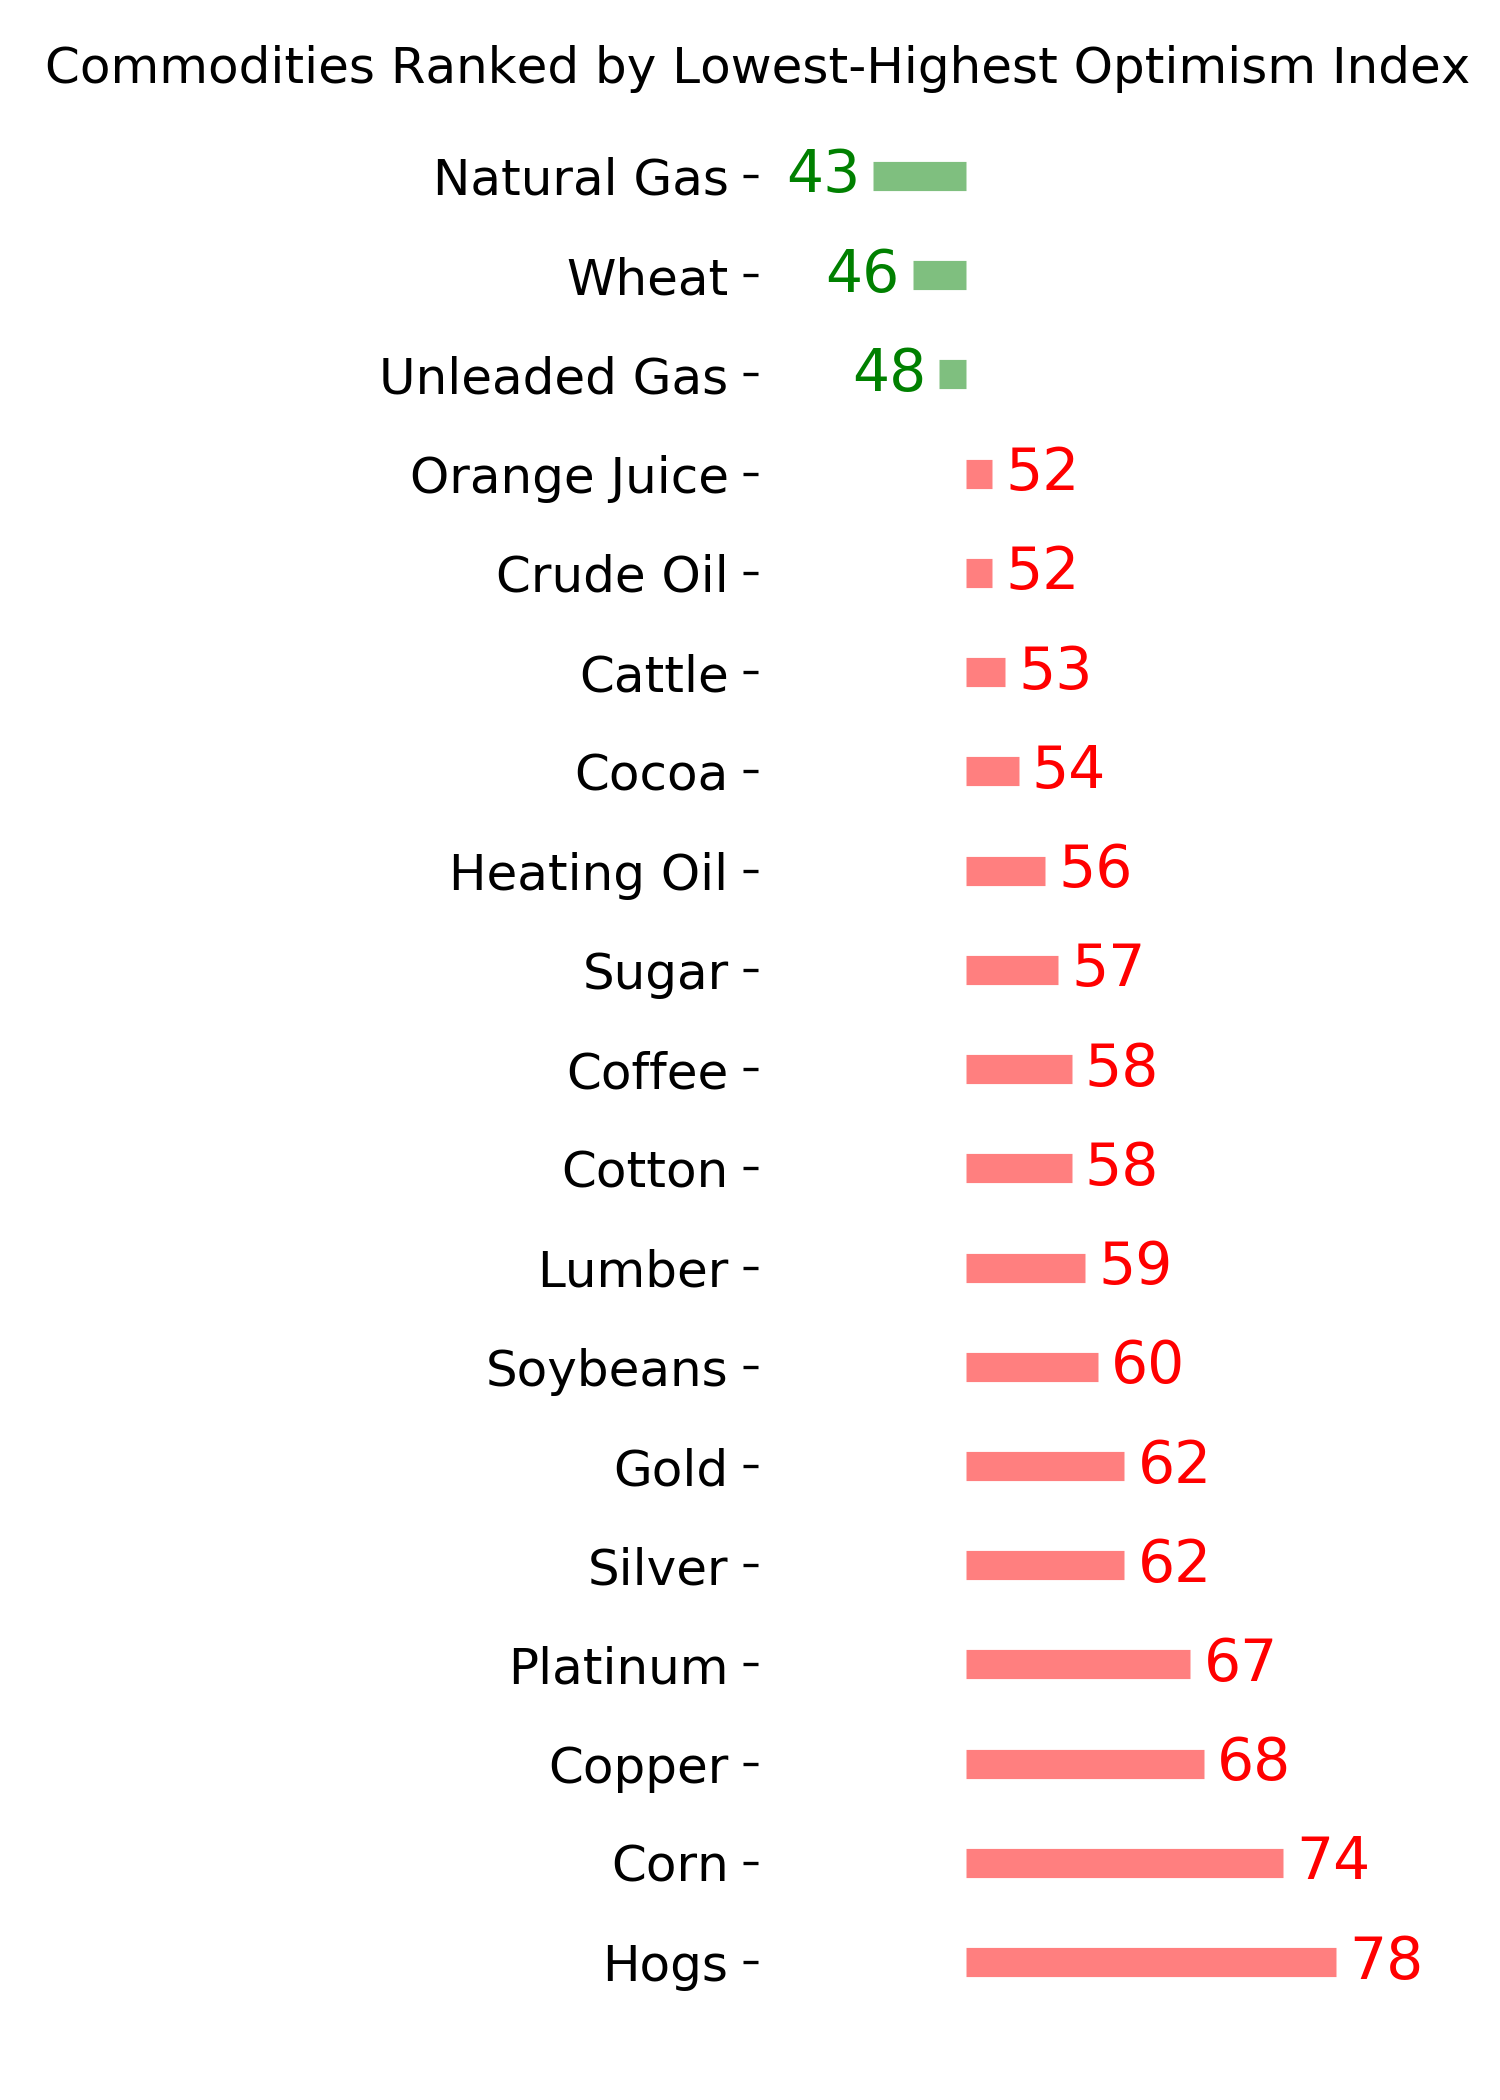
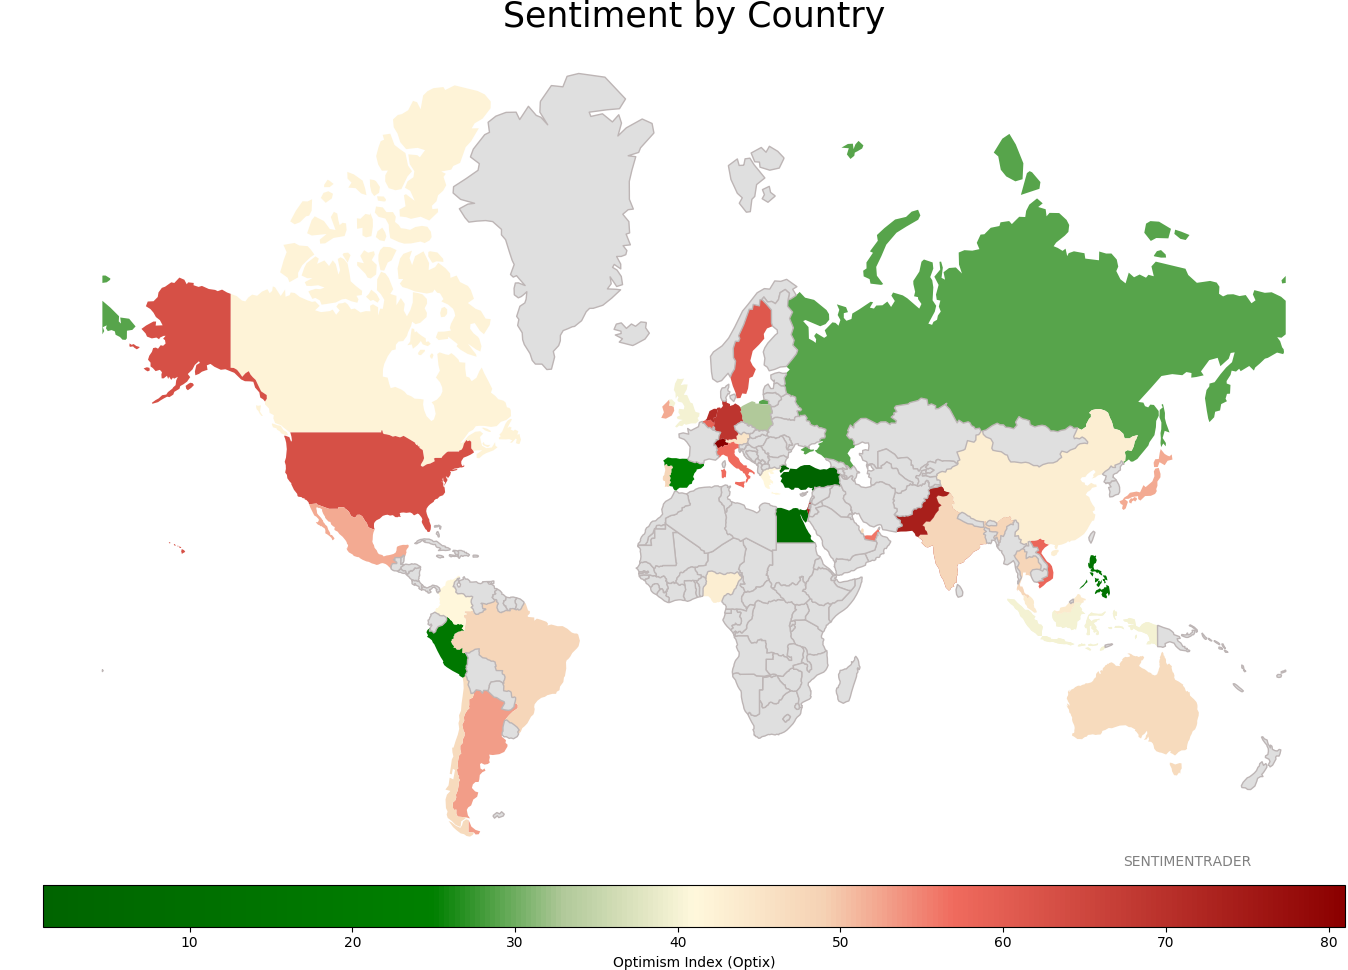
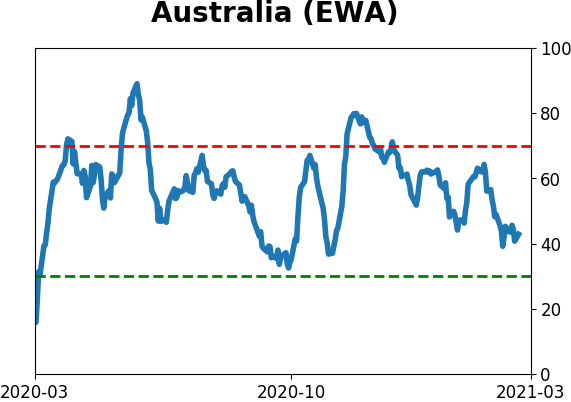
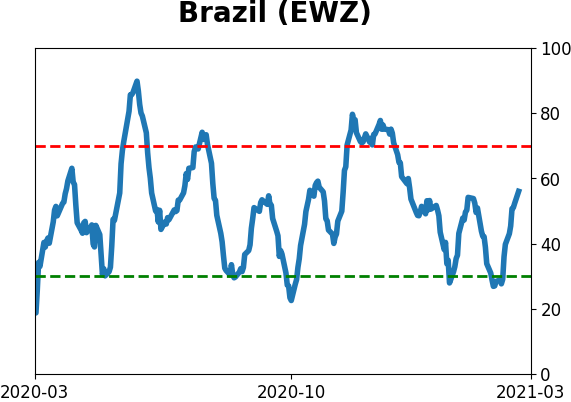
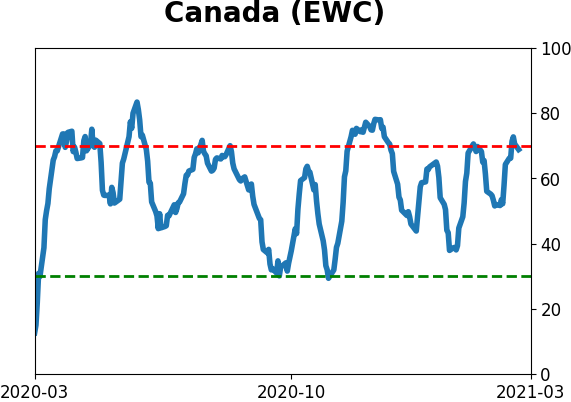
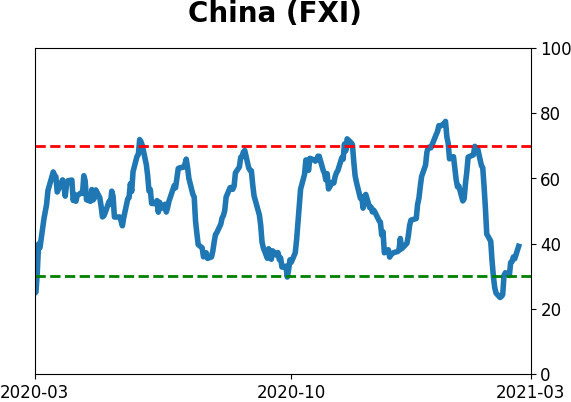
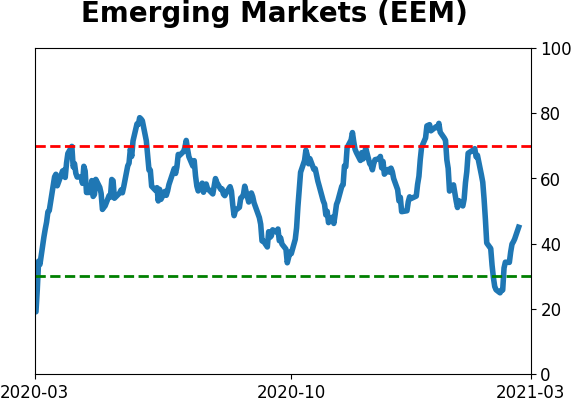
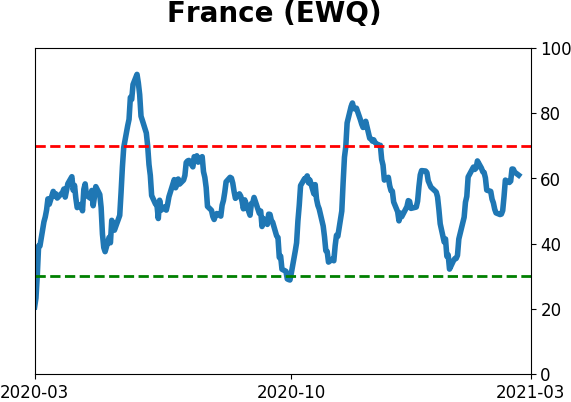
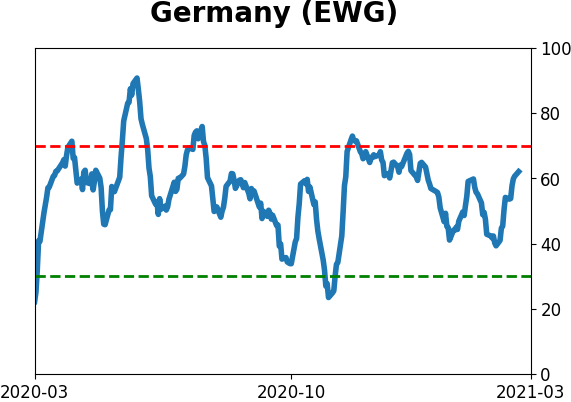
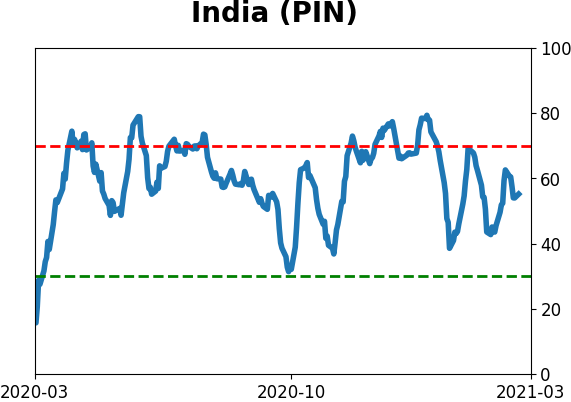
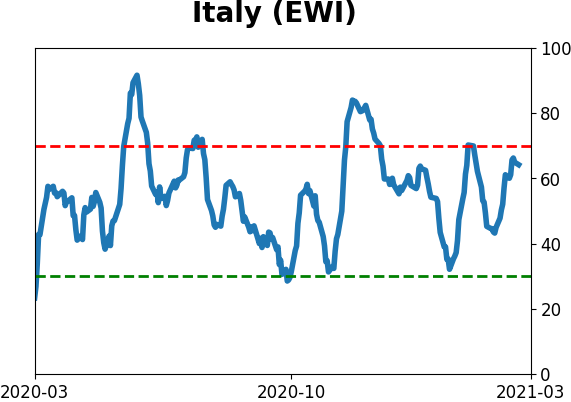
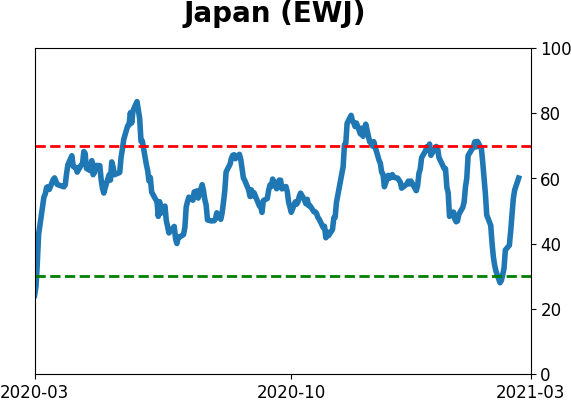
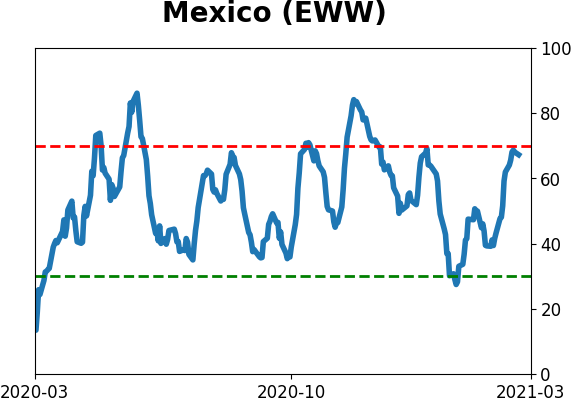
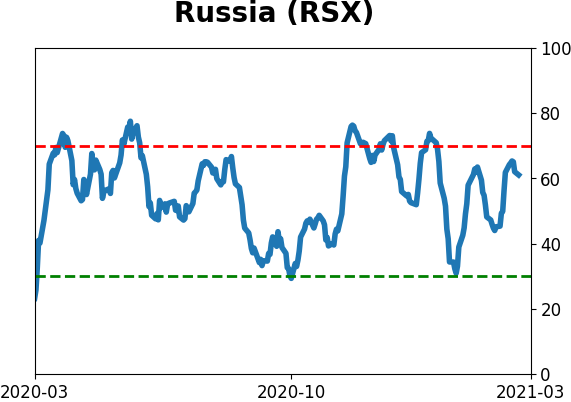
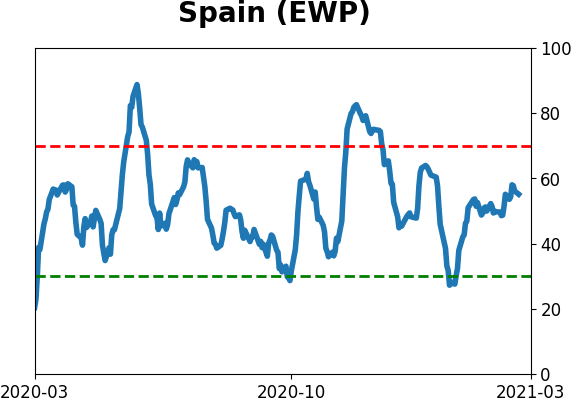
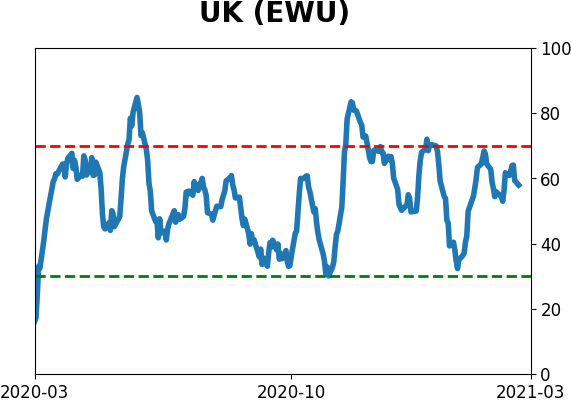
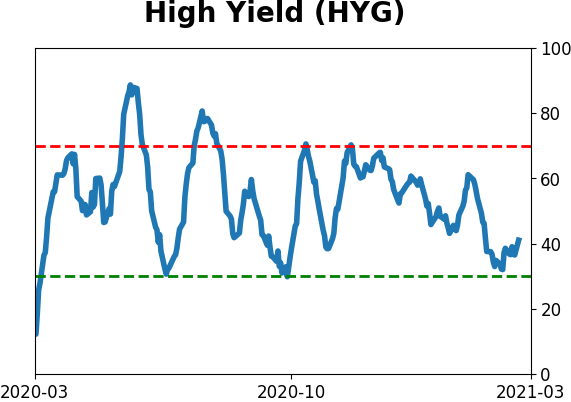
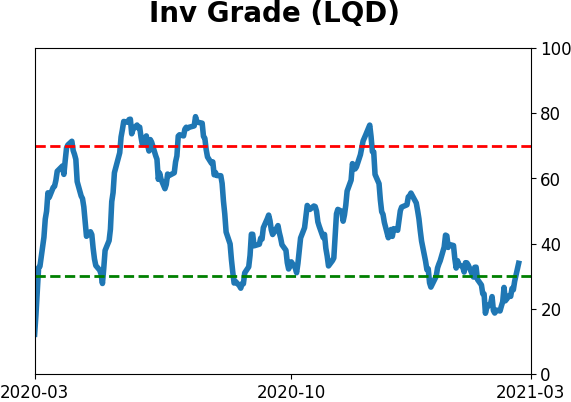
Sentiment Around The World
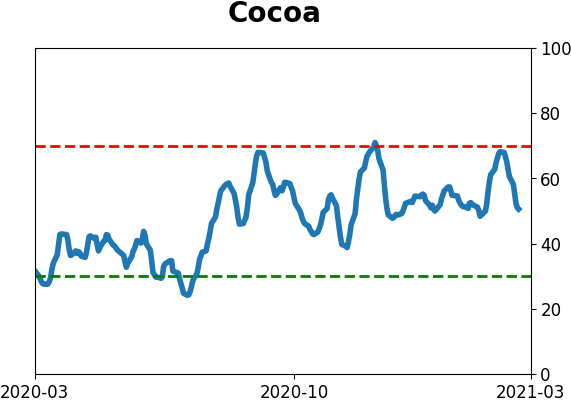
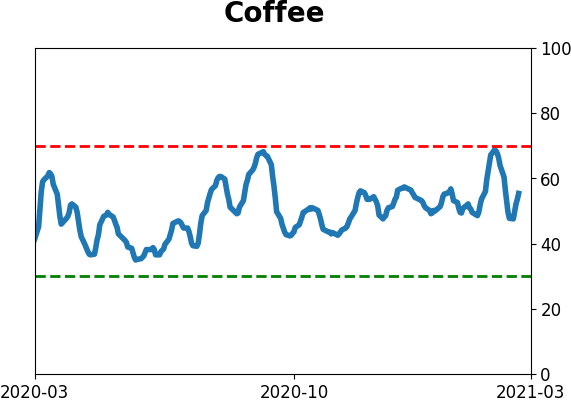
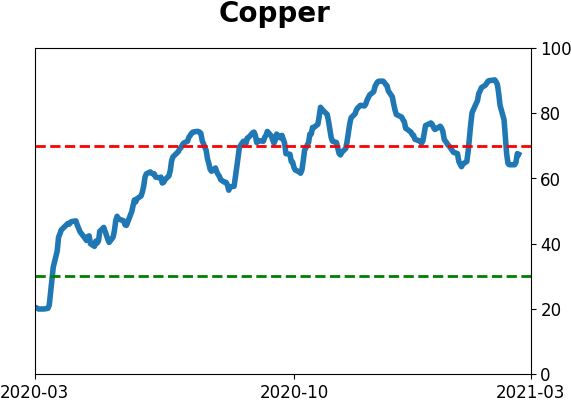
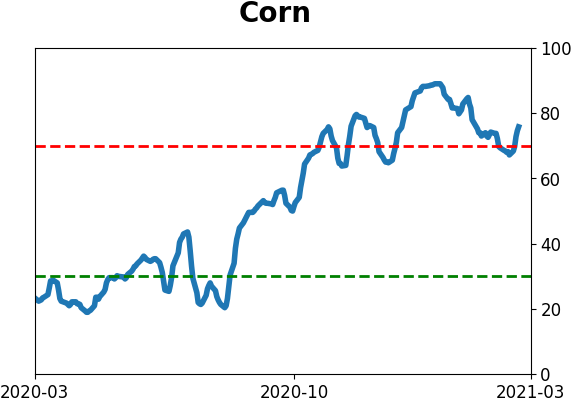
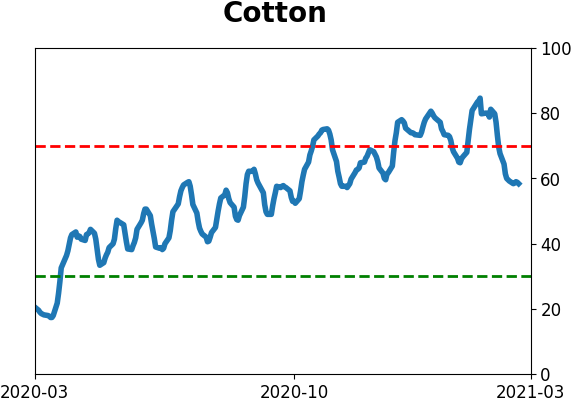
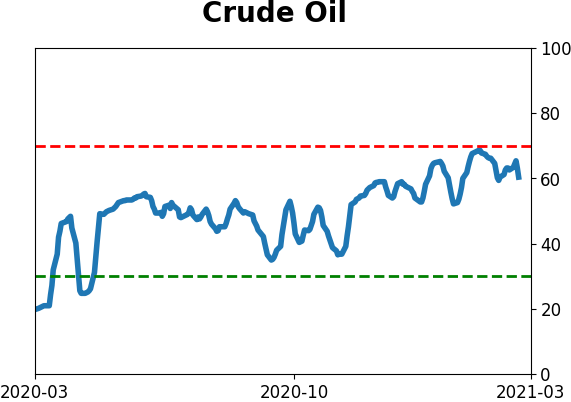
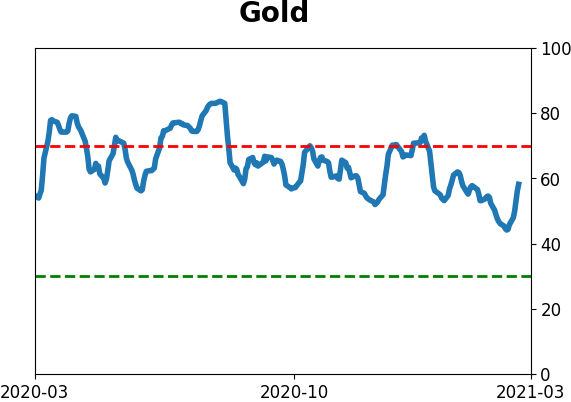
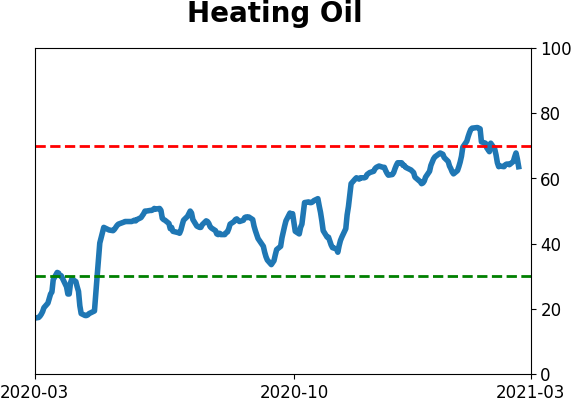
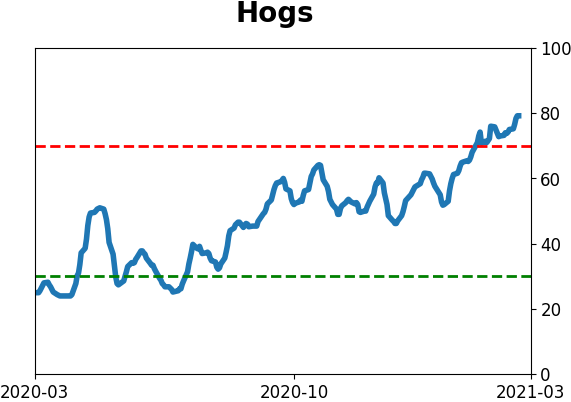
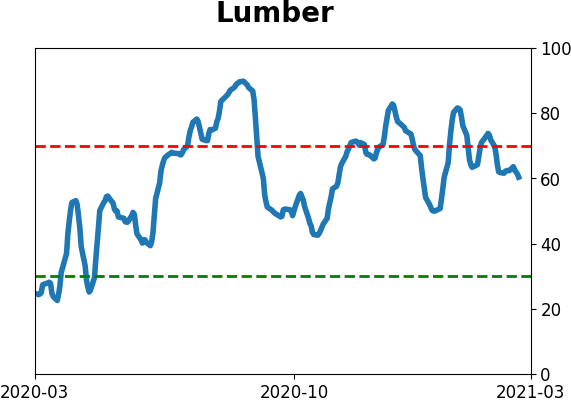
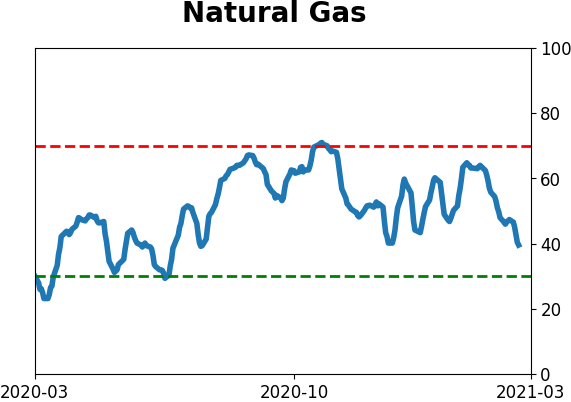
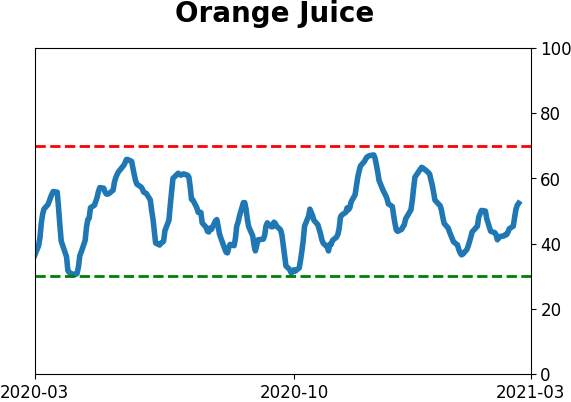
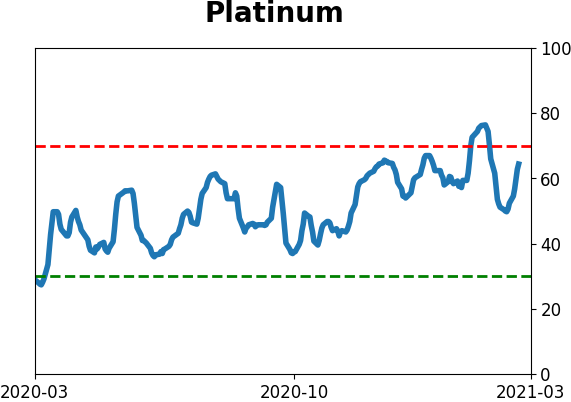
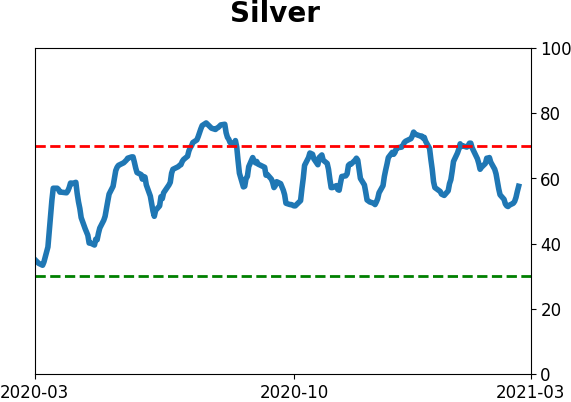
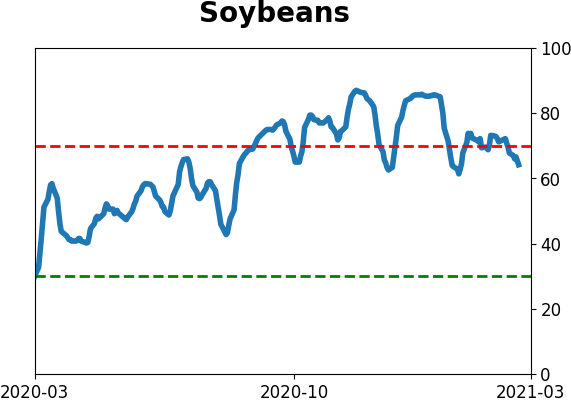
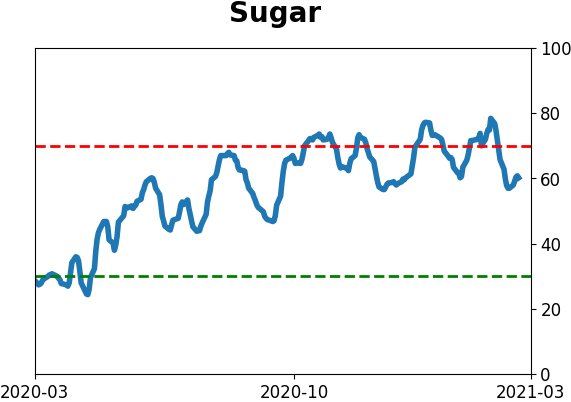
Optimism Index Thumbnails
|
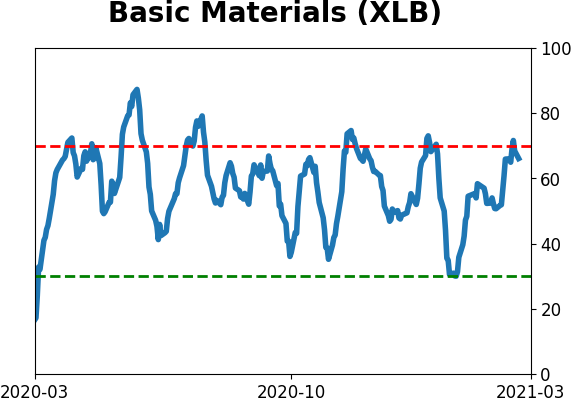
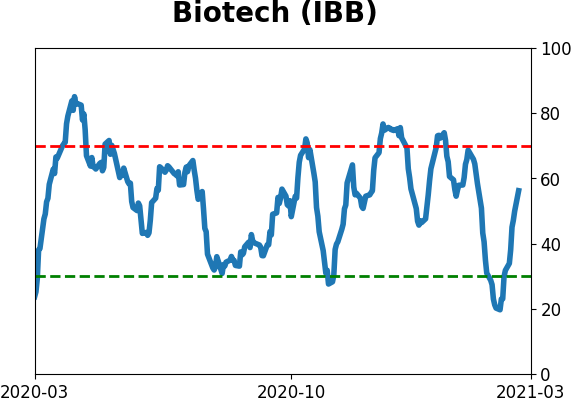
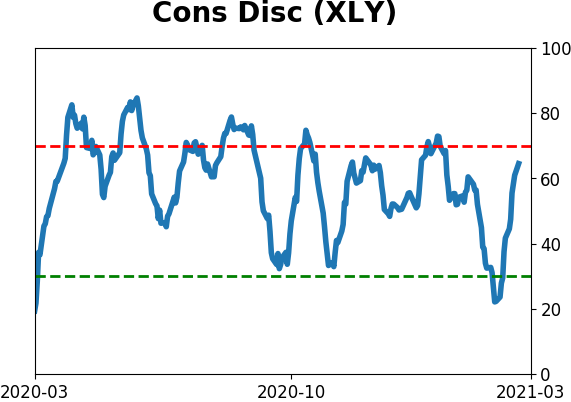
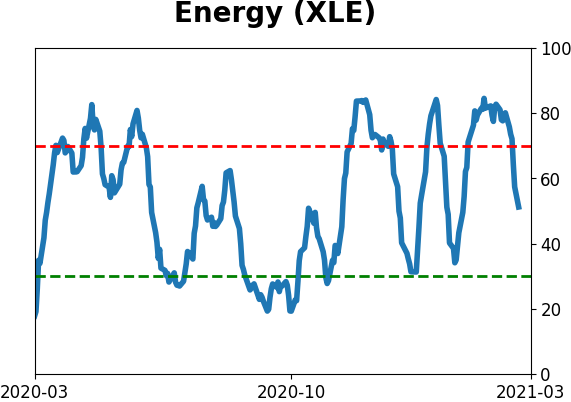
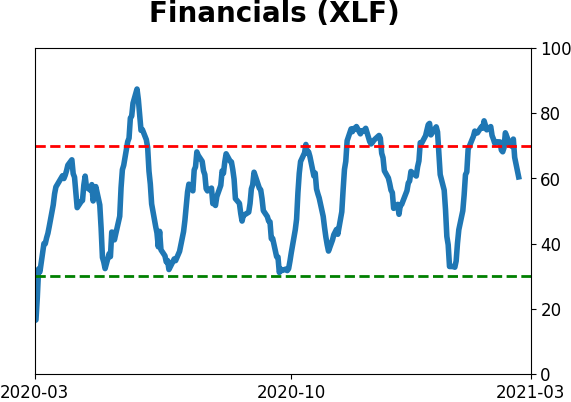
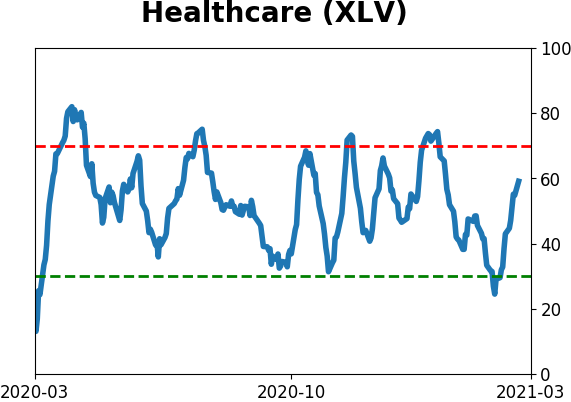
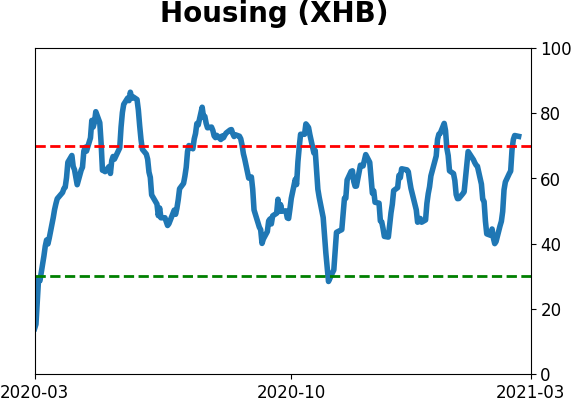
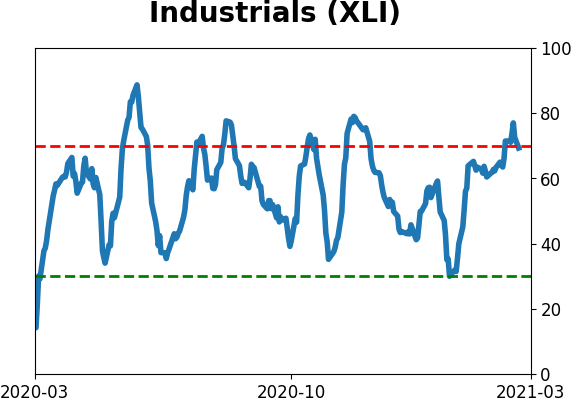
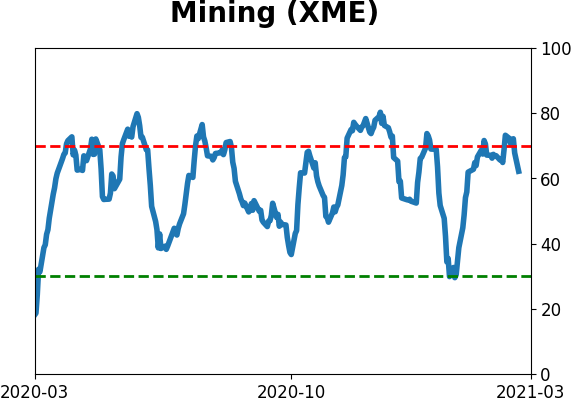
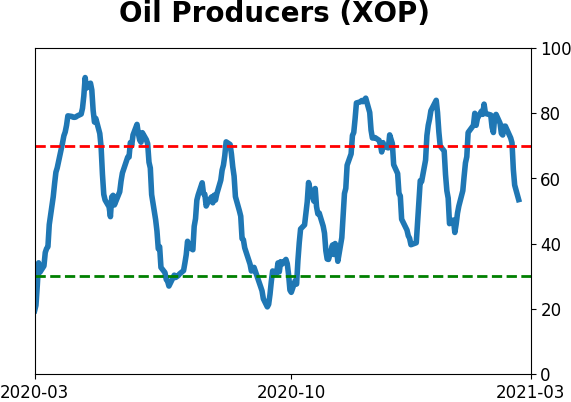
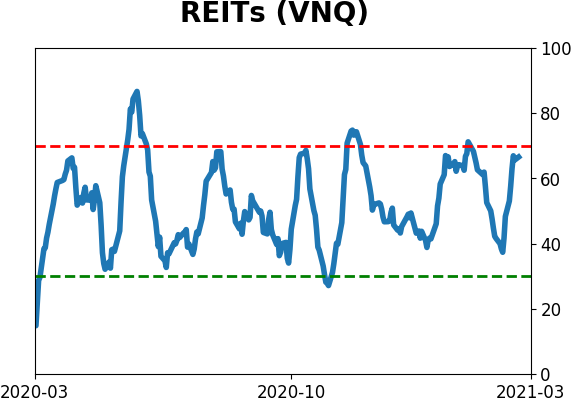
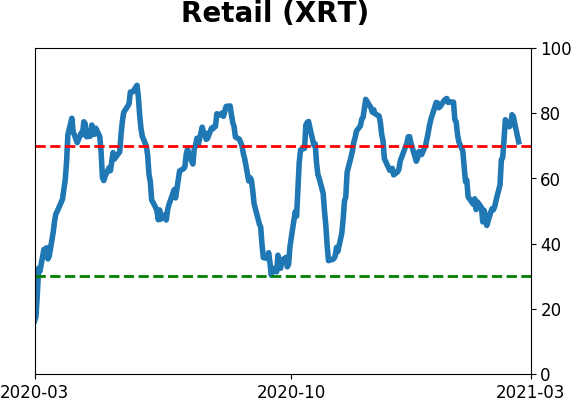
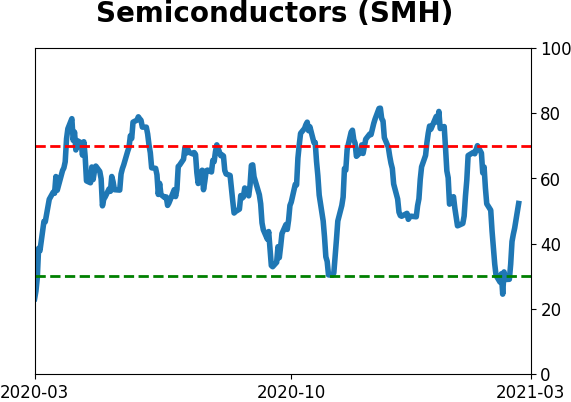
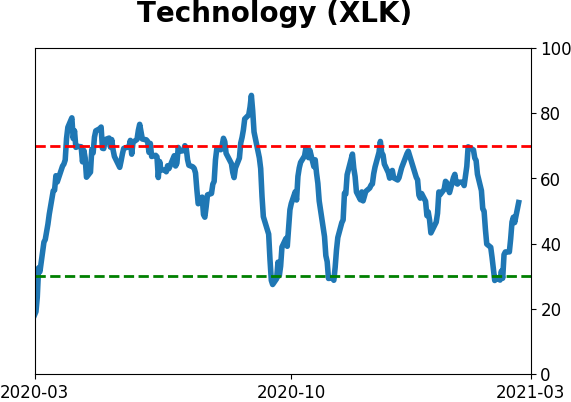
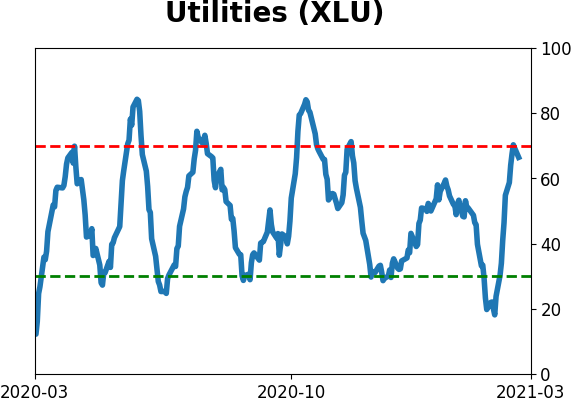
Sector ETF's - 10-Day Moving Average
|
|
|
Country ETF's - 10-Day Moving Average
|
|
|
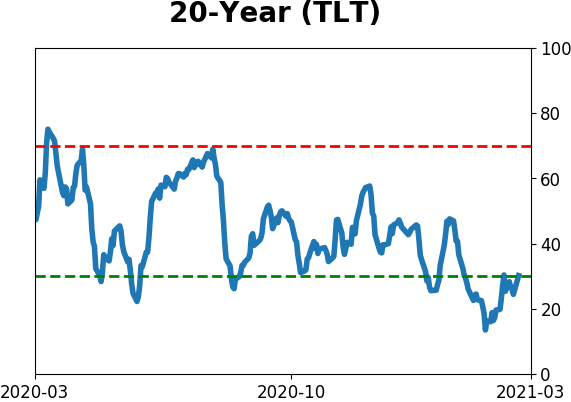
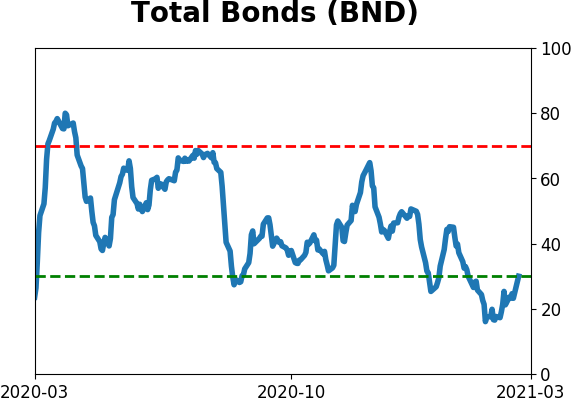
Bond ETF's - 10-Day Moving Average
|
|
|
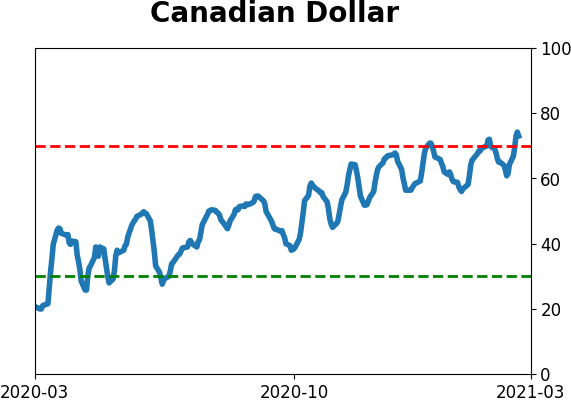
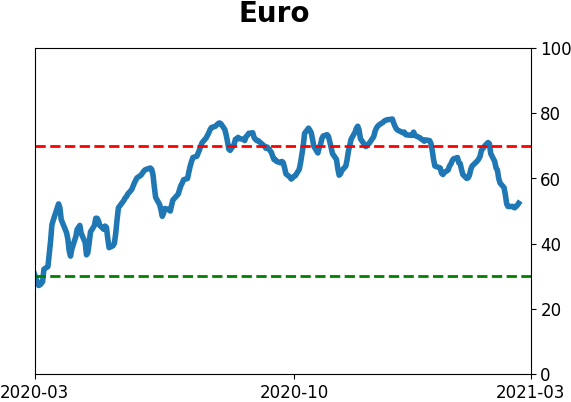
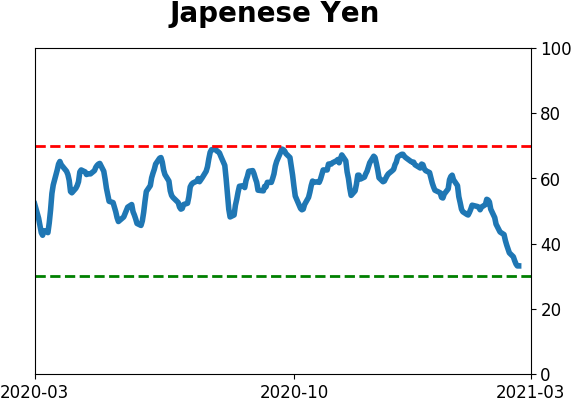
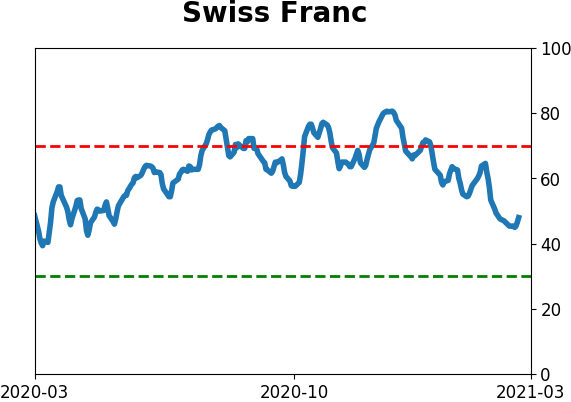
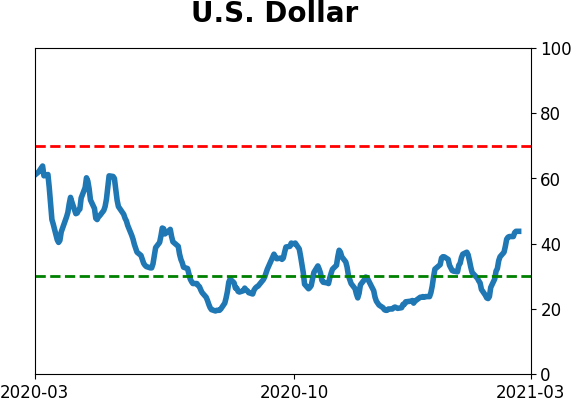
Currency ETF's - 5-Day Moving Average
|
|
|
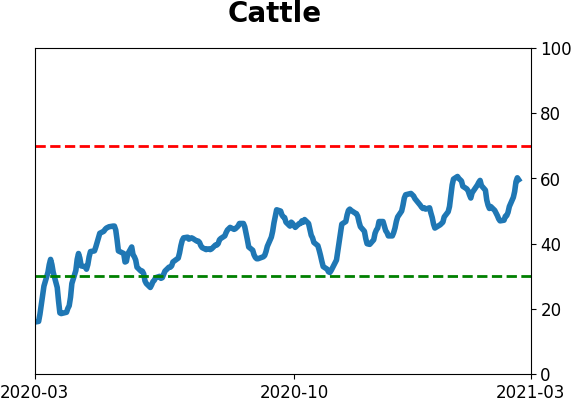
Commodity ETF's - 5-Day Moving Average
|
|