Headlines
|
|
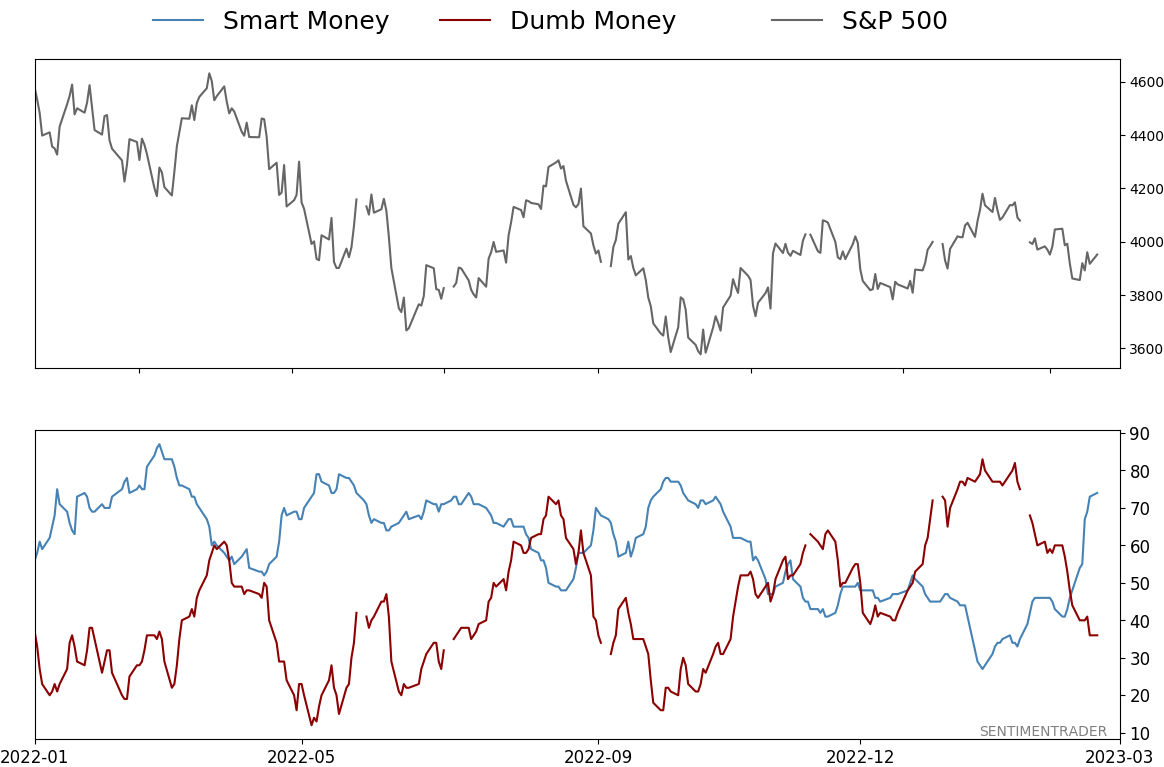
The Smart Money is now much more confident than Dumb Money:
In fewer than 30 sessions, investors have cycled from a feeling of high optimism all the way to deep pessimism. Similarly quick cycles in sentiment preceded positive returns for stocks, but the behavior of investors since the post-October rally is raising questions about a new bull market.
|
Smart / Dumb Money Confidence
|
Smart Money Confidence: 74%
Dumb Money Confidence: 36%
|
|
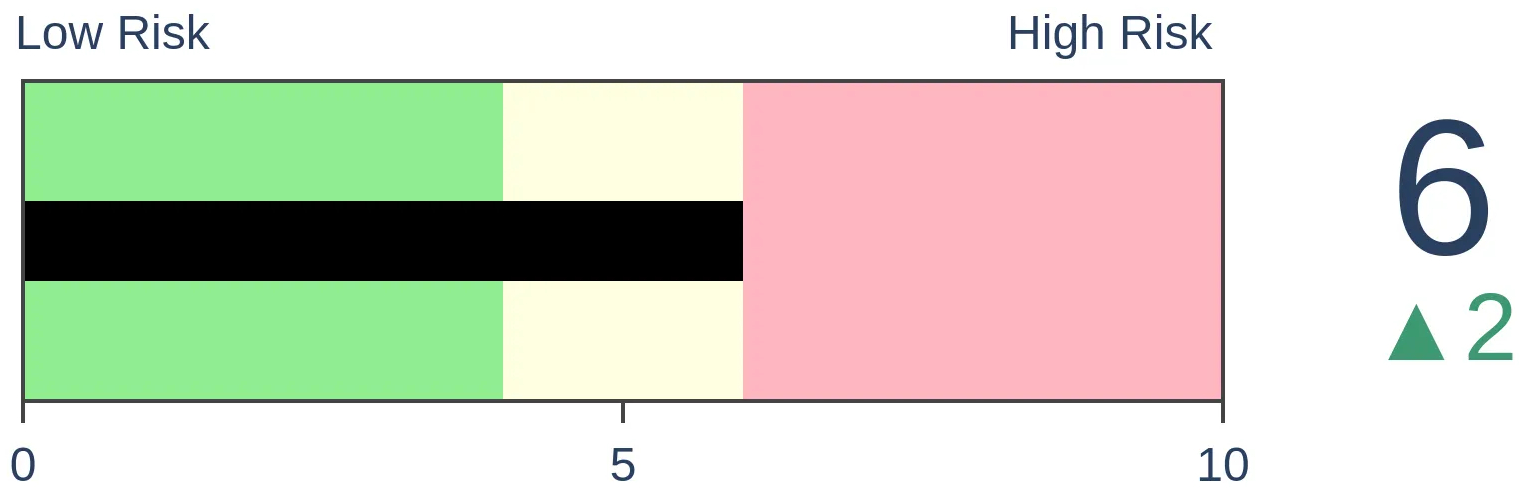
Risk Levels
Stocks Short-Term
|
Stocks Medium-Term

|
|
Bonds

|
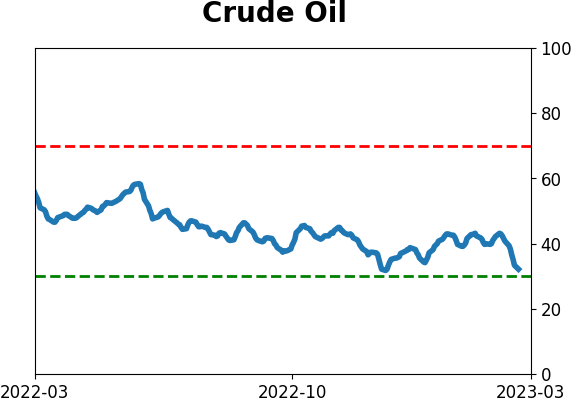
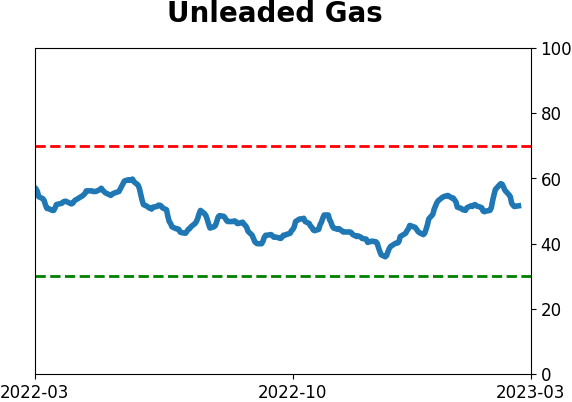
Crude Oil
|
|
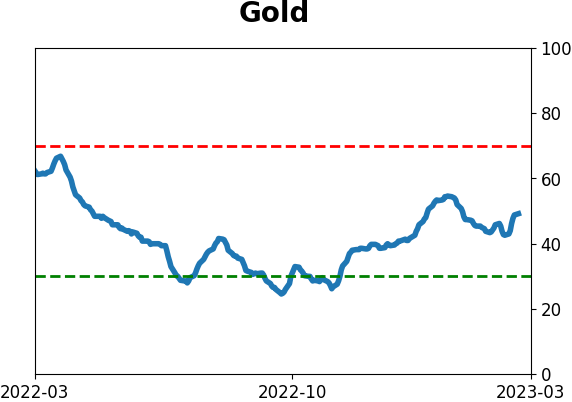
Gold
|
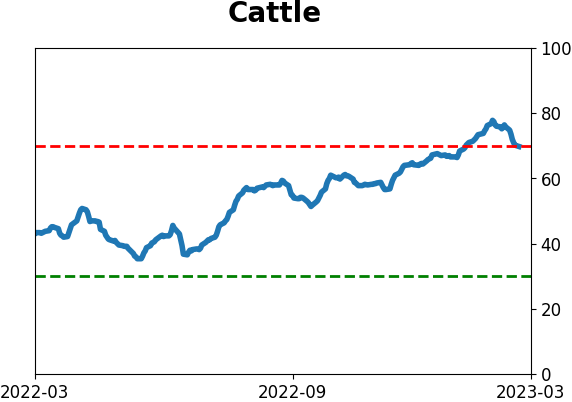
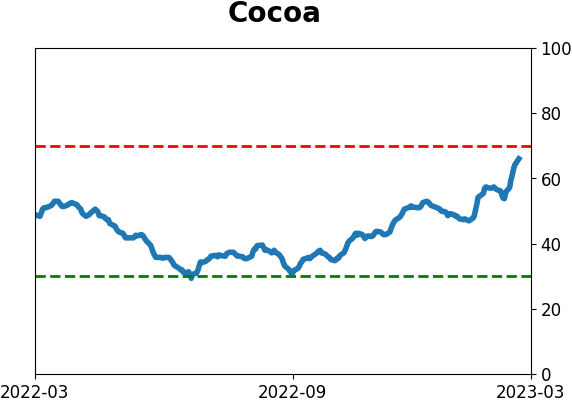
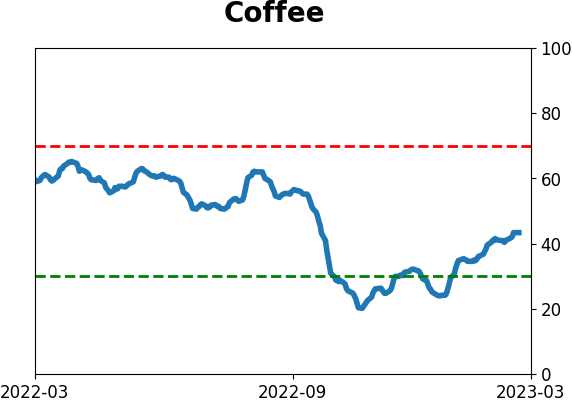
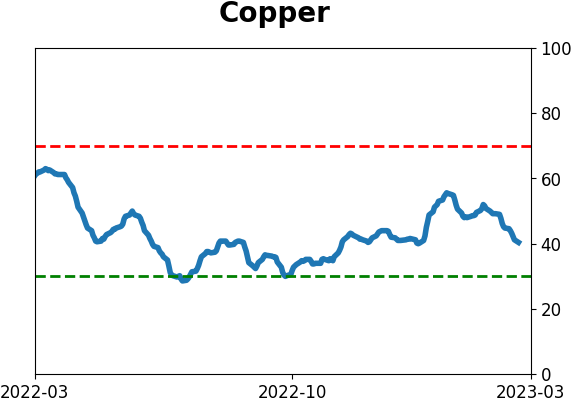
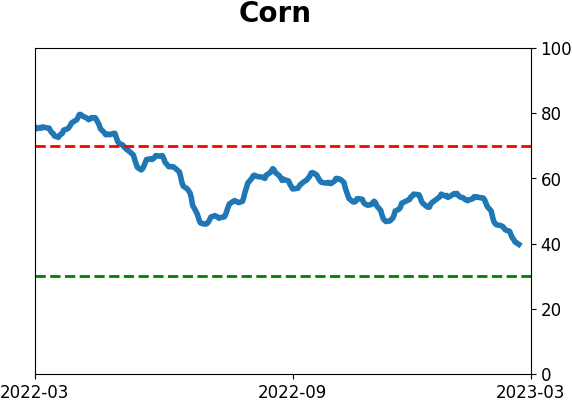
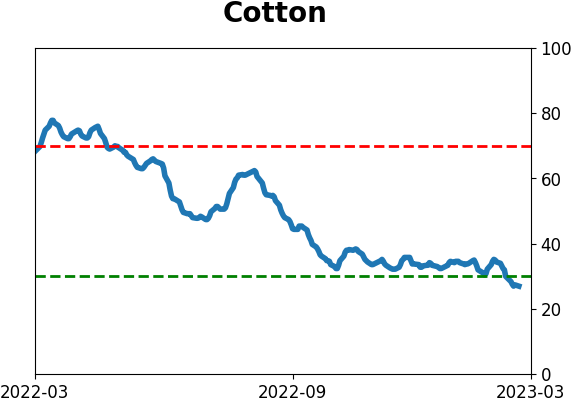
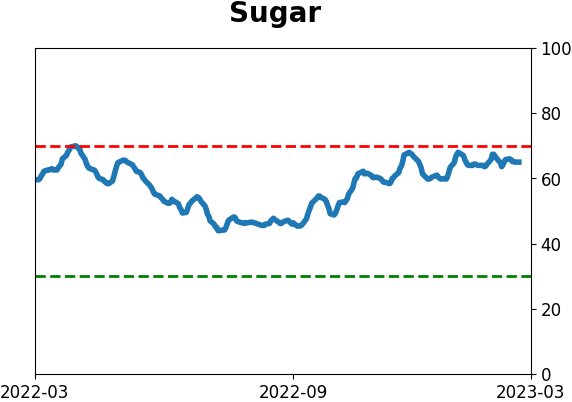
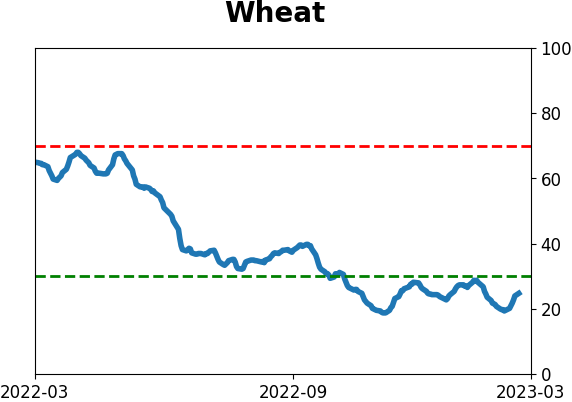
Agriculture
|
|
Research
By Jason Goepfert
BOTTOM LINE
In fewer than 30 sessions, investors have cycled from a feeling of high optimism all the way to deep pessimism. Similarly quick cycles in sentiment preceded positive returns for stocks, but the behavior of investors since the post-October rally is raising questions about a new bull market.
FORECAST / TIMEFRAME
None
|
Key points:
- Investors have quickly cycled from high optimism back to deep pessimism
- The spread between Smart and Dumb Money Confidence has fully cycled in fewer than 30 days
- Similar cycles preceded positive returns, but the "new bull market" theory is being seriously tested
Investors have made a quick flip back to pessimism
In early February, we saw that investor confidence had returned. The Smart Money / Dumb Money Confidence Spread had fully cycled from deep pessimism to high optimism.
After similar cycles, the S&P 500 had a good track record of continuing to rally over the medium- to long-term. The few failures turned tail almost immediately, and that's a concern because that's precisely what happened this time, too.
Investors have responded quickly, with the spread already moving to the opposite extreme, propelled by raging fears of a banking crisis and implications for further credit tightening. When the spread has been this wide, the S&P 500's annualized return is an impressive +17.0%, though that masks some extreme interim losses.
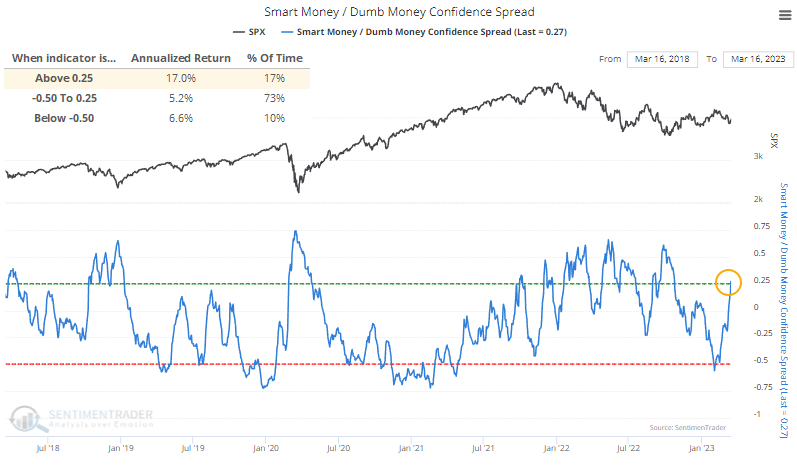
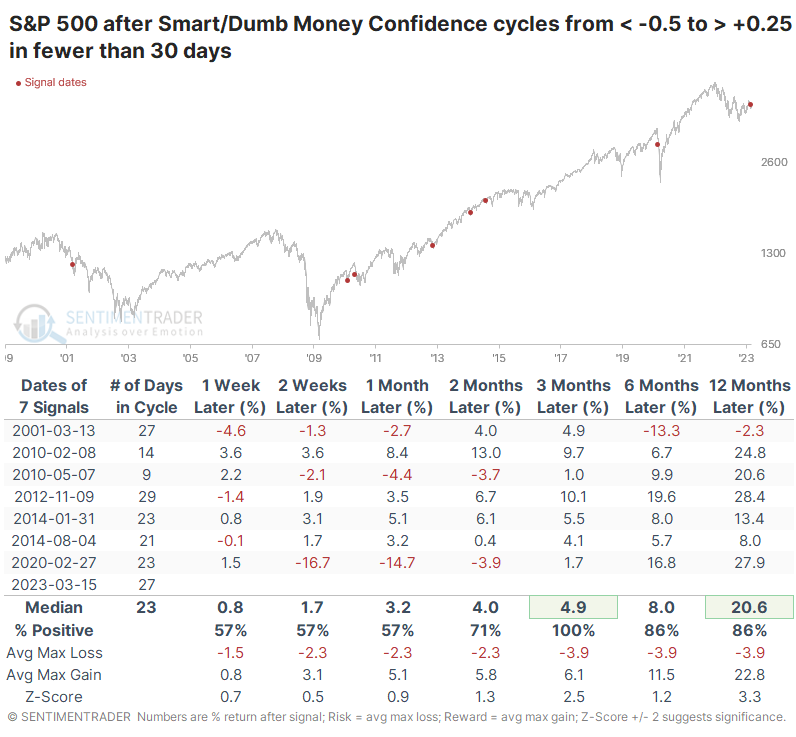
After other times when the spread cycled from high optimism territory beyond -0.5 to pessimistic territory above +0.25, short-term returns were inconsistent. Over the next three months, however, the S&P rallied after 14 of 17 signals. There were some notable losses in 2002, 2008, and 2011, and the signal from 2020 triggered in the midst of the pandemic meltdown before rebounding strongly.

What makes this signal a bit unique is just how fast it unfolded. Sentiment cycled from one extreme to the other in fewer than 30 sessions, one of the fastest turnarounds since we began computing this model in 1999. The handful of other times when sentiment cycled so quickly, the S&P rallied each time over the next few months, though it ultimately failed in 2001, and it required sitting through a painful drawdown during the pandemic.
What the research tells us...
From October through early February, the stock market did everything right. Study after study showed that the type of recovery witnessed by the market was different than any since the bear market began and, in fact, was different from any bear market rally ever. The magnitude, breadth, and persistence of the advance exceeded any failed bear market rally since at least 1950.
The reaction since then has been terrible and marks one of the worst post-rally reactions ever. That raises the possibility that this is one of those times when "never seen before" gets seen for the first time. Meaning, an exceptionally impressive rally that doesn't mark the beginning of a new bull market but the continuation of the existing bear. The way investors have behaved during this downturn, with a rapid switch back to deep pessimism from extreme optimism, further suggests that this is not just a bear market rally and the start of the next leg lower. But the confidence level in that assertion has to be lower given the deeper-than-usual pullback over the past month.
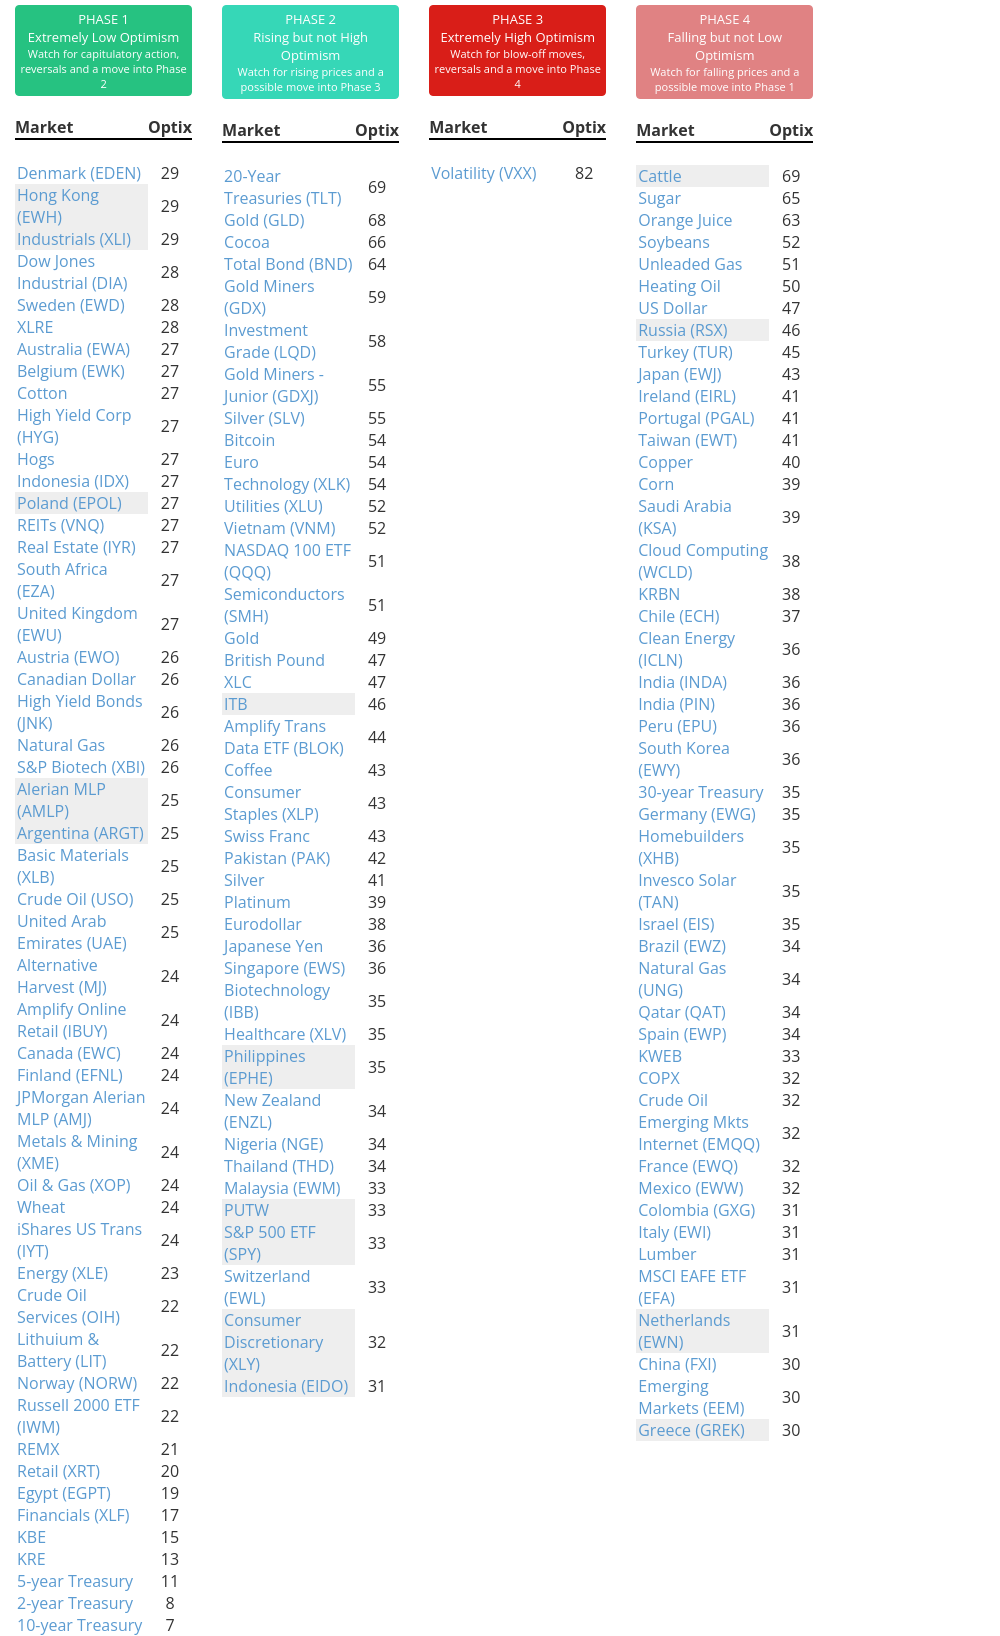
Indicators at Extremes
Phase Table
Ranks
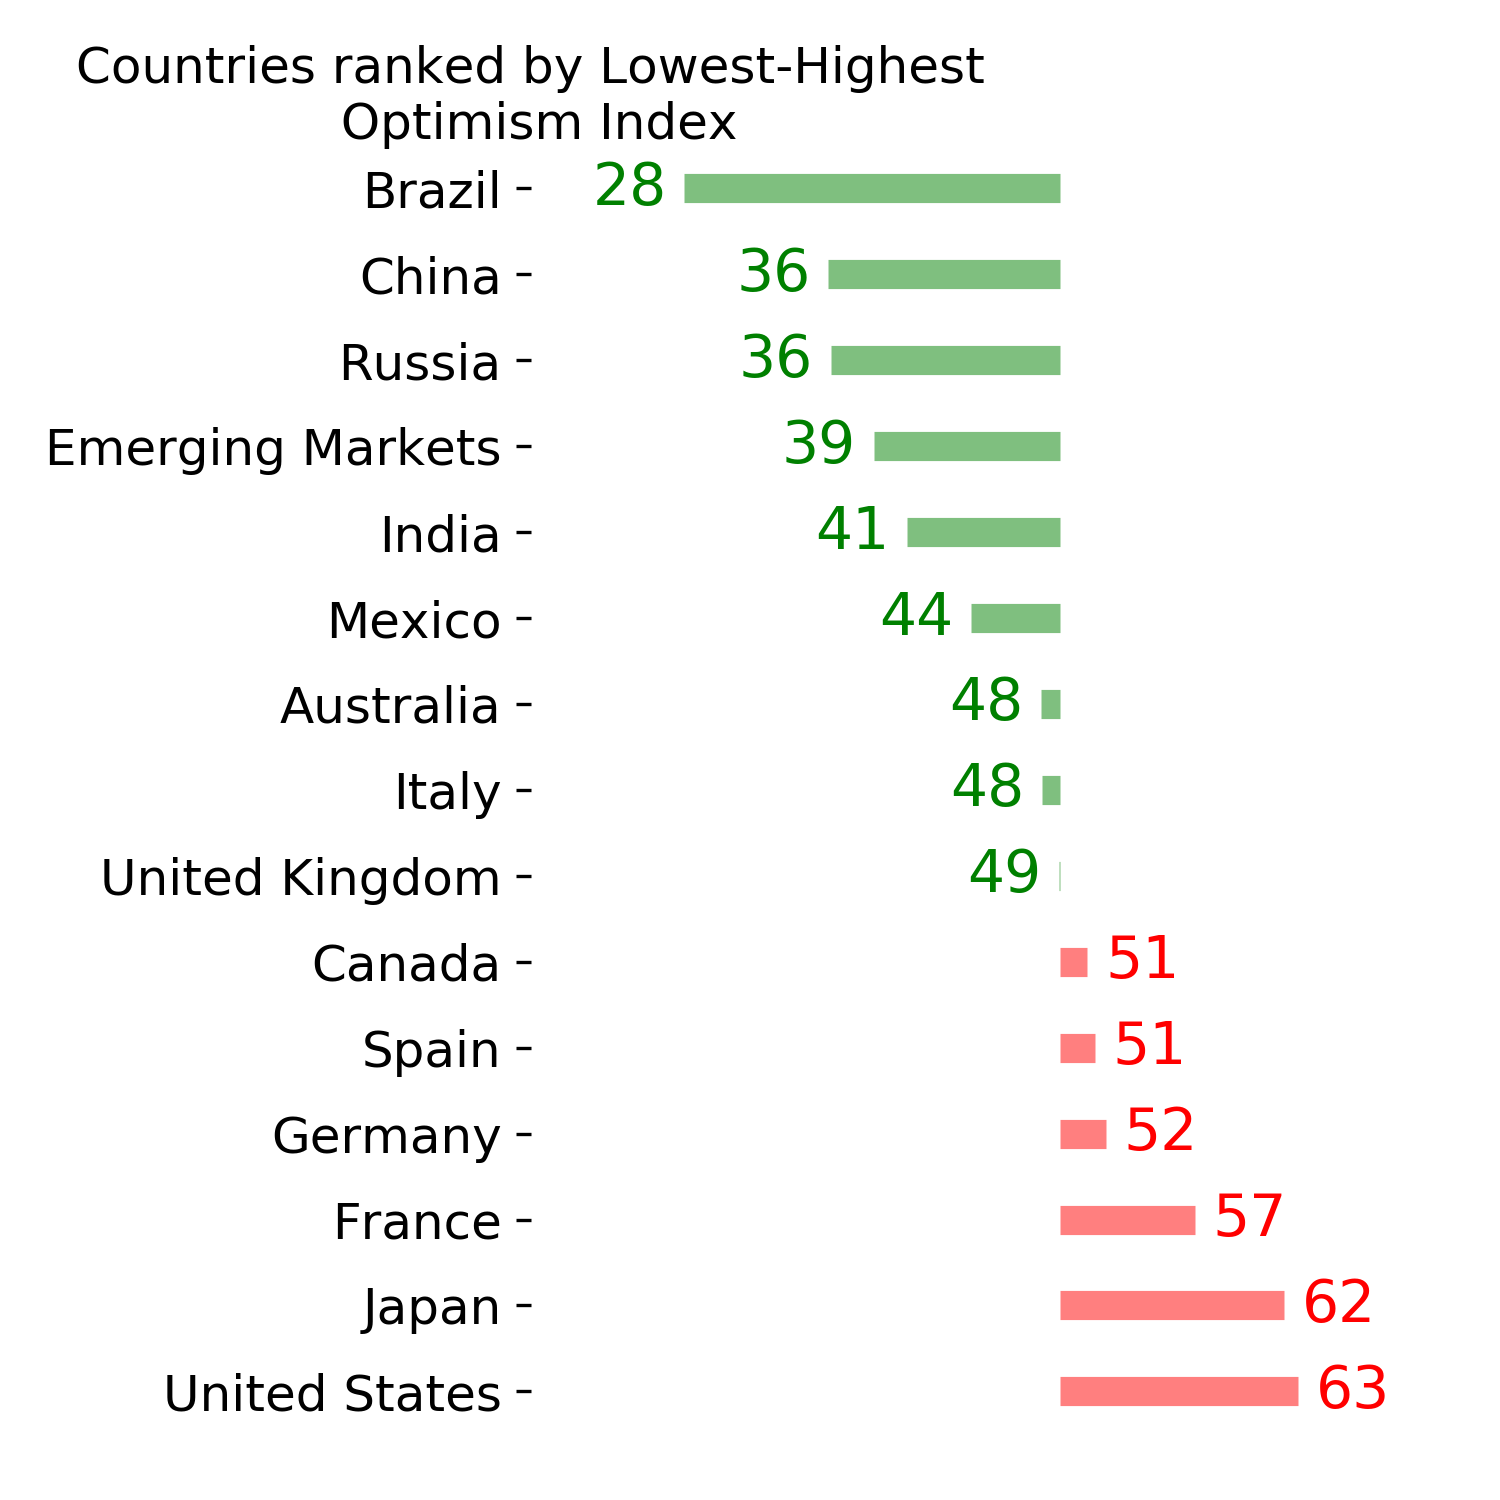
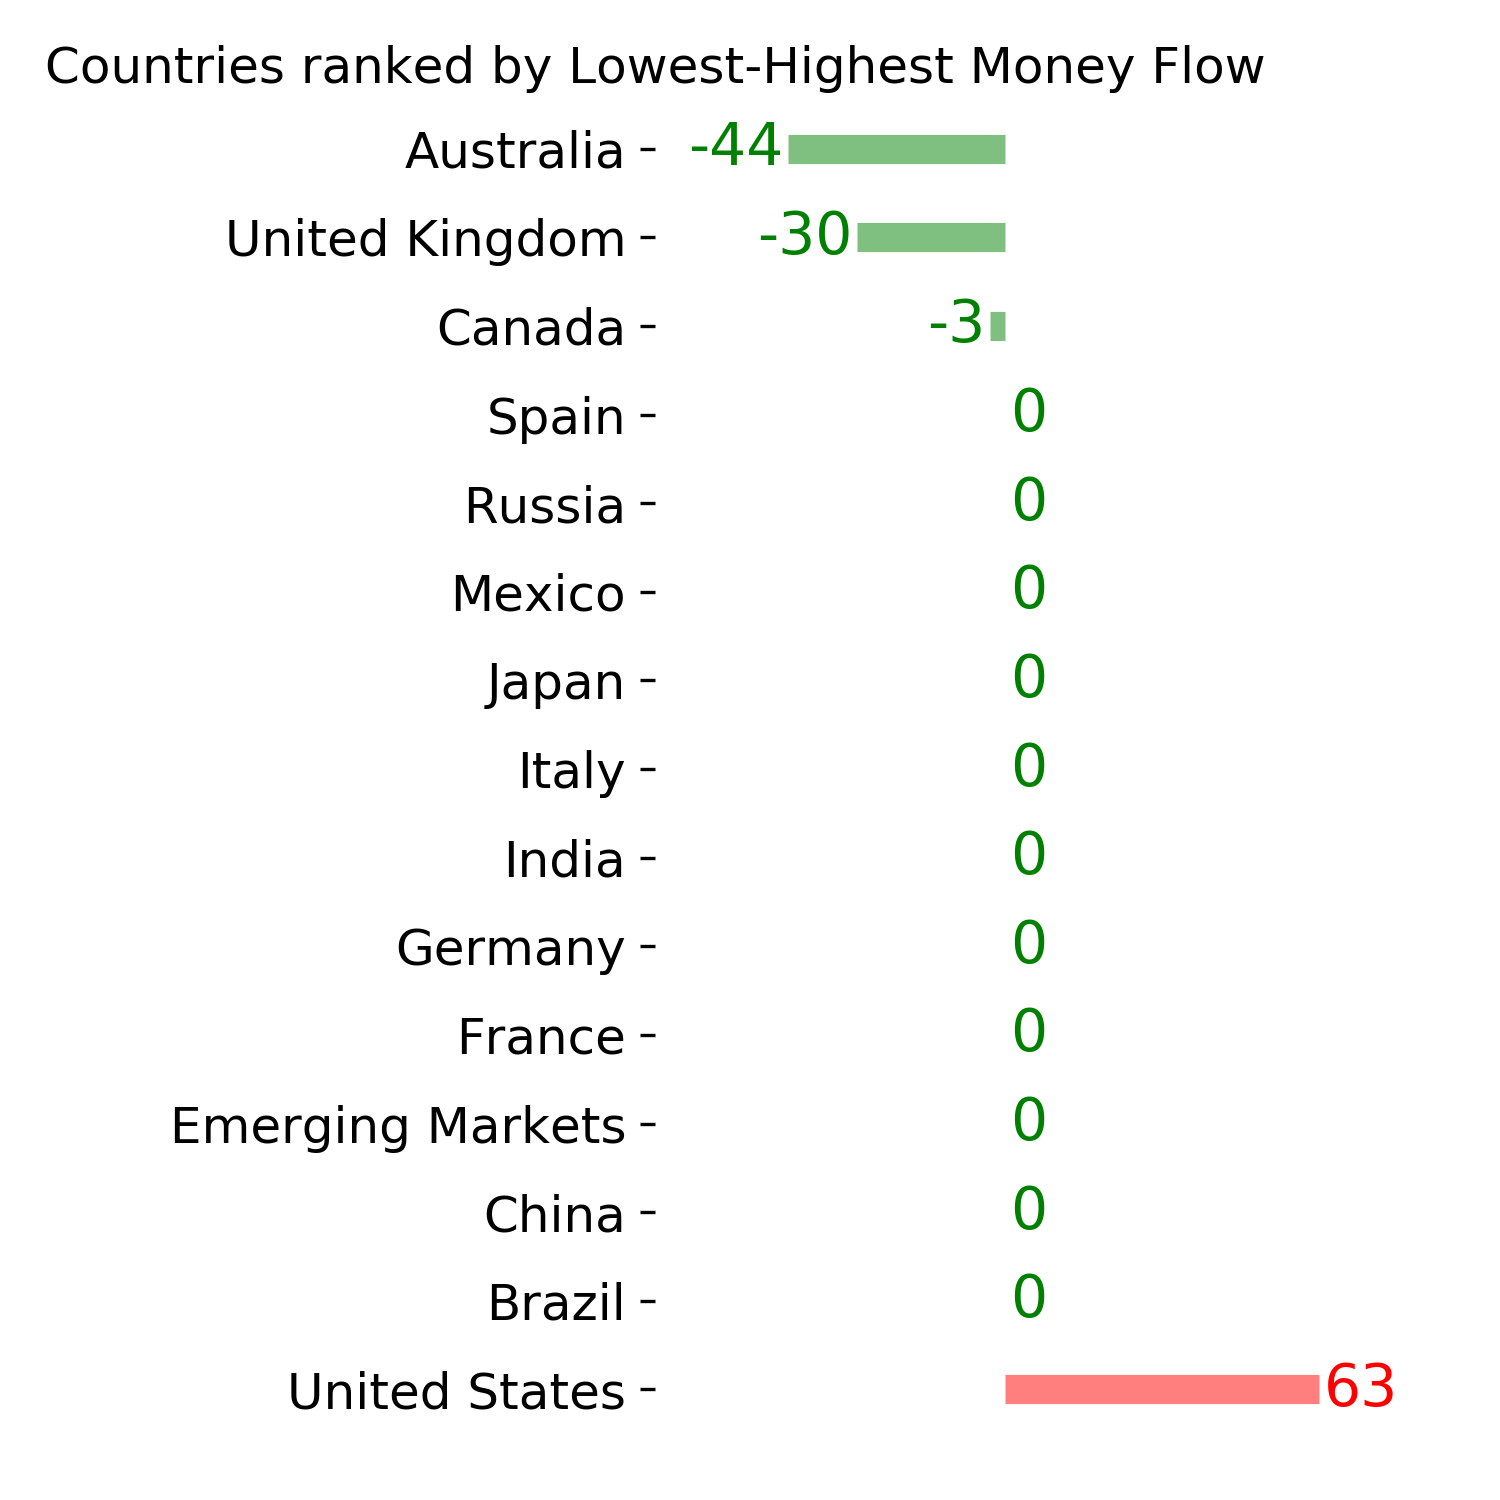
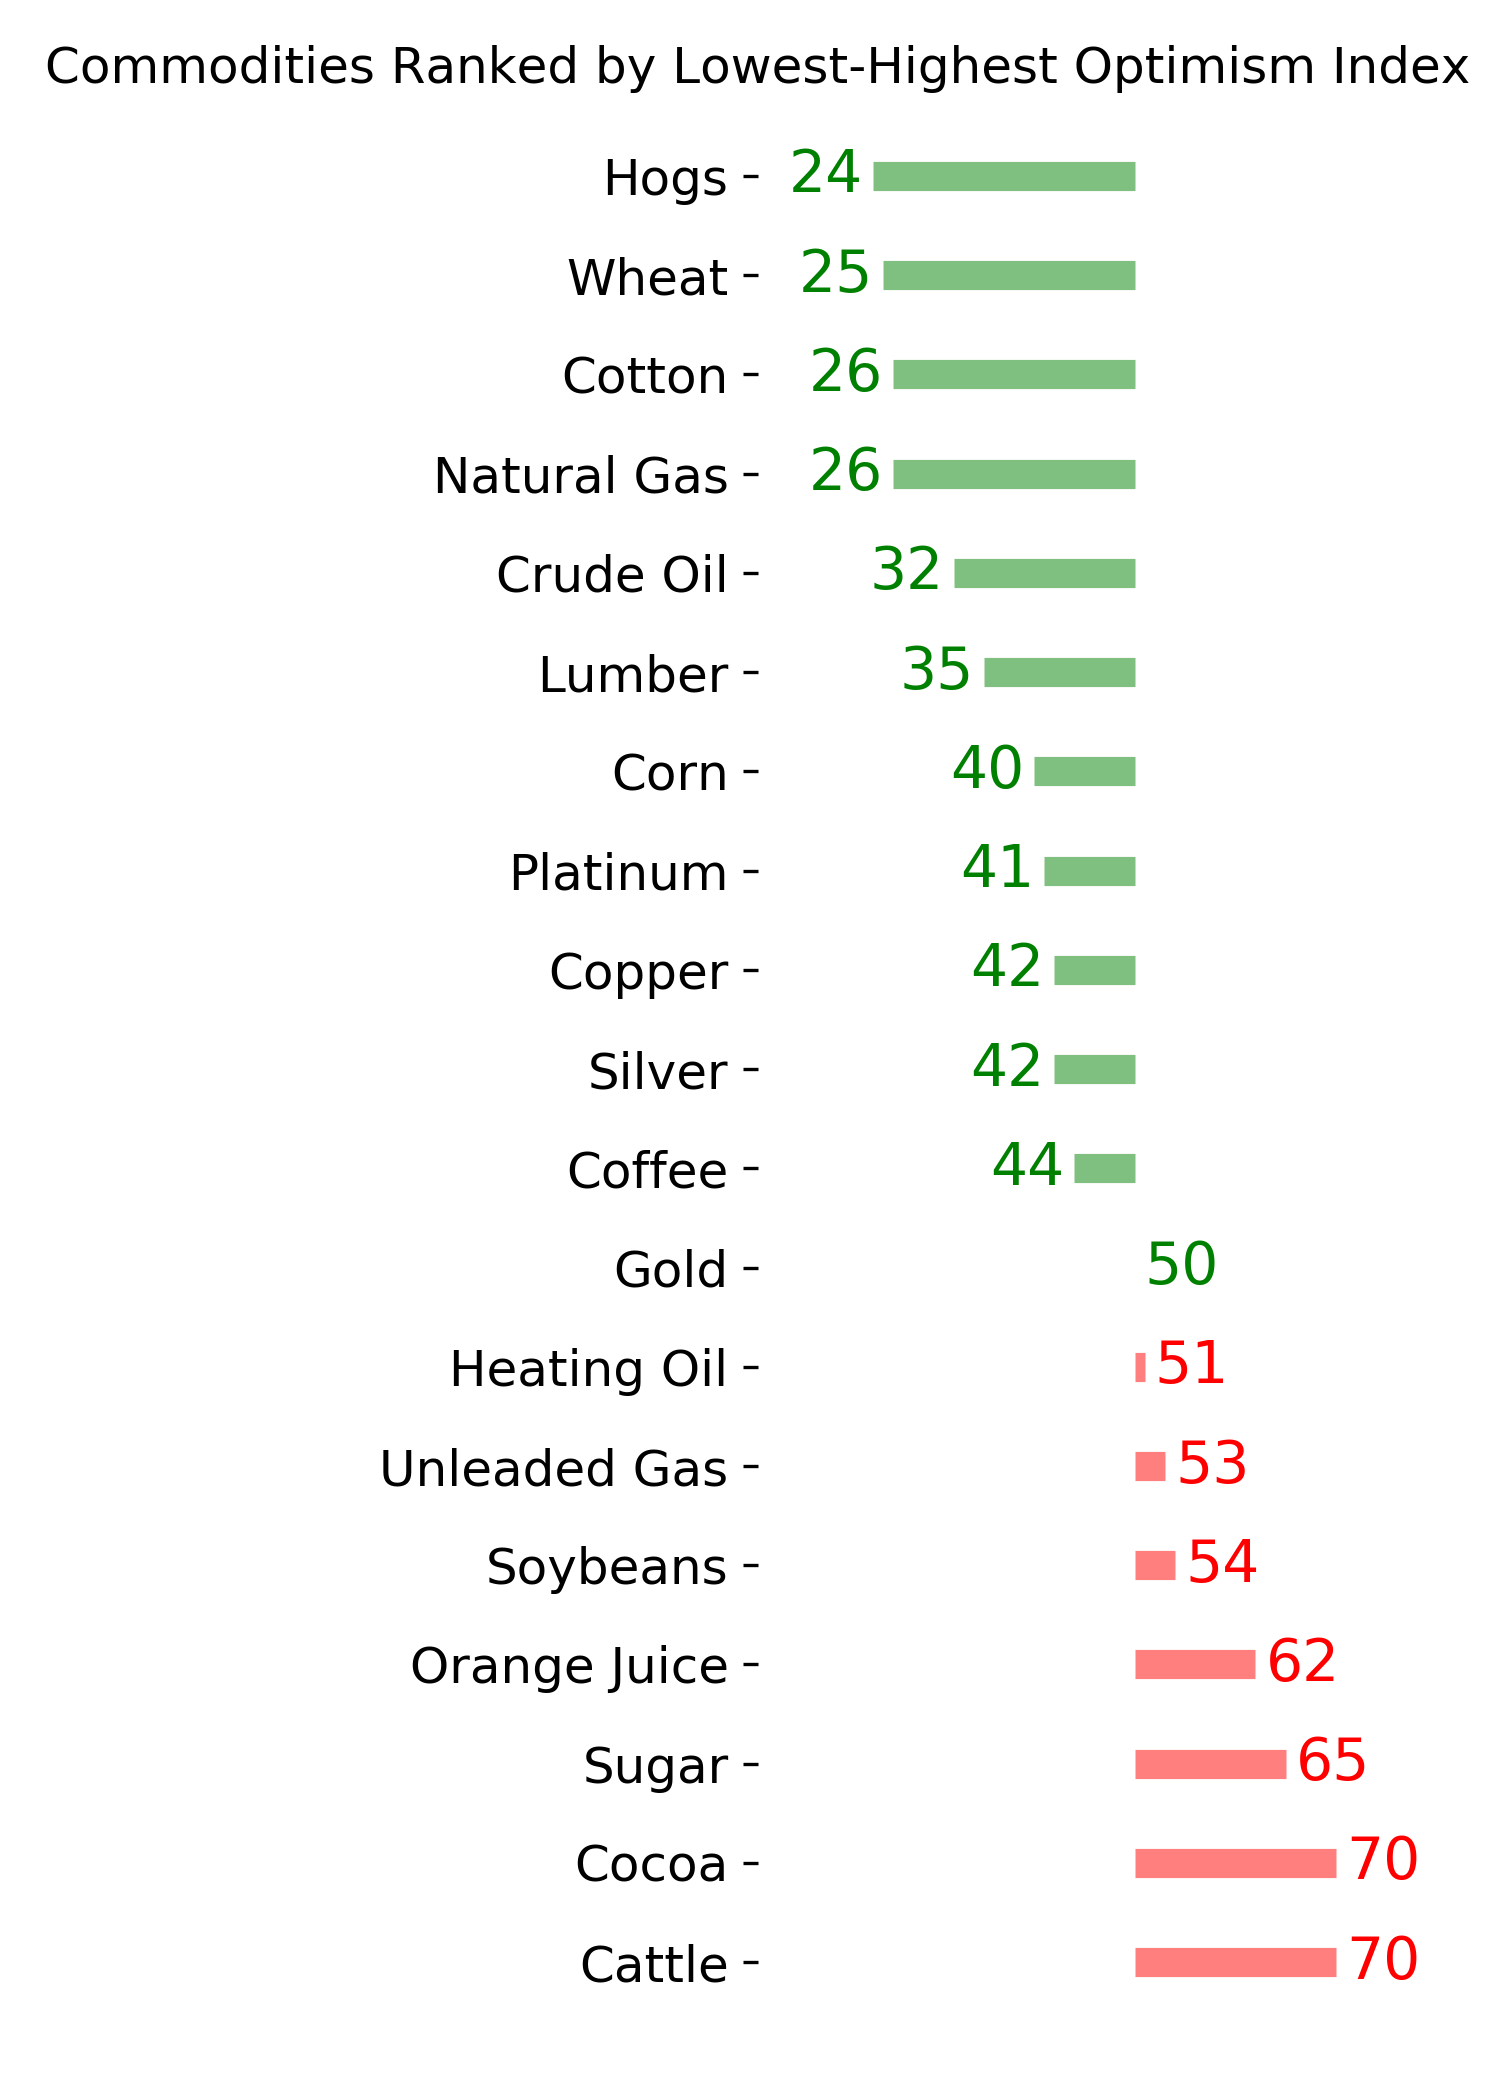
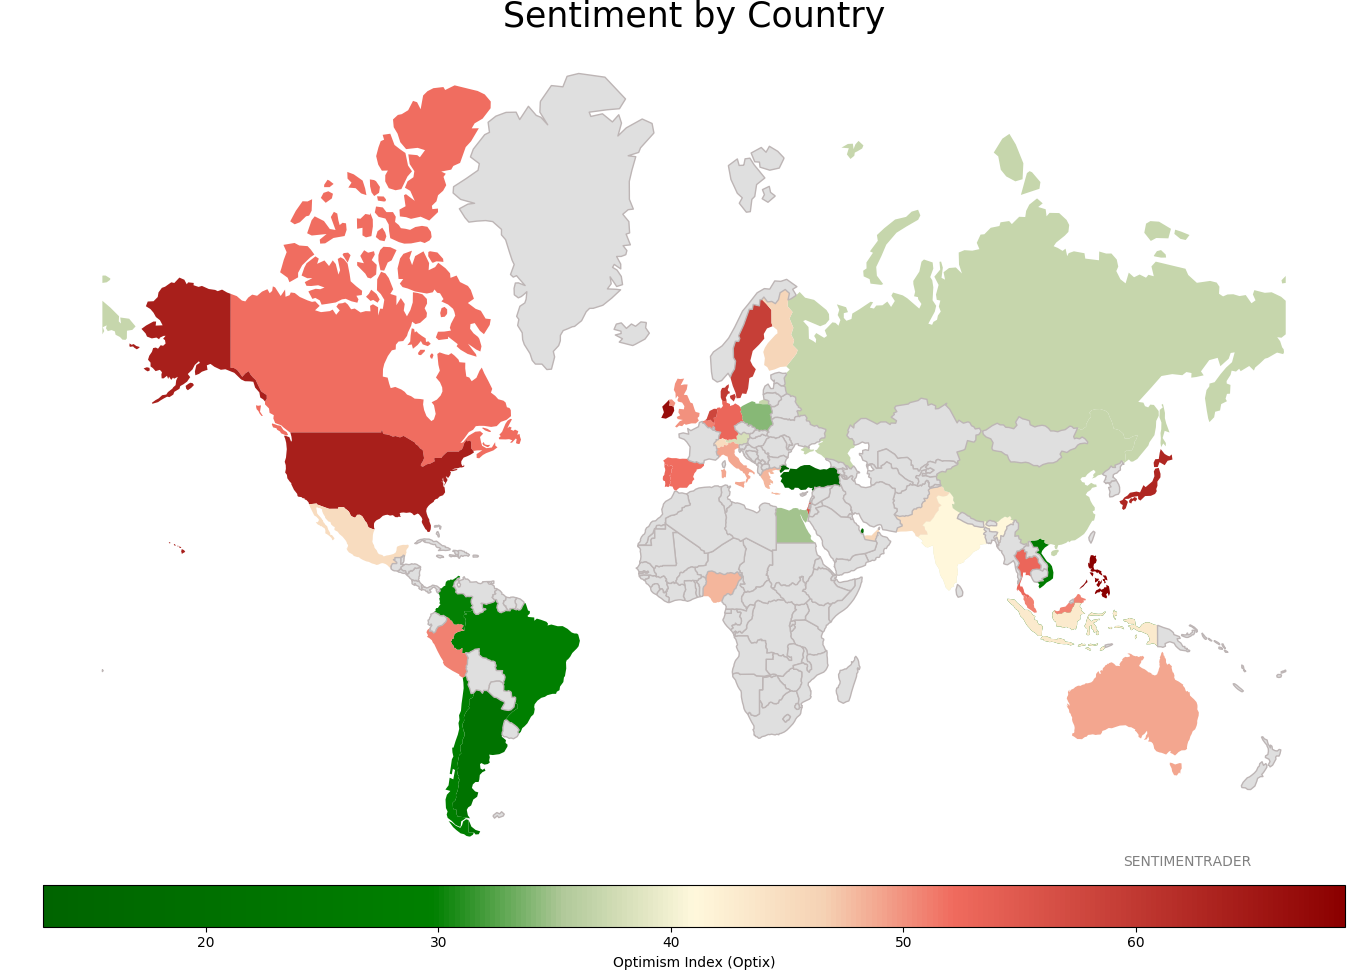
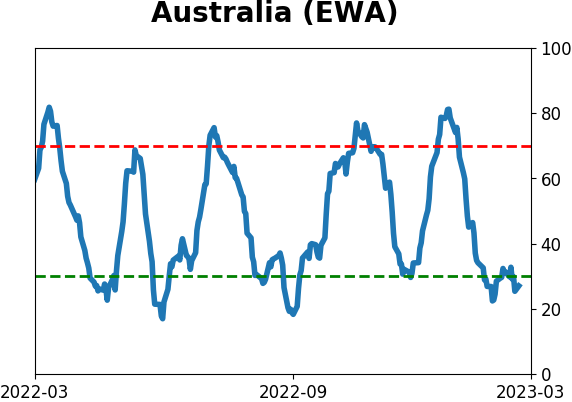
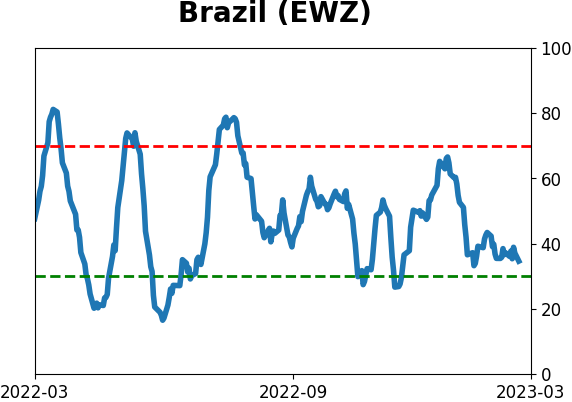
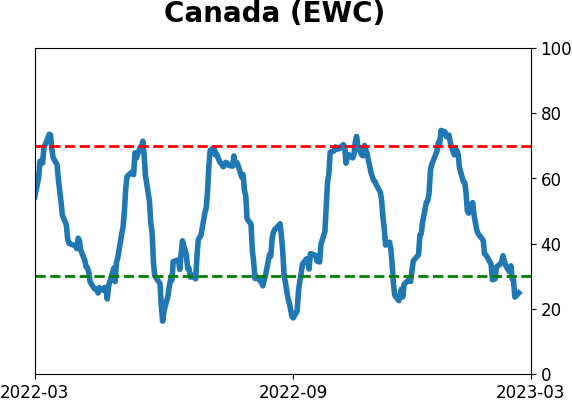
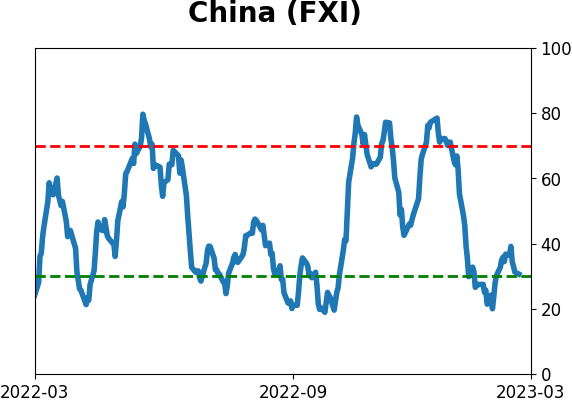
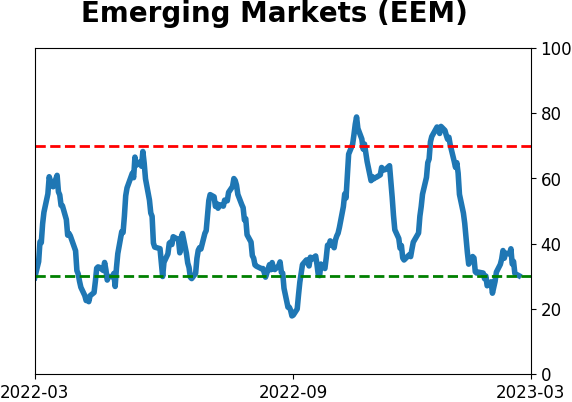
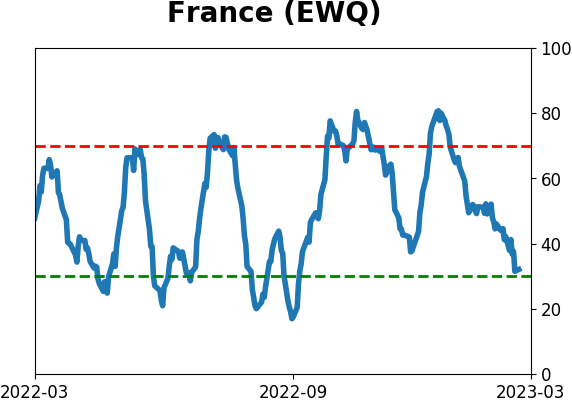
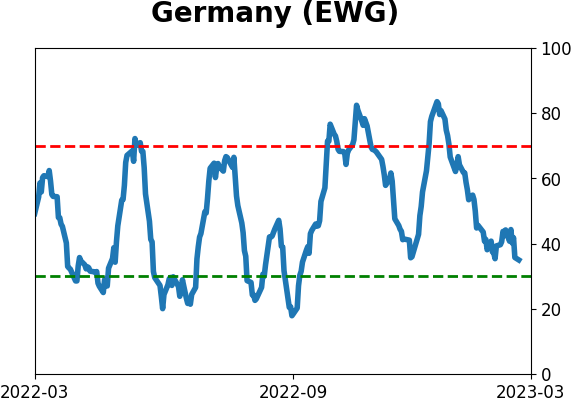
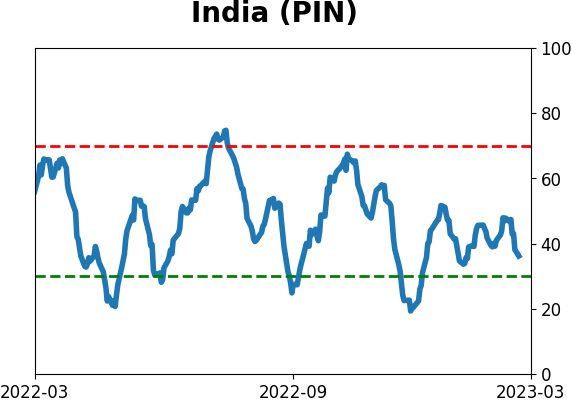
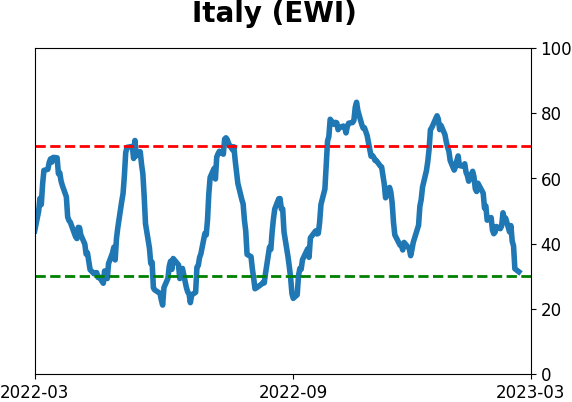
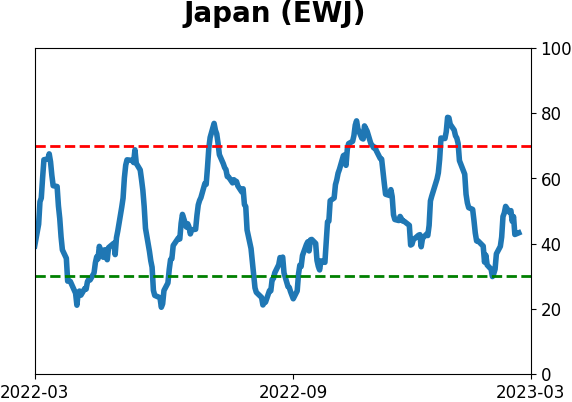
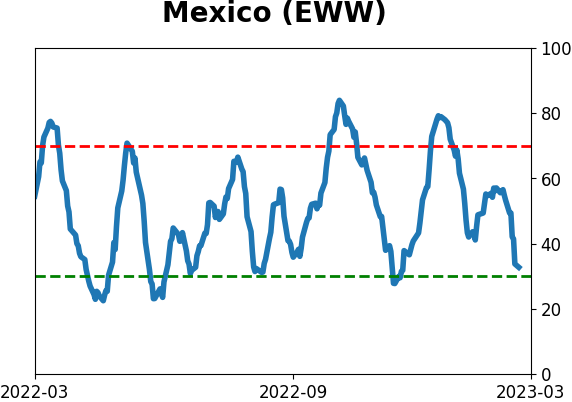
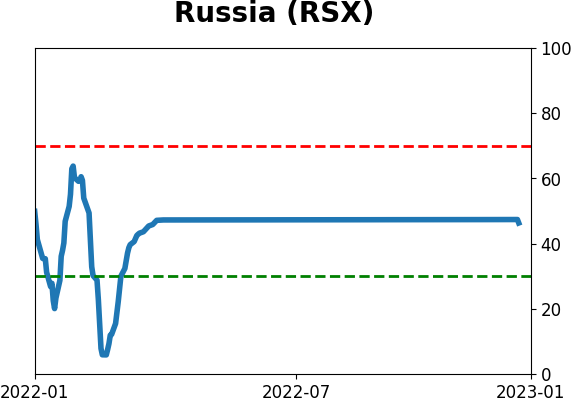
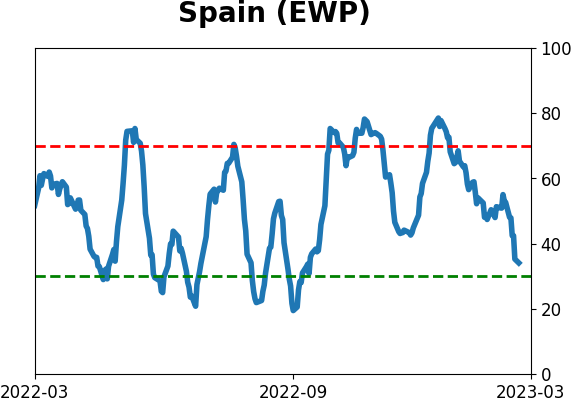
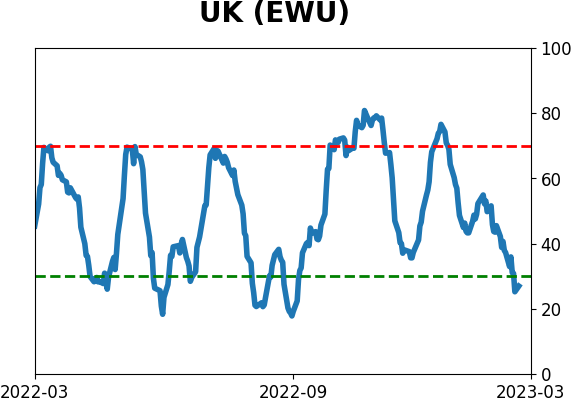
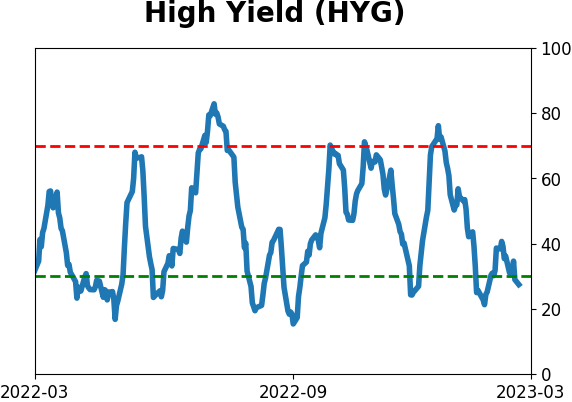
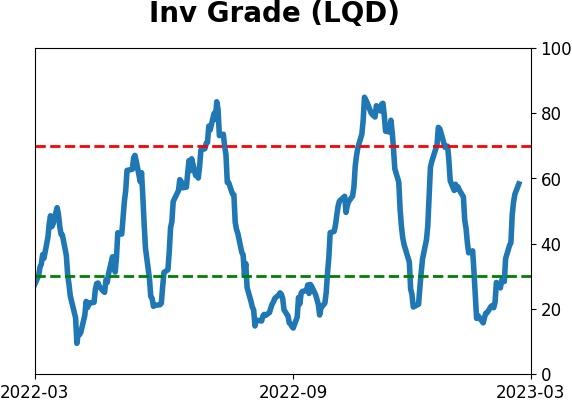
Sentiment Around The World
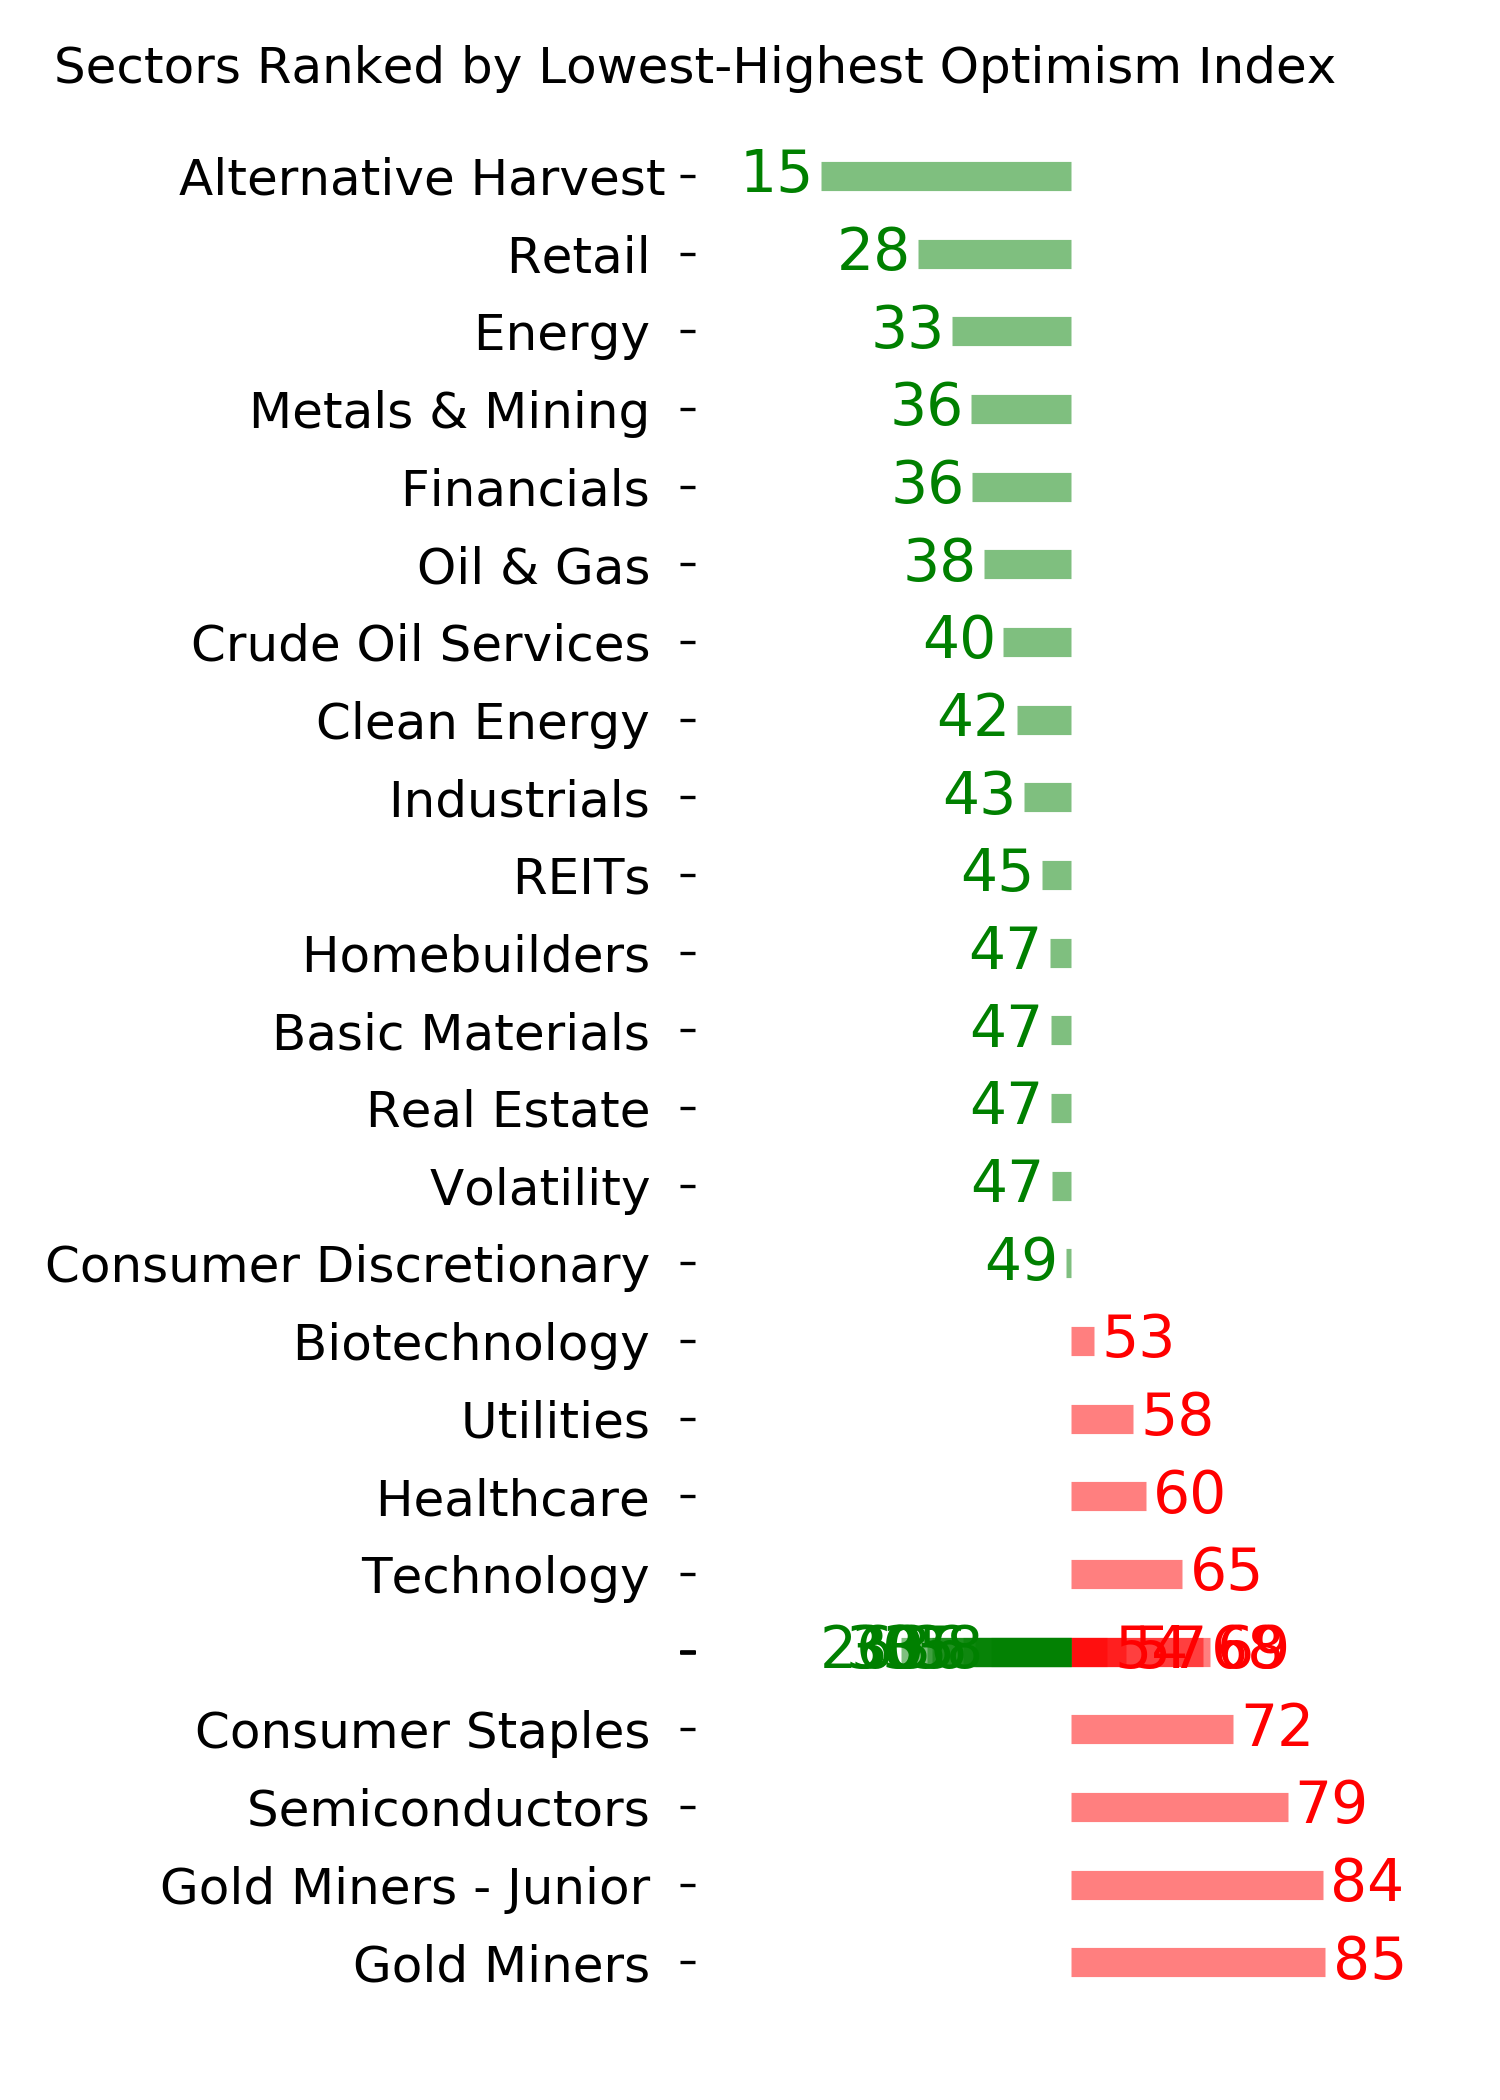
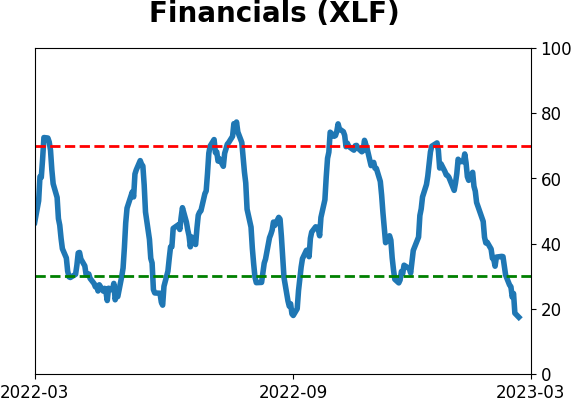
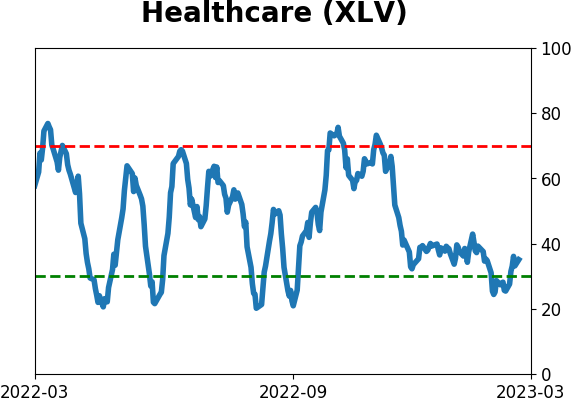
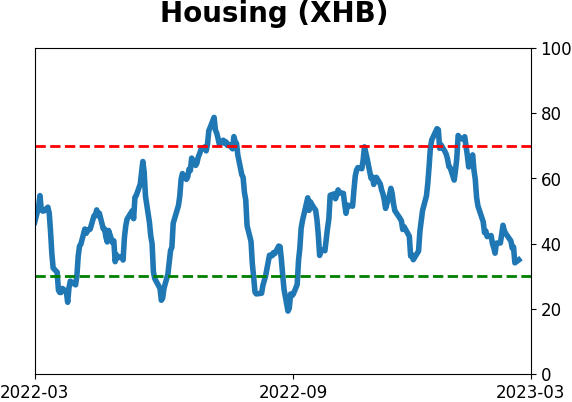
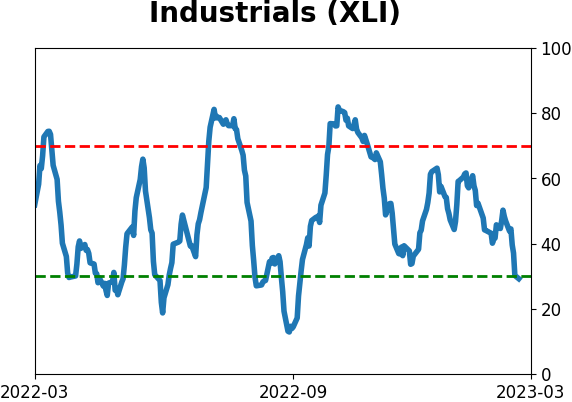
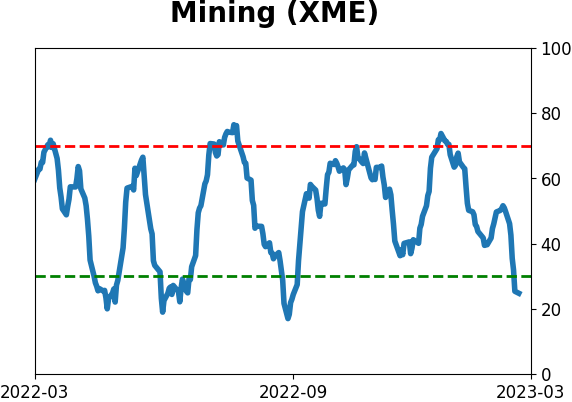
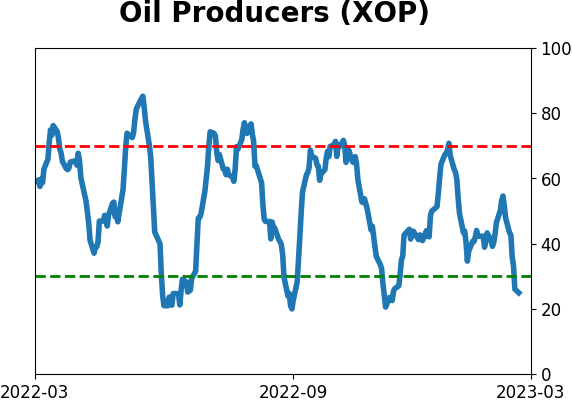
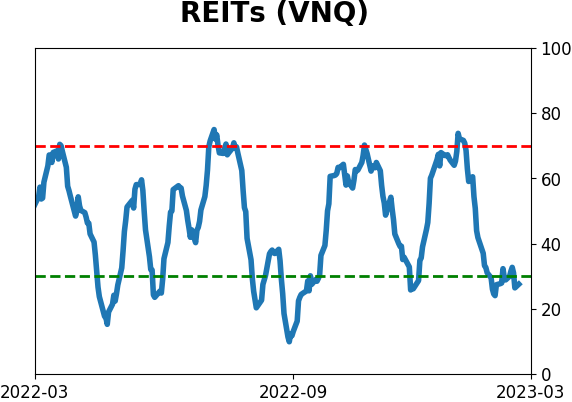
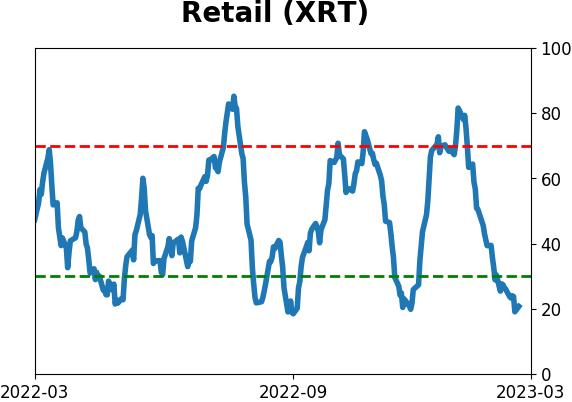
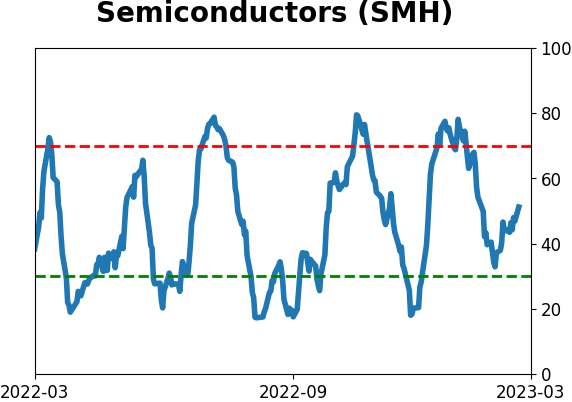
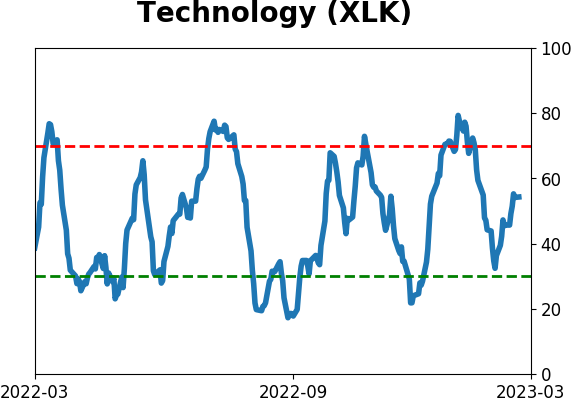
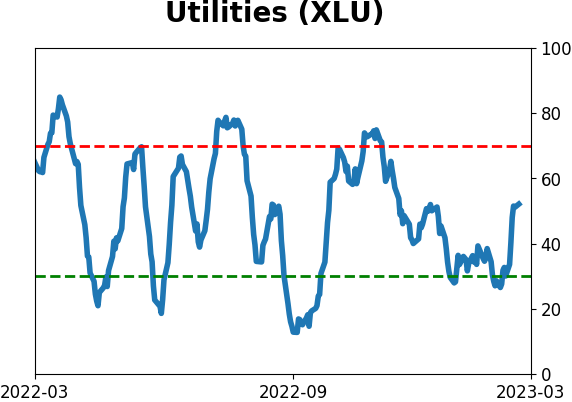
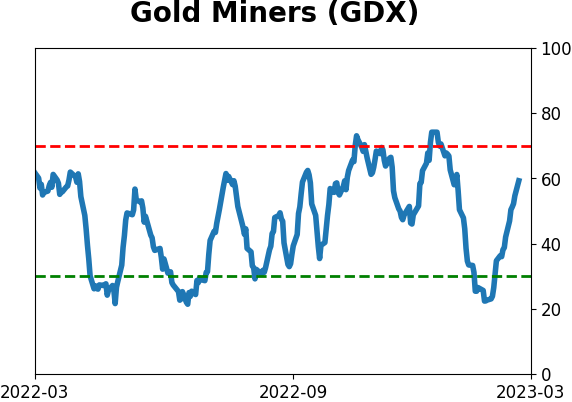
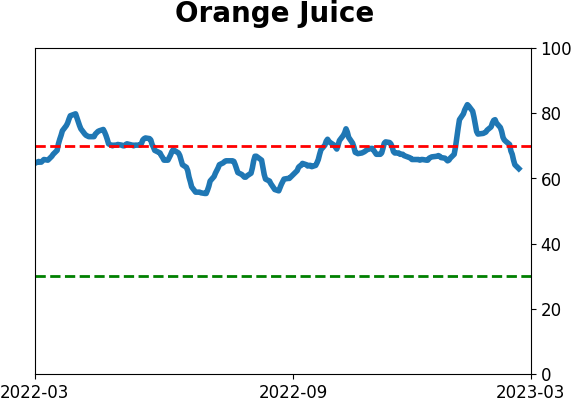
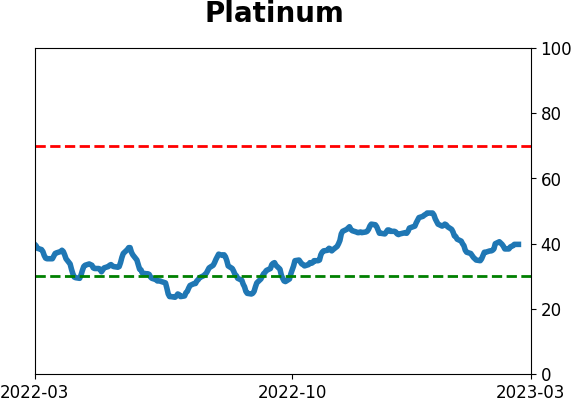
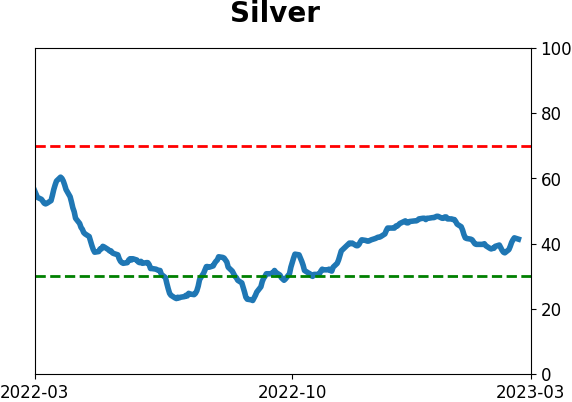
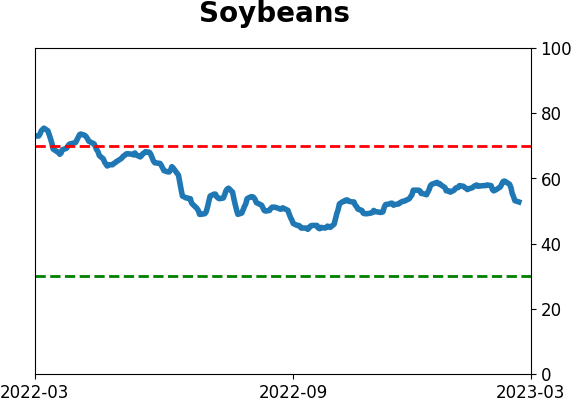
Optimism Index Thumbnails
|
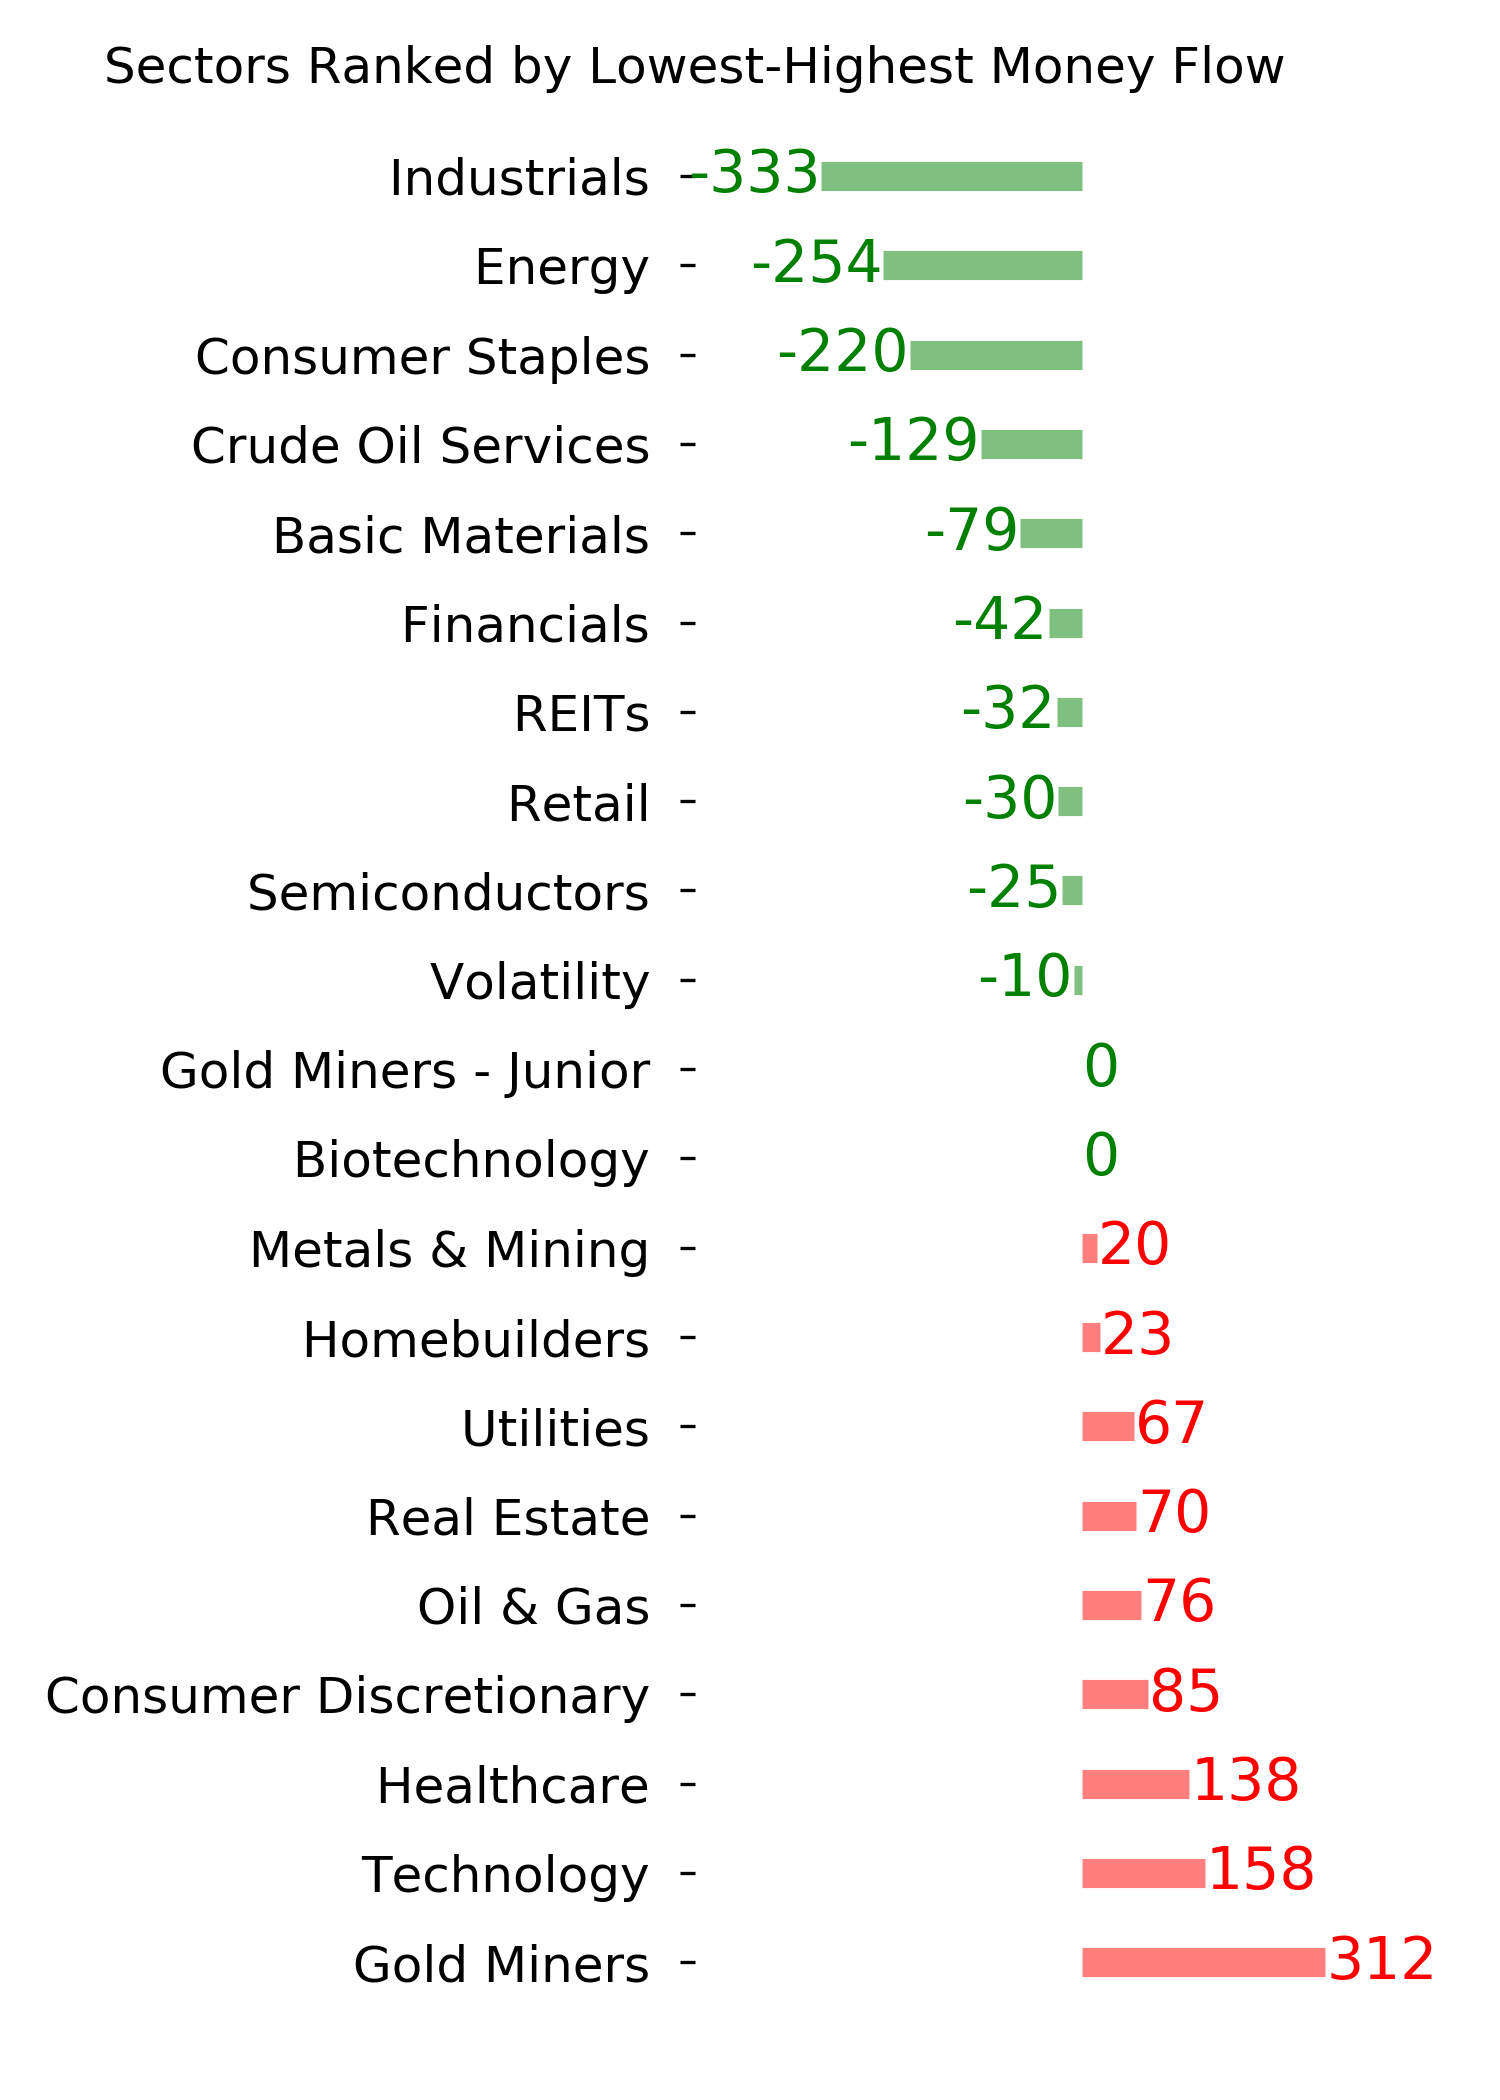
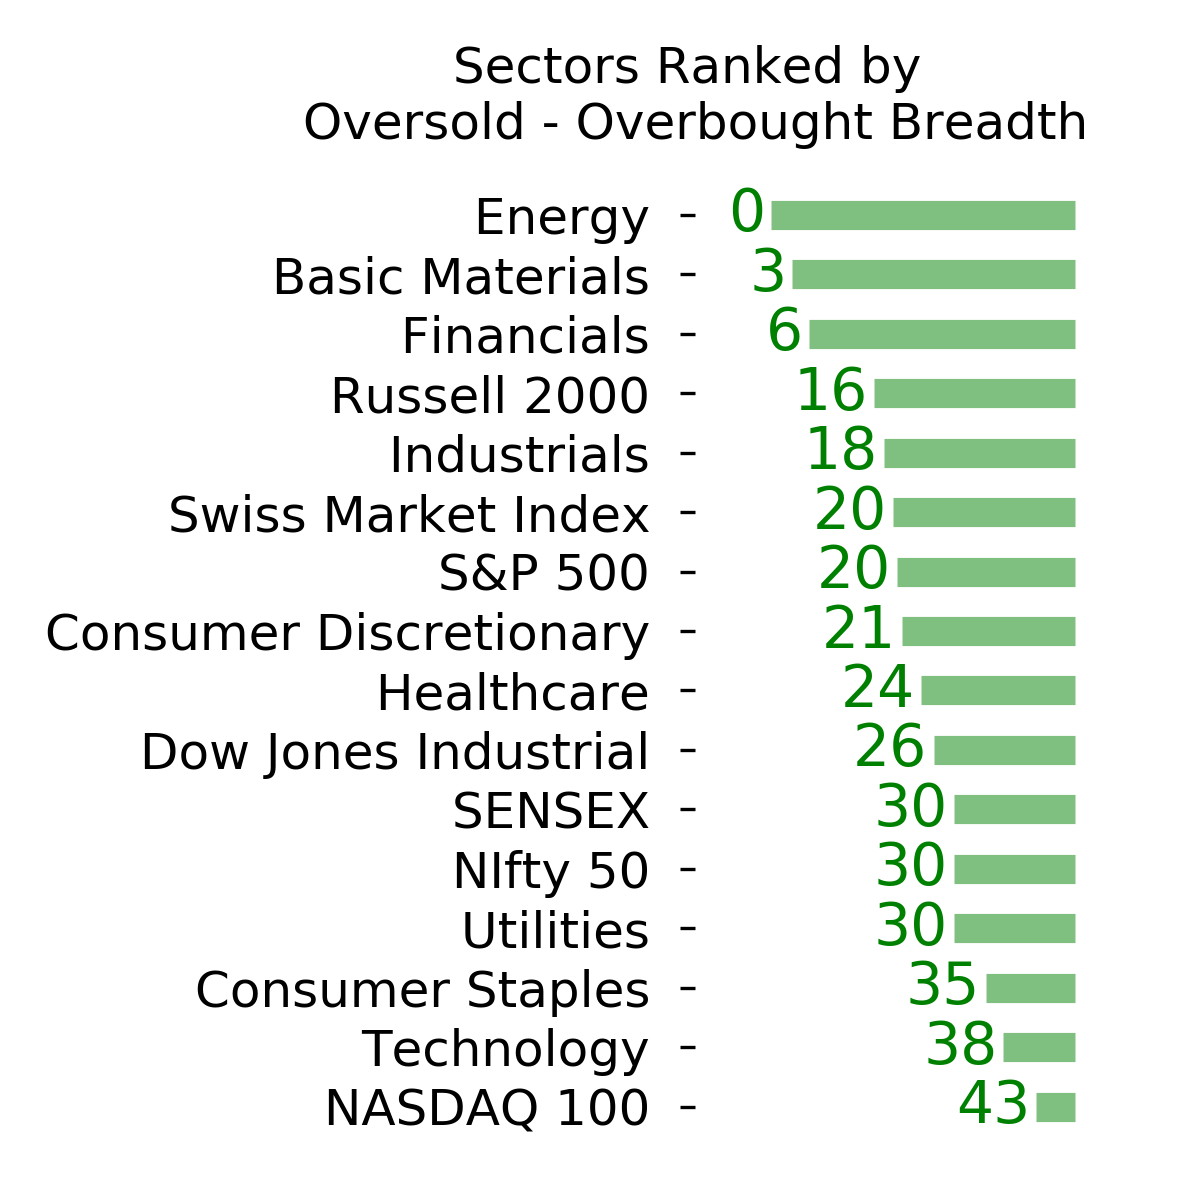
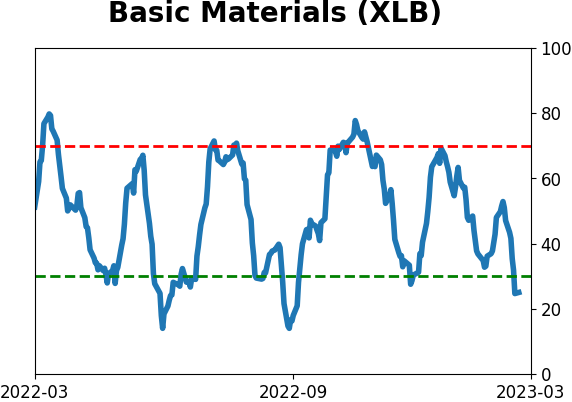
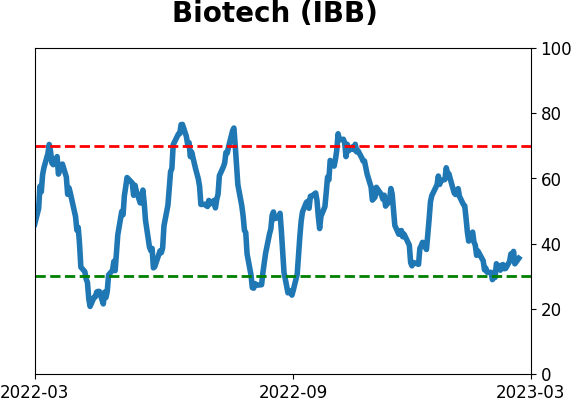
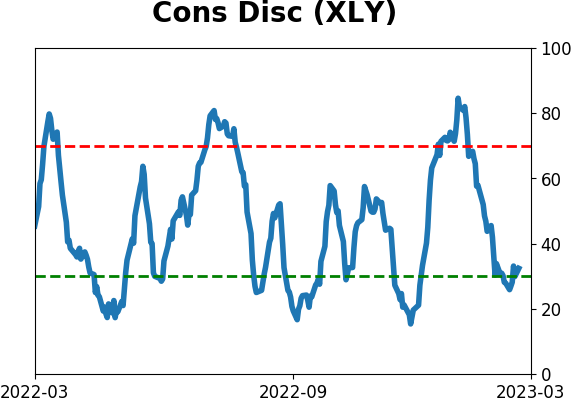
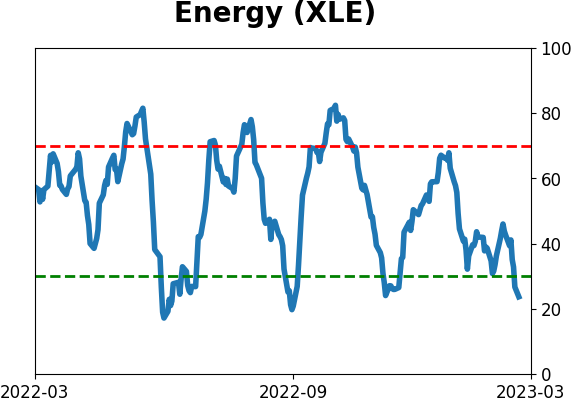
Sector ETF's - 10-Day Moving Average
|
|
|
Country ETF's - 10-Day Moving Average
|
|
|
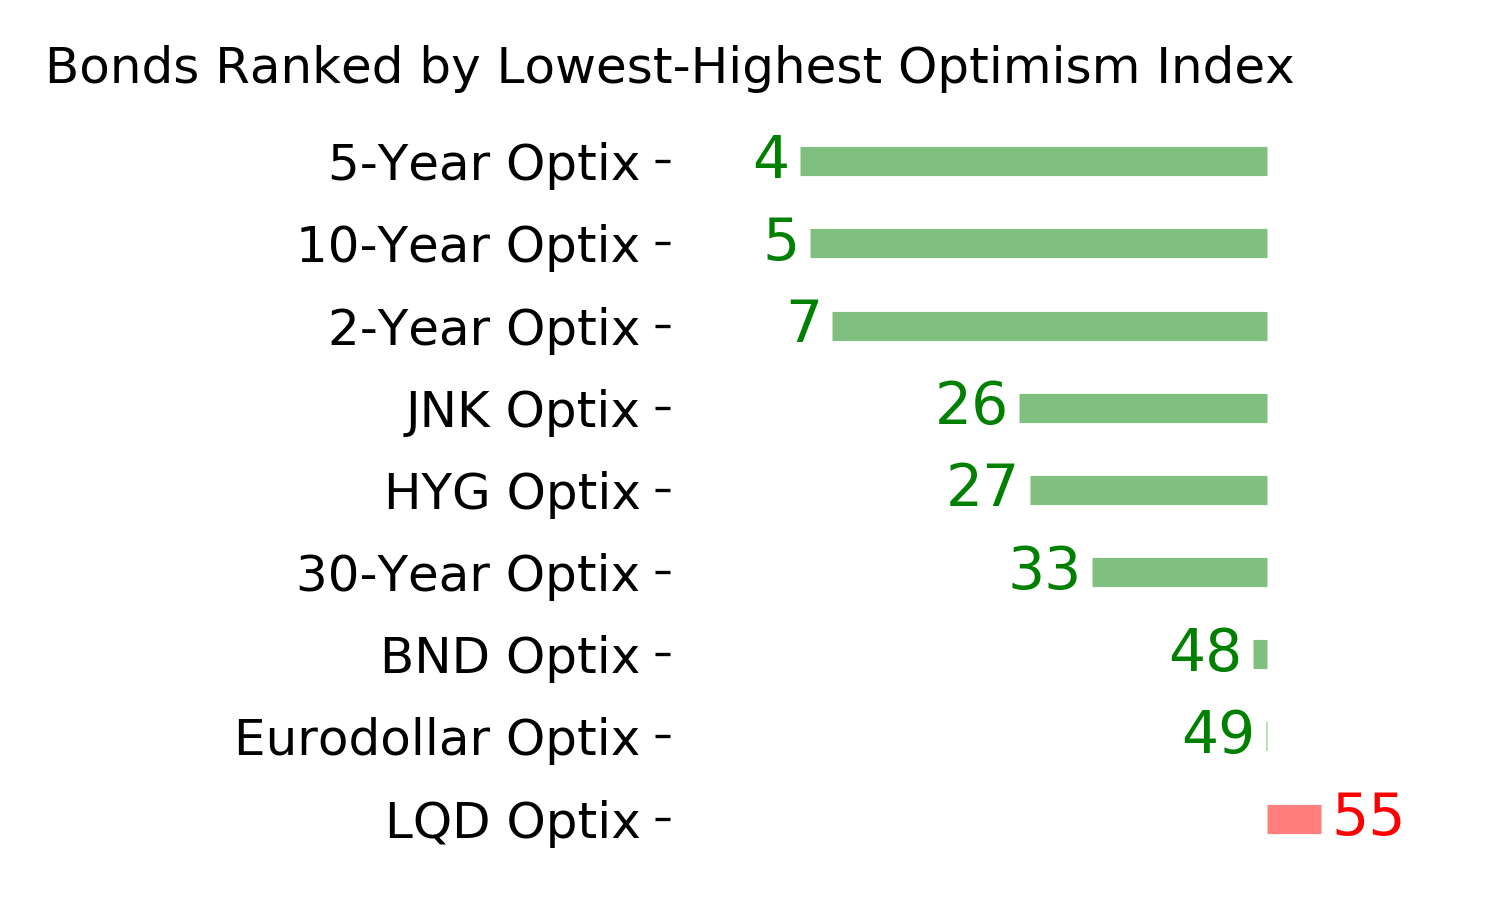
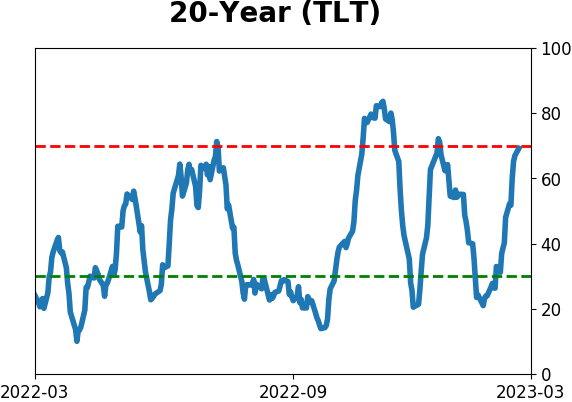
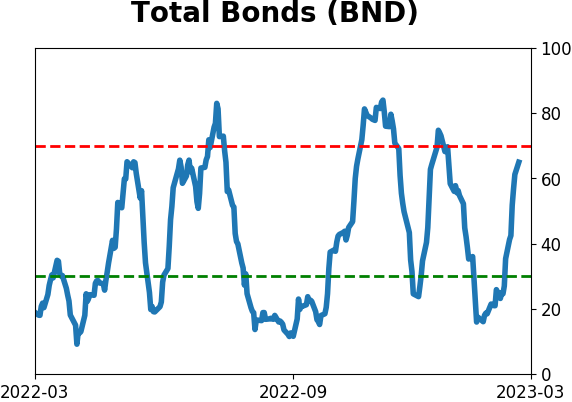
Bond ETF's - 10-Day Moving Average
|
|
|
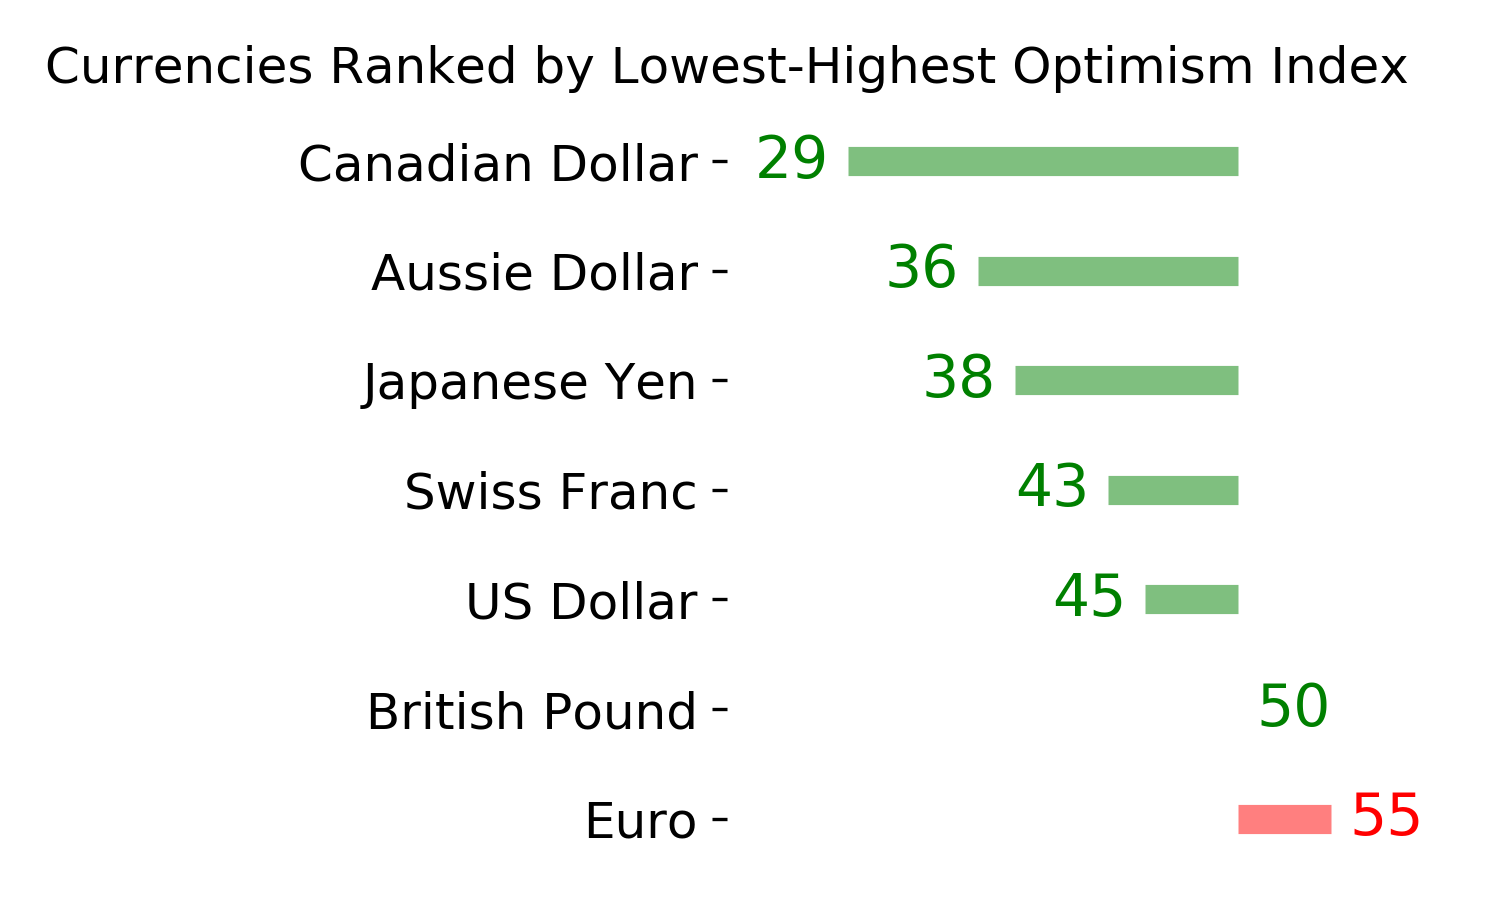
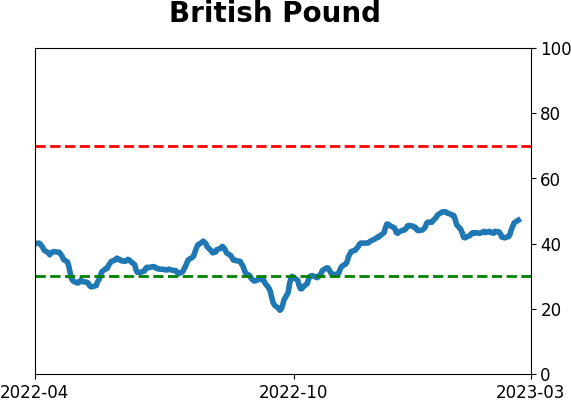
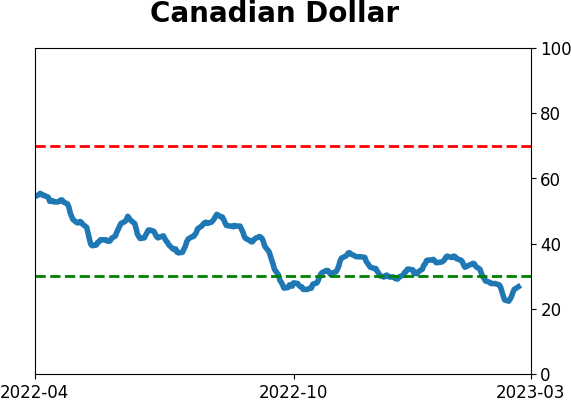
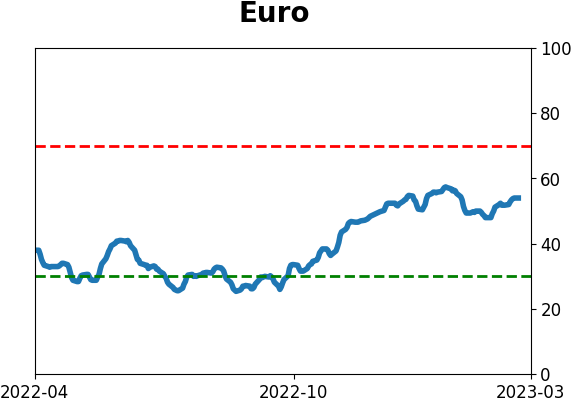
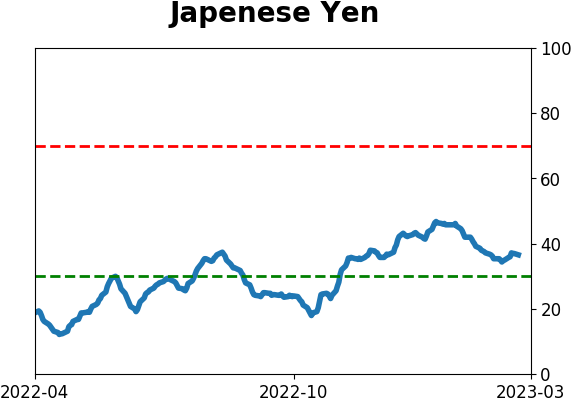
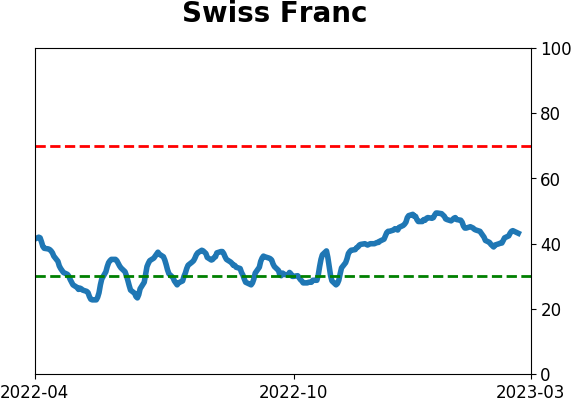
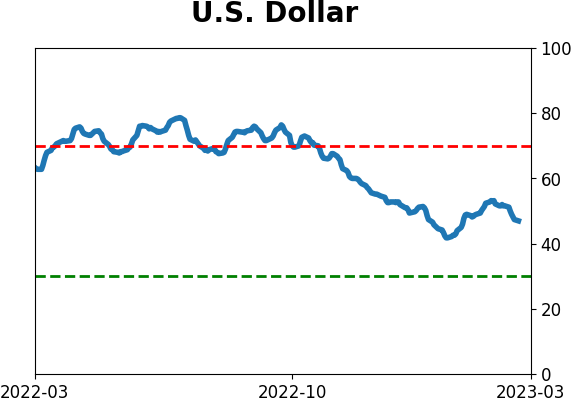
Currency ETF's - 5-Day Moving Average
|
|
|
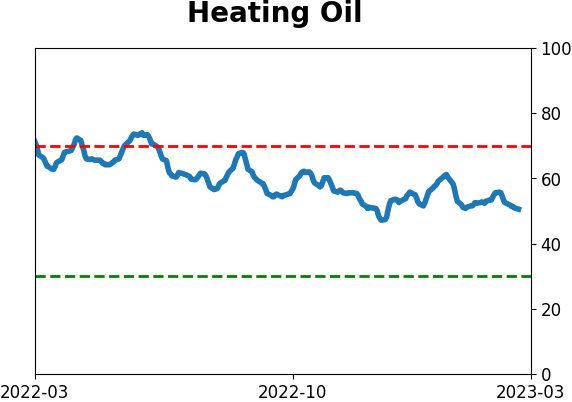
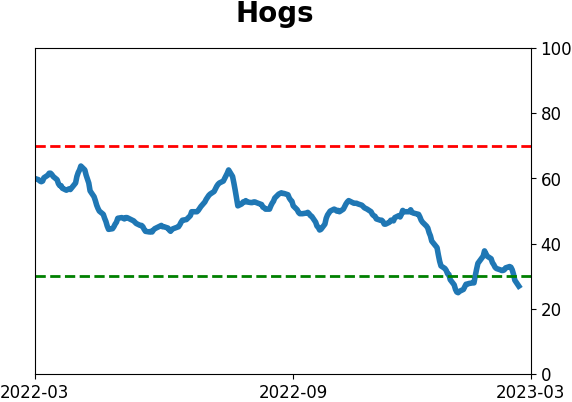
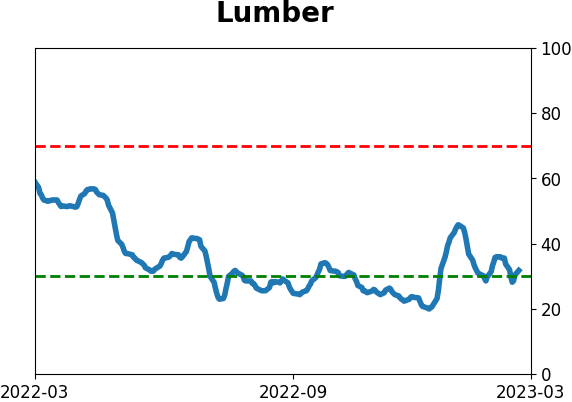
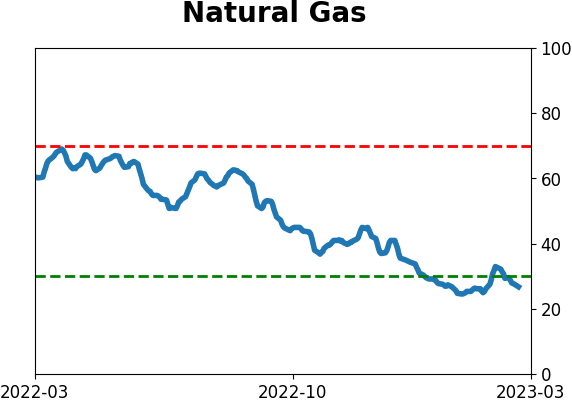
Commodity ETF's - 5-Day Moving Average
|
|