Headlines
|
|
A margin debt "what if":
When the margin debt figures for March are released, they're likely going to show that debt increased by more than 60% from a year ago. That will make the current rise in debt among the most extreme in history.
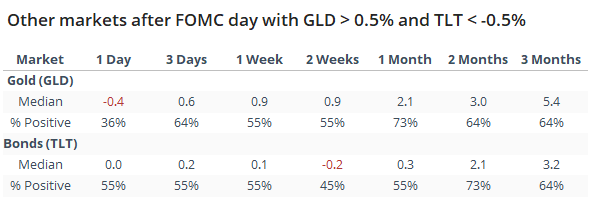
Knee-jerk buying: The initial reaction among stock investors to the latest FOMC pronouncements was to buy, not a big surprise there. Notably, they also bought gold and sold bonds. Dating back to 2005, there have been 11 other times when GLD rose by 0.5% or more, and TLT fell by -0.5% or more, on a day the FOMC announced its position on interest rates. It tended up to pop over the next few days, but that petered out over the next 1-2 weeks.
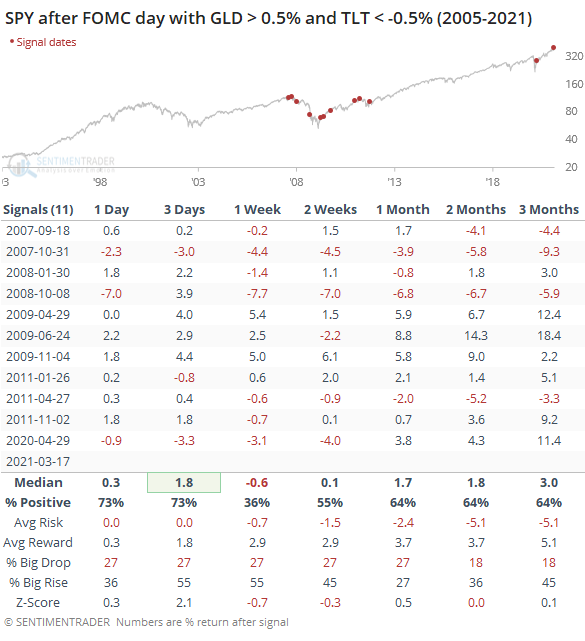
For GLD, it tended to be weaker short-term, and stronger longer-term. TLT was mixed up to 2 months later.
Bottom Line:
See the Outlook & Allocations page for more details on these summaries STOCKS: Weak sell
The extreme speculation registered in January and February is starting to get wrung out. Internal dynamics have mostly held up, so a return to neutral sentiment conditions would improve the forward risk/reward profile substantially. We're still a ways off from that. BONDS: Weak buy
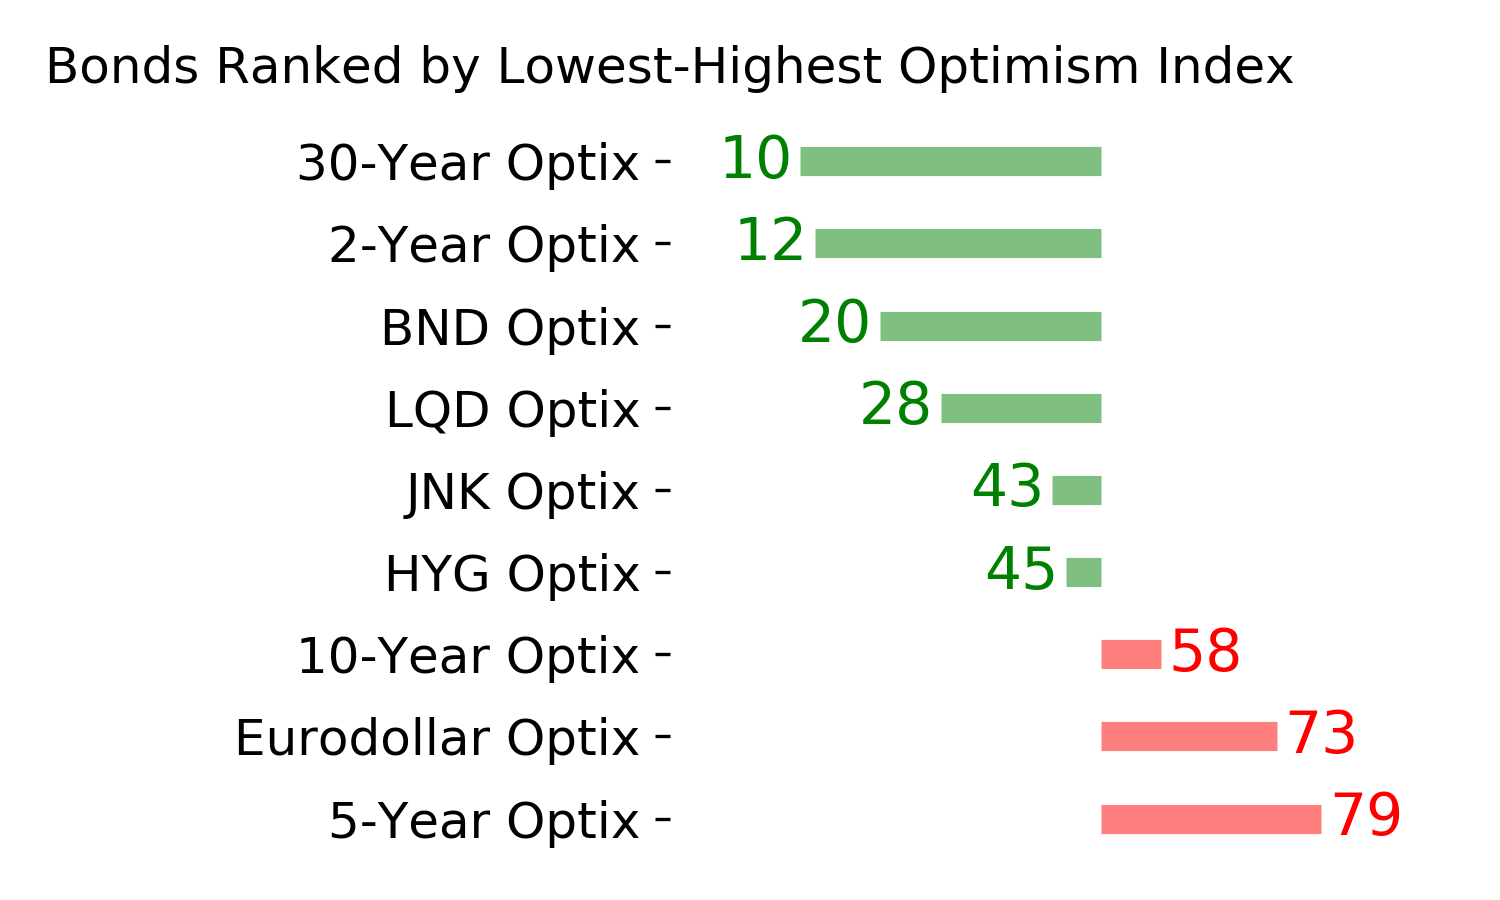
Various parts of the market have been hit in recent weeks, with mild oversold conditions. The Bond Optimism Index is now about as low as it gets during healthy bond market environments. Fixed income isn't responding well, so that needs to be monitored in case it's transitioning to a longer-term negative market environment. GOLD: Weak buy
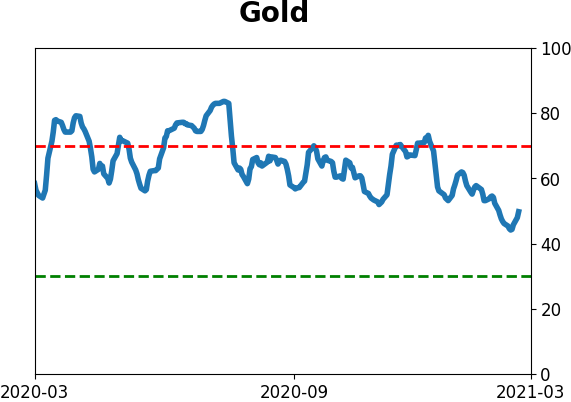
A dollar trying to rebound from a severe short position has weighed on gold and miners. The types of signals they've given in recent weeks, within the context of their recent surge, have usually resulted in higher prices over a medium- to long-term time frame. Like bonds, gold and miners aren't responding very well, and this needs to be monitored.
|
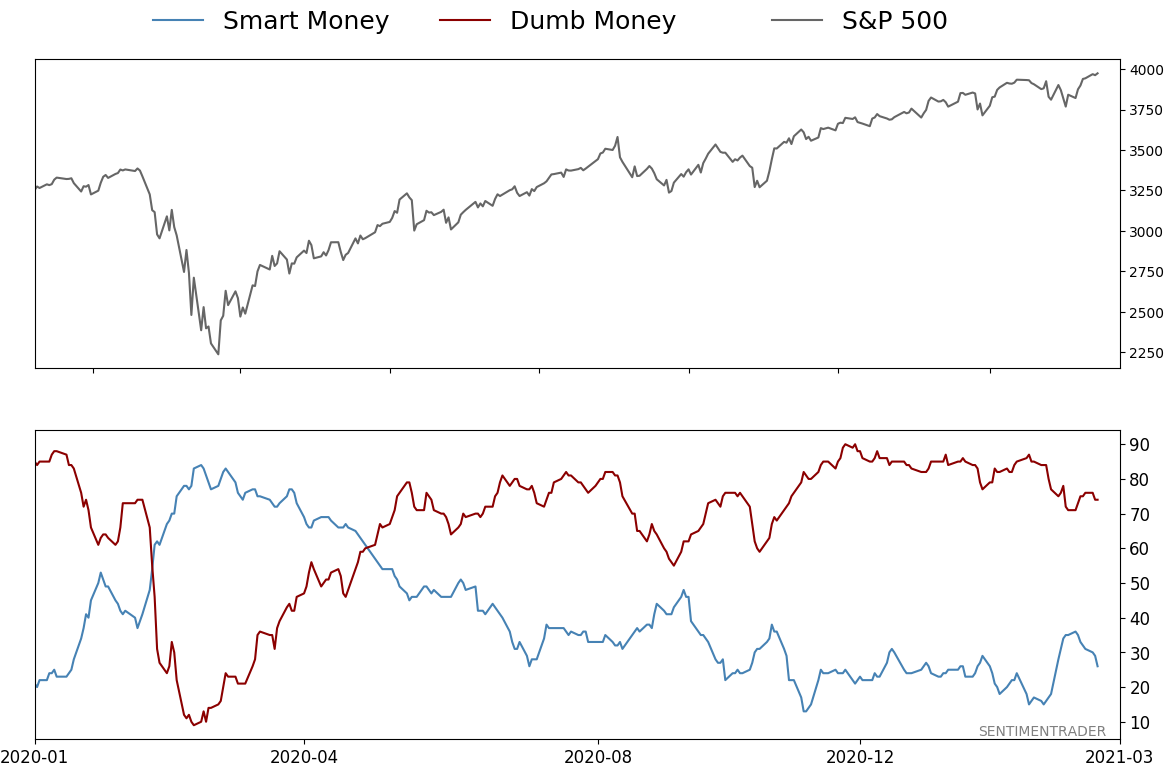
Smart / Dumb Money Confidence
|
Smart Money Confidence: 26%
Dumb Money Confidence: 74%
|
|
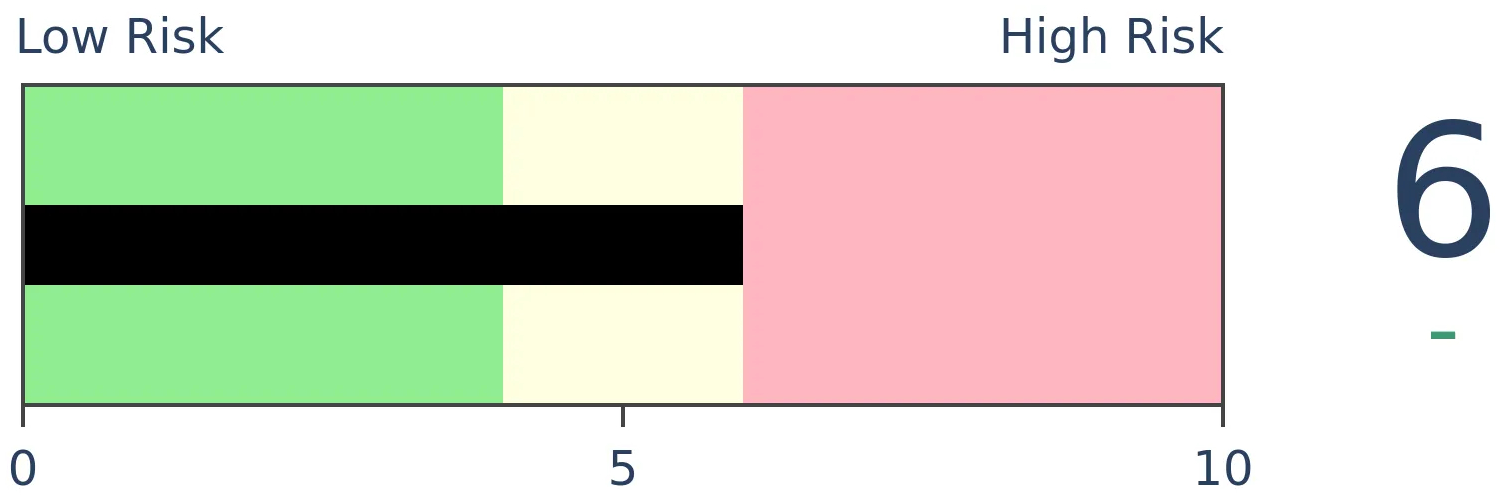
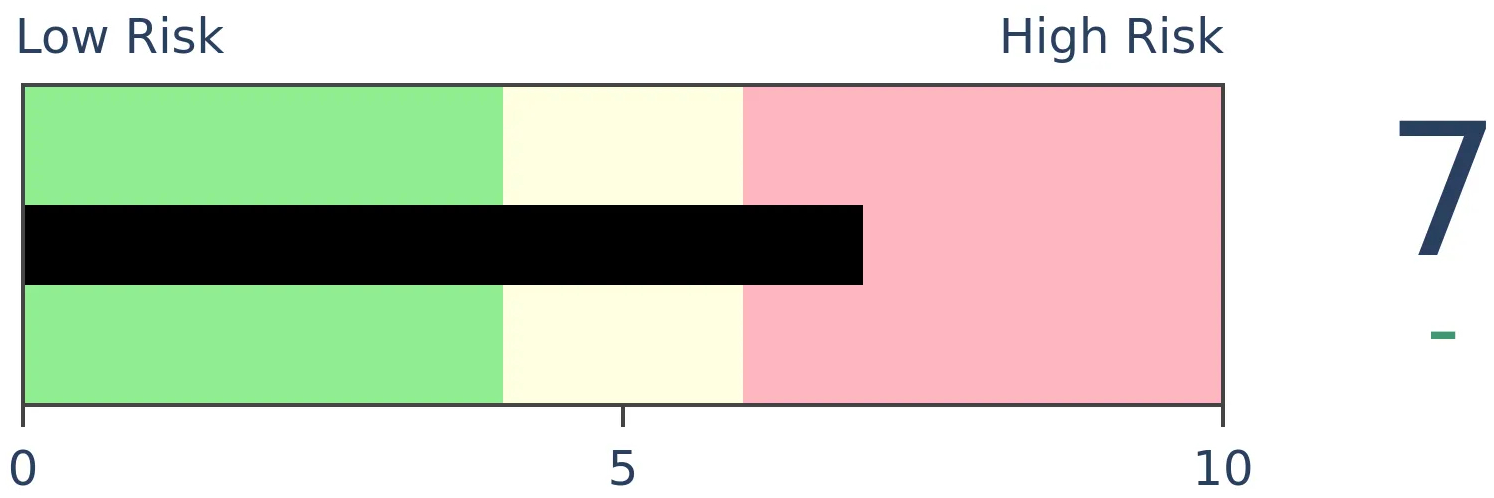
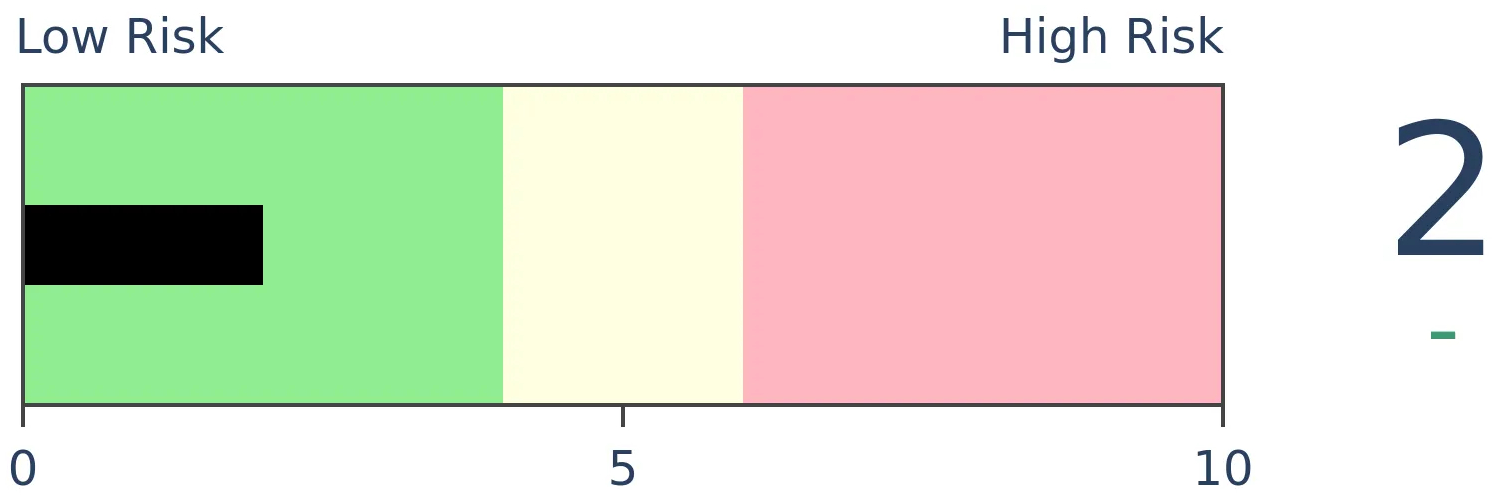
Risk Levels
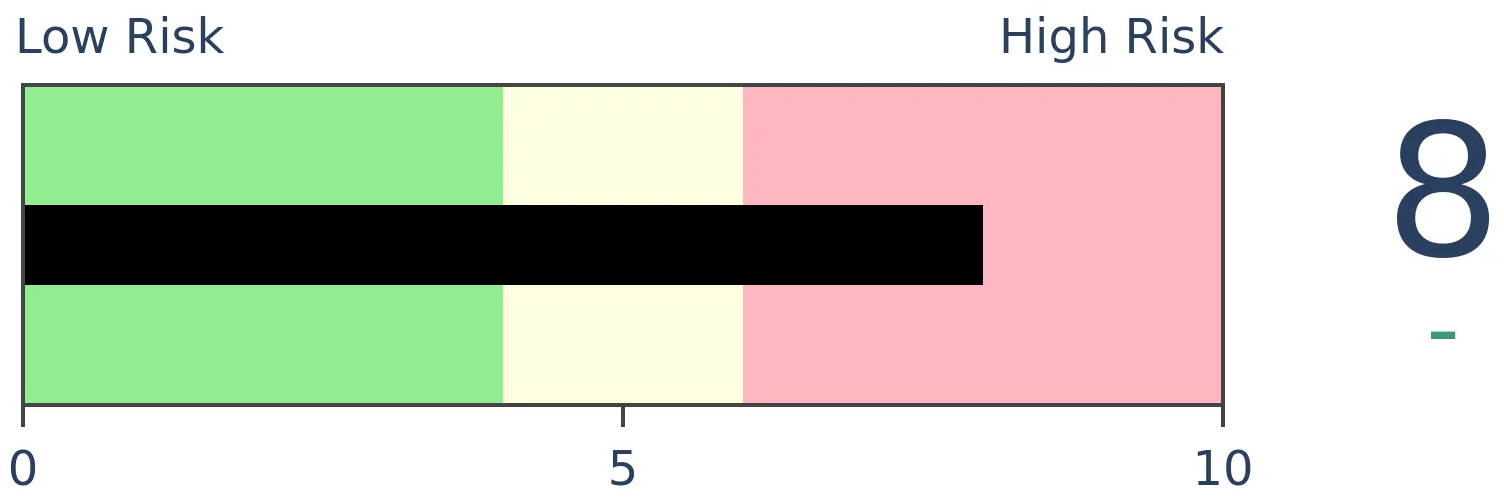
Stocks Short-Term
|
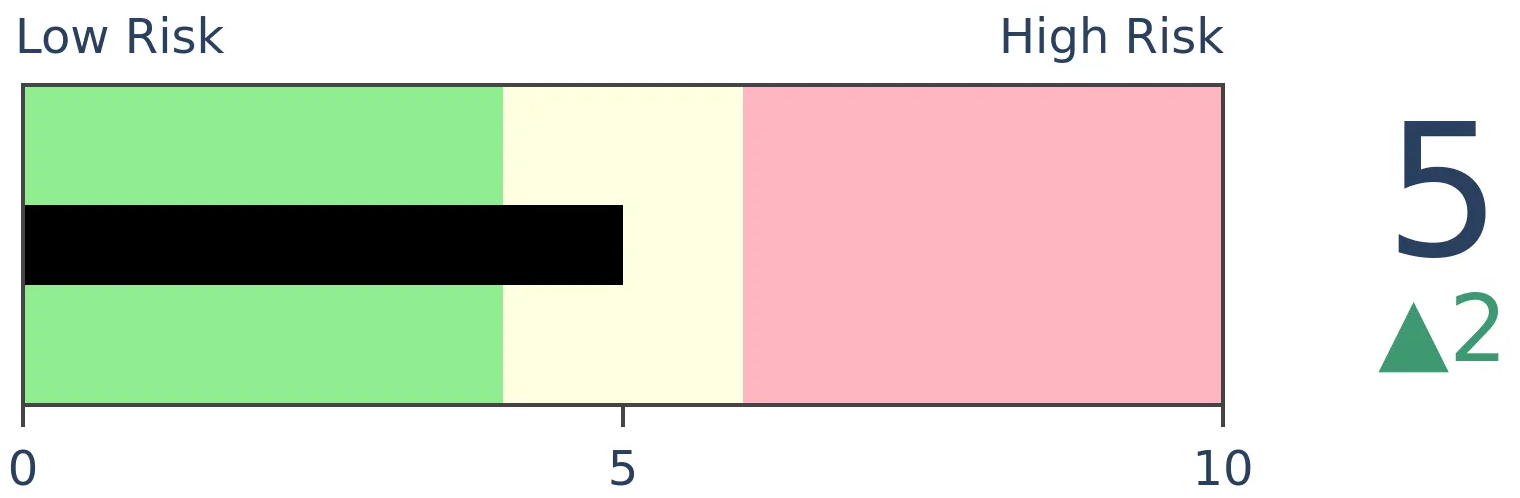
Stocks Medium-Term
|
|
Bonds
|
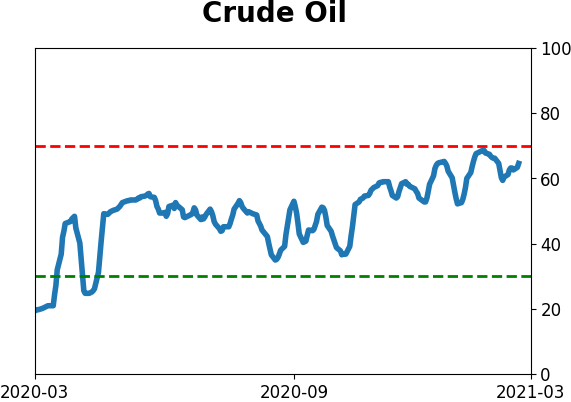
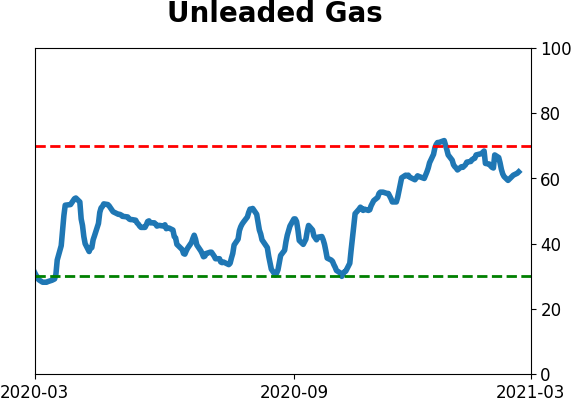
Crude Oil
|
|
Gold
|
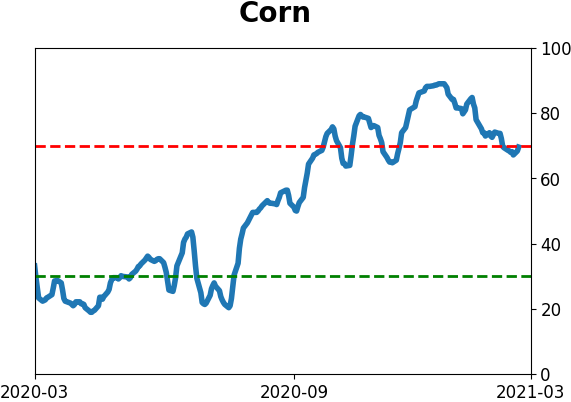
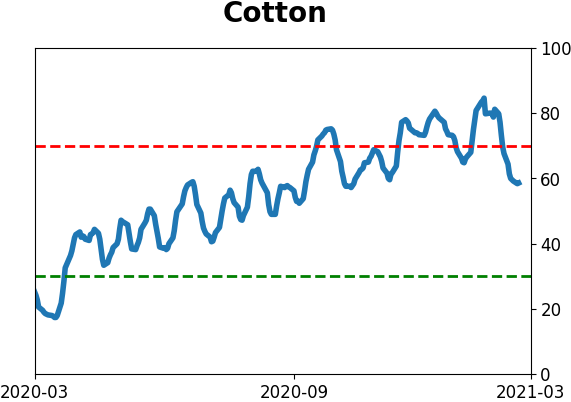
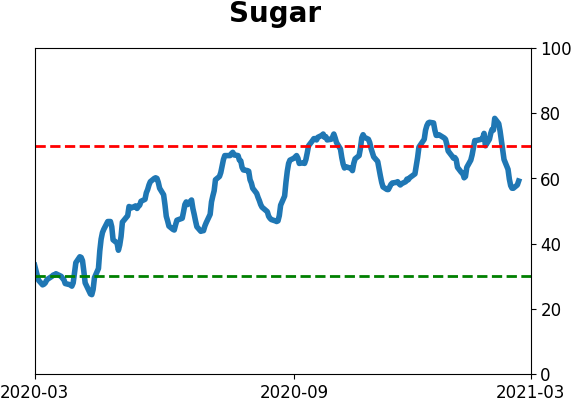
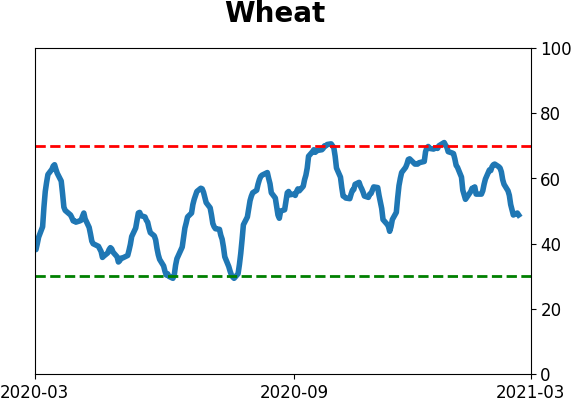
Agriculture

|
|
Research
BOTTOM LINE
When the margin debt figures for March are released, they're likely going to show that debt increased by more than 60% from a year ago. That will make the current rise in debt among the most extreme in history.
FORECAST / TIMEFRAME
None
|
For years, investors were worried about the growth in margin debt. As stocks rose throughout 2015, and kept going, there was a chorus of calls that investors were too optimistic.
Empirical evidence didn't support those concerns. The rate of growth in debt wasn't anywhere near prior extremes, especially when compared against the growth in stocks. For the most part, it was controlled and reasonable.
That has started to change in recent months. Based on how stocks have performed in March, and the historical relationship to margin debt, we can reasonably expect the next release to show eye-popping numbers.
Over the past 90 years, there has been a positive correlation between the S&P 500's performance during a month and the change in margin debt. As stocks rise, investors become more comfortable and borrow more against their appreciated holdings.
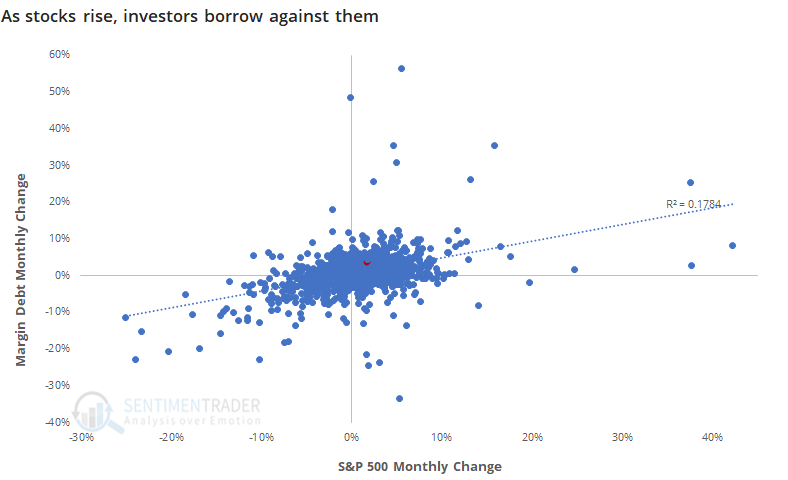
Based on this historical relationship, and how stocks have done so far this month, we can reasonably expect debt to exceed $831 billion when March's numbers are reported in April. Granted, that's assuming that stocks don't completely crater in the next 2 weeks.
Using some conservative assumptions, the below chart shows what the year-over-year rate of change in margin debt should look like when the next round of numbers are reported.
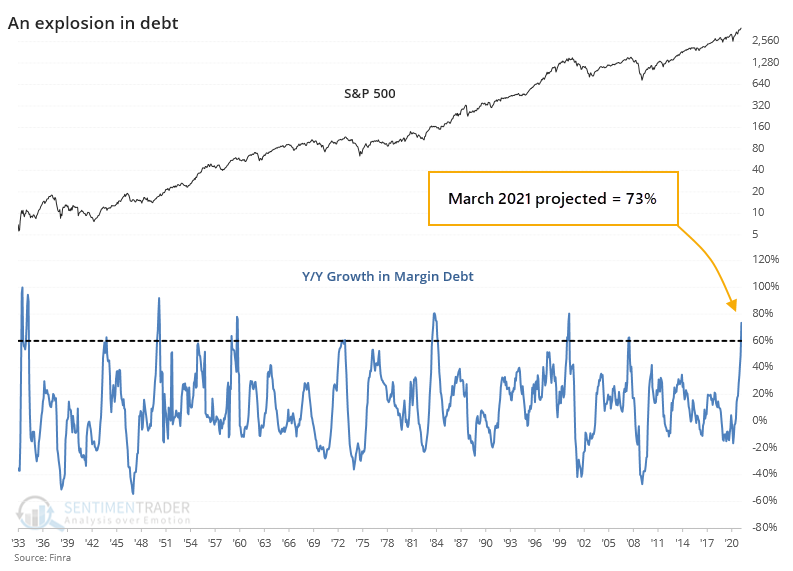
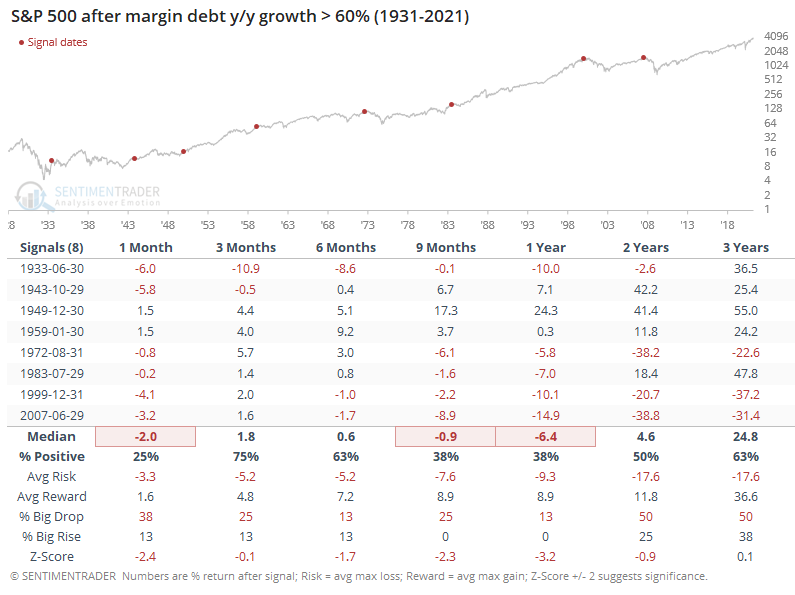
We can expect borrowings against stocks to appreciate more than 70% over where it was a year ago. Even if it only rises 60% from last March, it will still mark one of the sharpest expansions in debt since 1931.
Investors can be excused for holding more debt against stocks that have appreciated. The worry is that they've become increasingly comfortable even when accounting for the growth in stocks.
If current estimates hold, then the year-over-year change in debt will have exceeded the year-over-year change in the S&P 500 by more than 20% for 3 months running.
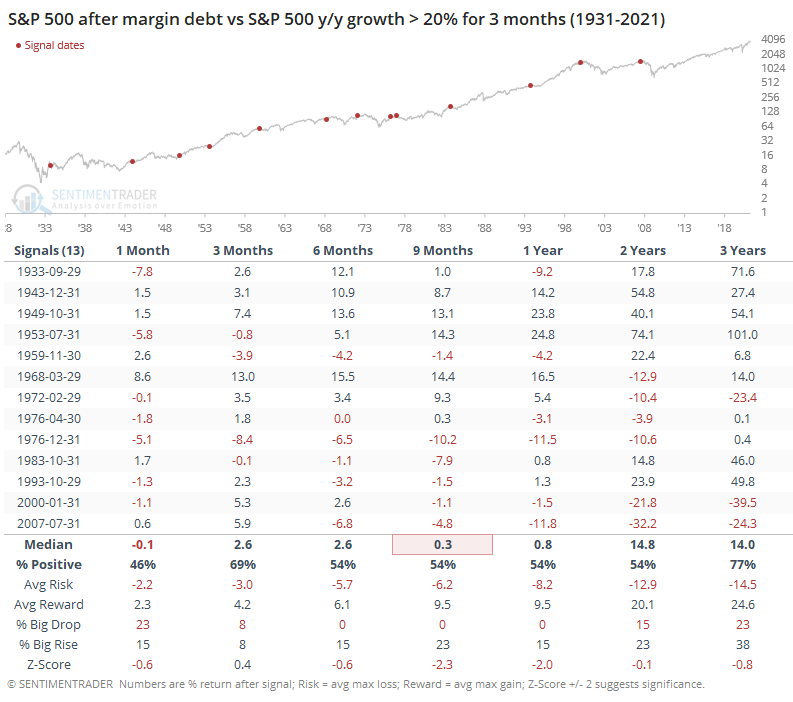
Particularly in recent decades, this kind of excessive and persistent growth in debt, on both an absolute and relative level, has been a boogeyman for forward returns. The last 9 instances, dating back to the 1950s, have all shown a negative return somewhere between the next 9-24 months.
Debt is still not near an extreme relative to the overall market cap of U.S. equities, but we've seen in the past that this is not a very effective indicator. The most effective use of the data, both on the upside and downside, has been the rate of change, including relative to the S&P. And that's why it's becoming to be a much larger concern.
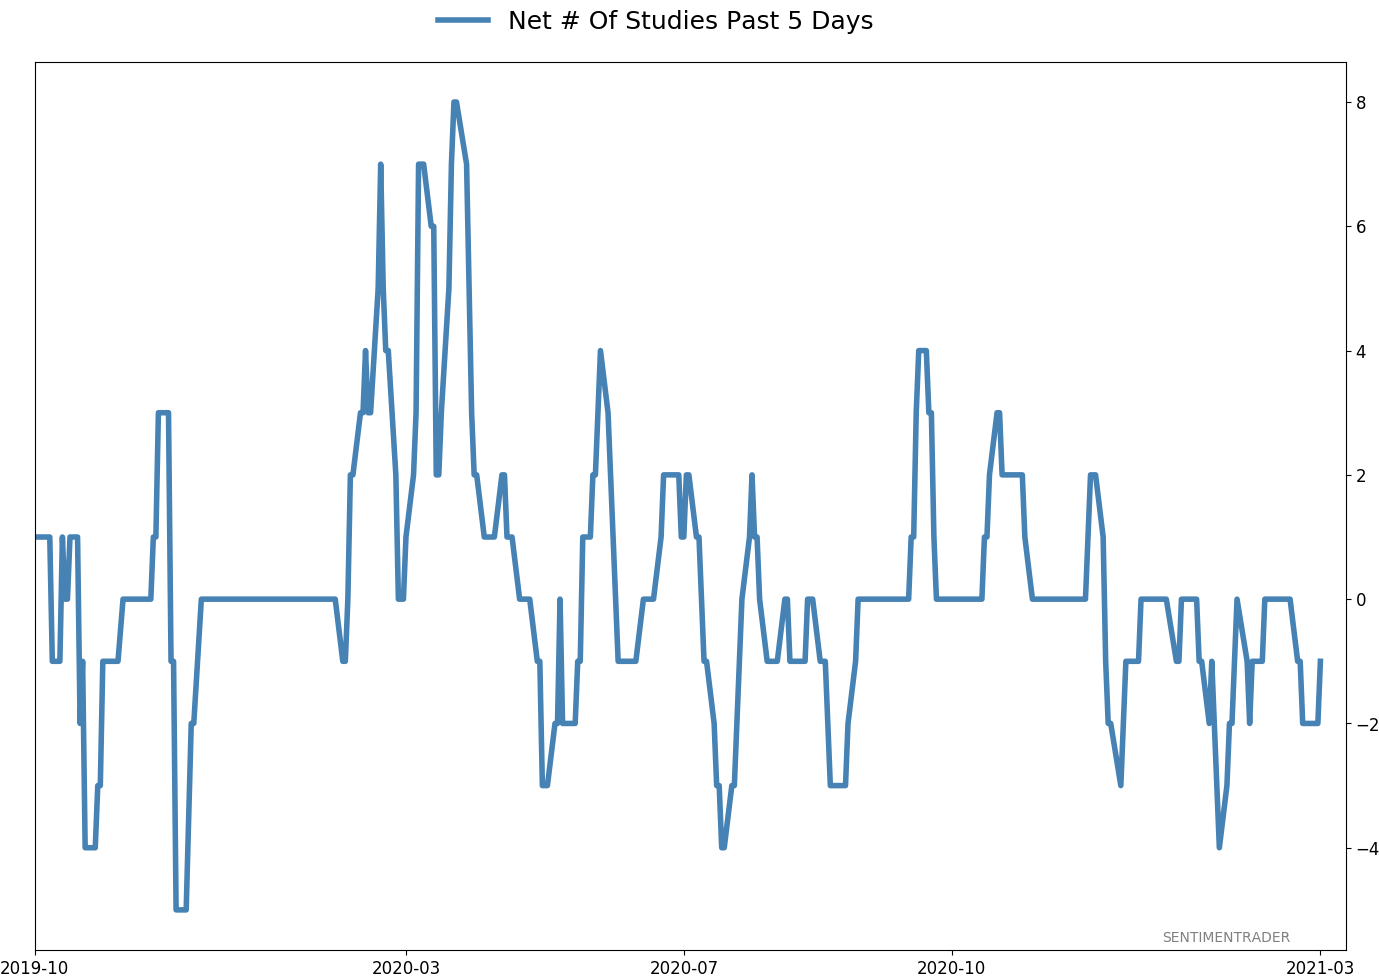
Active Studies
| Time Frame | Bullish | Bearish | | Short-Term | 0 | 0 | | Medium-Term | 2 | 10 | | Long-Term | 16 | 4 |
|
Indicators at Extremes
Portfolio
| Position | Description | Weight % | Added / Reduced | Date | | Stocks | RSP | 4.9 | Reduced 4% | 2021-02-09 | | Bonds | 30.0% BND, 8.8% SCHP | 38.8 | Added 15.1% | 2021-02-18 | | Commodities | GCC | 2.3 | Reduced 2.1%
| 2020-09-04 | | Precious Metals | GDX | 9.0 | Added 0.1% | 2021-02-18 | | Special Situations | 7.3% XLE, 4.8% PSCE | 12.1 | Reduced 5.6% | 2021-02-18 | | Cash | | 32.8 | | |
|
Updates (Changes made today are underlined)
With a market that has seen the kinds of broad participation and big breath thrusts like we did in the fall, it's hard to become too negative. Those kinds of conditions have consistently preceded higher returns over the next 6-12 months. It's the interim that's more of an issue. Even conditions like that haven't prevented some shorter-term pullbacks. And when we combine an environment where speculation is rampant and recent days have seen an increase in cracks under the surface of the indexes, it's enough to become more defensive over a short- to medium-term time frame. We still don't have much confirmation from the price action in the indexes, so those who are more conservative would likely wait before increasing cash levels. I've decreased risk exposure a bit more, mainly in terms of energy stocks and the ANGL fund, while adding more to the broader bond market. RETURN YTD: 7.1% 2020: 8.1%, 2019: 12.6%, 2018: 0.6%, 2017: 3.8%, 2016: 17.1%, 2015: 9.2%, 2014: 14.5%, 2013: 2.2%, 2012: 10.8%, 2011: 16.5%, 2010: 15.3%, 2009: 23.9%, 2008: 16.2%, 2007: 7.8%
|
|
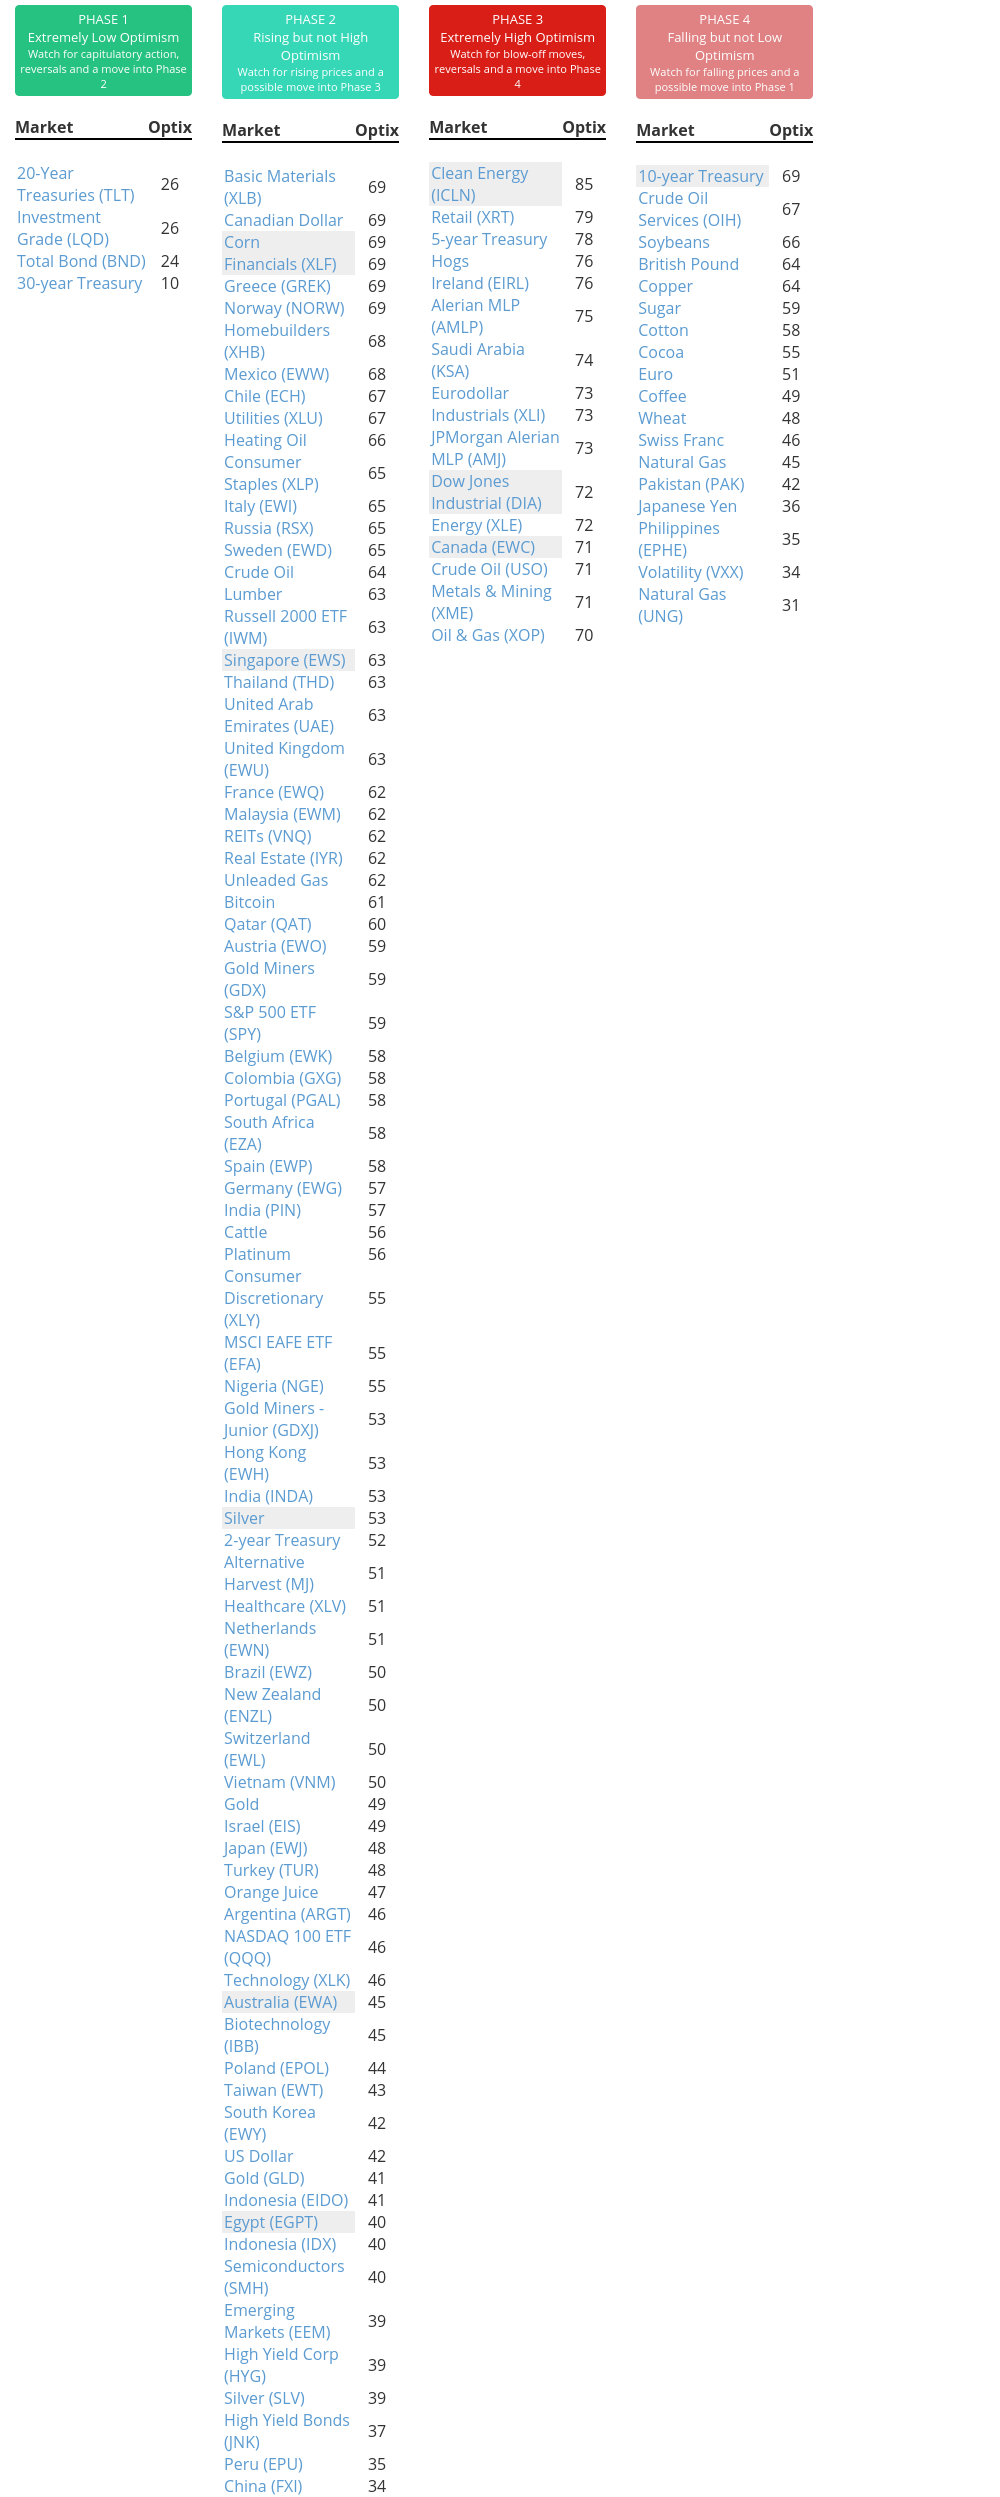
Phase Table
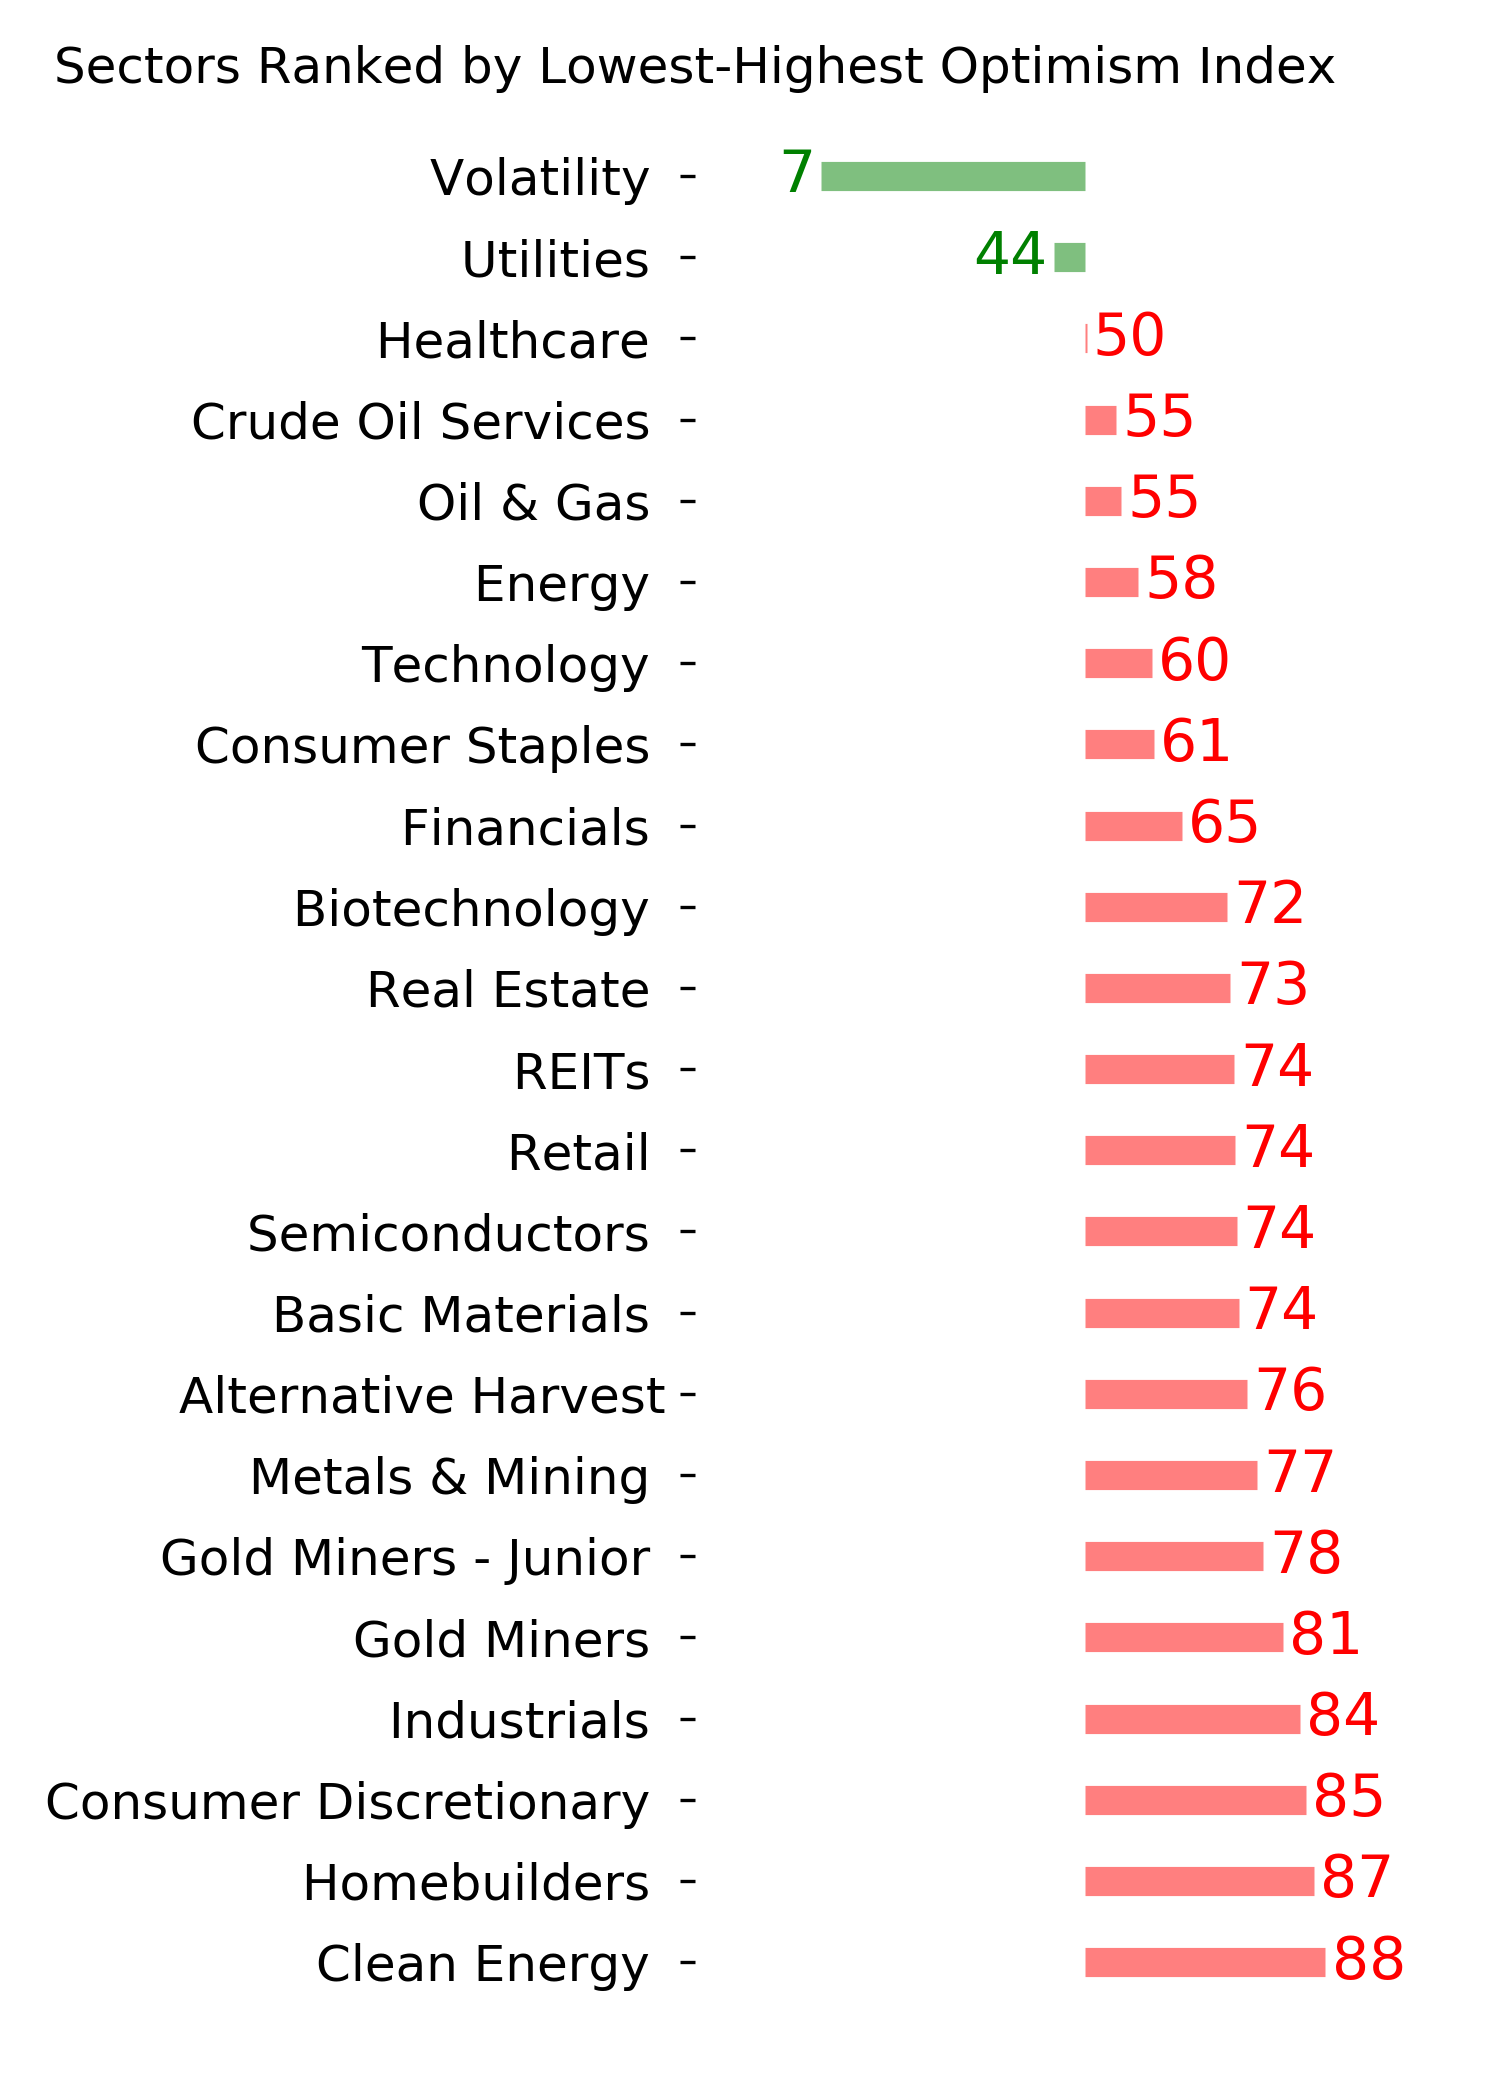
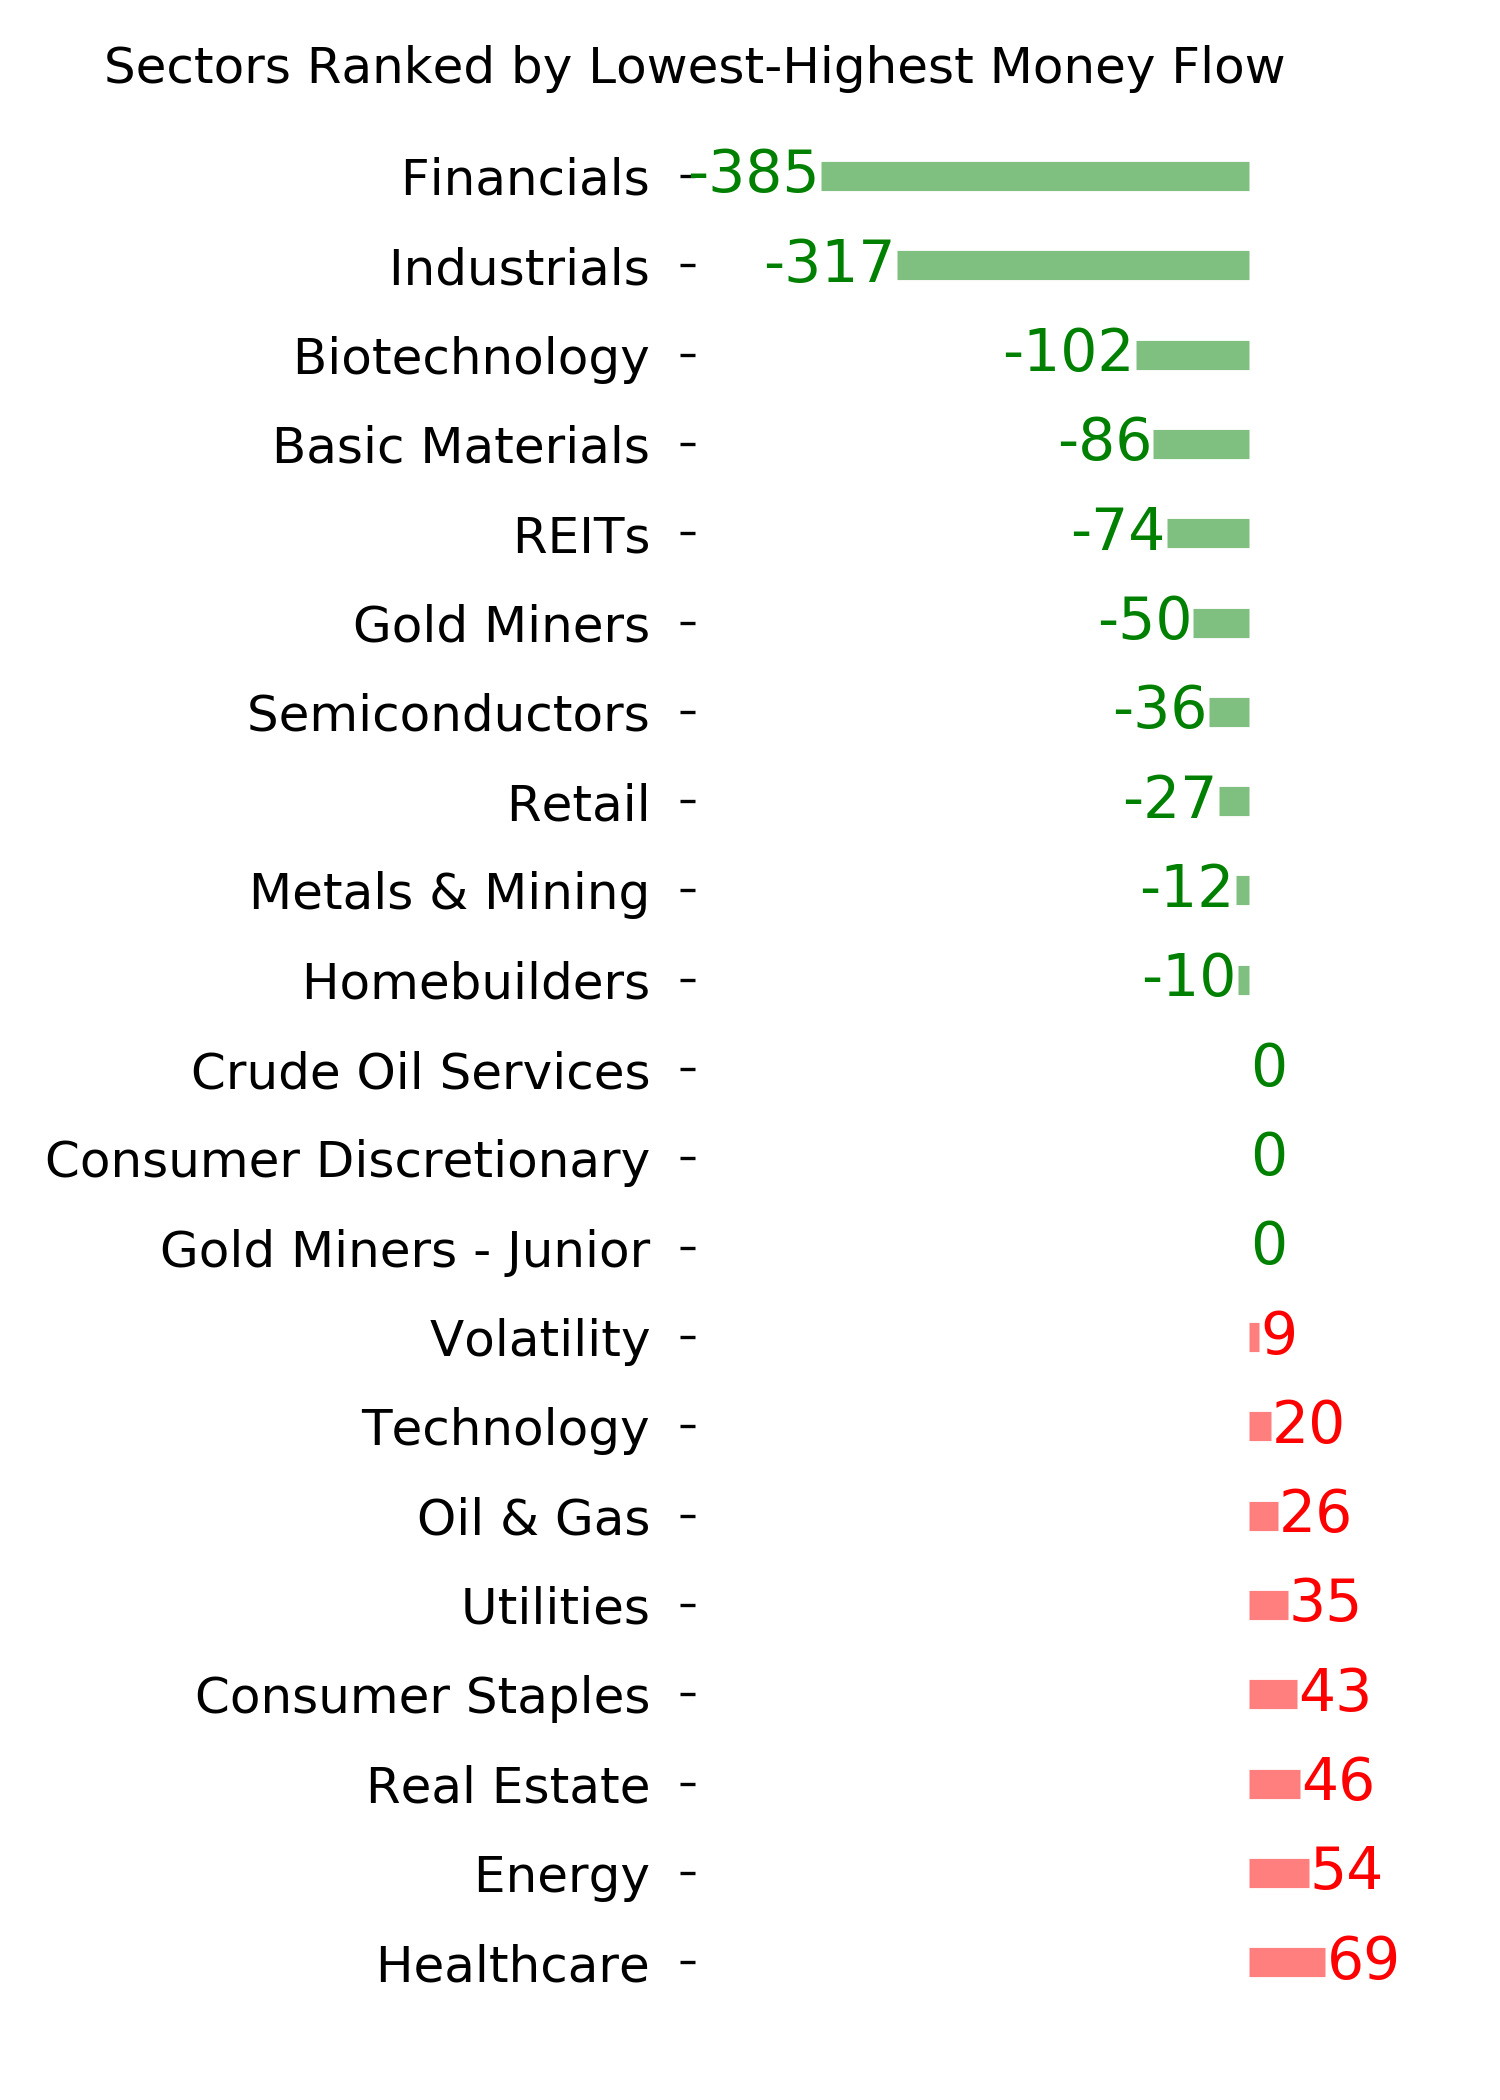
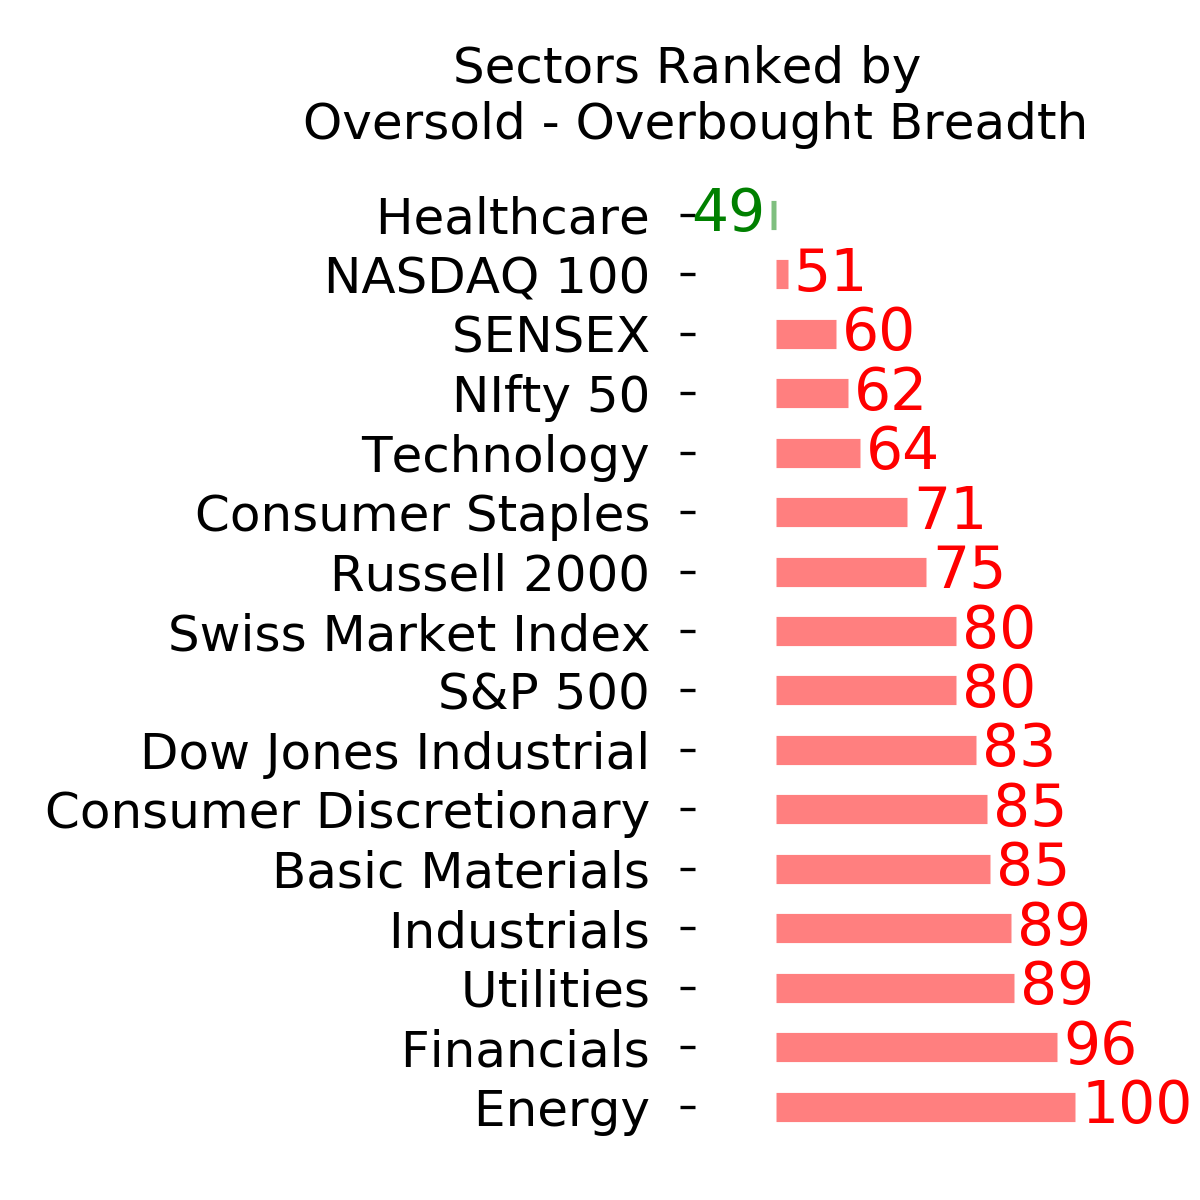
Ranks
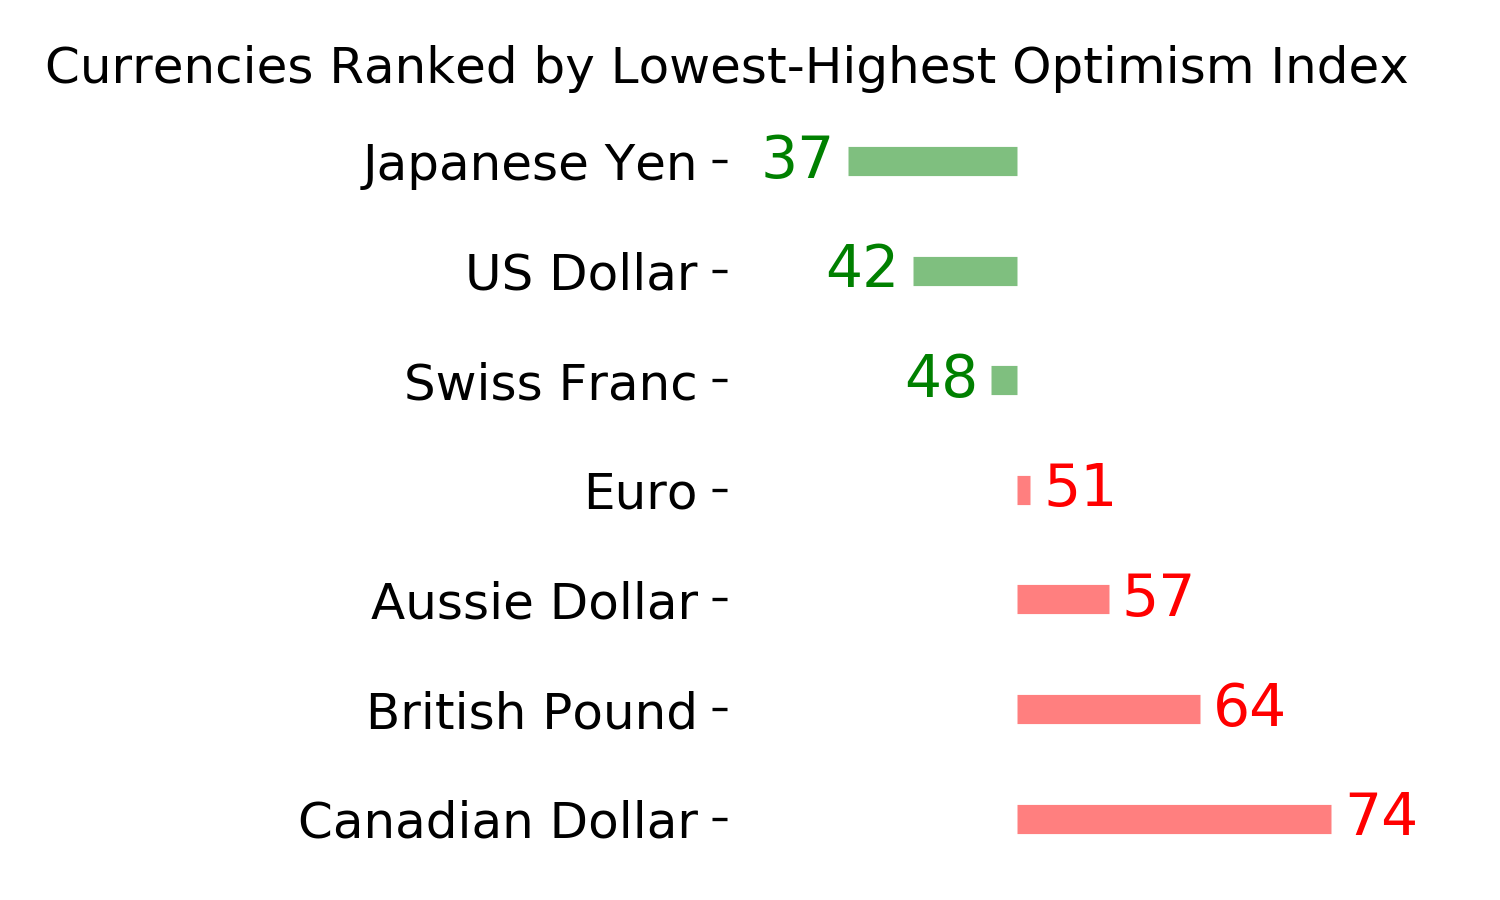
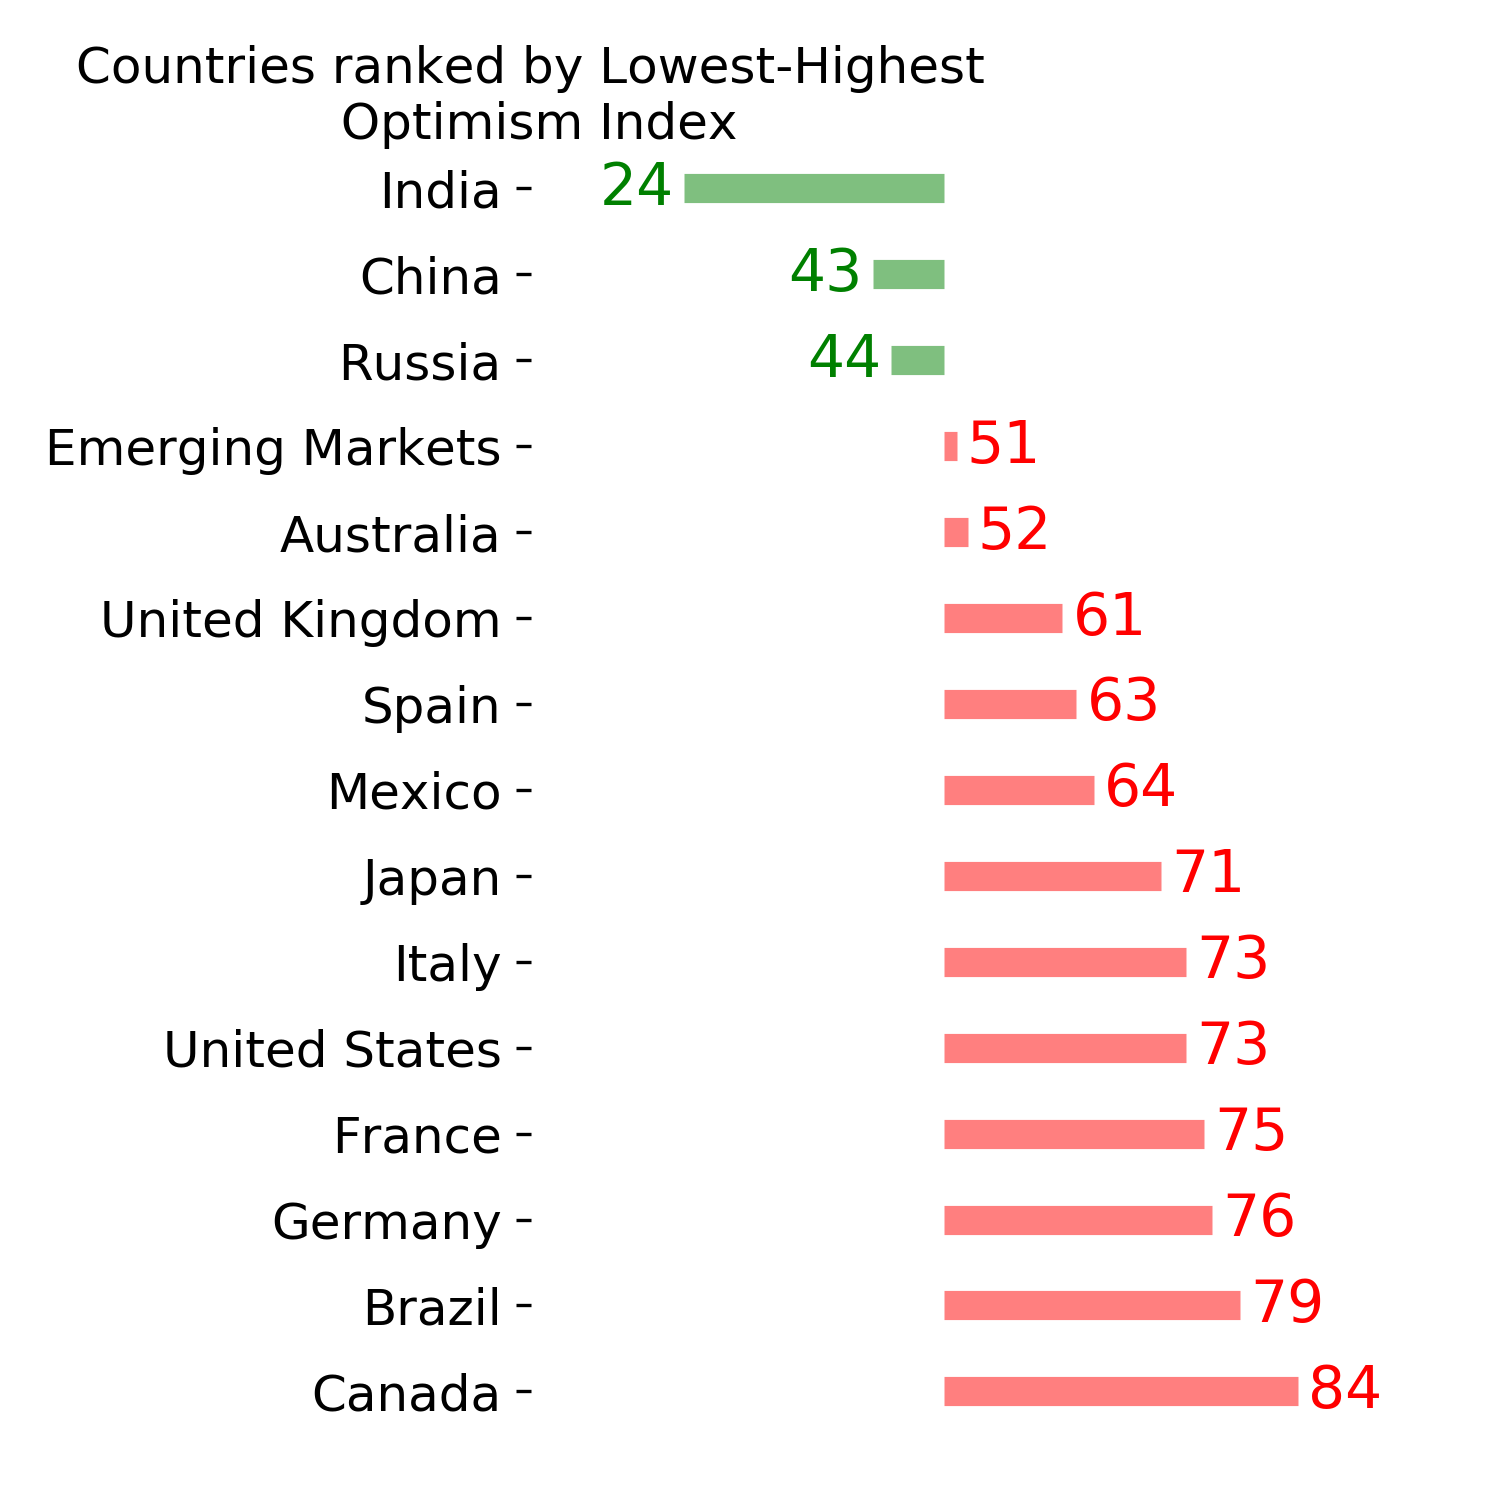
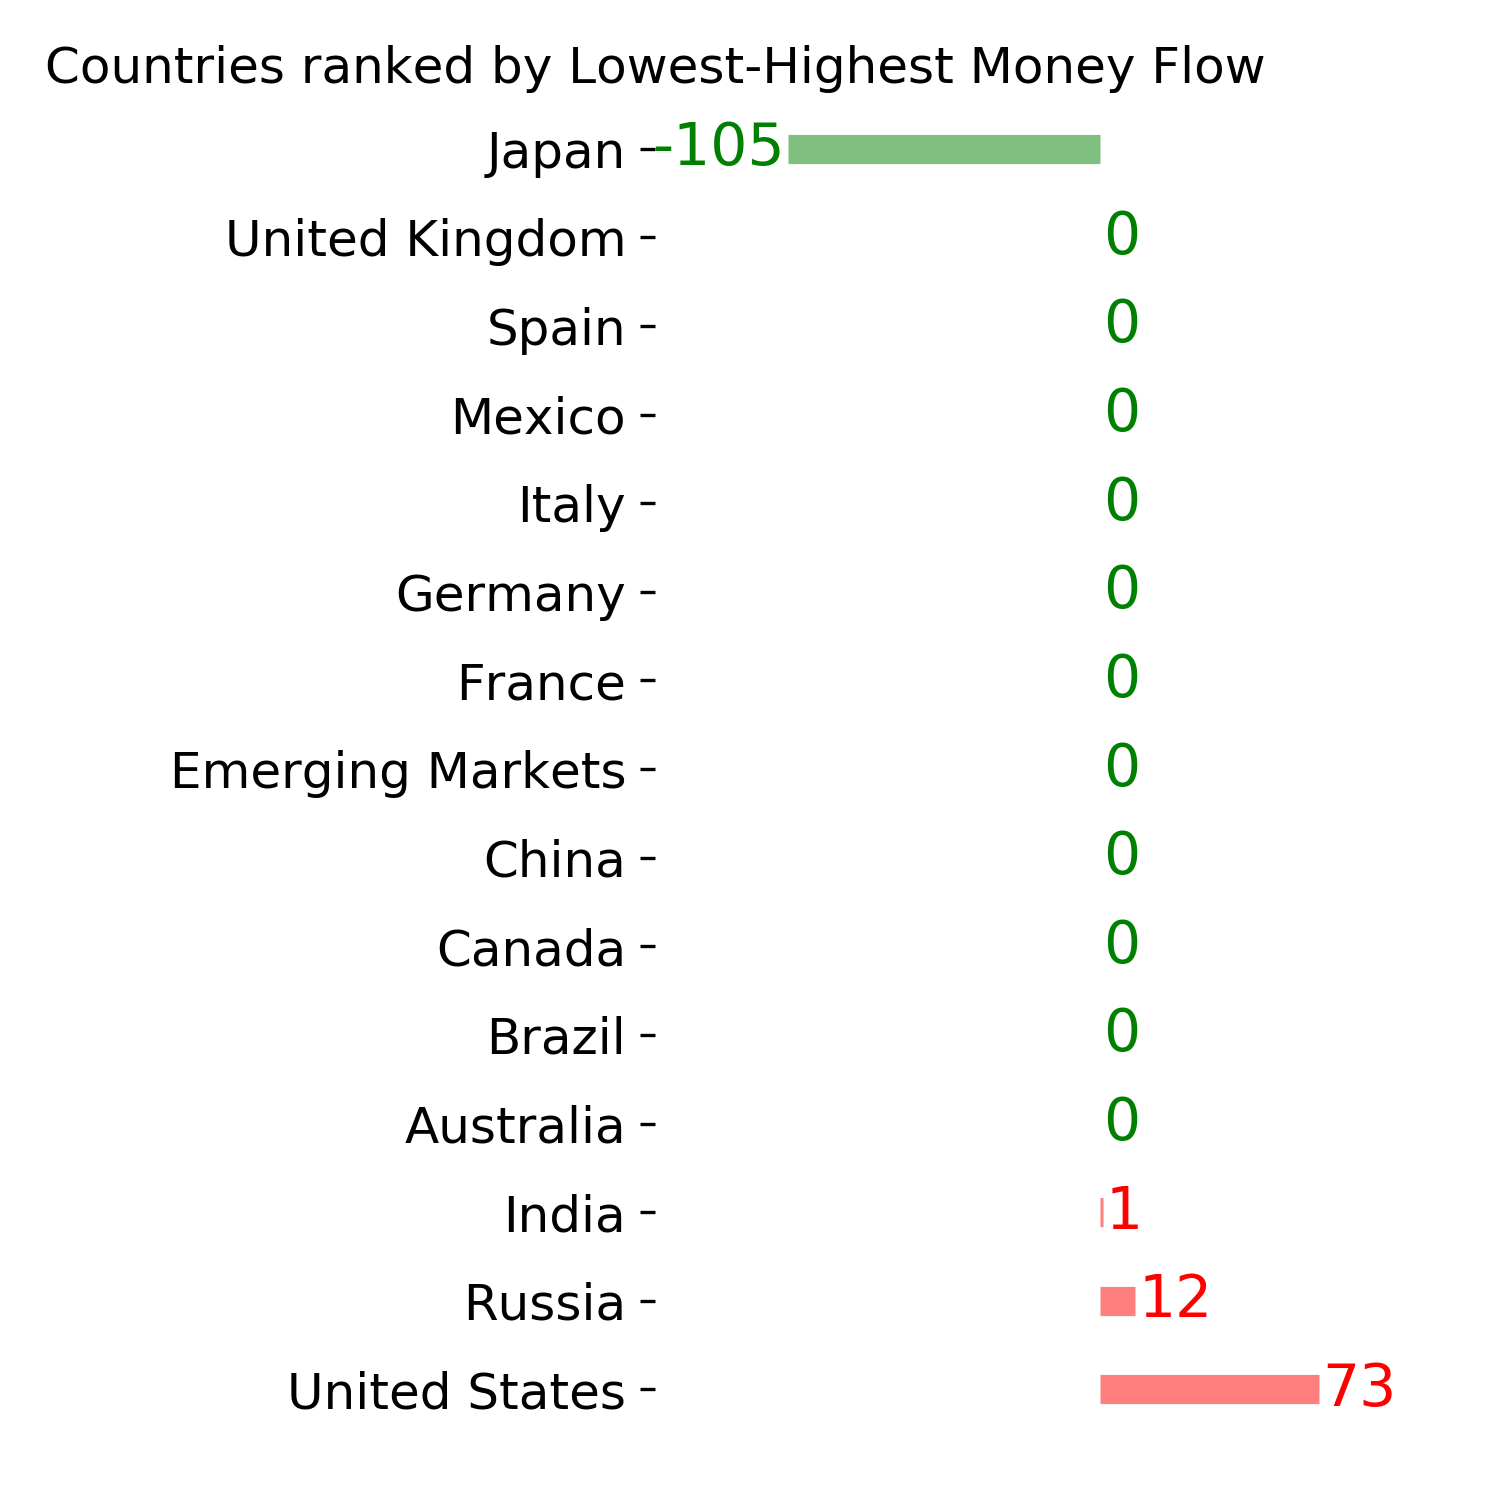
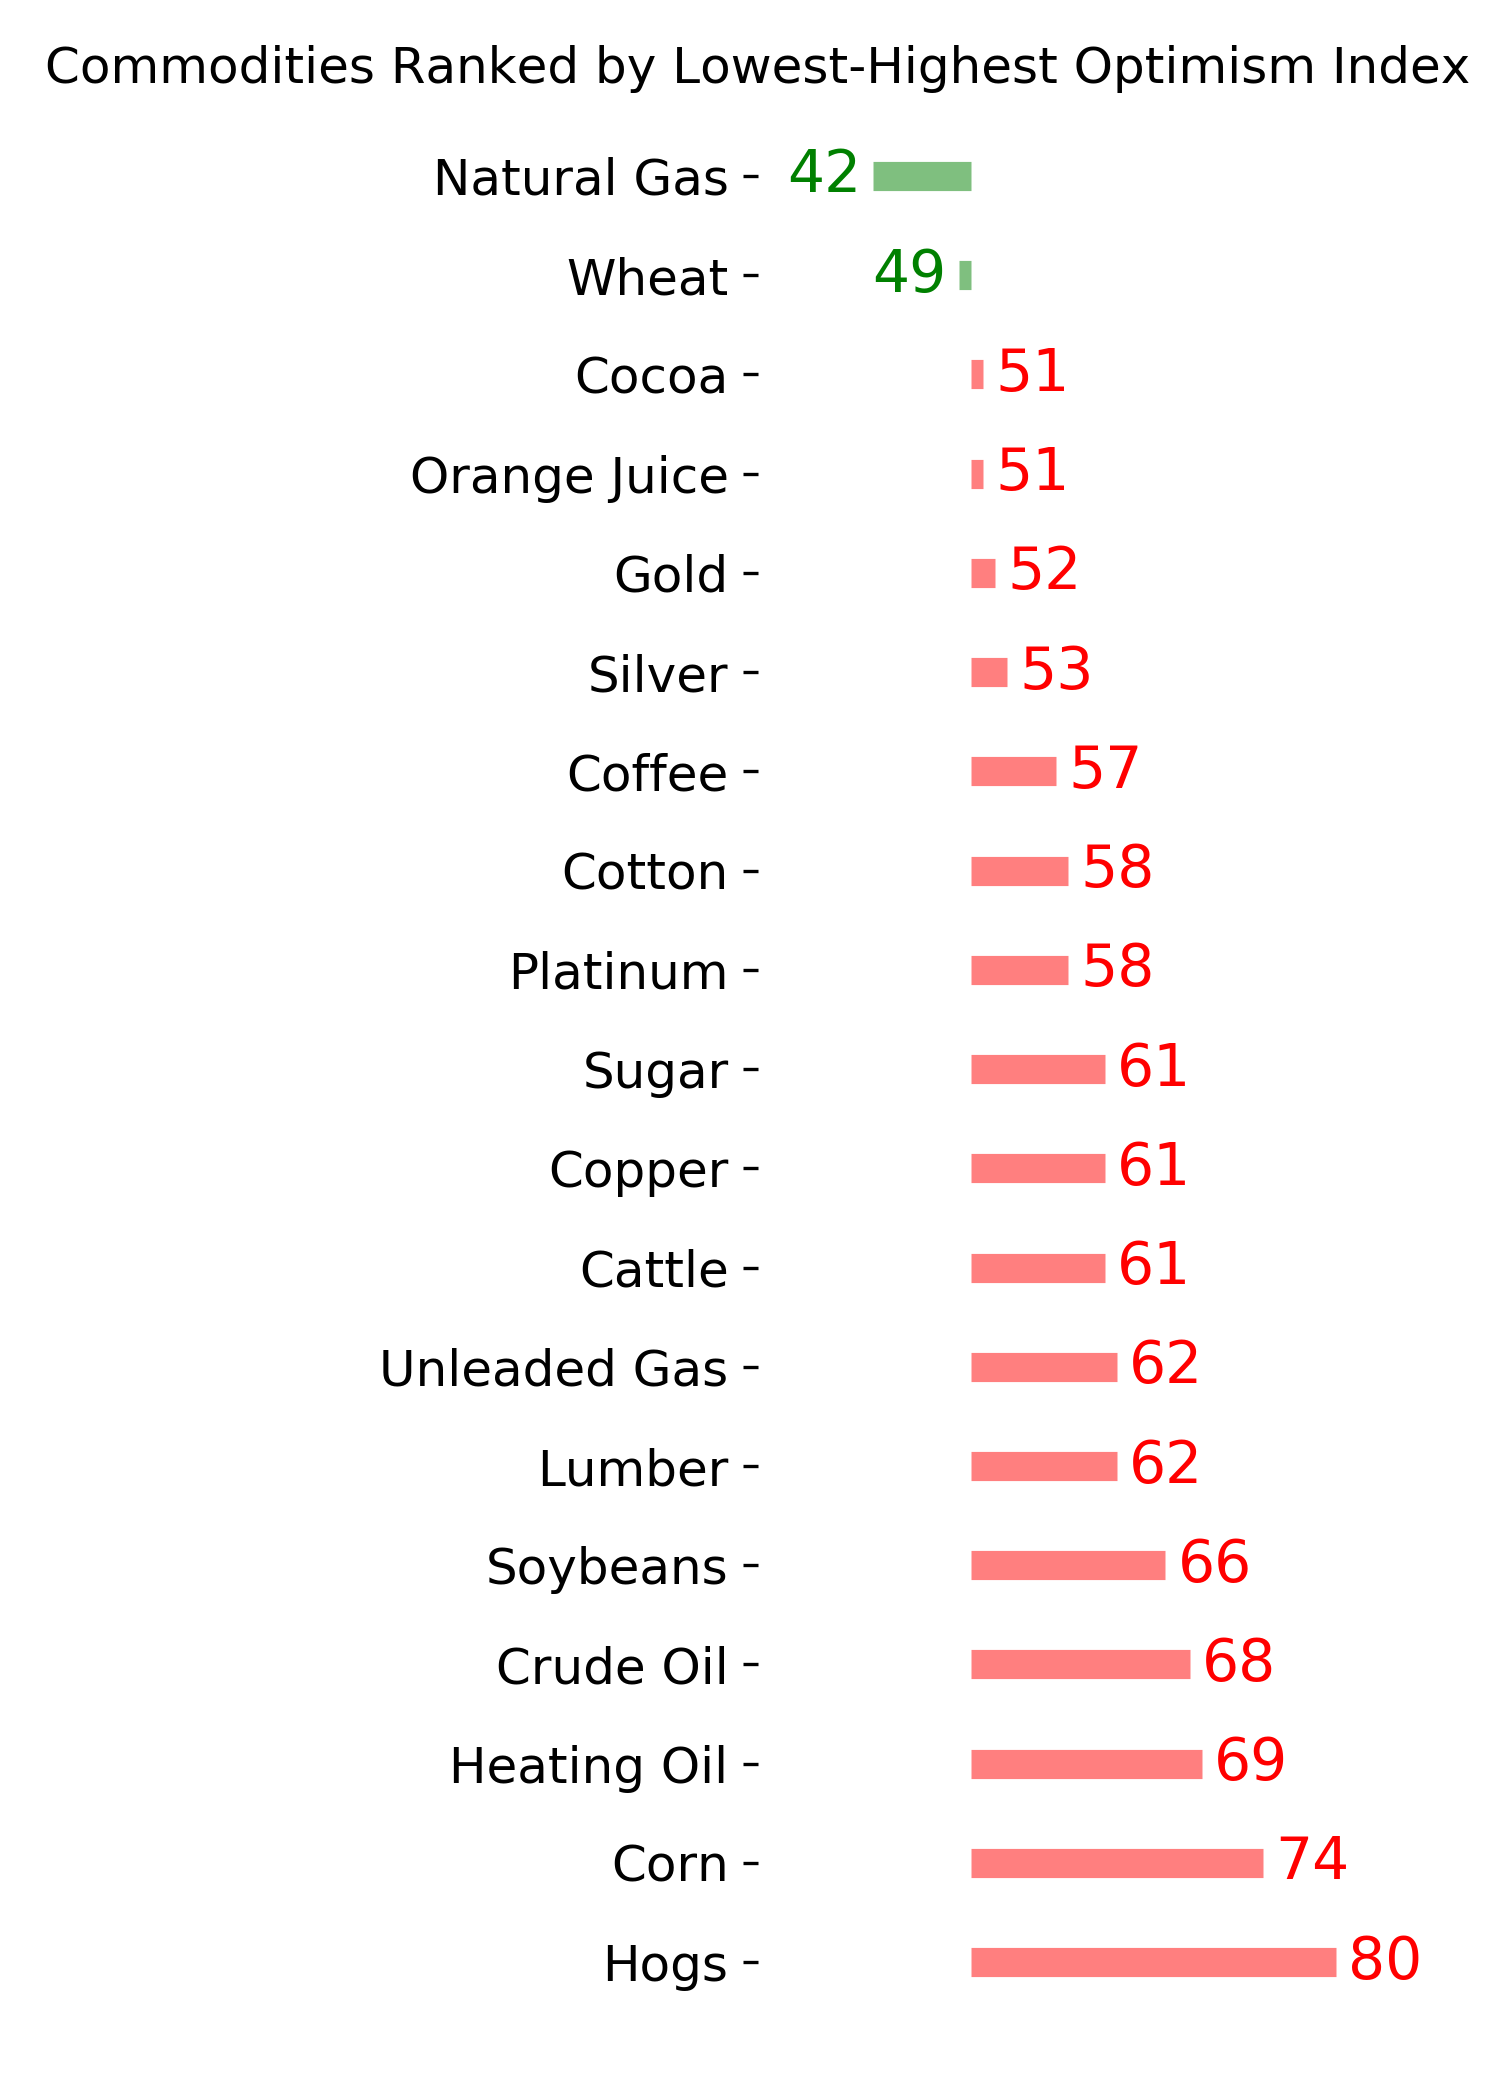
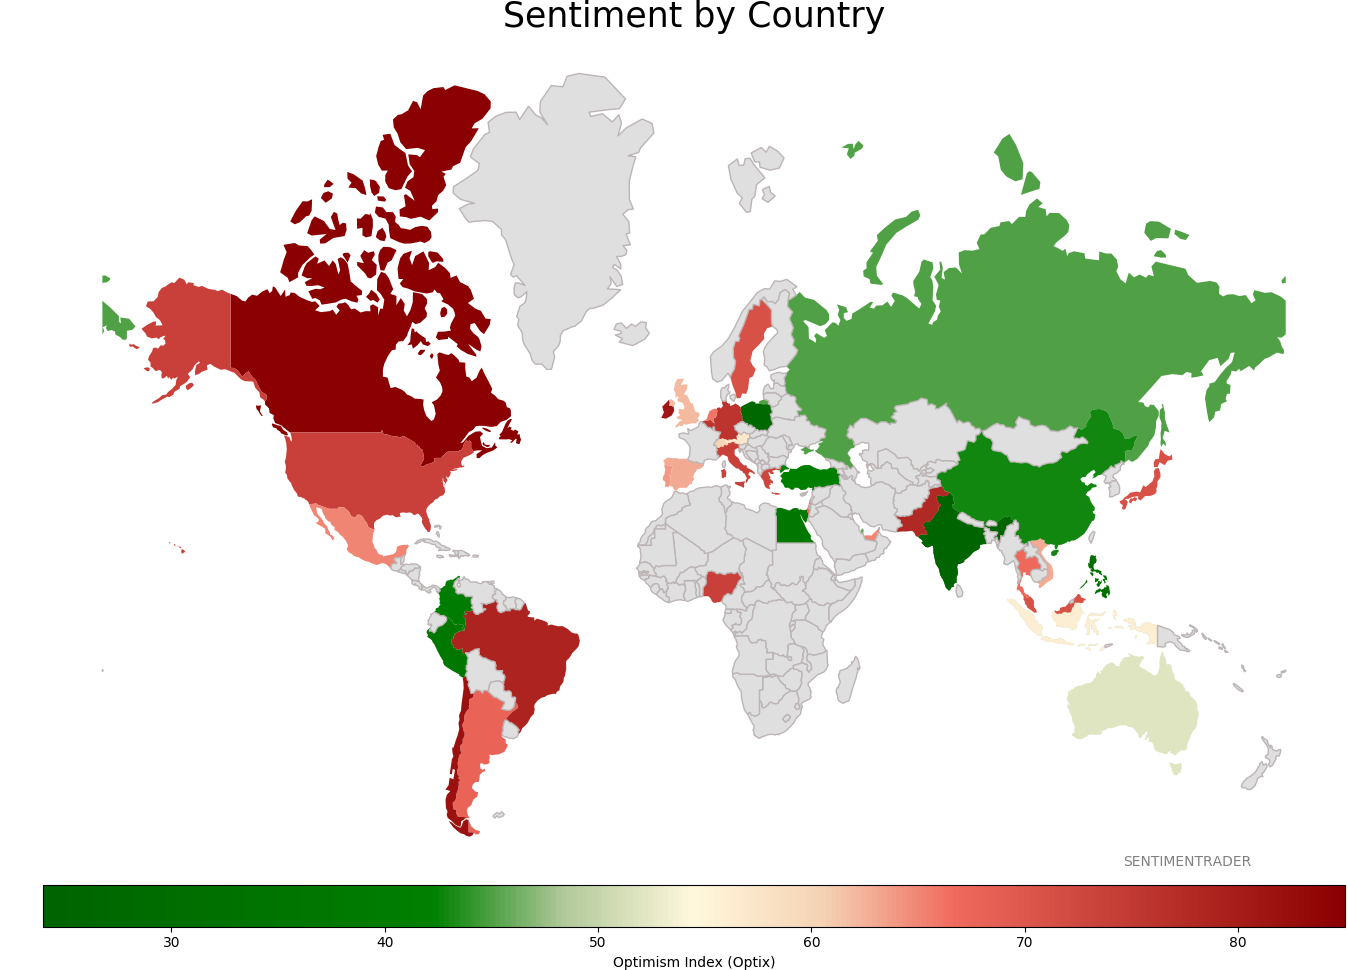
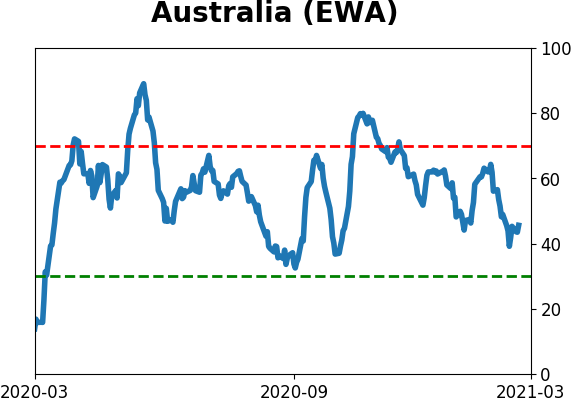
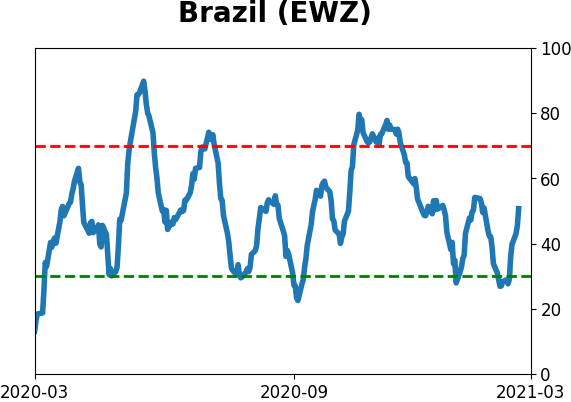
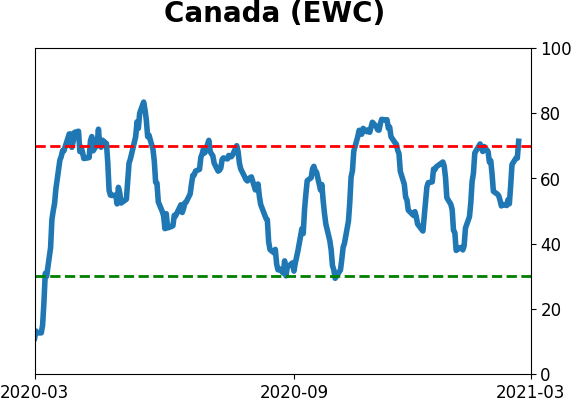
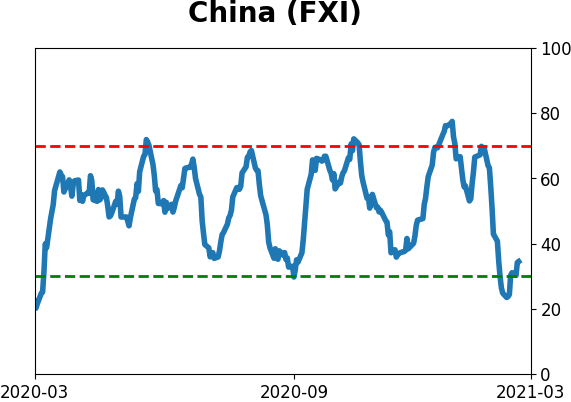
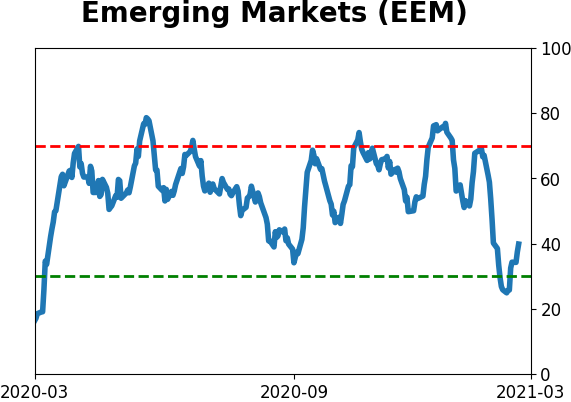
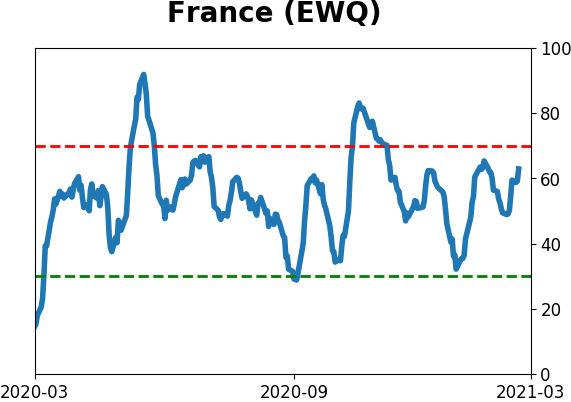
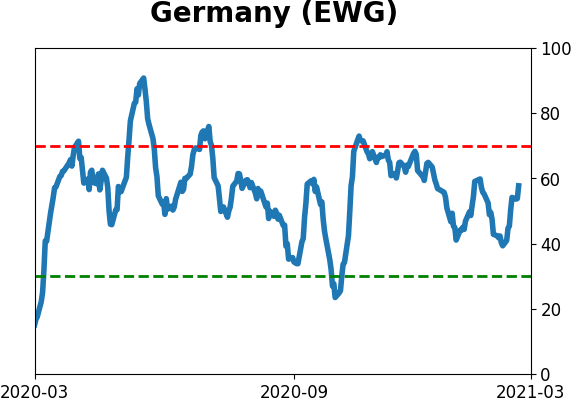
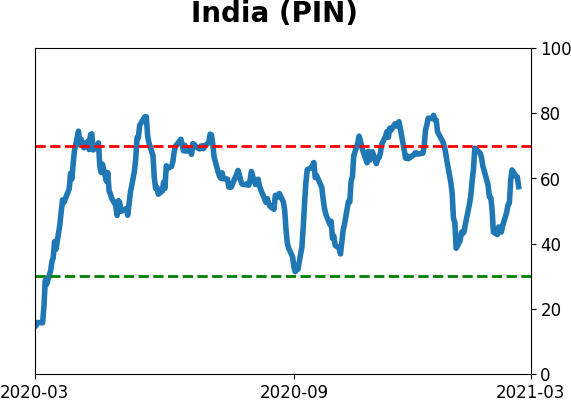
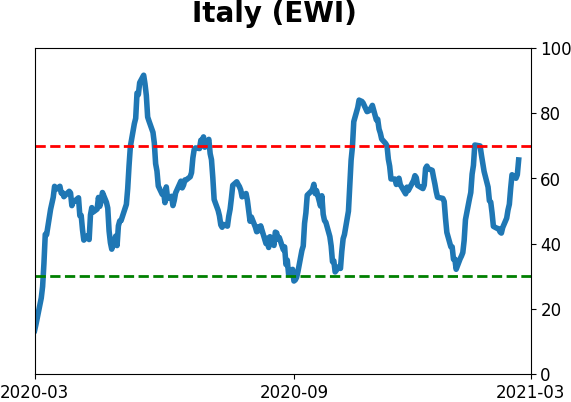
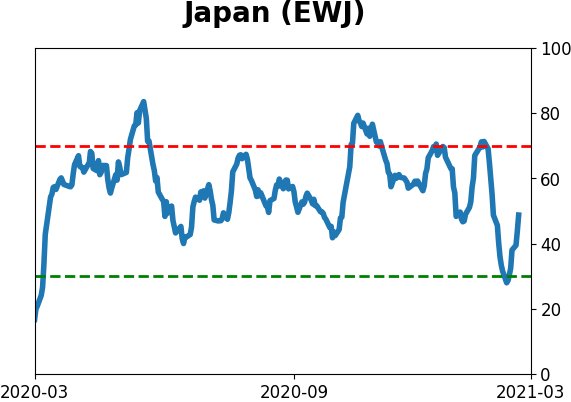
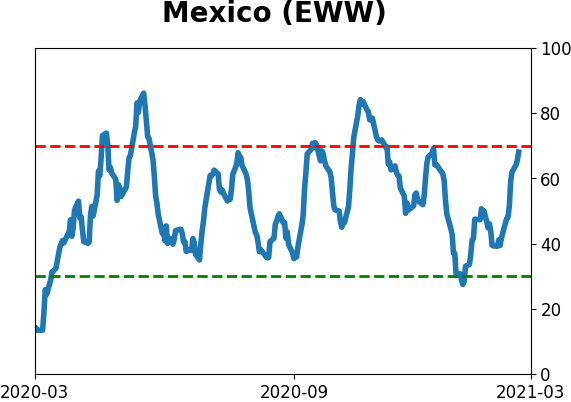
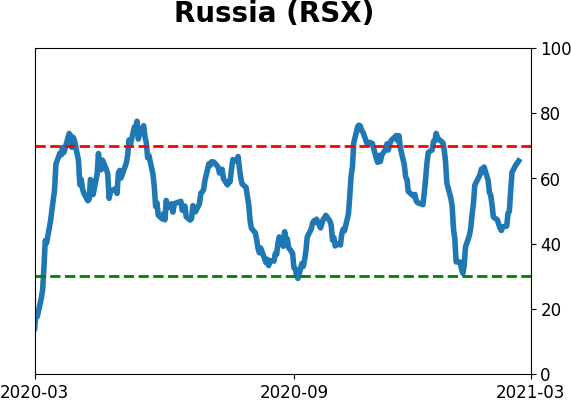
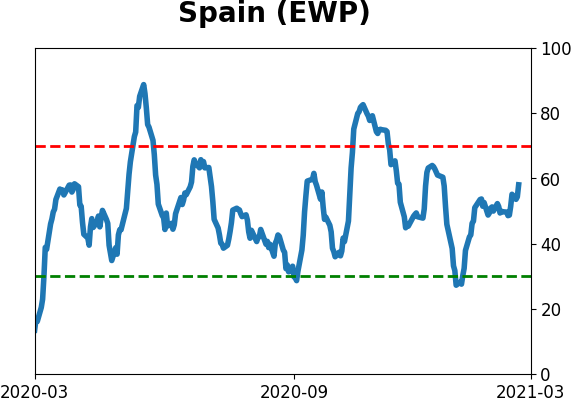
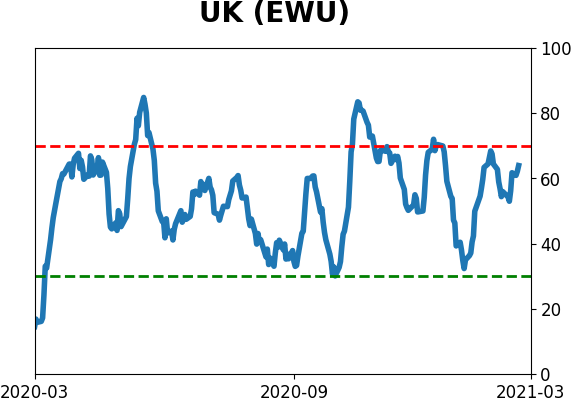
Sentiment Around The World
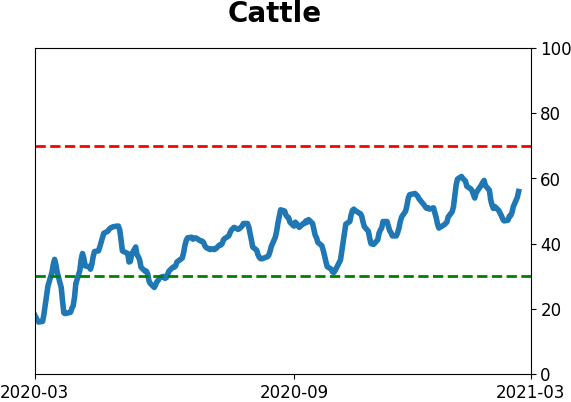
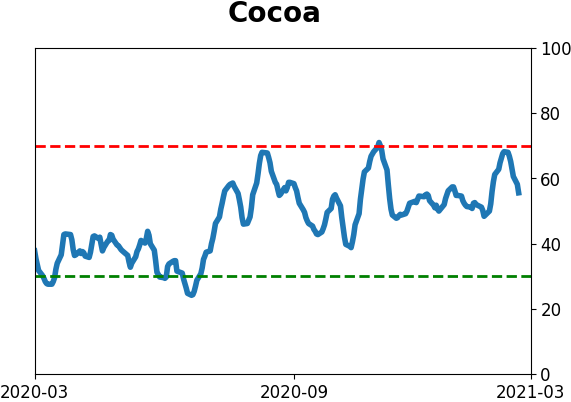
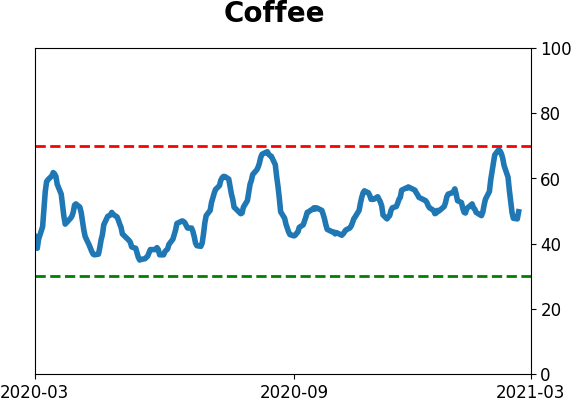
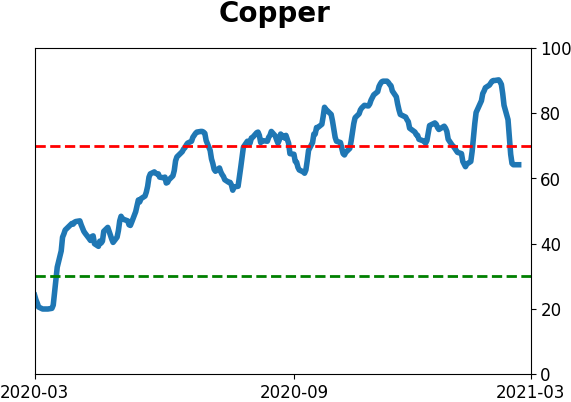
Optimism Index Thumbnails
|
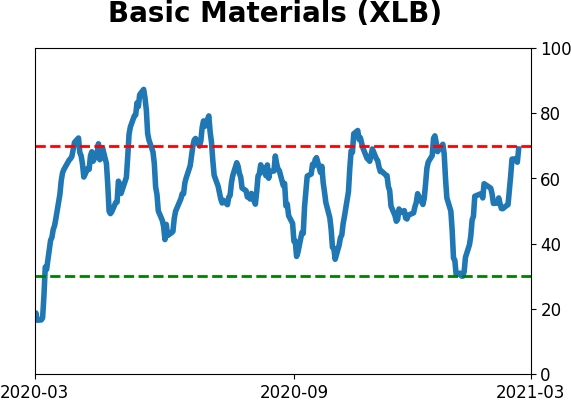
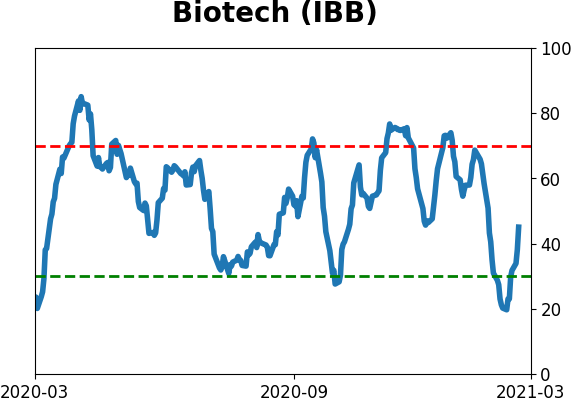
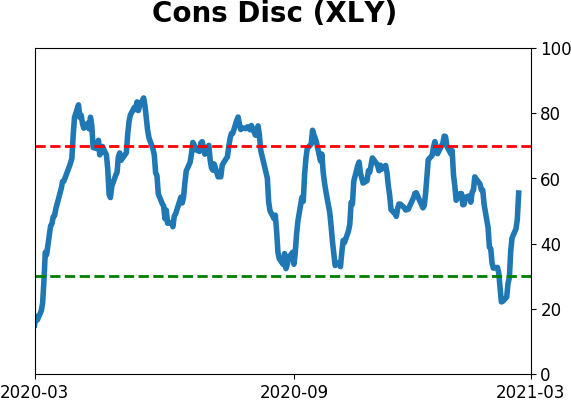
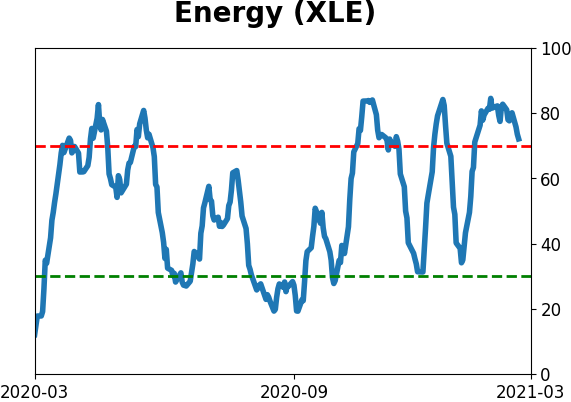
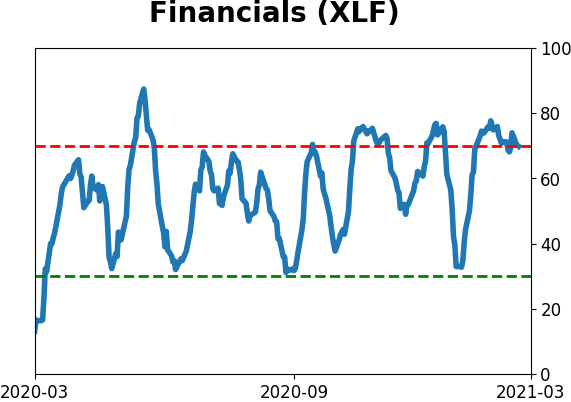
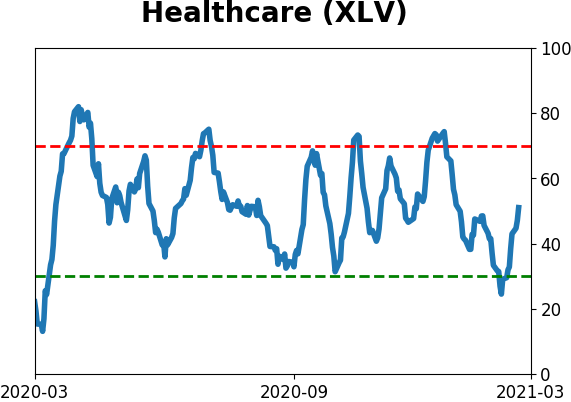
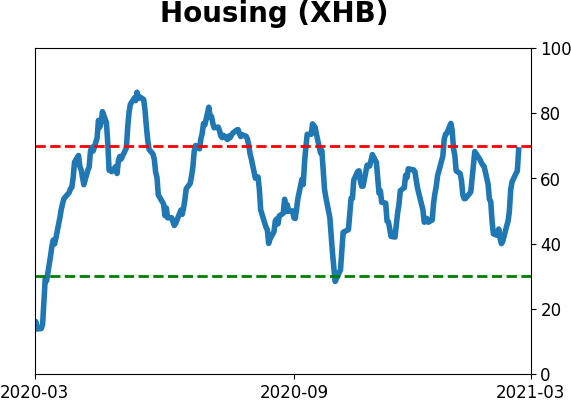
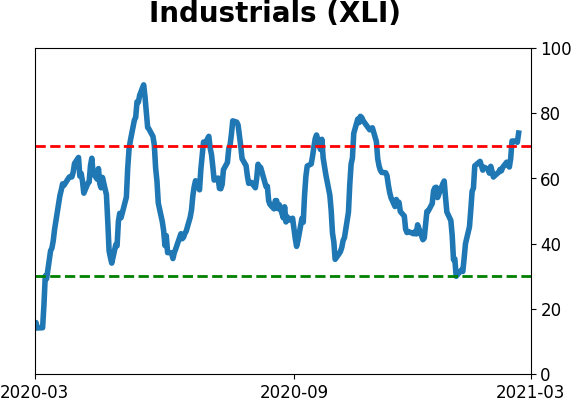
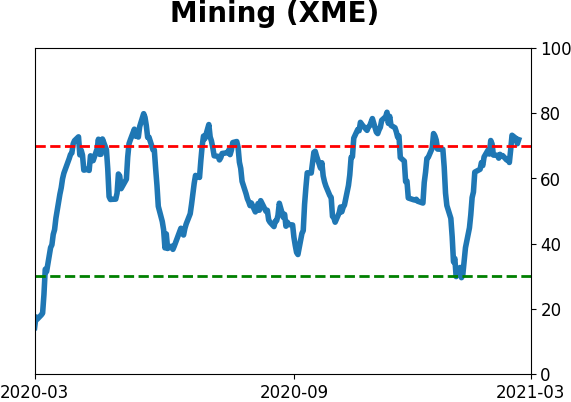
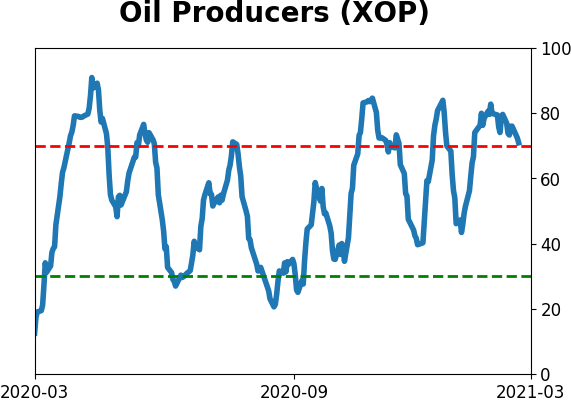
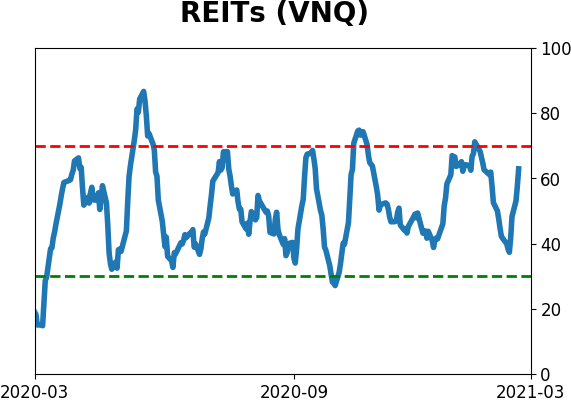
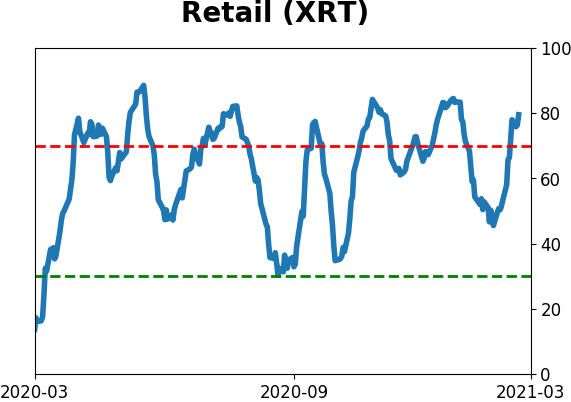
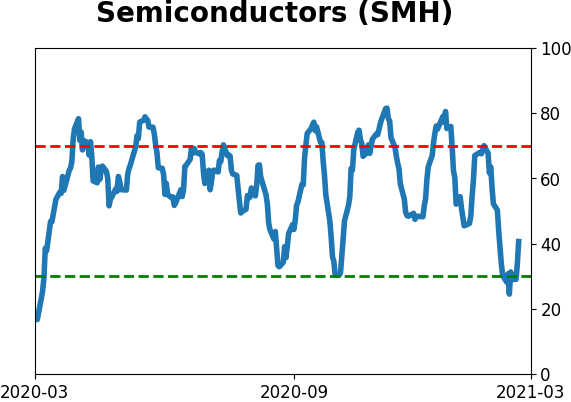
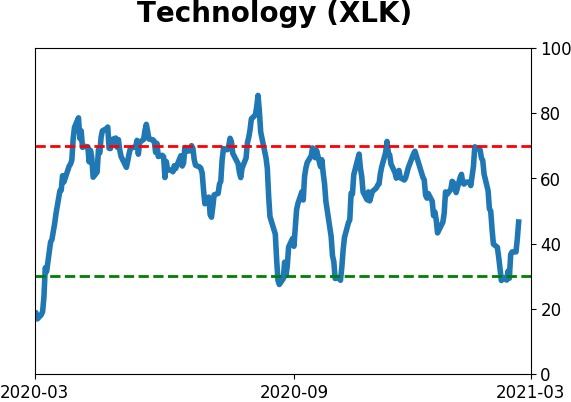
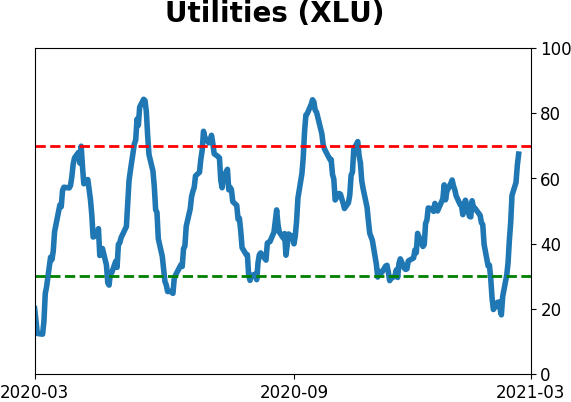
Sector ETF's - 10-Day Moving Average
|
|
|
Country ETF's - 10-Day Moving Average
|
|
|
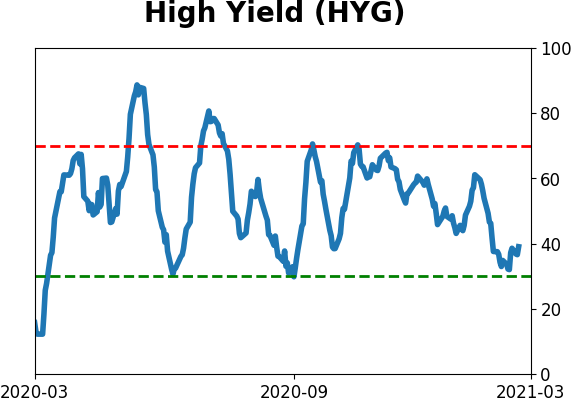
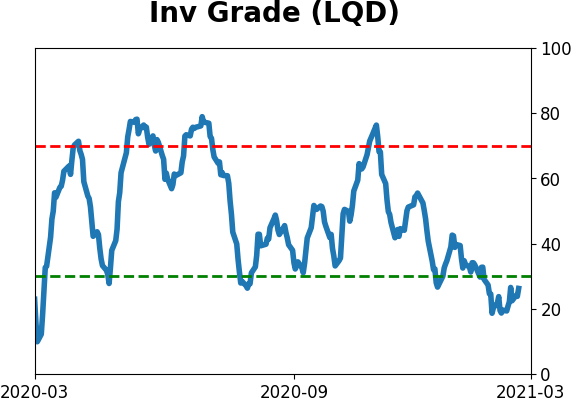
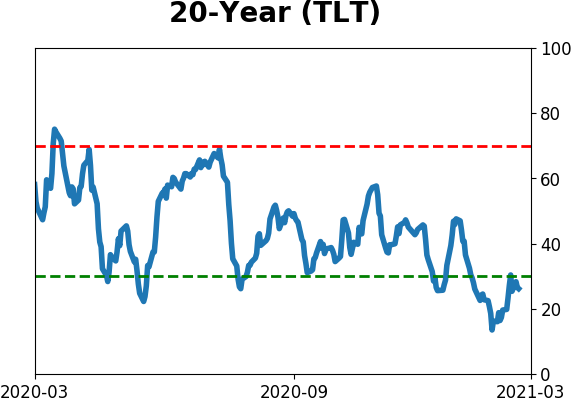
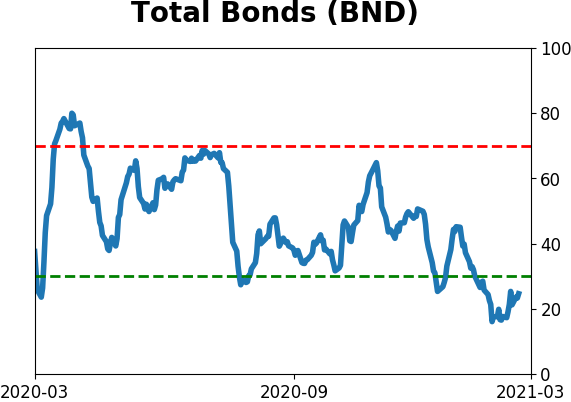
Bond ETF's - 10-Day Moving Average
|
|
|
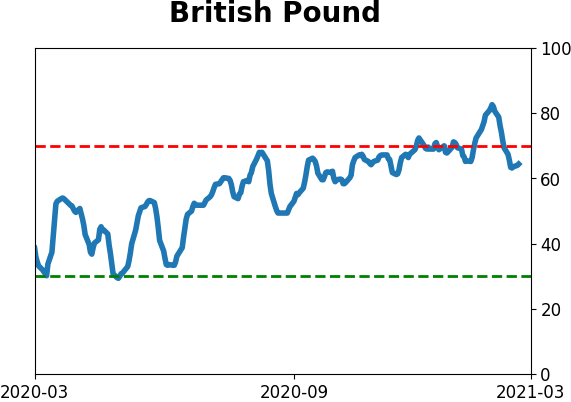
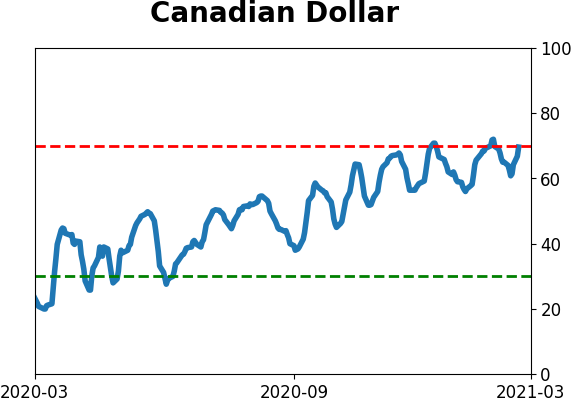
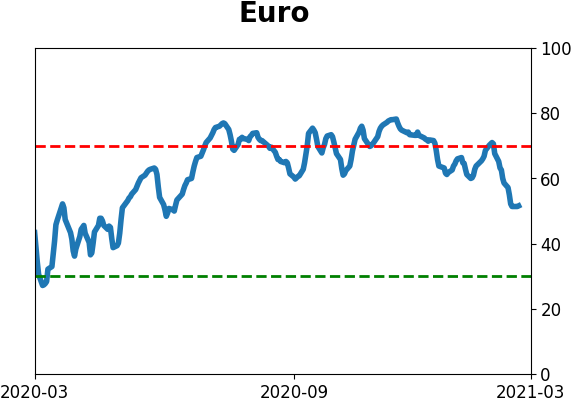
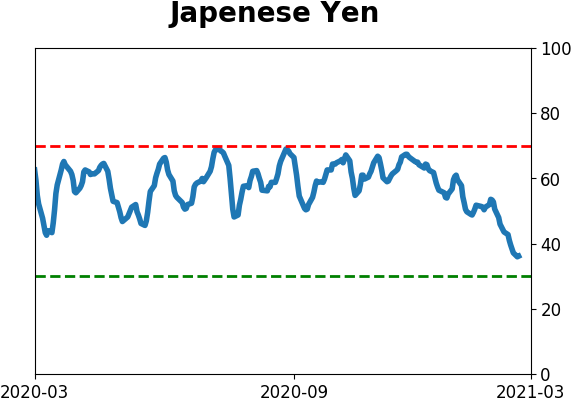
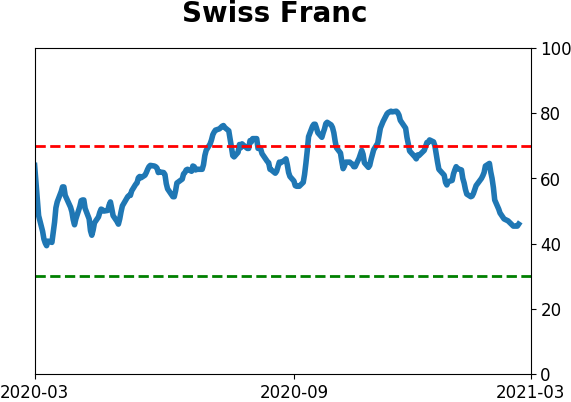
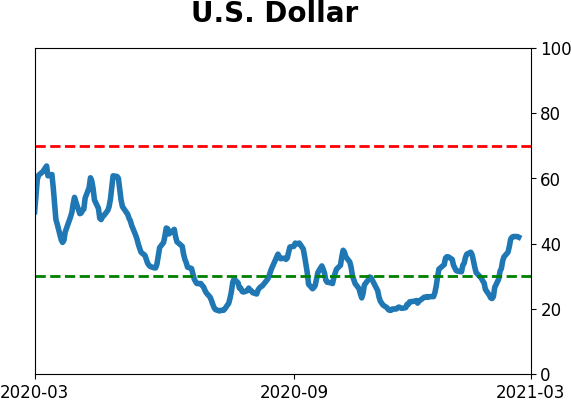
Currency ETF's - 5-Day Moving Average
|
|
|
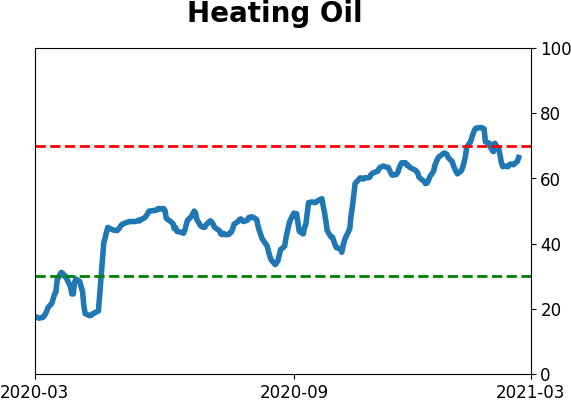
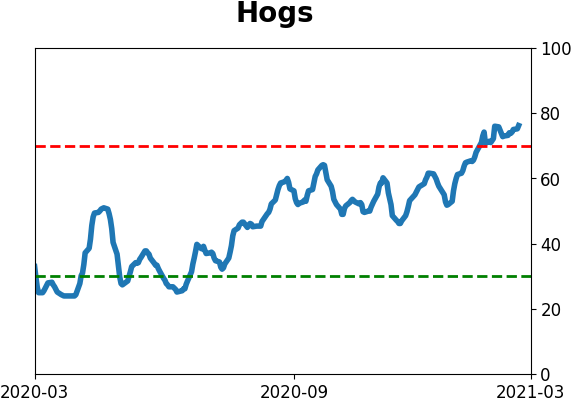
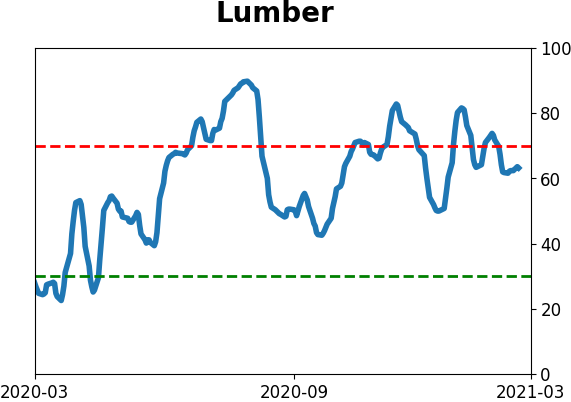
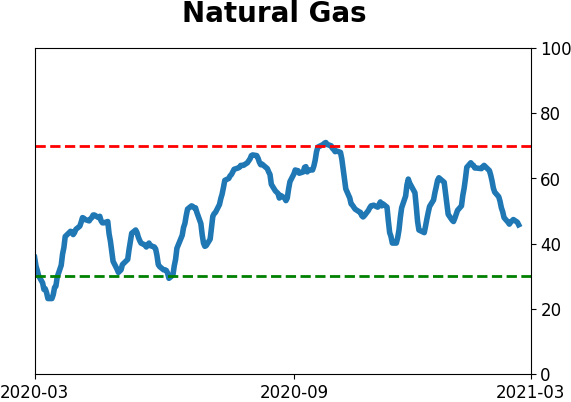
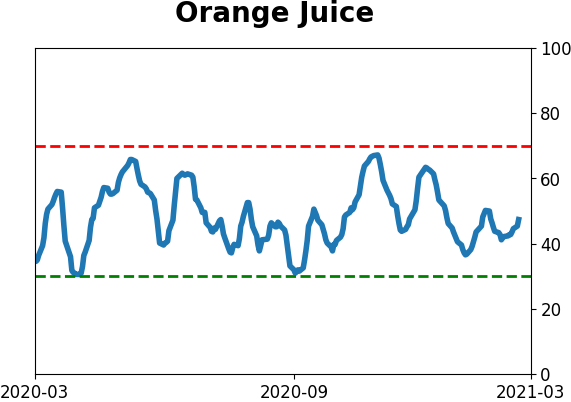
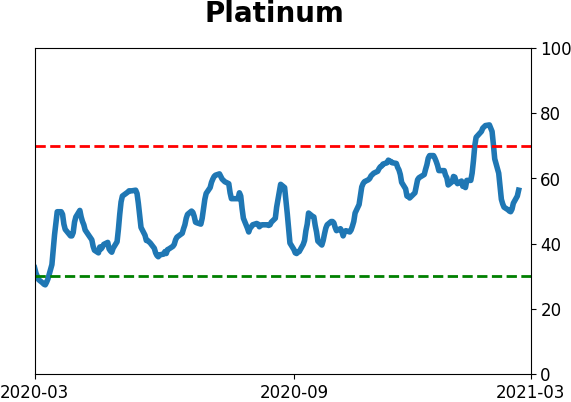
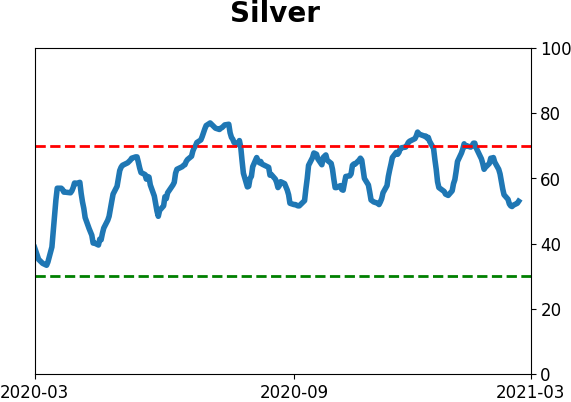
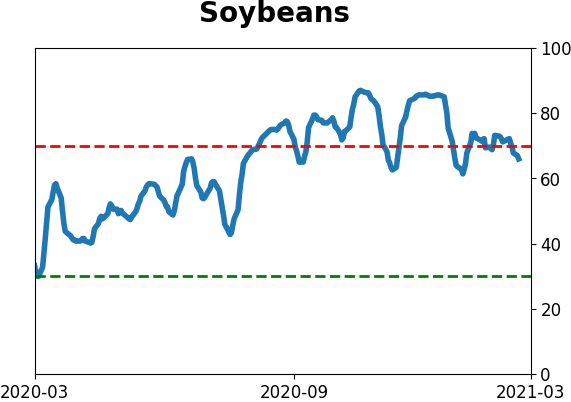
Commodity ETF's - 5-Day Moving Average
|
|