Headlines
|
|
When rising yields are driving volatility:
Over the past month, the correlation between the VIX and 10-year Treasury yields has soared to one of the highest levels in a decade, suggesting bonds are influencing stock investors' expectations for future volatility. This has been a mild negative for stocks.
Bottom Line:
See the Outlook & Allocations page for more details on these summaries STOCKS: Weak sell
The extreme speculation registered in January and February is starting to get wrung out. Internal dynamics have mostly held up, so a return to neutral sentiment conditions would improve the forward risk/reward profile substantially. We're still a ways off from that. BONDS: Weak buy
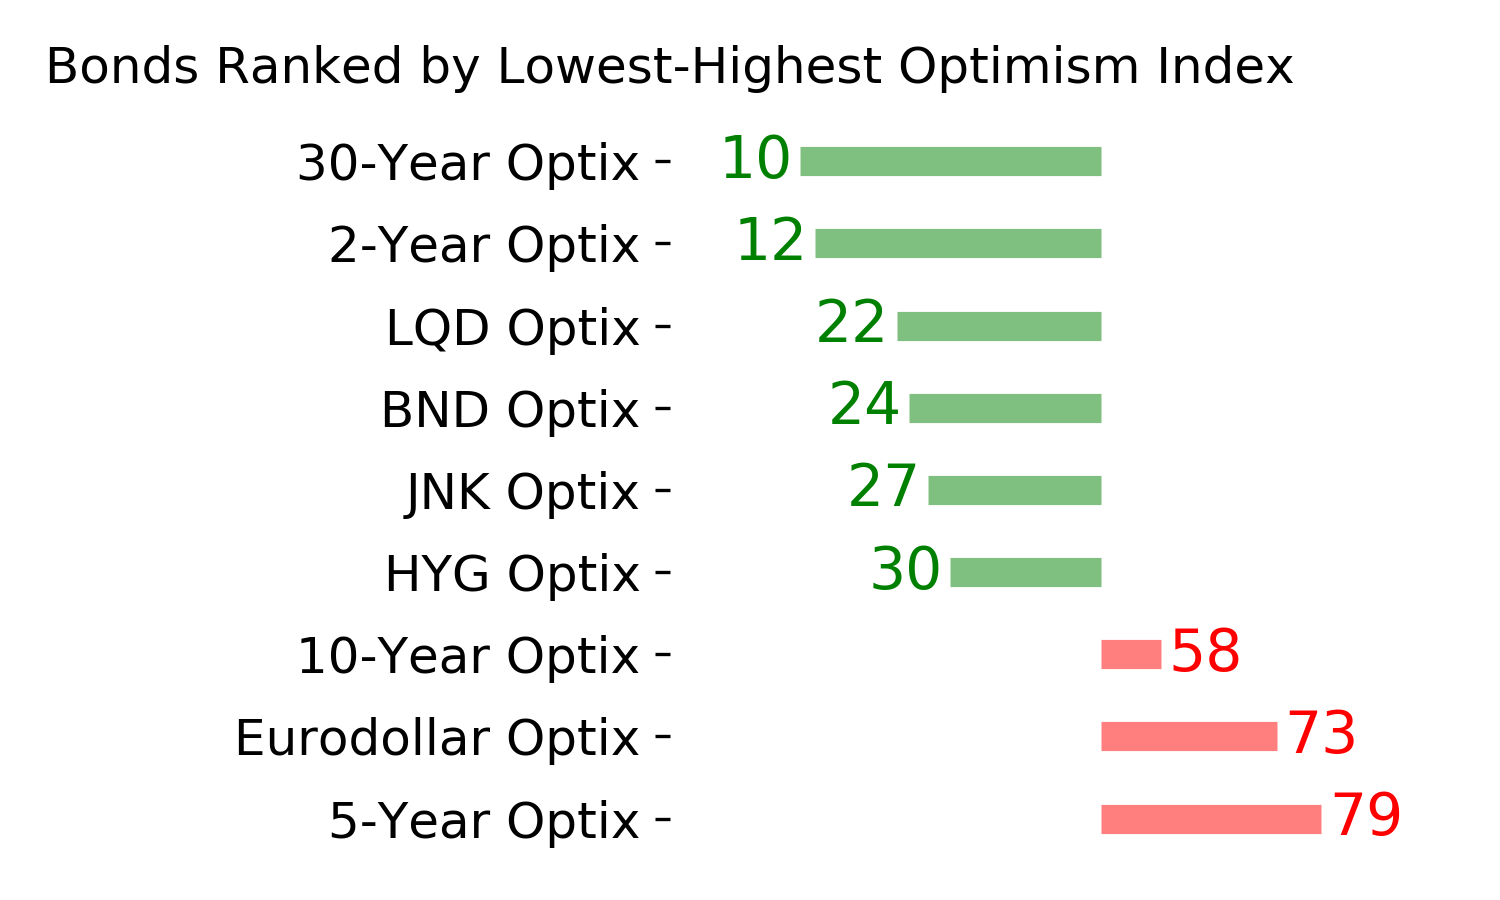
Various parts of the market have been hit in recent weeks, with mild oversold conditions. The Bond Optimism Index is now about as low as it gets during healthy bond market environments. Fixed income isn't responding well, so that needs to be monitored in case it's transitioning to a longer-term negative market environment. GOLD: Weak buy
A dollar trying to rebound from a severe short position has weighed on gold and miners. The types of signals they've given in recent weeks, within the context of their recent surge, have usually resulted in higher prices over a medium- to long-term time frame. Like bonds, gold and miners aren't responding very well, and this needs to be monitored.
|
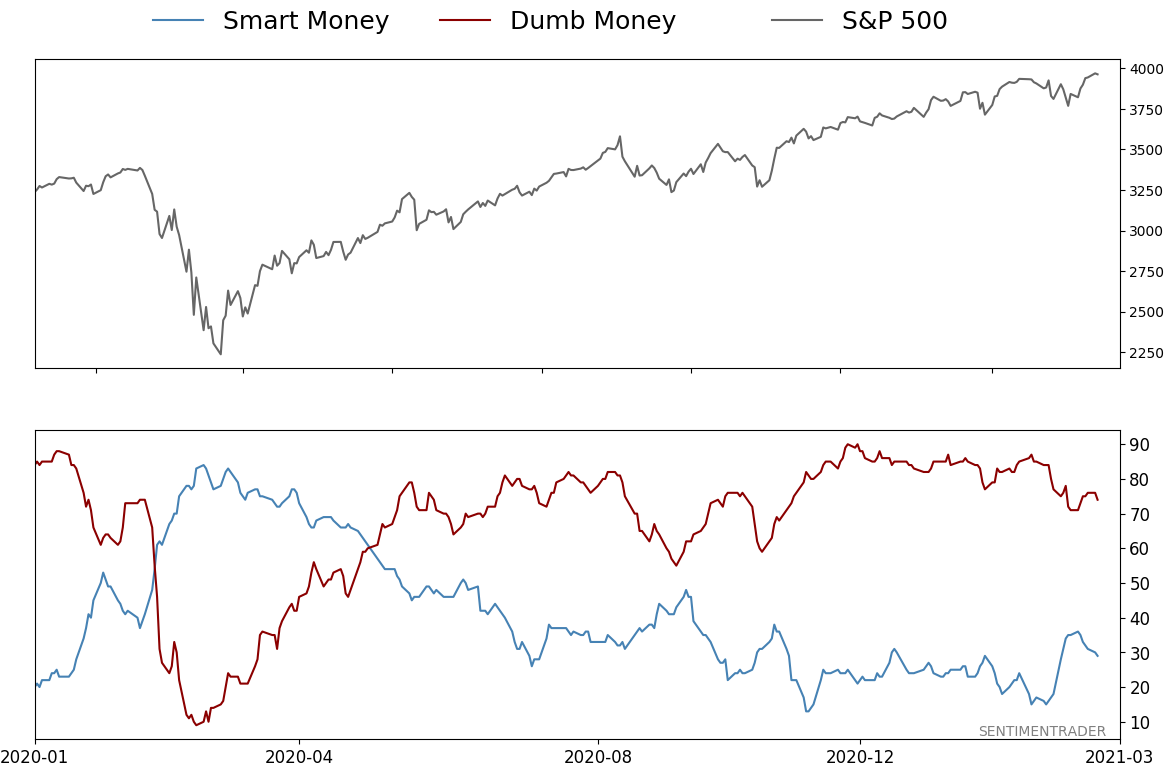
Smart / Dumb Money Confidence
|
Smart Money Confidence: 29%
Dumb Money Confidence: 74%
|
|
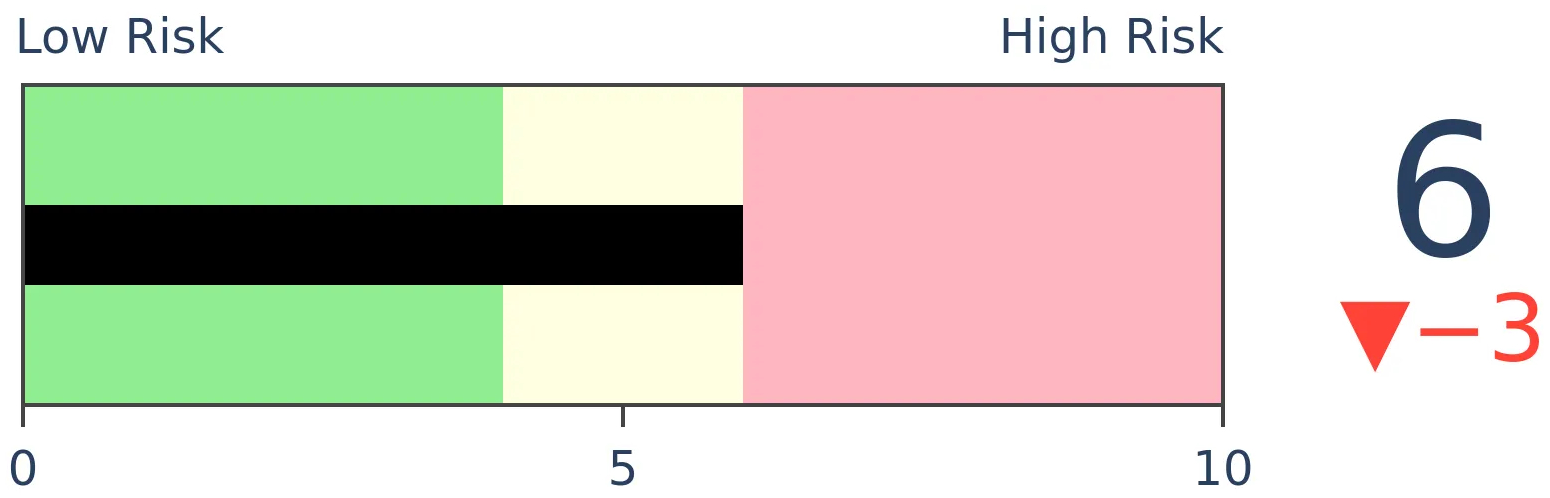
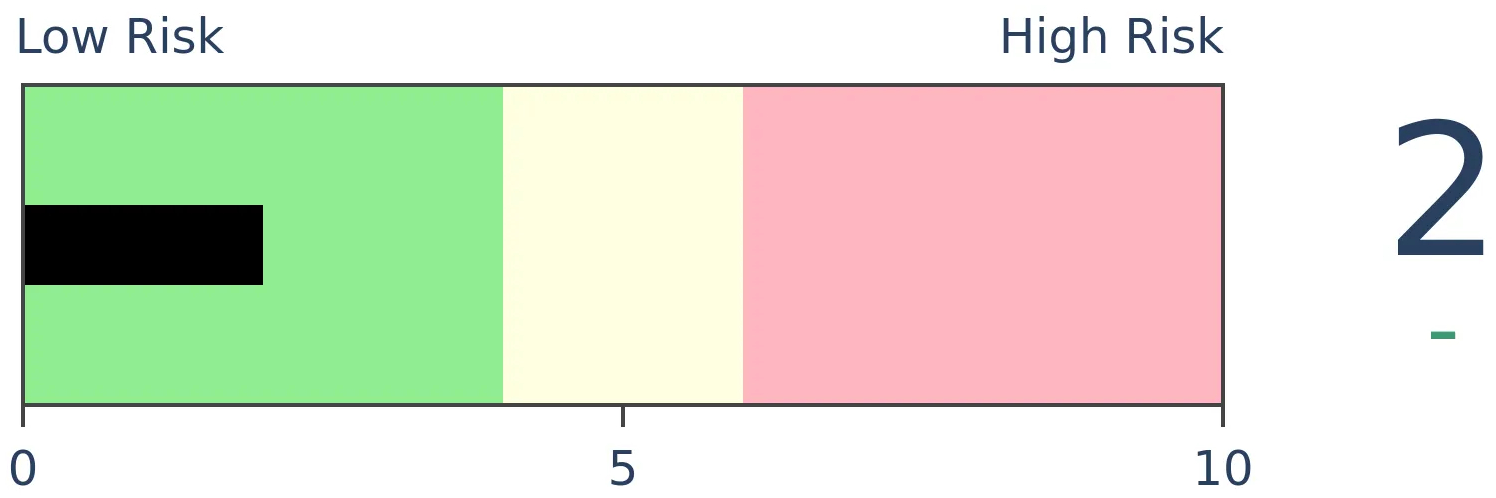
Risk Levels
Stocks Short-Term
|
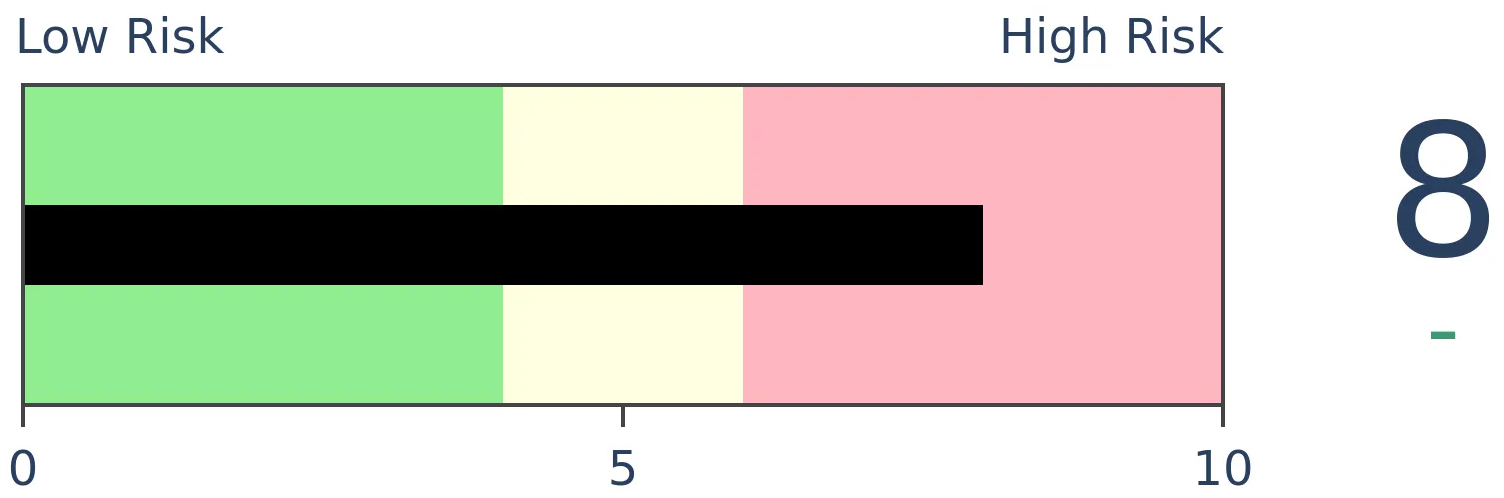
Stocks Medium-Term

|
|
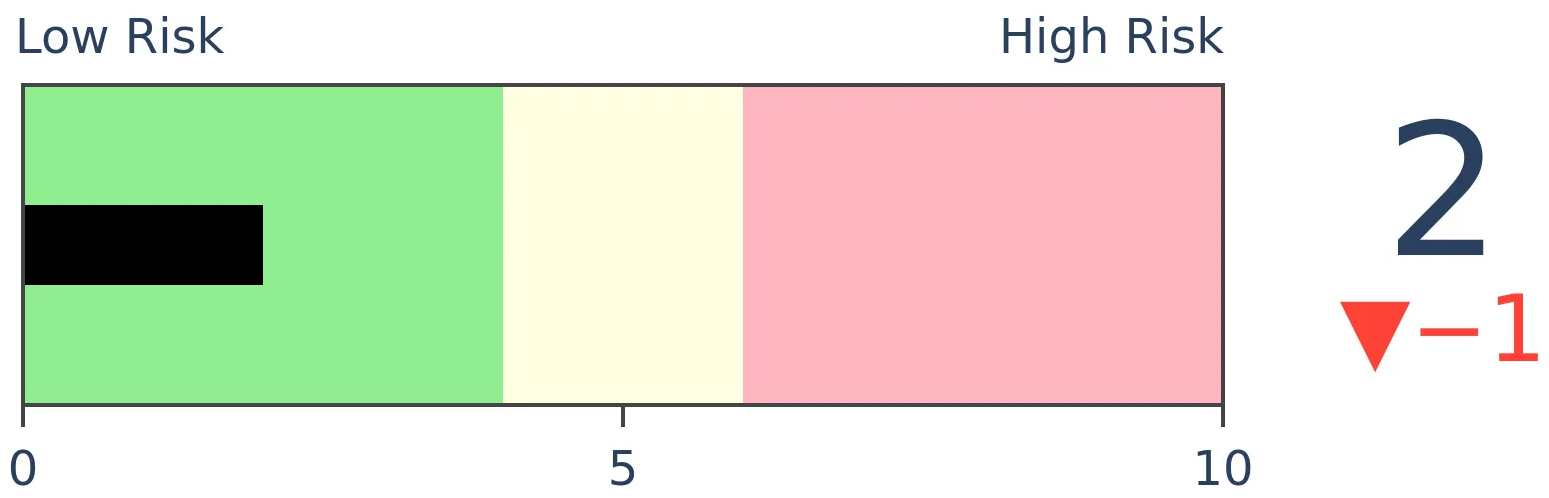
Bonds
|
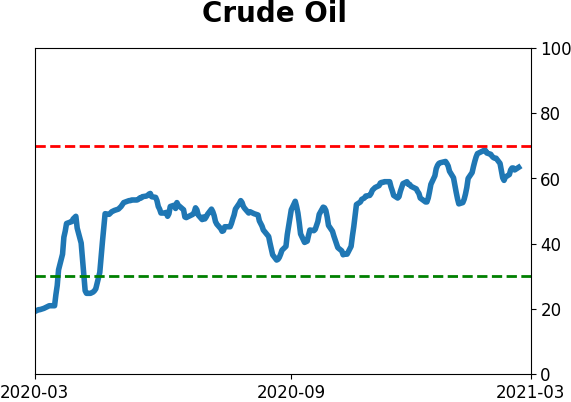
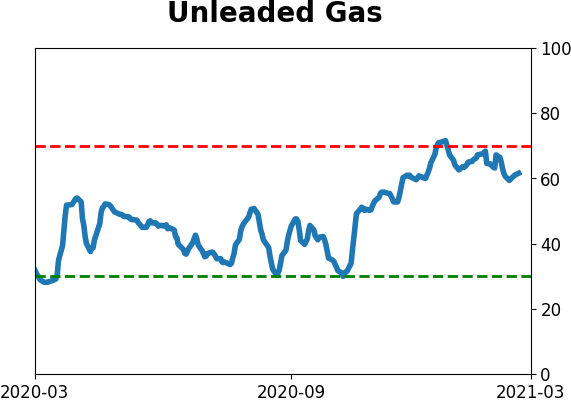
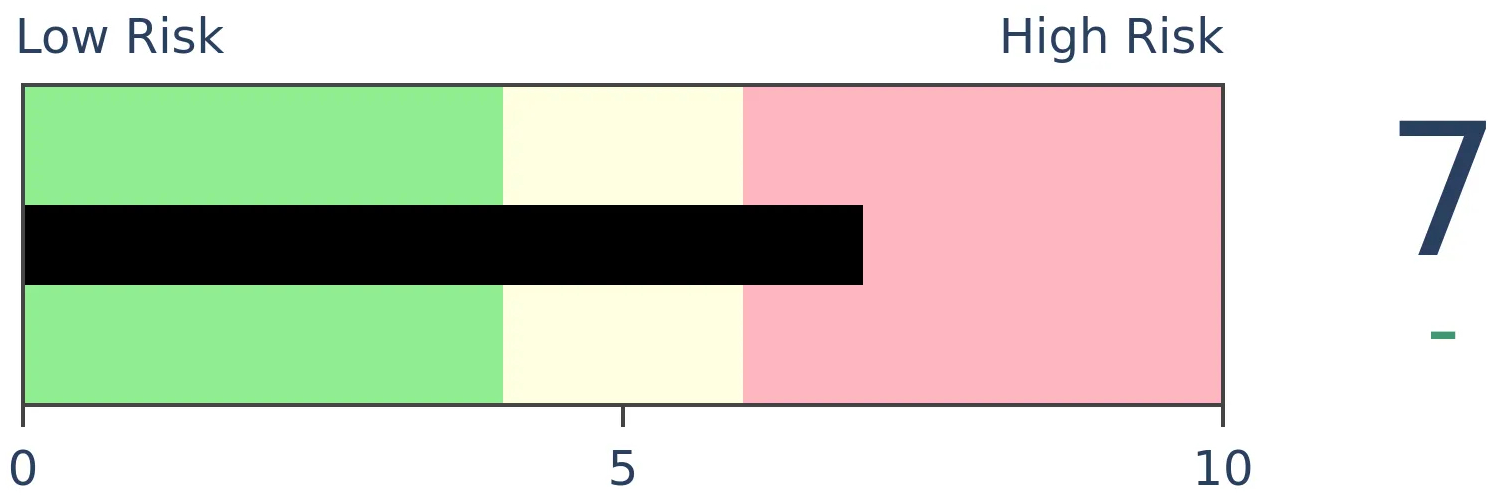
Crude Oil
|
|
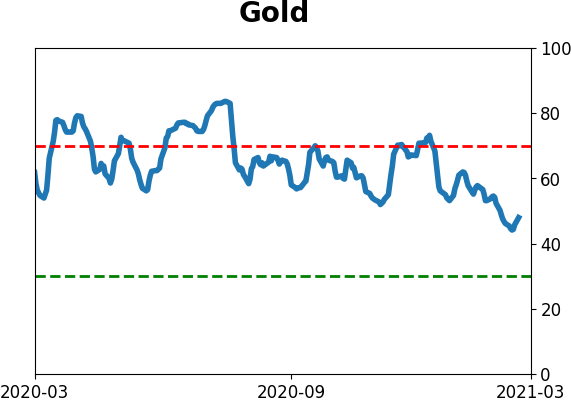
Gold
|
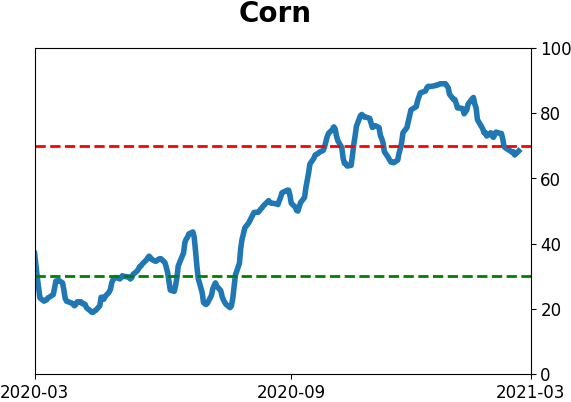
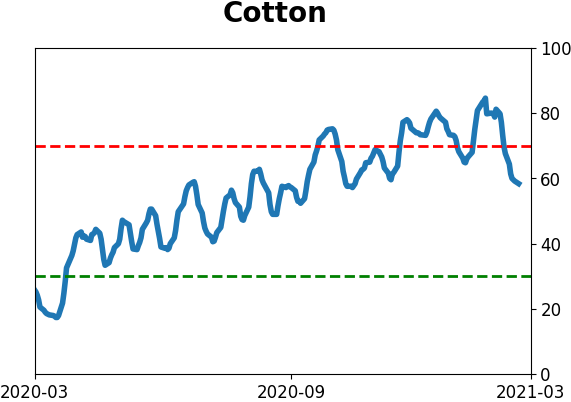
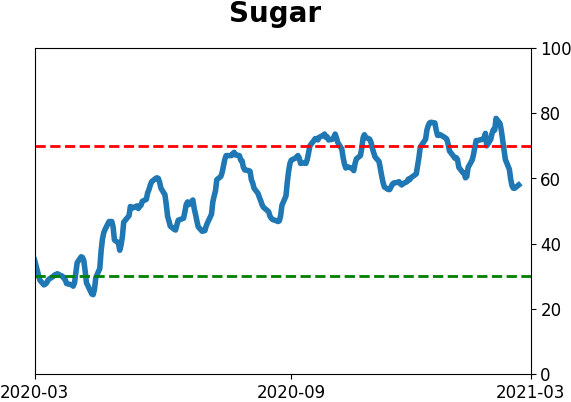
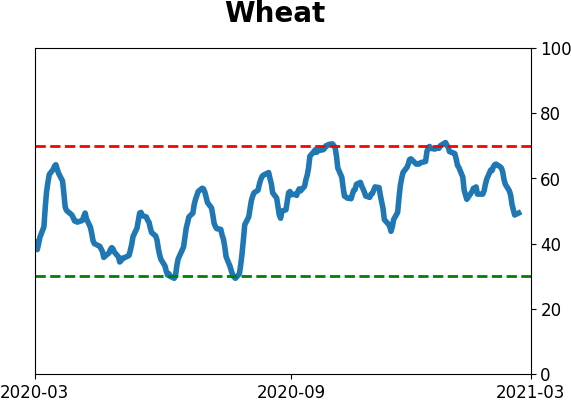
Agriculture
|
|
Research
BOTTOM LINE
Over the past month, the correlation between the VIX and 10-year Treasury yields has soared to one of the highest levels in a decade, suggesting bonds are influencing stock investors' expectations for future volatility. This has been a mild negative for stocks.
FORECAST / TIMEFRAME
None
|
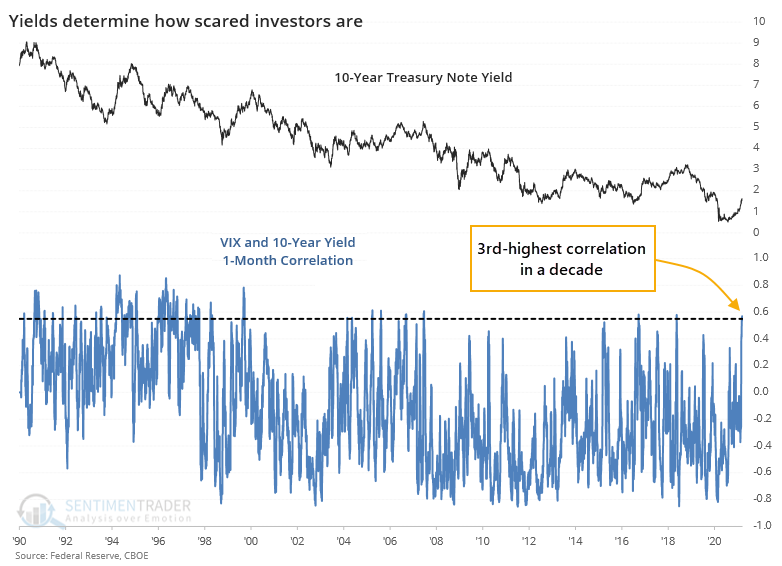
What's been scaring investors over the past month? Rising yields.
Maybe "scared" isn't the right word, since the VIX indicator, which measures options traders' estimate of future volatility, has mostly been dropping. So "influencing" is probably more appropriate. And over the past month, yields have been influencing the VIX at one of the highest levels in a decade.
The chart below shows a rolling 1-month correlation between daily changes in the VIX and 10-year Treasury yields. The higher the blue line, the more that yields seem to be influencing stock investors' volatility expectations.
Whether this matters is open to interpretation. So, let's put some numbers to it. We'll go back to the inception of the VIX and look for every time the 21-day correlation in daily changes between it and the yield on 10-year notes exceeds 0.55. This is on a scale of -1.0 (perfect inverse correlation) to +1.0 (perfect positive correlation).
The table below shows only the instances when yields have risen the most over the past month.
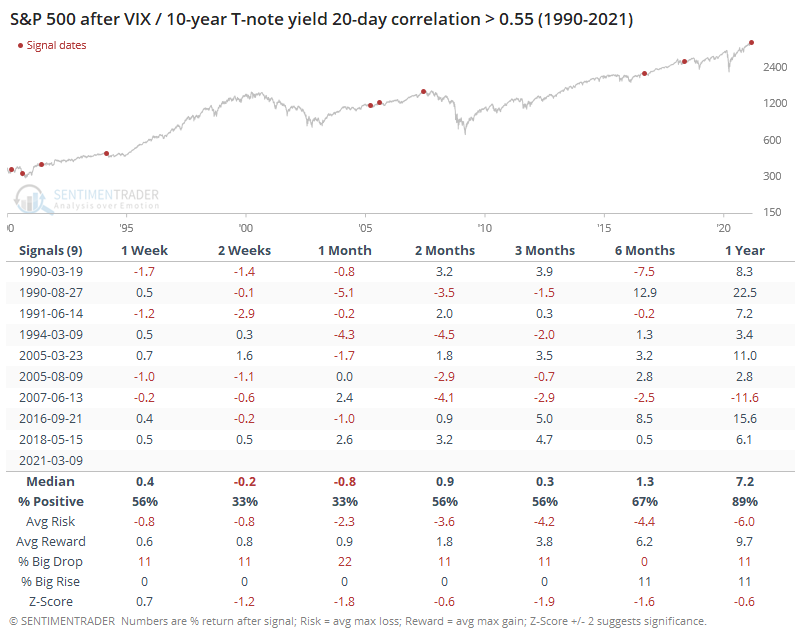
When rising yields most influenced the VIX, the S&P 500 struggled a bit over the next 2-3 weeks. All but one instance, the latest one in 2018, showed a negative return either 1 or 2 months later. And even that 2018 signal ended up giving its gains back eventually. Over the next 3 months, the S&P averaged a return of only +0.3%.
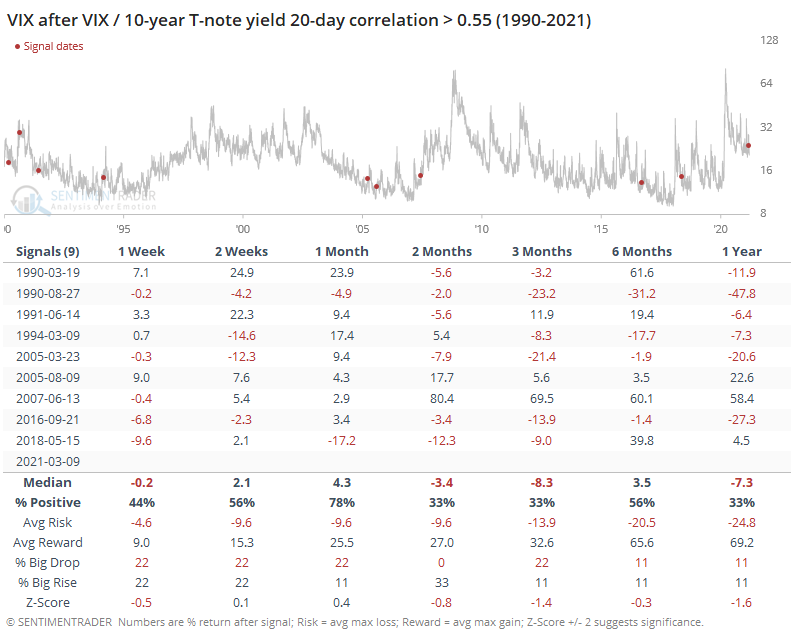
For the VIX itself, it was a mixed signal. It shows losses across most time frames, with the biggest chance for a spike being over the next month.
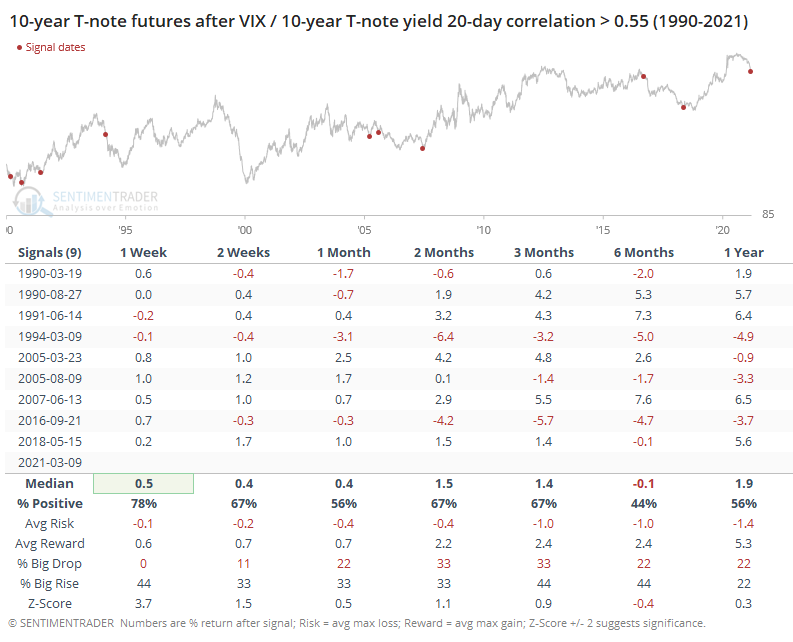
For Treasuries, it tended to be more of a shorter-term positive. Because yields were rising, that means note and bond prices were declining, and when the correlation with the VIX got to this high of a level, it mostly coincided with shorter-term oversold conditions in bonds.
It's often helpful to look at opposing conditions, so the table below shows returns in the S&P when the VIX and yields were highly correlated, but it was due to declining yields, not rising ones.
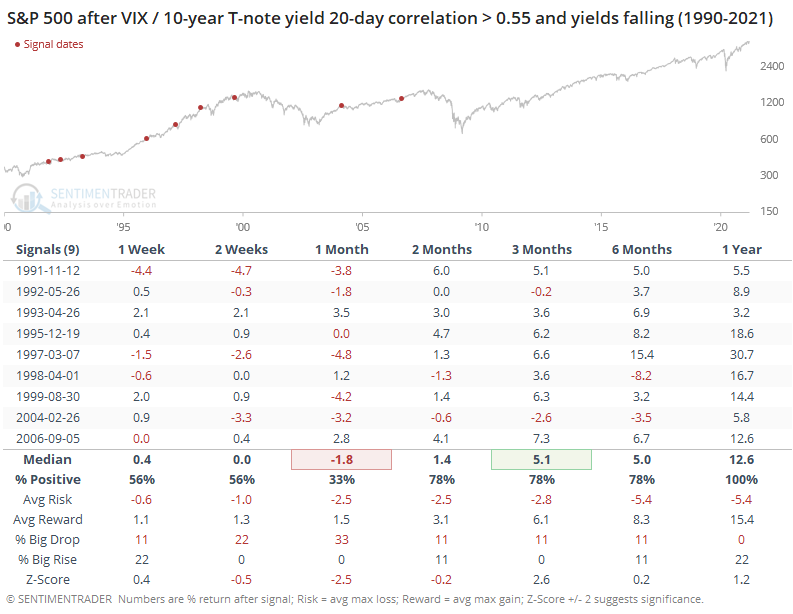
Here, shorter-term returns were still sketchy, but over the next few months, the S&P averaged a return of +5.1% (versus only 0.3% when yields were rising more), and over the next year, showed a gain every time.
Opinions on what the rise in yields means for investors are all over the place. At least, we can suggest with a mild amount of confidence that when rising yields have been a primary force driving forward volatility expectations, then stocks have struggled more than when they were fearing the economic stagnation that lower yields would suggest.
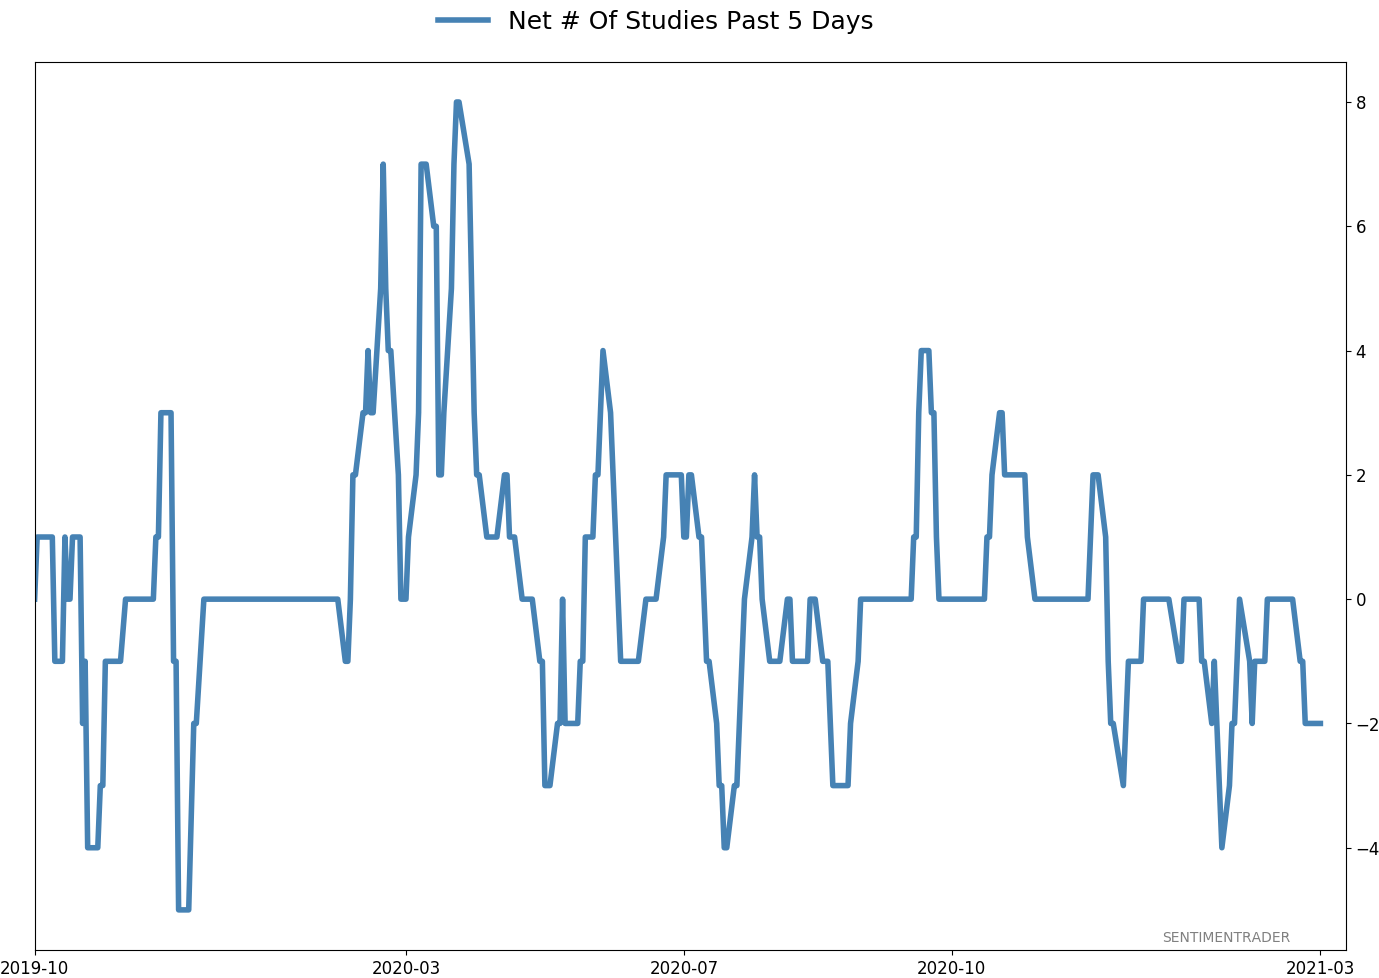
Active Studies
| Time Frame | Bullish | Bearish | | Short-Term | 0 | 0 | | Medium-Term | 2 | 10 | | Long-Term | 16 | 4 |
|
Indicators at Extremes
Portfolio
| Position | Description | Weight % | Added / Reduced | Date | | Stocks | RSP | 4.9 | Reduced 4% | 2021-02-09 | | Bonds | 30.0% BND, 8.8% SCHP | 38.8 | Added 15.1% | 2021-02-18 | | Commodities | GCC | 2.3 | Reduced 2.1%
| 2020-09-04 | | Precious Metals | GDX | 9.0 | Added 0.1% | 2021-02-18 | | Special Situations | 7.3% XLE, 4.8% PSCE | 12.1 | Reduced 5.6% | 2021-02-18 | | Cash | | 32.8 | | |
|
Updates (Changes made today are underlined)
With a market that has seen the kinds of broad participation and big breath thrusts like we did in the fall, it's hard to become too negative. Those kinds of conditions have consistently preceded higher returns over the next 6-12 months. It's the interim that's more of an issue. Even conditions like that haven't prevented some shorter-term pullbacks. And when we combine an environment where speculation is rampant and recent days have seen an increase in cracks under the surface of the indexes, it's enough to become more defensive over a short- to medium-term time frame. We still don't have much confirmation from the price action in the indexes, so those who are more conservative would likely wait before increasing cash levels. I've decreased risk exposure a bit more, mainly in terms of energy stocks and the ANGL fund, while adding more to the broader bond market. RETURN YTD: 6.8% 2020: 8.1%, 2019: 12.6%, 2018: 0.6%, 2017: 3.8%, 2016: 17.1%, 2015: 9.2%, 2014: 14.5%, 2013: 2.2%, 2012: 10.8%, 2011: 16.5%, 2010: 15.3%, 2009: 23.9%, 2008: 16.2%, 2007: 7.8%
|
|
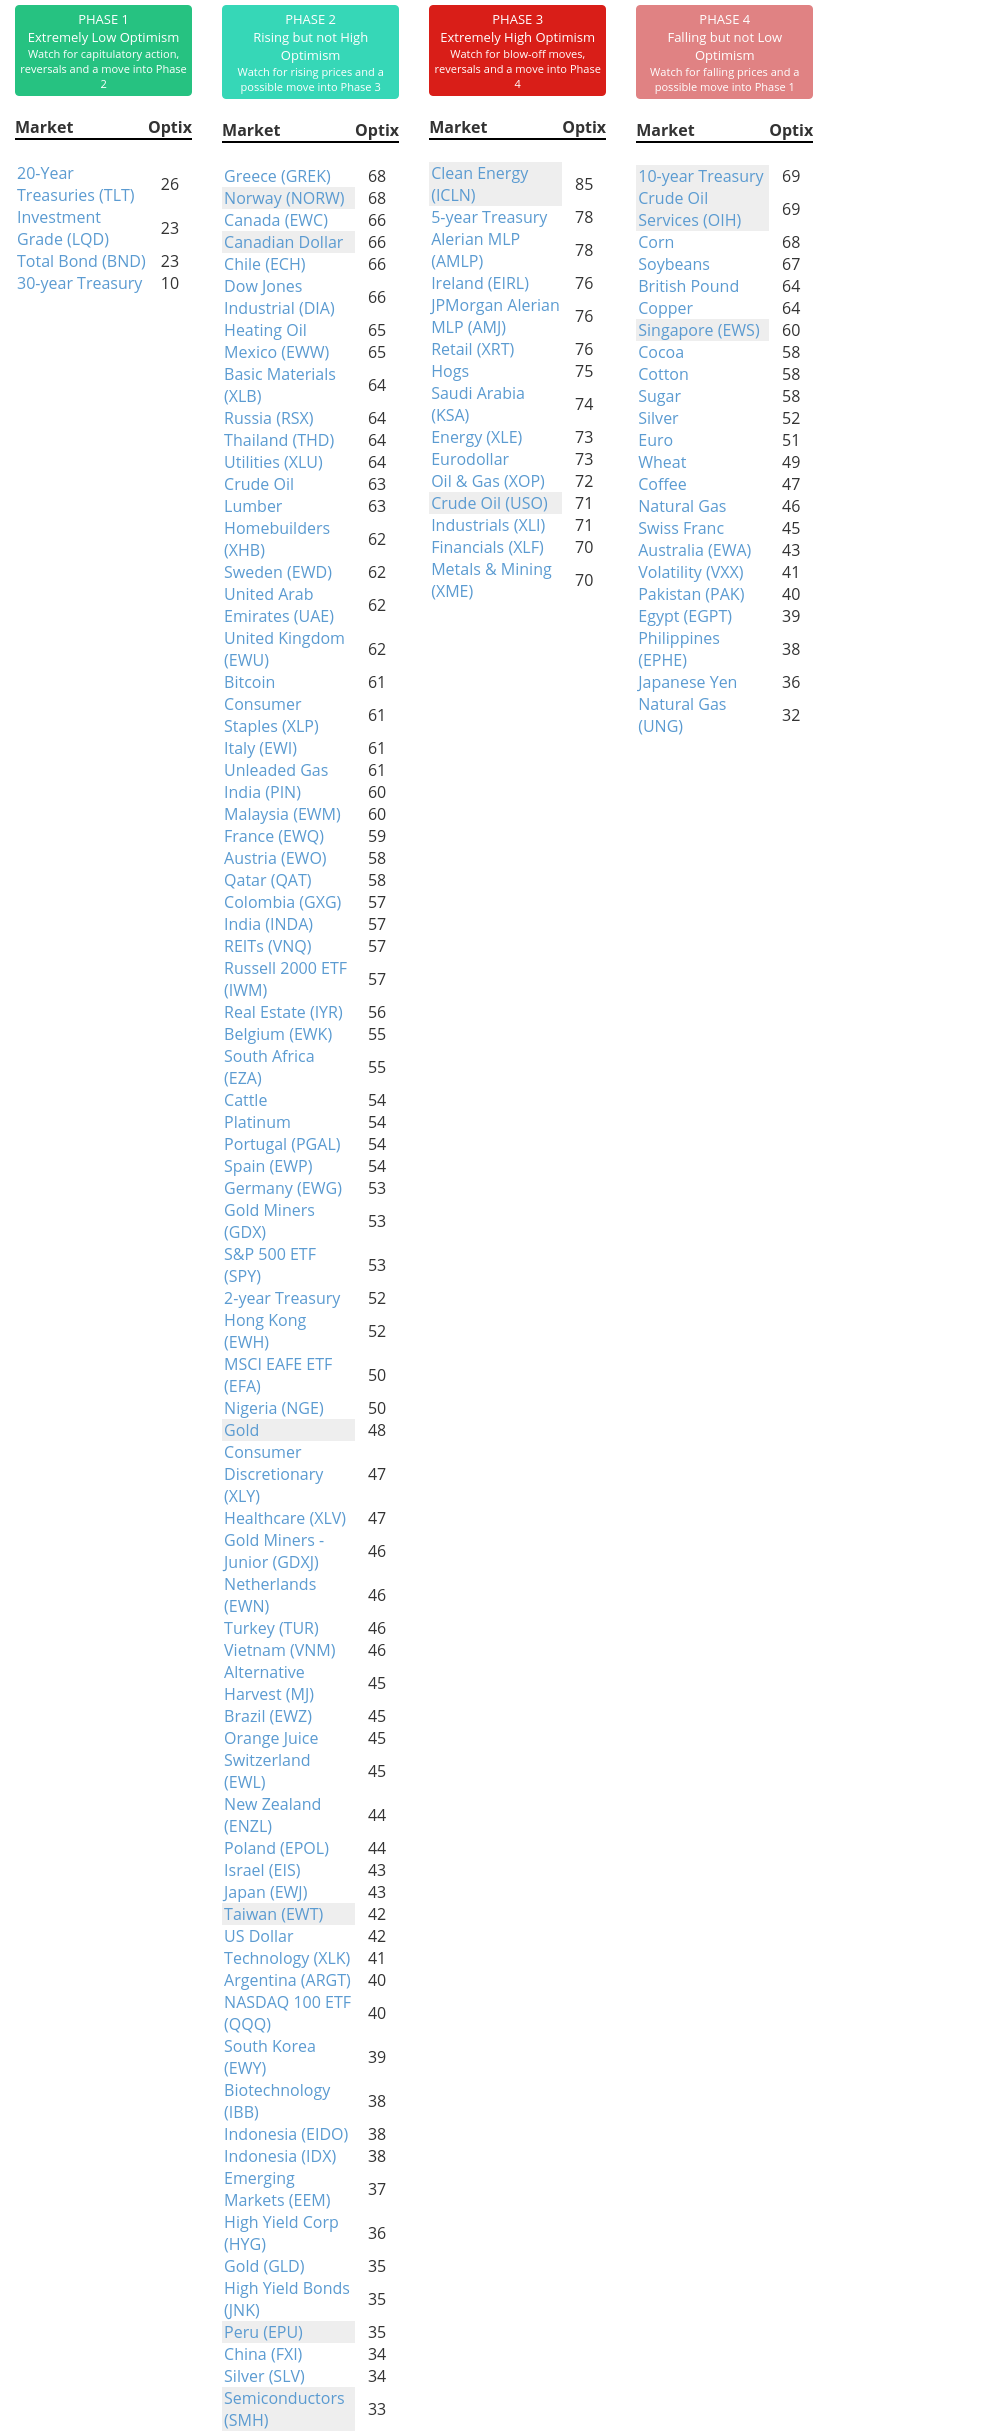
Phase Table
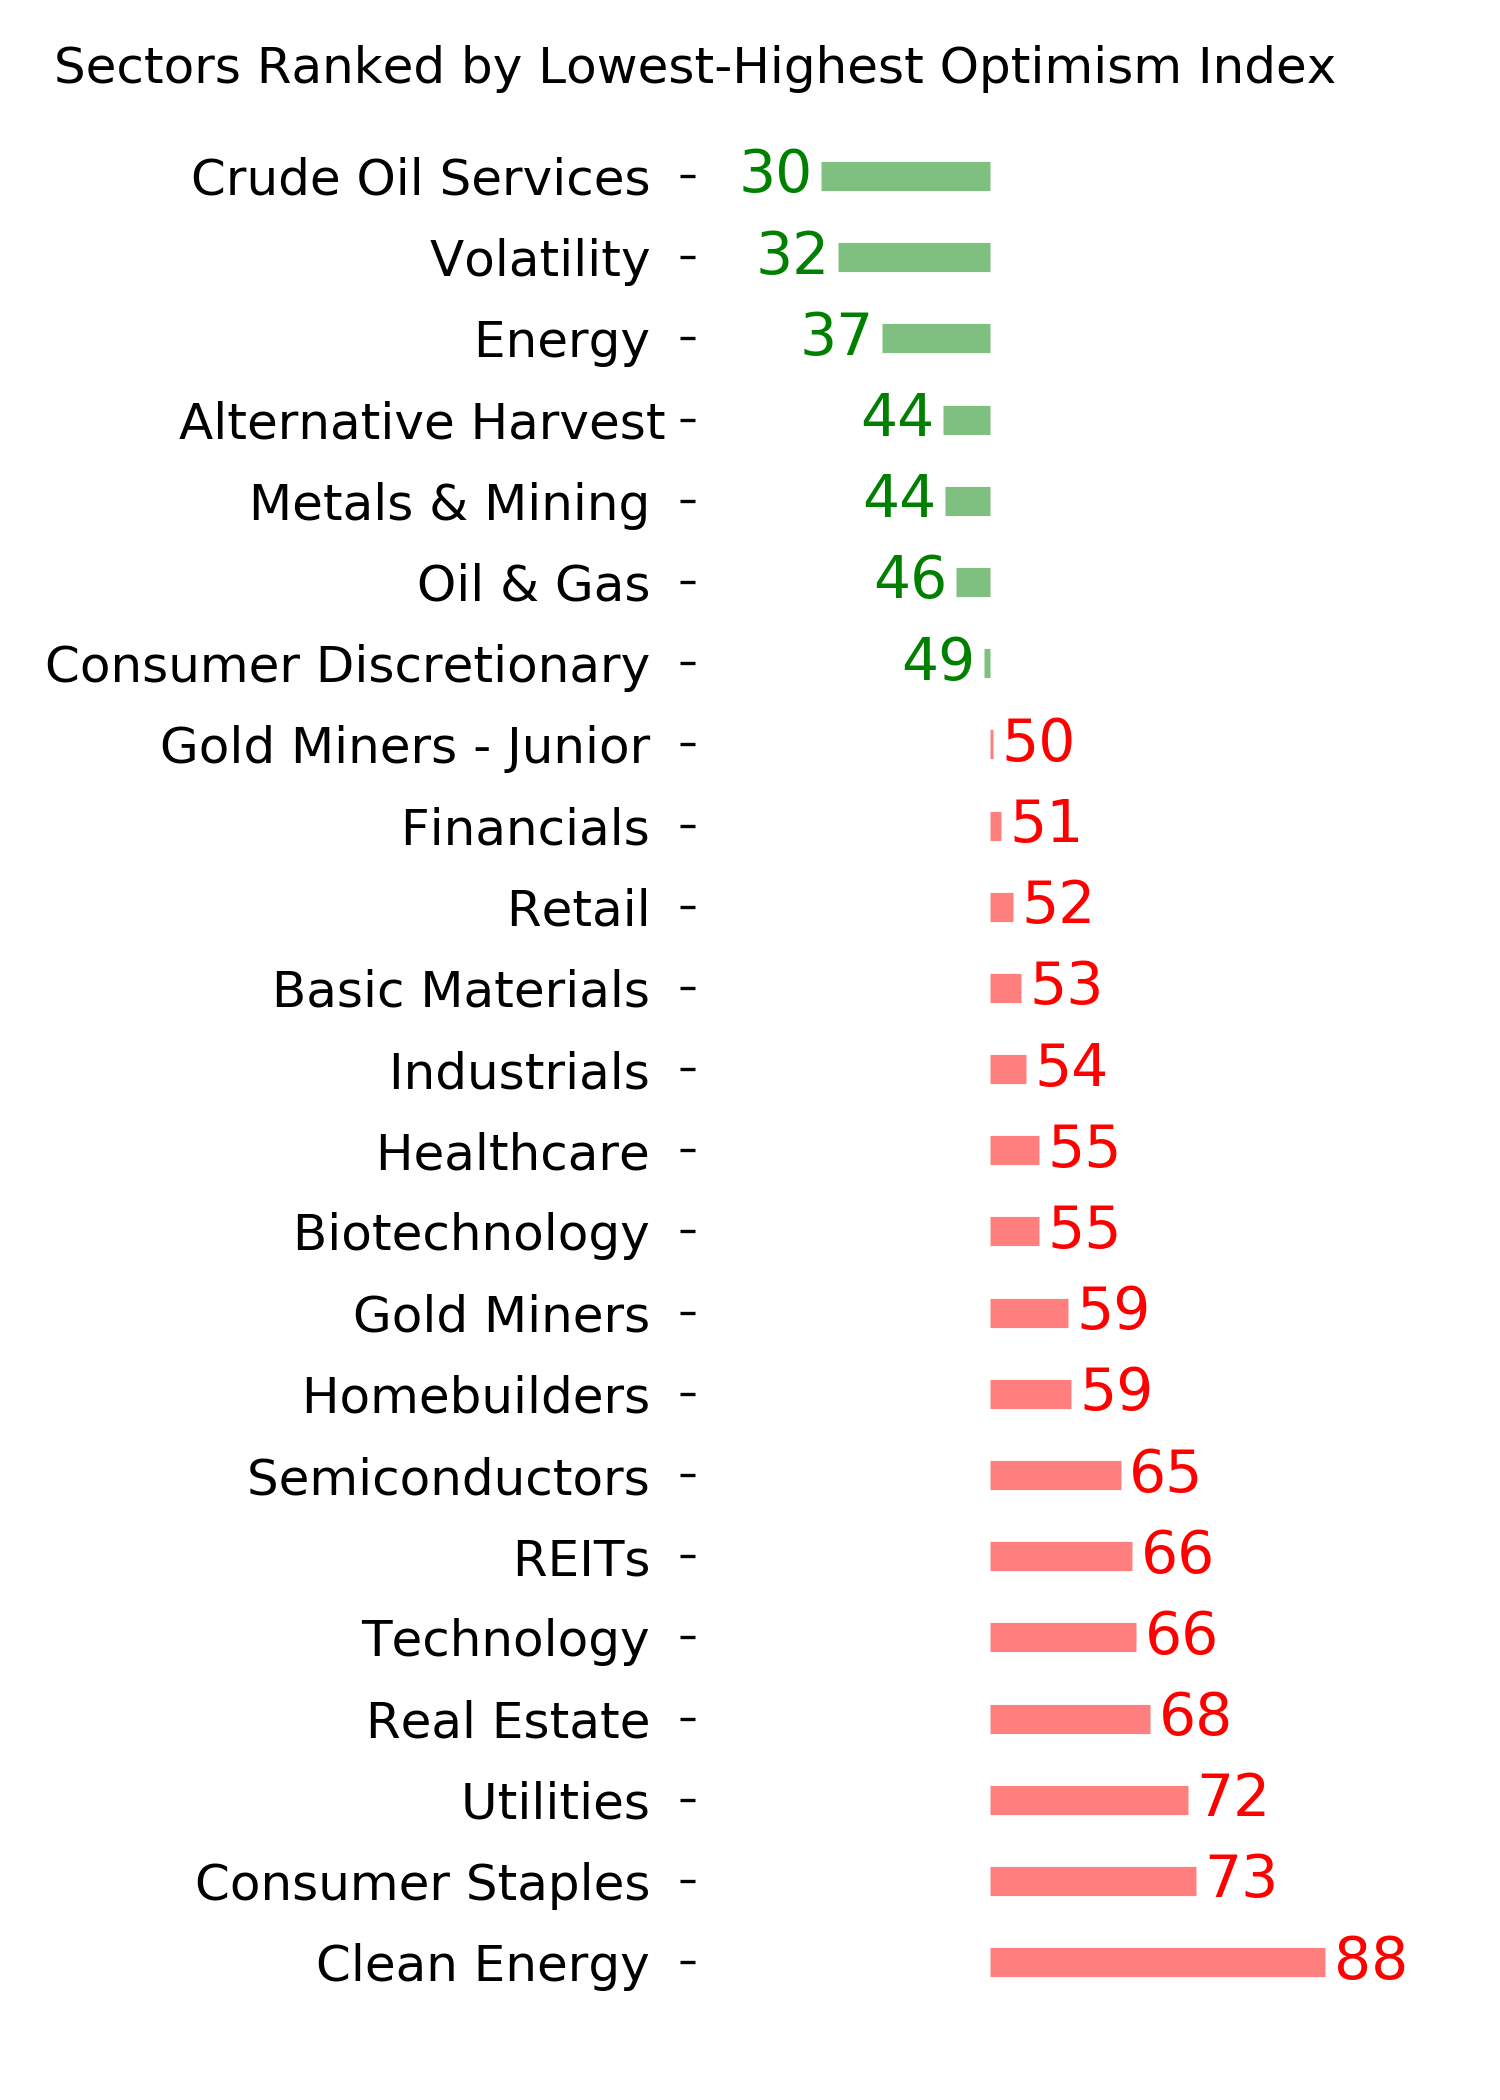
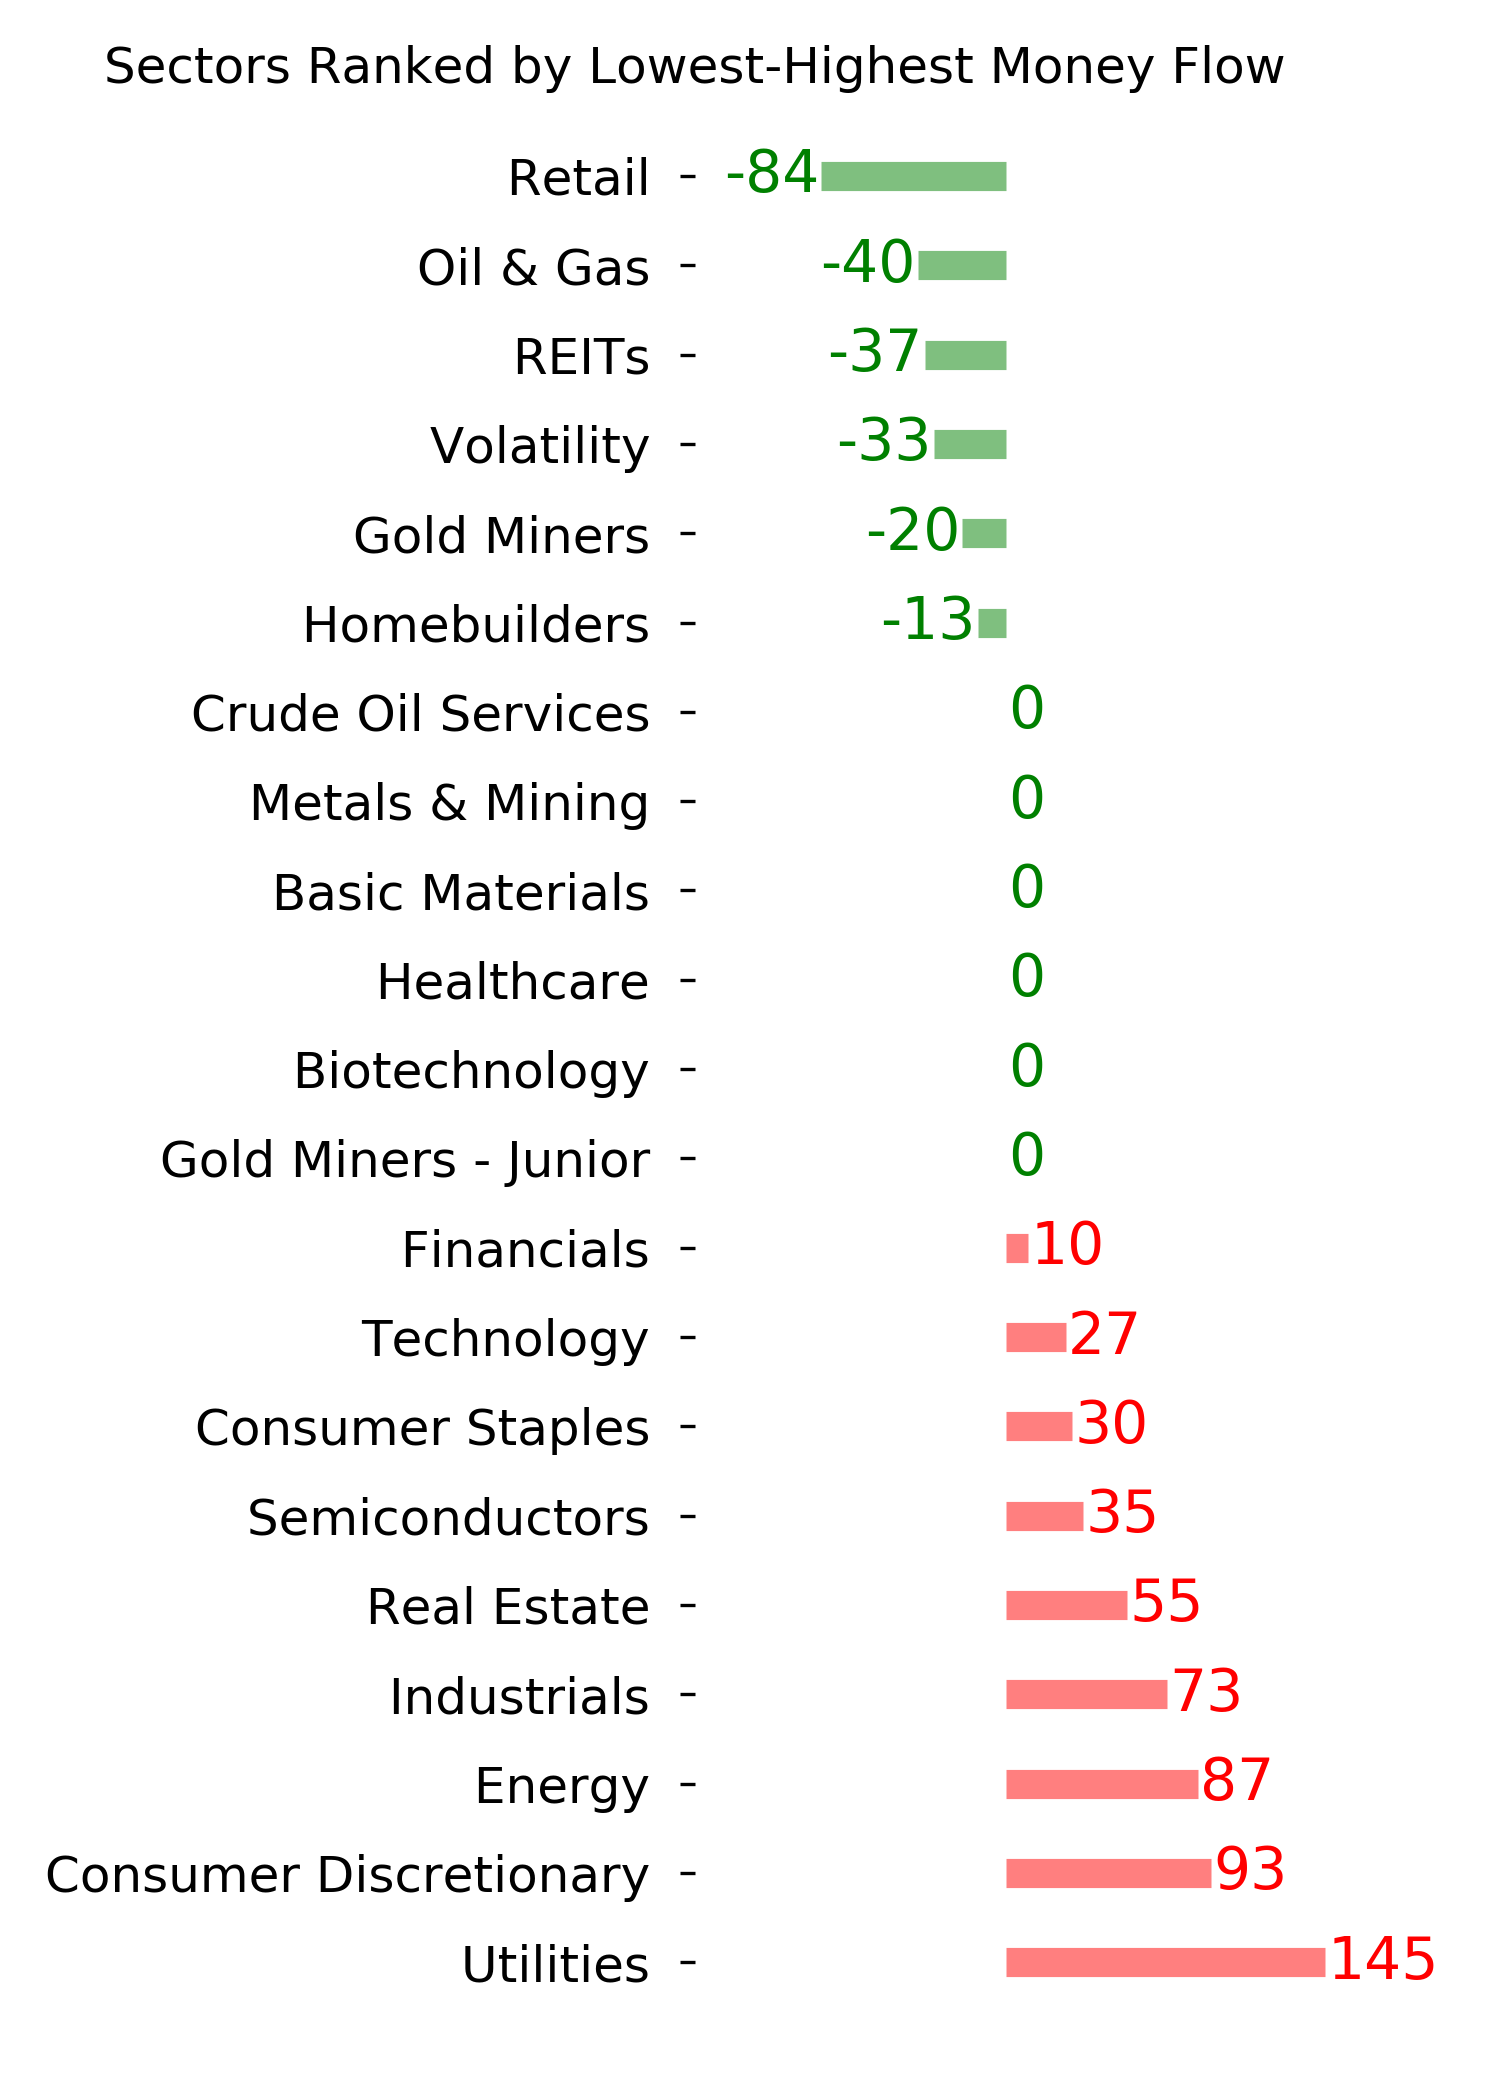
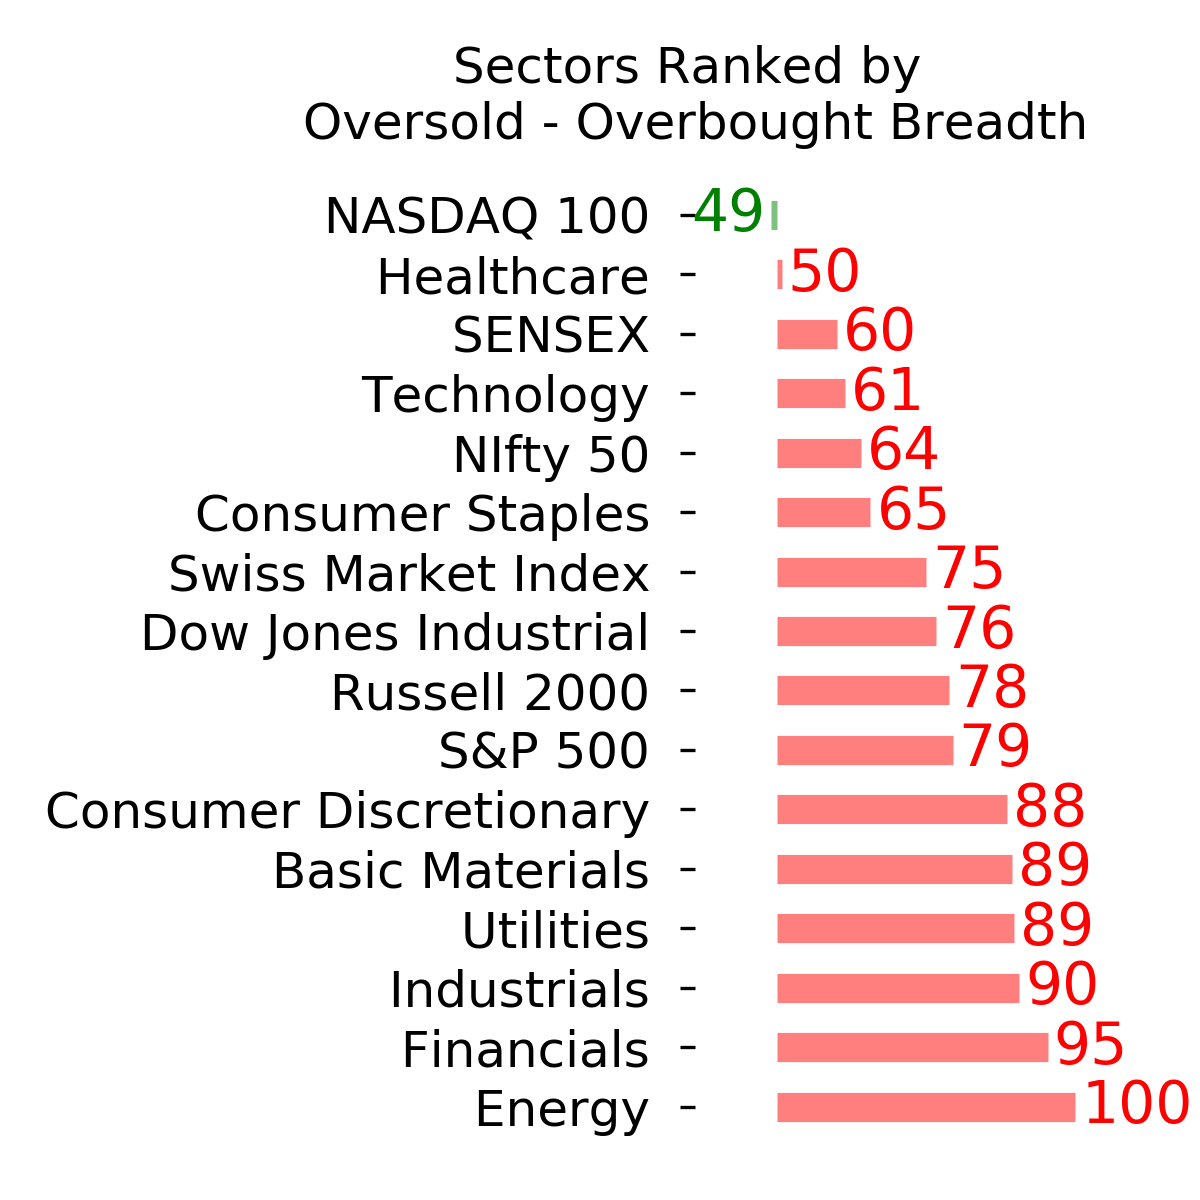
Ranks
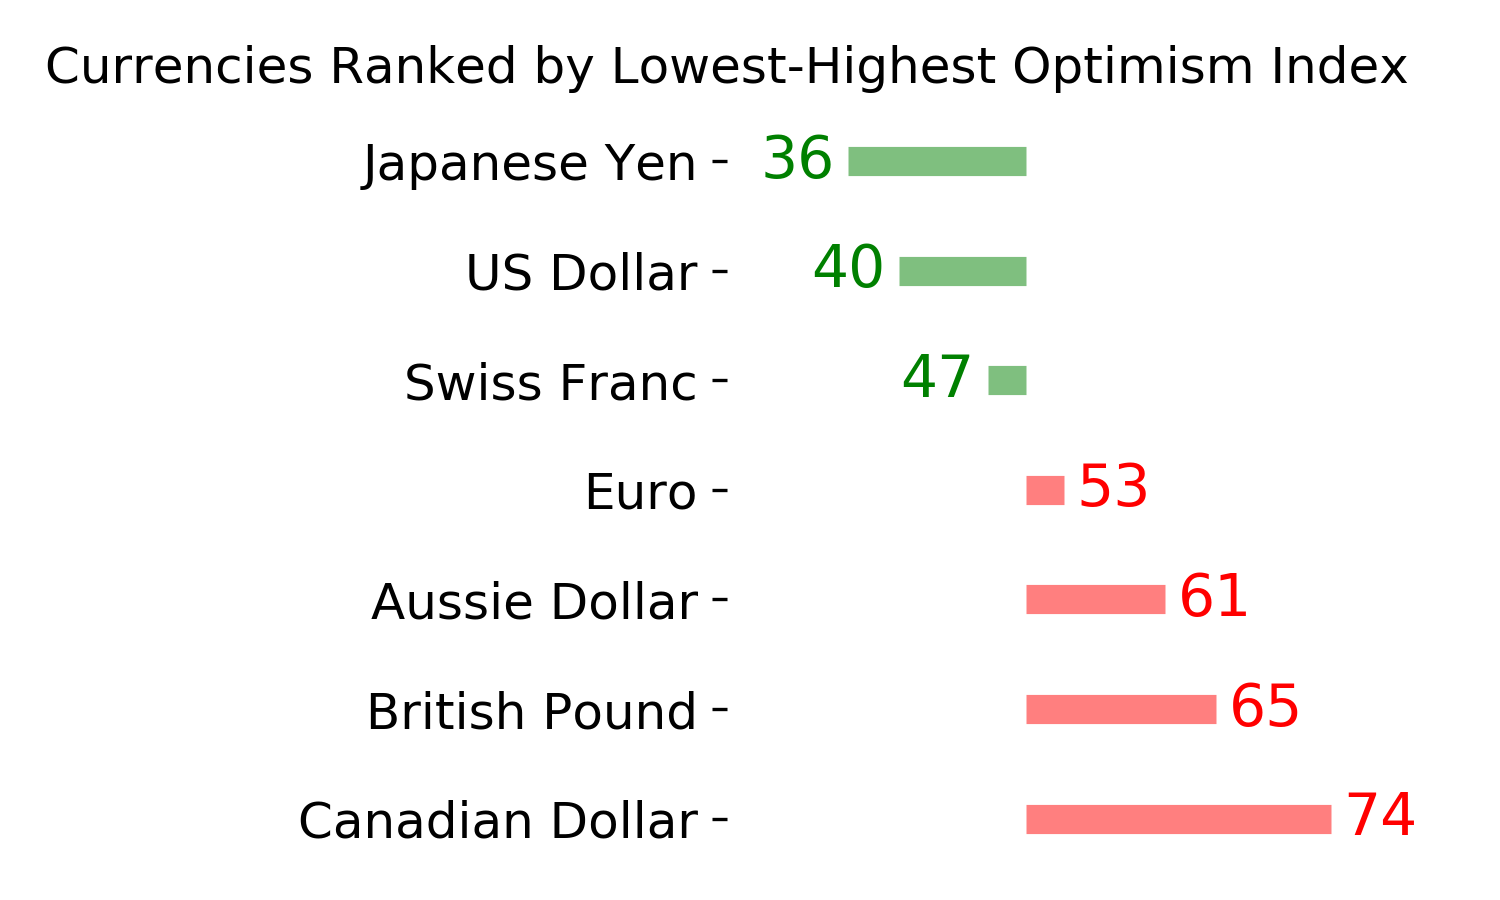
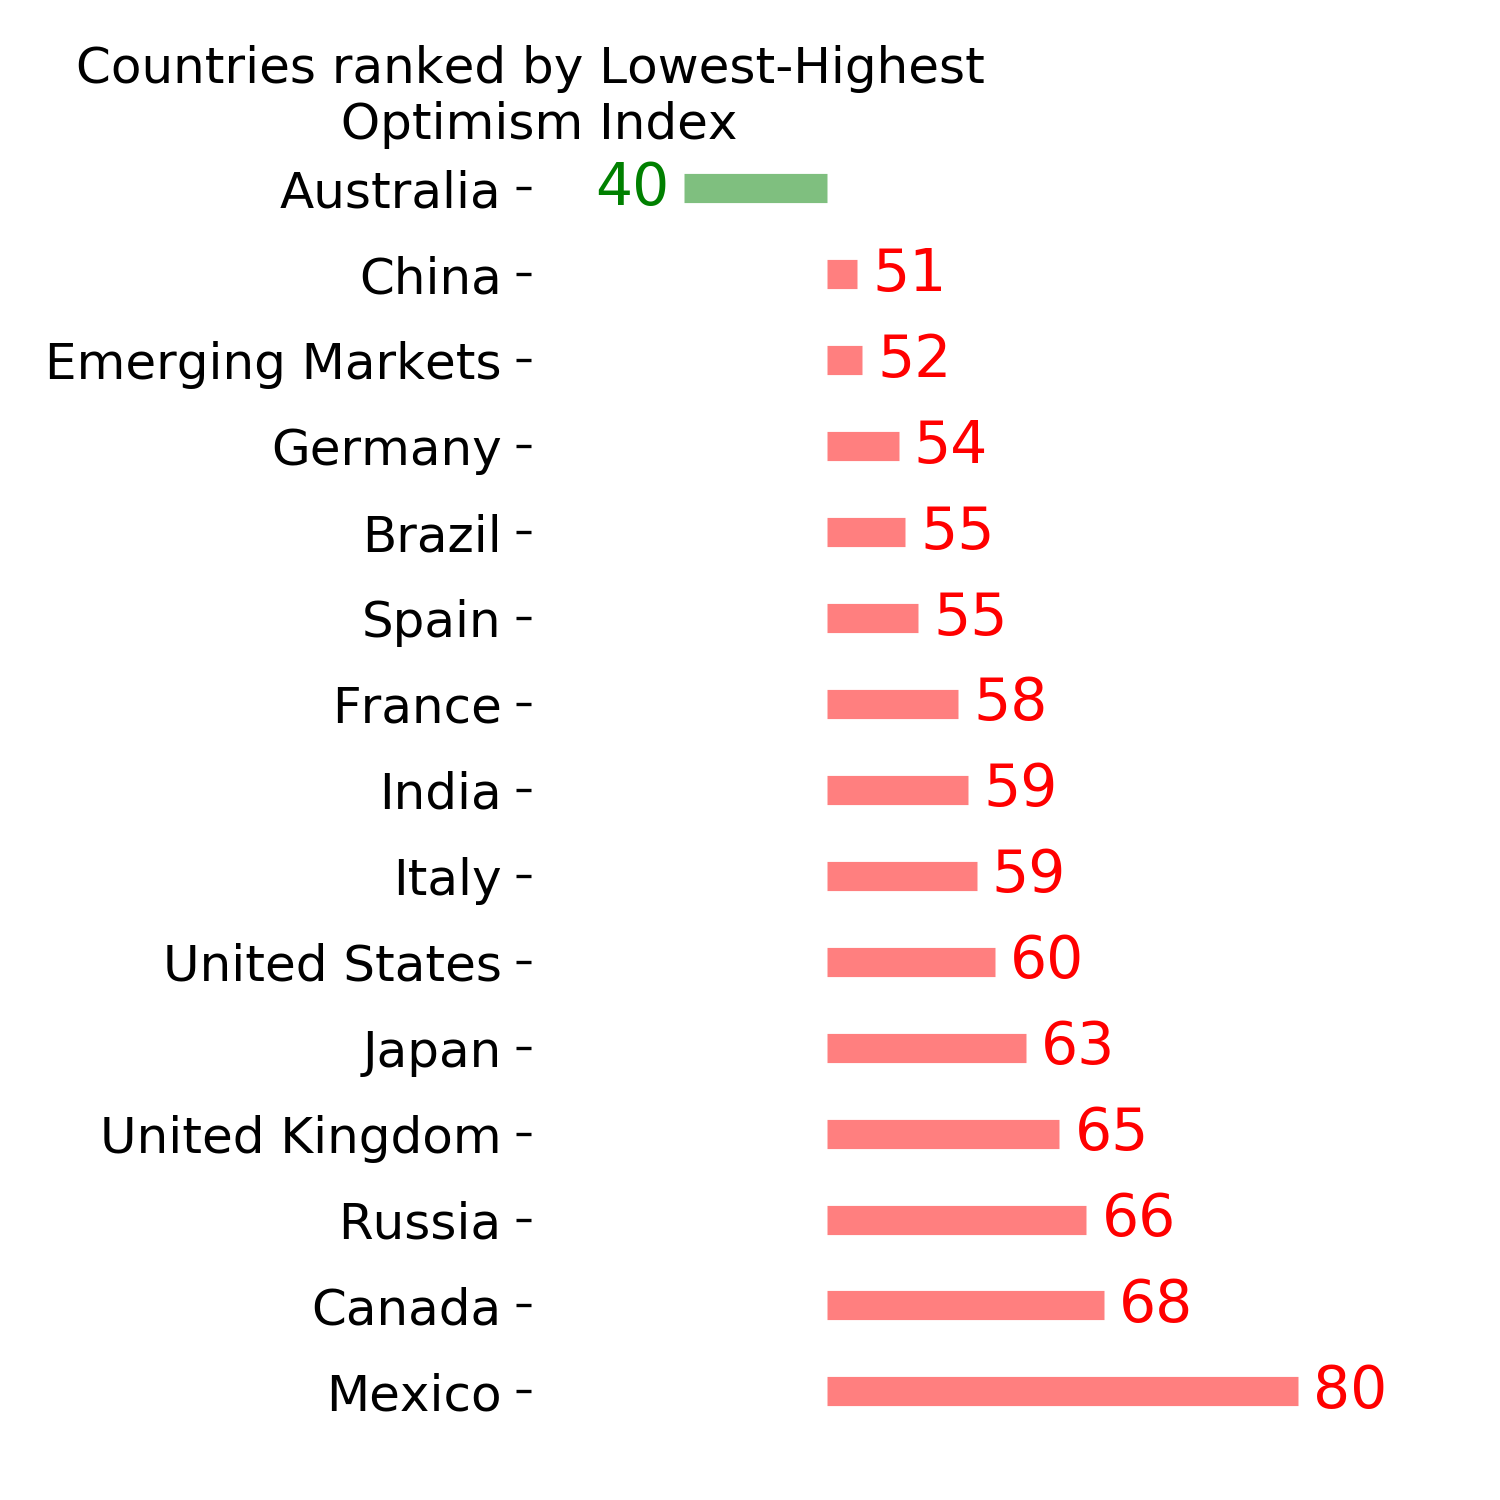
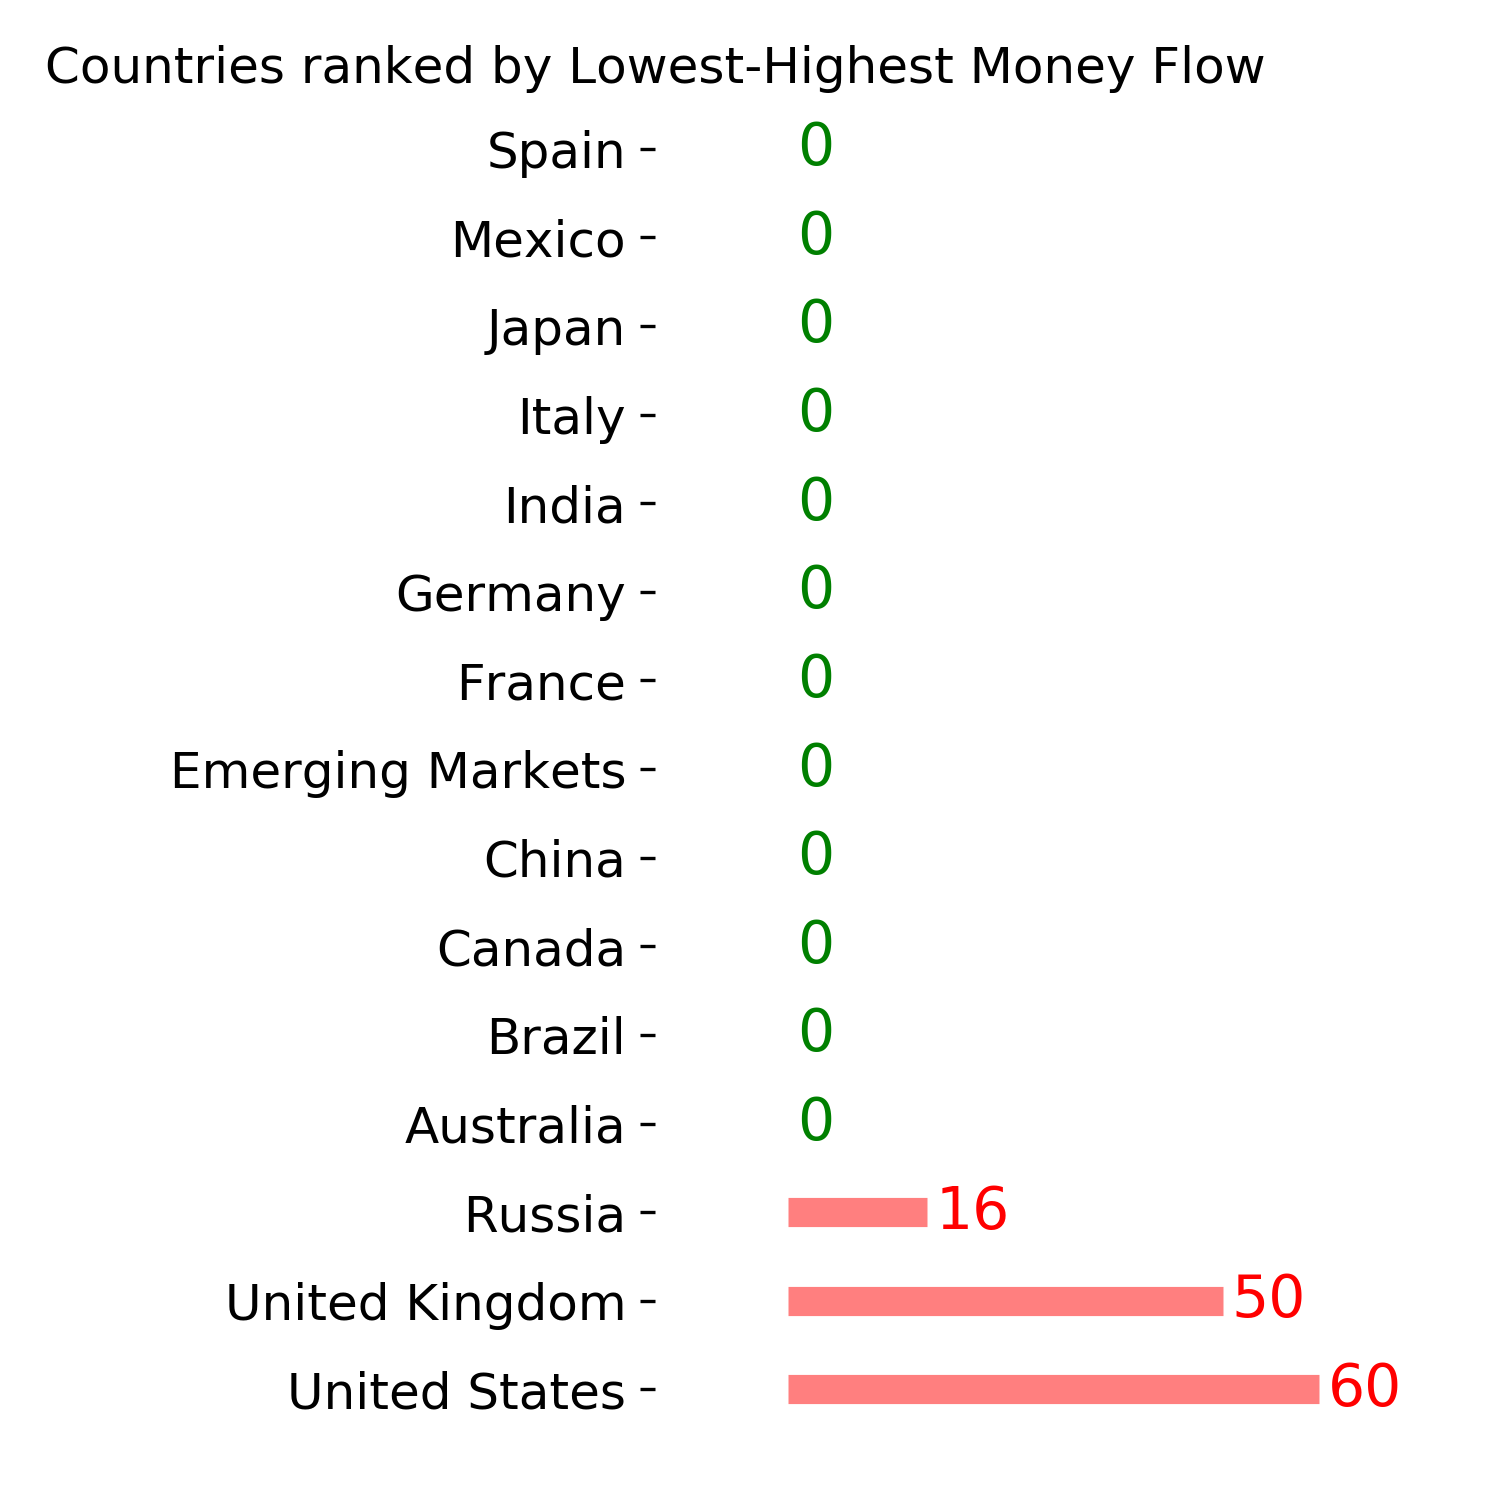
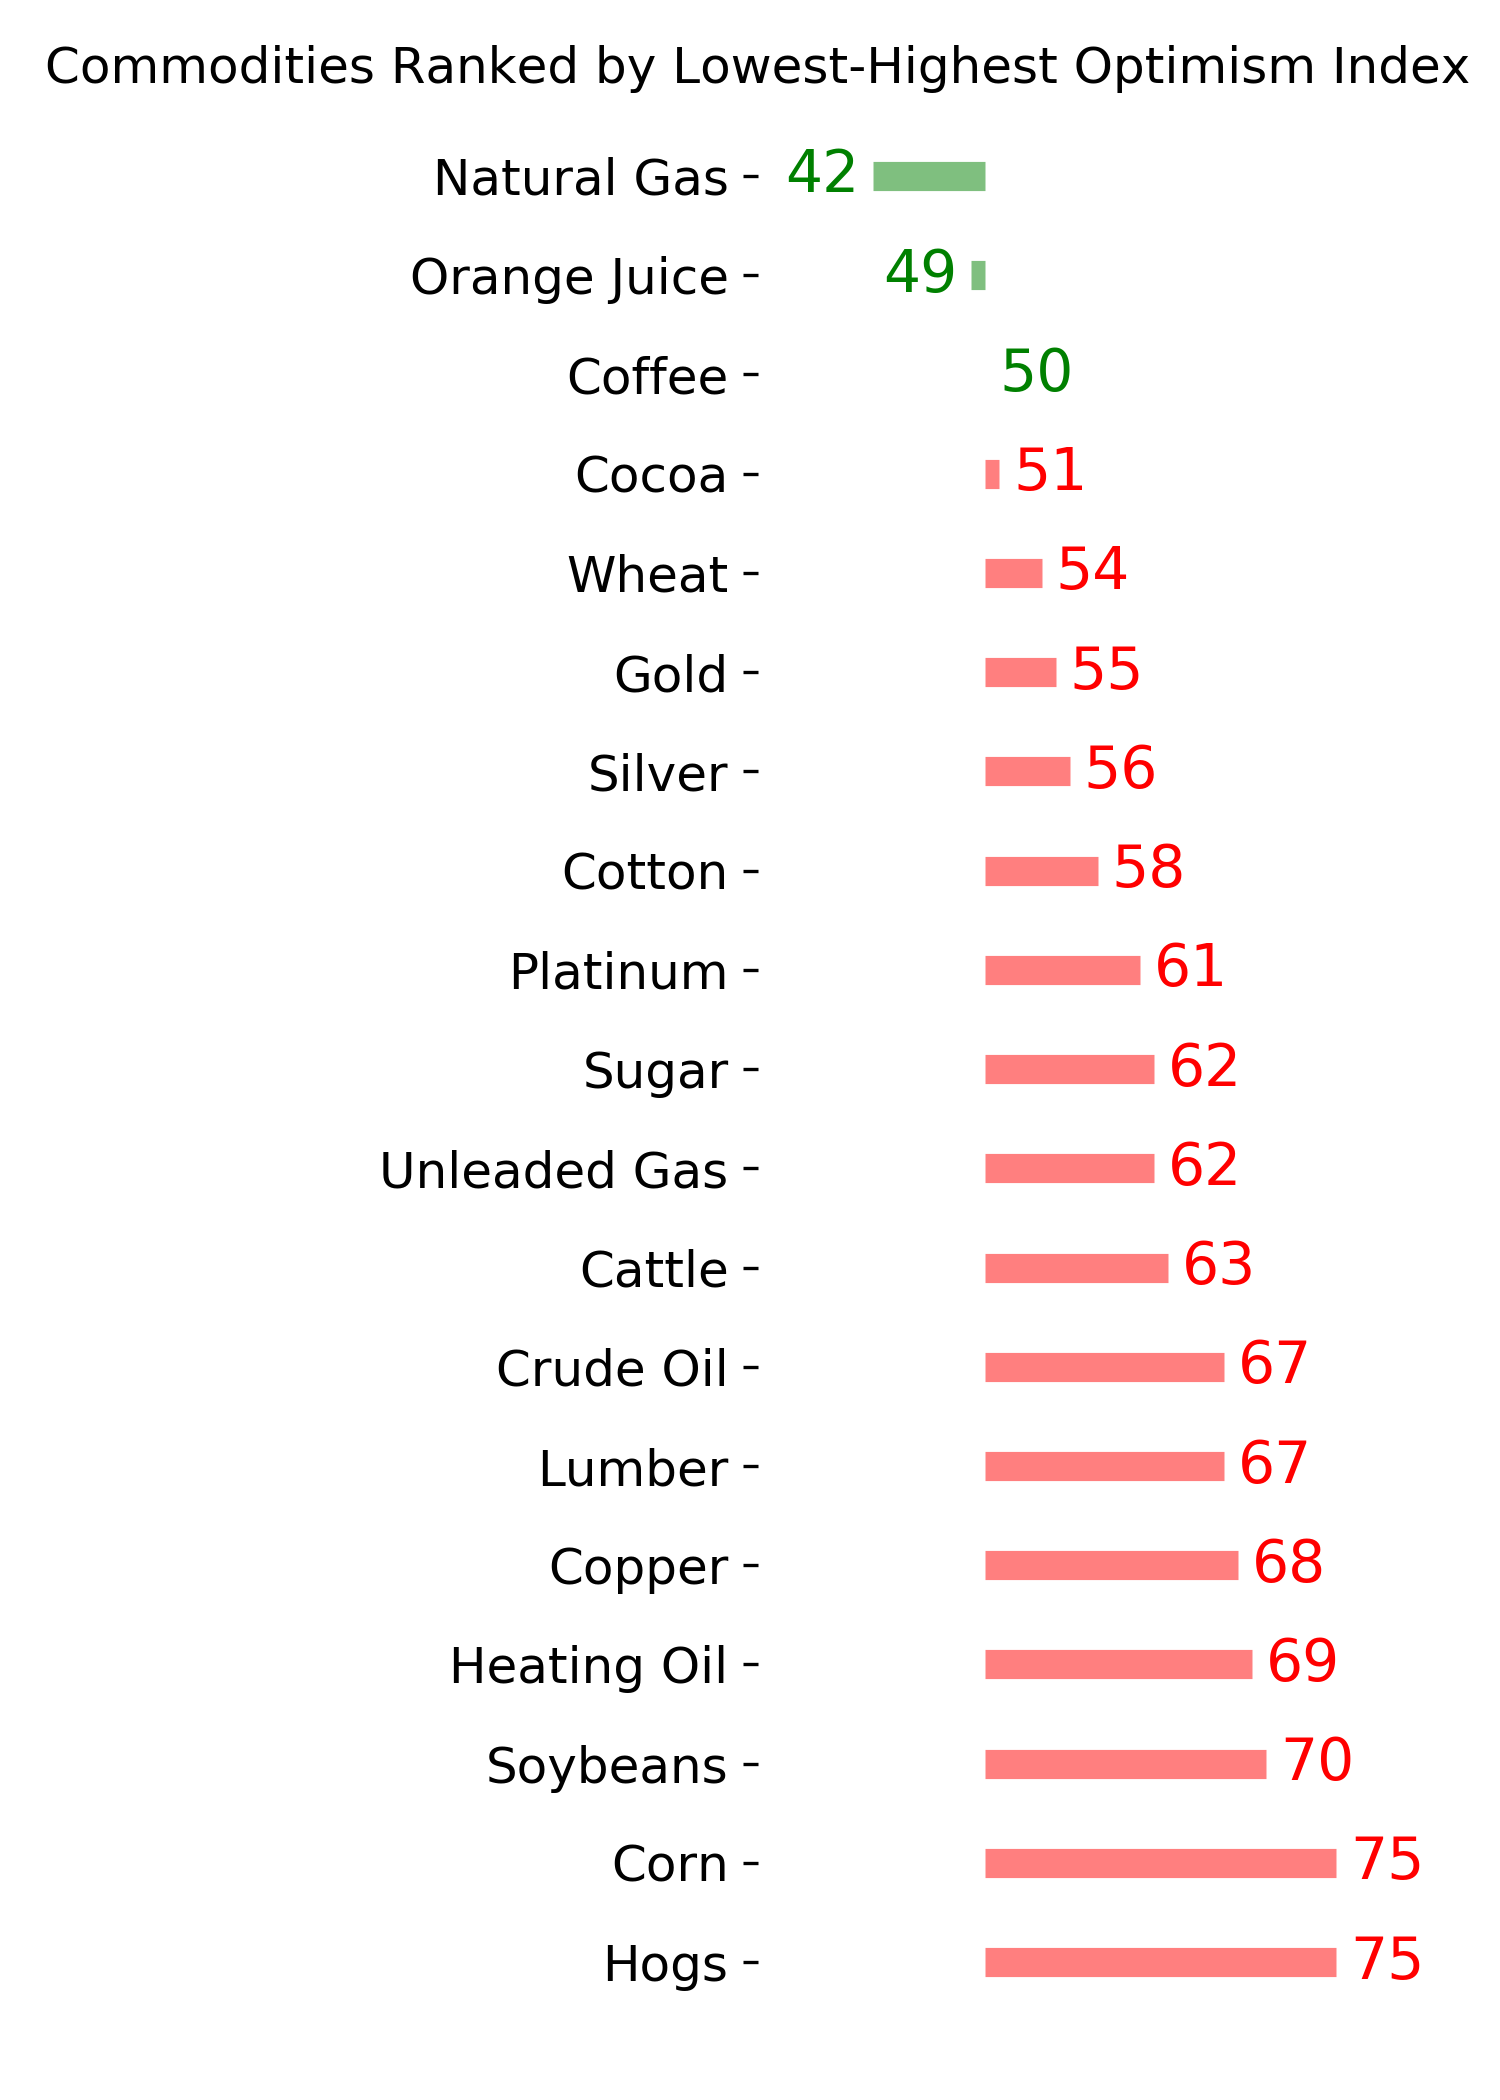
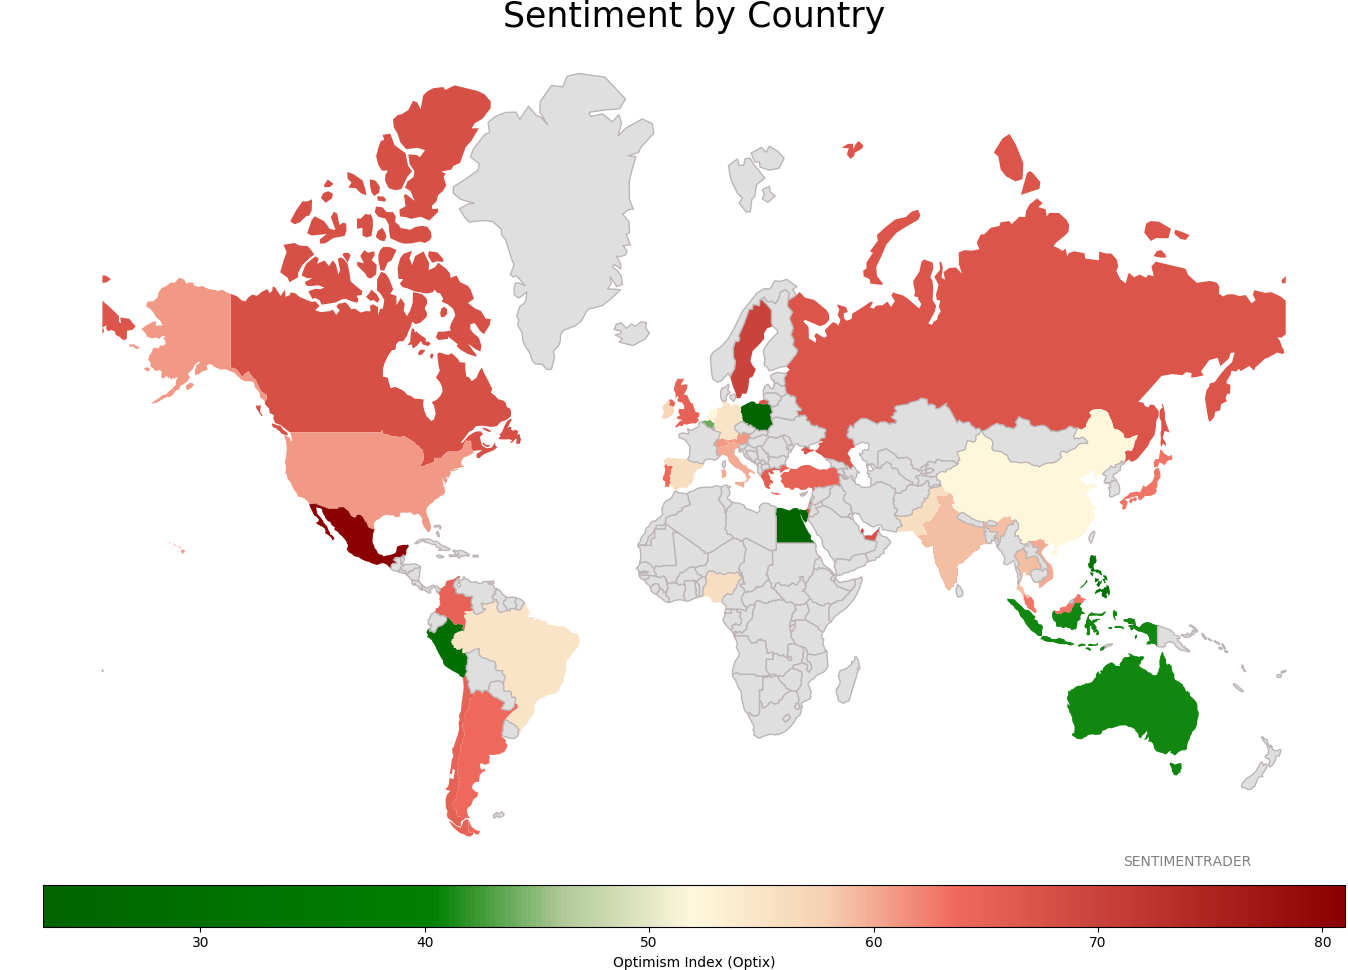
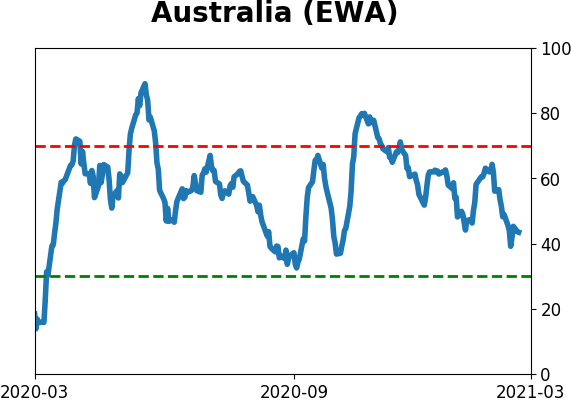
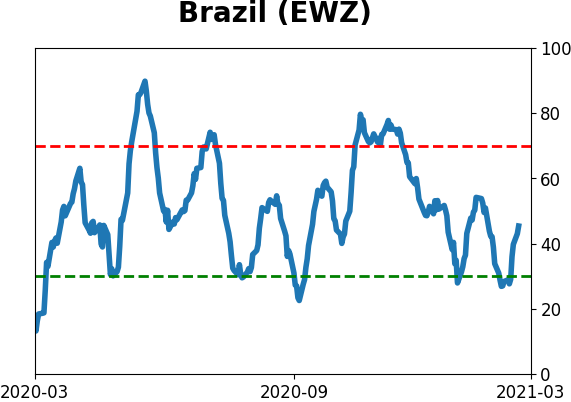
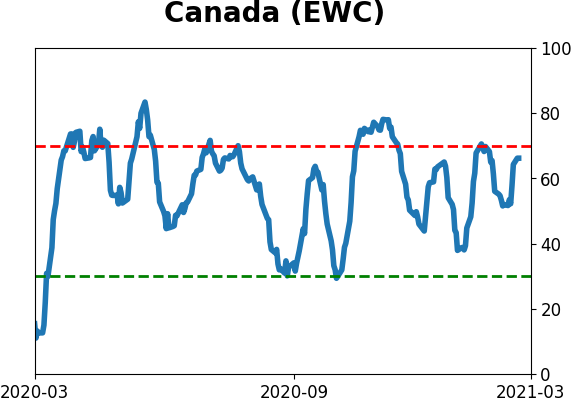
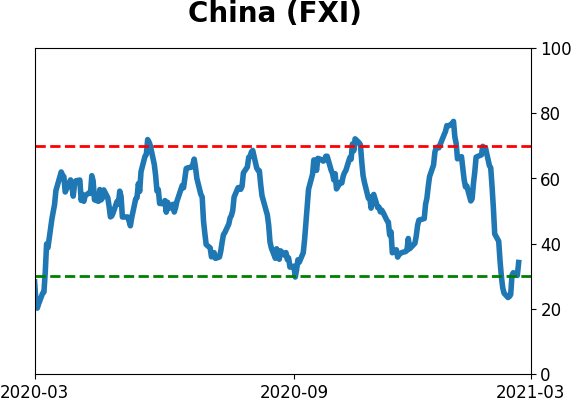
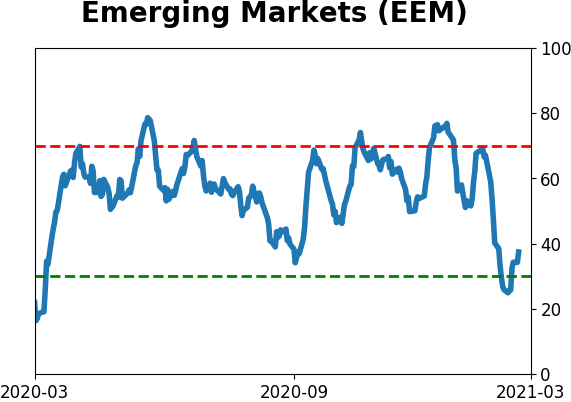
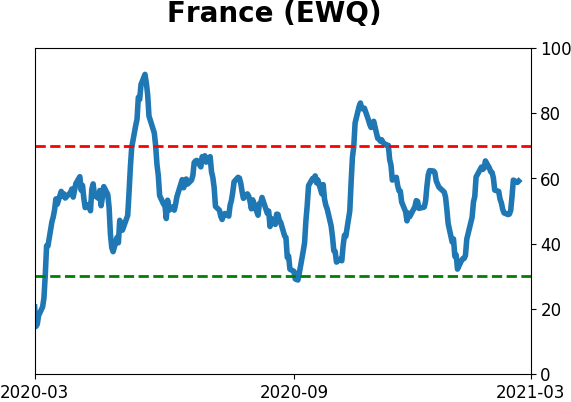
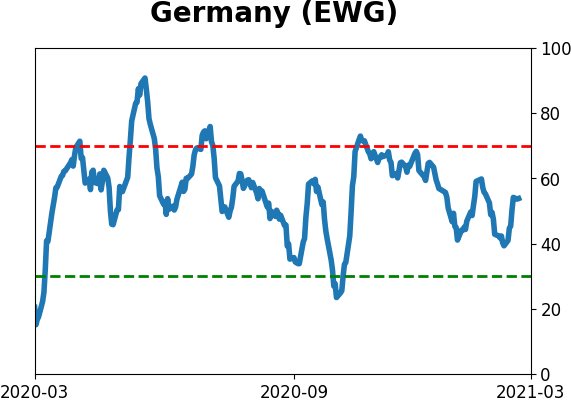
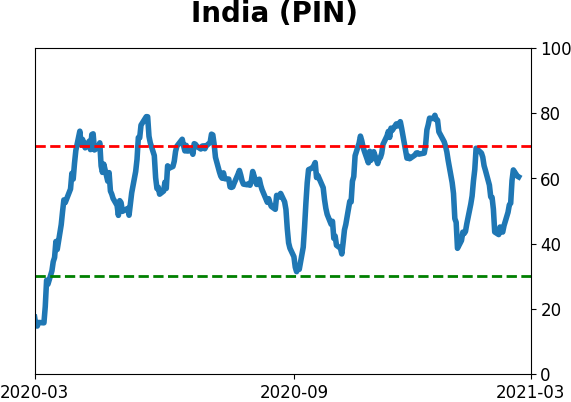
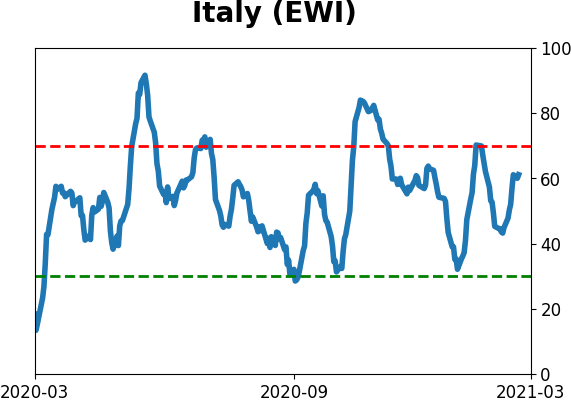
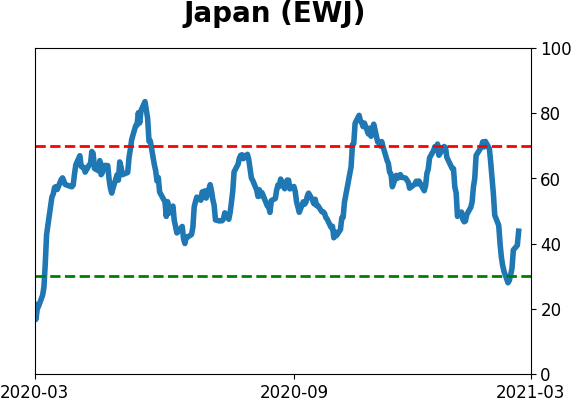
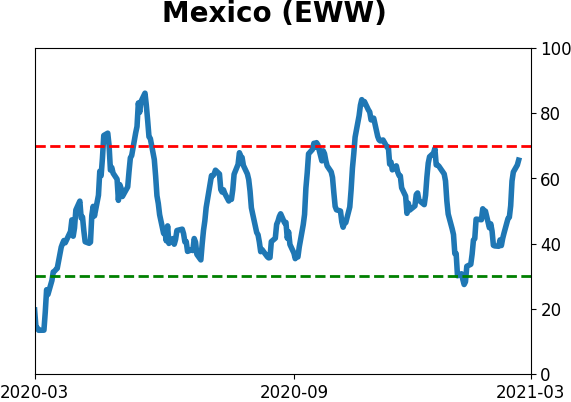
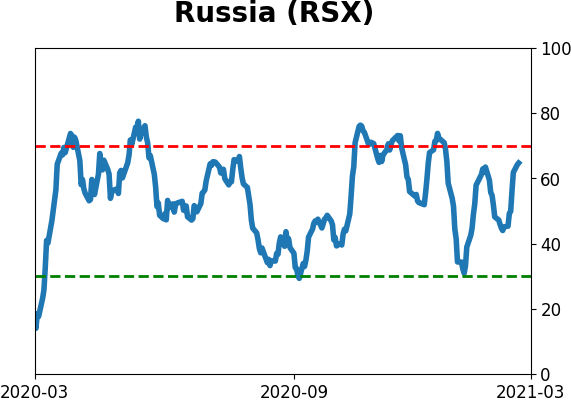
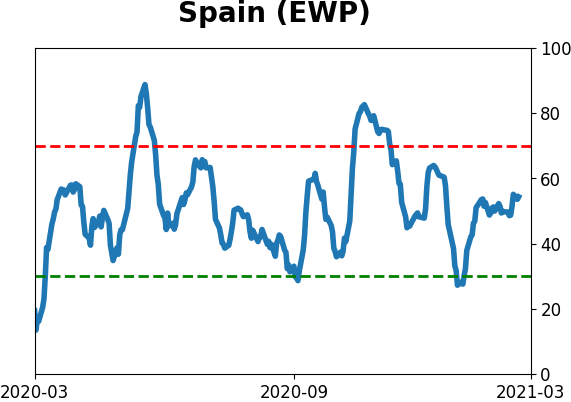
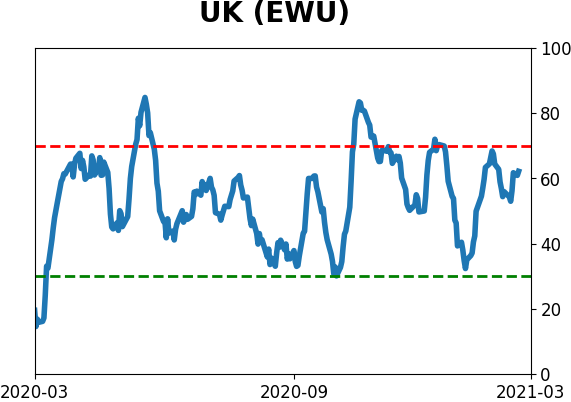
Sentiment Around The World
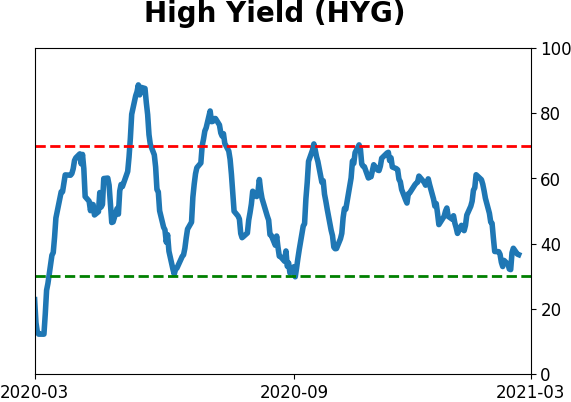
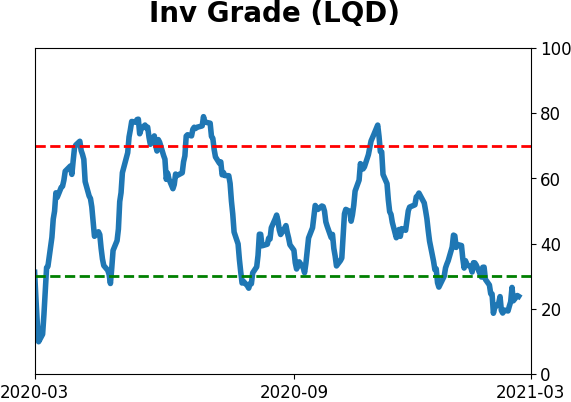
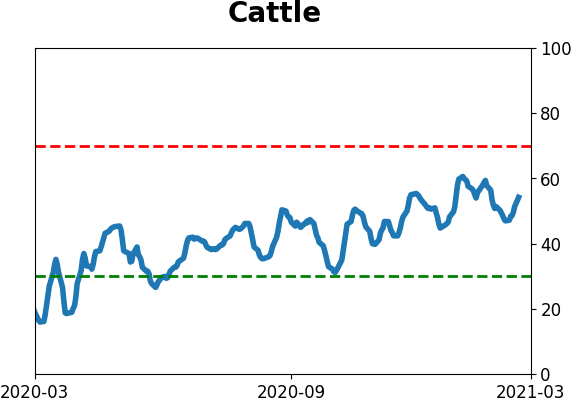
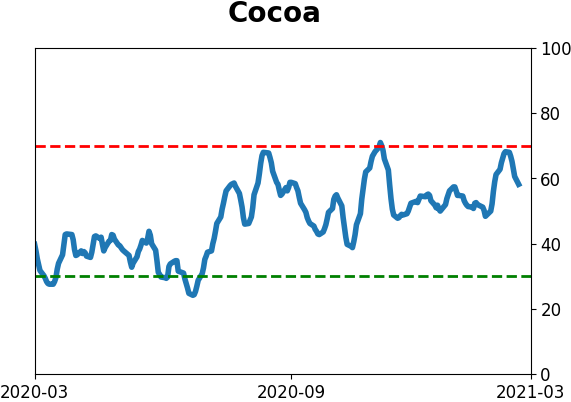
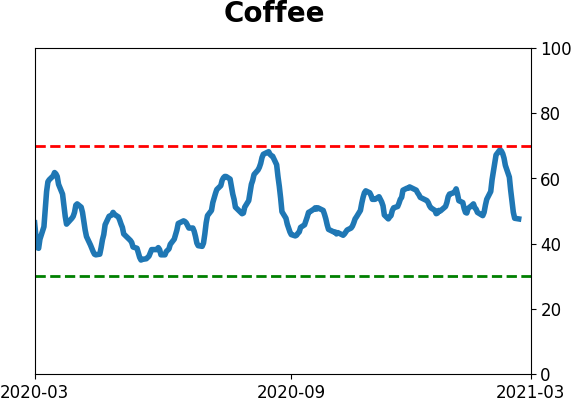
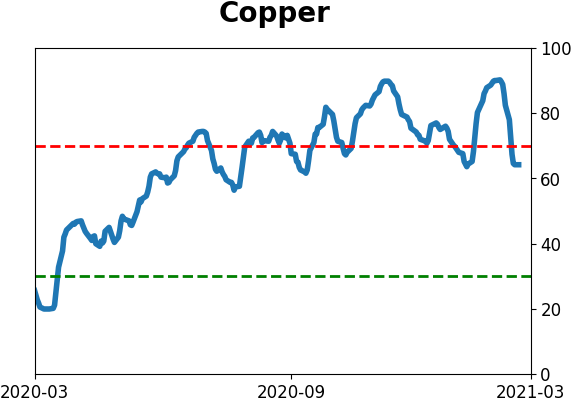
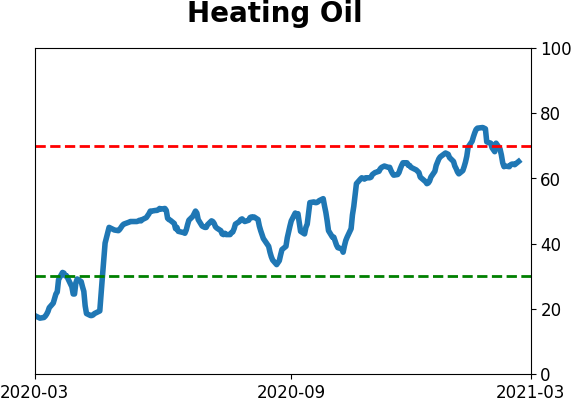
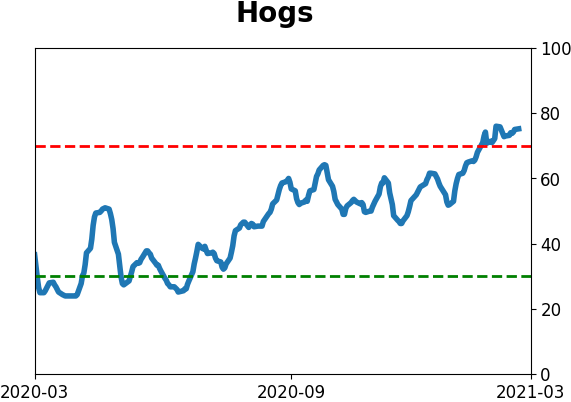
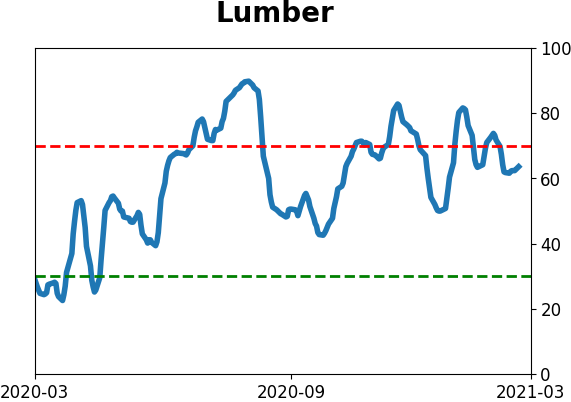
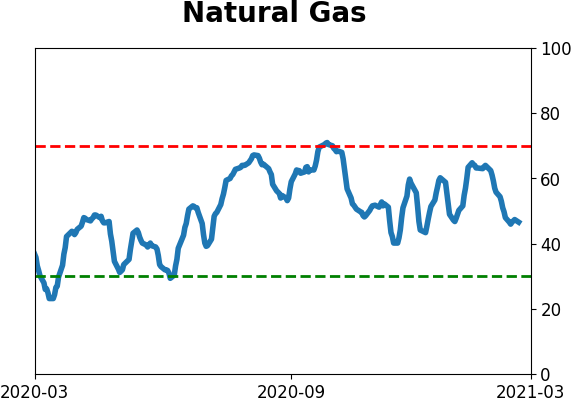
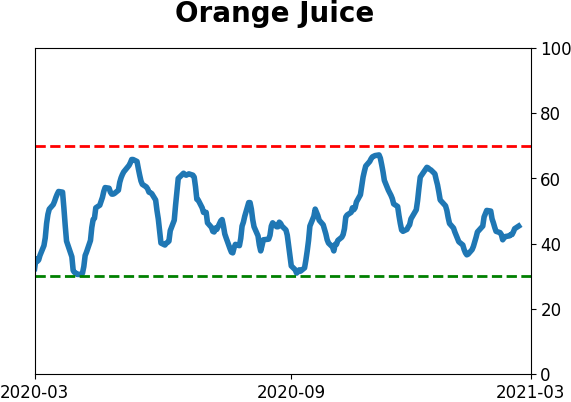
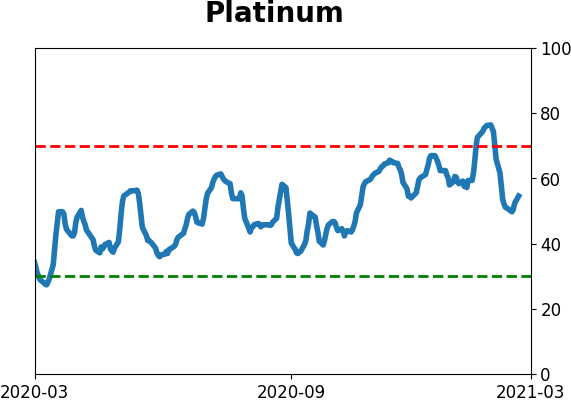
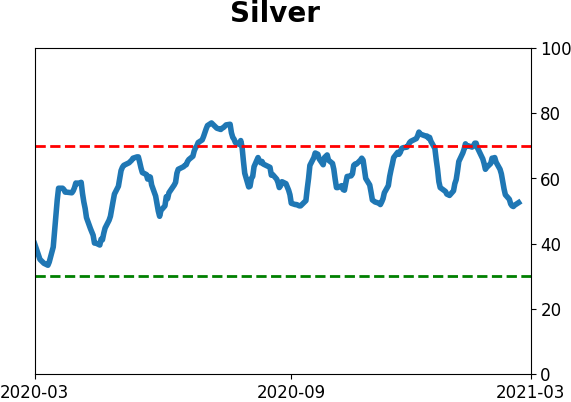
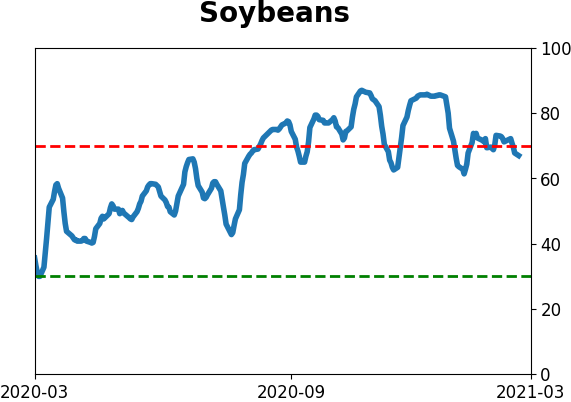
Optimism Index Thumbnails
|
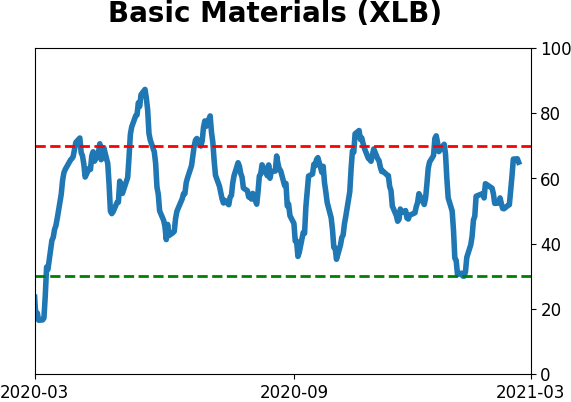
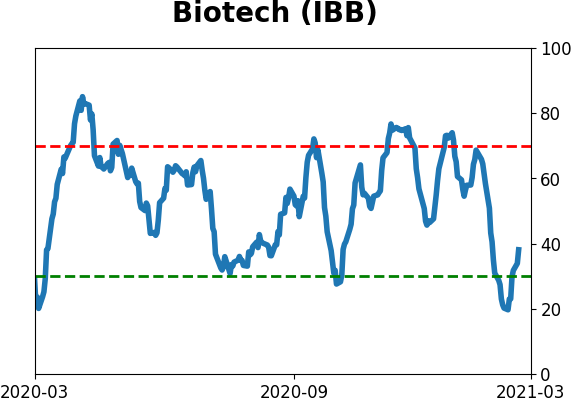
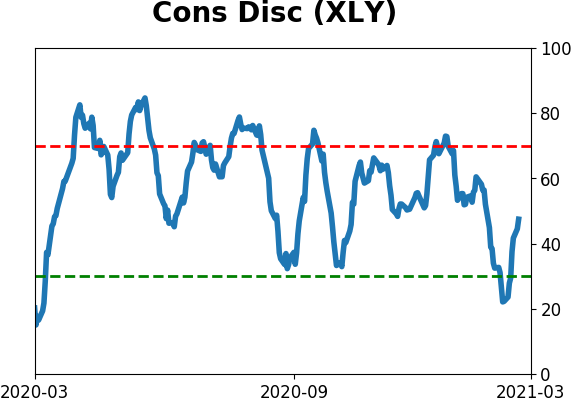
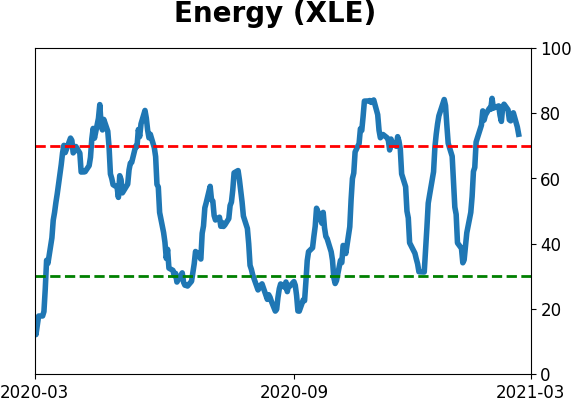
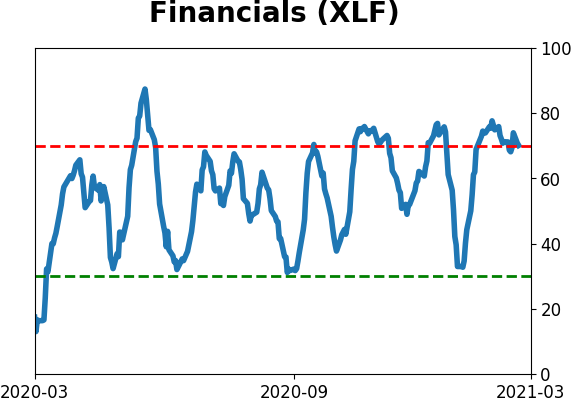
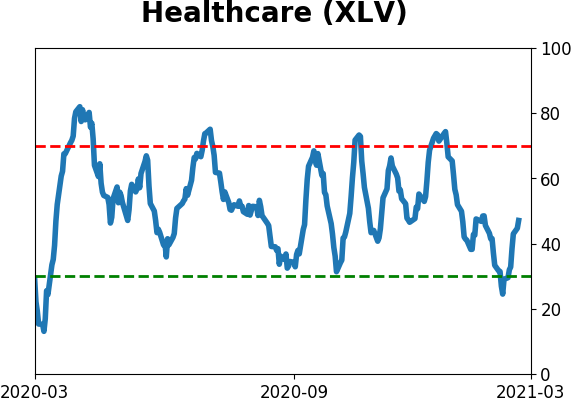
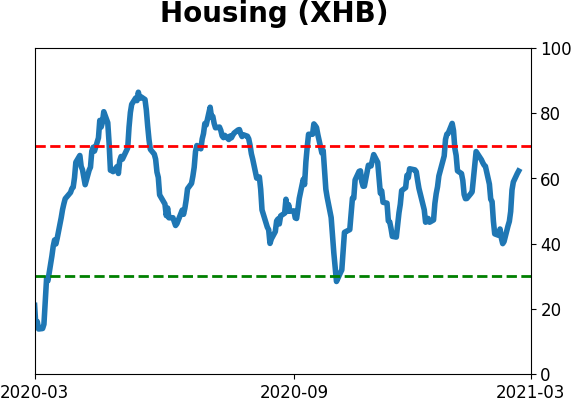
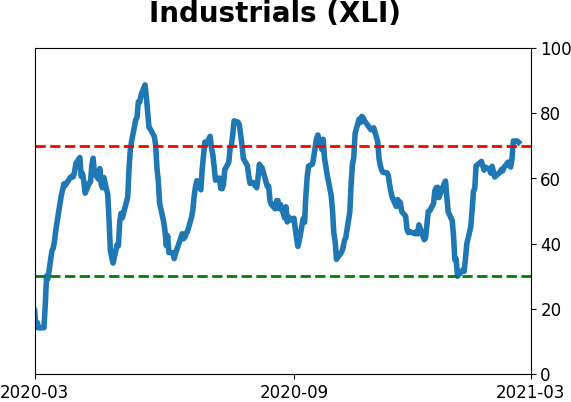
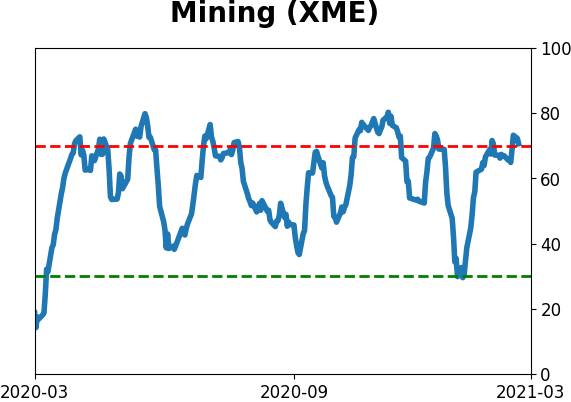
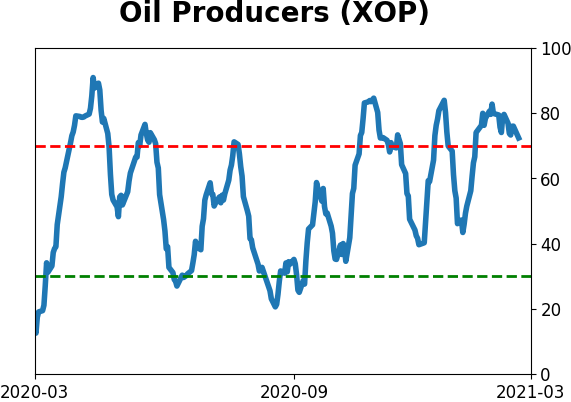
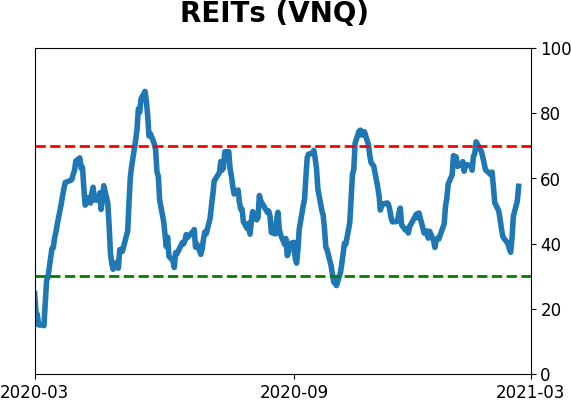
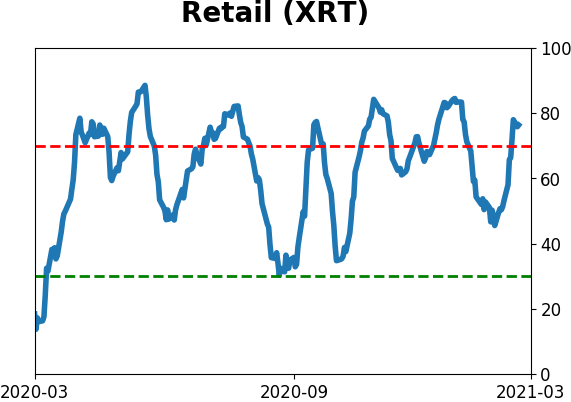
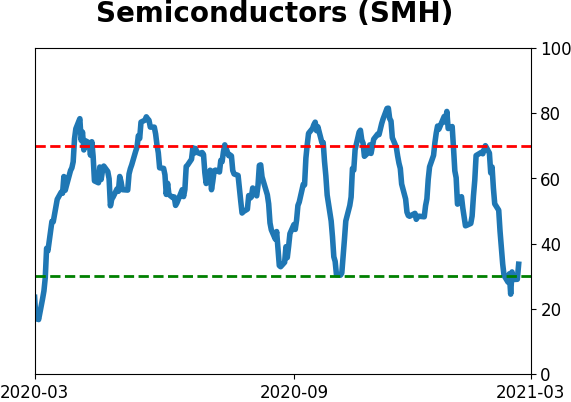
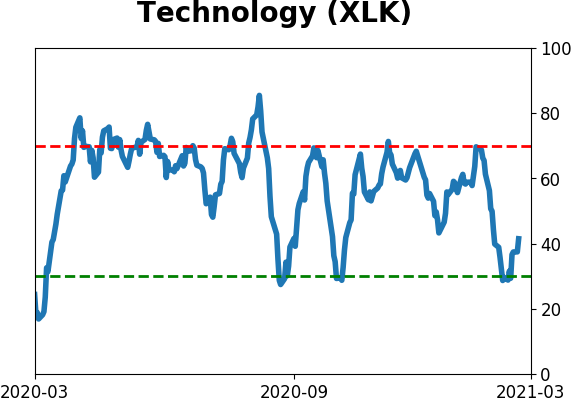
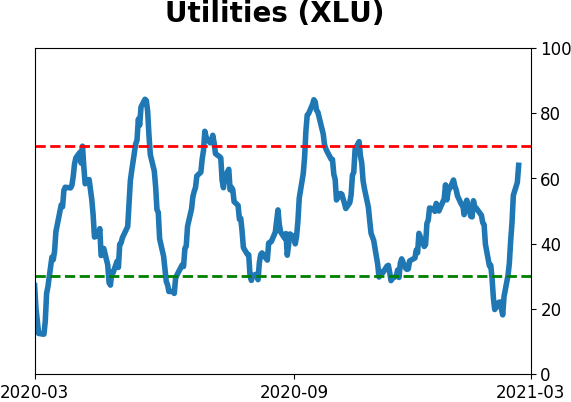
Sector ETF's - 10-Day Moving Average
|
|
|
Country ETF's - 10-Day Moving Average
|
|
|
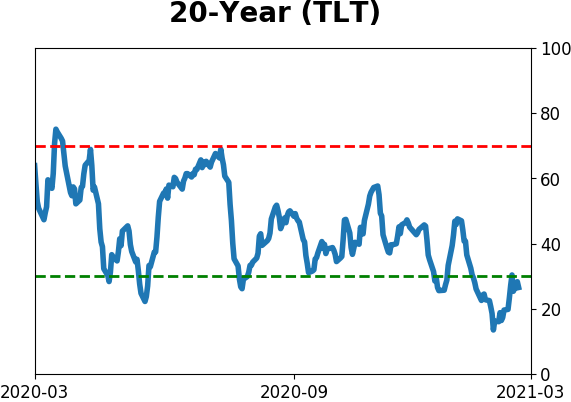
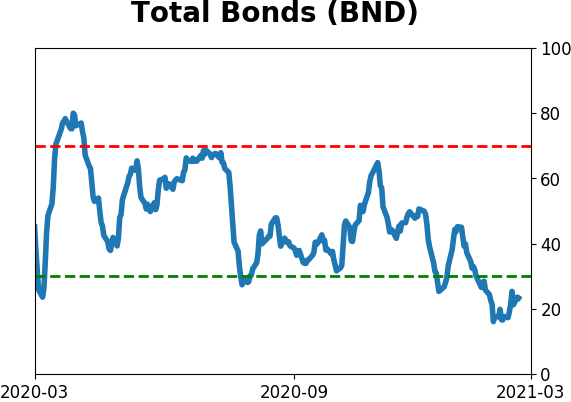
Bond ETF's - 10-Day Moving Average
|
|
|
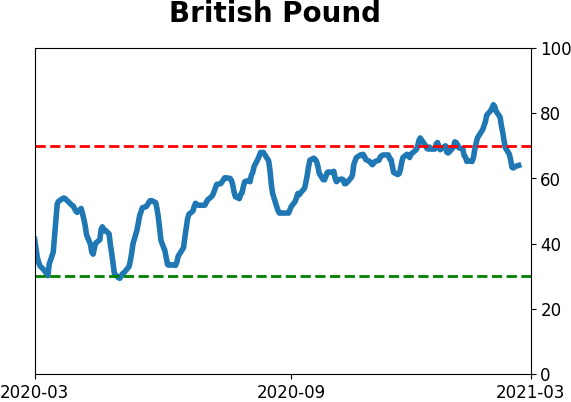
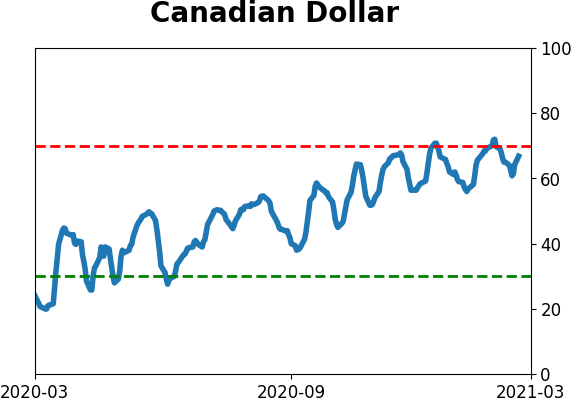
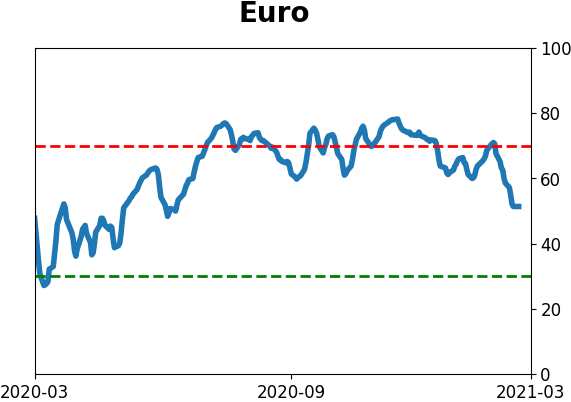
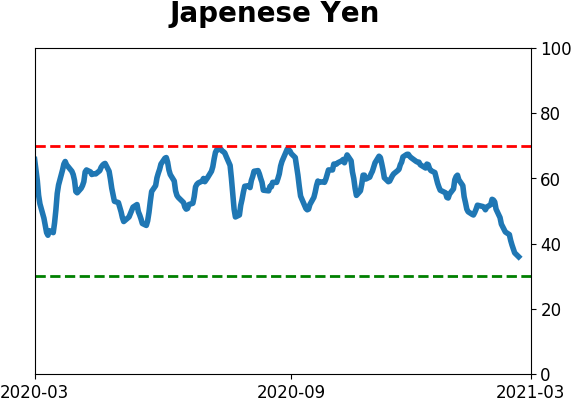
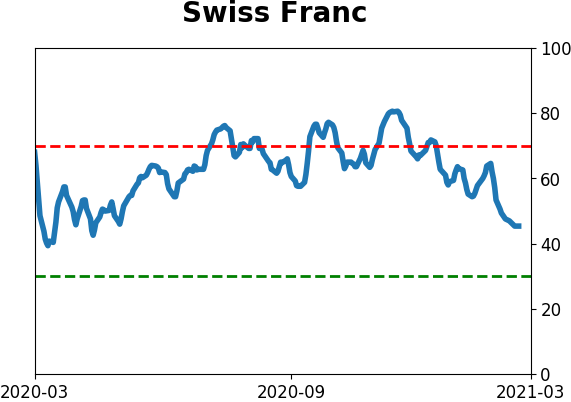
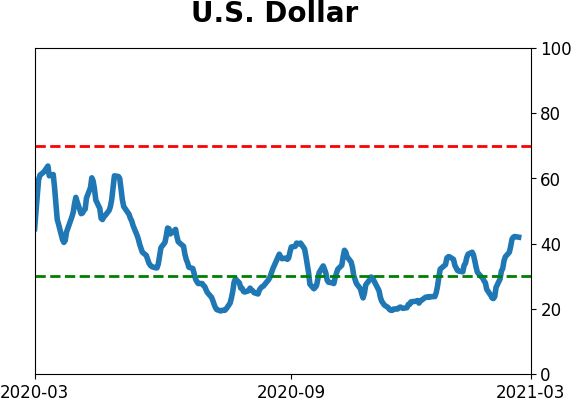
Currency ETF's - 5-Day Moving Average
|
|
|
Commodity ETF's - 5-Day Moving Average
|
|