Headlines
|
|
A split market, with a difference:
Thanks to a big split between winning and losing securities, the HiLo Logic indexes on both the NYSE and Nasdaq have spiked to worrying degrees.
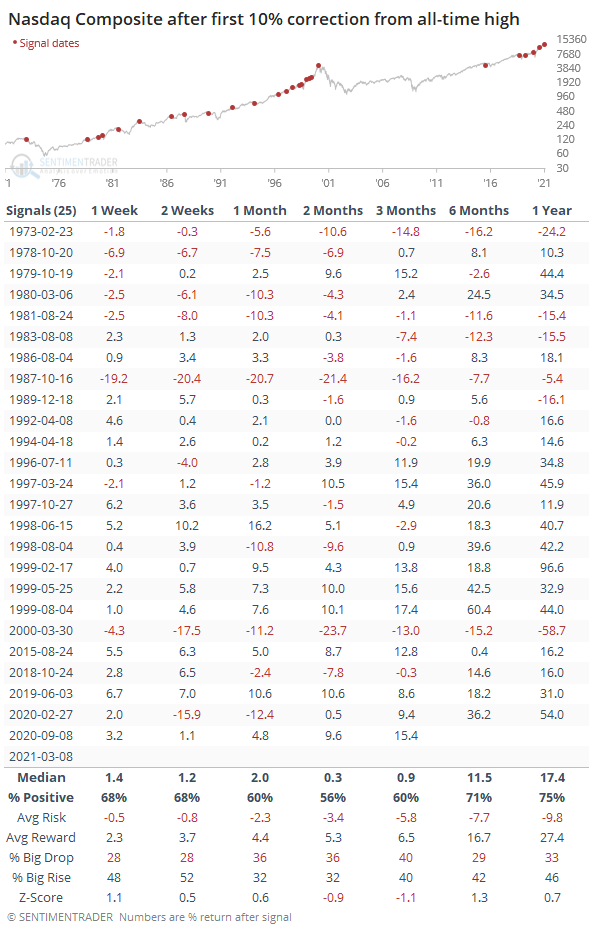
A quick correction: The Nasdaq Composite closed more than 10% from its all-time high on Monday. It took only 15 days for the index to cycle from all-time high to a correction, the 9th-fastest cycle in its history, dating to 1971. Below, we can see the Nasdaq's forward returns after it first fell into a correction following an all-time high. It was pretty mixed over the next 2-3 months.
Bottom Line:
See the Outlook & Allocations page for more details on these summaries STOCKS: Weak sell
The extreme speculation registered in January and February is starting to get wrung out. Internal dynamics have mostly held up, so a return to neutral sentiment conditions would improve for the forward risk/reward profile substantially. BONDS: Weak buy
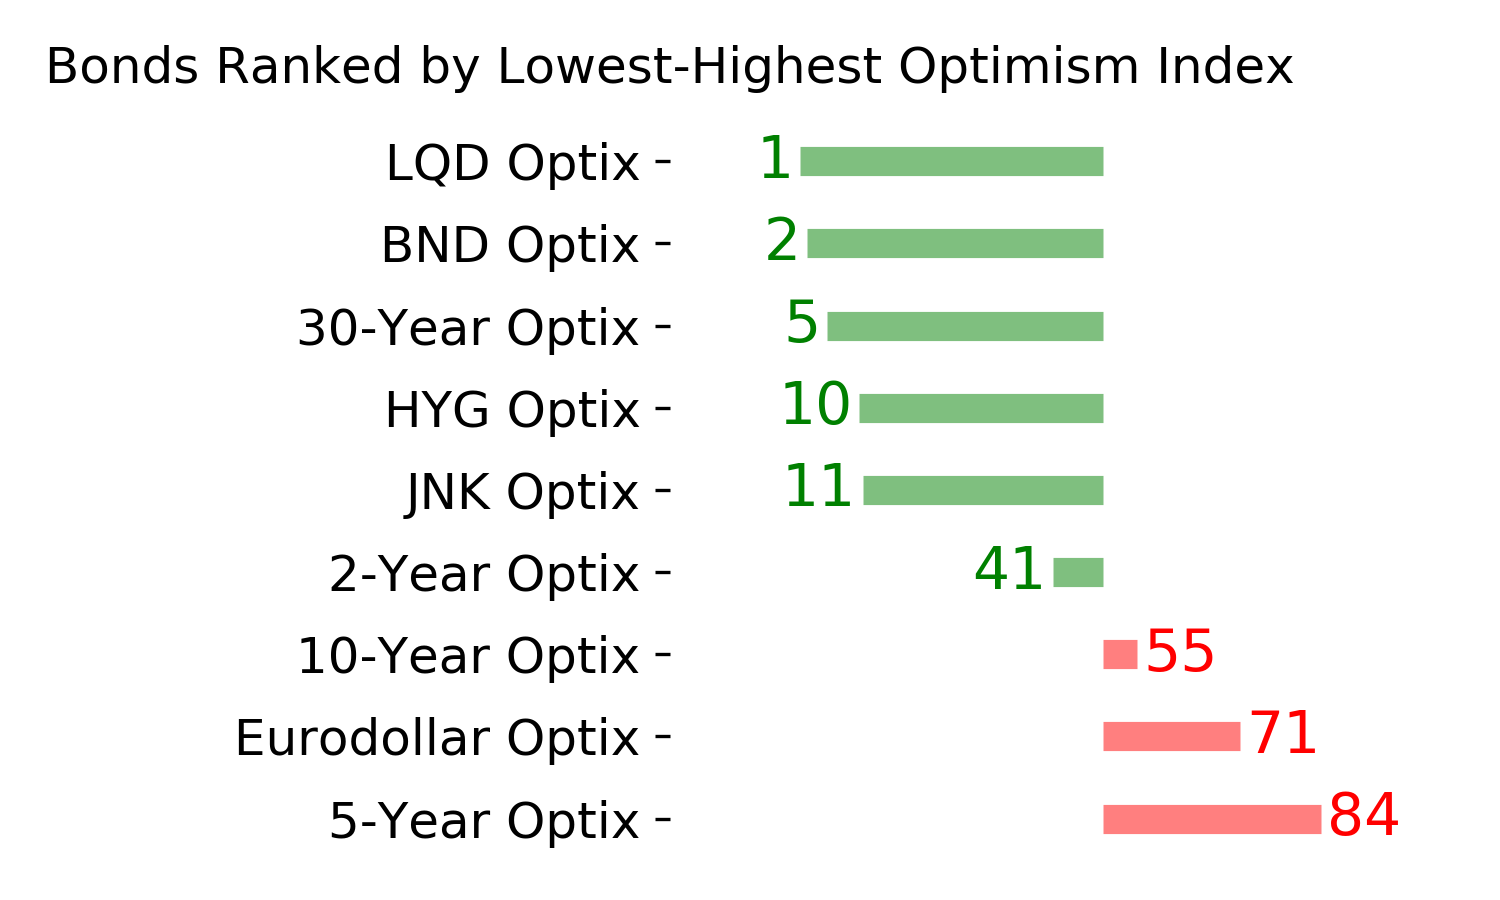
Various parts of the market have been hit in recent weeks, with mild oversold conditions. The Bond Optimism Index is now about as low as it gets during healthy bond market environments. Fixed income isn't responding well, so that needs to be monitored in case its transitioning to a longer-term negative market environment. GOLD: Weak buy
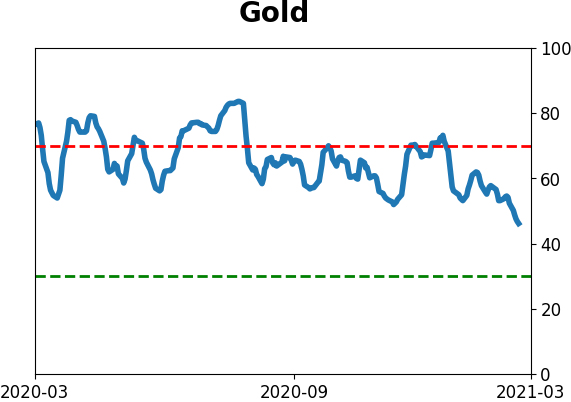
A dollar trying to rebound from a severe short position has weighed on gold and miners. The types of signals they've given in recent weeks, within the context of their recent surge, have usually resulted in higher prices over a medium- to long-term time frame. Like bonds, gold and miners aren't responding very well, and this needs to be monitored.
|
Smart / Dumb Money Confidence
|
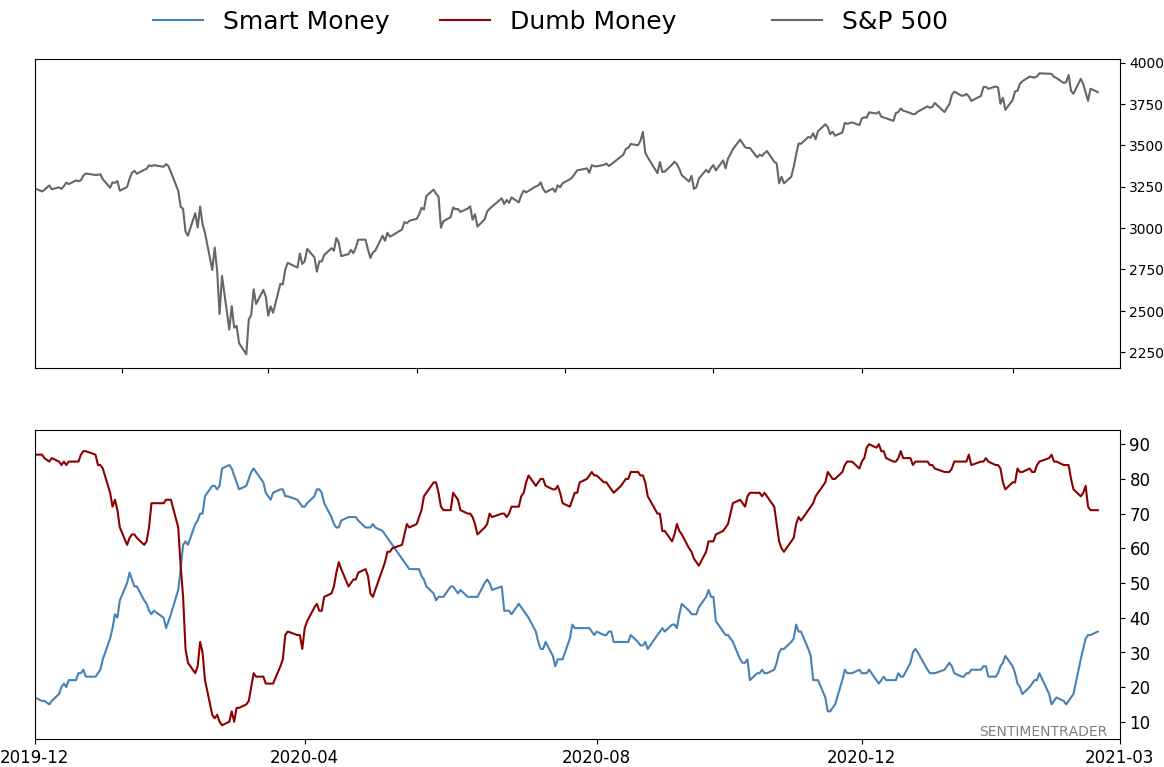
Smart Money Confidence: 36%
Dumb Money Confidence: 71%
|
|
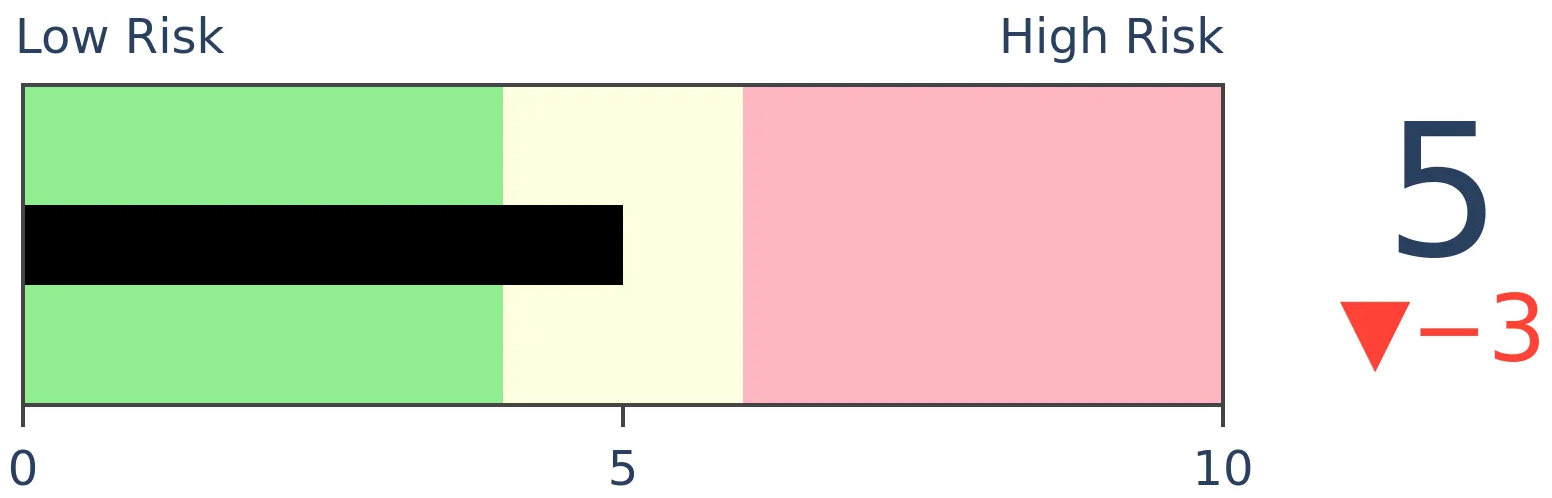
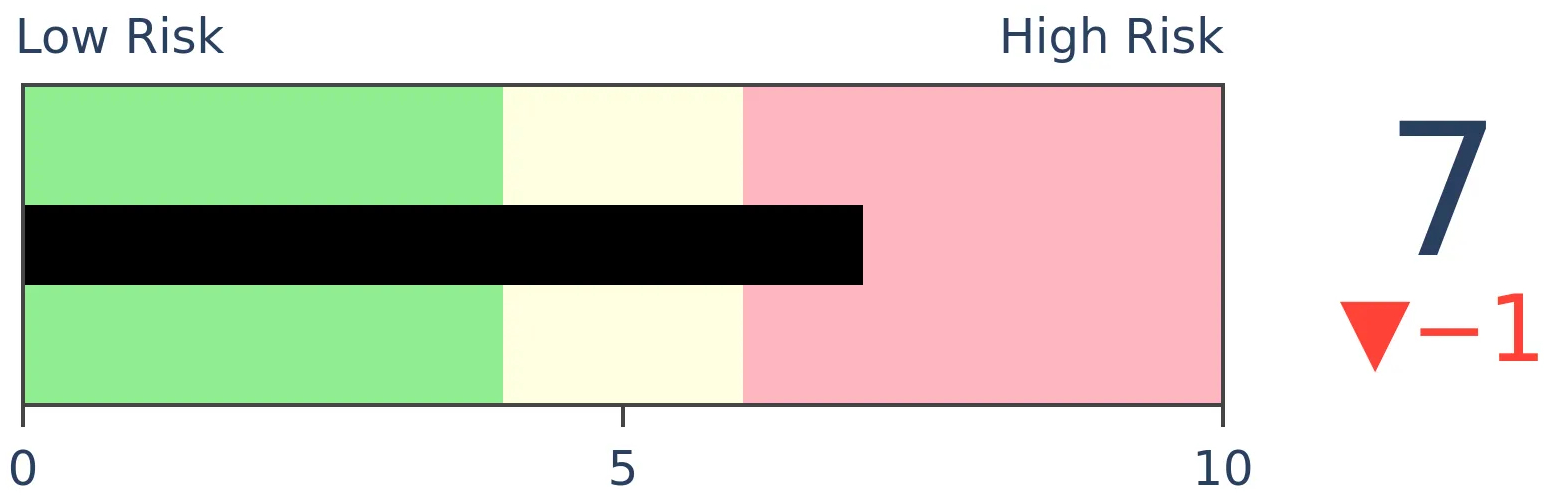
Risk Levels
Stocks Short-Term
|
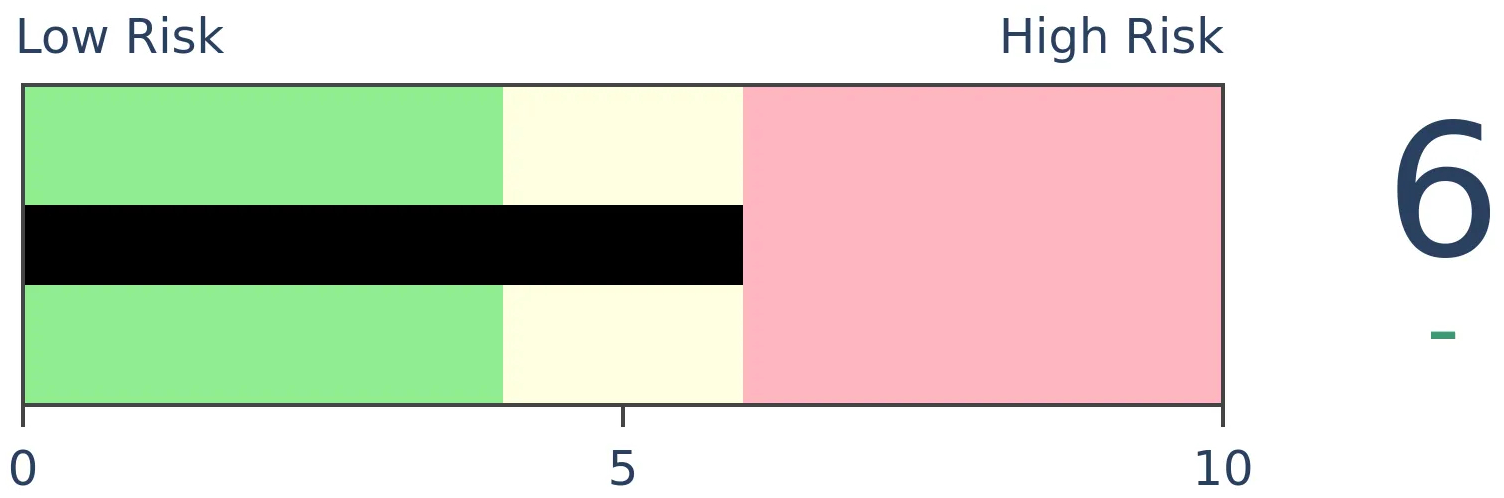
Stocks Medium-Term
|
|
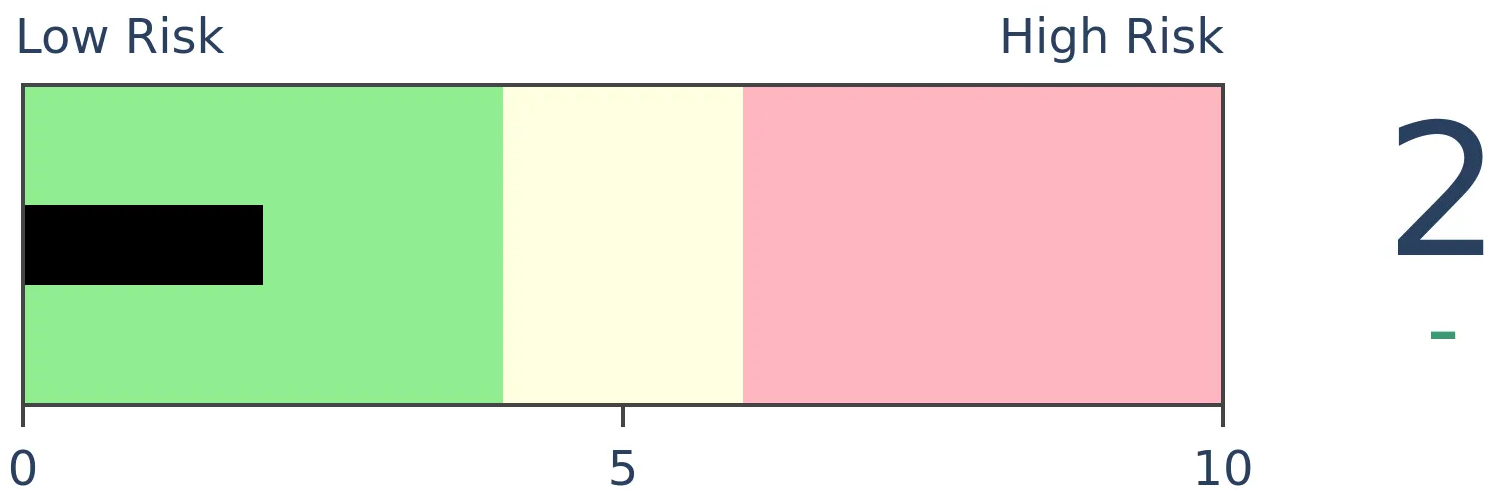
Bonds

|
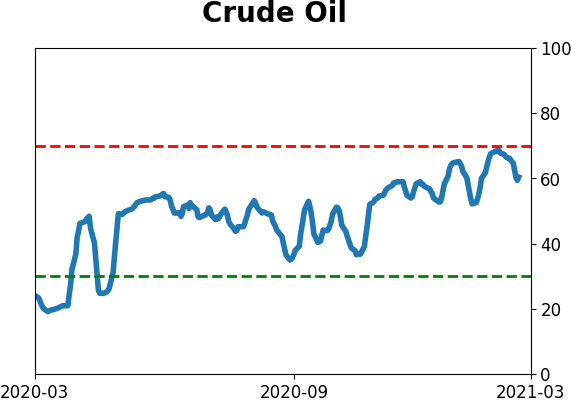
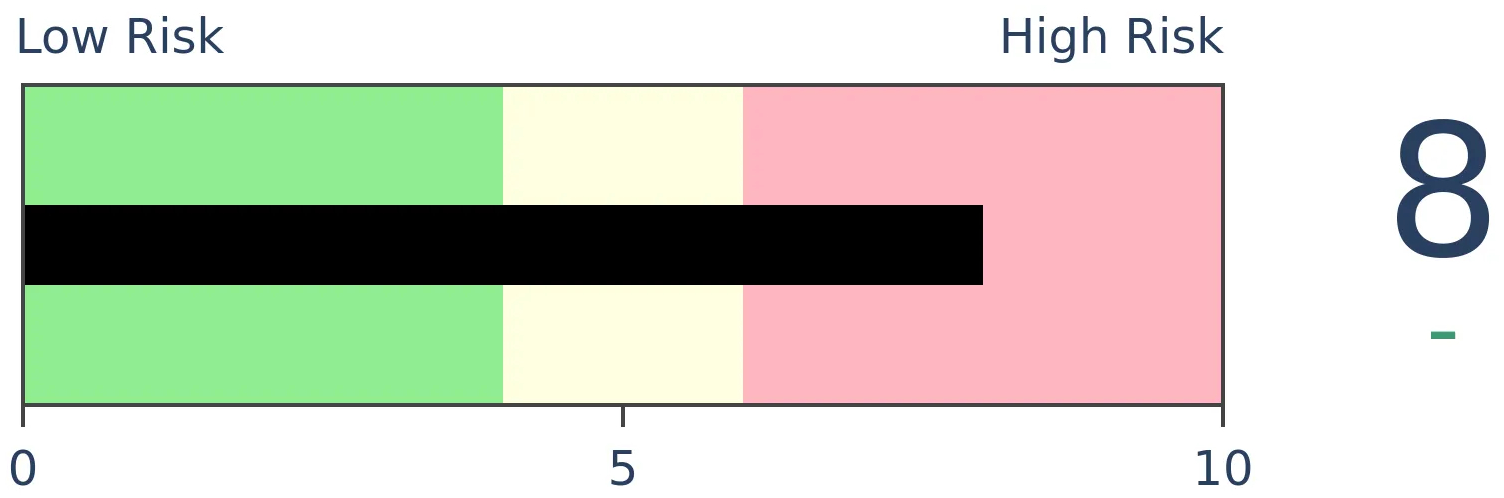
Crude Oil
|
|
Gold
|
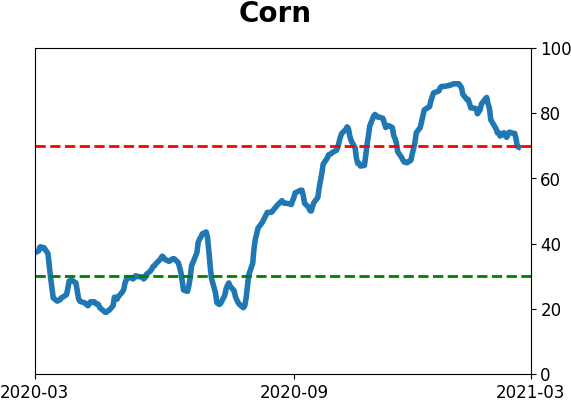
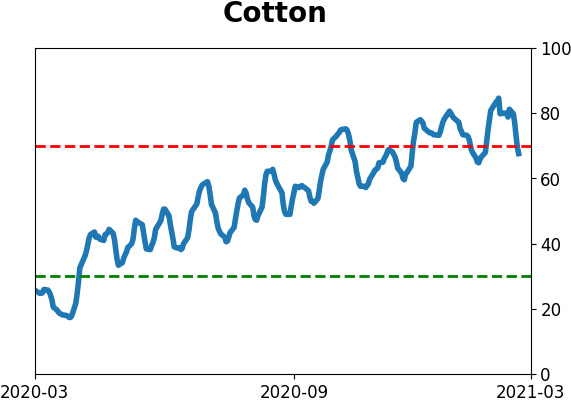
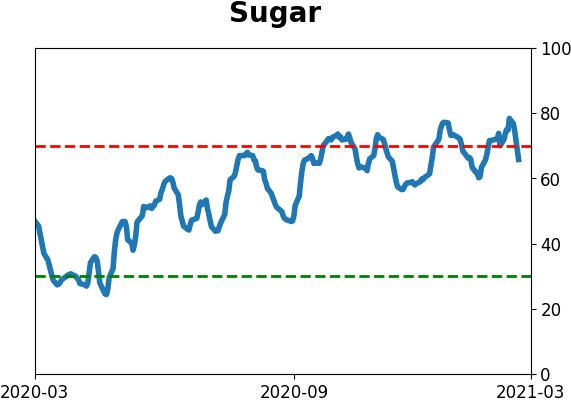
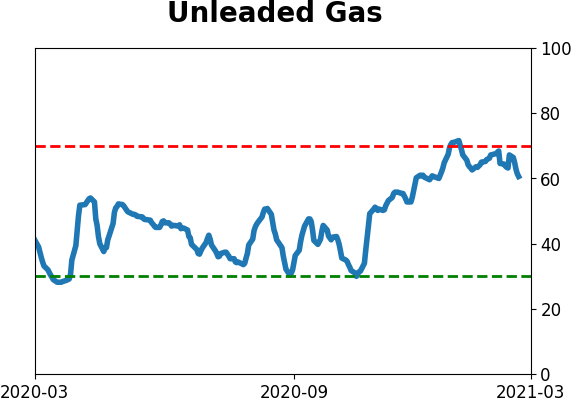
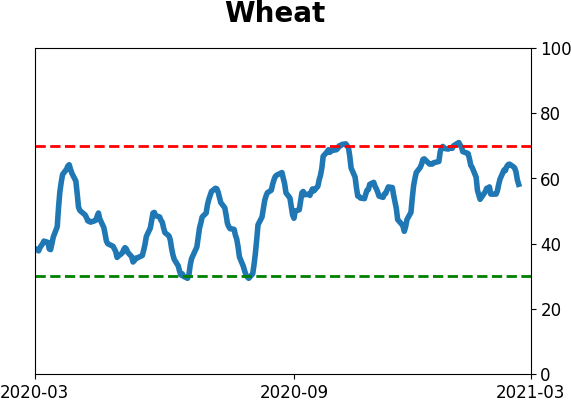
Agriculture
|
|
Research
BOTTOM LINE
Thanks to a big split between winning and losing securities, the HiLo Logic indexes on both the NYSE and Nasdaq have spiked to worrying degrees.
FORECAST / TIMEFRAME
SPY -- Down, Medium-Term
|
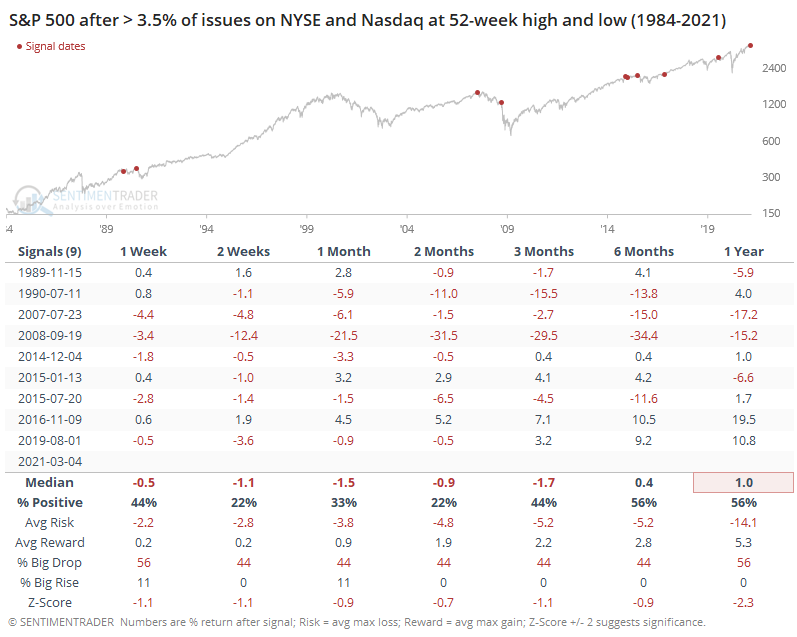
A few times last week, we looked at the "split" in the market between winners and losers. To one of the greatest degrees in history, we're seeing a large number of securities at 52-week highs and a large number at 52-week lows at the same time.
There is no doubt this is being heavily influenced by the sudden drop in SPACs, which have been distorting the breadth numbers for months. Whenever there is a split like this, there's always an excuse. In prior years, the split was "only" because of bank stocks, or energy stocks, or rate-sensitive issues. The vast majority of the time, that doesn't matter. It is what it is.
Does the influence of SPACs this time mean we should ignore the warnings? I dunno. Maybe? Trying to outsmart the indicators and guess when they matter and when they don't has never been consistently successful.
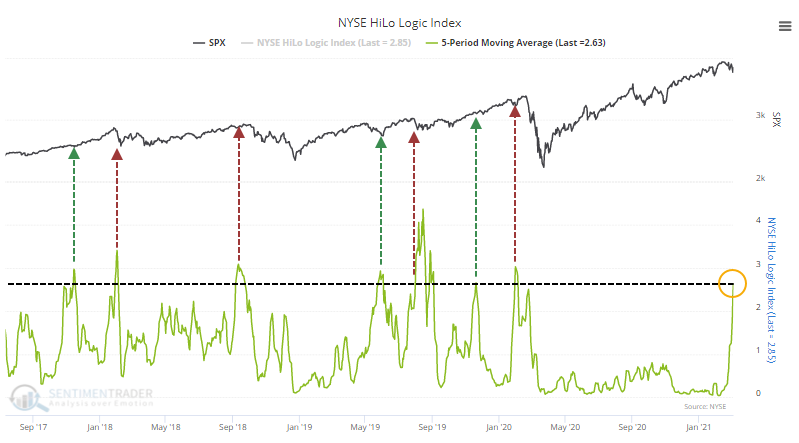
Last week, Jay noted that this kind of split is what makes the HiLo Logic Index spike higher. The indicator is simply the lesser of 52-week highs and 52-week lows. Bull markets are typically preceded by very low readings, when everything is in gear one way or the other. Bear markets, or at least tough market conditions, tend to be preceded by times when markets are split between winners and losers. Like now.
Over the past 5 days, the HiLo Logic Indexes on both the NYSE and Nasdaq have averaged a very high reading. In recent years, this has had a mixed record, roughly preceding 3 rallies and 4 declines. Generally, if it was going to matter, then it mattered right away.
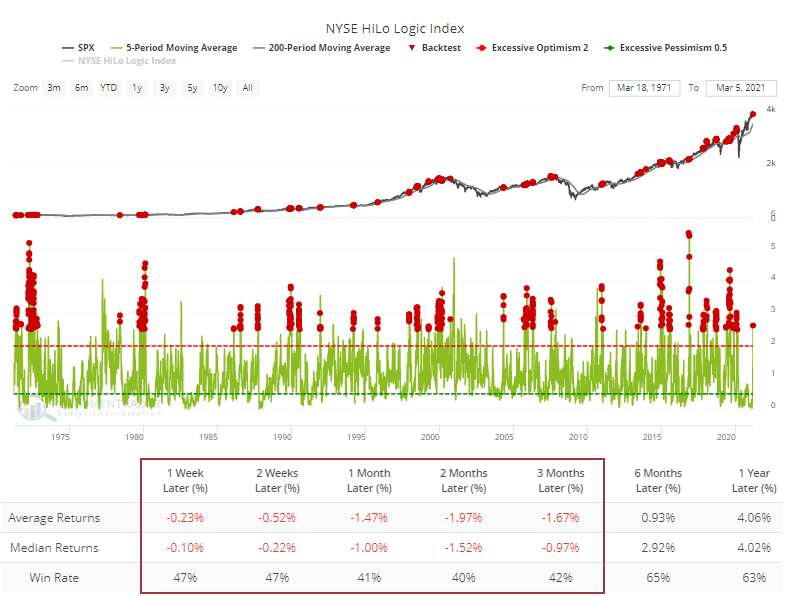
Over a long time frame, the Backtest Engine shows that anytime the NYSE figure averaged more than 2.5 over a week, forward returns were very poor. The test includes only those times when the S&P 500 was above a rising 200-day moving average at the time.
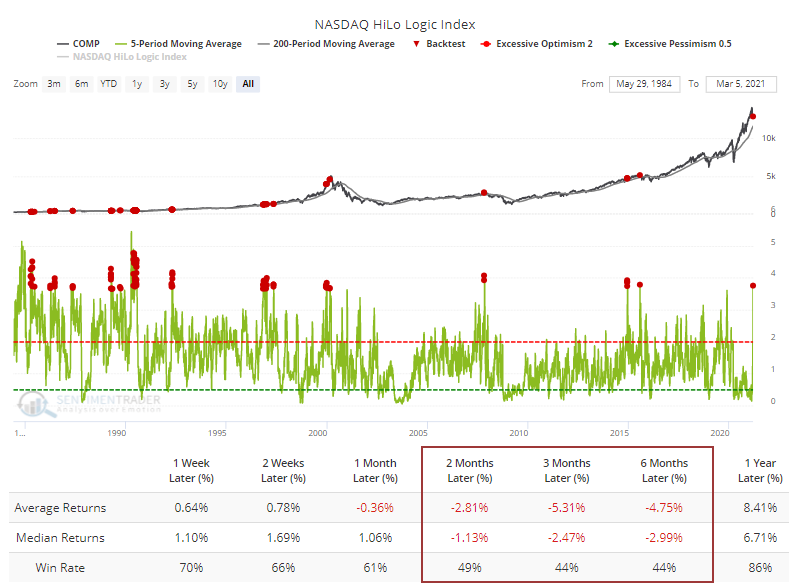
The same can be said for the Nasdaq.
In the Minutes last week, we looked at the combination of these on both exchanges, with the precedents being disturbing.
One of the saving graces this time is that leading up to the last week, the HiLo Logic has been extremely low. That's because 52-week highs had overwhelmed 52-week lows, once again thanks in large part to the roaring performance of SPACs. Other times the HiLo index was very low and then spiked higher, the declines tended to be more muted.
We rate these splits as a negative, with the modest caveats that it's being heavily influenced by one particular corner of the market, and it was preceded by very healthy internal conditions.
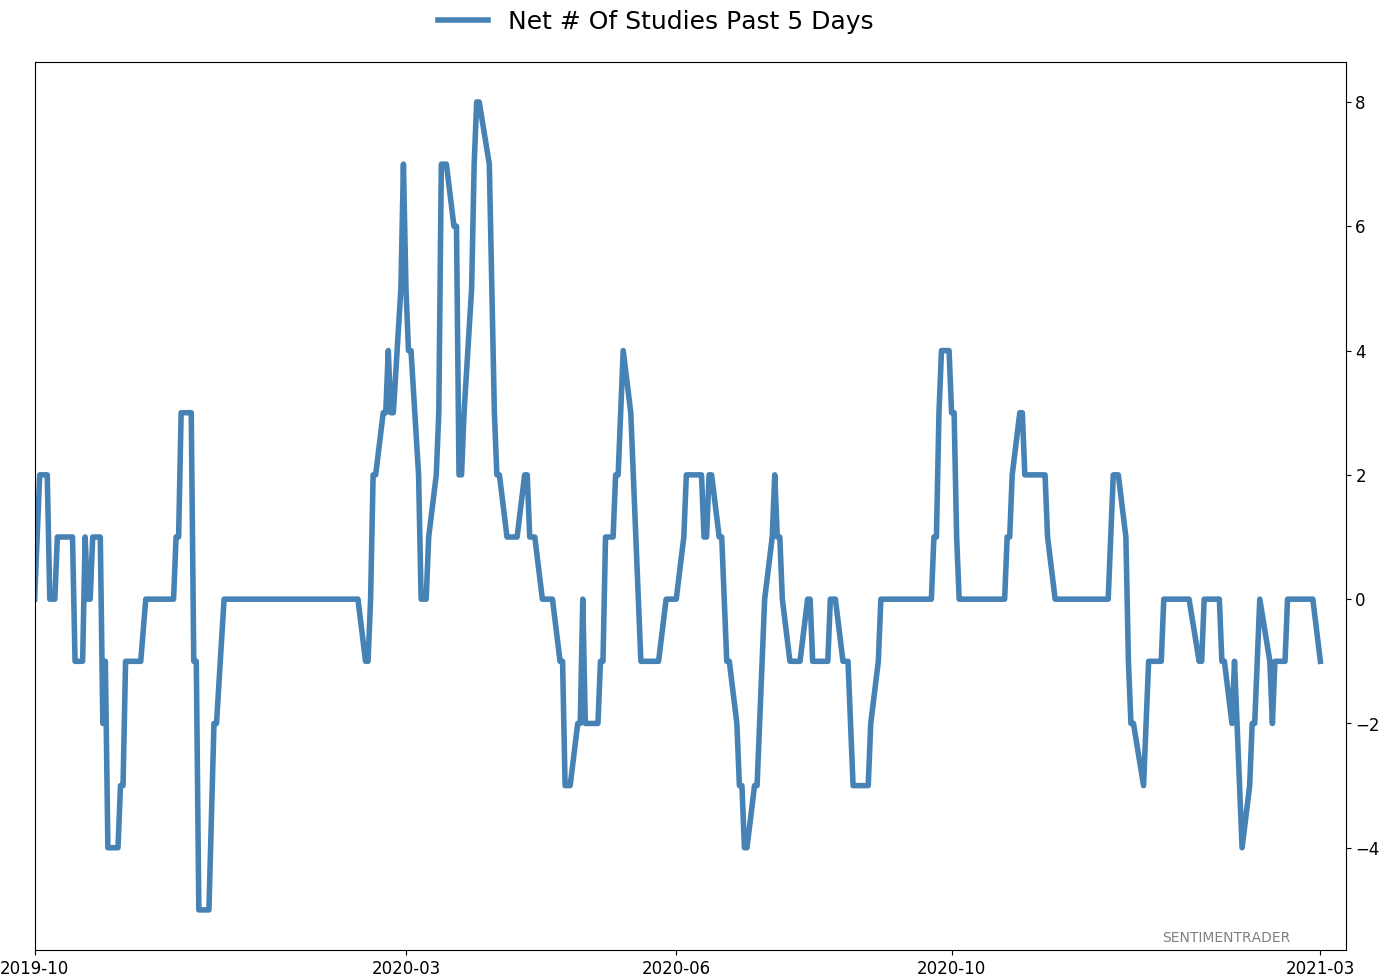
Active Studies
| Time Frame | Bullish | Bearish | | Short-Term | 0 | 0 | | Medium-Term | 2 | 9 | | Long-Term | 16 | 3 |
|
Indicators at Extremes
Portfolio
| Position | Description | Weight % | Added / Reduced | Date | | Stocks | RSP | 4.9 | Reduced 4% | 2021-02-09 | | Bonds | 30.0% BND, 8.8% SCHP | 38.8 | Added 15.1% | 2021-02-18 | | Commodities | GCC | 2.3 | Reduced 2.1%
| 2020-09-04 | | Precious Metals | GDX | 9.0 | Added 0.1% | 2021-02-18 | | Special Situations | 7.3% XLE, 4.8% PSCE | 12.1 | Reduced 5.6% | 2021-02-18 | | Cash | | 32.8 | | |
|
Updates (Changes made today are underlined)
With a market that has seen the kinds of broad participation and big breath thrusts like we did in the fall, it's hard to become too negative. Those kinds of conditions have consistently preceded higher returns over the next 6-12 months. It's the interim that's more of an issue. Even conditions like that haven't prevented some shorter-term pullbacks. And when we combine an environment where speculation is rampant and recent days have seen an increase in cracks under the surface of the indexes, it's enough to become more defensive over a short- to medium-term time frame. We still don't have much confirmation from the price action in the indexes, so those who are more conservative would likely wait before increasing cash levels. I've decreased risk exposure a bit more, mainly in terms of energy stocks and the ANGL fund, while adding more to the broader bond market. RETURN YTD: 6.4% 2020: 8.1%, 2019: 12.6%, 2018: 0.6%, 2017: 3.8%, 2016: 17.1%, 2015: 9.2%, 2014: 14.5%, 2013: 2.2%, 2012: 10.8%, 2011: 16.5%, 2010: 15.3%, 2009: 23.9%, 2008: 16.2%, 2007: 7.8%
|
|
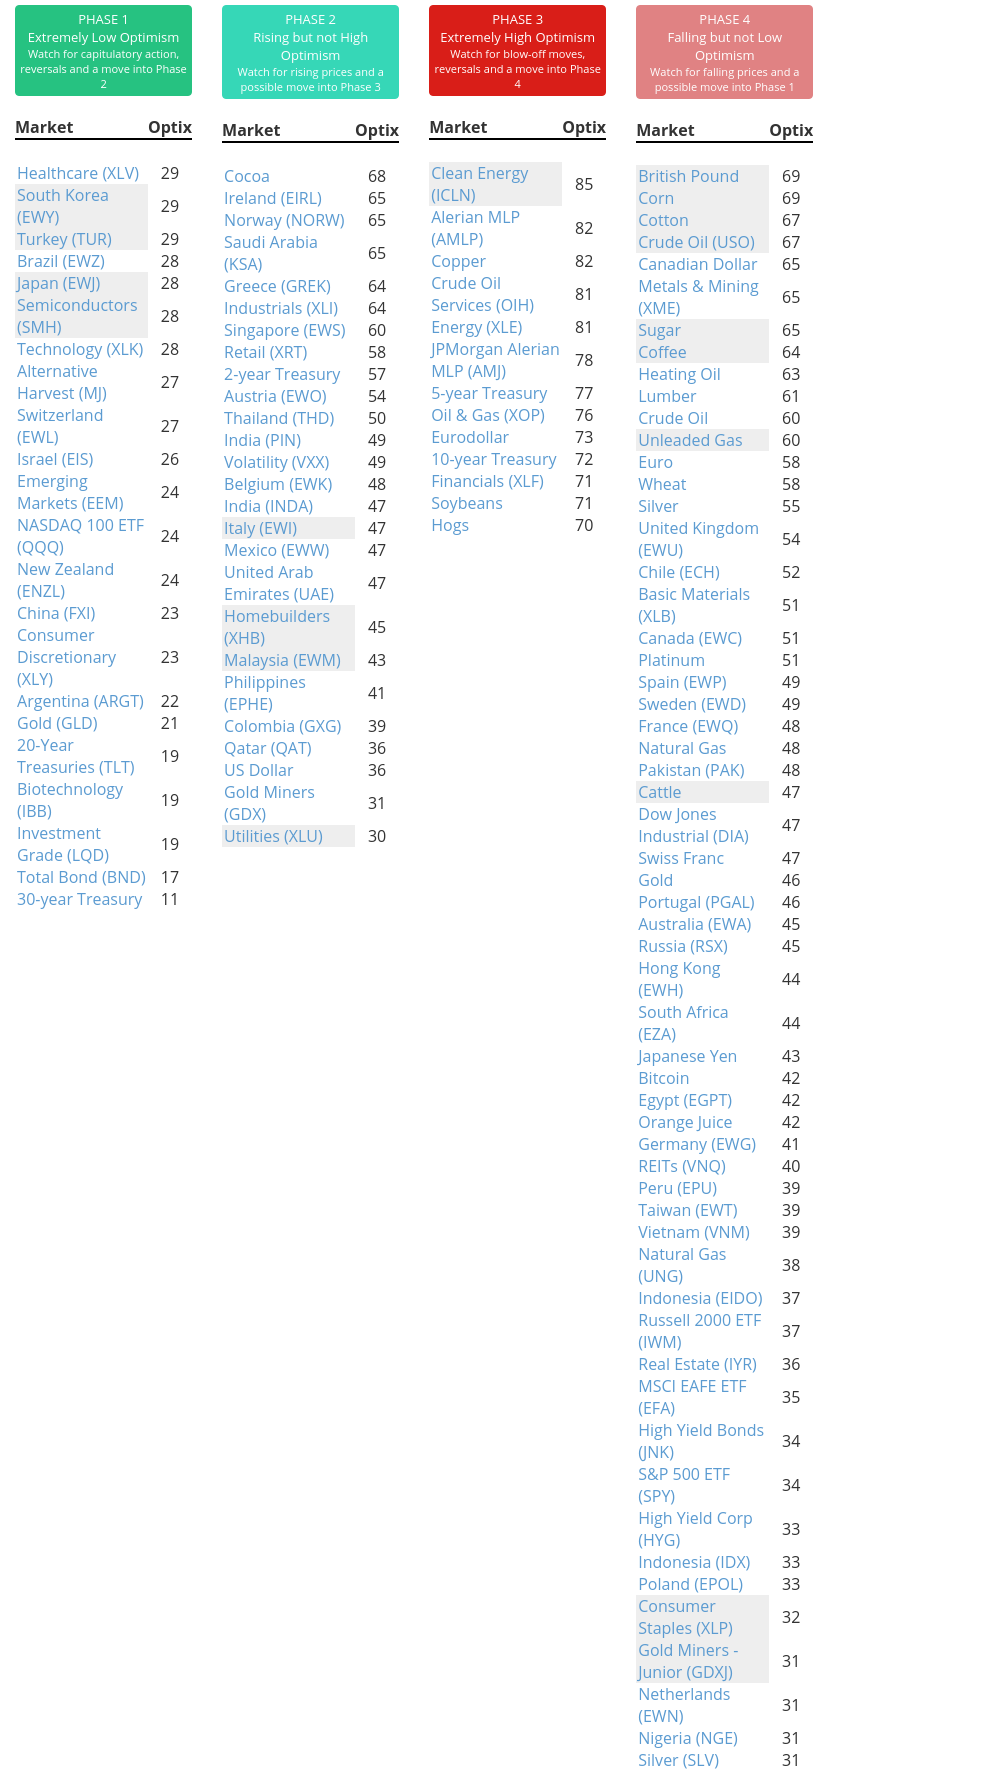
Phase Table
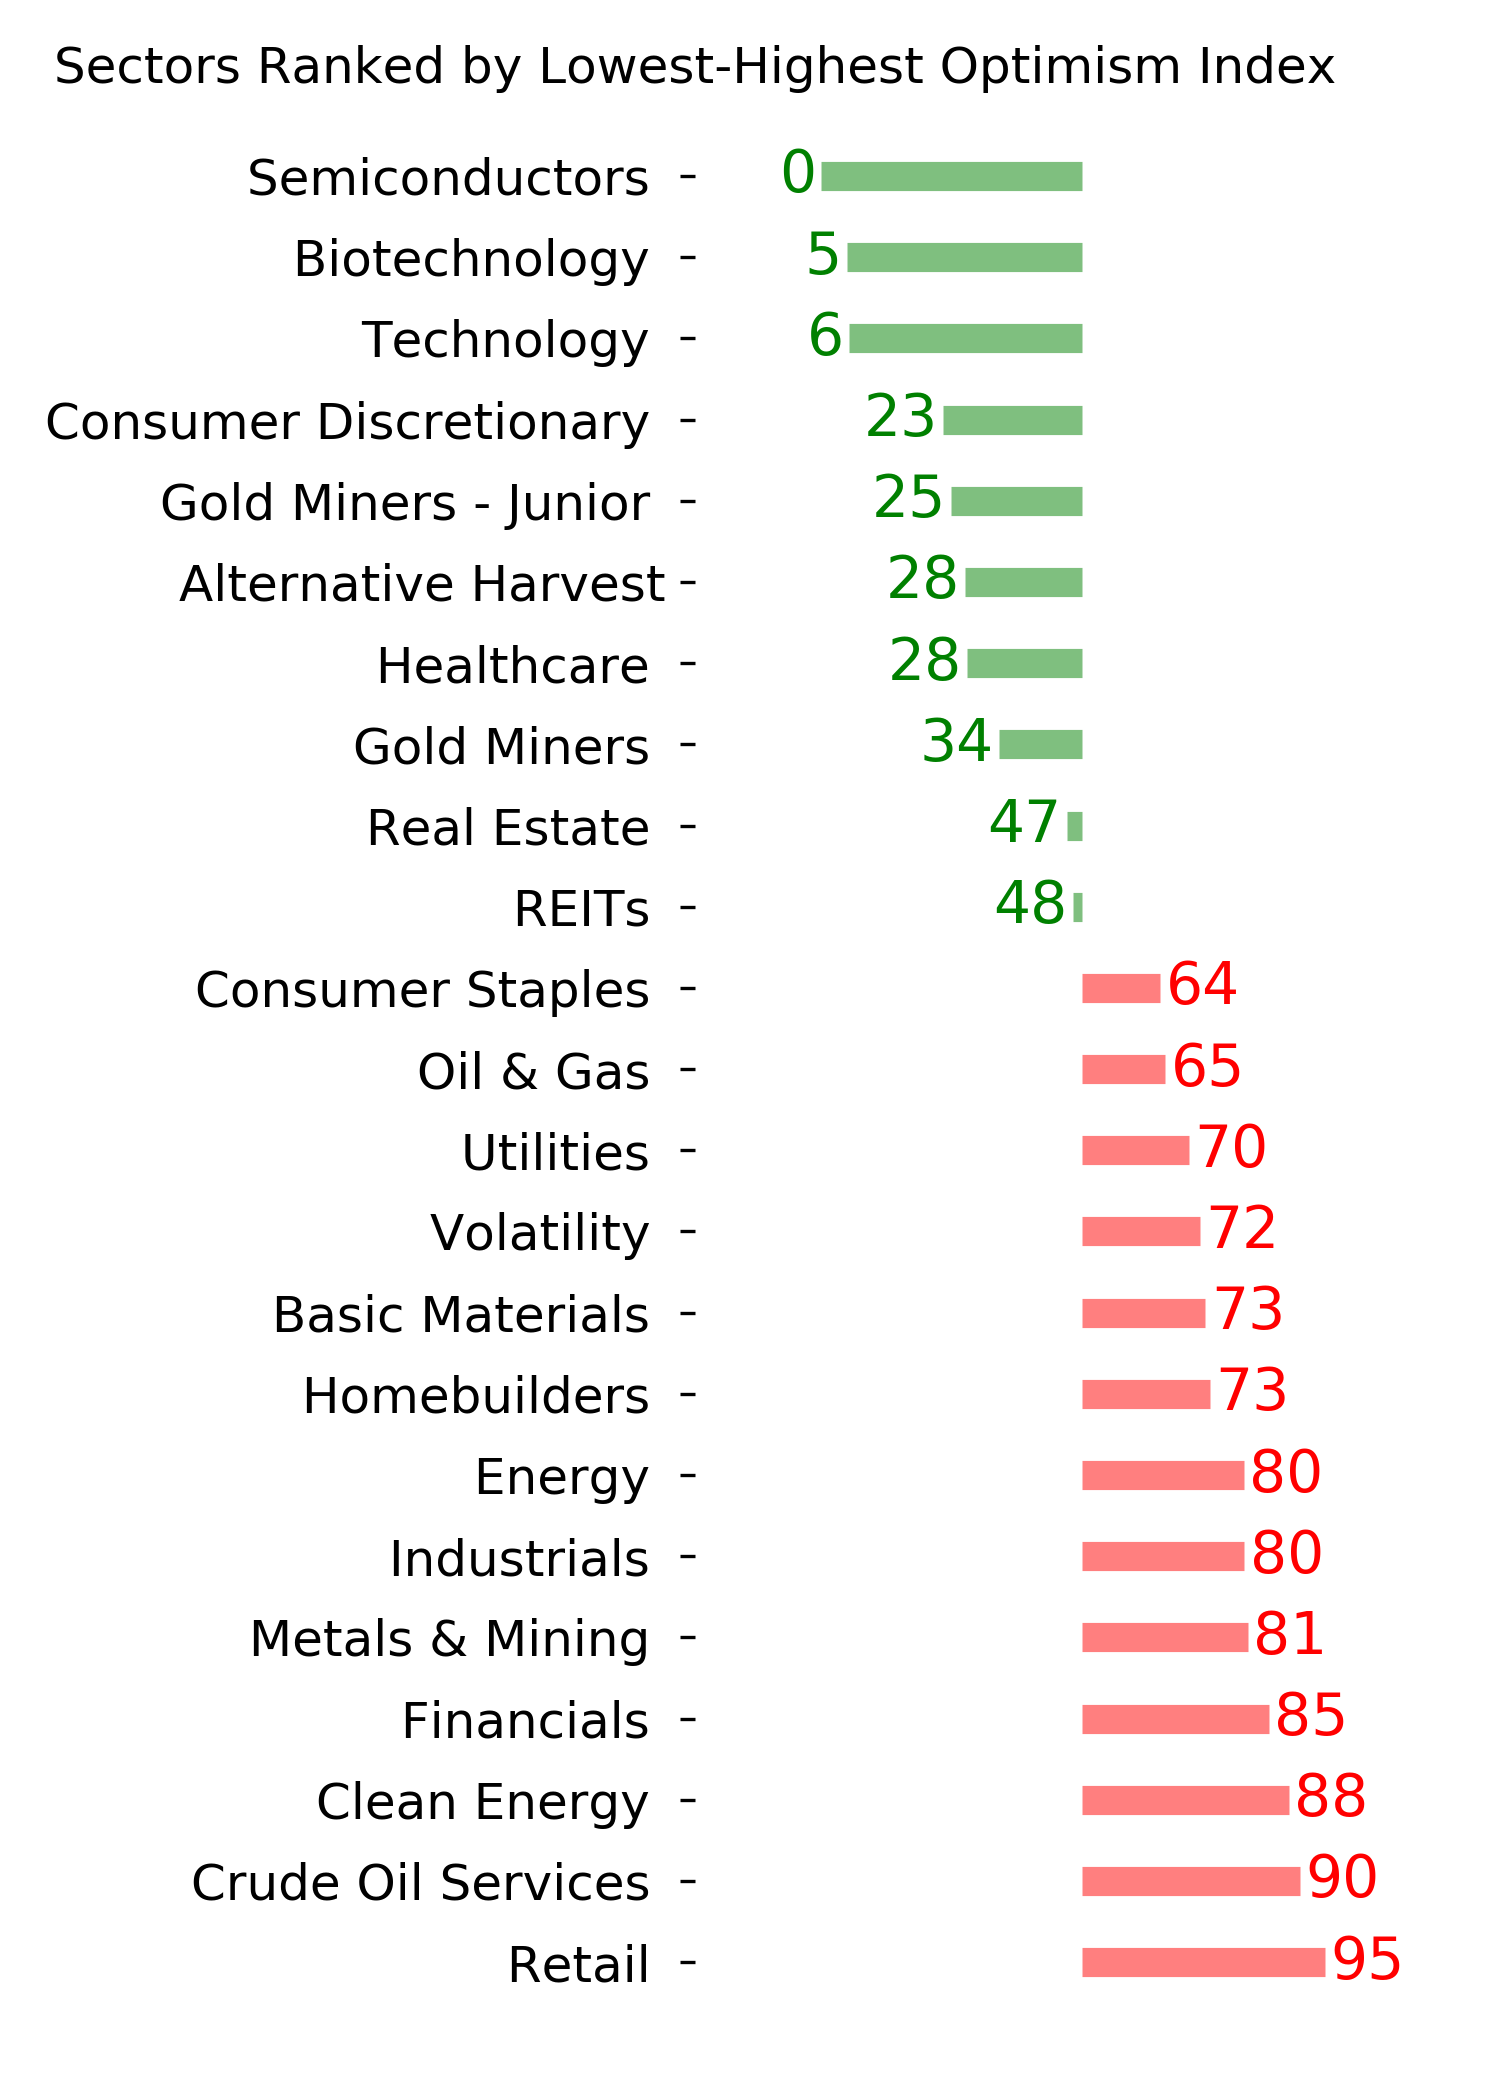
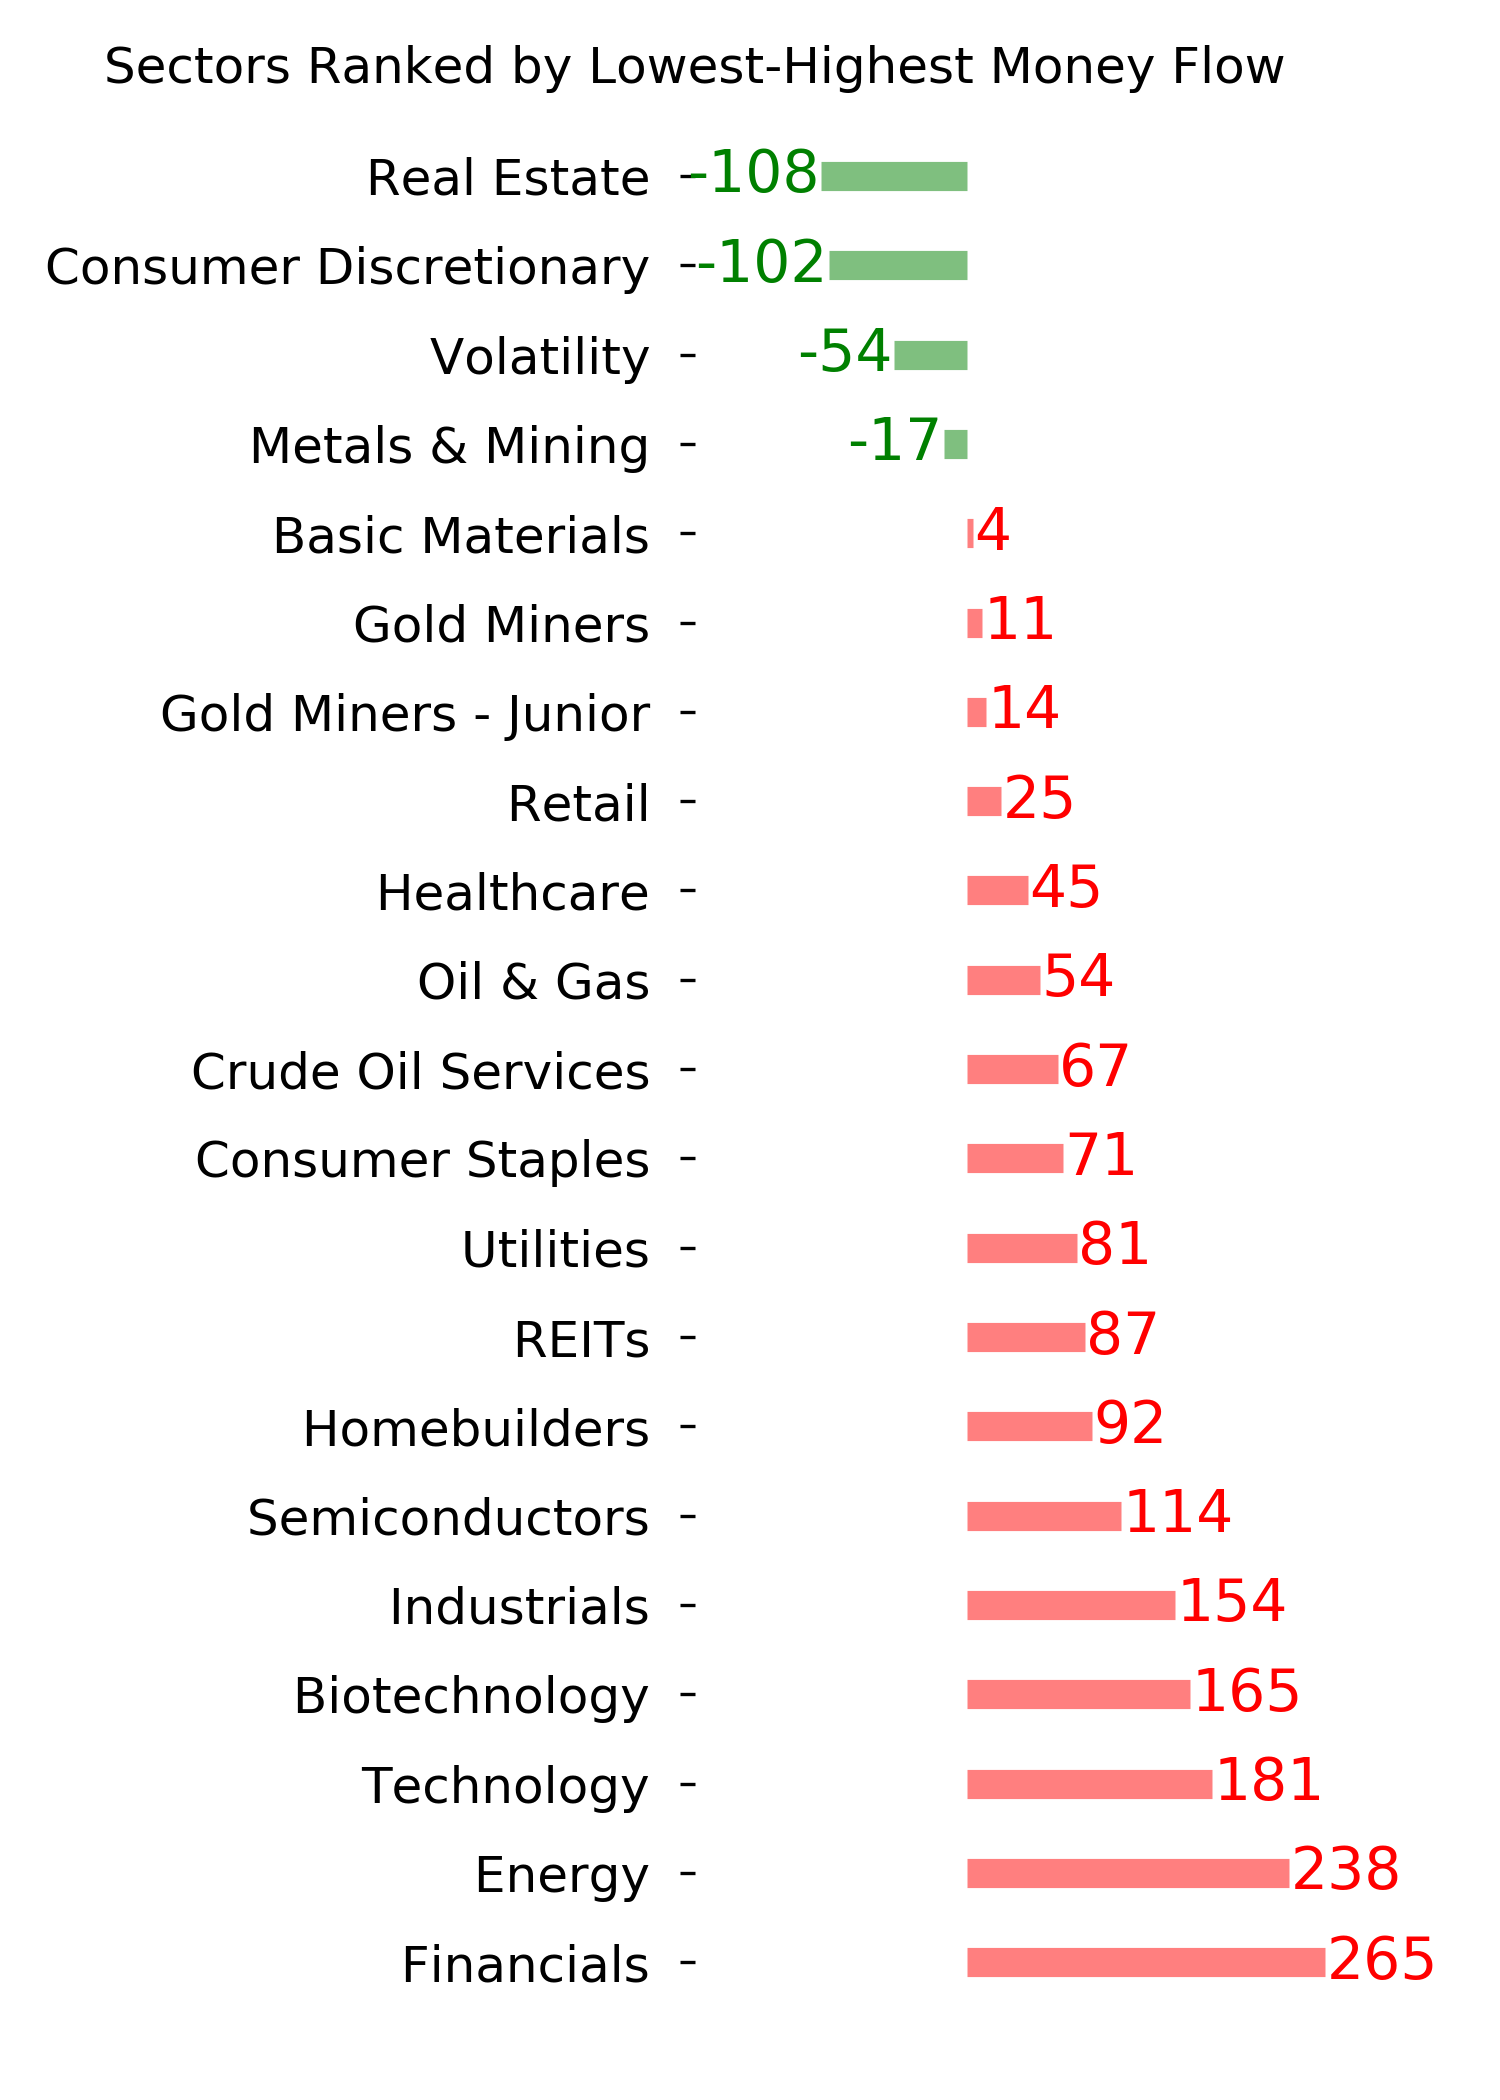
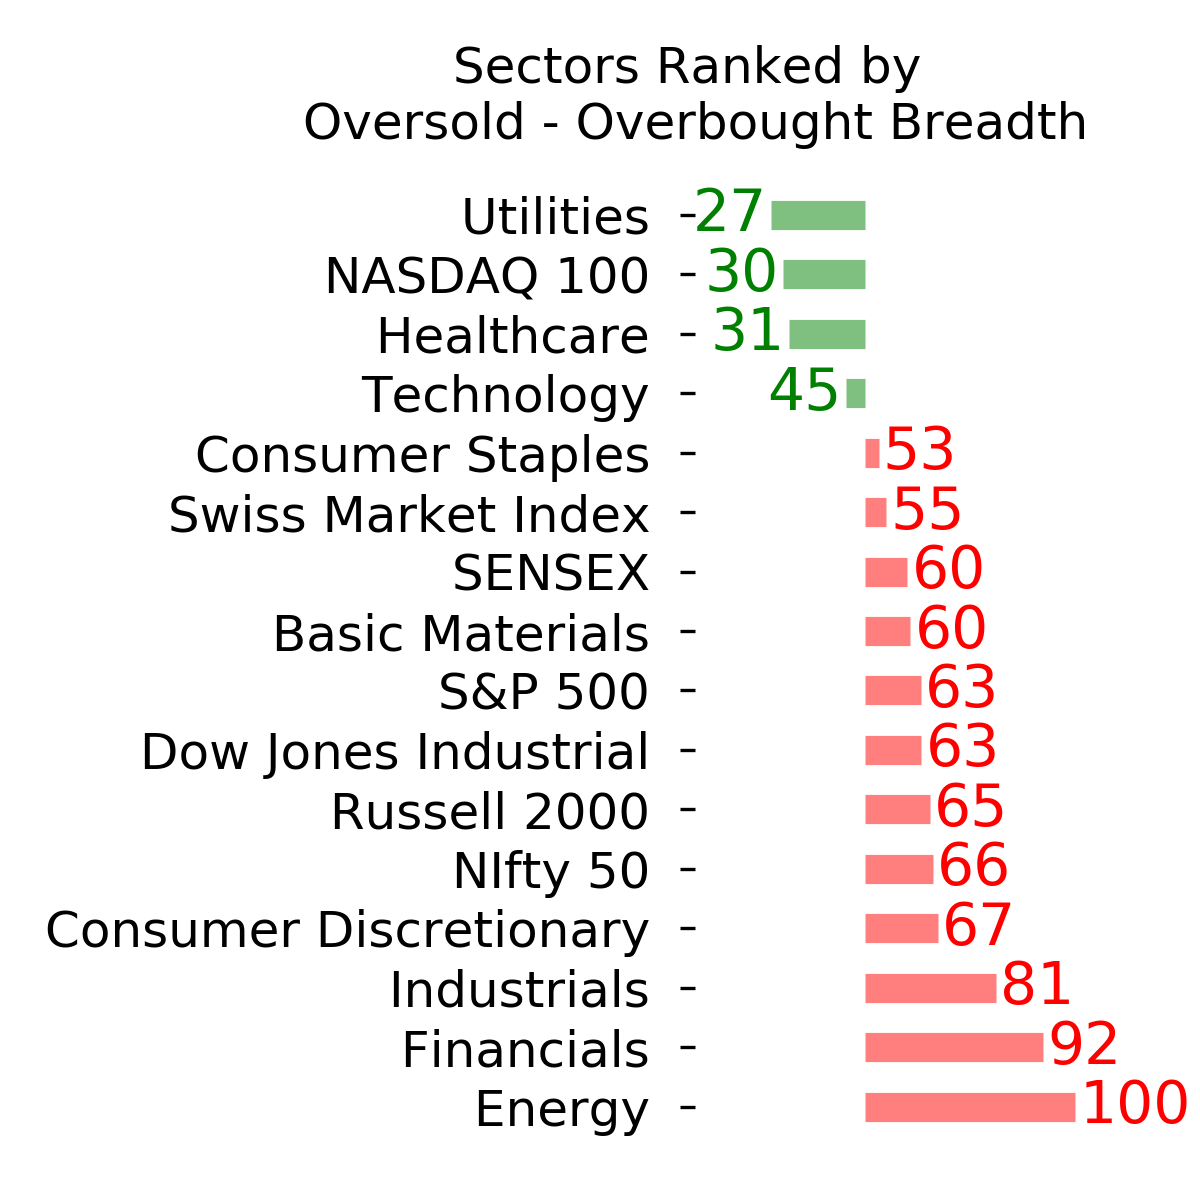
Ranks
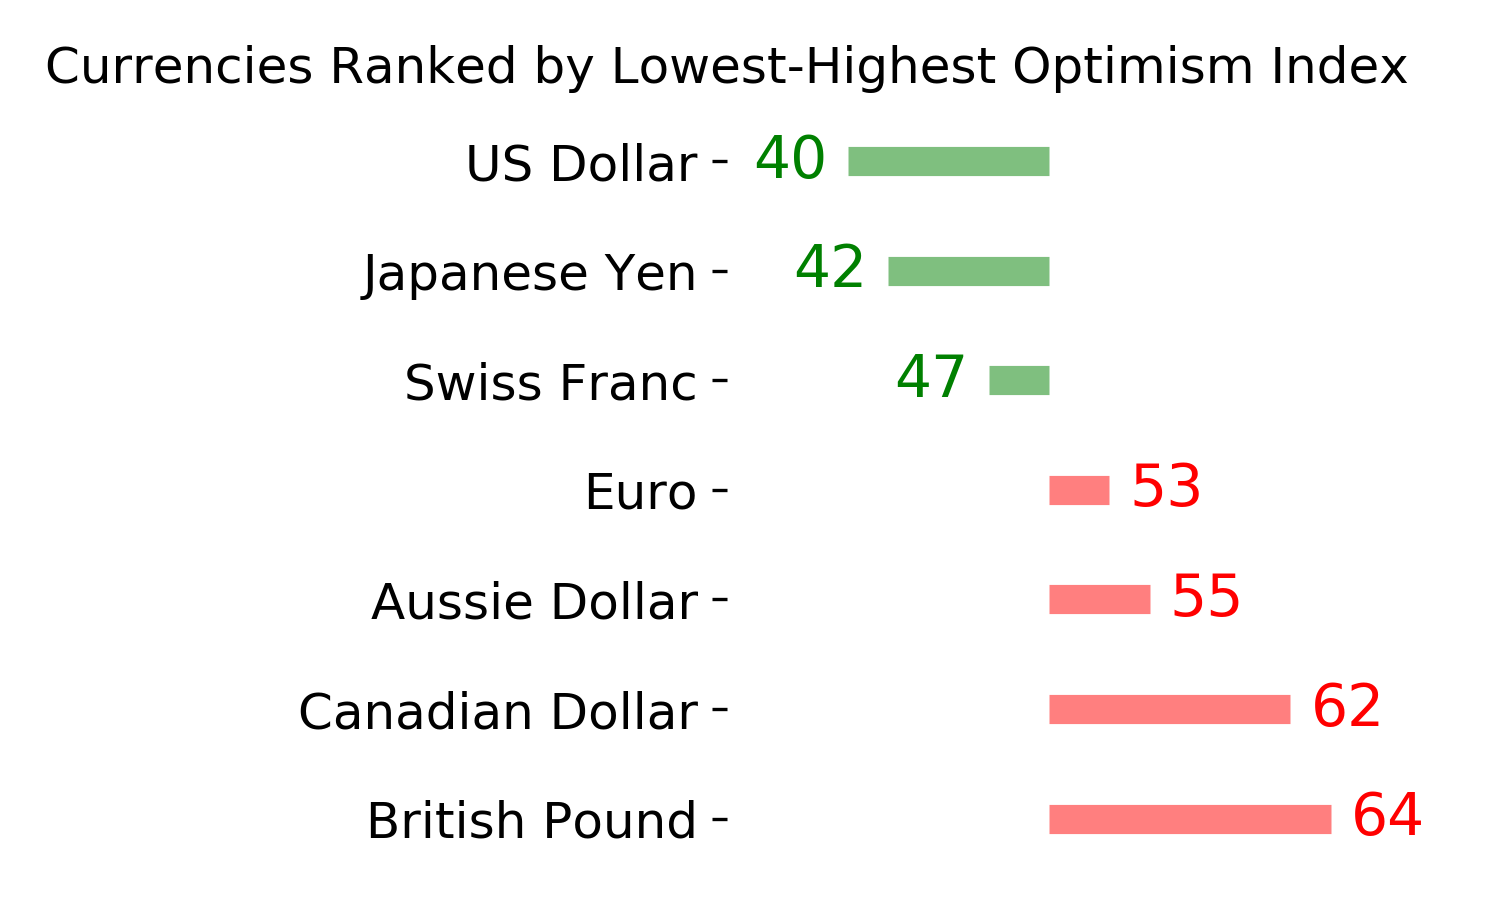
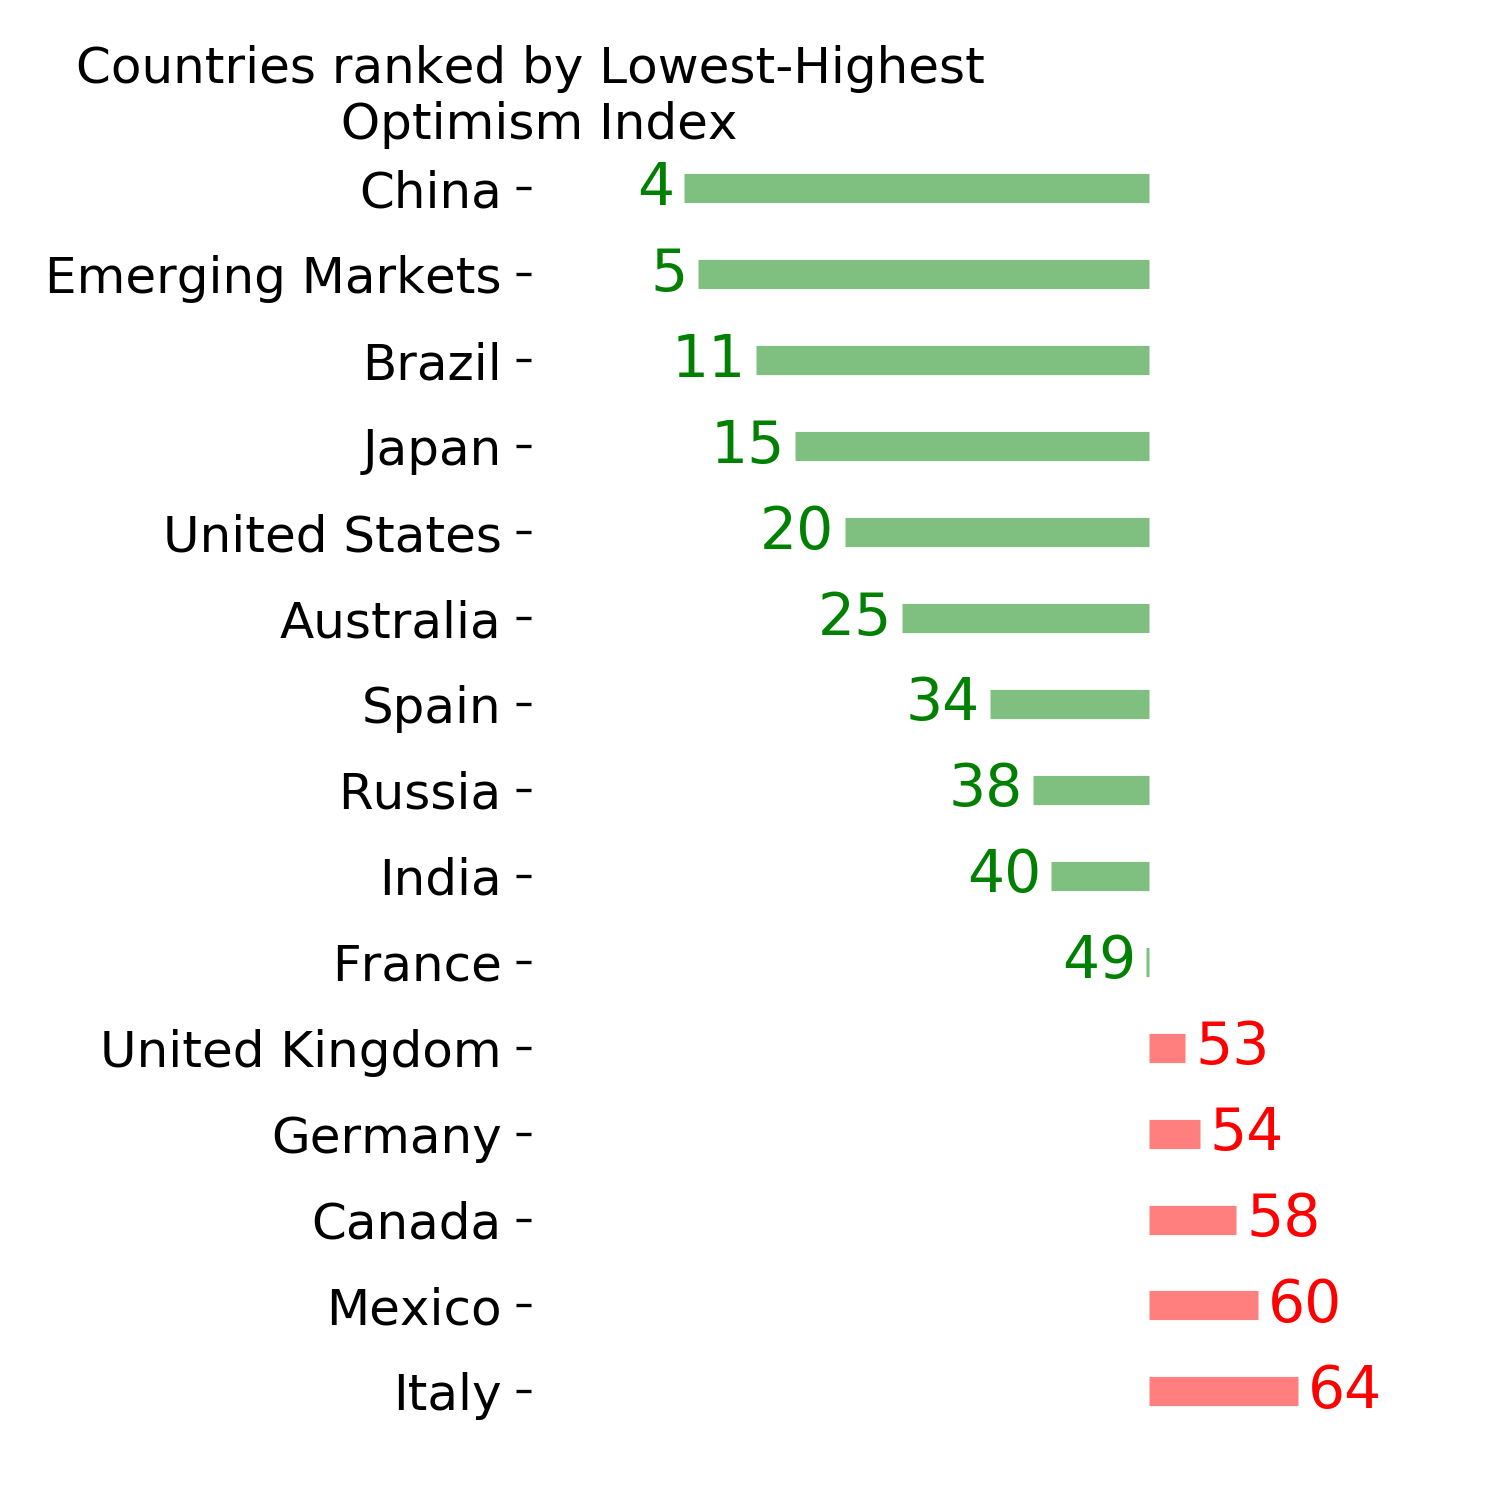
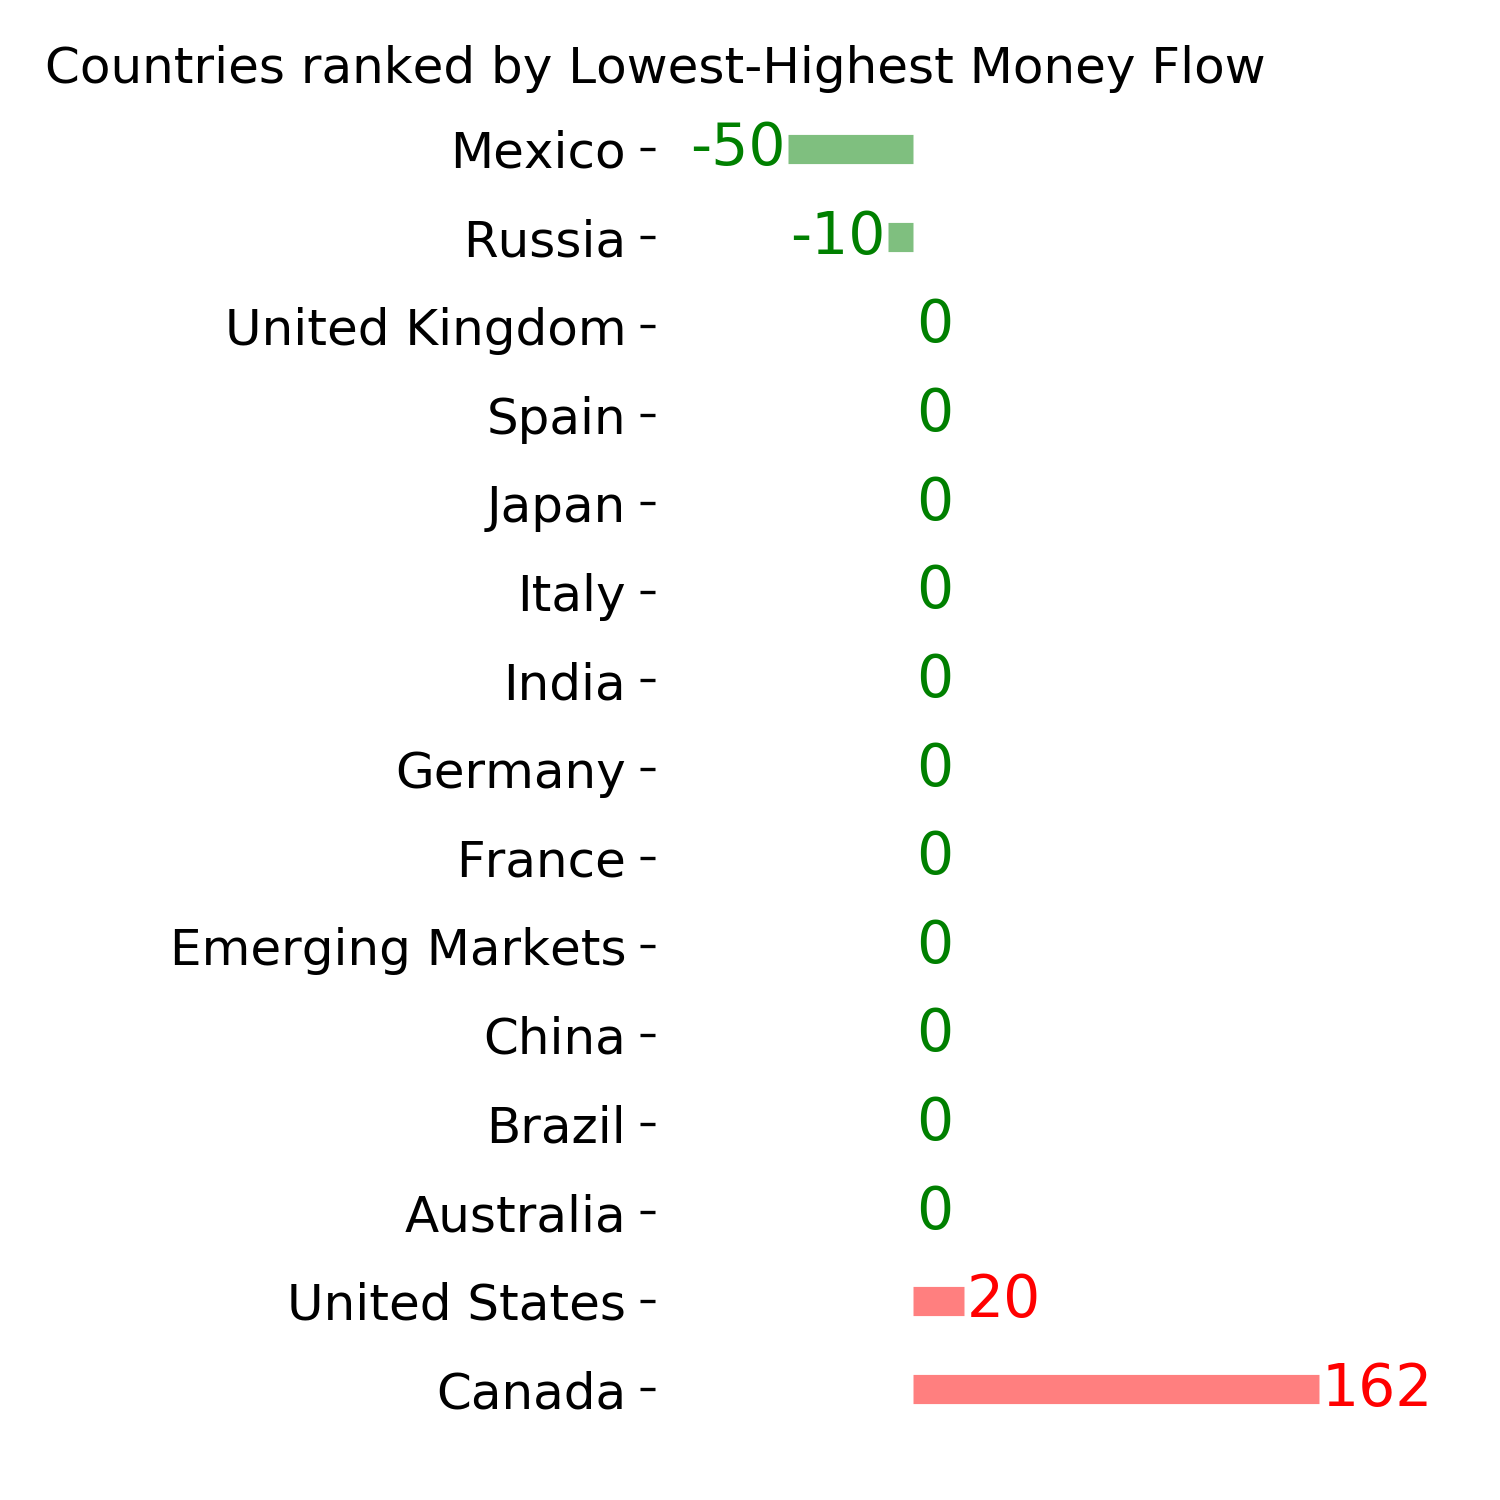
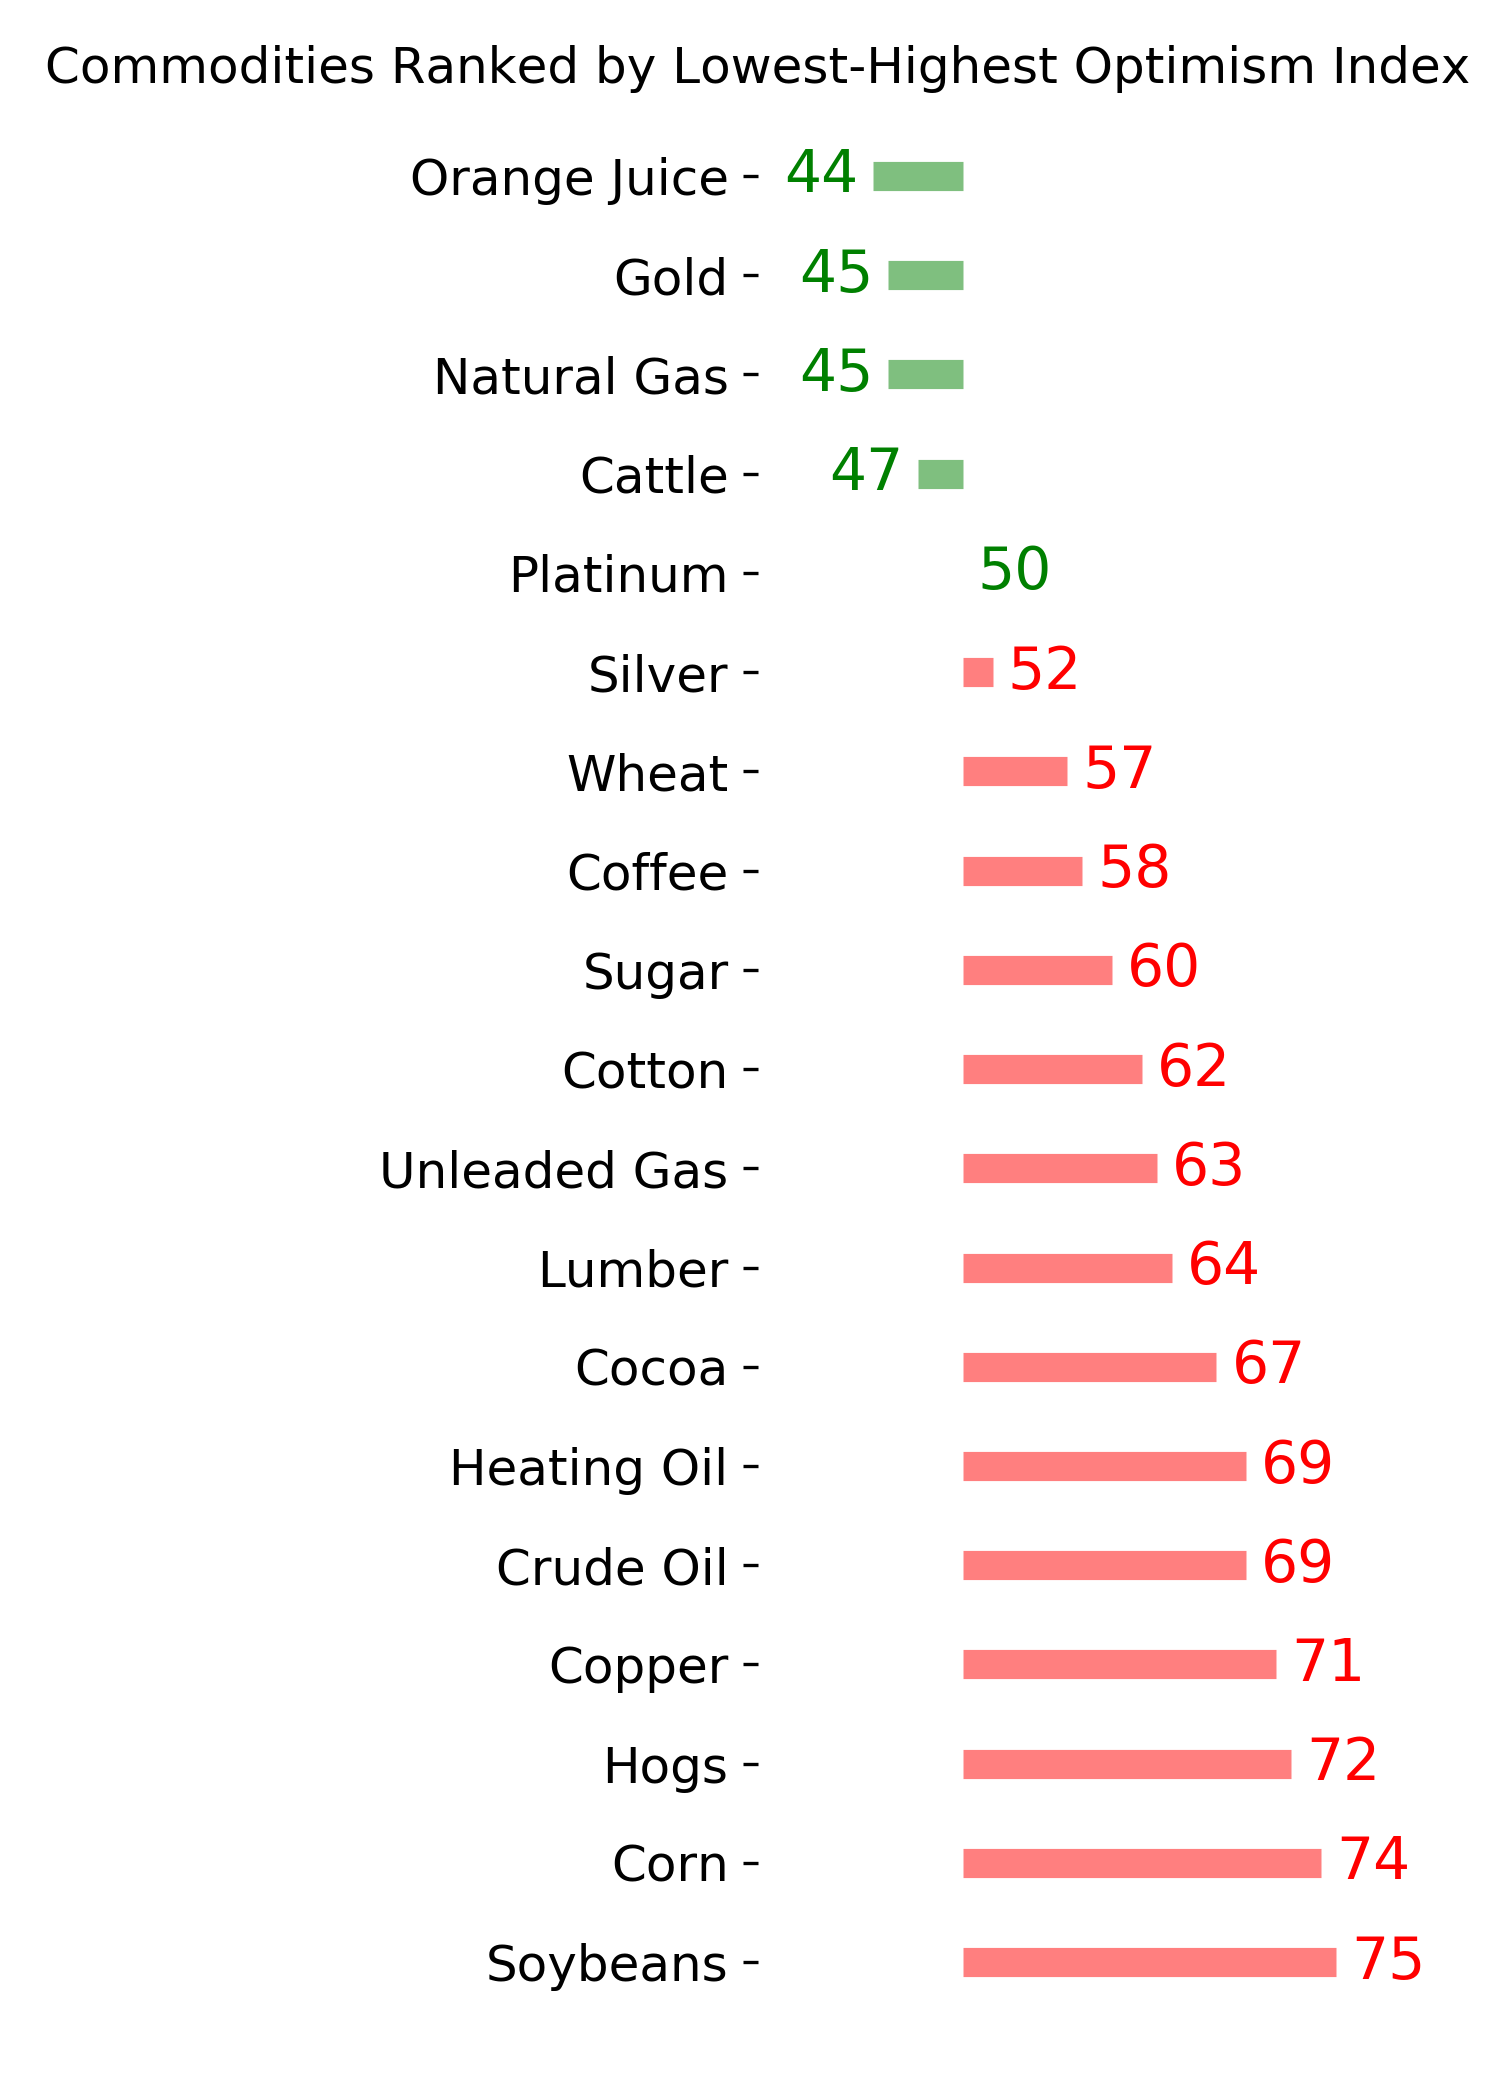
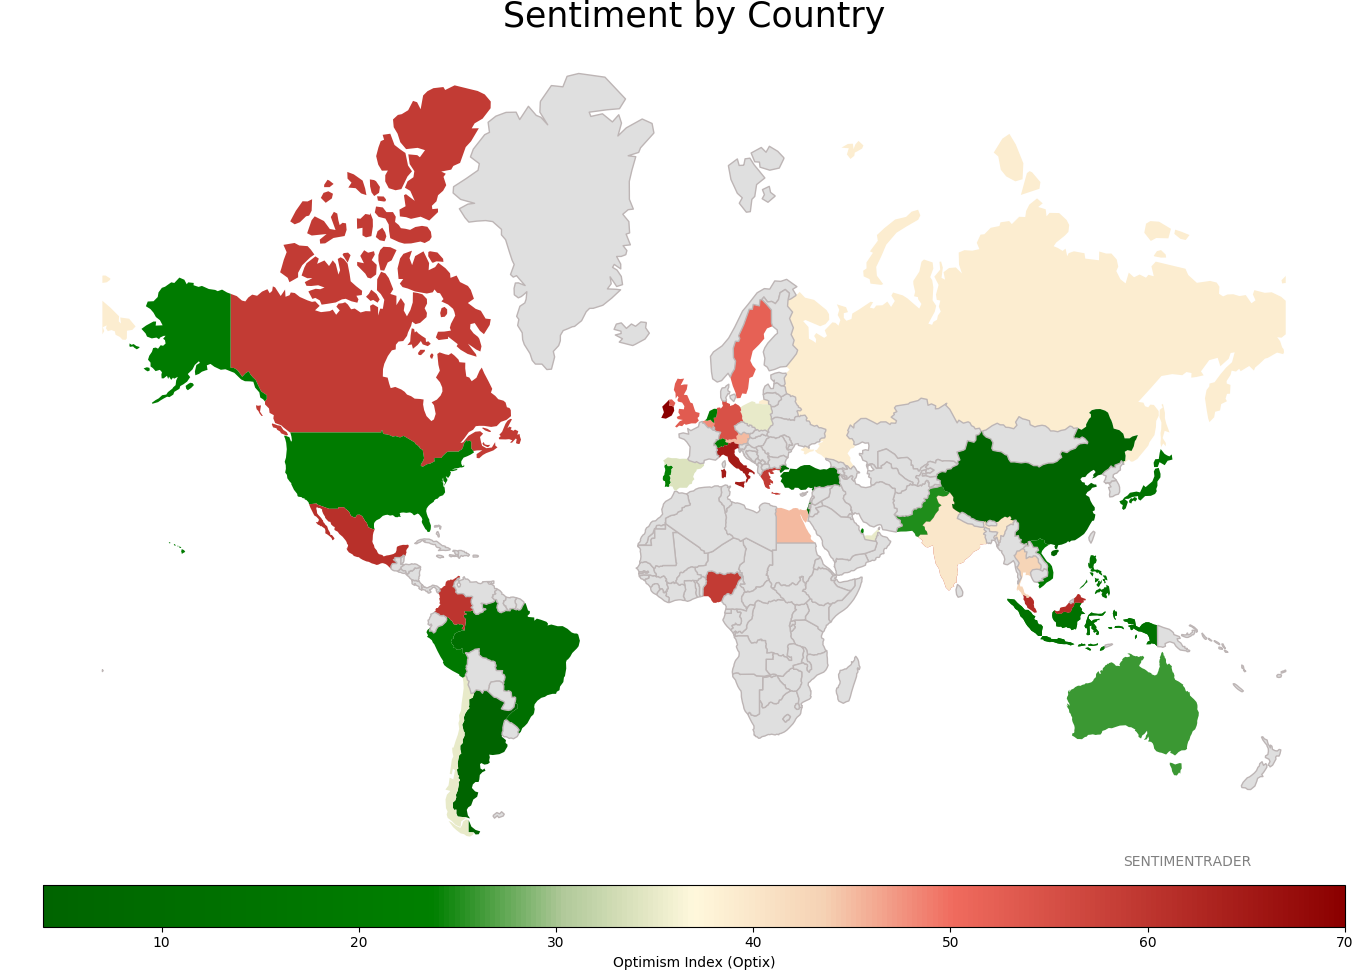
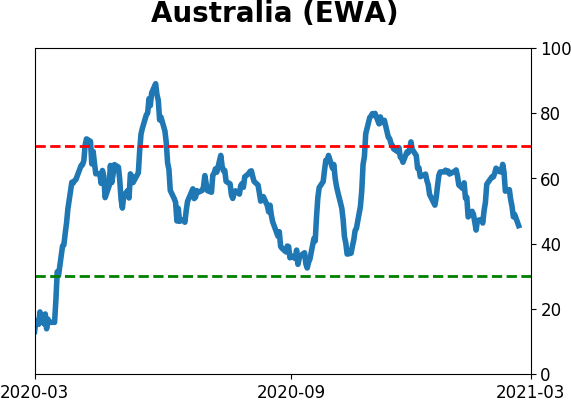
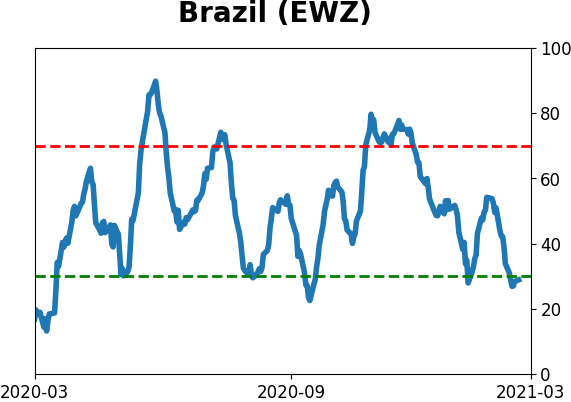
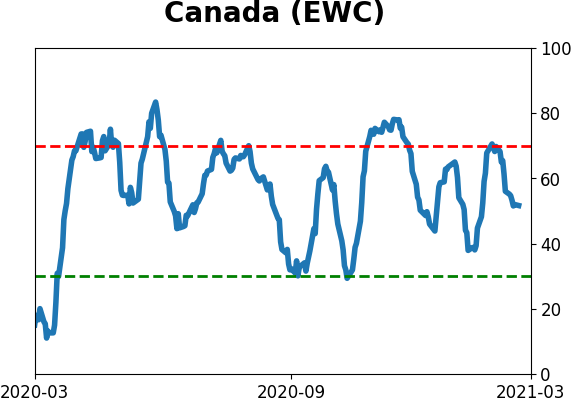
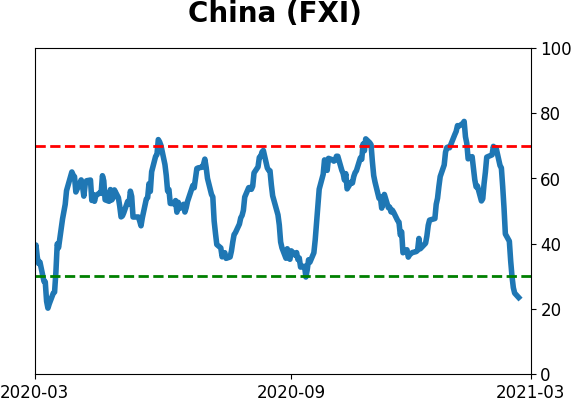
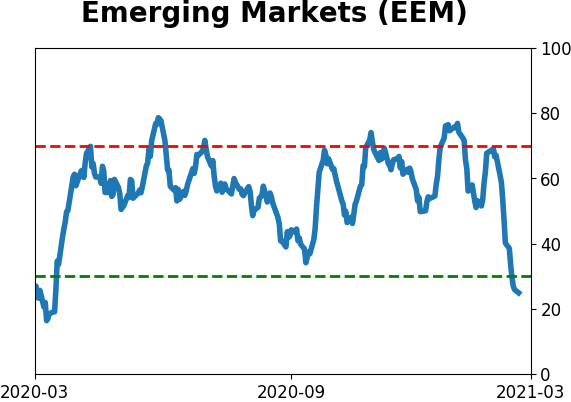
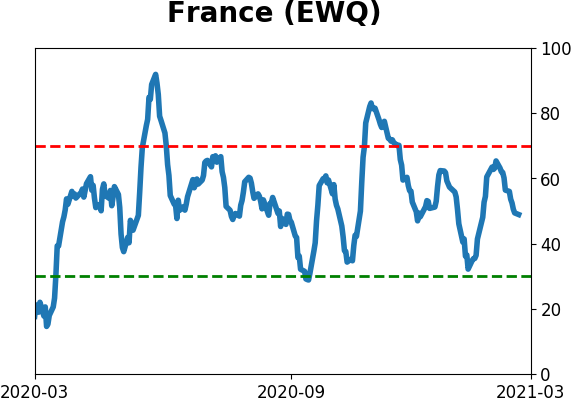
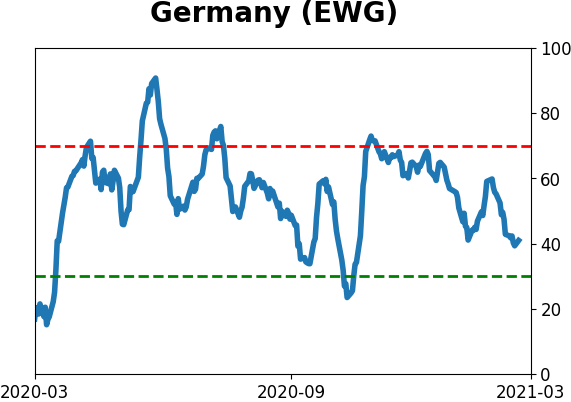
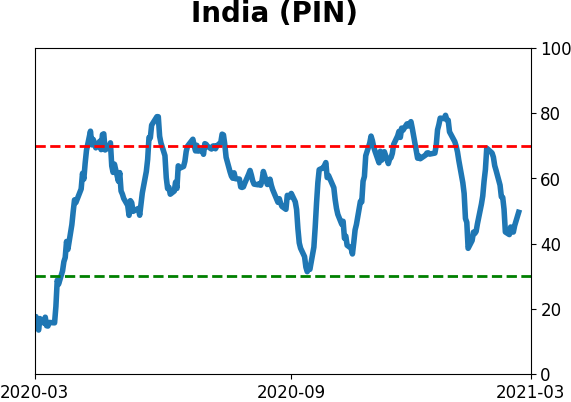
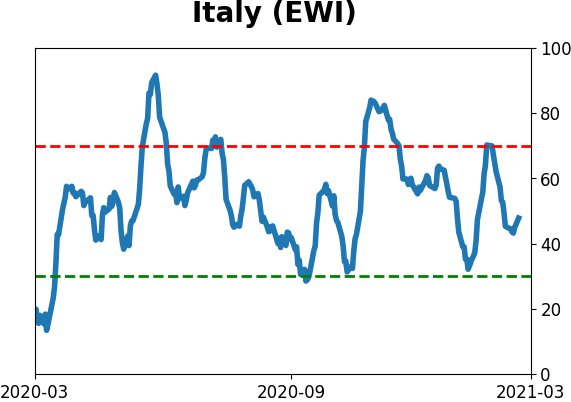
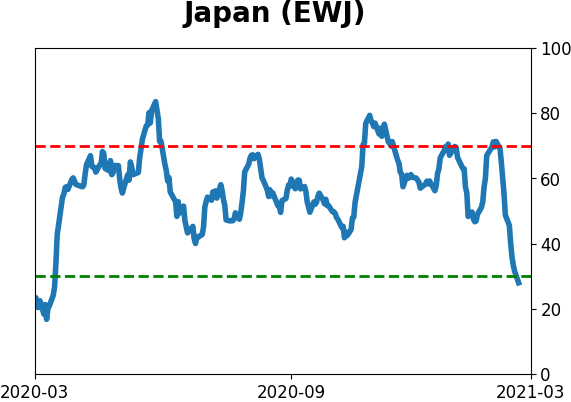
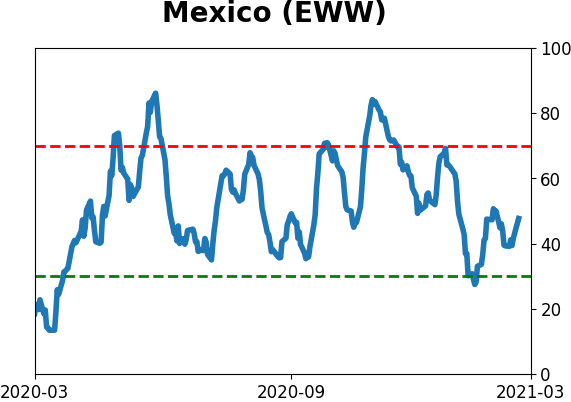
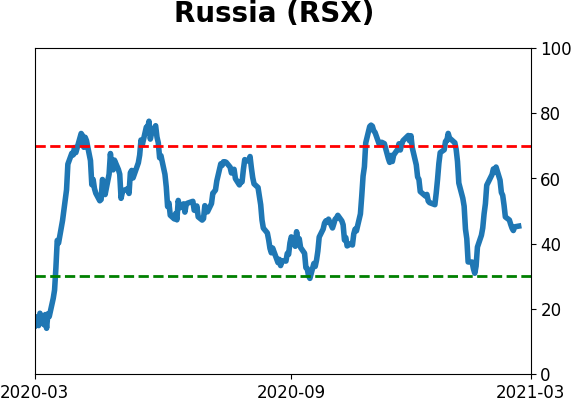
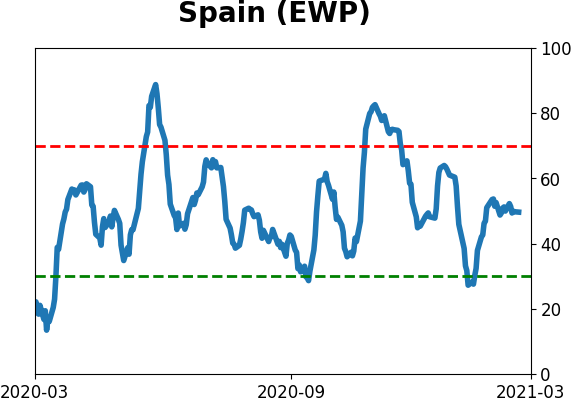
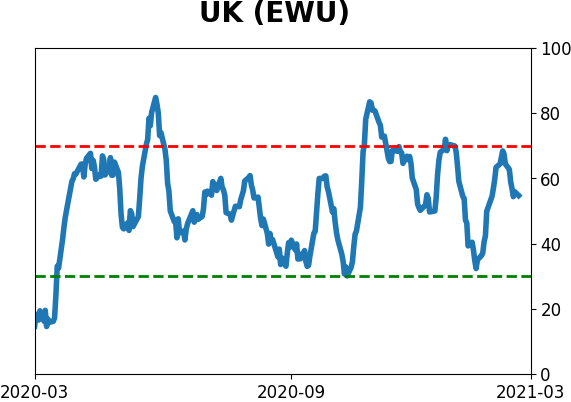
Sentiment Around The World
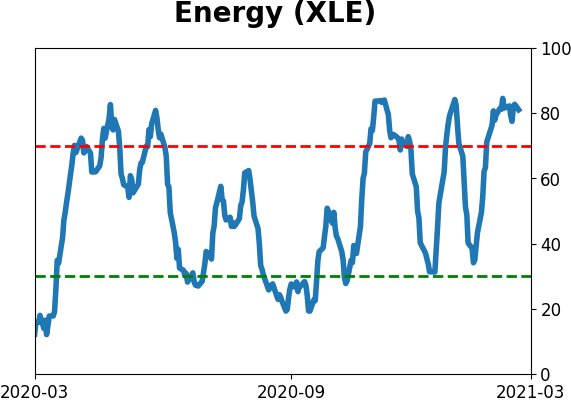
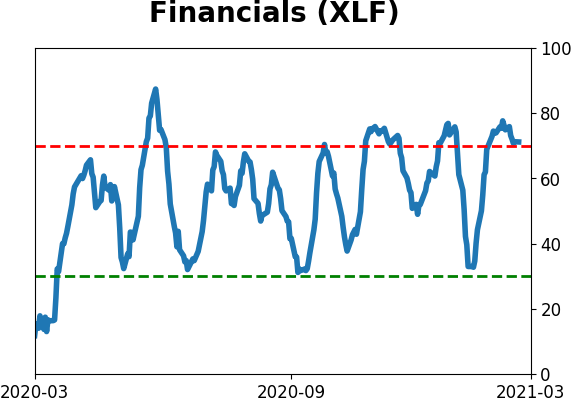
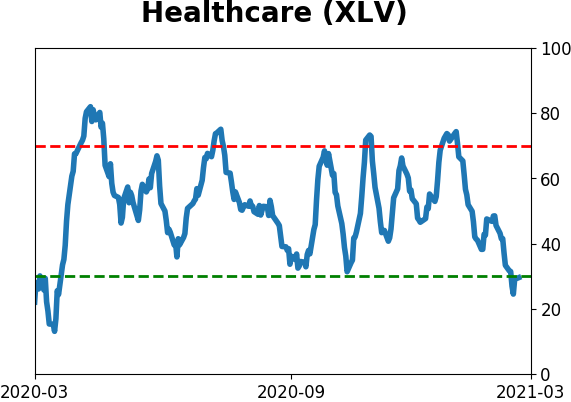
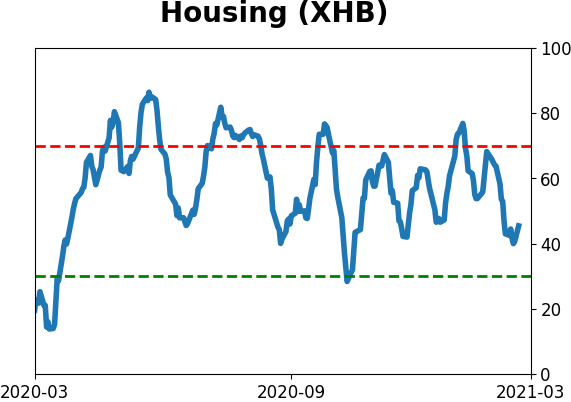
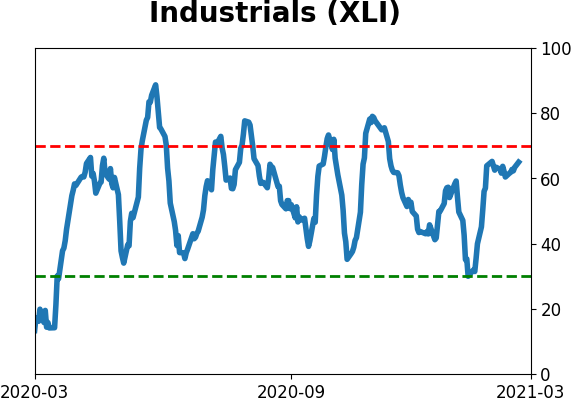
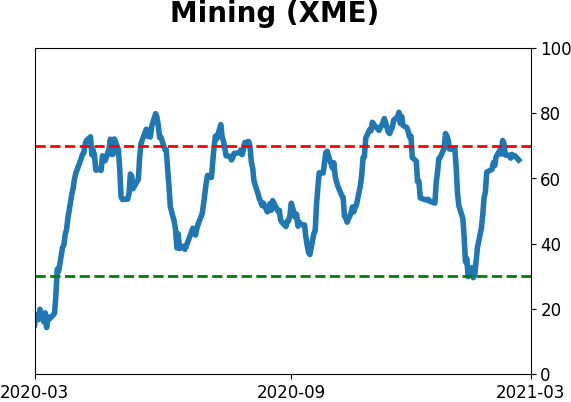
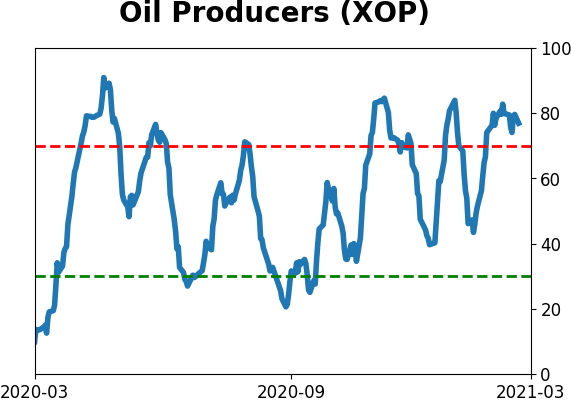
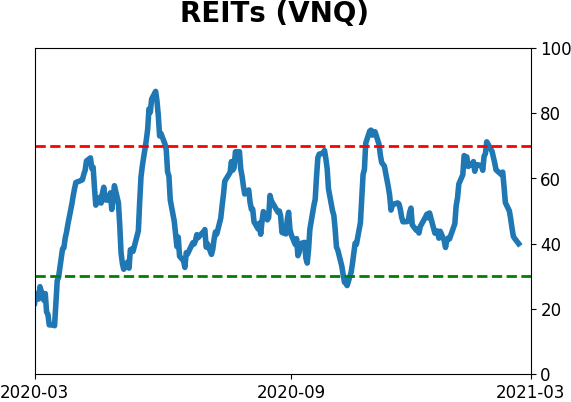
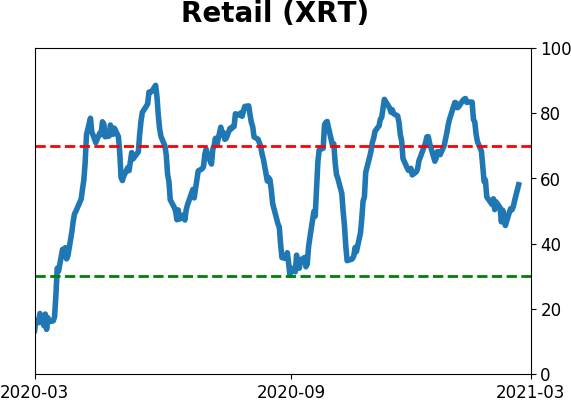
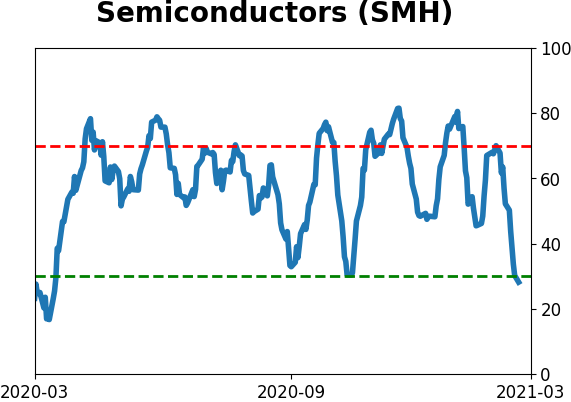
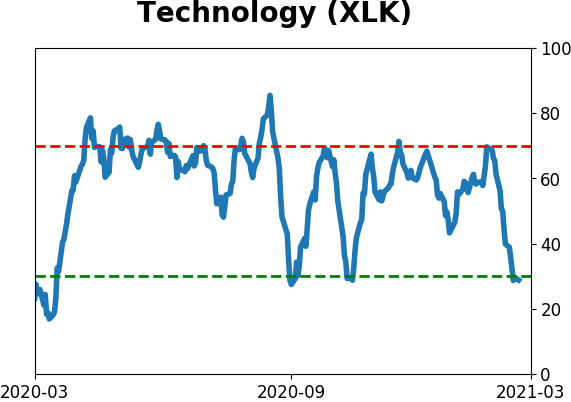
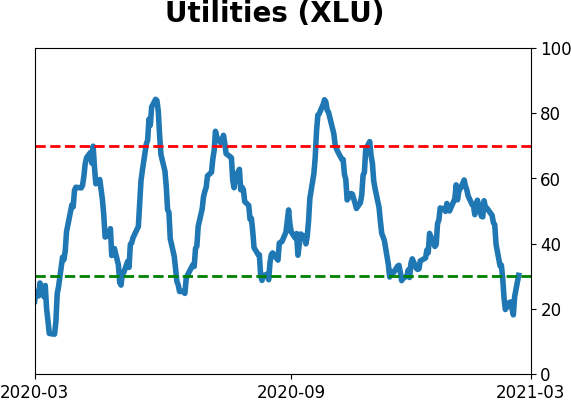
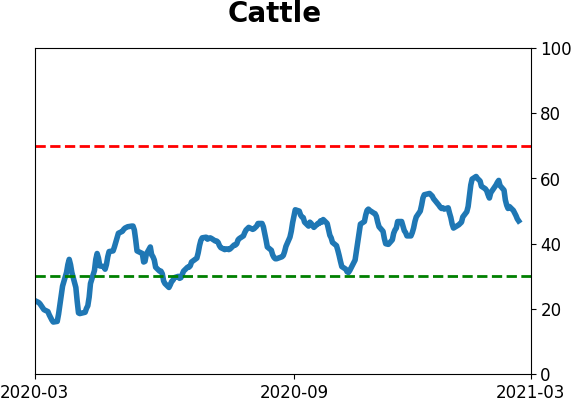
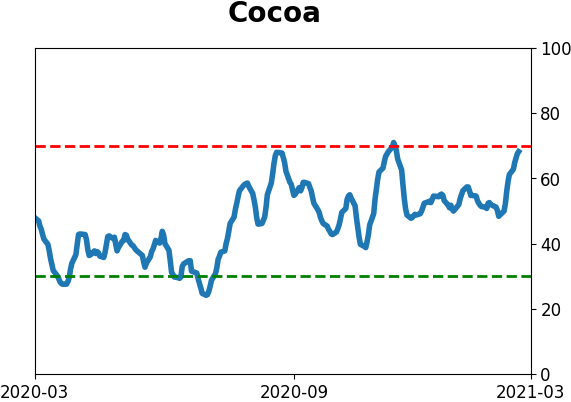
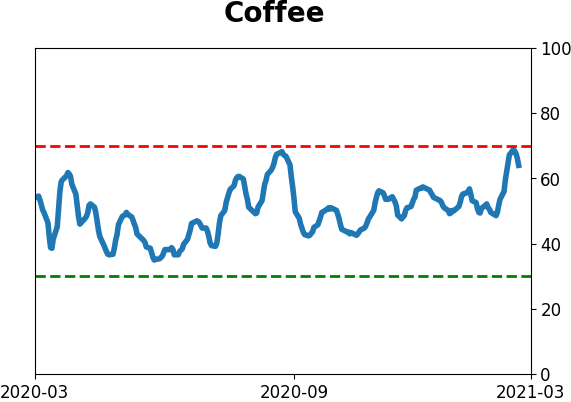
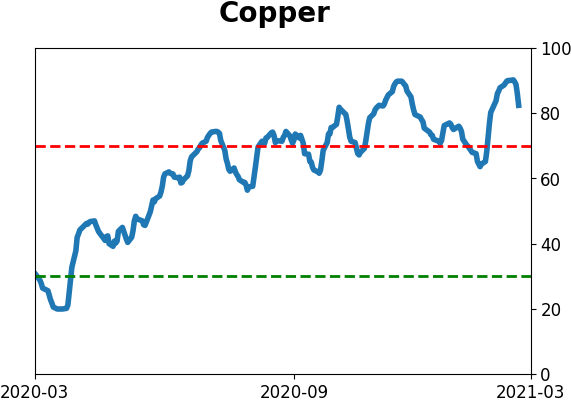
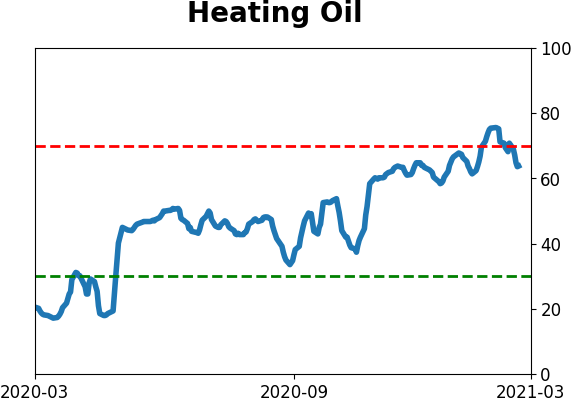
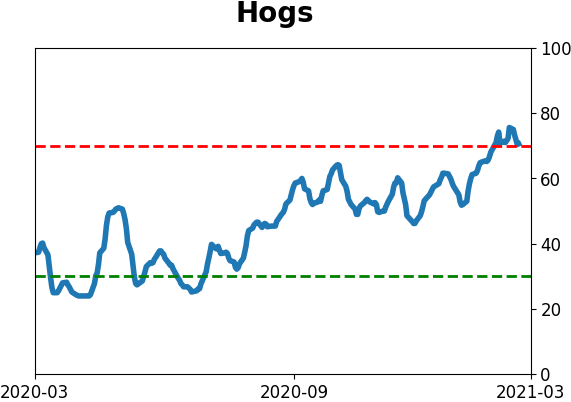
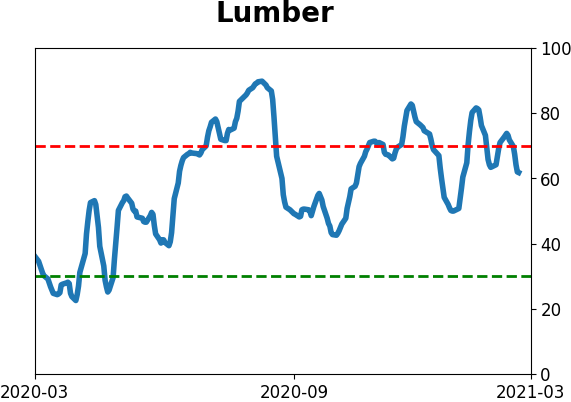
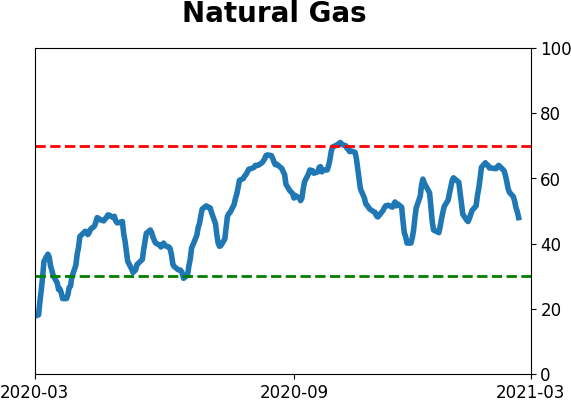
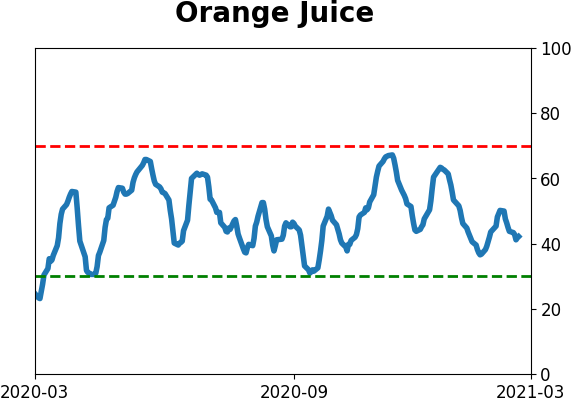
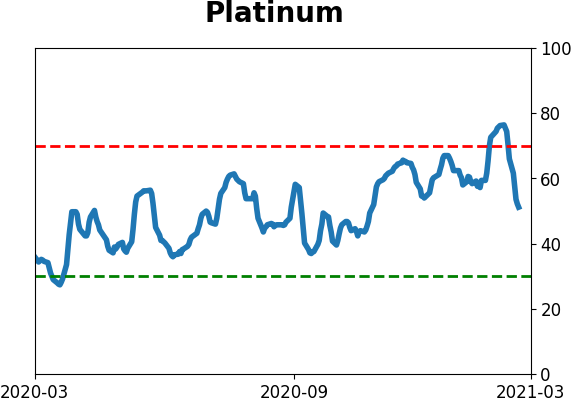
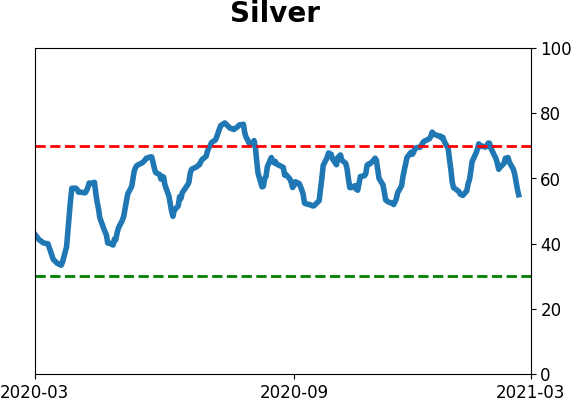
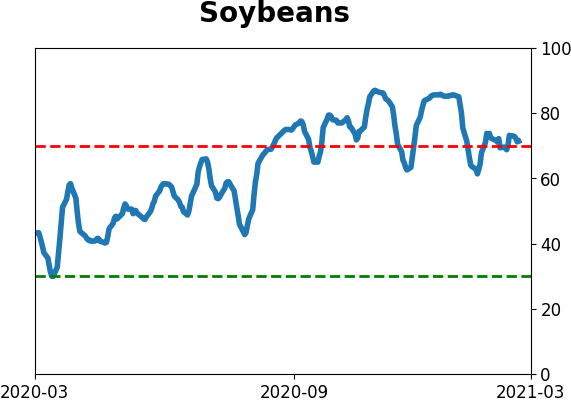
Optimism Index Thumbnails
|
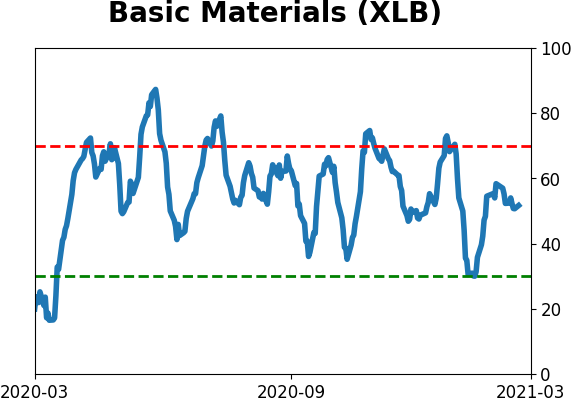
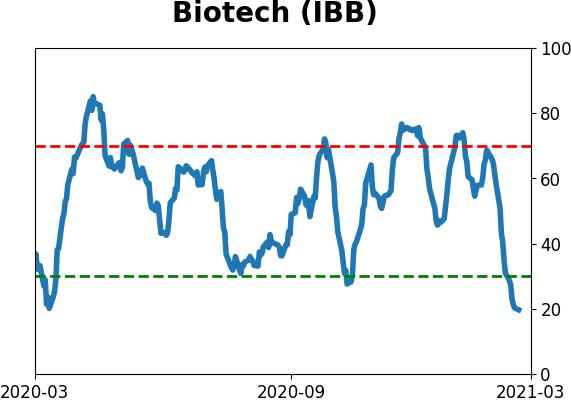
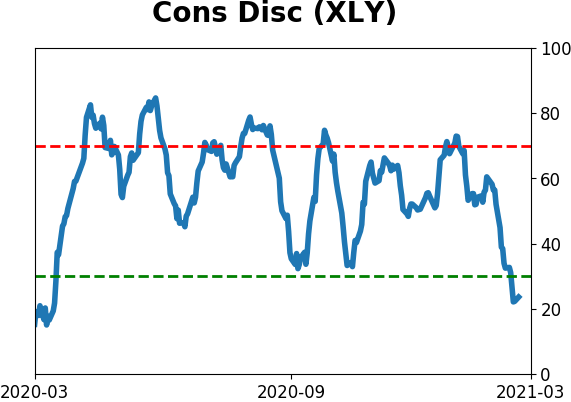
Sector ETF's - 10-Day Moving Average
|
|
|
Country ETF's - 10-Day Moving Average
|
|
|
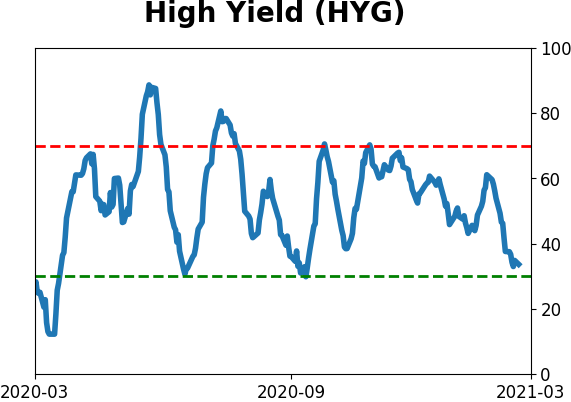
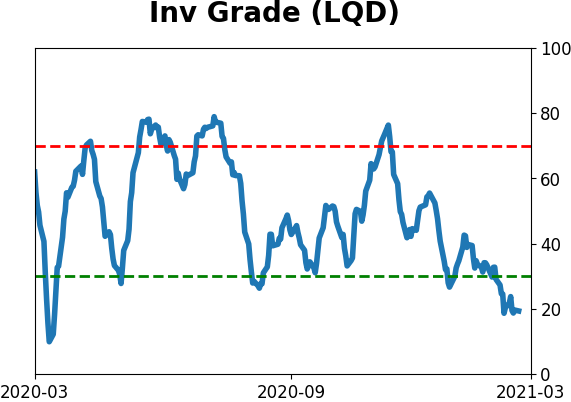
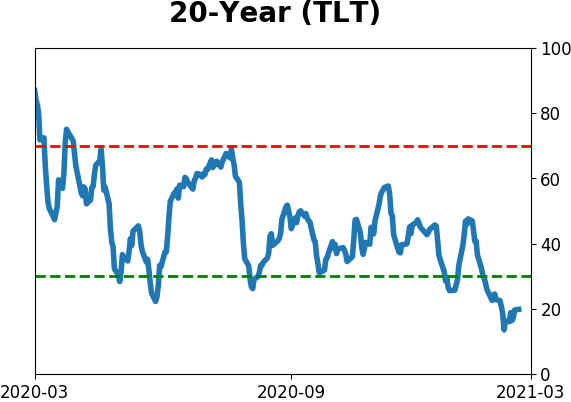
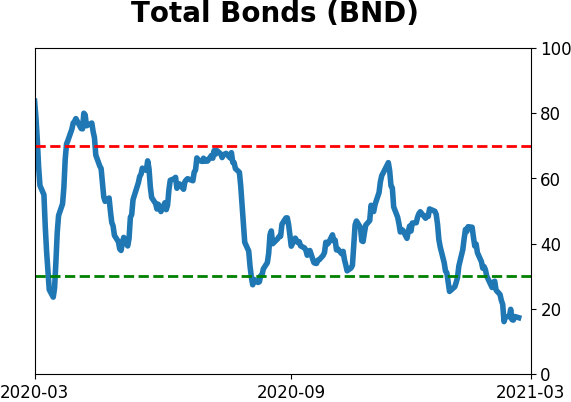
Bond ETF's - 10-Day Moving Average
|
|
|
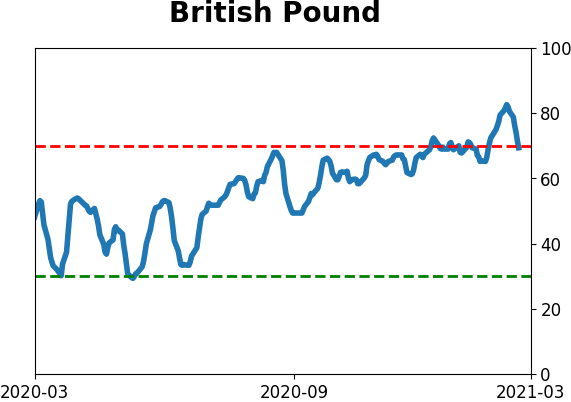
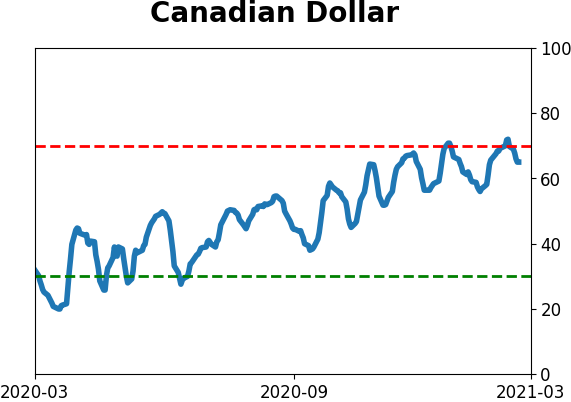
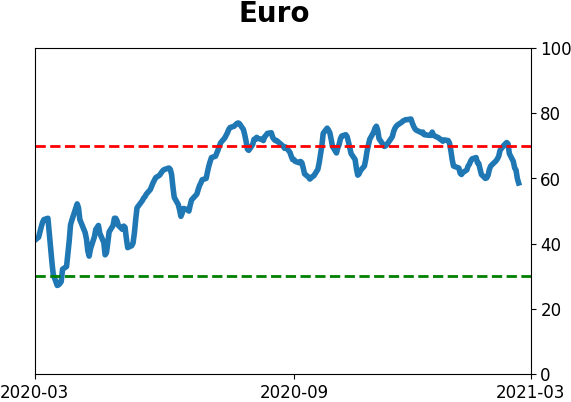
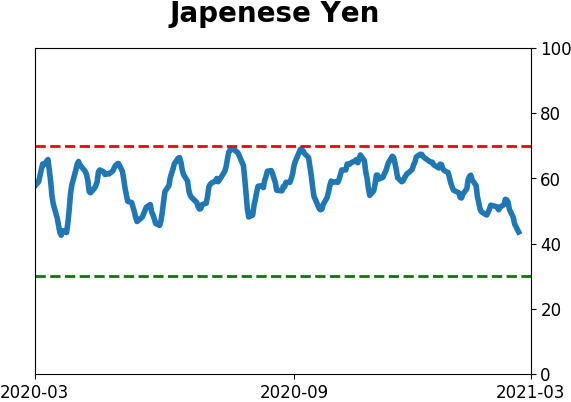
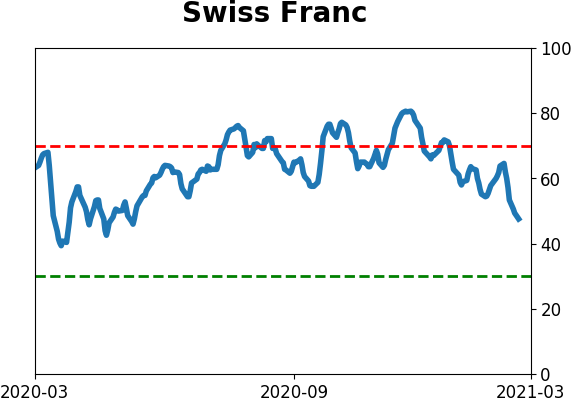
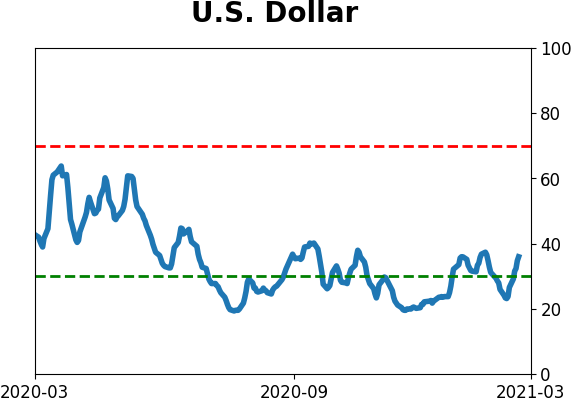
Currency ETF's - 5-Day Moving Average
|
|
|
Commodity ETF's - 5-Day Moving Average
|
|