Headlines
|
|
Indexes are losing steam, stocks not so much:
For the past 2 months, the S&P 500 has traded at a record high and then closed in the bottom 40% of its range. That suggests buying exhaustion, though we're not seeing too much similar activity among individual stocks.
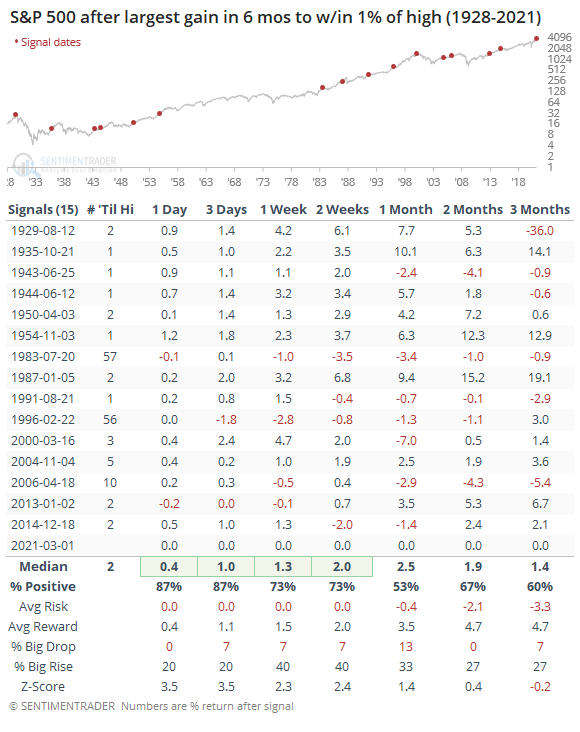
New highs on tap: The never-give-up attitude of buyers remains on display, as the major indexes had their best gains in months on Monday. For the S&P 500, it enjoyed its largest one-day jump in more than 6 months, climbing to within 1% of a new high. The table below shows all similar spikes since 1928, with the 2nd column highlighting how many trading days it took before it closed at a new high. On average, it only took a couple of sessions, with only 3 out of 15 signals taking more than a week.
Bottom Line:
See the Outlook & Allocations page for more details on these summaries STOCKS: Weak sell
We're in an extremely speculative environment that is enough to suggest a defensive posture. Internal breadth and momentum have mostly remained positive, so a more strenuous sell wouldn't trigger unless that changed. BONDS: Weak buy
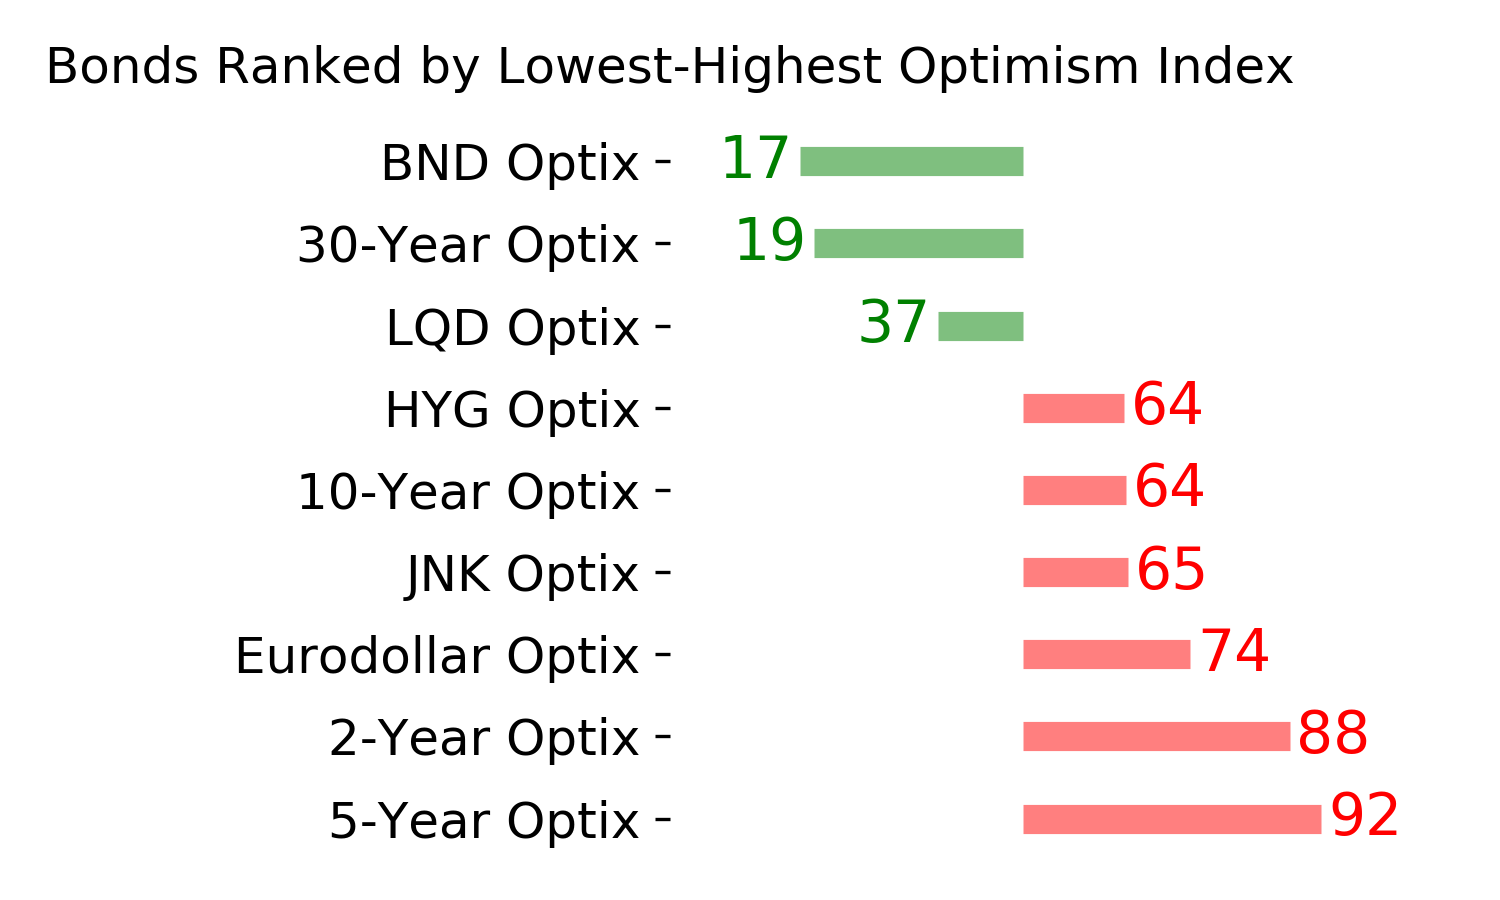
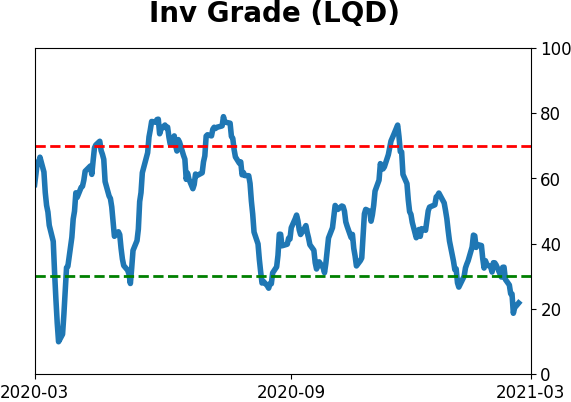
Various parts of the market have been hit in recent weeks, with mild oversold conditions. The Bond Optimism Index is now about as low as it gets during healthy bond market environments. GOLD: Weak buy
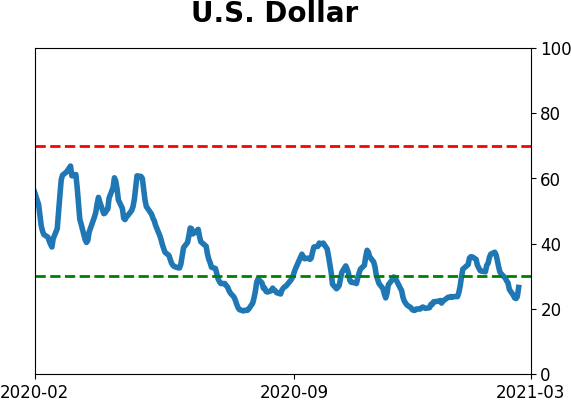
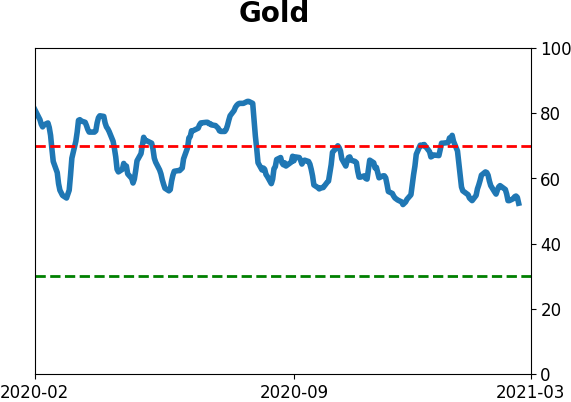
A dollar trying to rebound from a severe short position has weighed on gold and miners. The types of signals they've given in recent weeks, within the context of their recent surge, have usually resulted in higher prices over a medium- to long-term time frame.
|
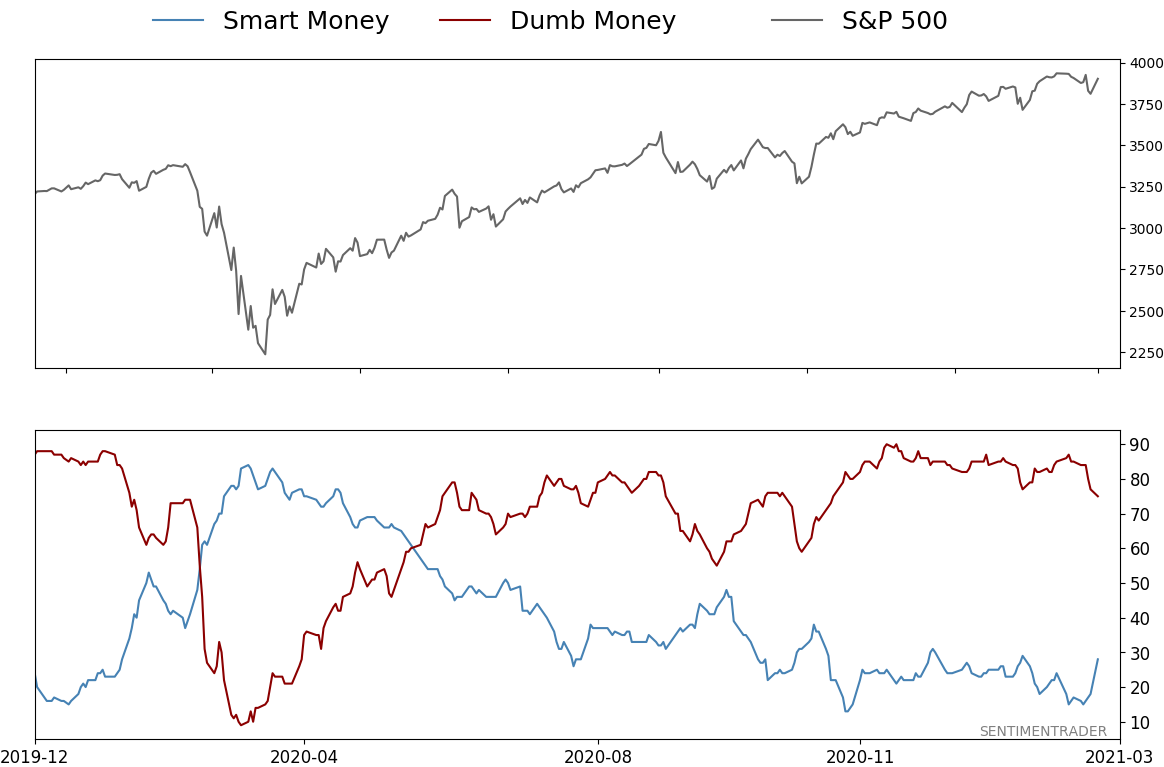
Smart / Dumb Money Confidence
|
Smart Money Confidence: 28%
Dumb Money Confidence: 75%
|
|
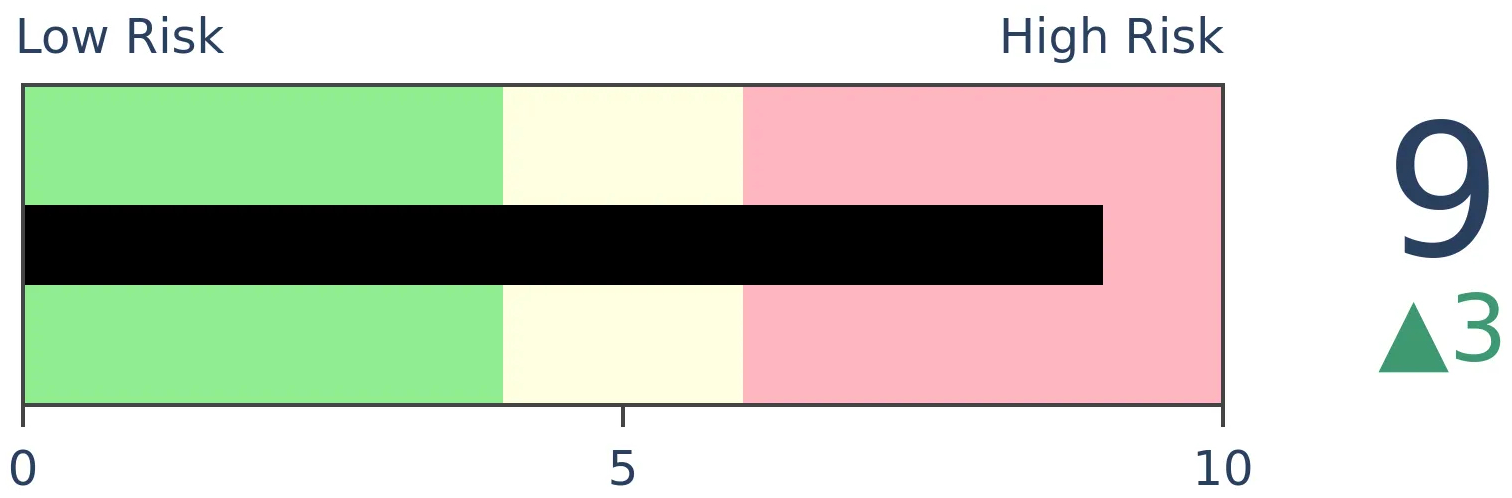
Risk Levels
Stocks Short-Term
|
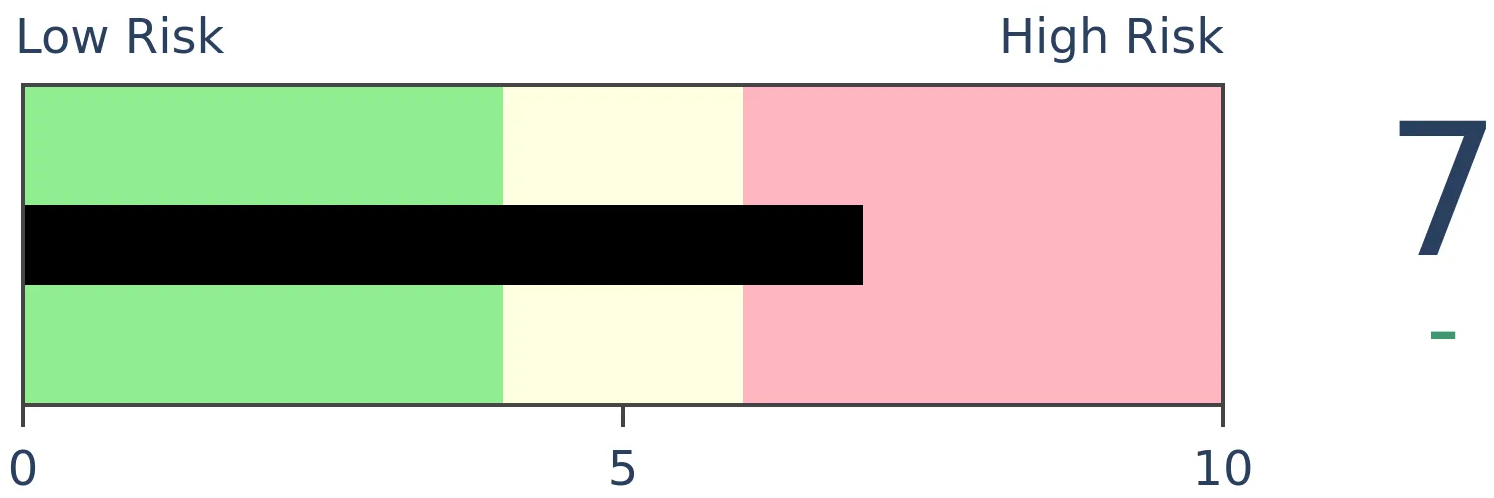
Stocks Medium-Term
|
|
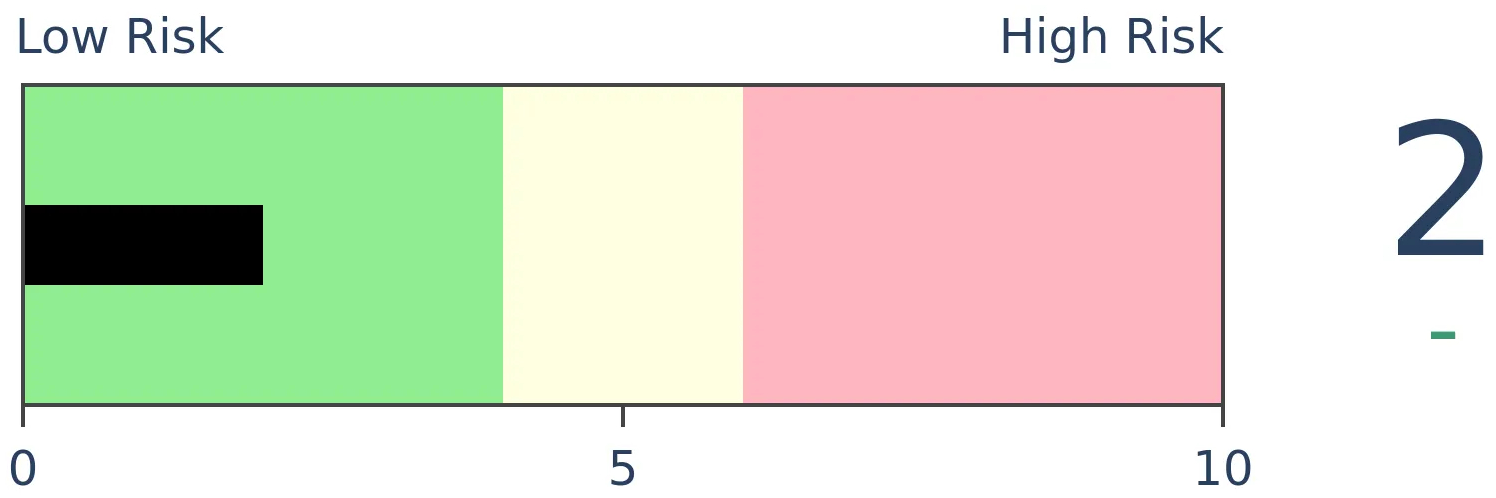
Bonds
|
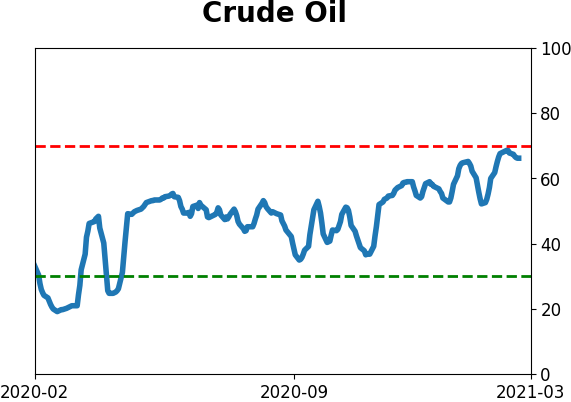
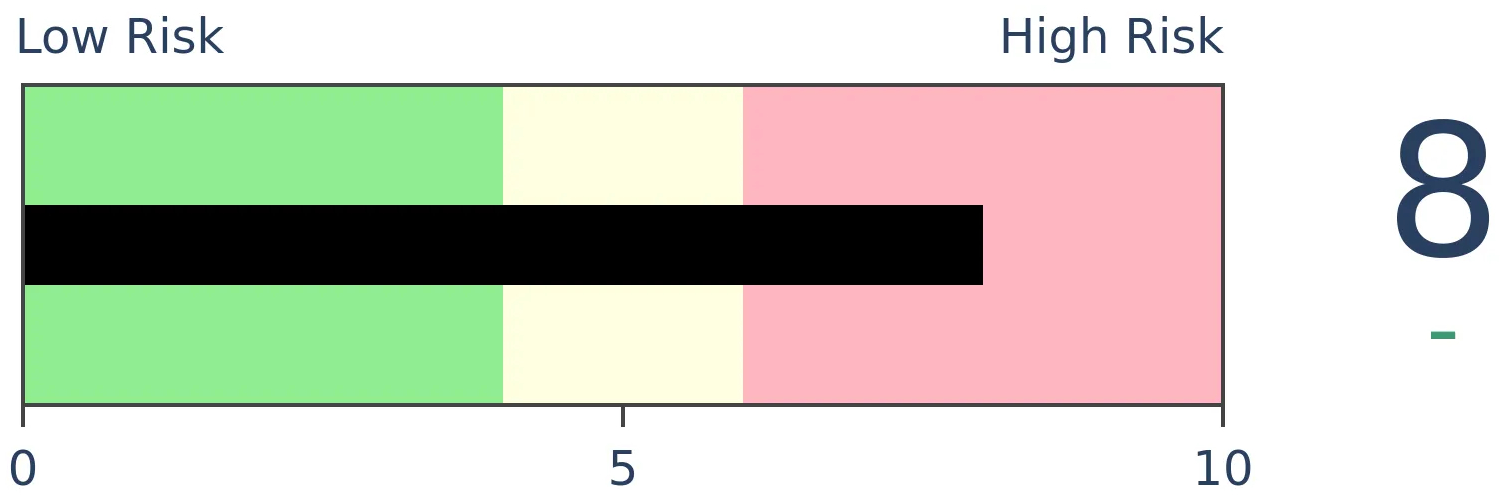
Crude Oil
|
|
Gold

|
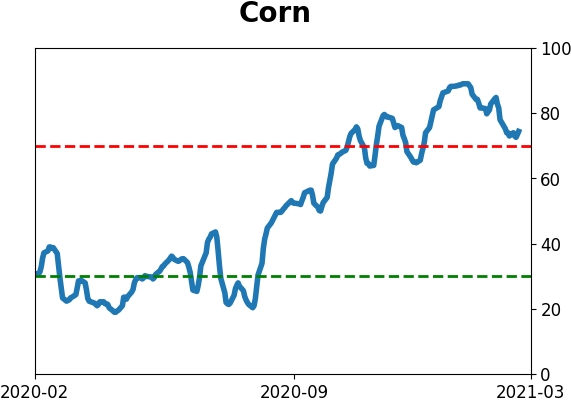
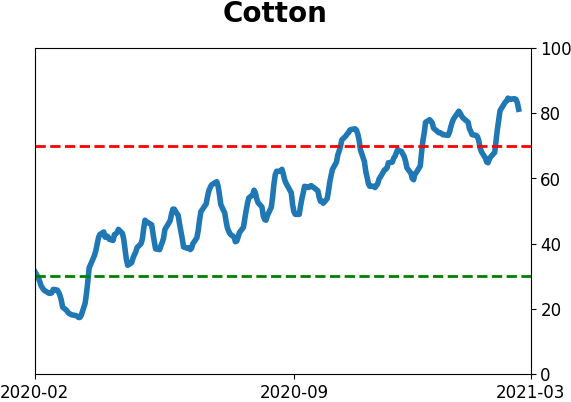
Agriculture

|
|
Research
BOTTOM LINE
For the past 2 months, the S&P 500 has traded at a record high and then closed in the bottom 40% of its range. That suggests buying exhaustion, though we're not seeing too much similar activity among individual stocks.
FORECAST / TIMEFRAME
None
|
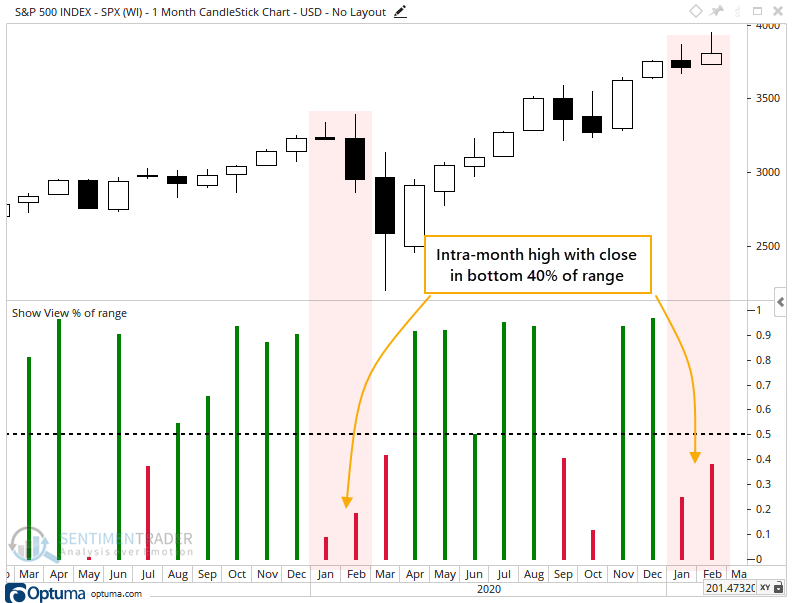
With another month in the books, stocks looked tired once again in February. Despite shooting to record highs during the month, the S&P 500 fell near month-end to close in the bottom 40% of its range.
Just like it did in January.
The only other time in recent years when the S&P rose to a 3-year high at some point during the month and then closed in the bottom 40% of its range, on back-to-back months, was in January and February of 2020.
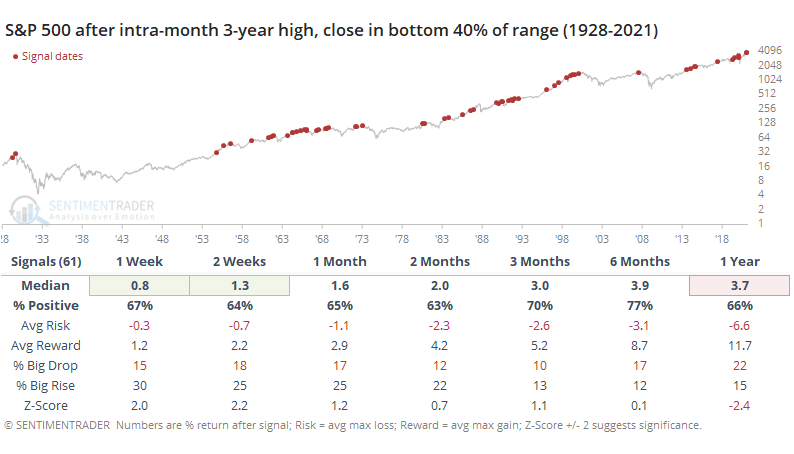
After any month that saw the S&P trade to a 3-year high and then close in the bottom 40% of its range for the month, the start of the next month went okay, as it looks like it's on track to do again, but generally, it was not a great longer-term sign with only a 3.7% median return over the next year.
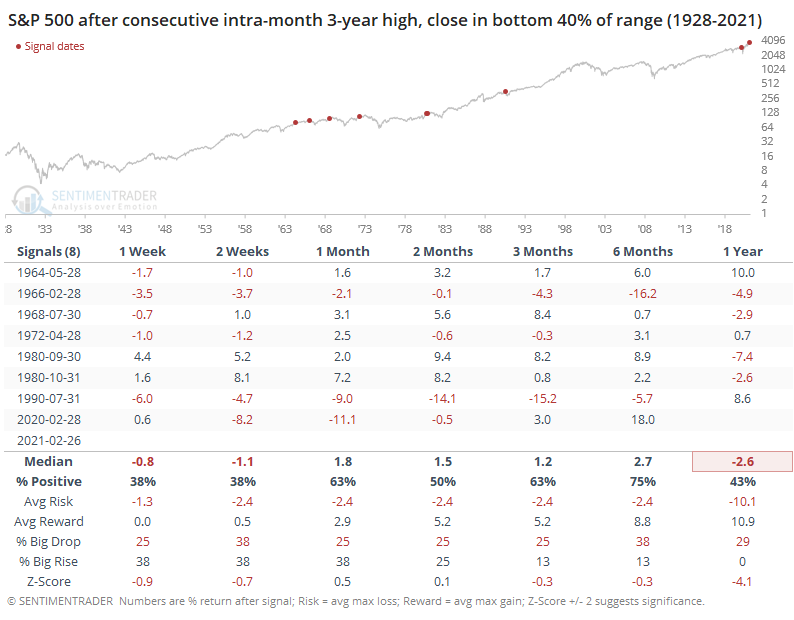
What makes the current display of exhaustion unique is that it's happened for two consecutive months. When we filter the table to only include consecutive signals, then it becomes much rarer and significantly less positive.
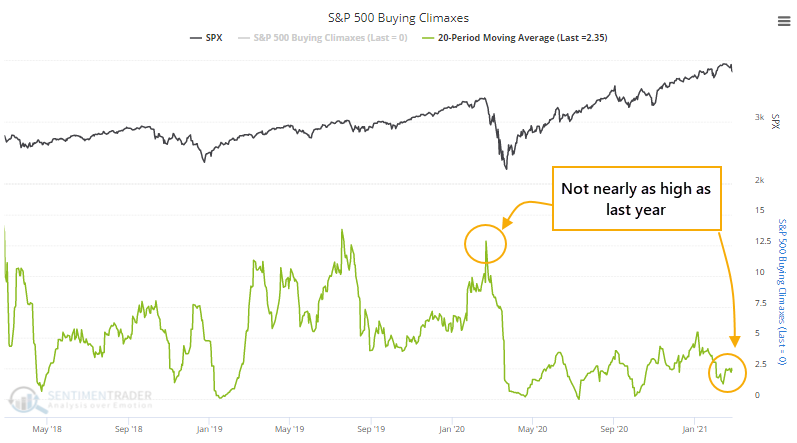
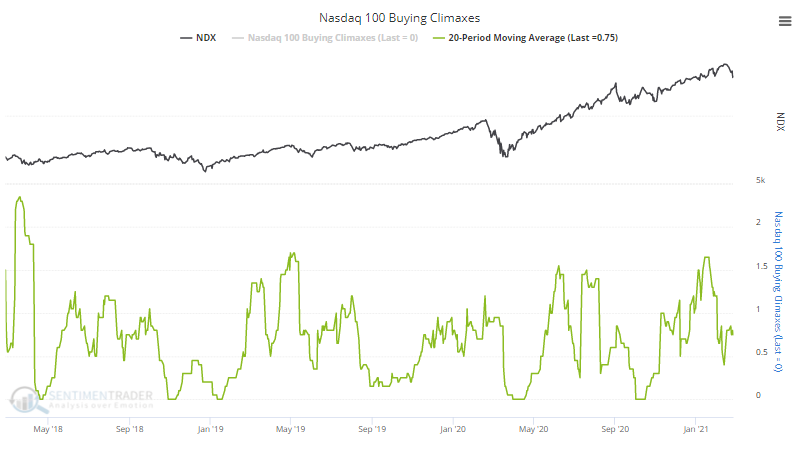
Among individual stocks, the number of buying climaxes in the S&P 500 over the past 20 days isn't high enough to be a concern. A buying climax triggers when a stock trades at a 52-week high and then closes below the close of the prior day.
When stocks were peaking last year, there was a consistent tendency to see a large number of individual stocks pull back from new highs. We're not seeing that now.
Among members of the Nasdaq 100, though, buying climaxes are coming down from a fairly high level, so it's a bit more of a concern among big tech.
We've been looking closely for signs of internal deterioration, waning momentum, and buying exhaustion ever since sentiment started to register extremes a couple of months ago. There were some cracks in January but buying interest has mostly come back enough to erase those concerns.
Stocks don't have to trigger any of these warning signs before the indexes fall into a correction, it just makes it a higher probability if they do. Evidence is pretty weak so far that we're seeing widespread enough exhaustion to be a major concern.
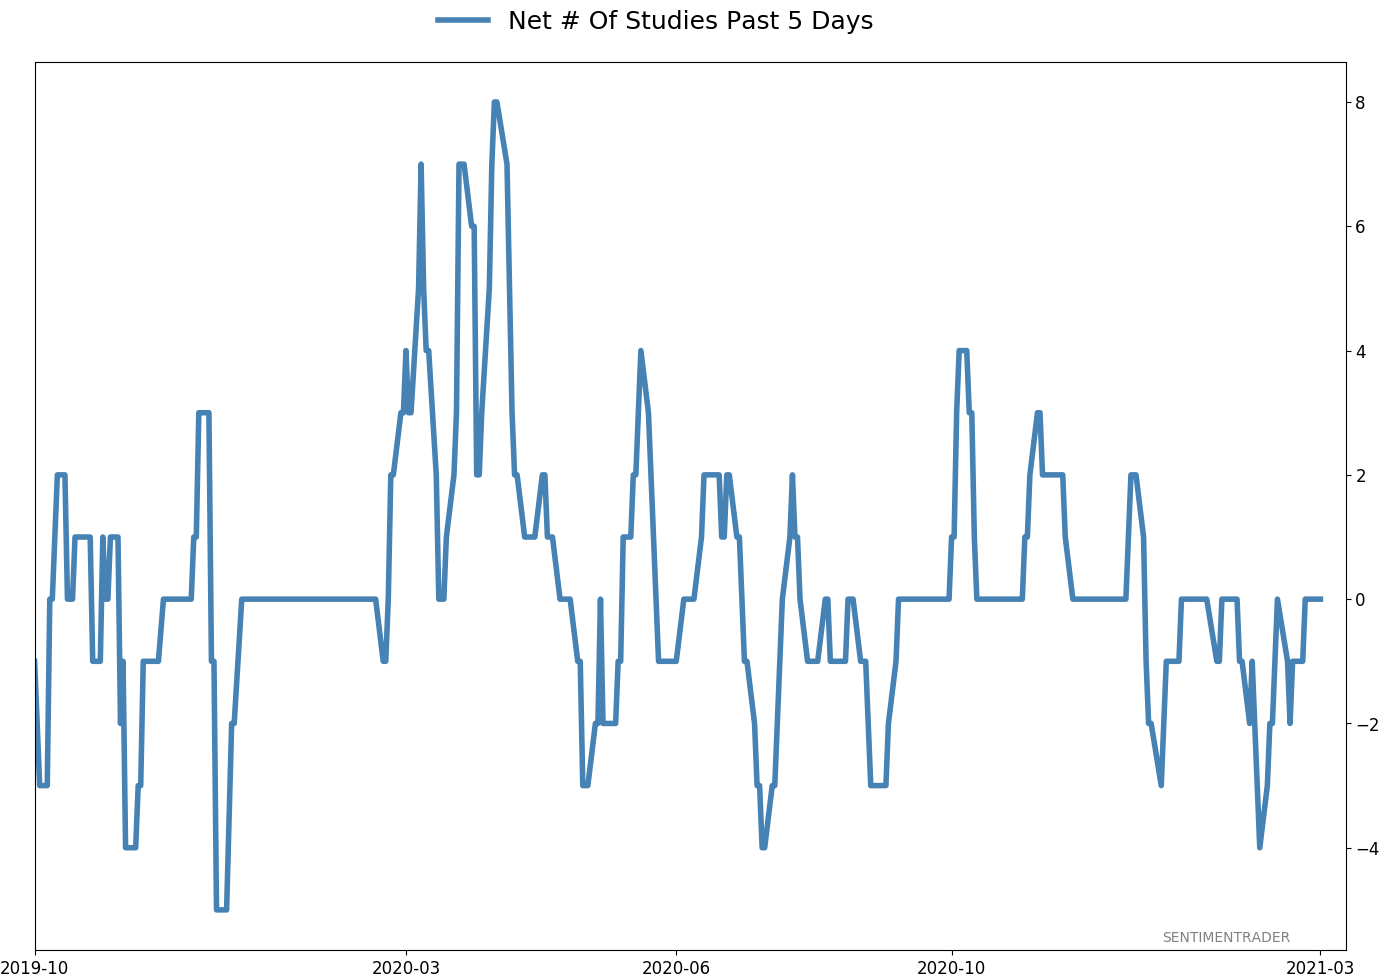
Active Studies
| Time Frame | Bullish | Bearish | | Short-Term | 0 | 0 | | Medium-Term | 2 | 8 | | Long-Term | 16 | 3 |
|
Indicators at Extremes
Portfolio
| Position | Description | Weight % | Added / Reduced | Date | | Stocks | RSP | 4.9 | Reduced 4% | 2021-02-09 | | Bonds | 30.0% BND, 8.8% SCHP | 38.8 | Added 15.1% | 2021-02-18 | | Commodities | GCC | 2.3 | Reduced 2.1%
| 2020-09-04 | | Precious Metals | GDX | 9.0 | Added 0.1% | 2021-02-18 | | Special Situations | 7.3% XLE, 4.8% PSCE | 12.1 | Reduced 5.6% | 2021-02-18 | | Cash | | 32.8 | | |
|
Updates (Changes made today are underlined)
With a market that has seen the kinds of broad participation and big breath thrusts like we did in the fall, it's hard to become too negative. Those kinds of conditions have consistently preceded higher returns over the next 6-12 months. It's the interim that's more of an issue. Even conditions like that haven't prevented some shorter-term pullbacks. And when we combine an environment where speculation is rampant and recent days have seen an increase in cracks under the surface of the indexes, it's enough to become more defensive over a short- to medium-term time frame. We still don't have much confirmation from the price action in the indexes, so those who are more conservative would likely wait before increasing cash levels. I've decreased risk exposure a bit more, mainly in terms of energy stocks and the ANGL fund, while adding more to the broader bond market. RETURN YTD: 5.6% 2020: 8.1%, 2019: 12.6%, 2018: 0.6%, 2017: 3.8%, 2016: 17.1%, 2015: 9.2%, 2014: 14.5%, 2013: 2.2%, 2012: 10.8%, 2011: 16.5%, 2010: 15.3%, 2009: 23.9%, 2008: 16.2%, 2007: 7.8%
|
|
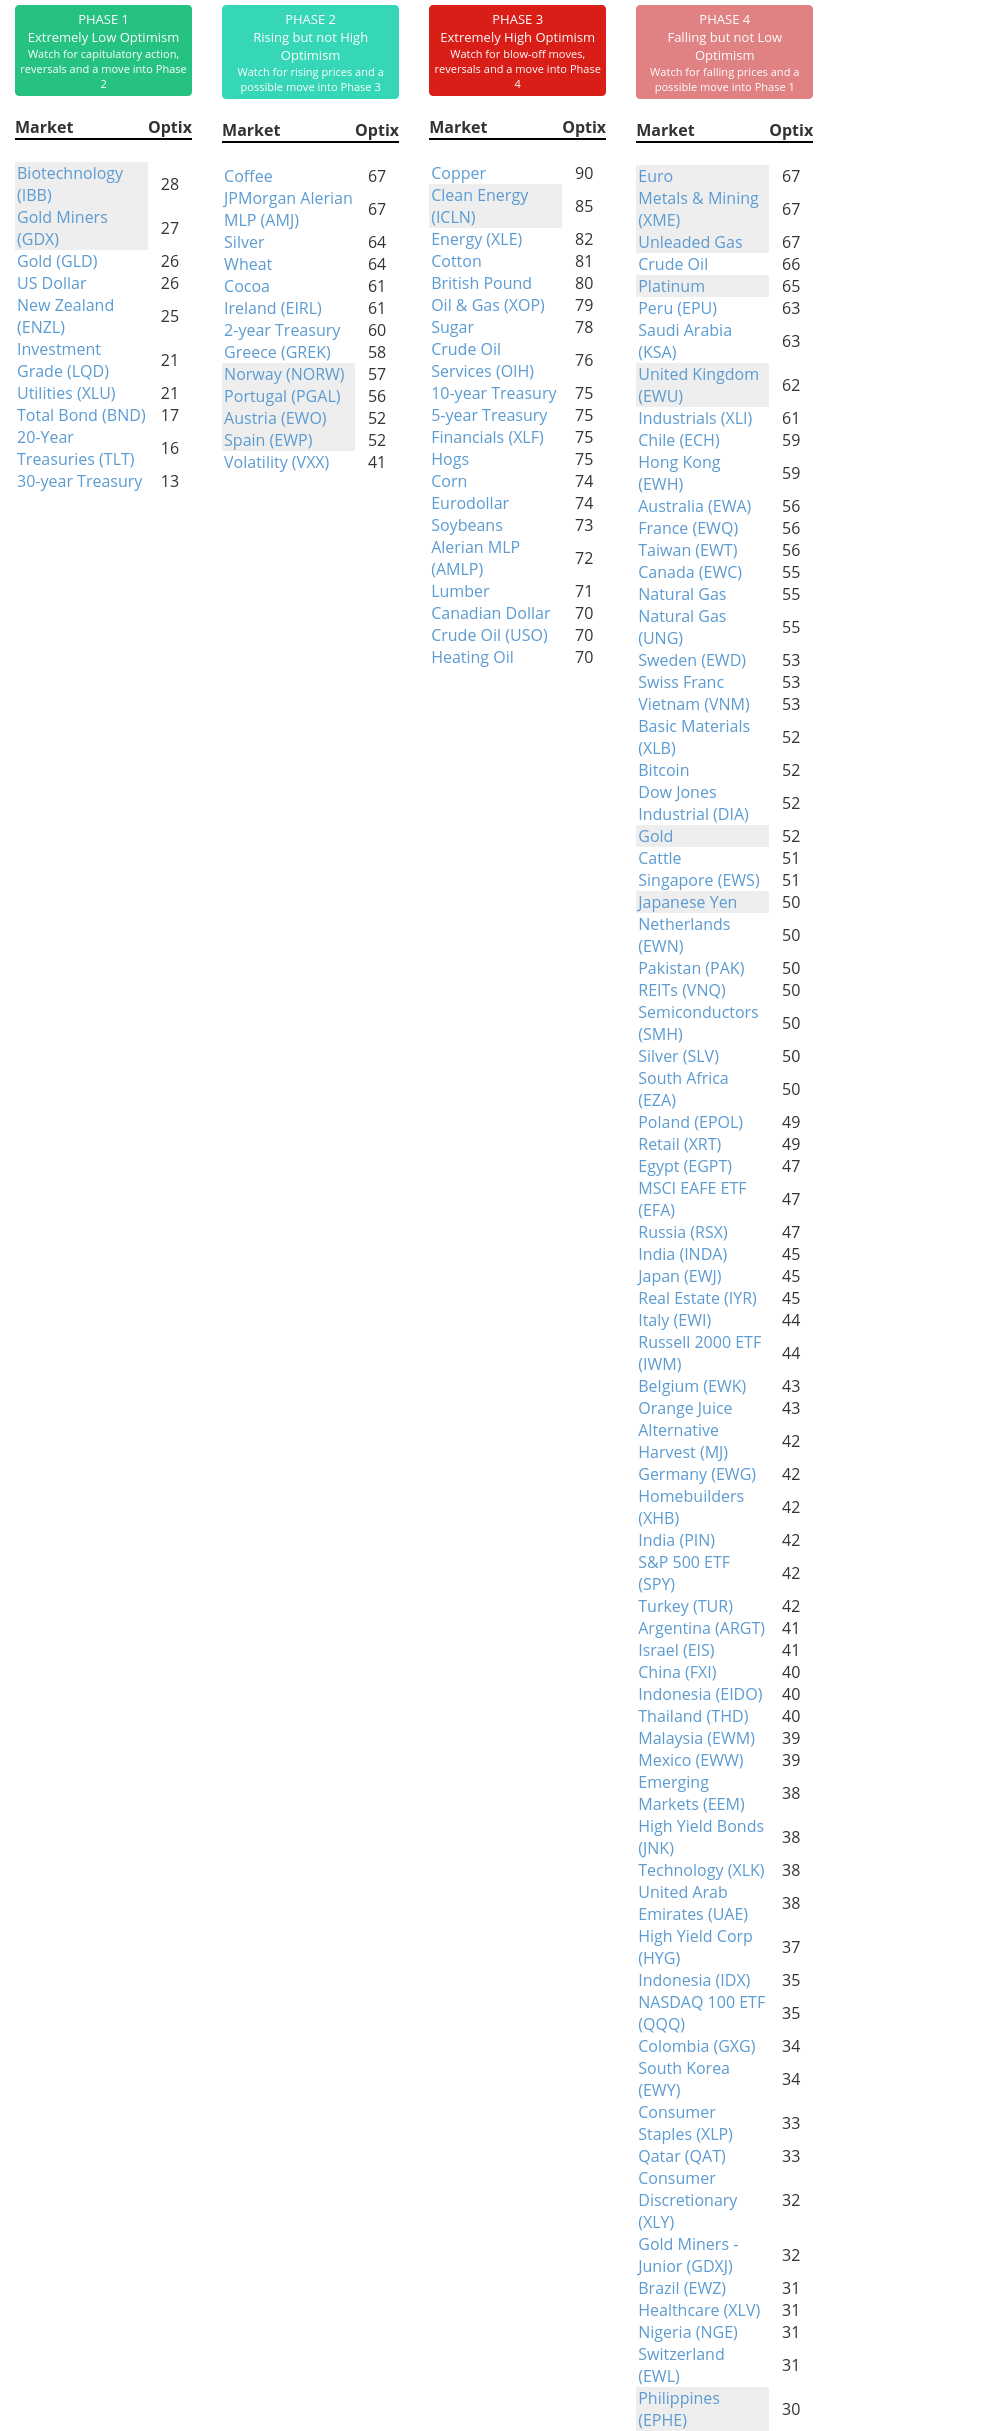
Phase Table
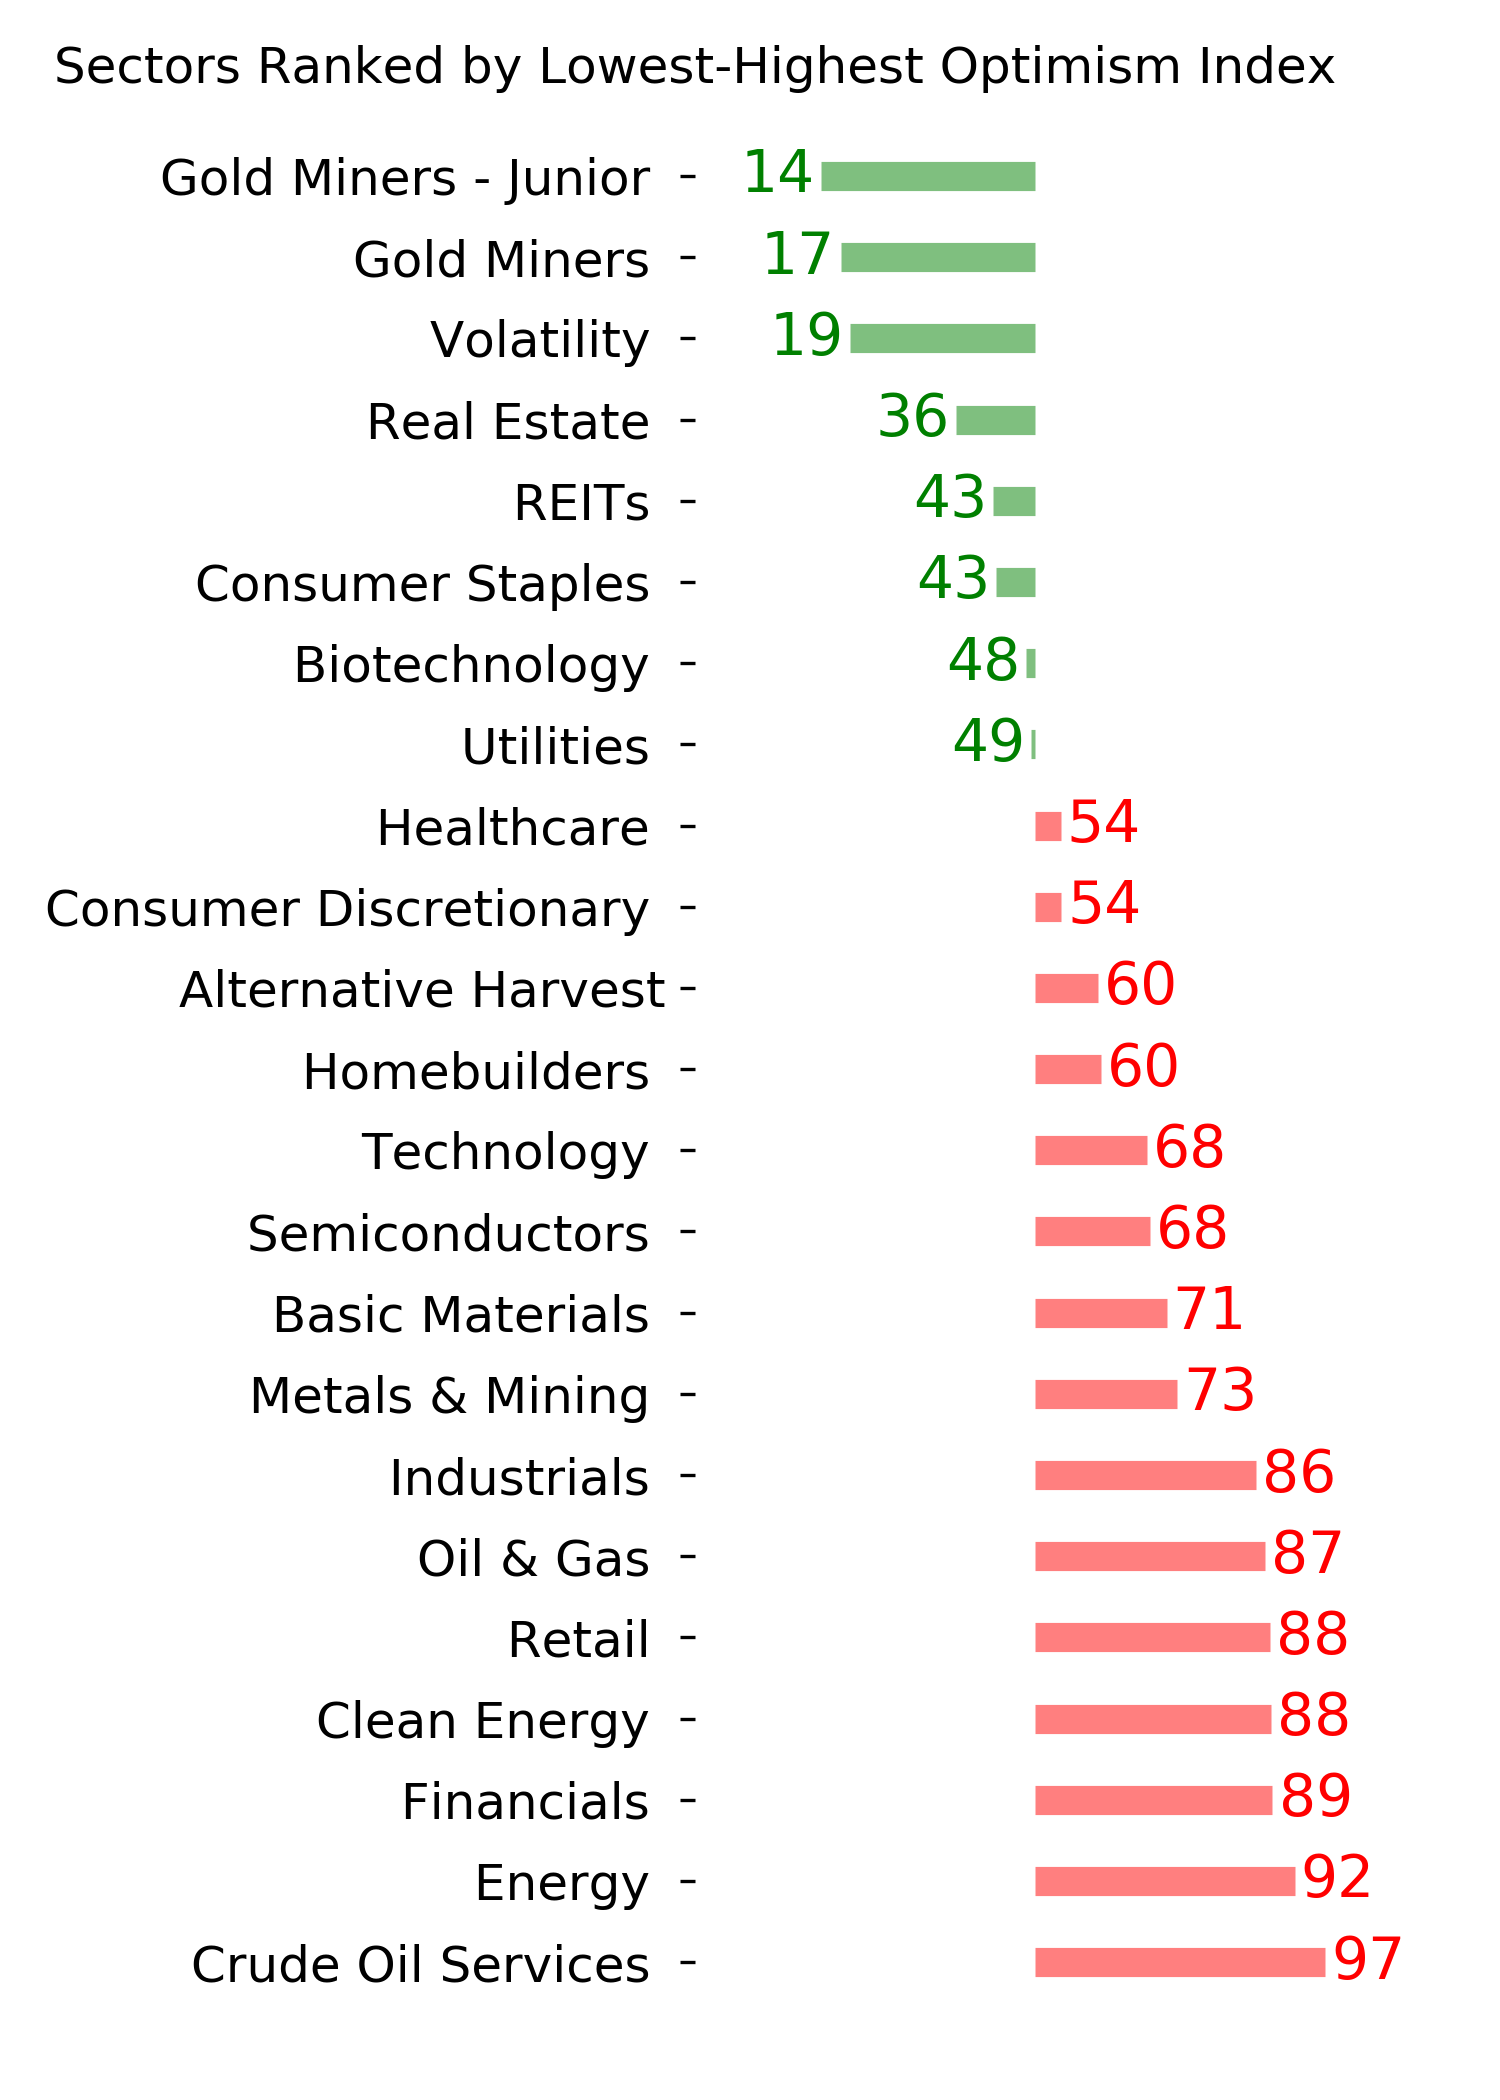
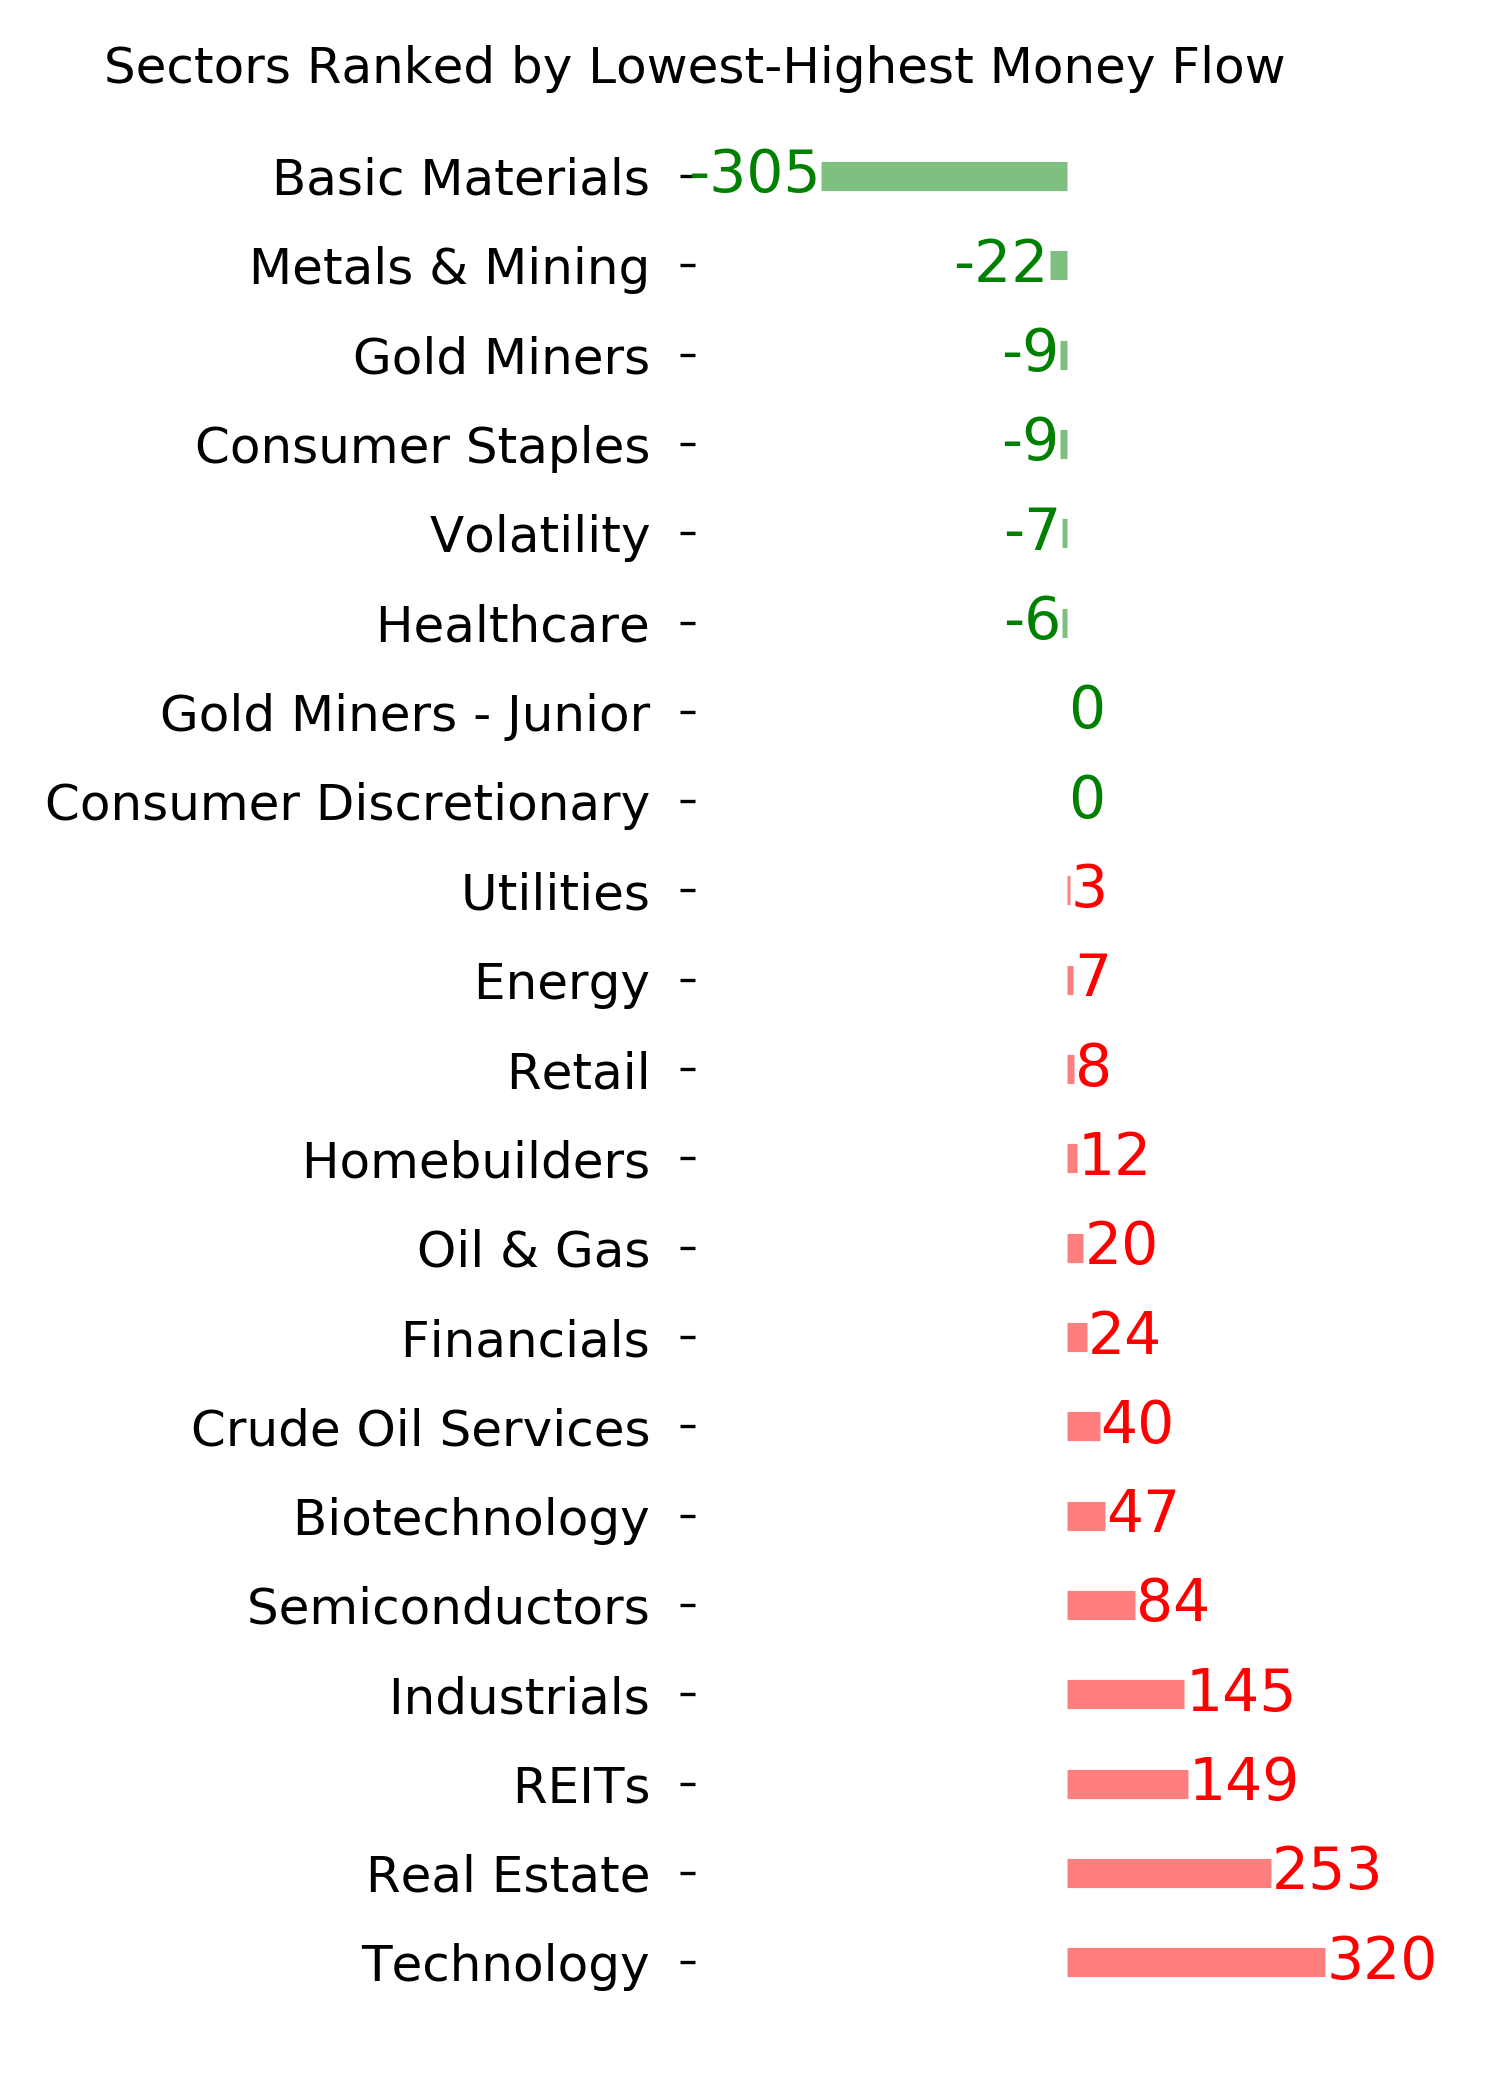
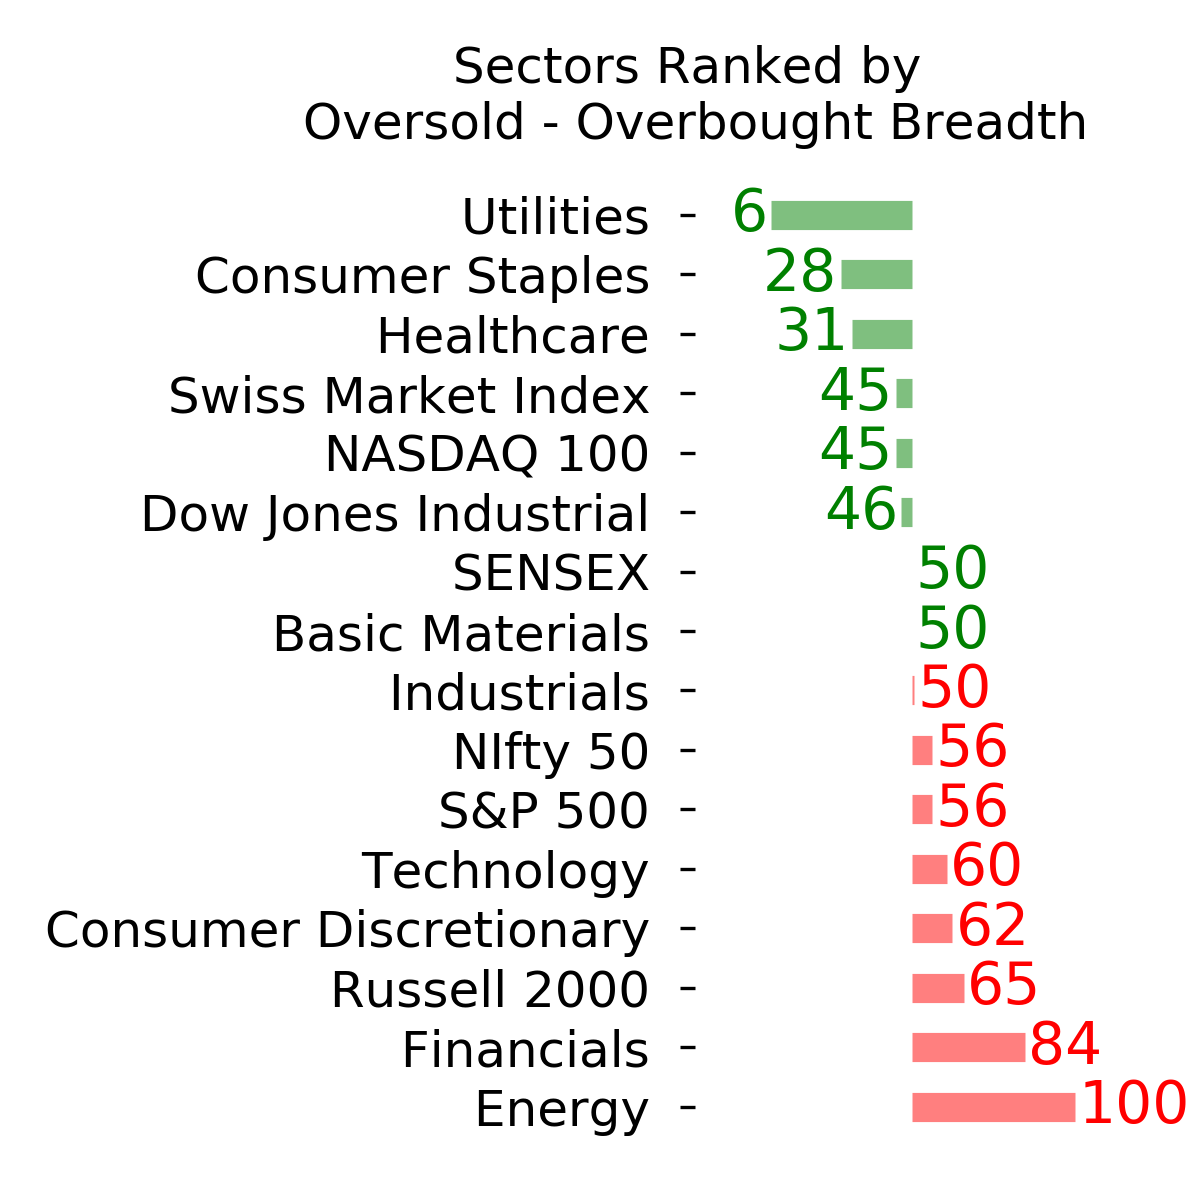
Ranks
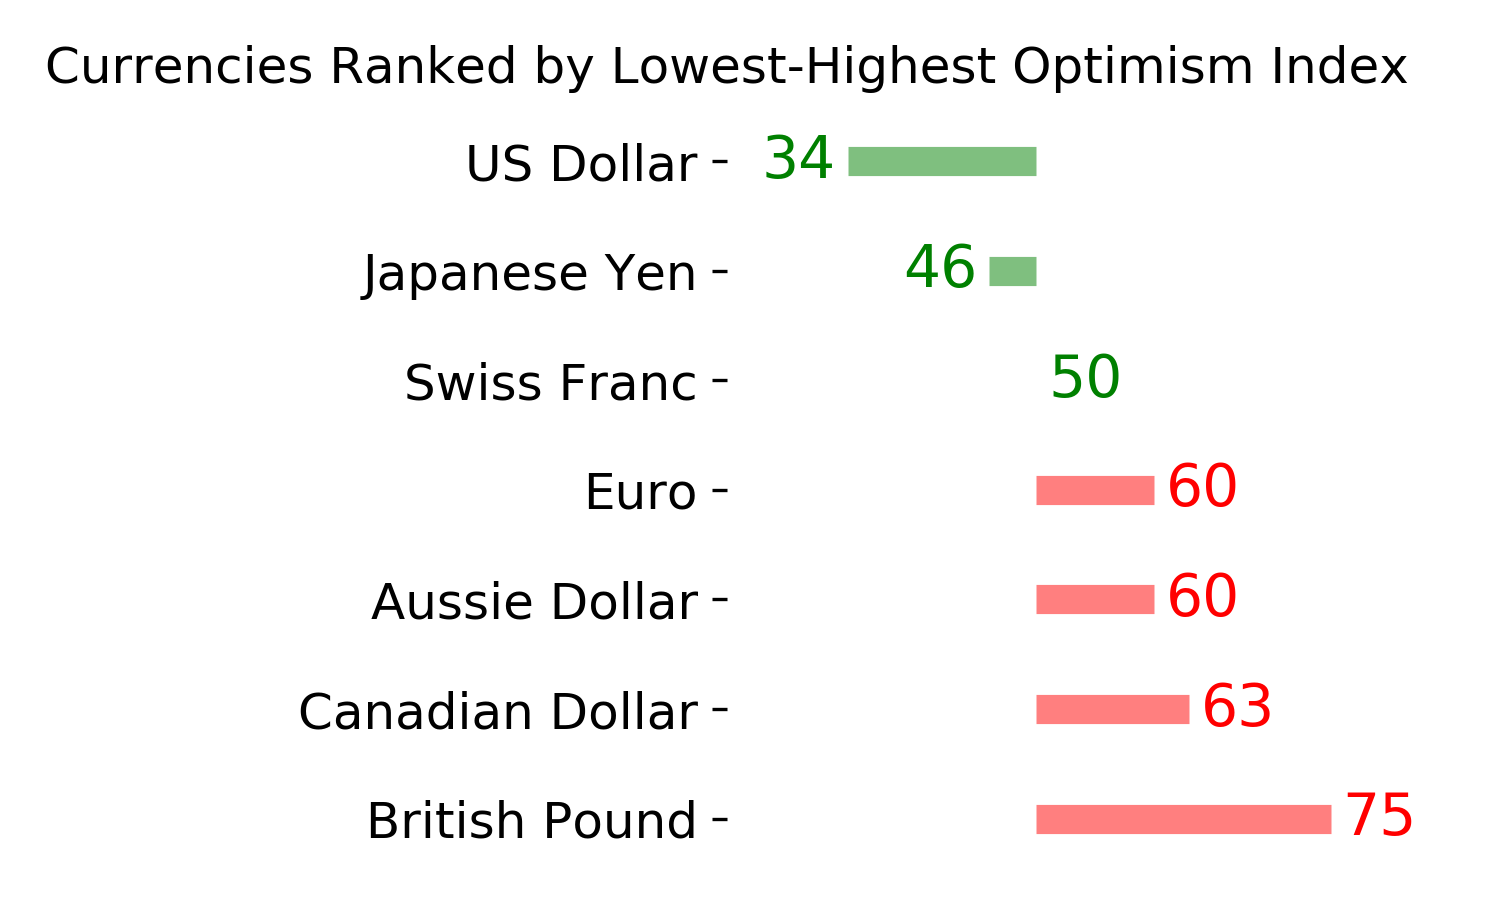
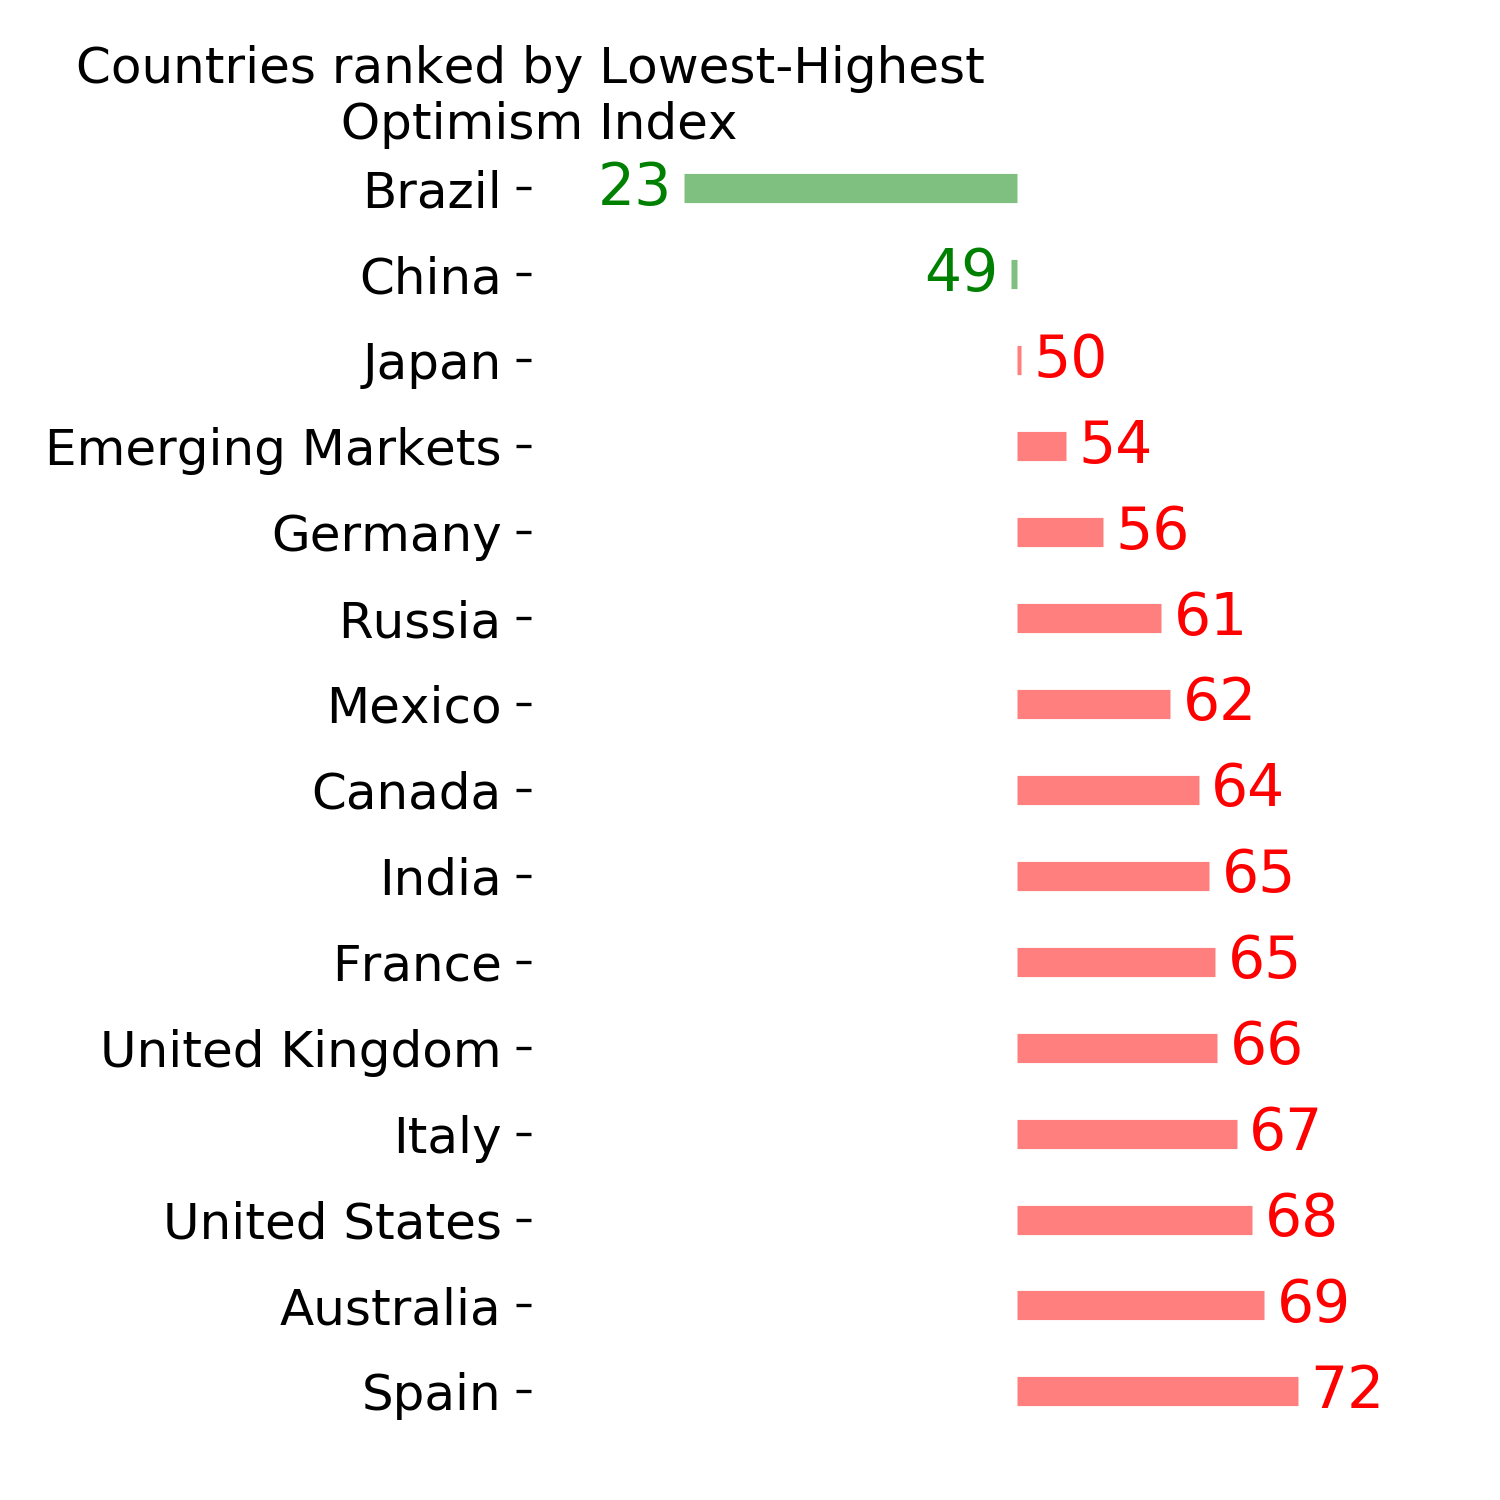
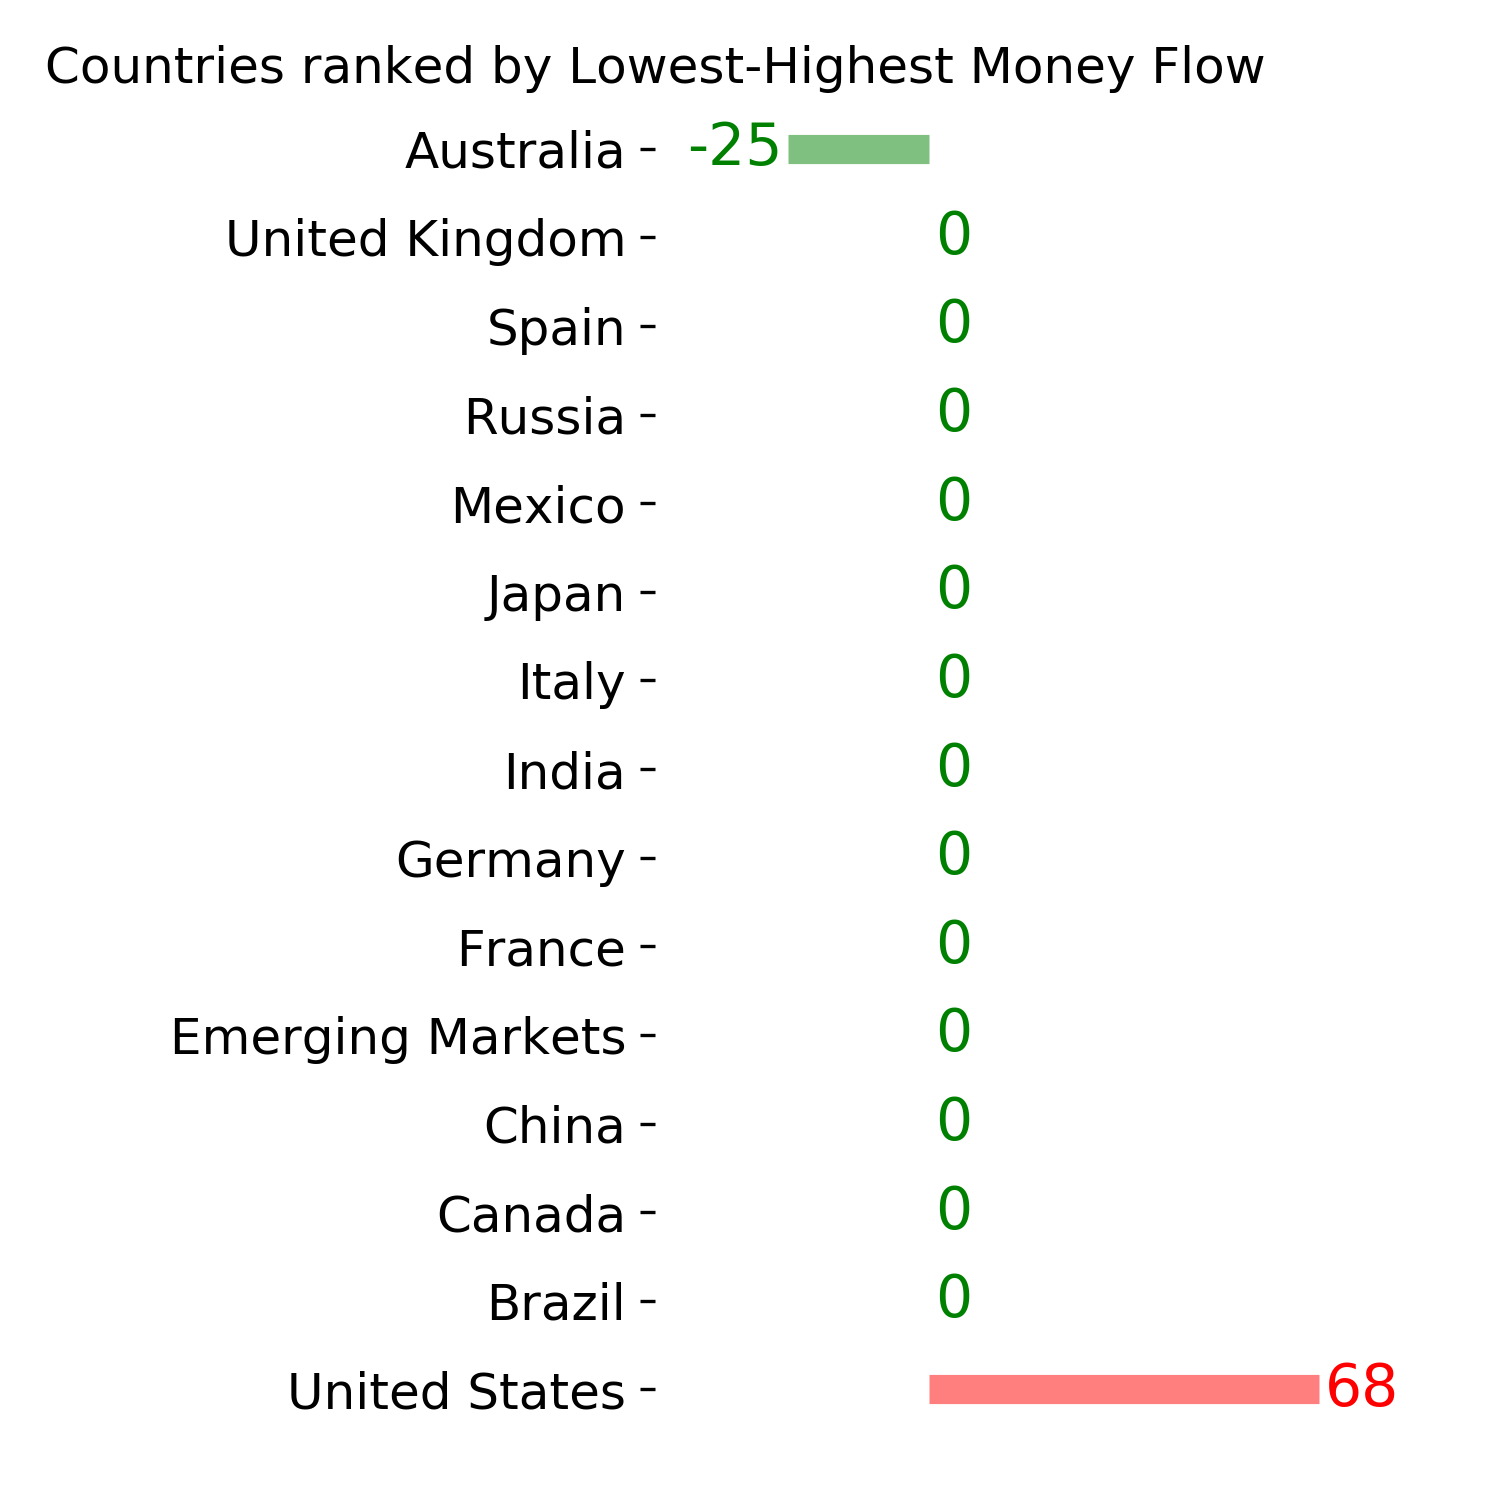
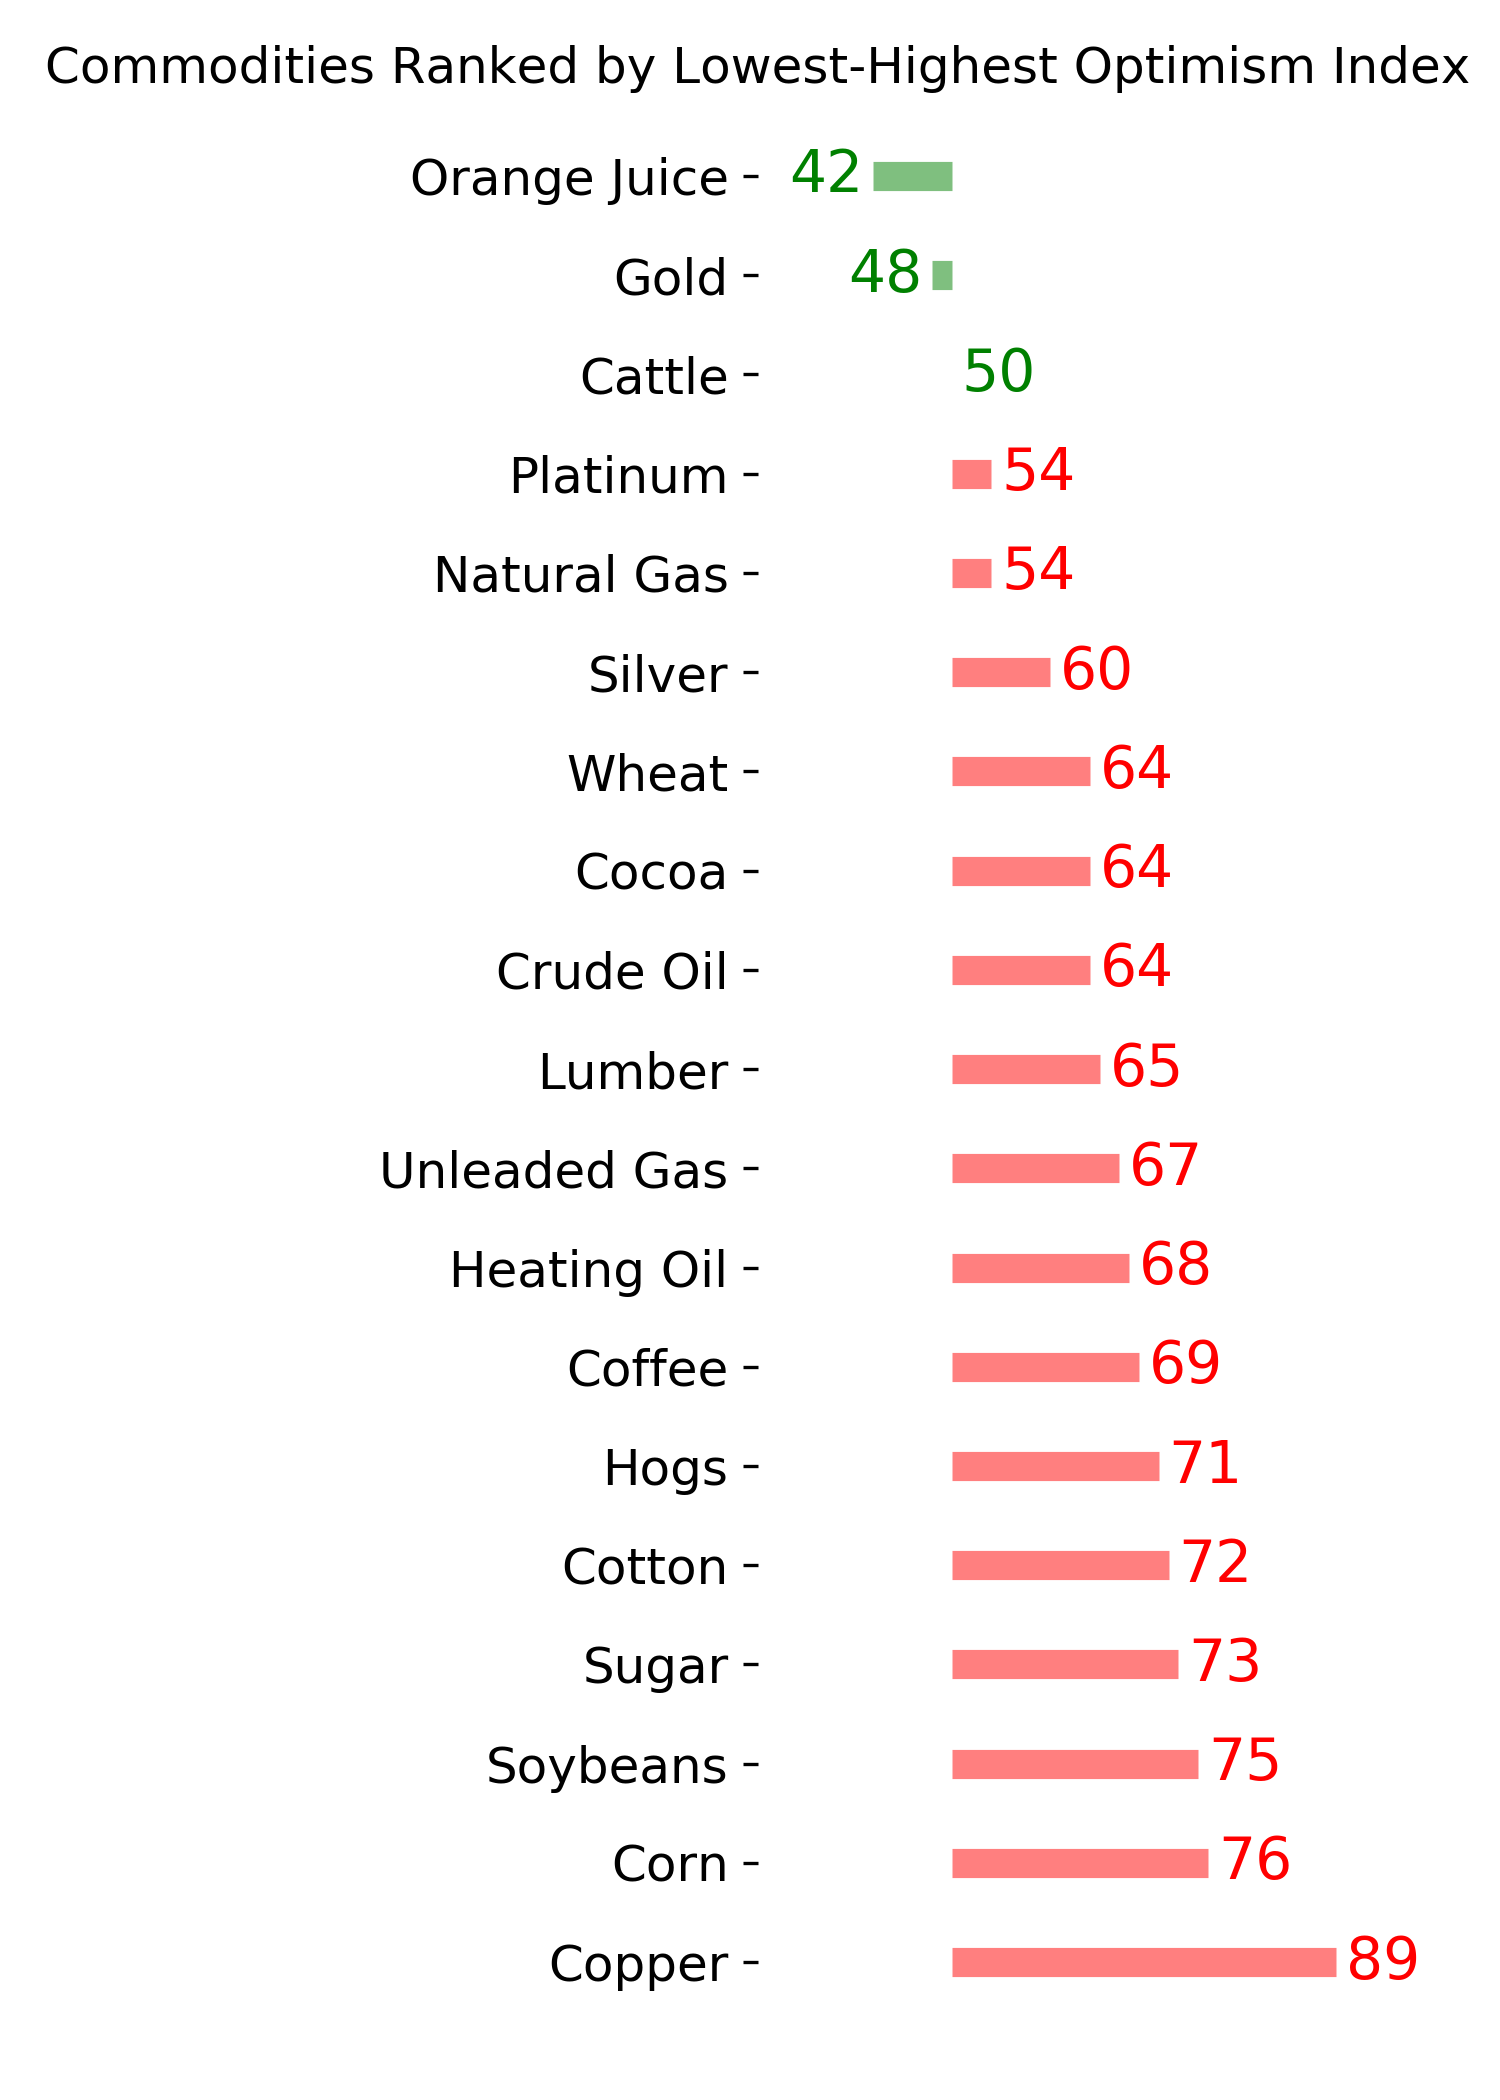
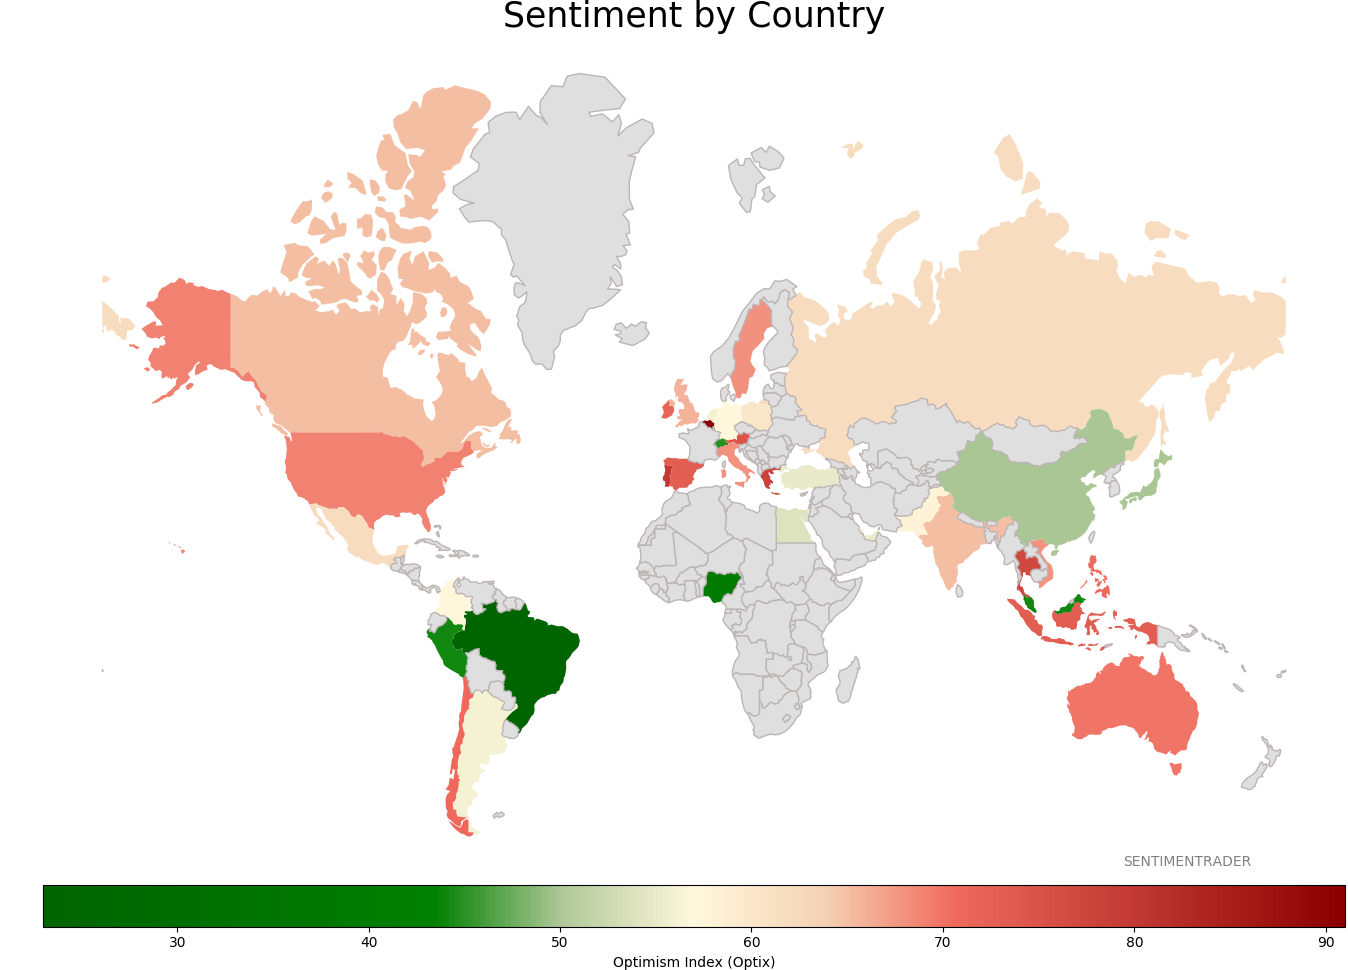
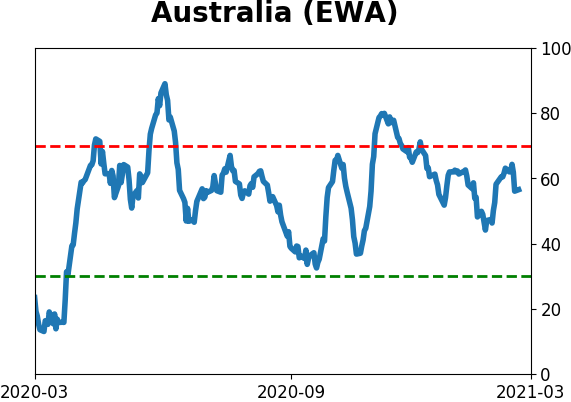
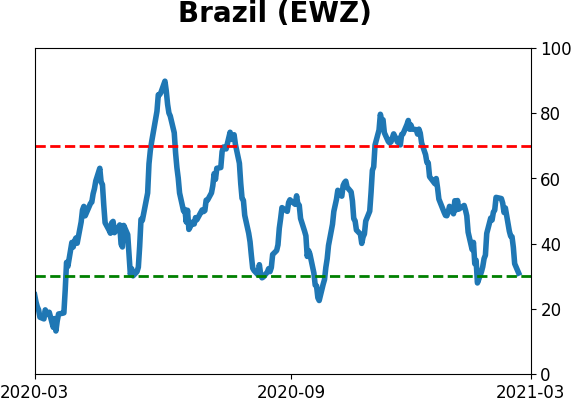
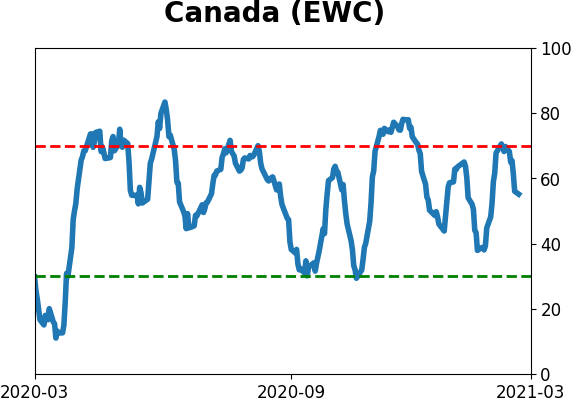
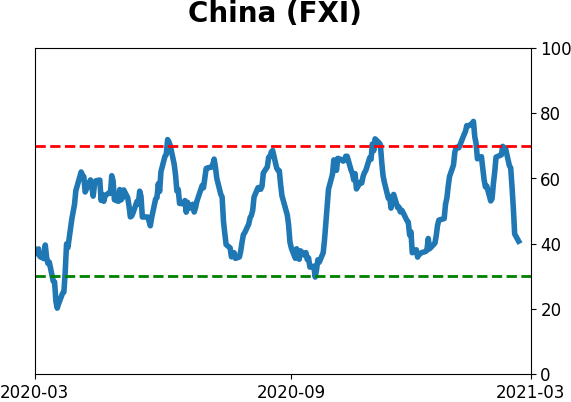
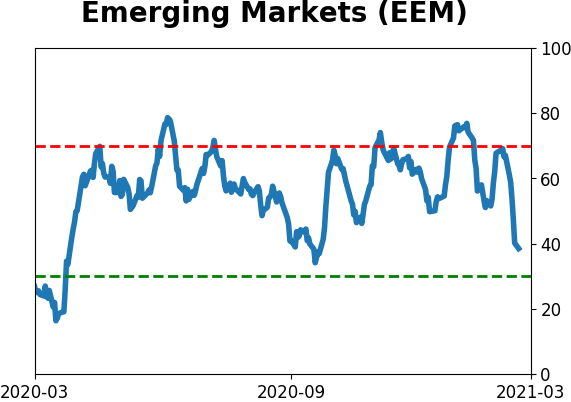
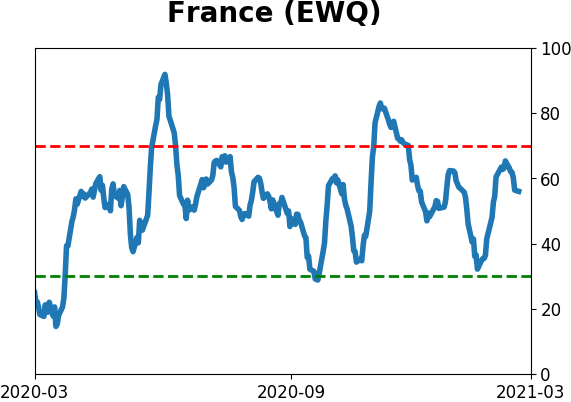
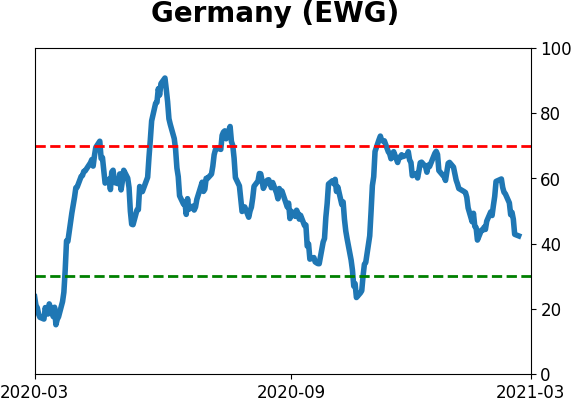
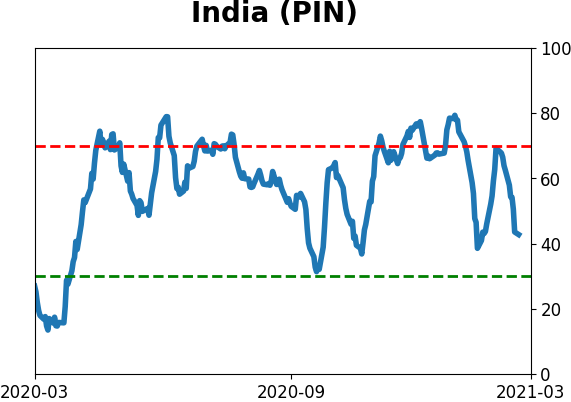
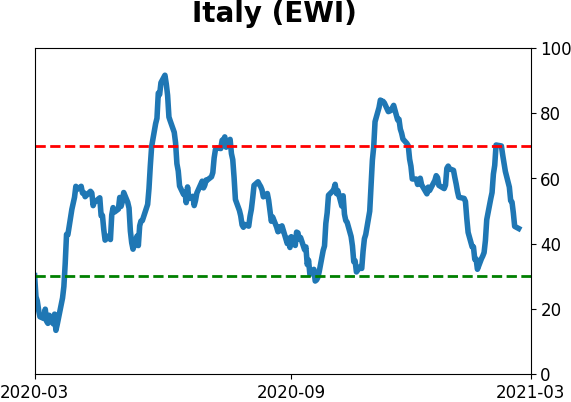
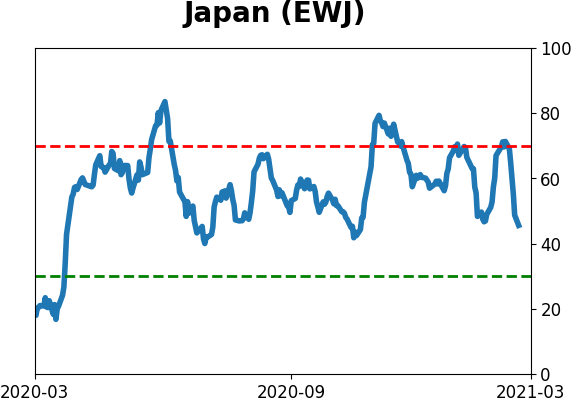
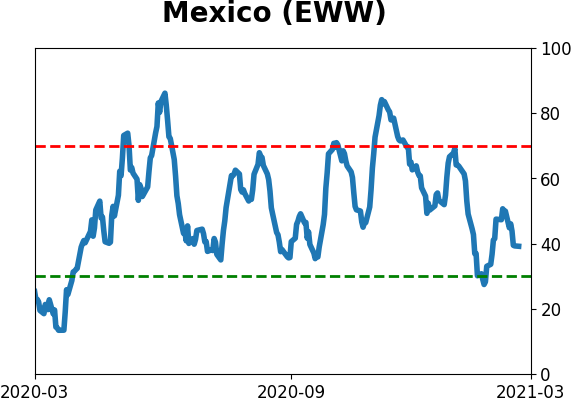
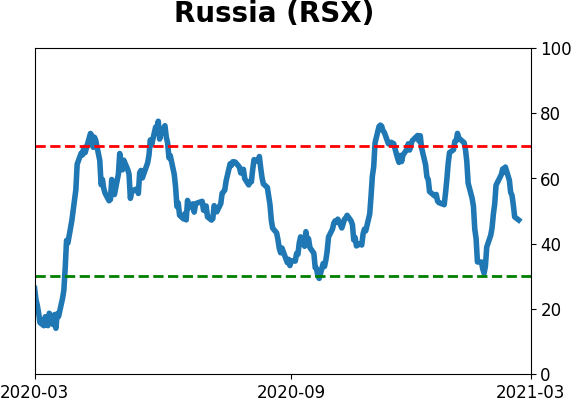
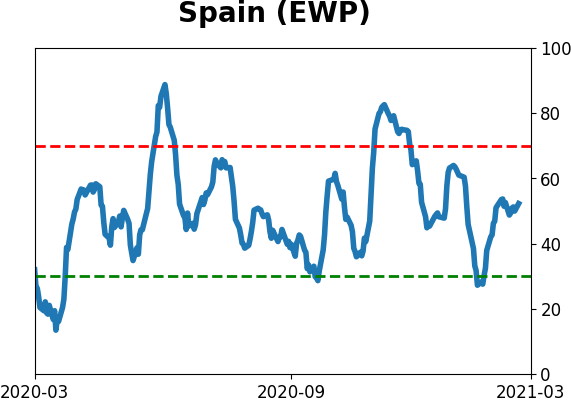
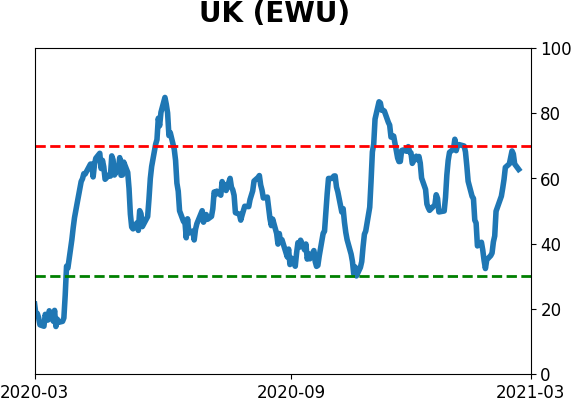
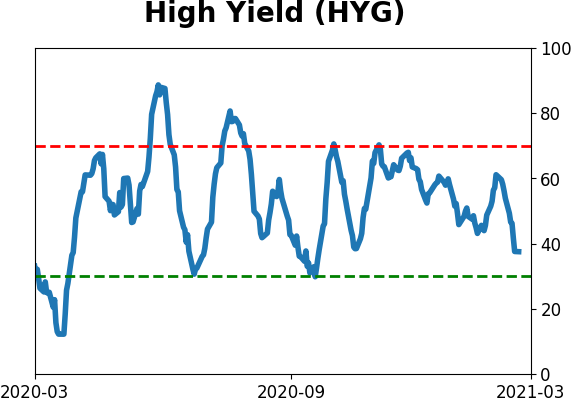
Sentiment Around The World
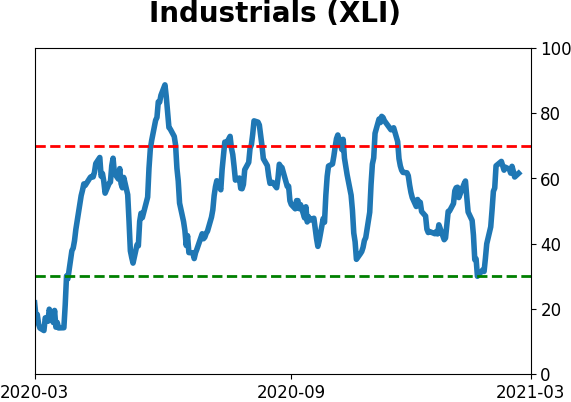
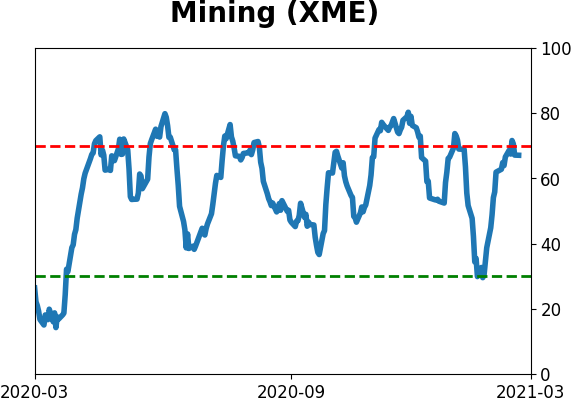
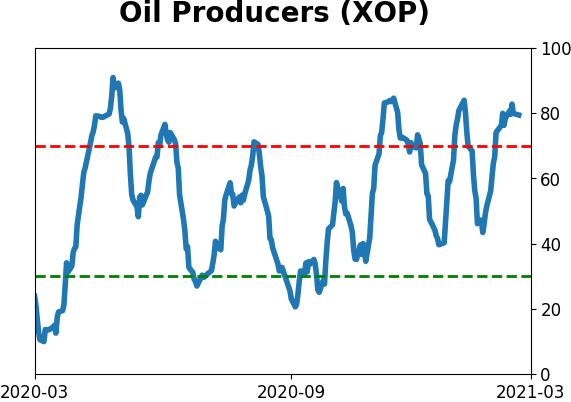
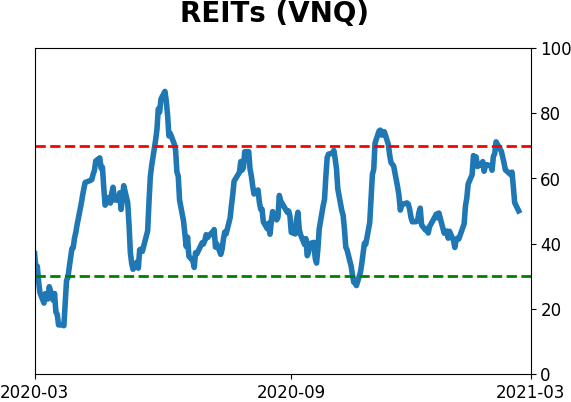
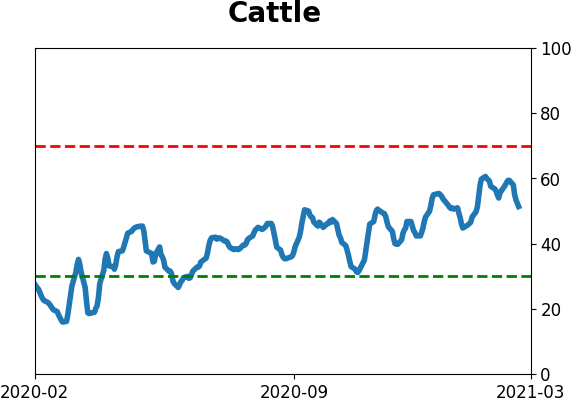
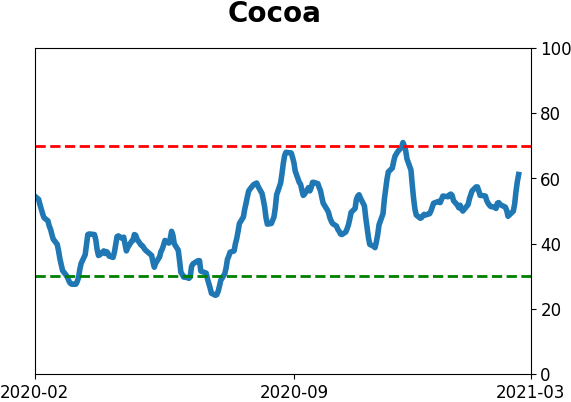
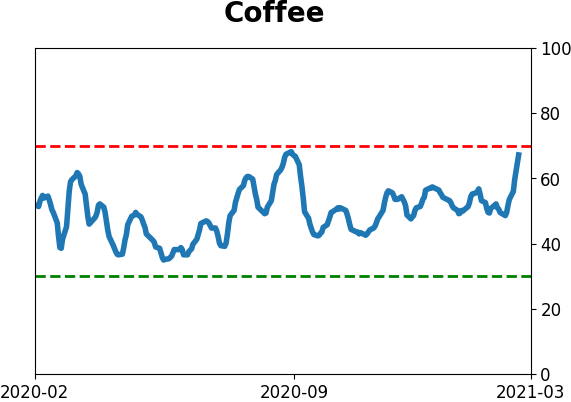
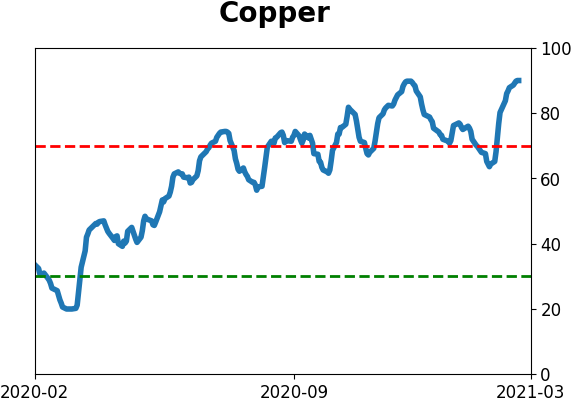
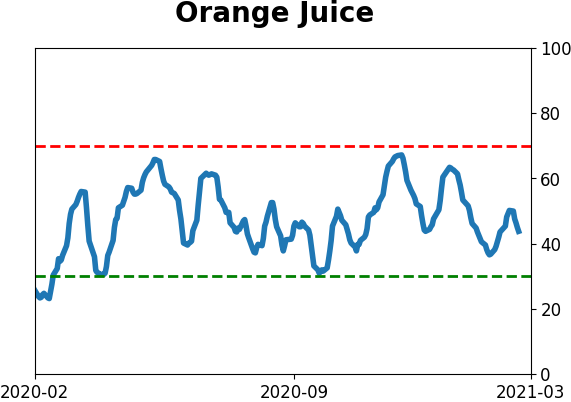
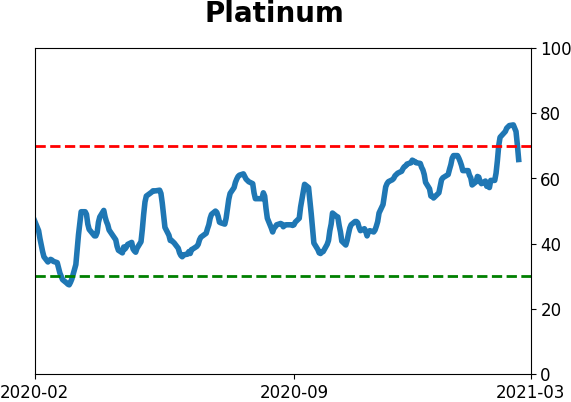
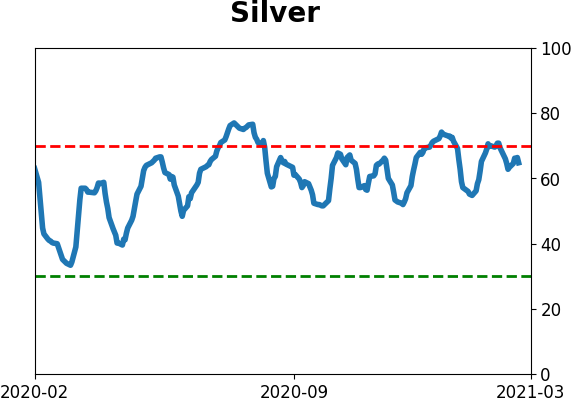
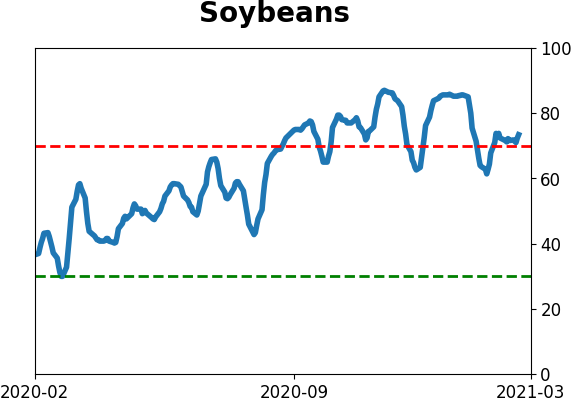
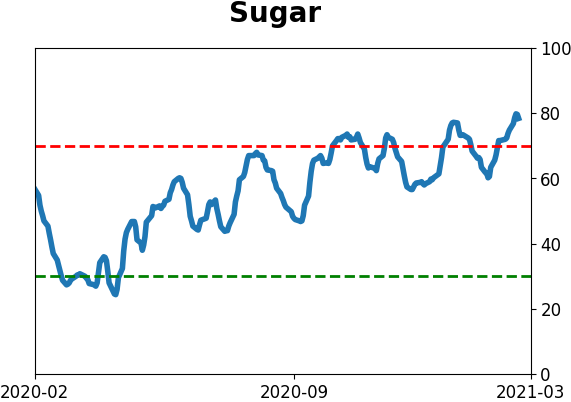
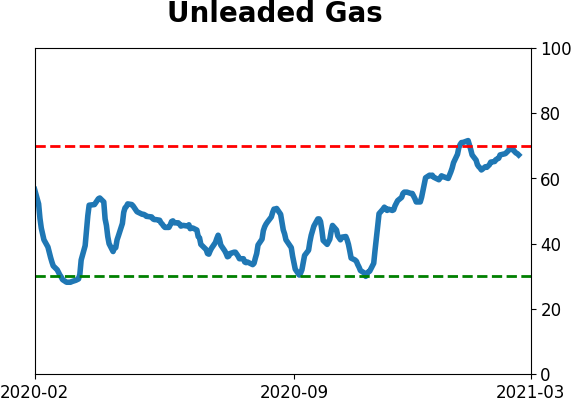
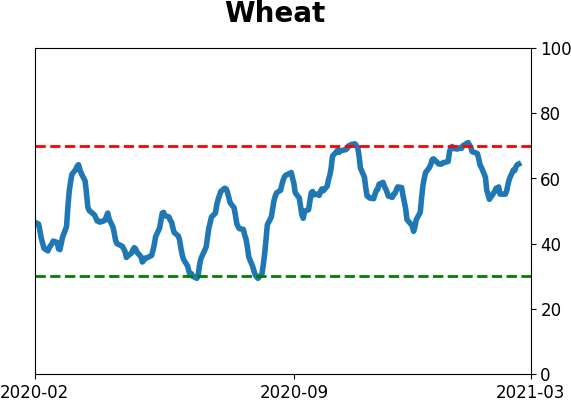
Optimism Index Thumbnails
|
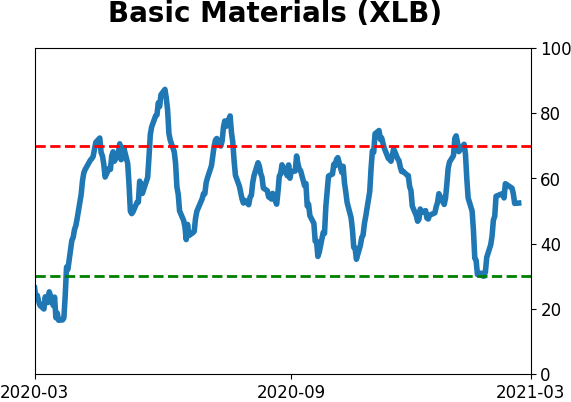
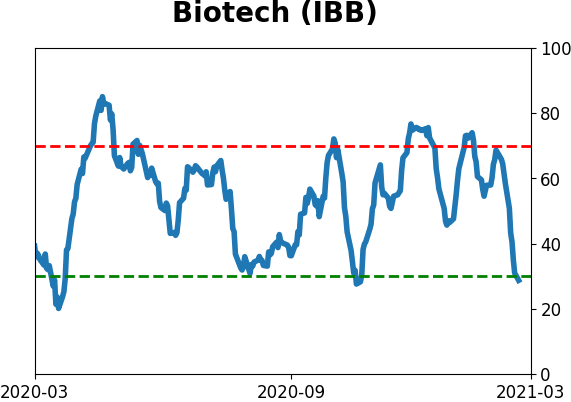
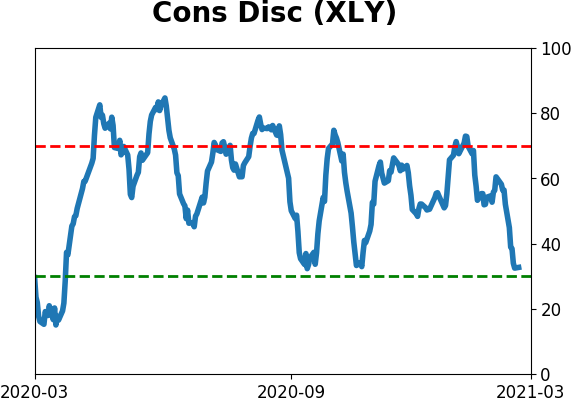
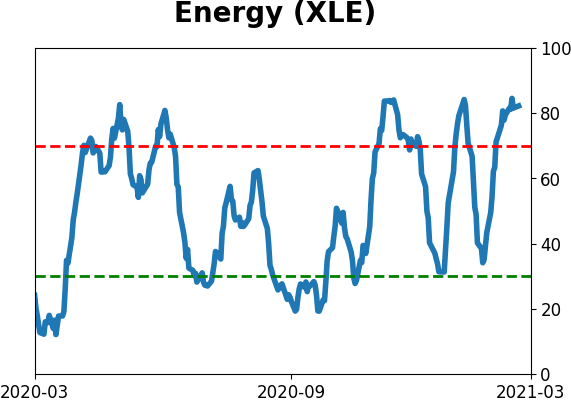
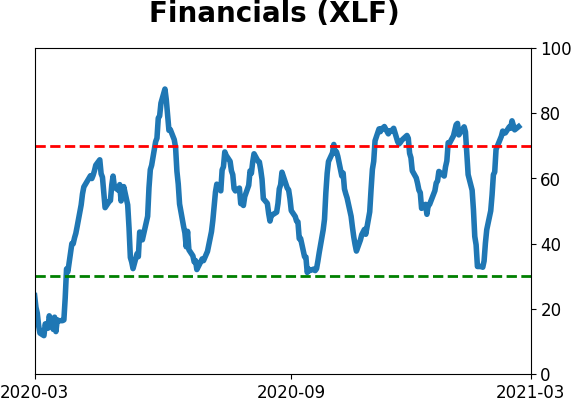
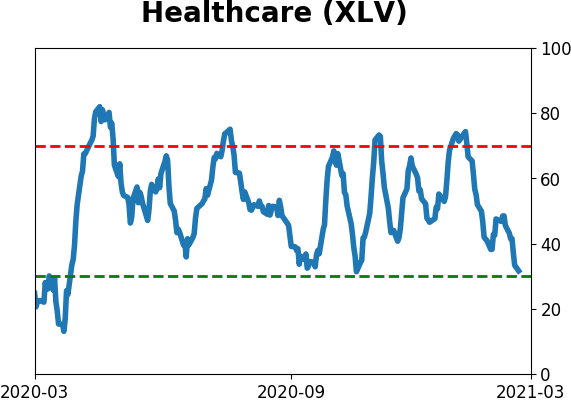
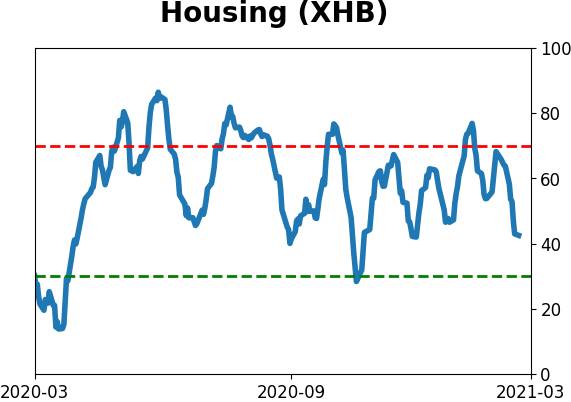
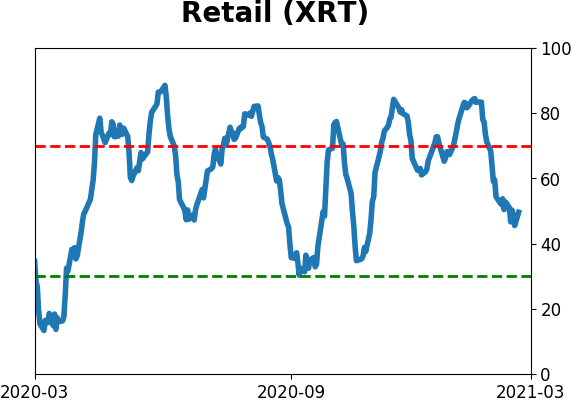
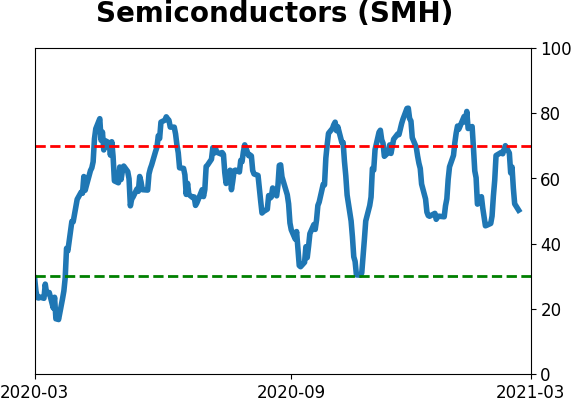
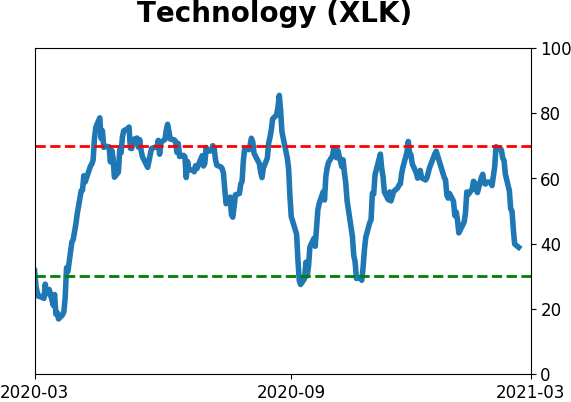
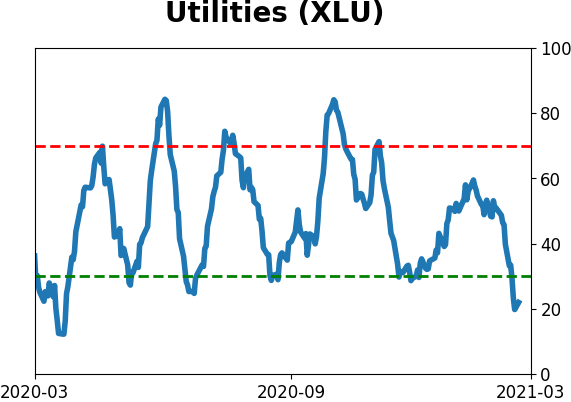
Sector ETF's - 10-Day Moving Average
|
|
|
Country ETF's - 10-Day Moving Average
|
|
|
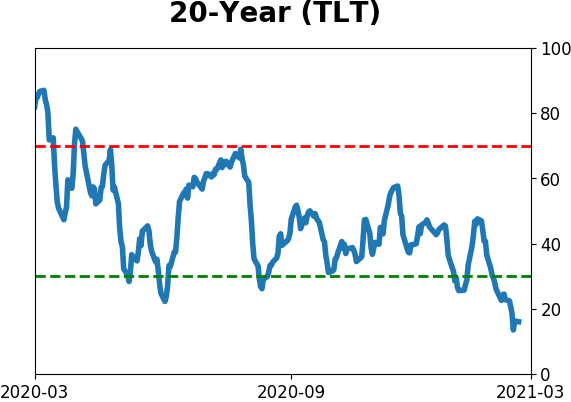
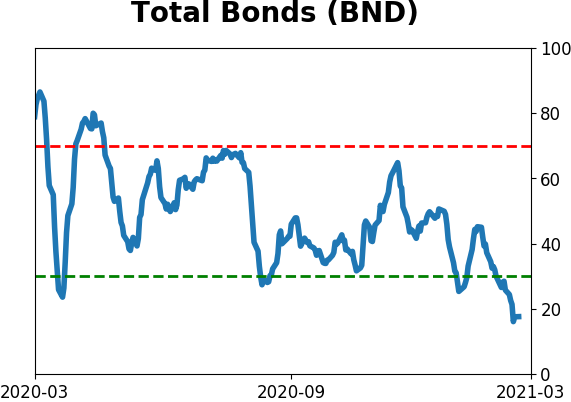
Bond ETF's - 10-Day Moving Average
|
|
|
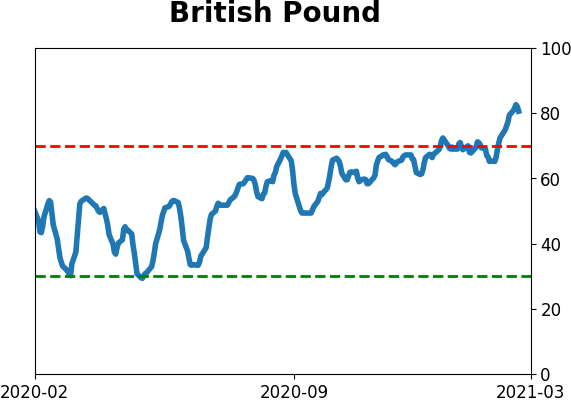
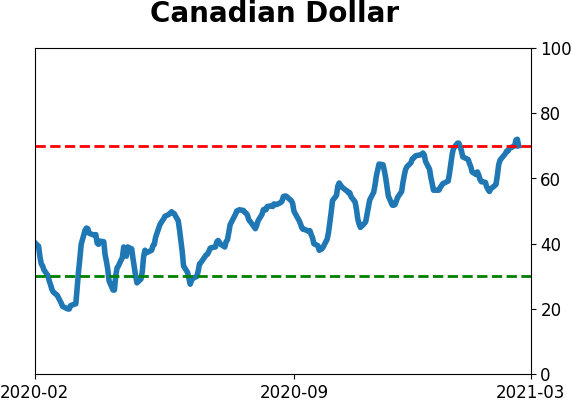
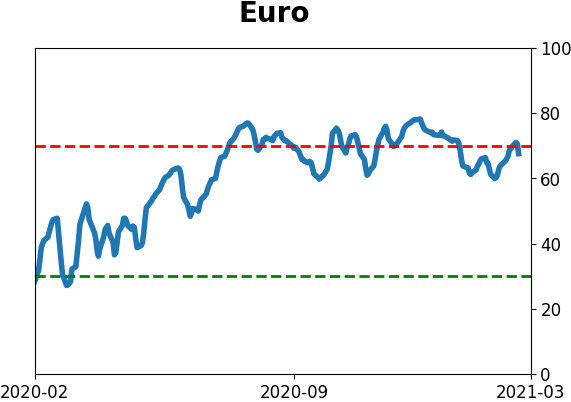
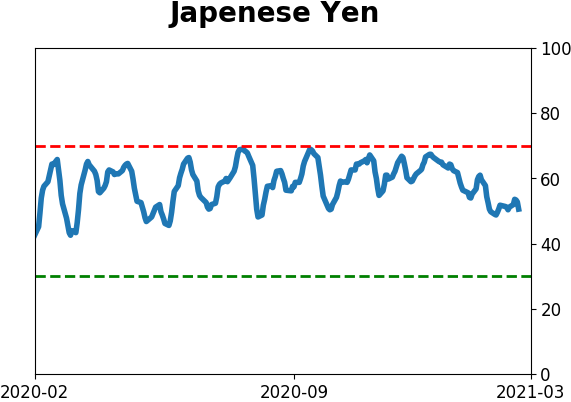
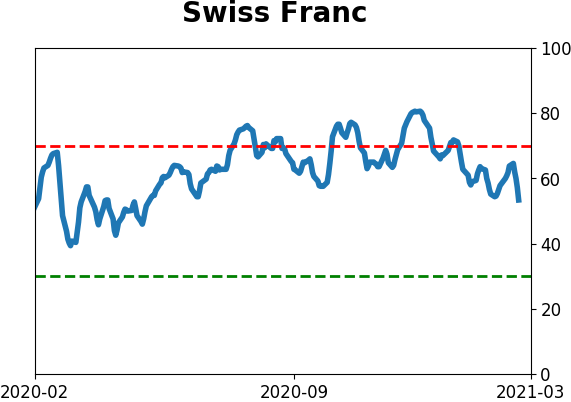
Currency ETF's - 5-Day Moving Average
|
|
|
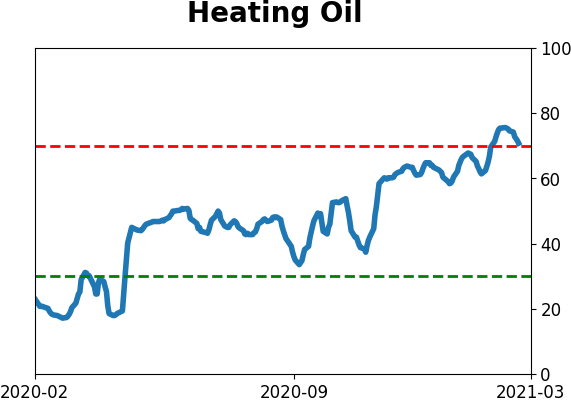
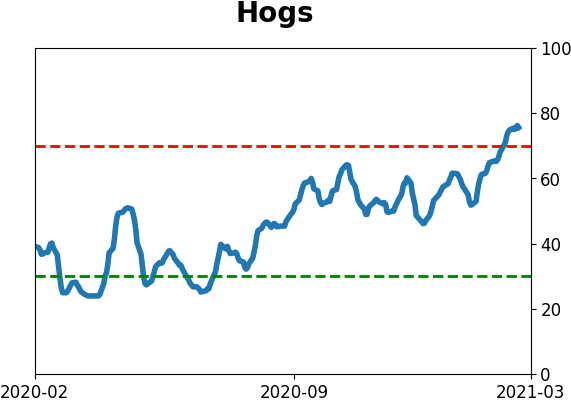
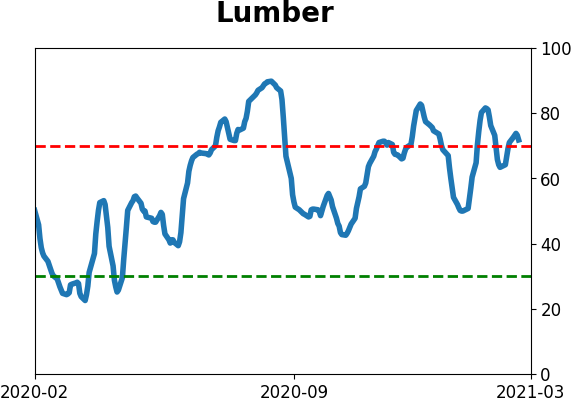
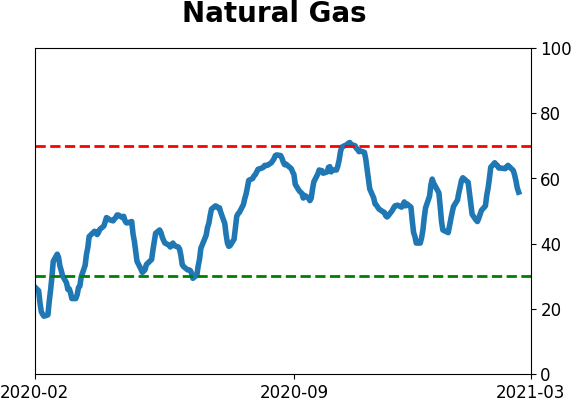
Commodity ETF's - 5-Day Moving Average
|
|