Headlines
|
|
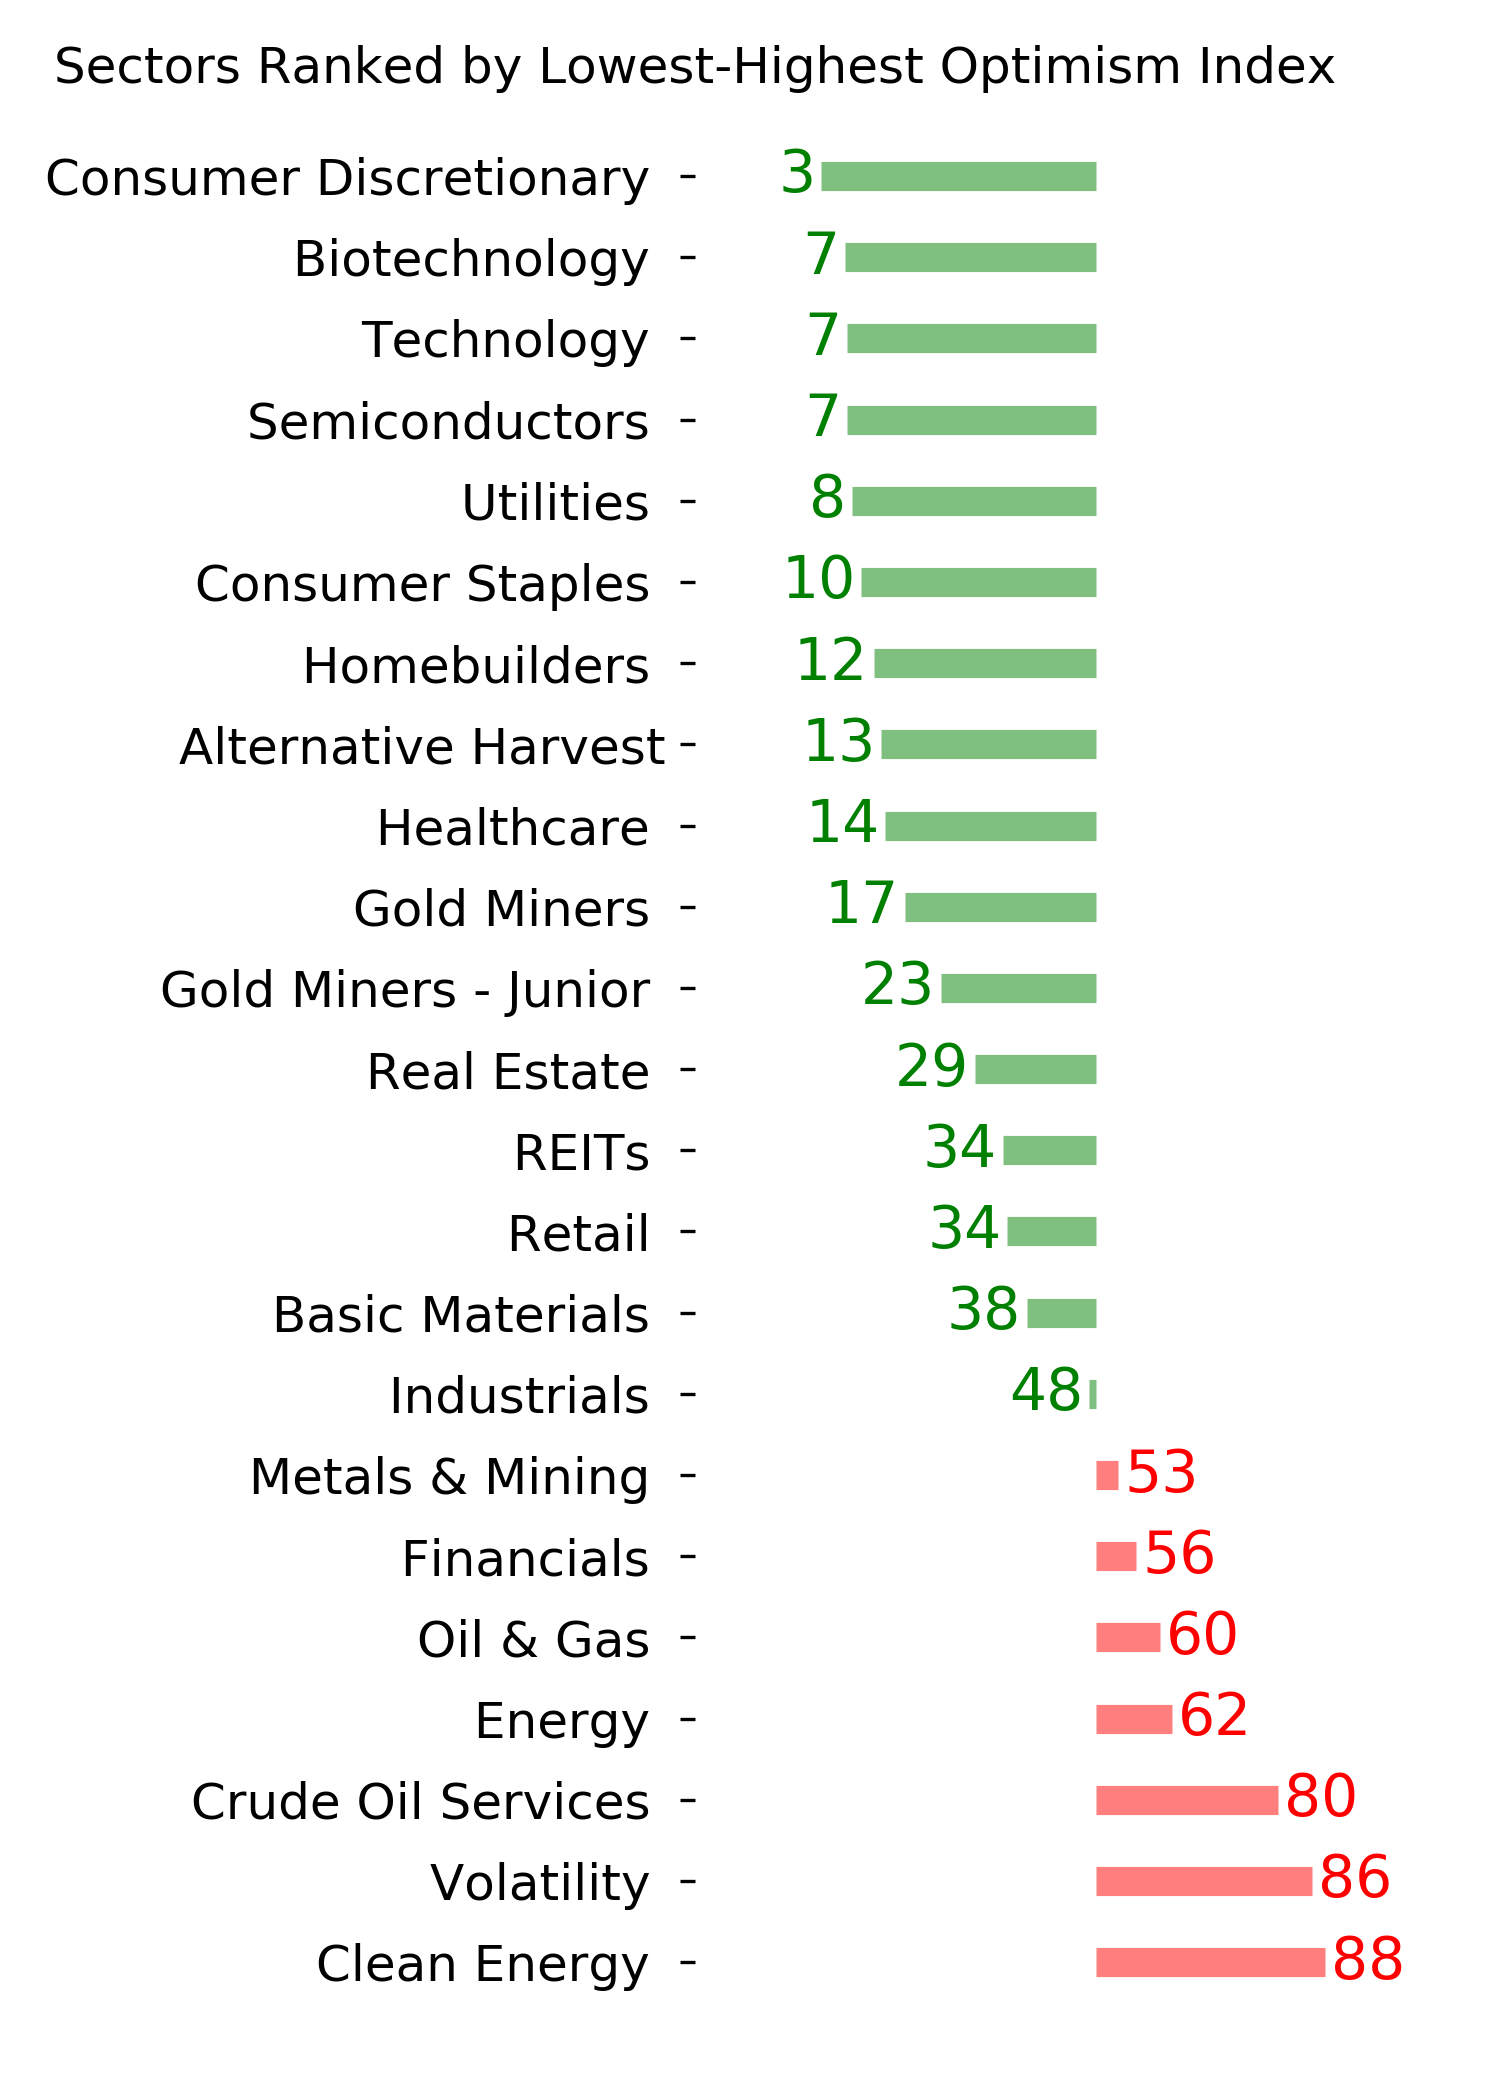
A major breakout in recovery sector stocks:
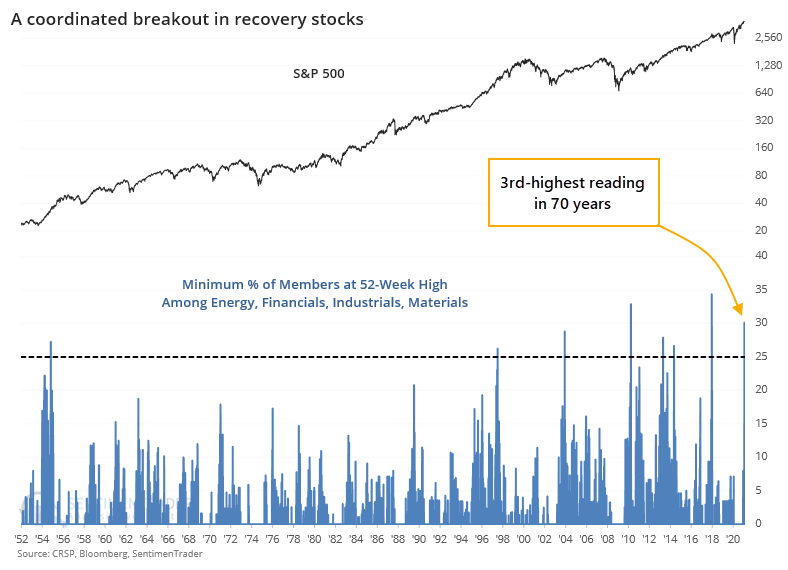
On Wednesday, there was a surge in 52-week highs among members of the Energy, Financial, Industrial, and Material sectors, those most geared to an economic recovery. Other times over the past 70 years when those sectors saw this kind of breakout, stocks struggled over the medium-term.
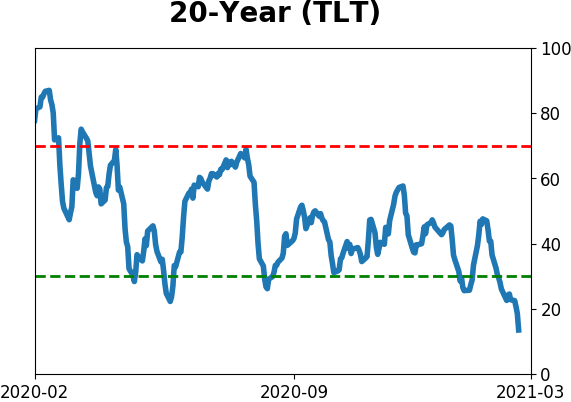
Bond break: We don't often see the bond market break like it did this afternoon. In stocks, this kind of behavior is usually a sign of a short-term extreme. For the most popular Treasury bond fund, TLT, the selling pressure has been enough that its 14-day Relative Strength Index (RSI) fell below 19 for only the 3rd time in its history. Sentiment on notes/bonds is relatively mixed, nearing pessimistic conditions but not overwhelmingly so, but this technical measure at least is signaling that sellers have pressed very, very hard.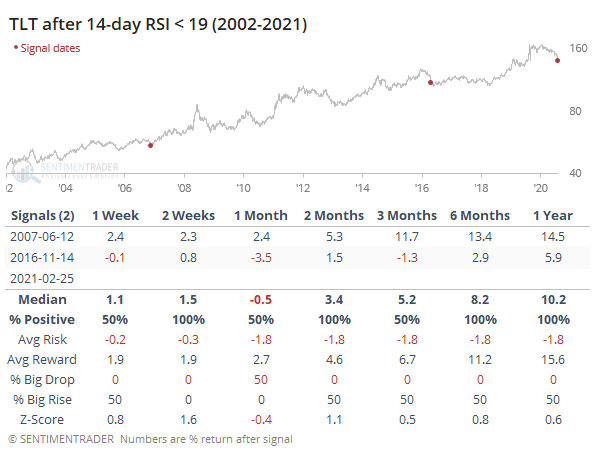
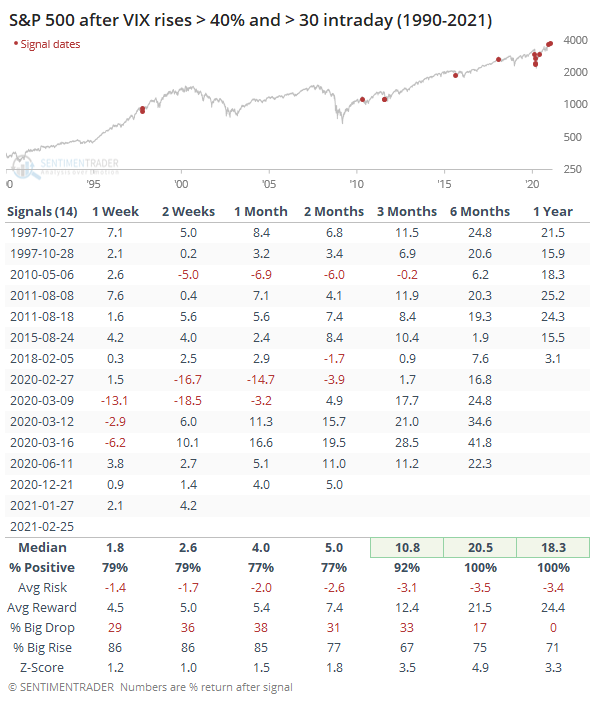
VIX gets even higher: The VIX "fear gauge" has been oddly elevated, and got even more so on Thursday. It spiked more than 40% intraday, exceeding 30 at some point. Big rips in the VIX when it's already relatively high have preceded some short-term scary moments but ended up rewarding those hanging on for 3 months or longer.
Bottom Line:
See the Outlook & Allocations page for more details on these summaries STOCKS: Weak sell
We're in an extremely speculative environment that is enough to suggest a defensive posture. Internal breadth and momentum have mostly remained positive, so a more strenuous sell wouldn't trigger unless that changed. BONDS: Weak buy
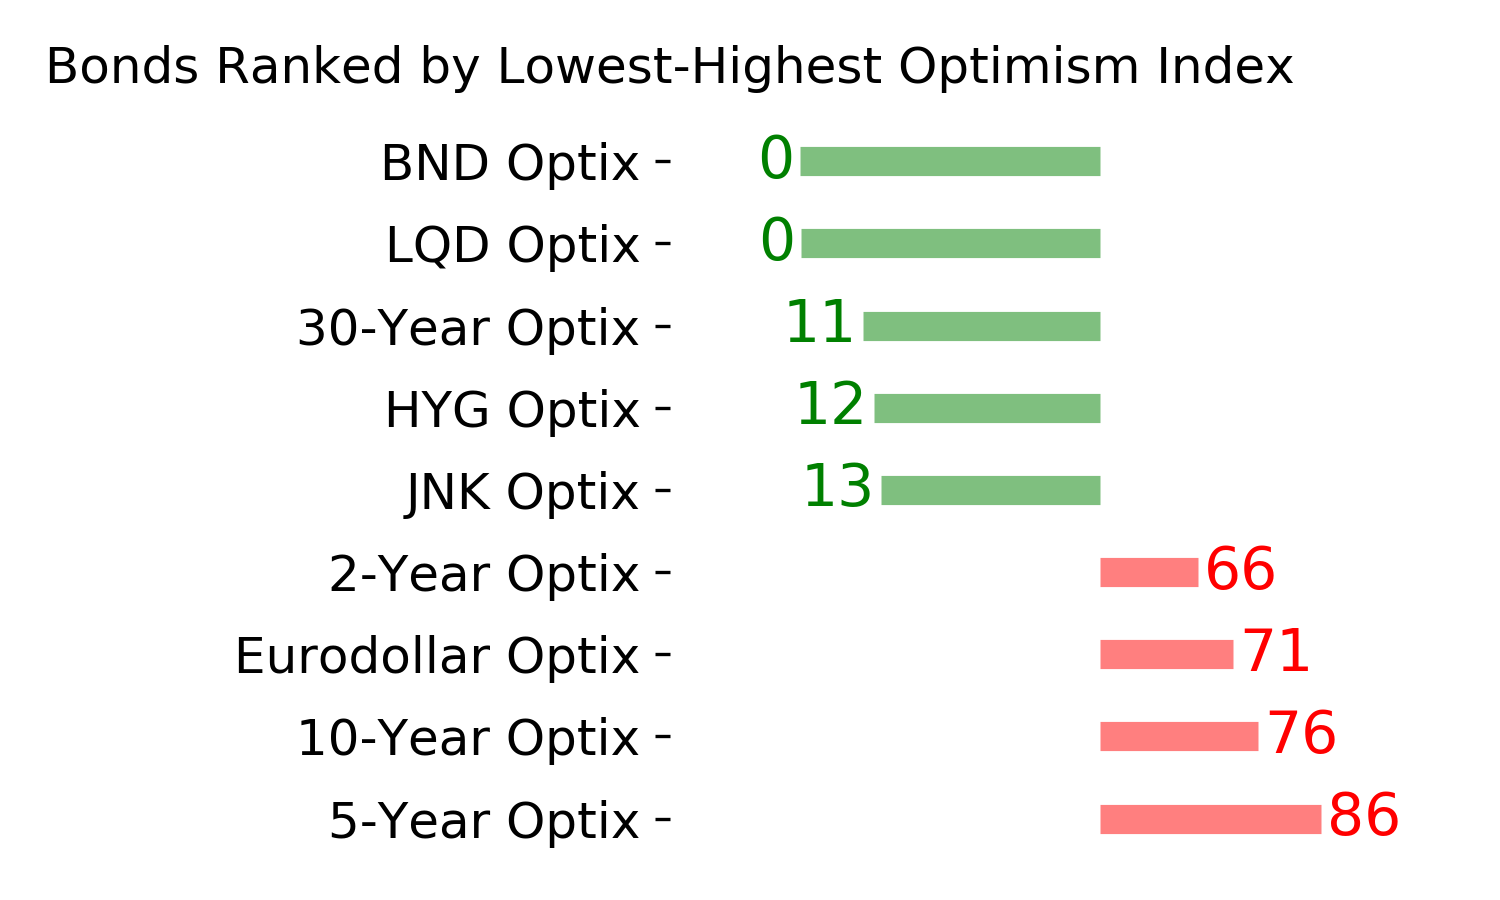
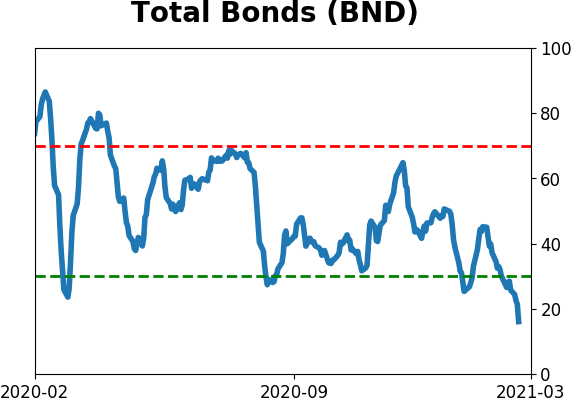
Various parts of the market have been hit in recent weeks, with mild oversold conditions. The Bond Optimism Index is now about as low as it gets during healthy bond market environments. GOLD: Weak buy
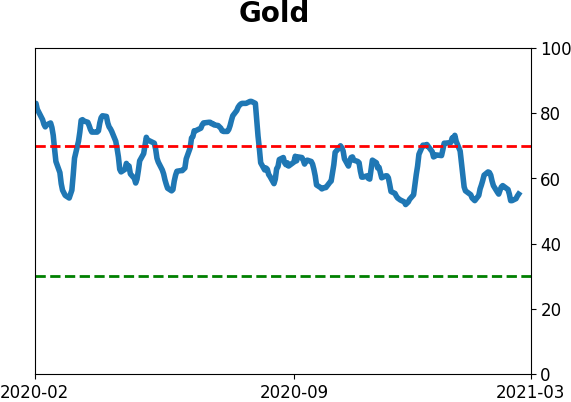
A dollar trying to rebound from a severe short position has weighed on gold and miners. The types of signals they've given in recent weeks, within the context of their recent surge, have usually resulted in higher prices over a medium- to long-term time frame.
|
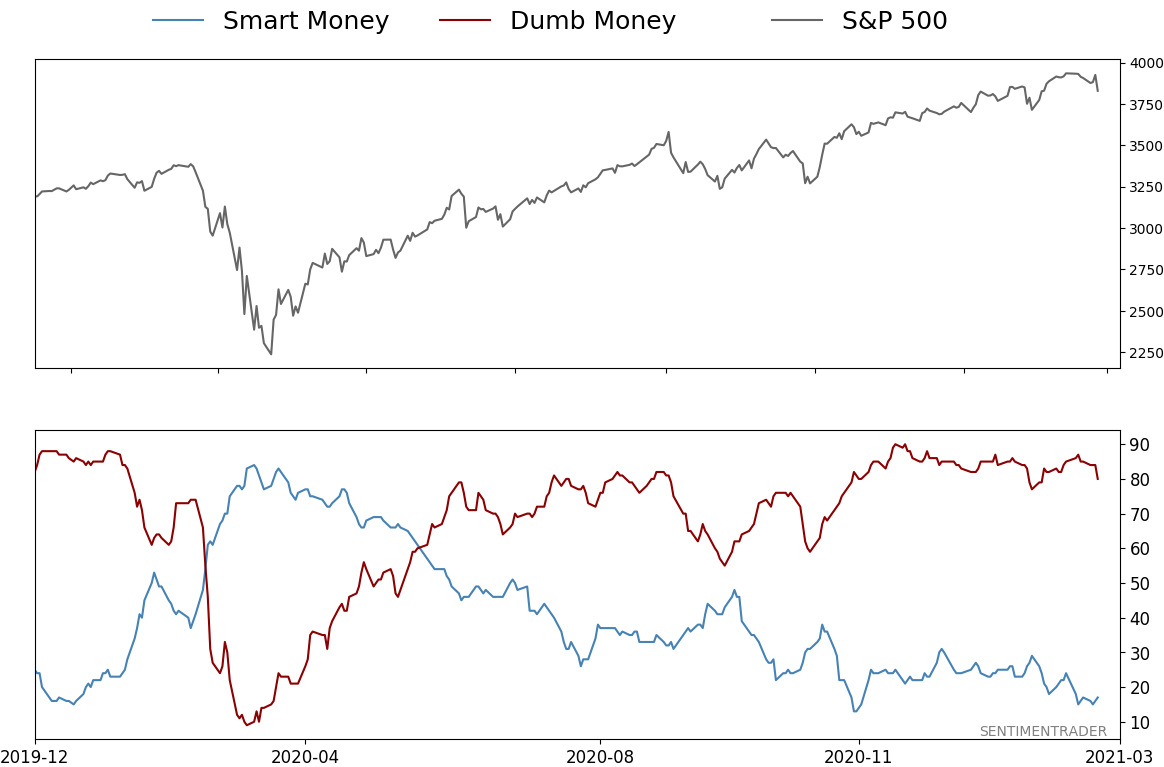
Smart / Dumb Money Confidence
|
Smart Money Confidence: 17%
Dumb Money Confidence: 80%
|
|
Risk Levels
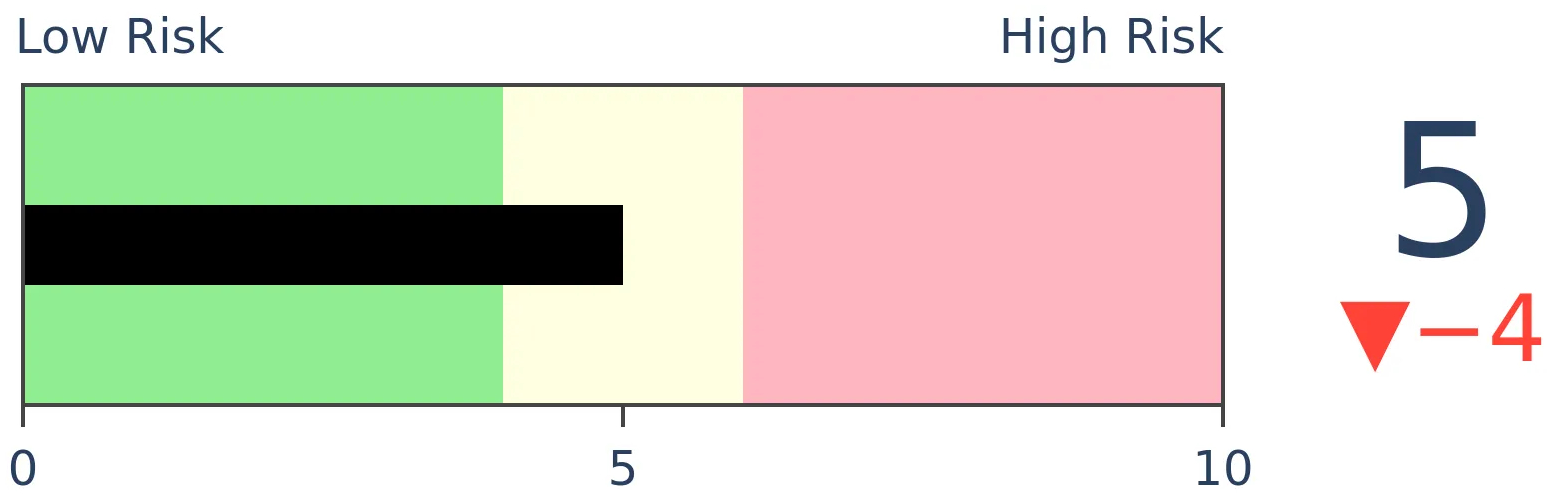
Stocks Short-Term
|
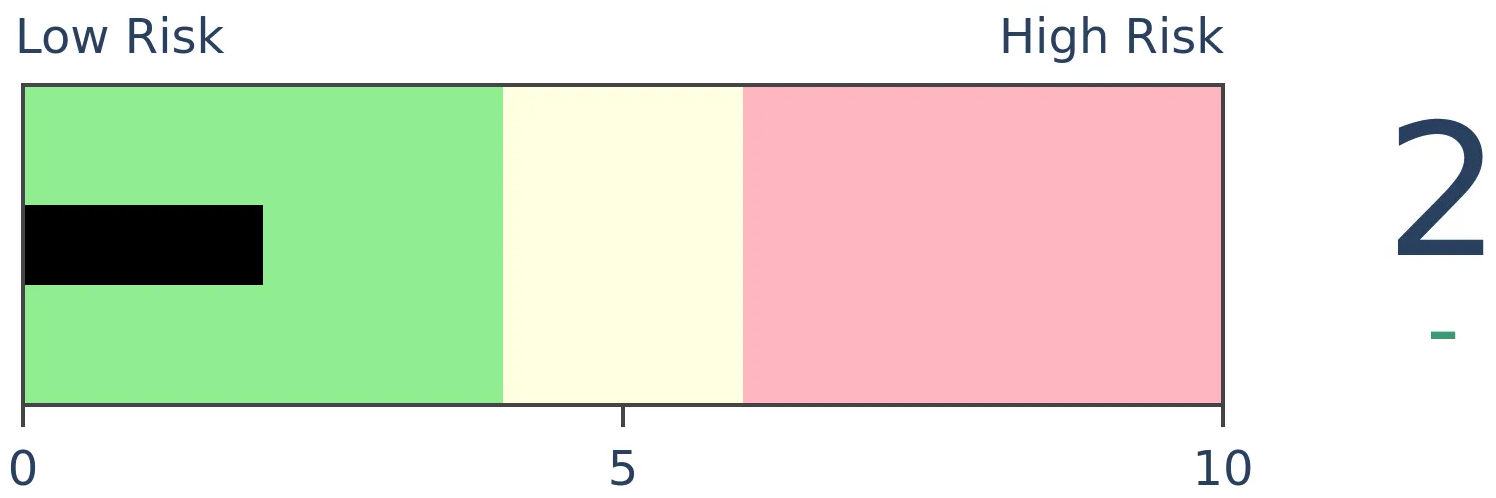
Stocks Medium-Term

|
|
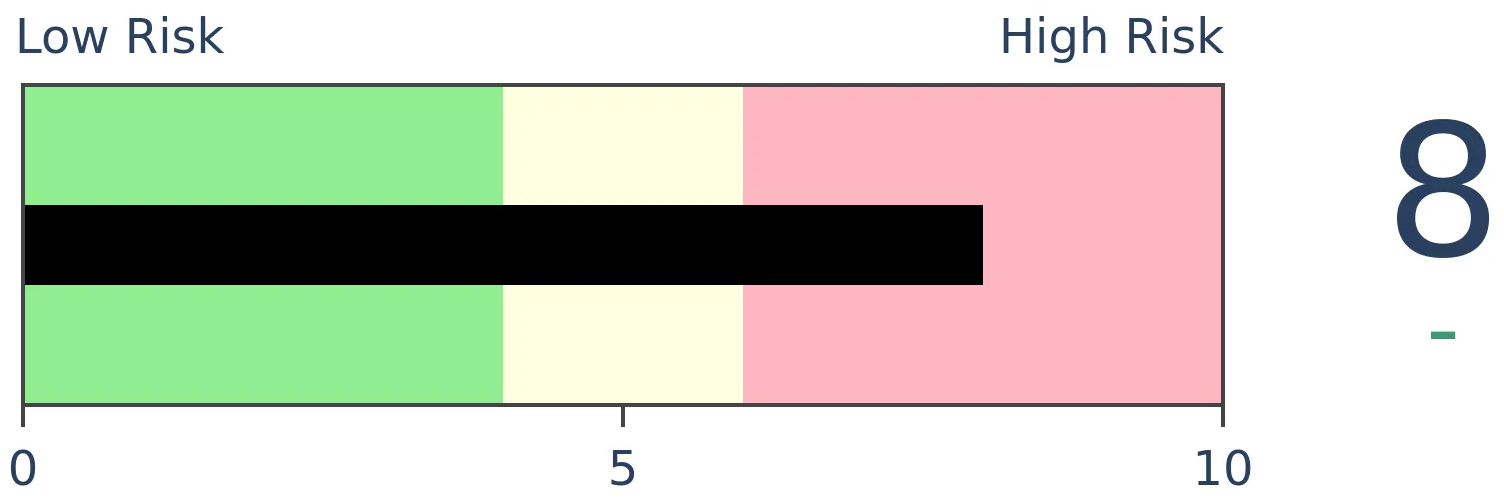
Bonds

|
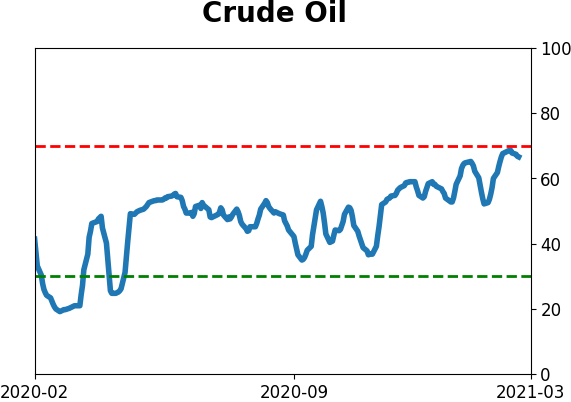
Crude Oil

|
|
Gold
|
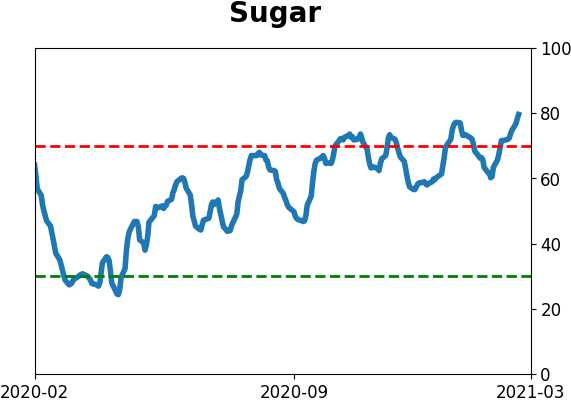
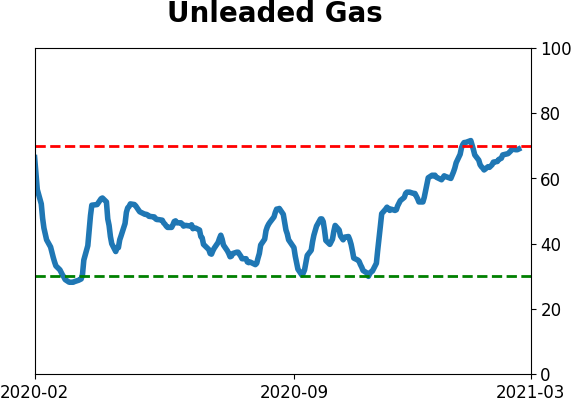
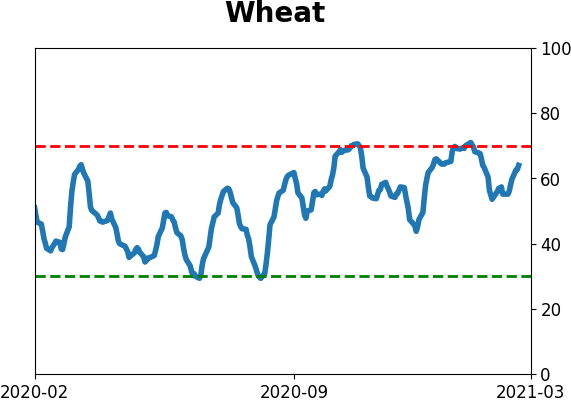
Agriculture
|
|
Research
BOTTOM LINE
On Wednesday, there was a surge in 52-week highs among members of the Energy, Financial, Industrial, and Material sectors, those most geared to an economic recovery. Other times over the past 70 years when those sectors saw this kind of breakout, stocks struggled over the medium-term.
FORECAST / TIMEFRAME
XLI -- Down, Medium-Term
|
Earlier this week, financial stocks enjoyed a broad breakout, with nearly 30% of stocks in the sector breaking out to at least a 52-week high.
It's only gotten better from there. And they've been joined by a bunch of recovery-sector buddies, too.
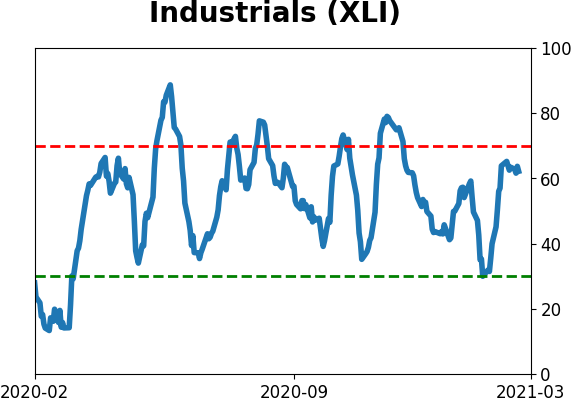
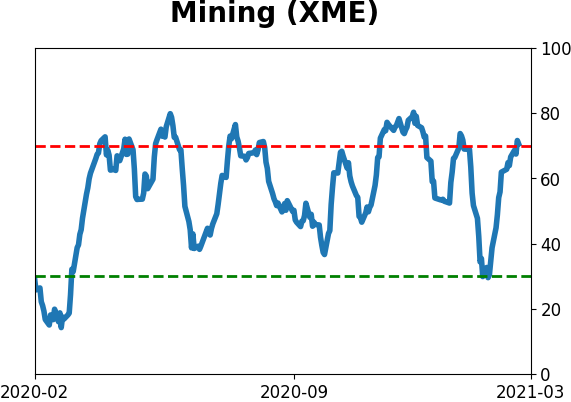
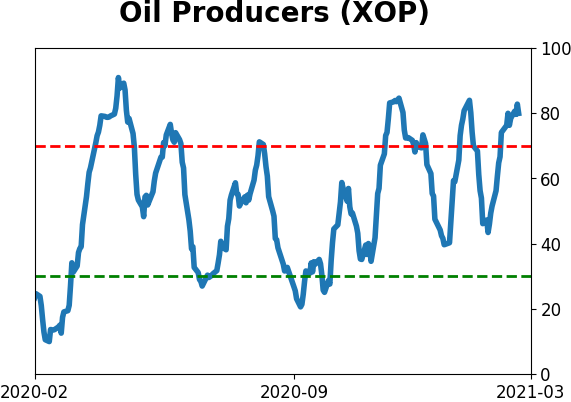
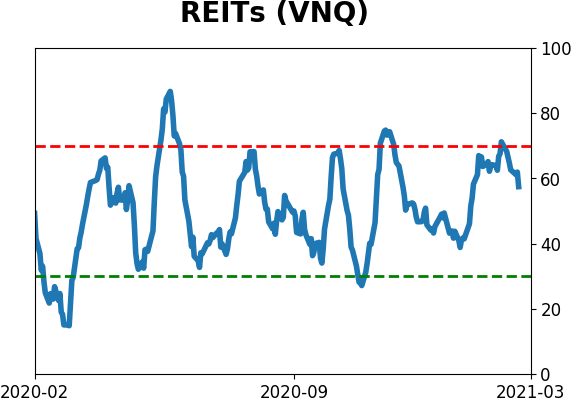
Among all indexes and sectors, the four horsemen of a recovery - Energy, Financials, Industrials, and Materials - are leading the charge. At least 30% of member stocks in all four of those sectors reached a new high on Wednesday. That's among the most impressive breakouts in 70 years for sectors geared to an economic recovery.
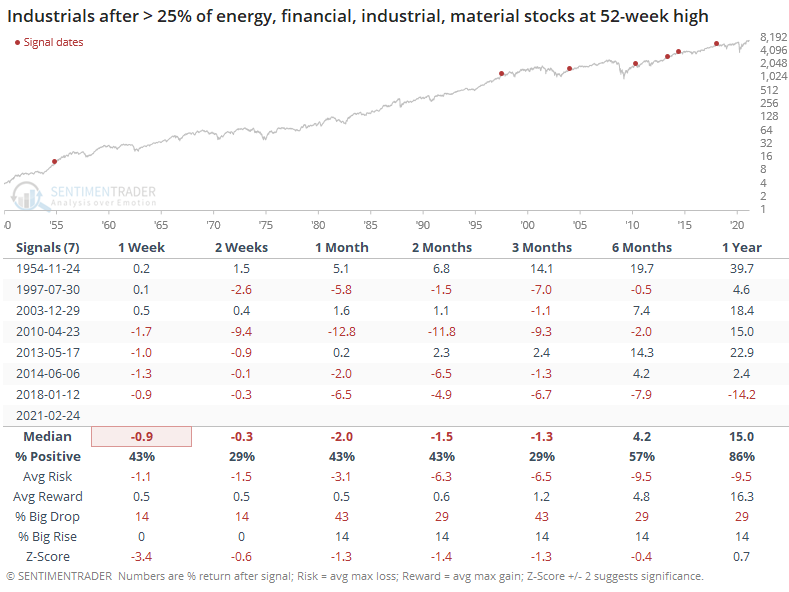
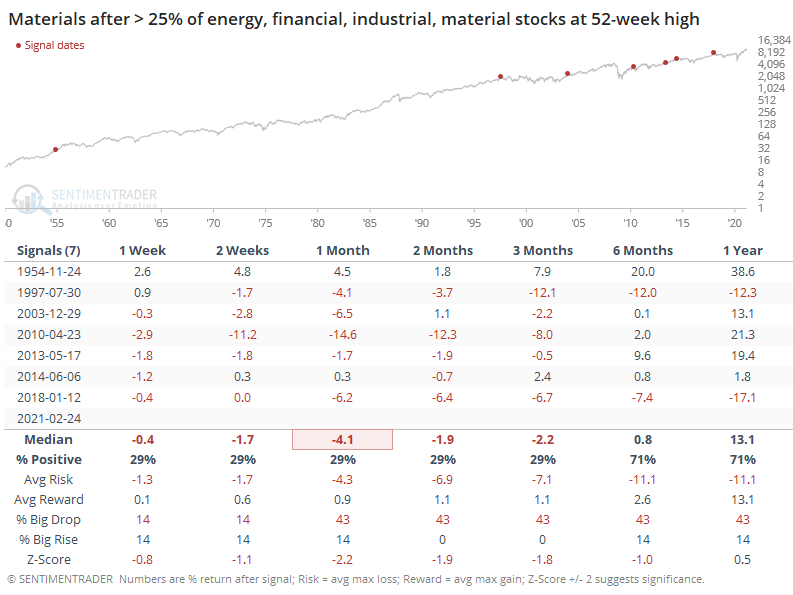
Let's check to see whether other coordinated breakouts from these sectors have preceded consistent returns. The table below shows forward returns in the S&P 500 (price only) following any day when at least 25% of members in all four of those sectors hit a 52-week high.
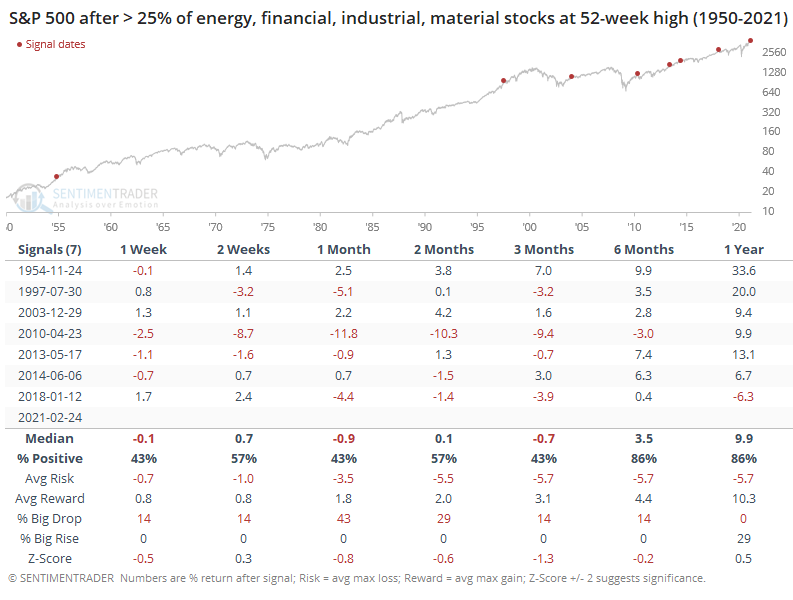
Over the short- to medium-term, returns weren't great. The S&P's median return was well below random, risk was higher than reward, and it had a greater chance of suffering a big drop than enjoying a big rise. That started to change after a few months, and by a year later, things were looking better.
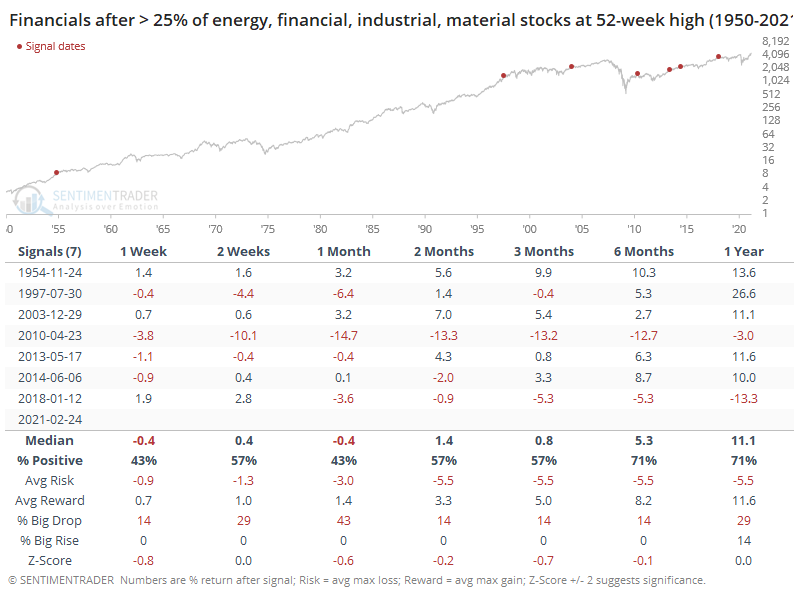
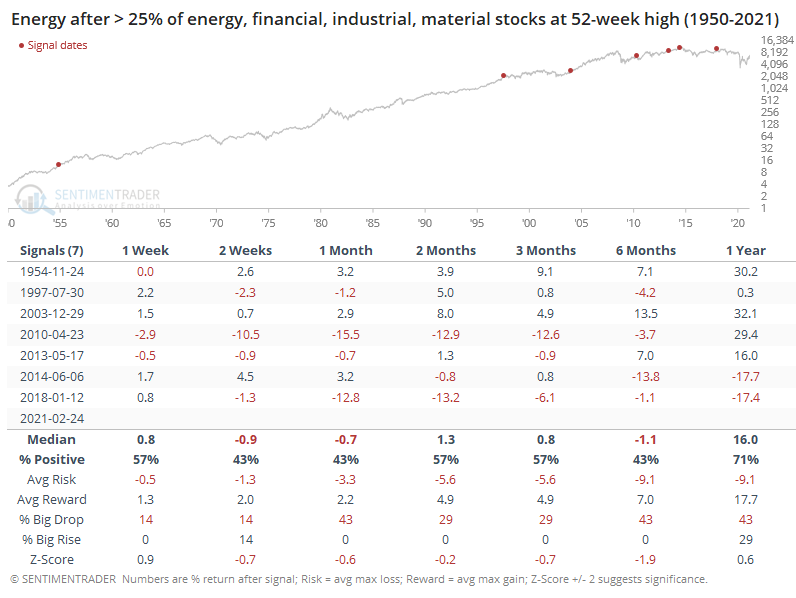
We can see returns for each of the four sectors below. These are total return, so it includes price change and dividends. Among them, Financials generally held up the best, Energy was next, then Industrials and Materials brought up the rear. It was rare for the latter two to show gains at all over the next few months.
The story surrounding these breakouts sounds great, and the news is looking good. Of course, it was the exact opposite scenario 11 months ago, and look where we are now. After some spotty days in January, the extreme (maybe even record) speculative activity we've seen in recent months has not preceded internal deterioration. Breadth and momentum remain strong, and that bodes well longer-term. In the interim, the biggest negative is just that things have been so positive for so long, they rarely keep going uninterrupted over a 2-3 month time frame.
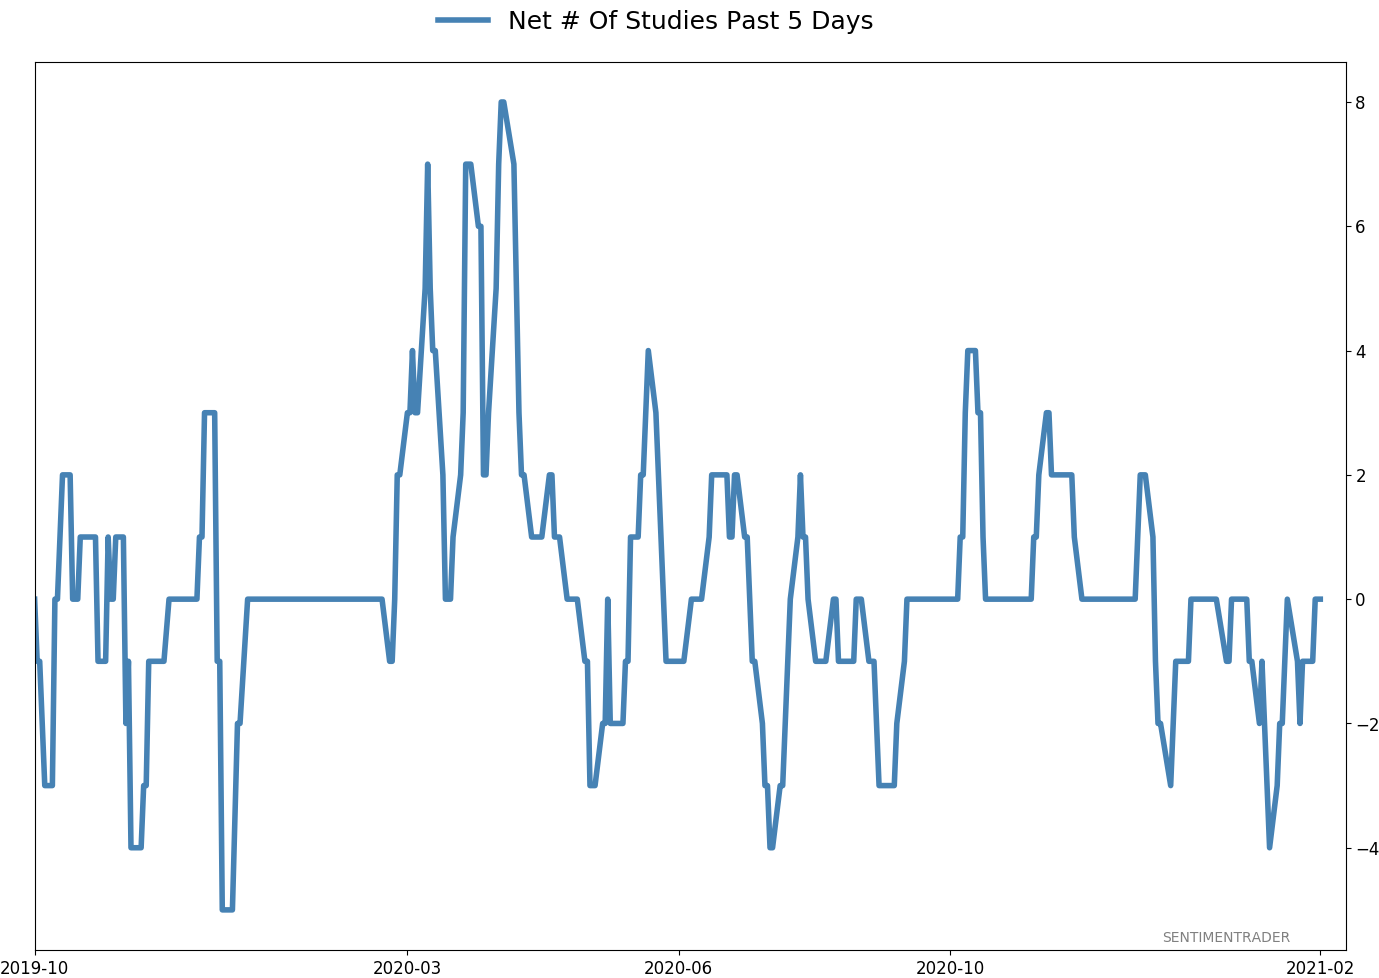
Active Studies
| Time Frame | Bullish | Bearish | | Short-Term | 0 | 0 | | Medium-Term | 2 | 8 | | Long-Term | 16 | 3 |
|
Indicators at Extremes
Portfolio
| Position | Description | Weight % | Added / Reduced | Date | | Stocks | RSP | 4.9 | Reduced 4% | 2021-02-09 | | Bonds | 30.0% BND, 8.8% SCHP | 38.8 | Added 15.1% | 2021-02-18 | | Commodities | GCC | 2.3 | Reduced 2.1%
| 2020-09-04 | | Precious Metals | GDX | 9.0 | Added 0.1% | 2021-02-18 | | Special Situations | 7.3% XLE, 4.8% PSCE | 12.1 | Reduced 5.6% | 2021-02-18 | | Cash | | 32.8 | | |
|
Updates (Changes made today are underlined)
With a market that has seen the kinds of broad participation and big breath thrusts like we did in the fall, it's hard to become too negative. Those kinds of conditions have consistently preceded higher returns over the next 6-12 months. It's the interim that's more of an issue. Even conditions like that haven't prevented some shorter-term pullbacks. And when we combine an environment where speculation is rampant and recent days have seen an increase in cracks under the surface of the indexes, it's enough to become more defensive over a short- to medium-term time frame. We still don't have much confirmation from the price action in the indexes, so those who are more conservative would likely wait before increasing cash levels. I've decreased risk exposure a bit more, mainly in terms of energy stocks and the ANGL fund, while adding more to the broader bond market. RETURN YTD: 5.5% 2020: 8.1%, 2019: 12.6%, 2018: 0.6%, 2017: 3.8%, 2016: 17.1%, 2015: 9.2%, 2014: 14.5%, 2013: 2.2%, 2012: 10.8%, 2011: 16.5%, 2010: 15.3%, 2009: 23.9%, 2008: 16.2%, 2007: 7.8%
|
|
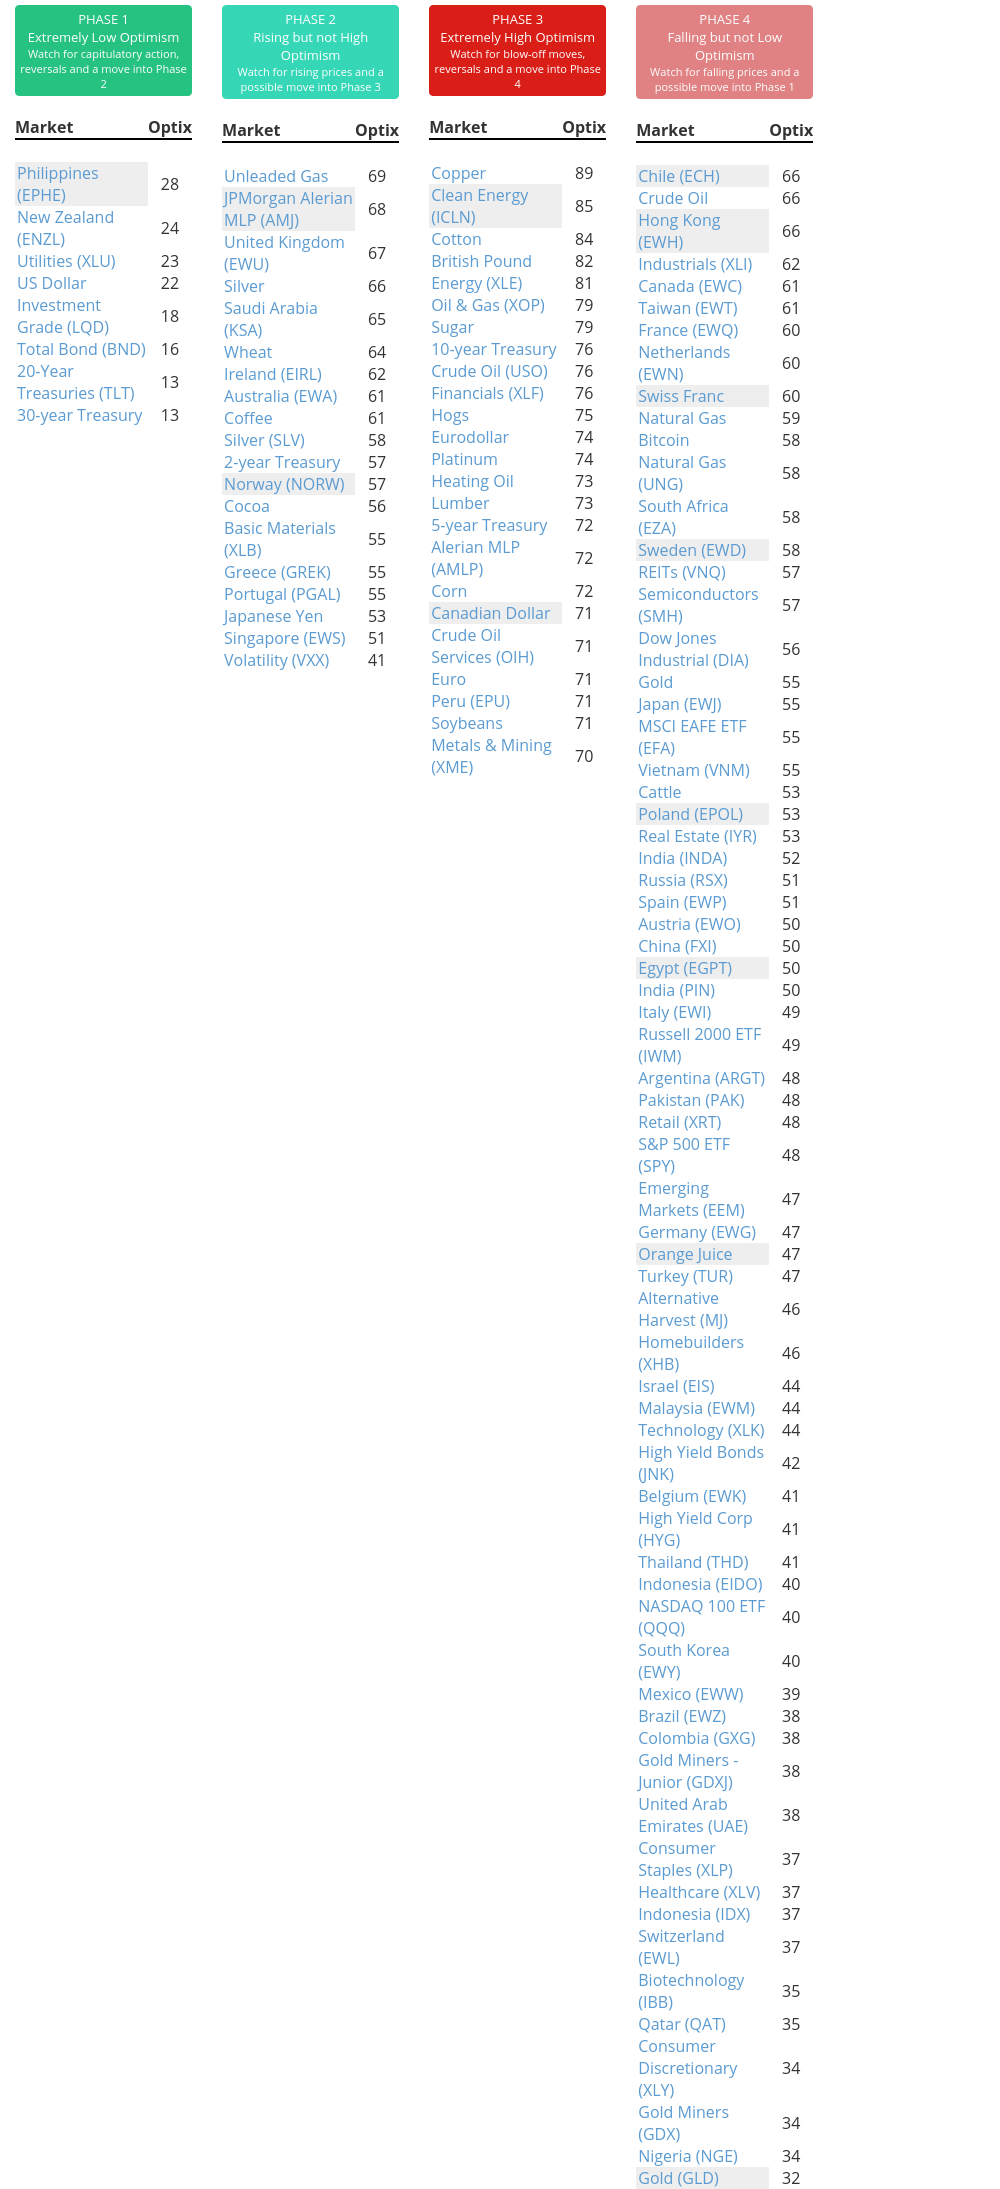
Phase Table
Ranks
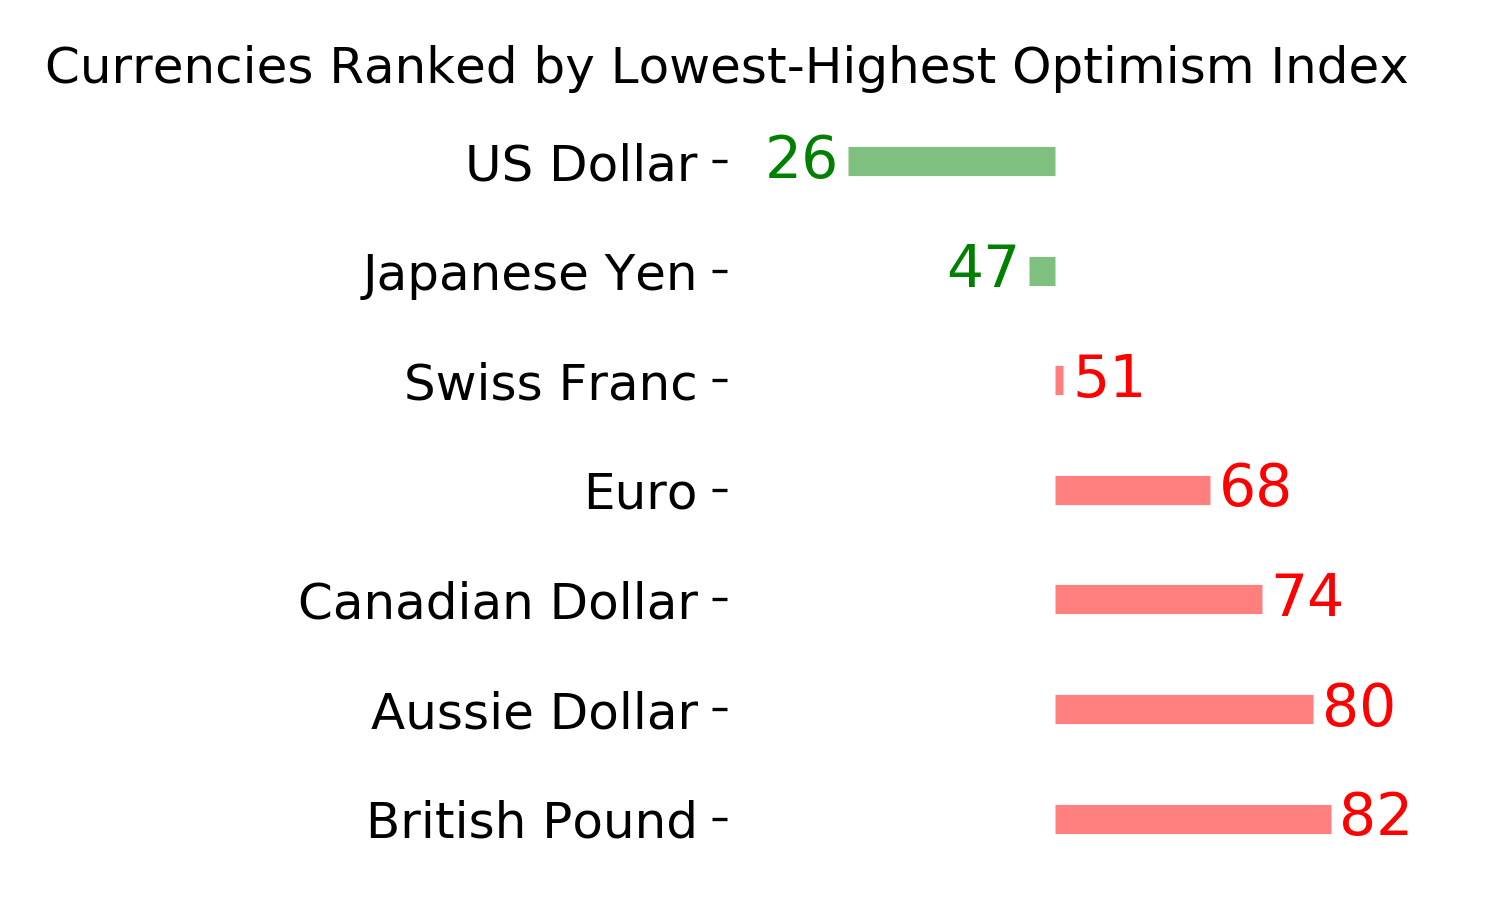
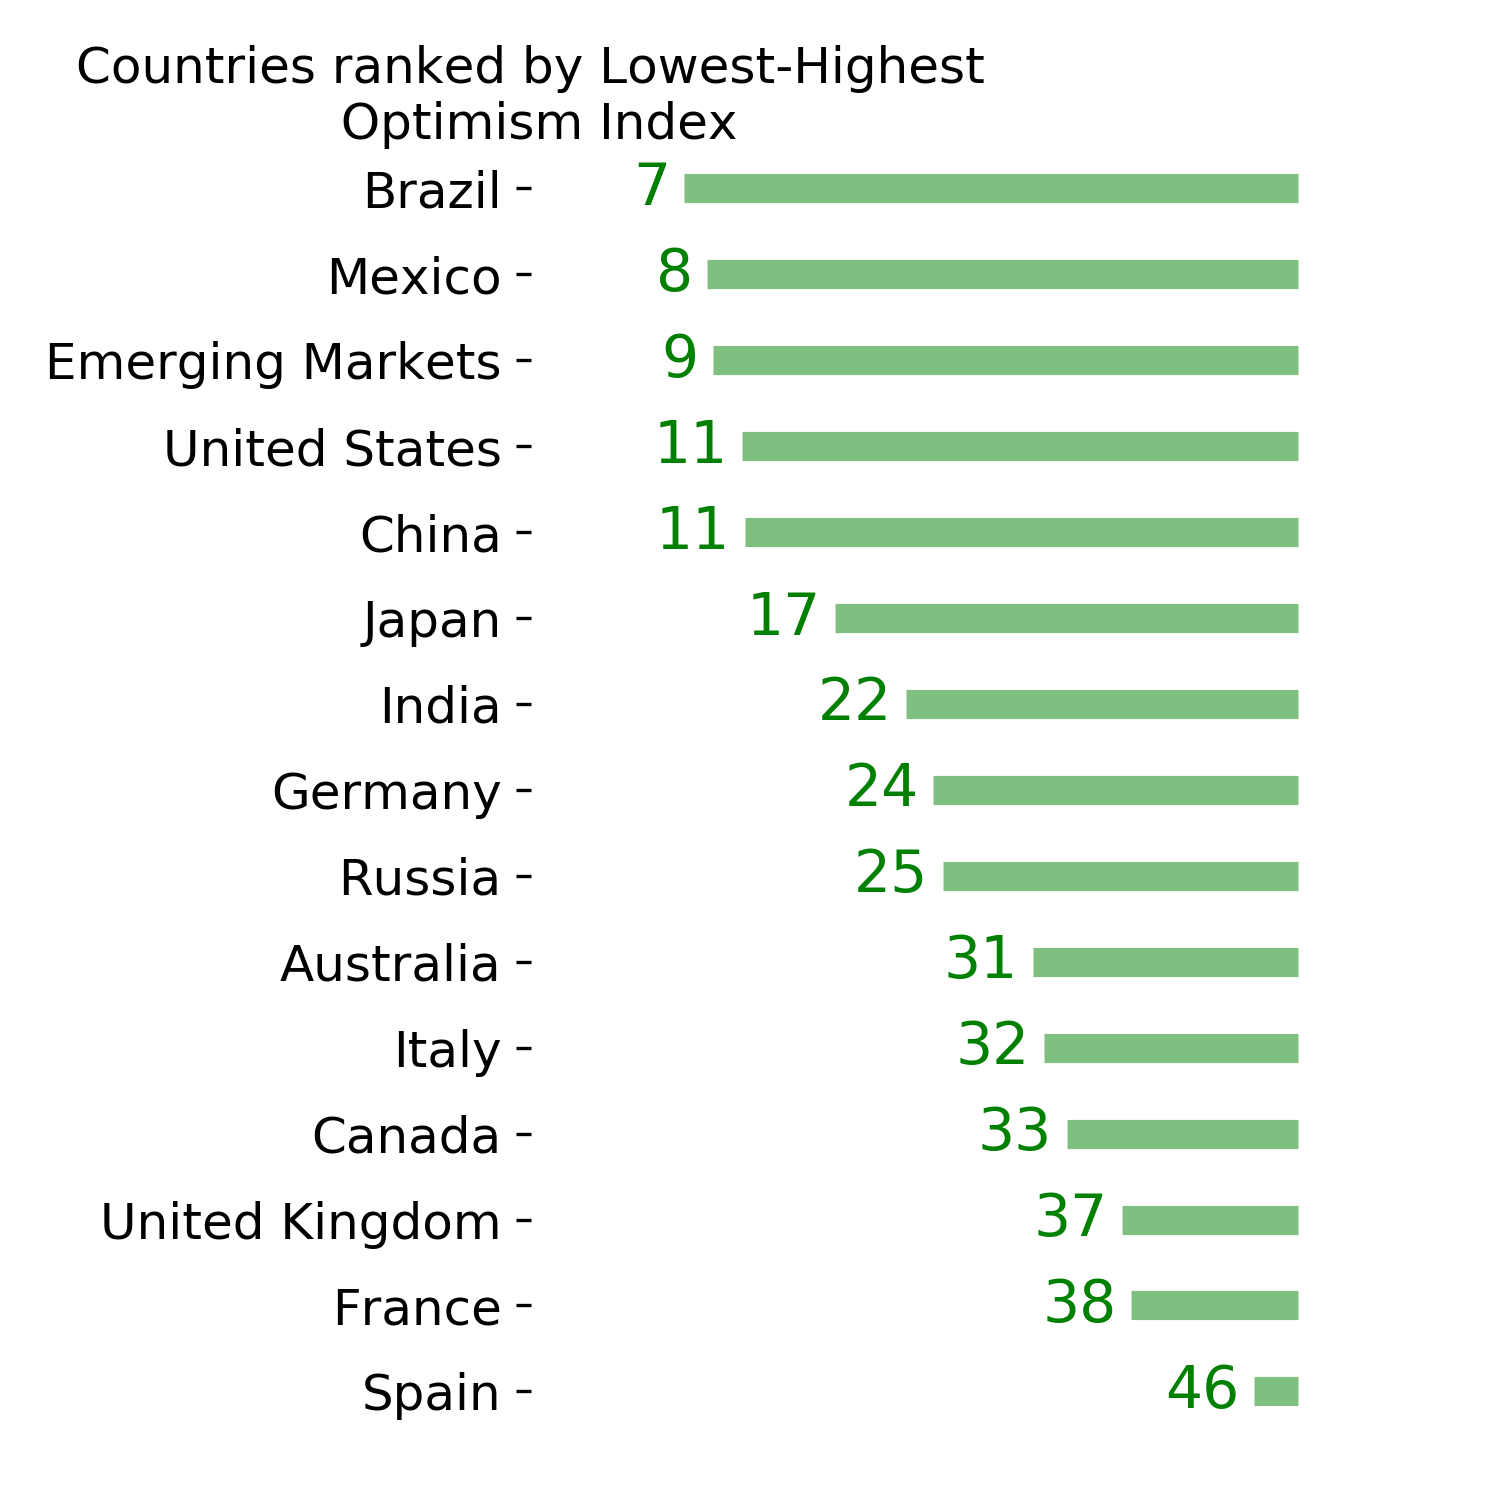
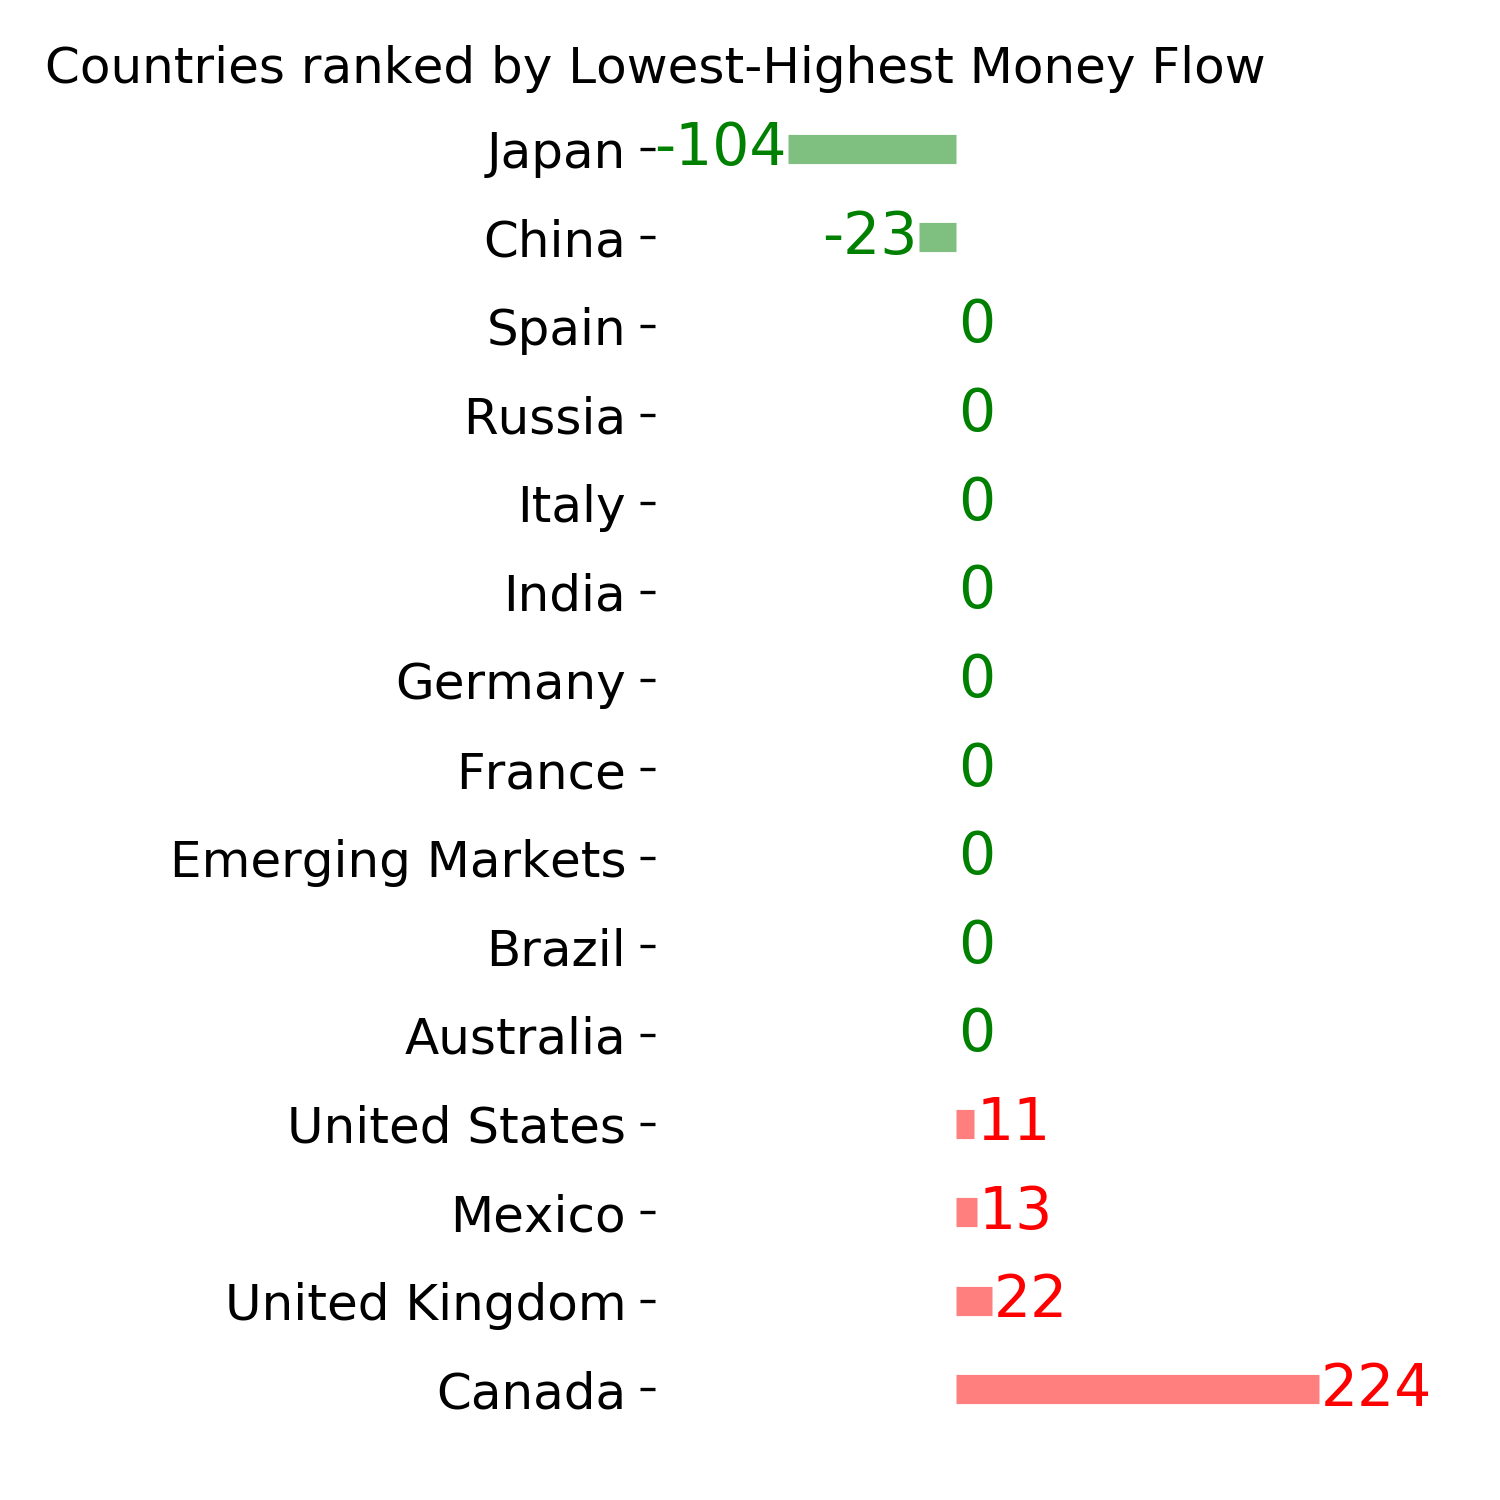
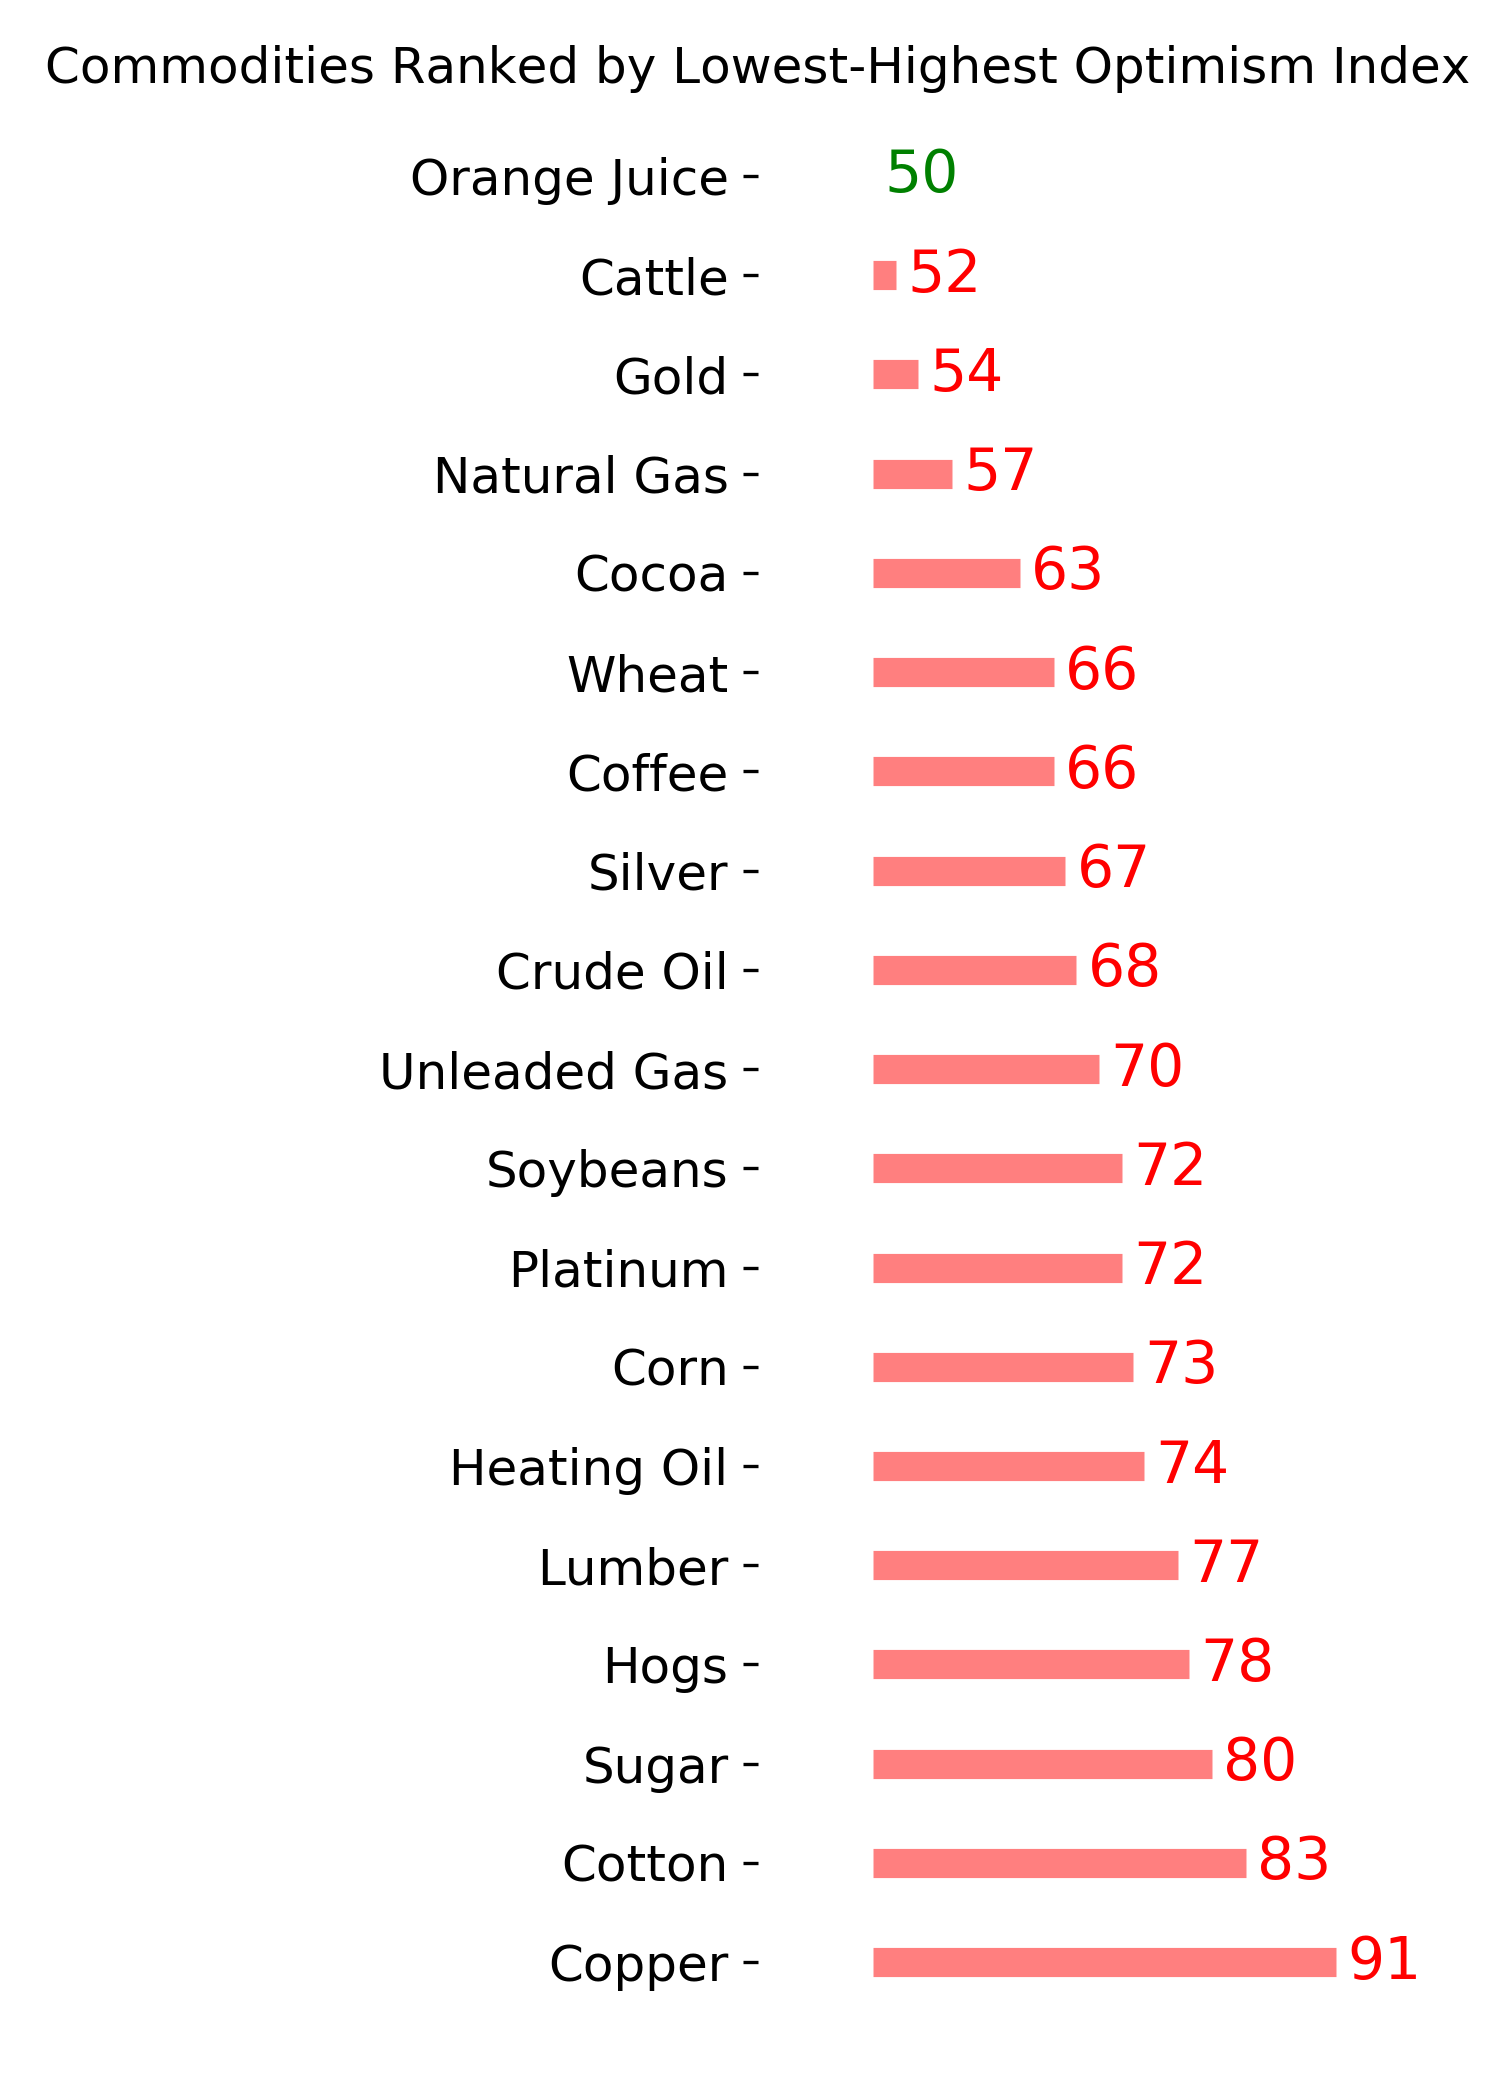
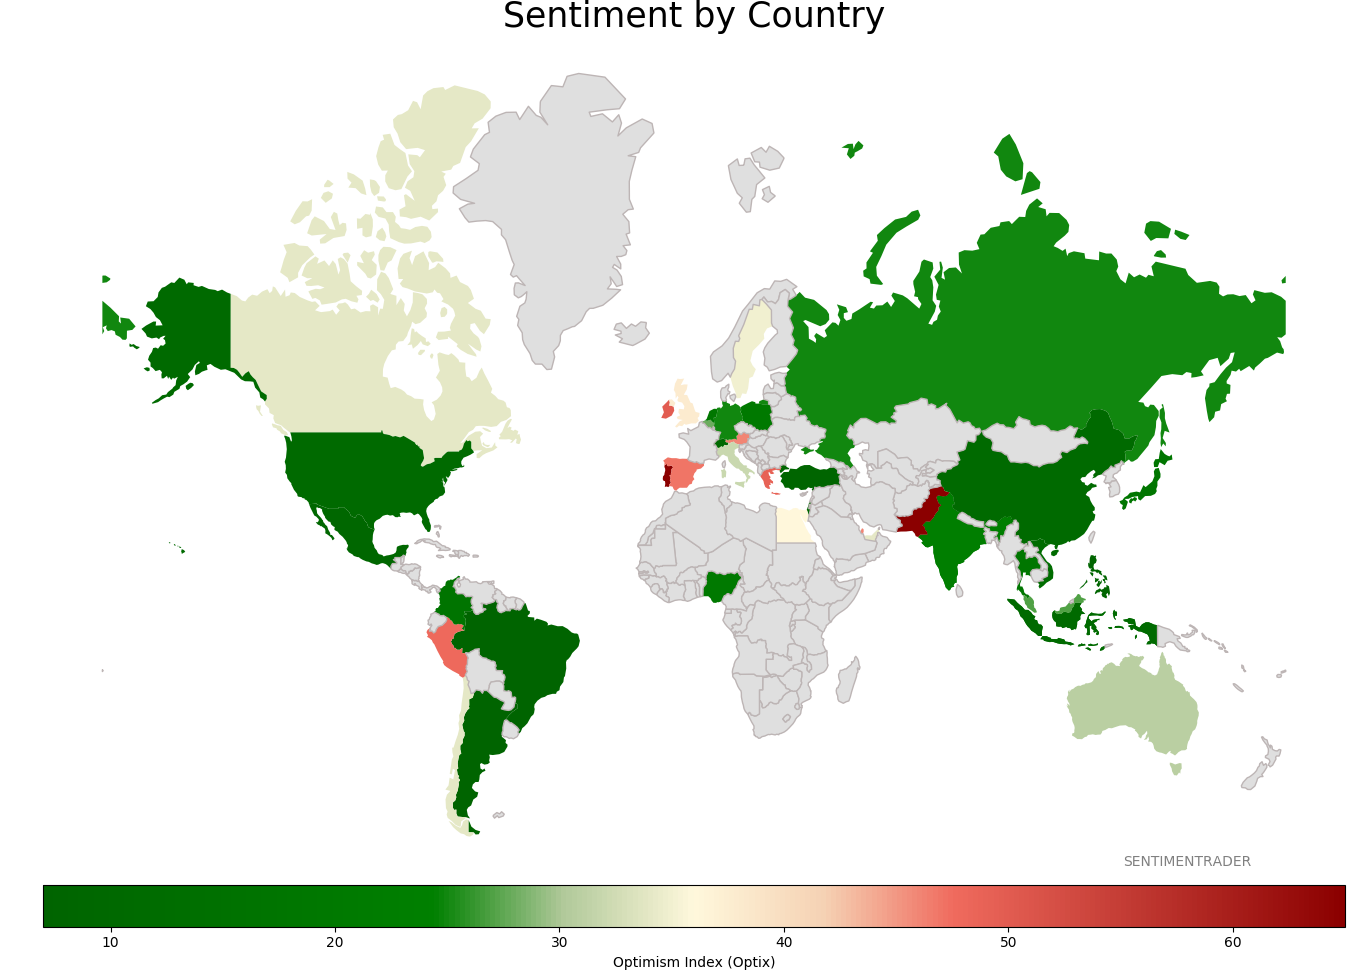
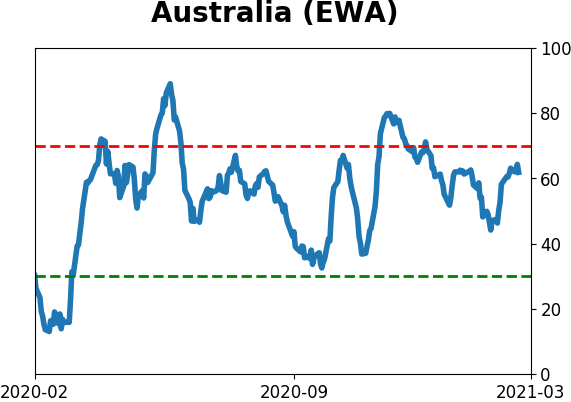
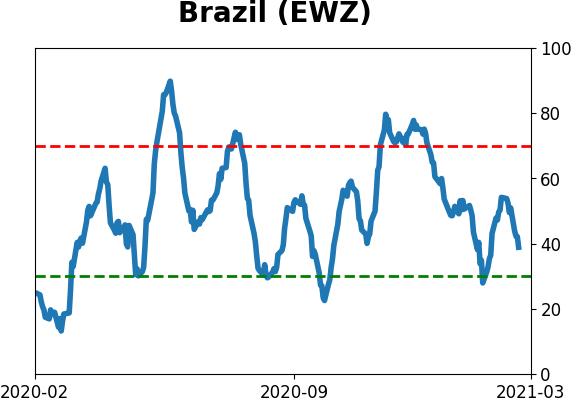
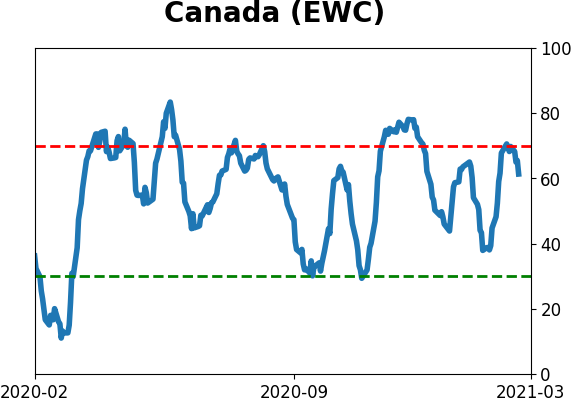
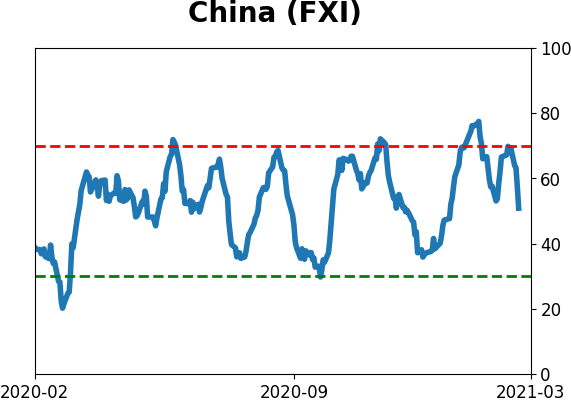
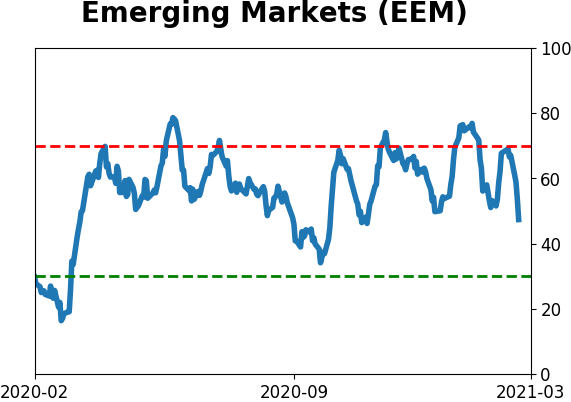
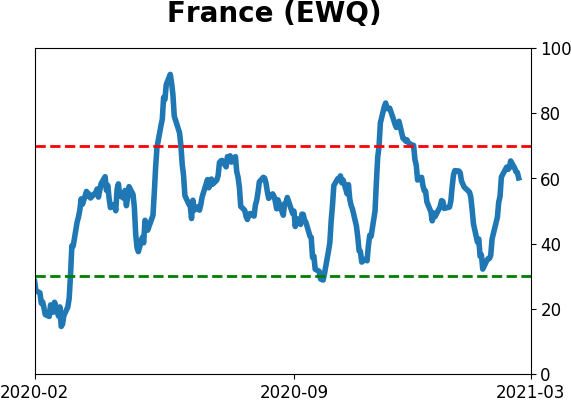
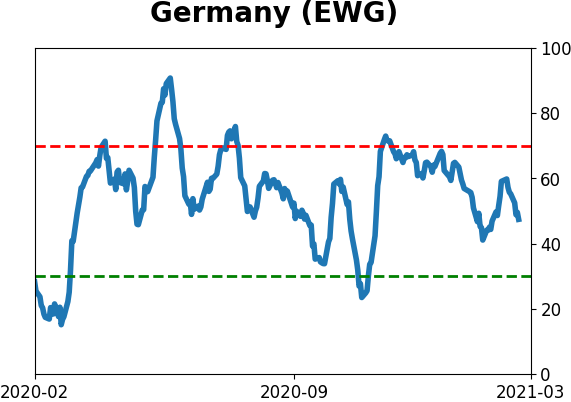
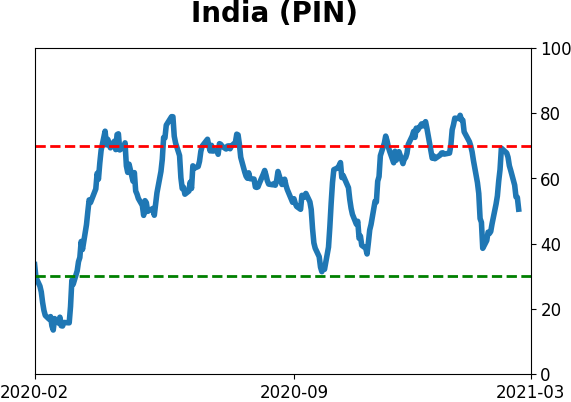
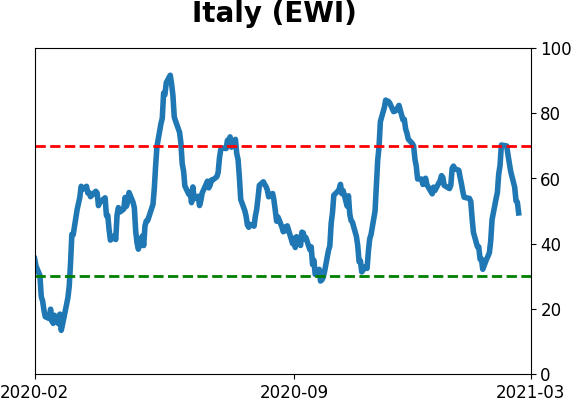
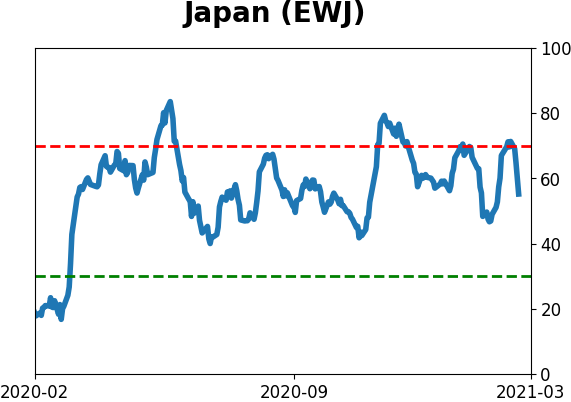
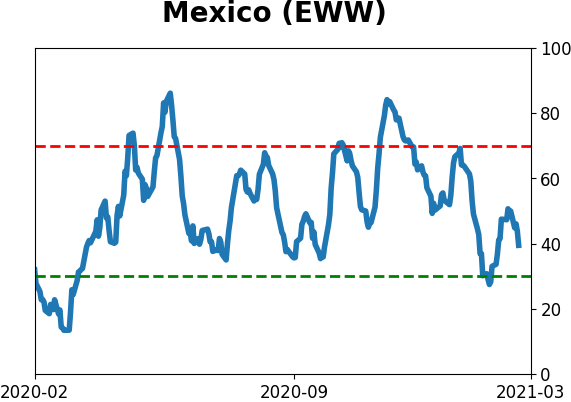
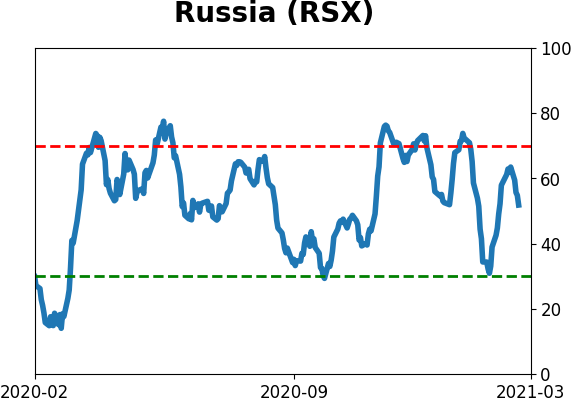
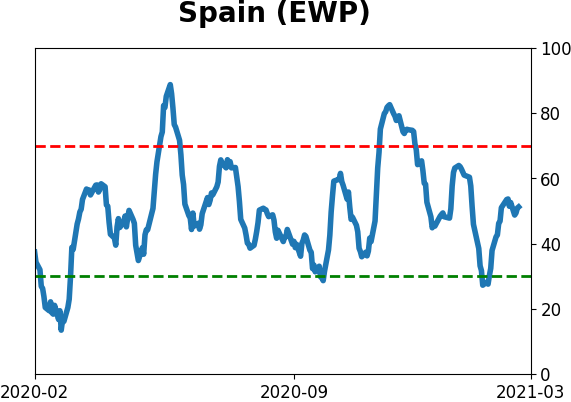
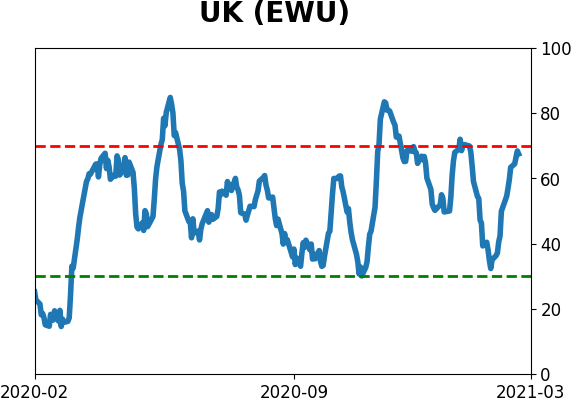
Sentiment Around The World
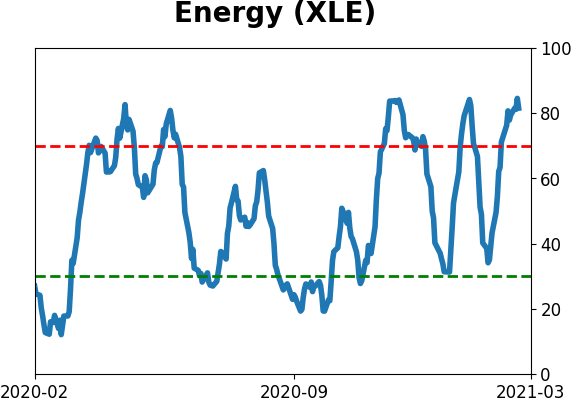
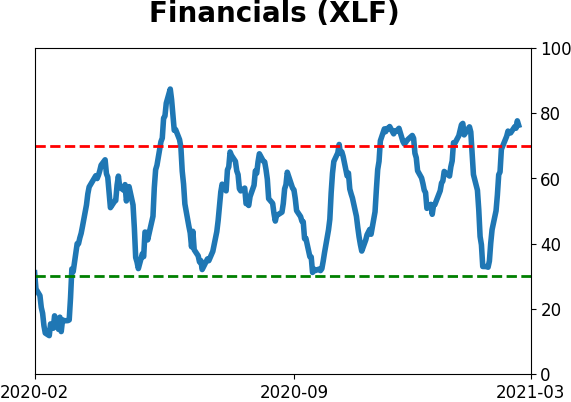
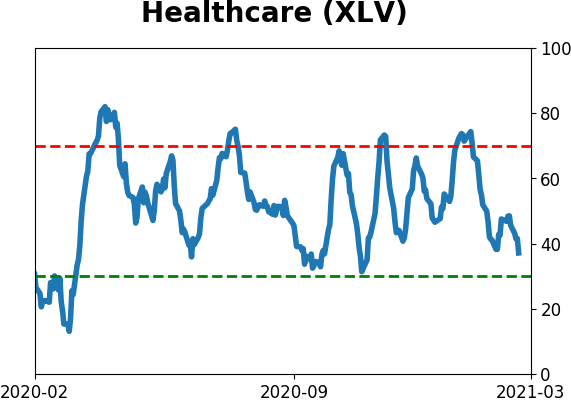
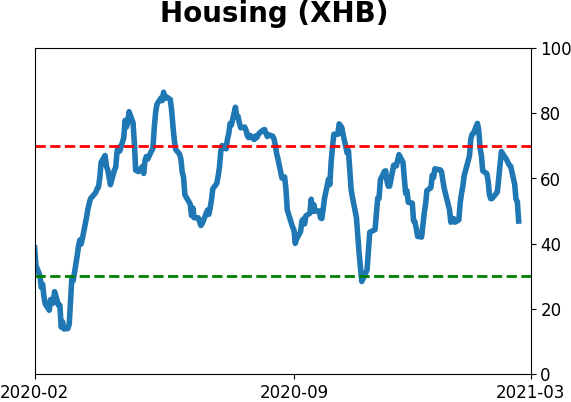
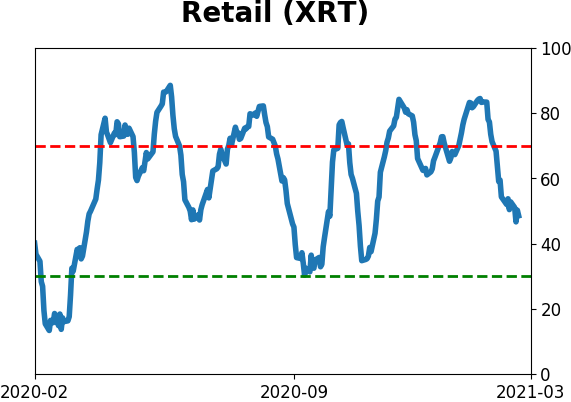
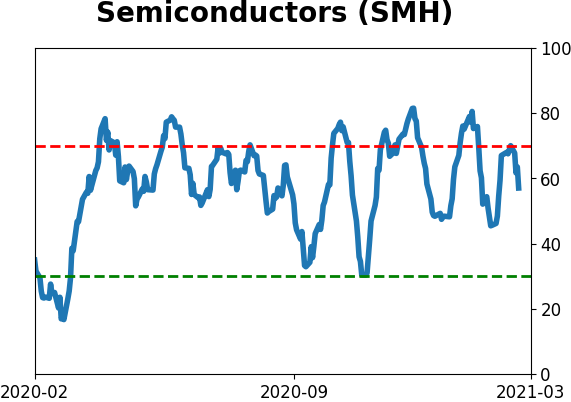
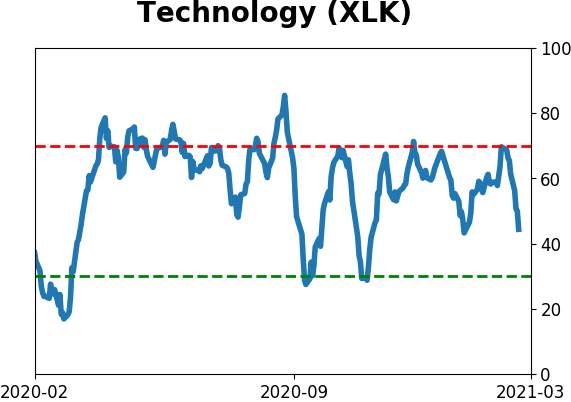
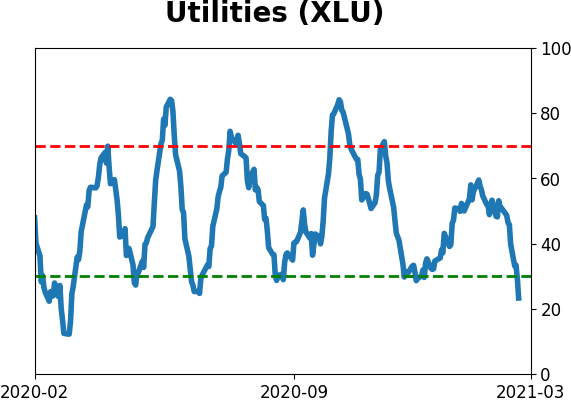
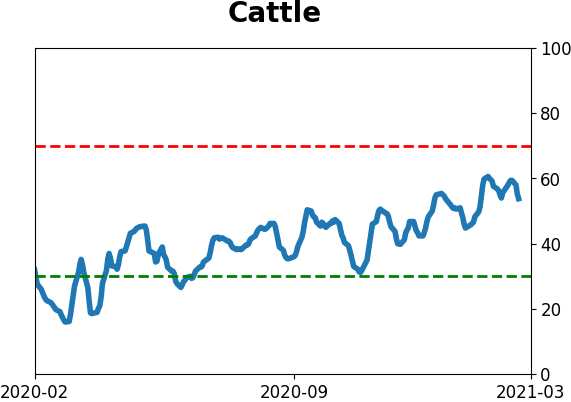
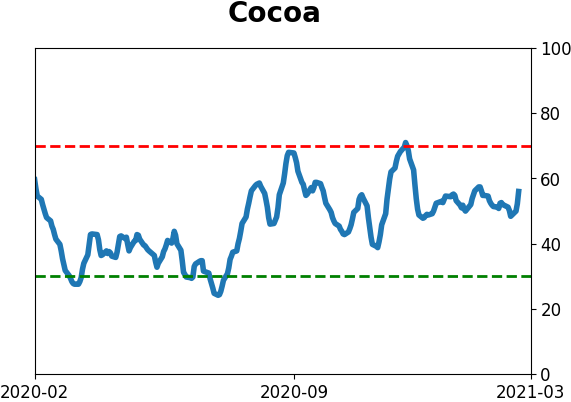
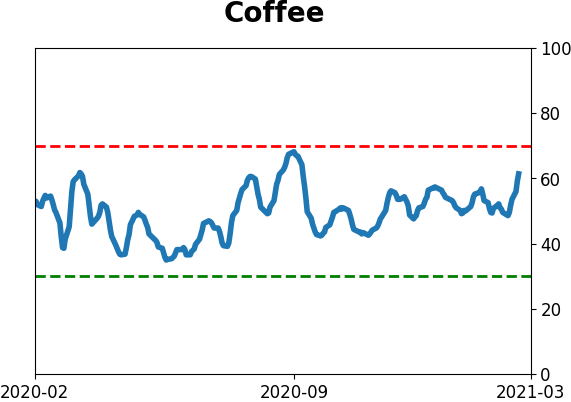
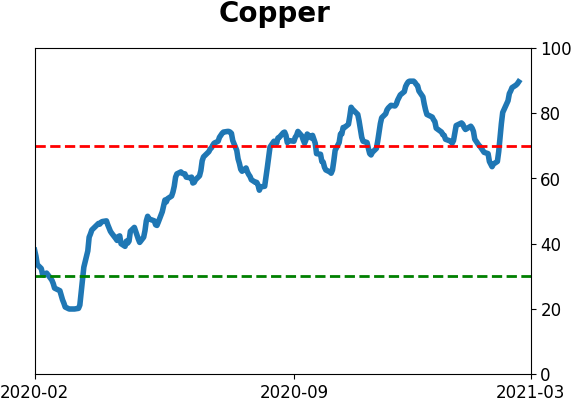
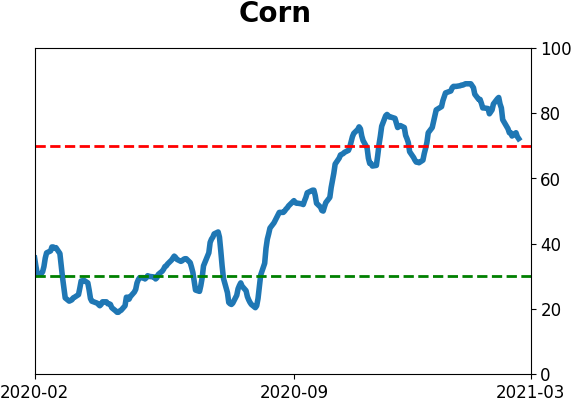
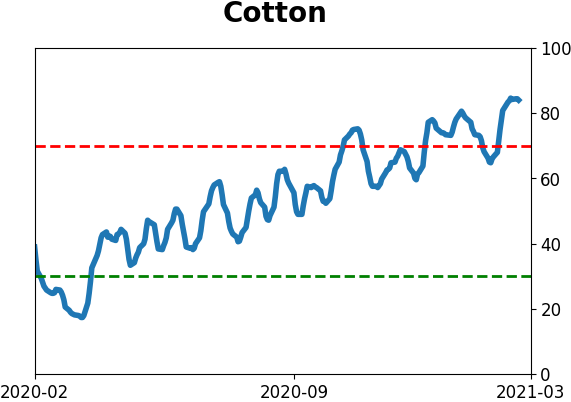
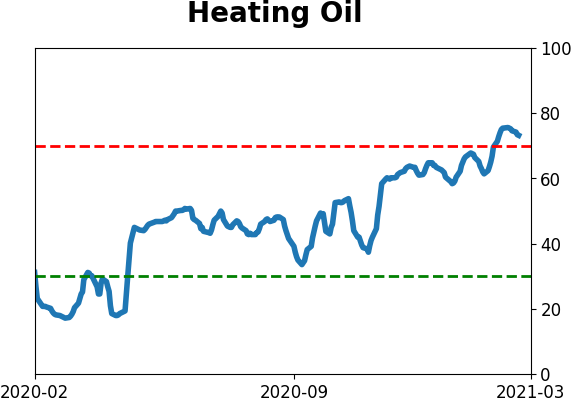
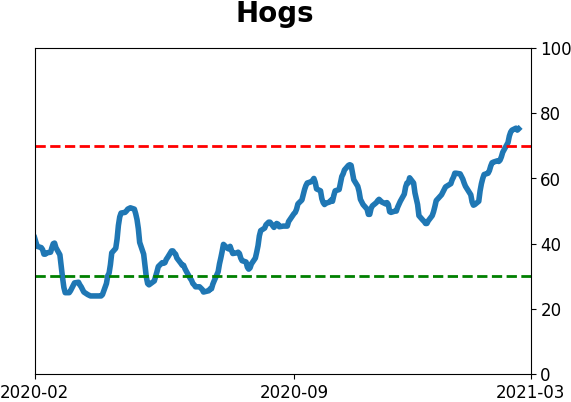
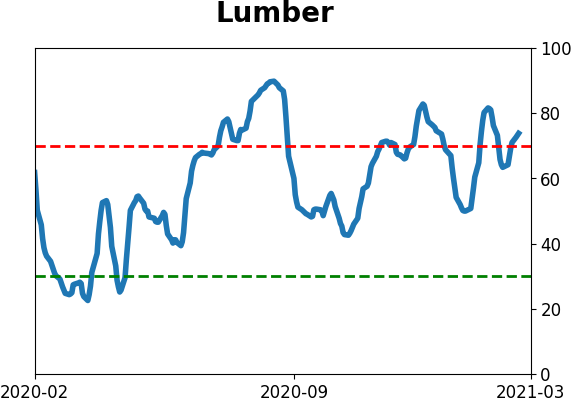
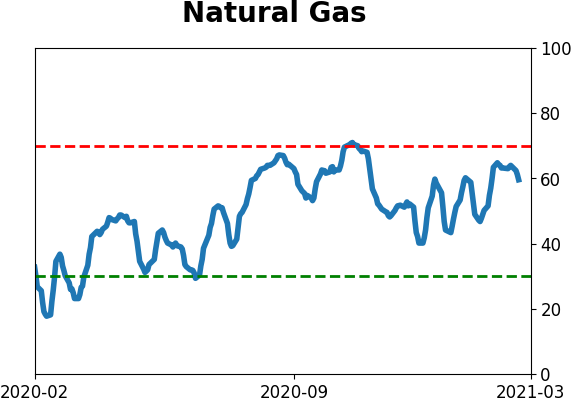
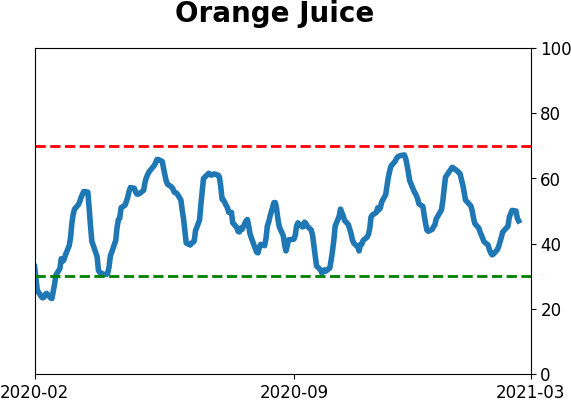
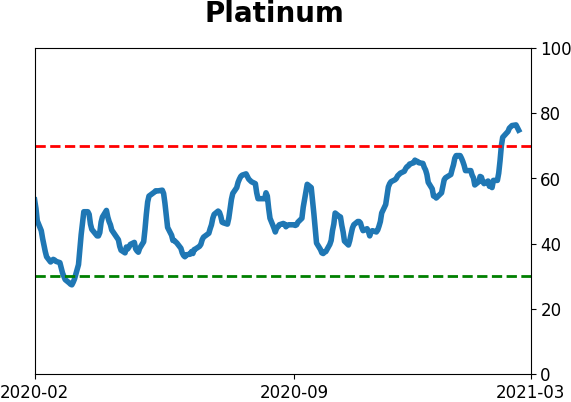
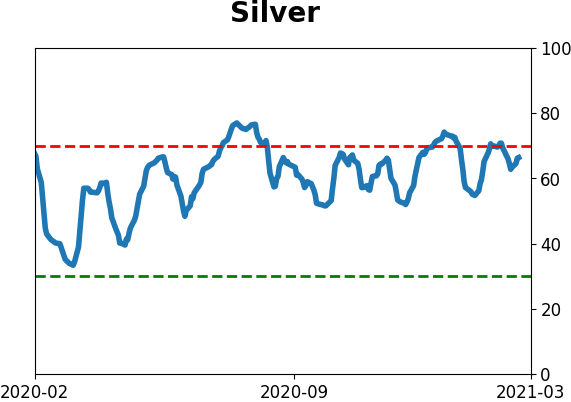
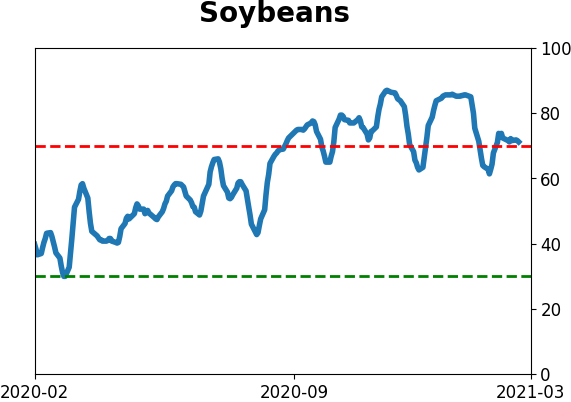
Optimism Index Thumbnails
|
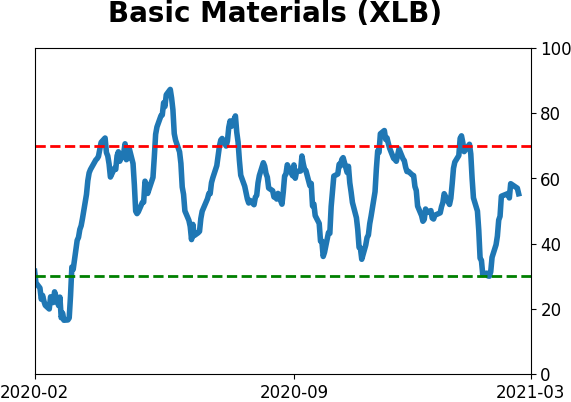
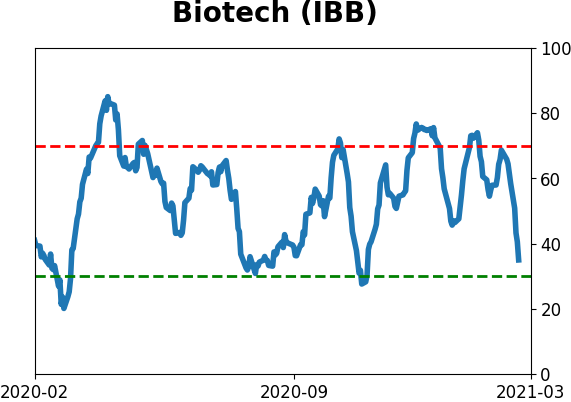
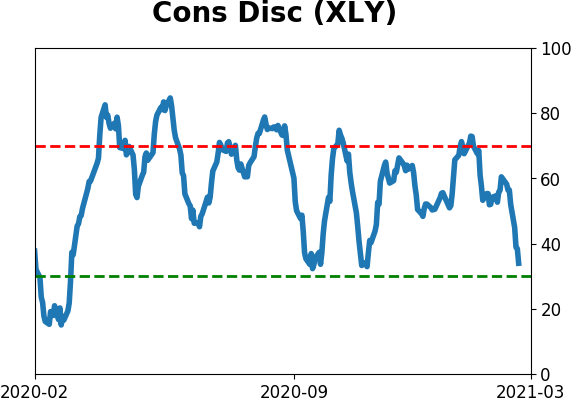
Sector ETF's - 10-Day Moving Average
|
|
|
Country ETF's - 10-Day Moving Average
|
|
|
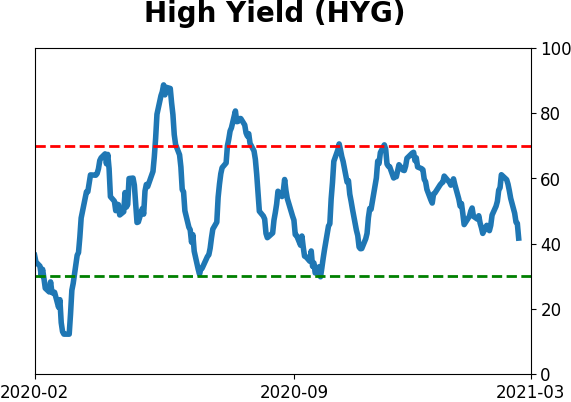
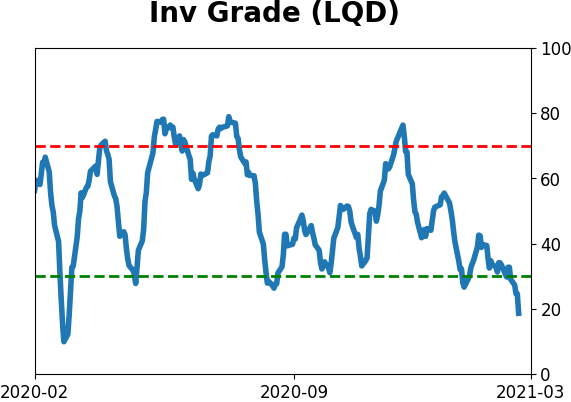
Bond ETF's - 10-Day Moving Average
|
|
|
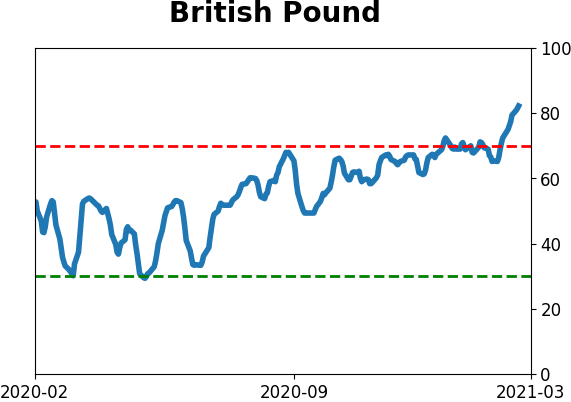
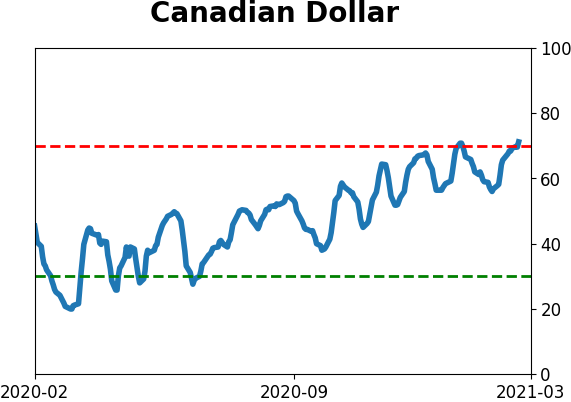
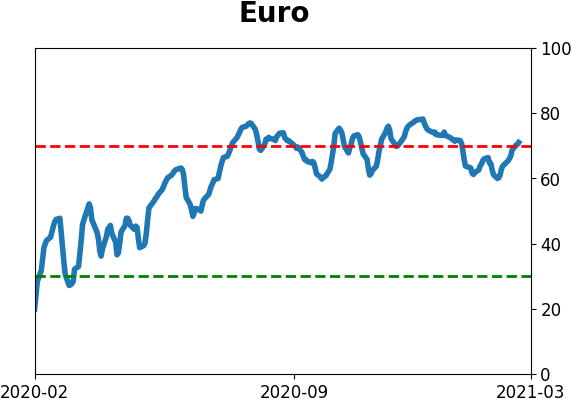
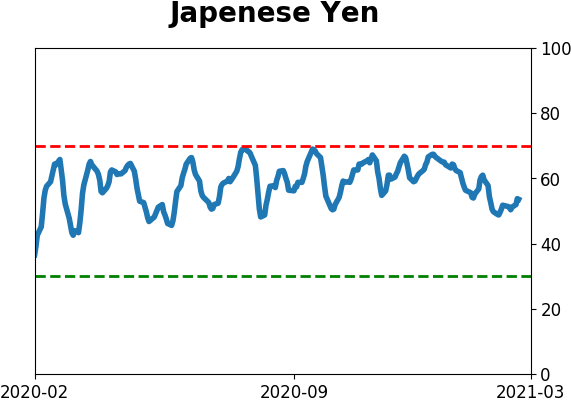
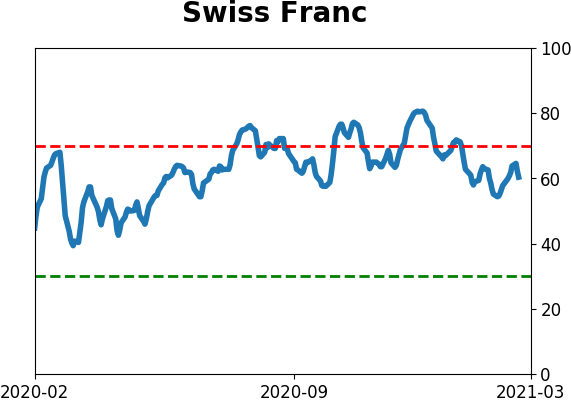
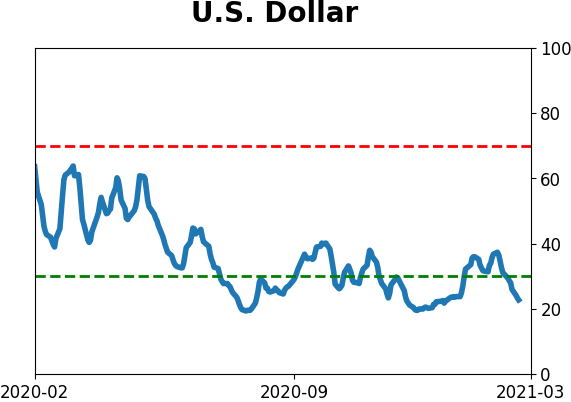
Currency ETF's - 5-Day Moving Average
|
|
|
Commodity ETF's - 5-Day Moving Average
|
|