Headlines
|
|
The only weakness in junk is that there is no weakness:
In the high-yield (junk) bond market, bonds reaching 52-week highs continue to overwhelm those falling to 52-week lows. This indicates good health. About the only issue is that things have been so positive for so long, it equals past extremes when those bonds, and stocks, took a breather.
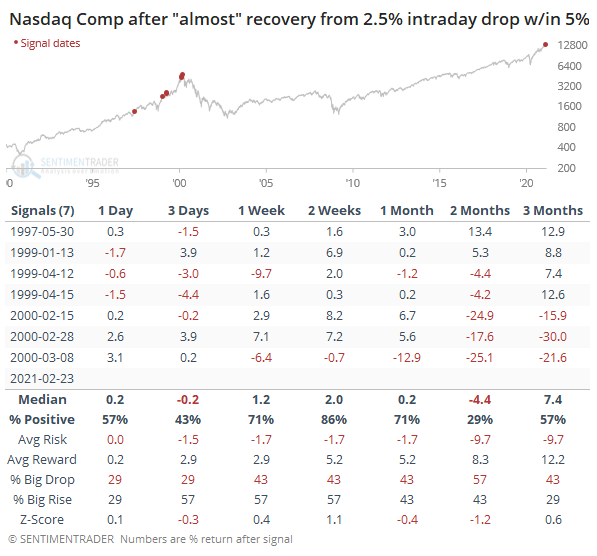
Big reversal: The S&P 500 on Tuesday enjoyed one of its largest-ever intraday reversals when so near a 52-week high, which we outlined in a premium minute. The Nasdaq's reversal was even more impressive, again with few precedents. If we relax the parameters, then there was a cluster of signals in 1999-2000, but other than that, this is highly unusual.
Bottom Line:
See the Outlook & Allocations page for more details on these summaries STOCKS: Weak sell
We're in an extremely speculative environment that is enough to become defensive, especially with recent cracks showing in what had been pristine breadth conditions. The spike in fear from a couple of weeks ago has dissipated and likely not enough to offset the negatives over a medium-term time frame. BONDS: Weak buy
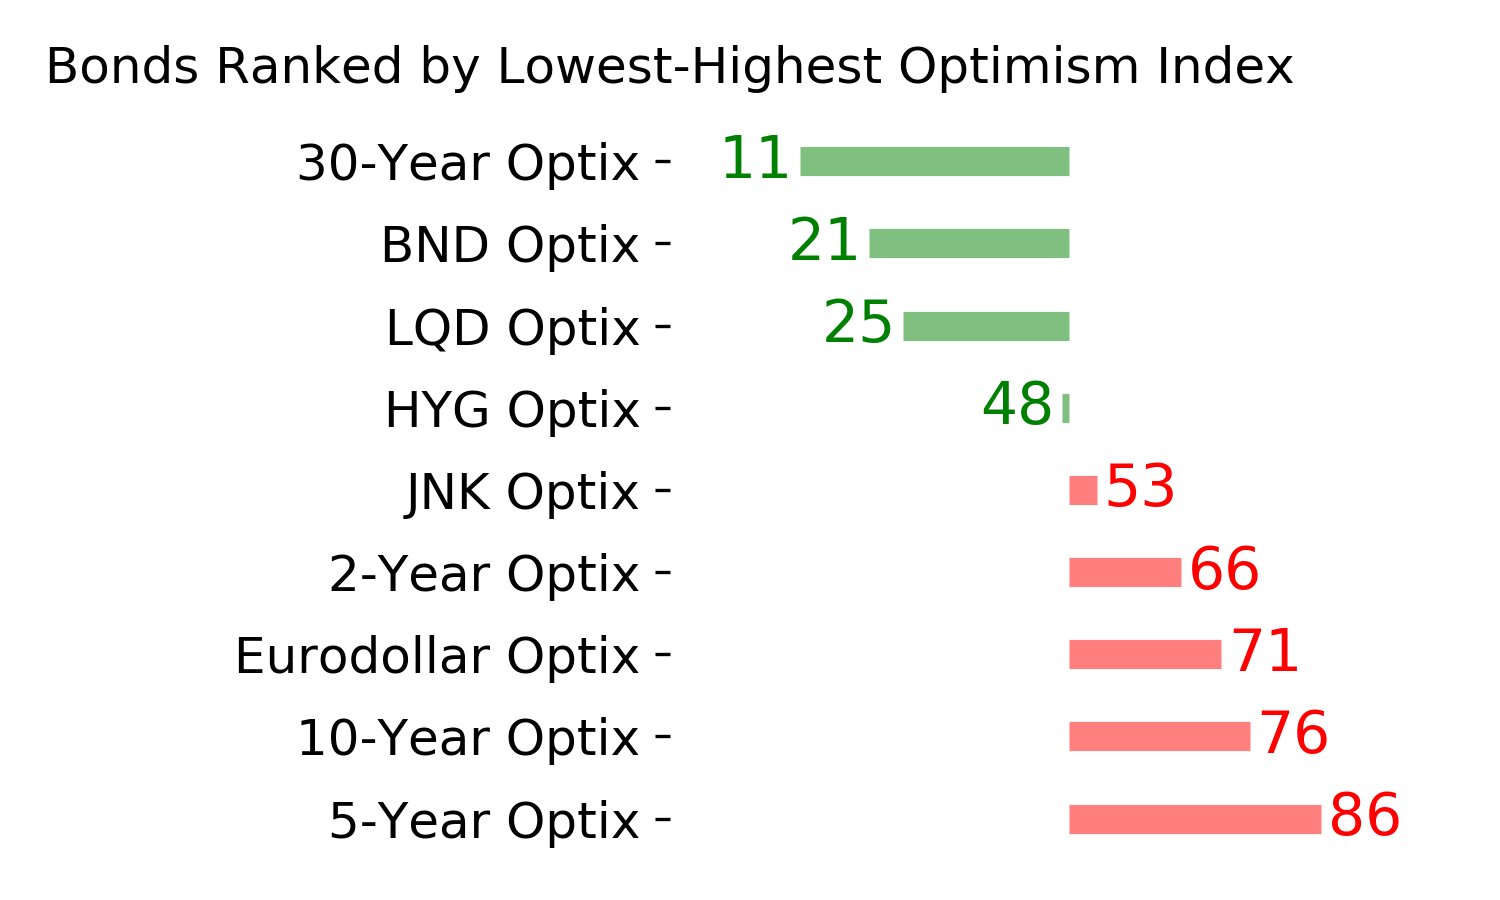
Various parts of the market have been hit in recent weeks, with mild oversold conditions. The Bond Optimism Index is now about as low as it gets during healthy bond market environments. GOLD: Weak buy
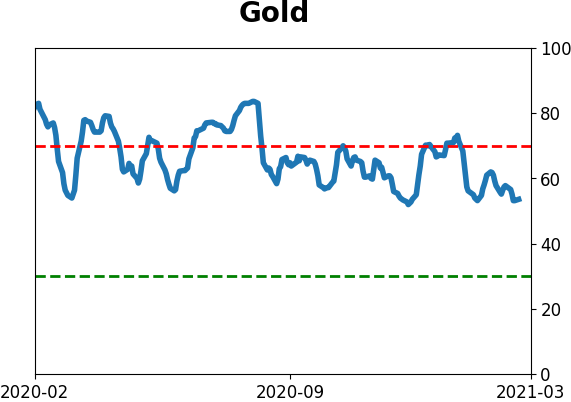
A dollar trying to rebound from a severe short position has weighed on gold and miners. The types of signals they've given in recent weeks, within the context of their recent surge, have usually resulted in higher prices over a medium- to long-term time frame.
|
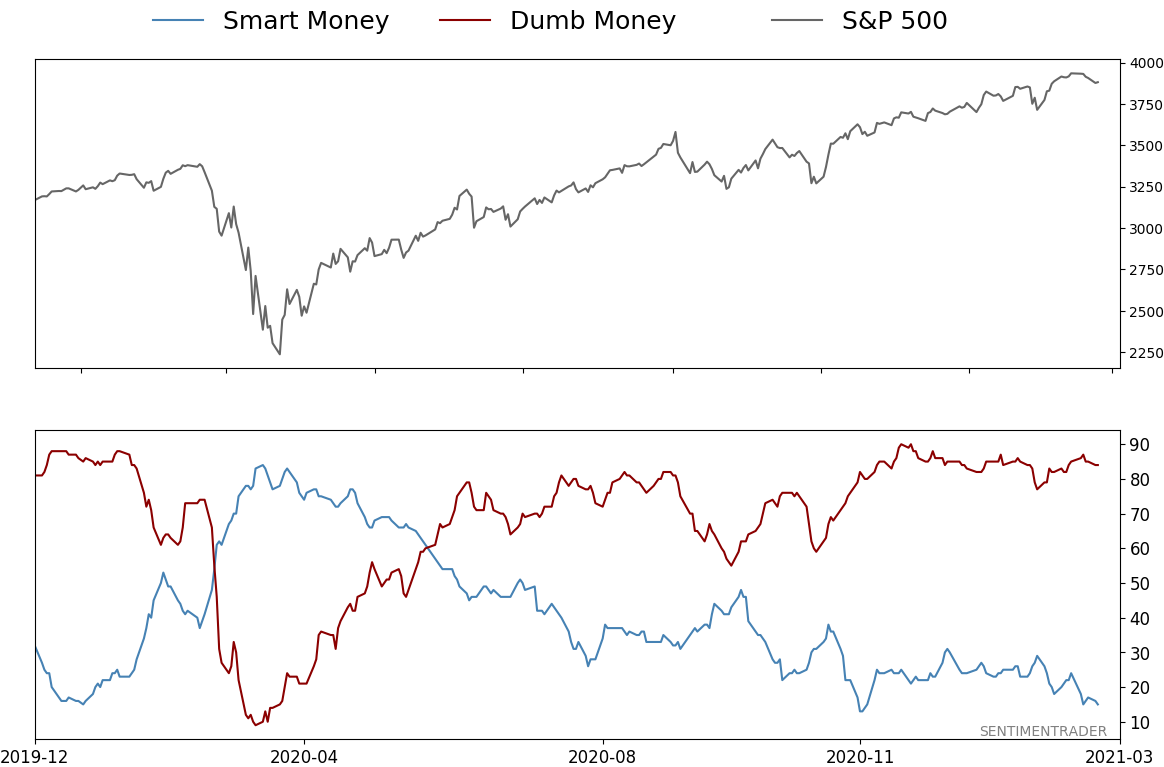
Smart / Dumb Money Confidence
|
Smart Money Confidence: 15%
Dumb Money Confidence: 84%
|
|
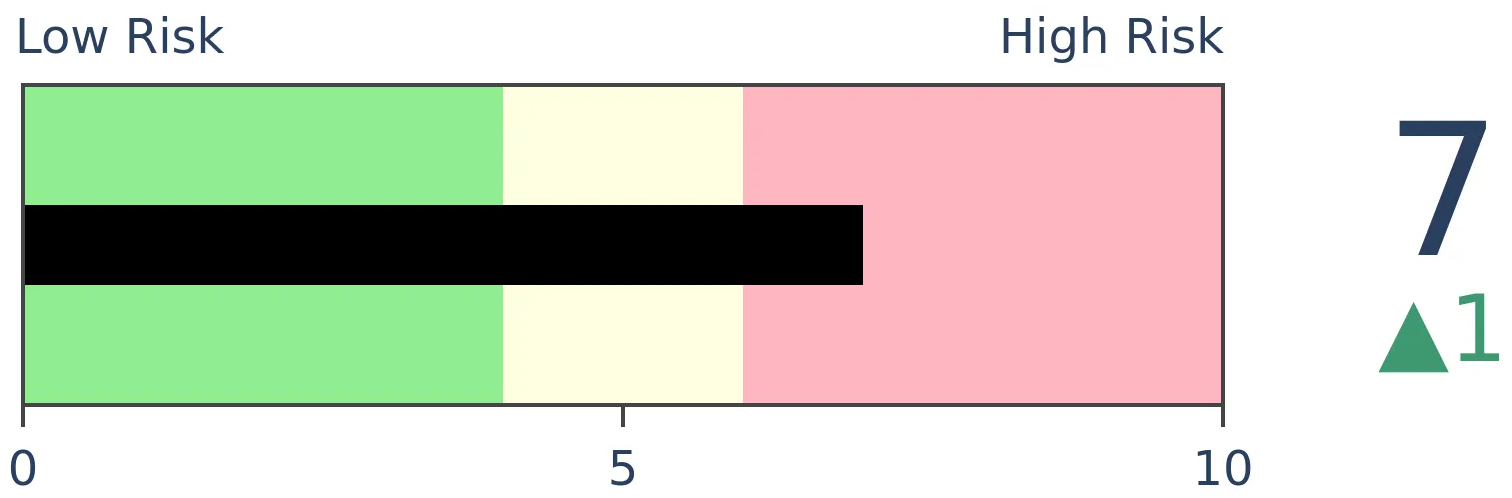
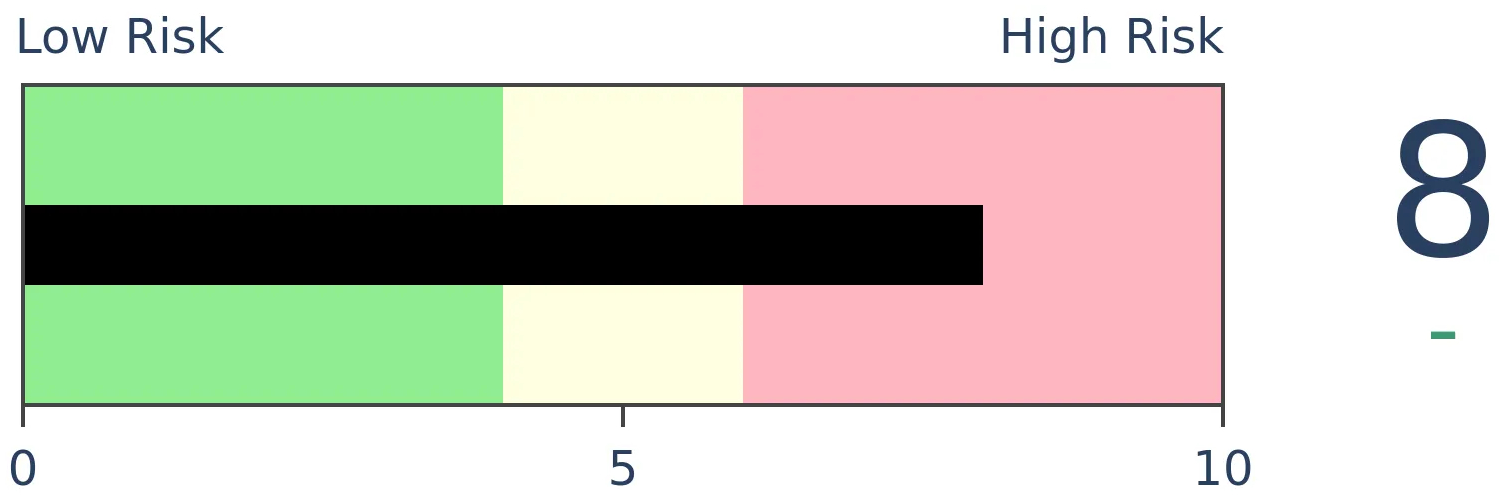
Risk Levels
Stocks Short-Term
|
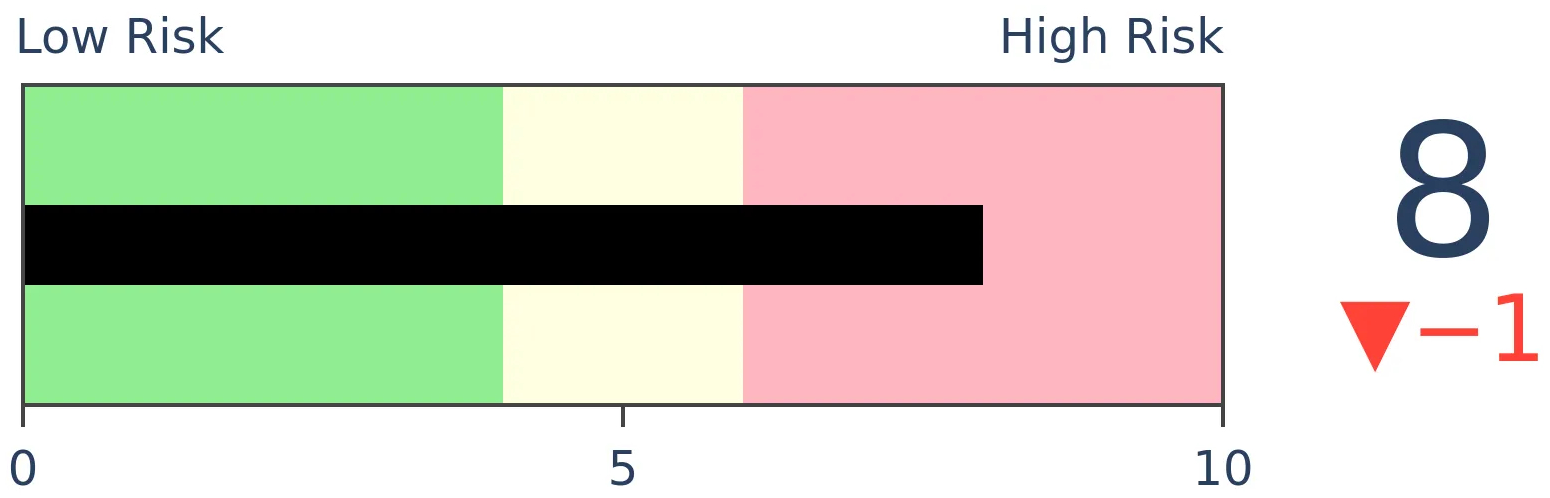
Stocks Medium-Term
|
|
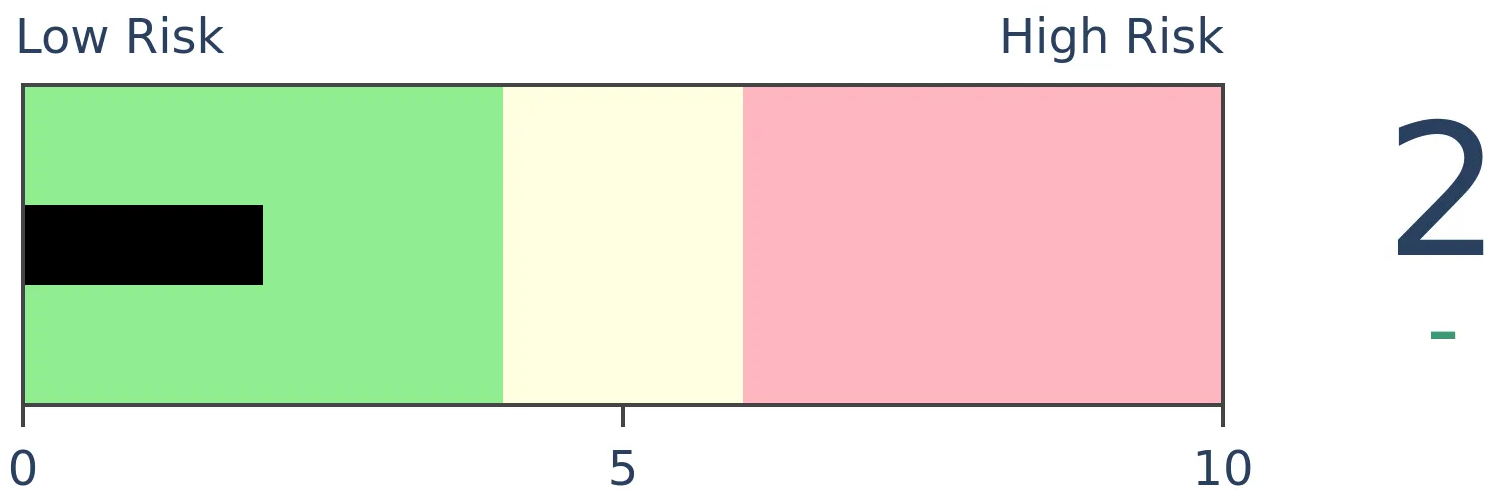
Bonds
|
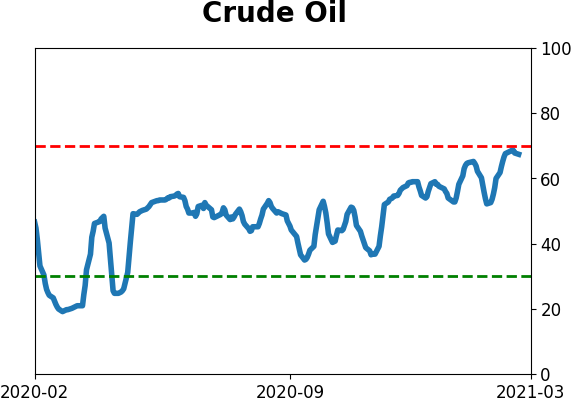
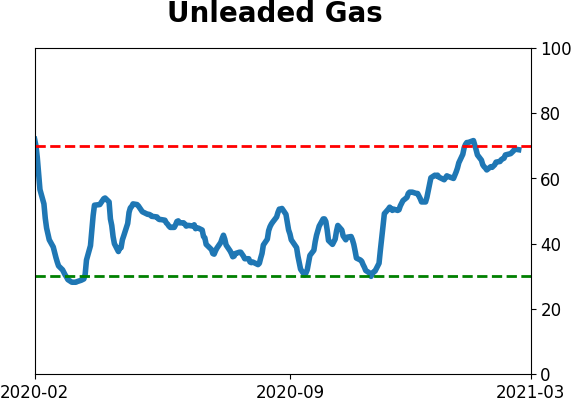
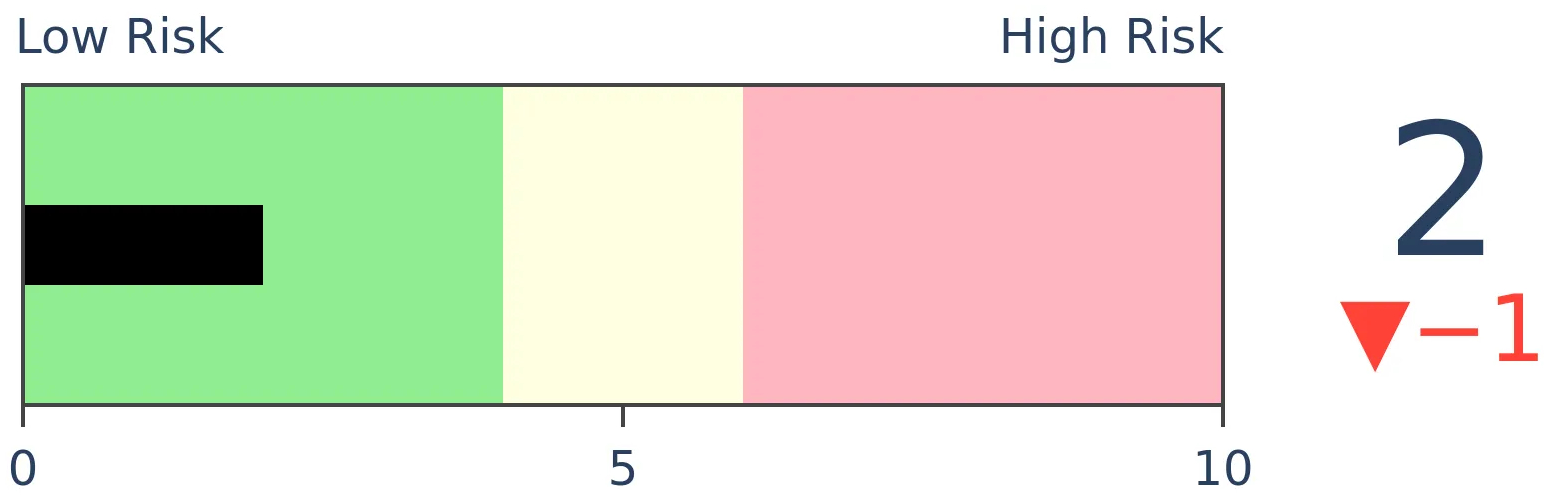
Crude Oil

|
|
Gold
|
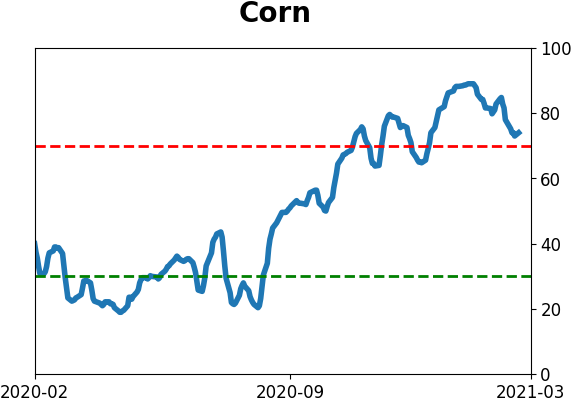
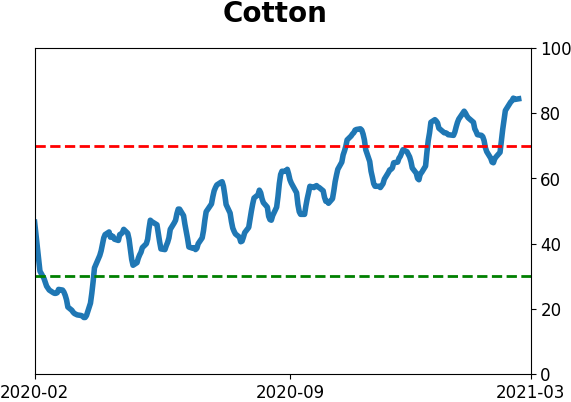
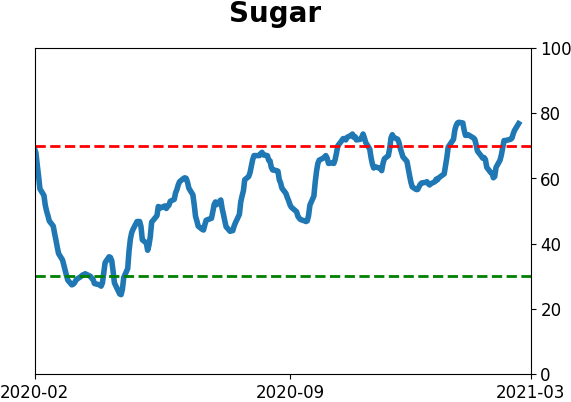
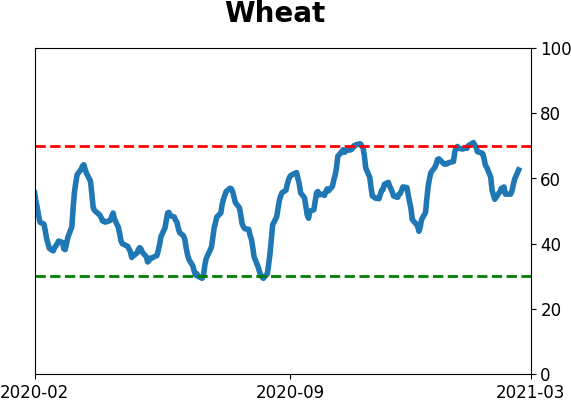
Agriculture
|
|
Research
BOTTOM LINE
In the high-yield (junk) bond market, bonds reaching 52-week highs continue to overwhelm those falling to 52-week lows. This indicates good health. About the only issue is that things have been so positive for so long, it equals past extremes when those bonds, and stocks, took a breather.
FORECAST / TIMEFRAME
None
|
Given the paroxysm of speculative activity over the past 1-2 months, we've been keeping an eye on some other markets that have had a decent tendency to provide a heads-up that risk appetite was starting to wane.
One of those is the high-yield bond market. Watching for deterioration there gives us a sense as to whether bond investors are starting to price in more defaults, which can often happen before stock investors take notice.
So far, there isn't much evidence of that. Fund flows in HYG have been quite negative (but not as negative as investment-grade funds like LQD or Treasury funds like TLT). But that hasn't had much of an impact on the internal health of that market.
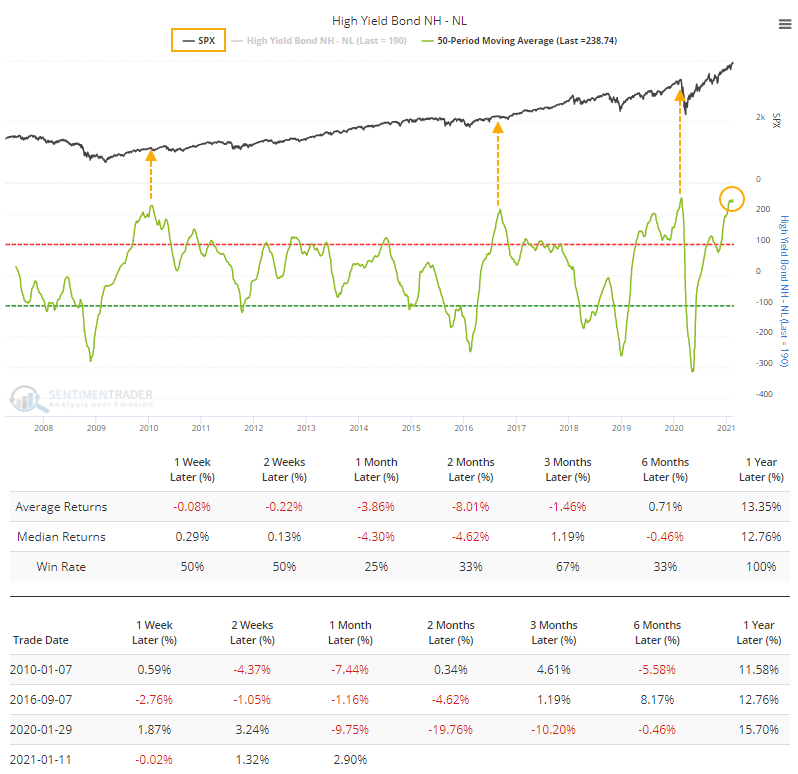
One of the primary gauges for that is the net percentage of high-yield bonds that are hitting 52-week highs minus those falling to 52-week lows. If it's positive, then it's a good sign for both high-yield bonds and the stock market.
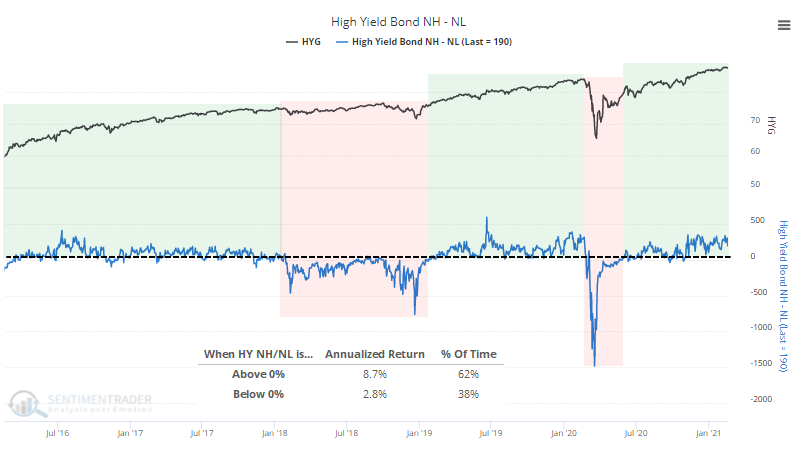
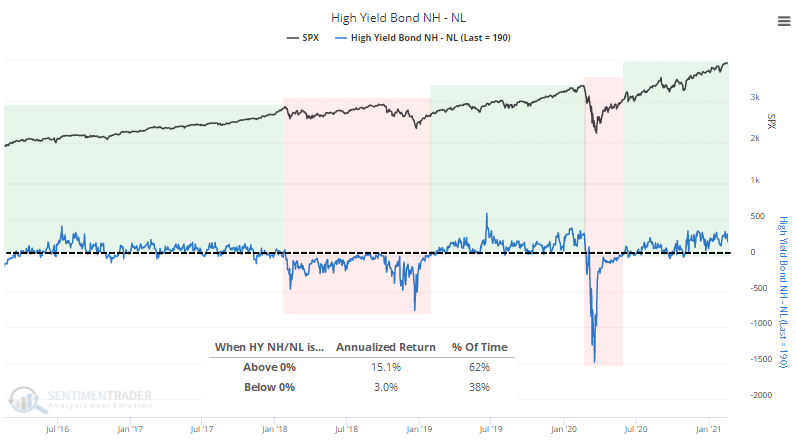
The S&P 500 has held up well when this is positive. The difference in its annualized return is stark depending on whether there are more junk bonds hitting new highs or new lows. The fact that this is still well above zero indicates a healthy junk-bond market, or at least one that buyers are still supporting, and that has indicated good forward returns.
The biggest caveat is simply that things have been so positive for so long.
The 50-day average of net new highs is now the highest in at least 14 years. Other times it first reached a very high level, HYG struggled over the next couple of months according to the Backtest Engine. It first became extreme a little over a month ago, so it has been defying gravity since then. It has been a challenge for it to levitate much longer.
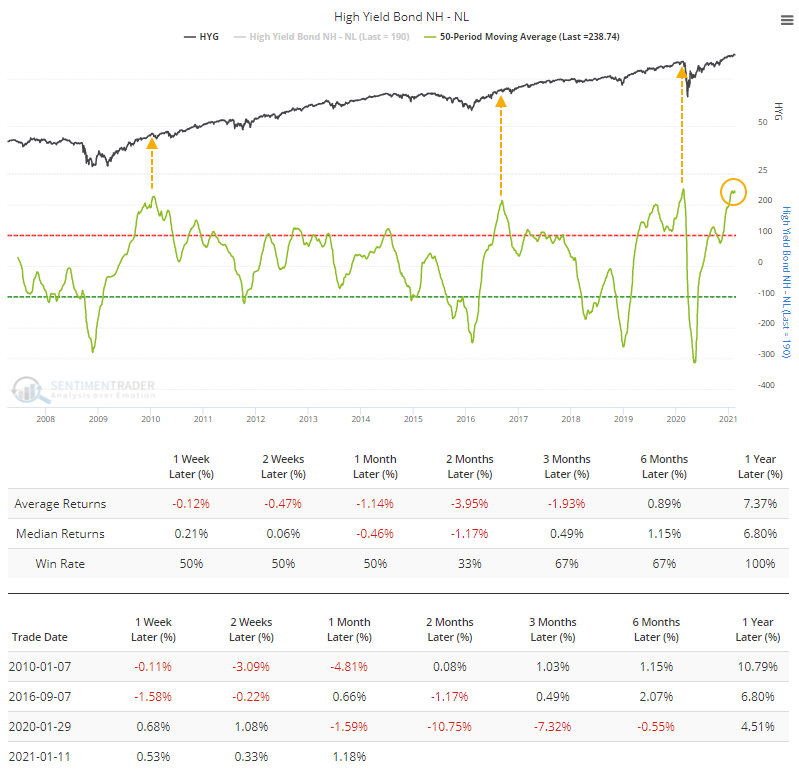
It was the same suggestion for the S&P 500. The Backtest Engine shows losses across most time frames.
Each of those times, while forward gains were limited, by the time that losses in bonds (and stocks) were enough to push the net percentage of bonds much below the zero line, the bulk of the selling pressure was nearly done, at least time-wise. Last year, of course, the losses were deep but it's relatively safe to say that was an unusual circumstance.
Like a lot of what we've been looking at, this suggests that things have been so good for so long, that it's unlikely to lead to large, sustained gains from here. But the momentum has been so strong that if we do see some multi-week or multi-month selling, buyers won't go away easily.
Active Studies
| Time Frame | Bullish | Bearish | | Short-Term | 0 | 0 | | Medium-Term | 2 | 8 | | Long-Term | 16 | 3 |
|
Indicators at Extremes
Portfolio
| Position | Description | Weight % | Added / Reduced | Date | | Stocks | RSP | 4.9 | Reduced 4% | 2021-02-09 | | Bonds | 30.0% BND, 8.8% SCHP | 38.8 | Added 15.1% | 2021-02-18 | | Commodities | GCC | 2.3 | Reduced 2.1%
| 2020-09-04 | | Precious Metals | GDX | 9.0 | Added 0.1% | 2021-02-18 | | Special Situations | 7.3% XLE, 4.8% PSCE | 12.1 | Reduced 5.6% | 2021-02-18 | | Cash | | 32.8 | | |
|
Updates (Changes made today are underlined)
With a market that has seen the kinds of broad participation and big breath thrusts like we did in the fall, it's hard to become too negative. Those kinds of conditions have consistently preceded higher returns over the next 6-12 months. It's the interim that's more of an issue. Even conditions like that haven't prevented some shorter-term pullbacks. And when we combine an environment where speculation is rampant and recent days have seen an increase in cracks under the surface of the indexes, it's enough to become more defensive over a short- to medium-term time frame. We still don't have much confirmation from the price action in the indexes, so those who are more conservative would likely wait before increasing cash levels. I've decreased risk exposure a bit more, mainly in terms of energy stocks and the ANGL fund, while adding more to the broader bond market. RETURN YTD: 5.9% 2020: 8.1%, 2019: 12.6%, 2018: 0.6%, 2017: 3.8%, 2016: 17.1%, 2015: 9.2%, 2014: 14.5%, 2013: 2.2%, 2012: 10.8%, 2011: 16.5%, 2010: 15.3%, 2009: 23.9%, 2008: 16.2%, 2007: 7.8%
|
|
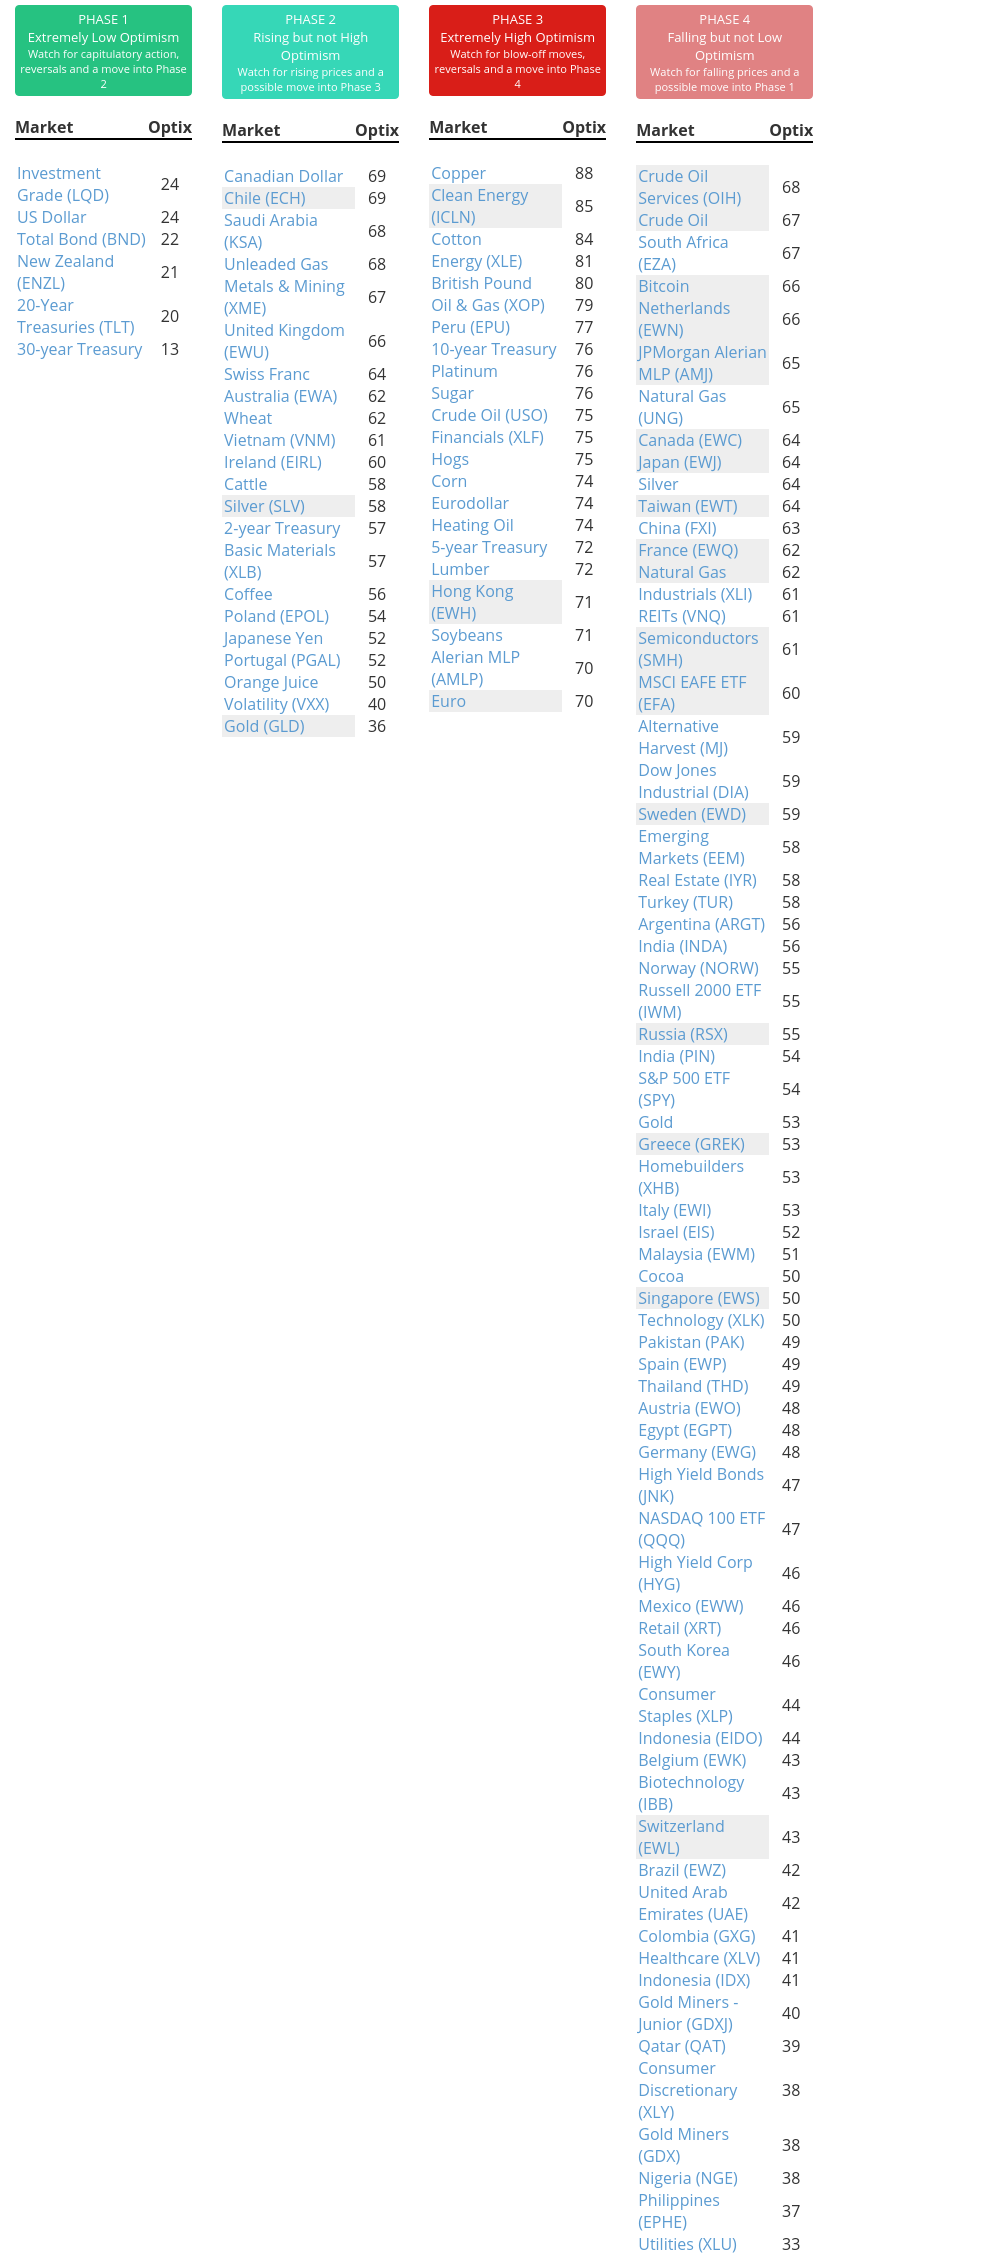
Phase Table
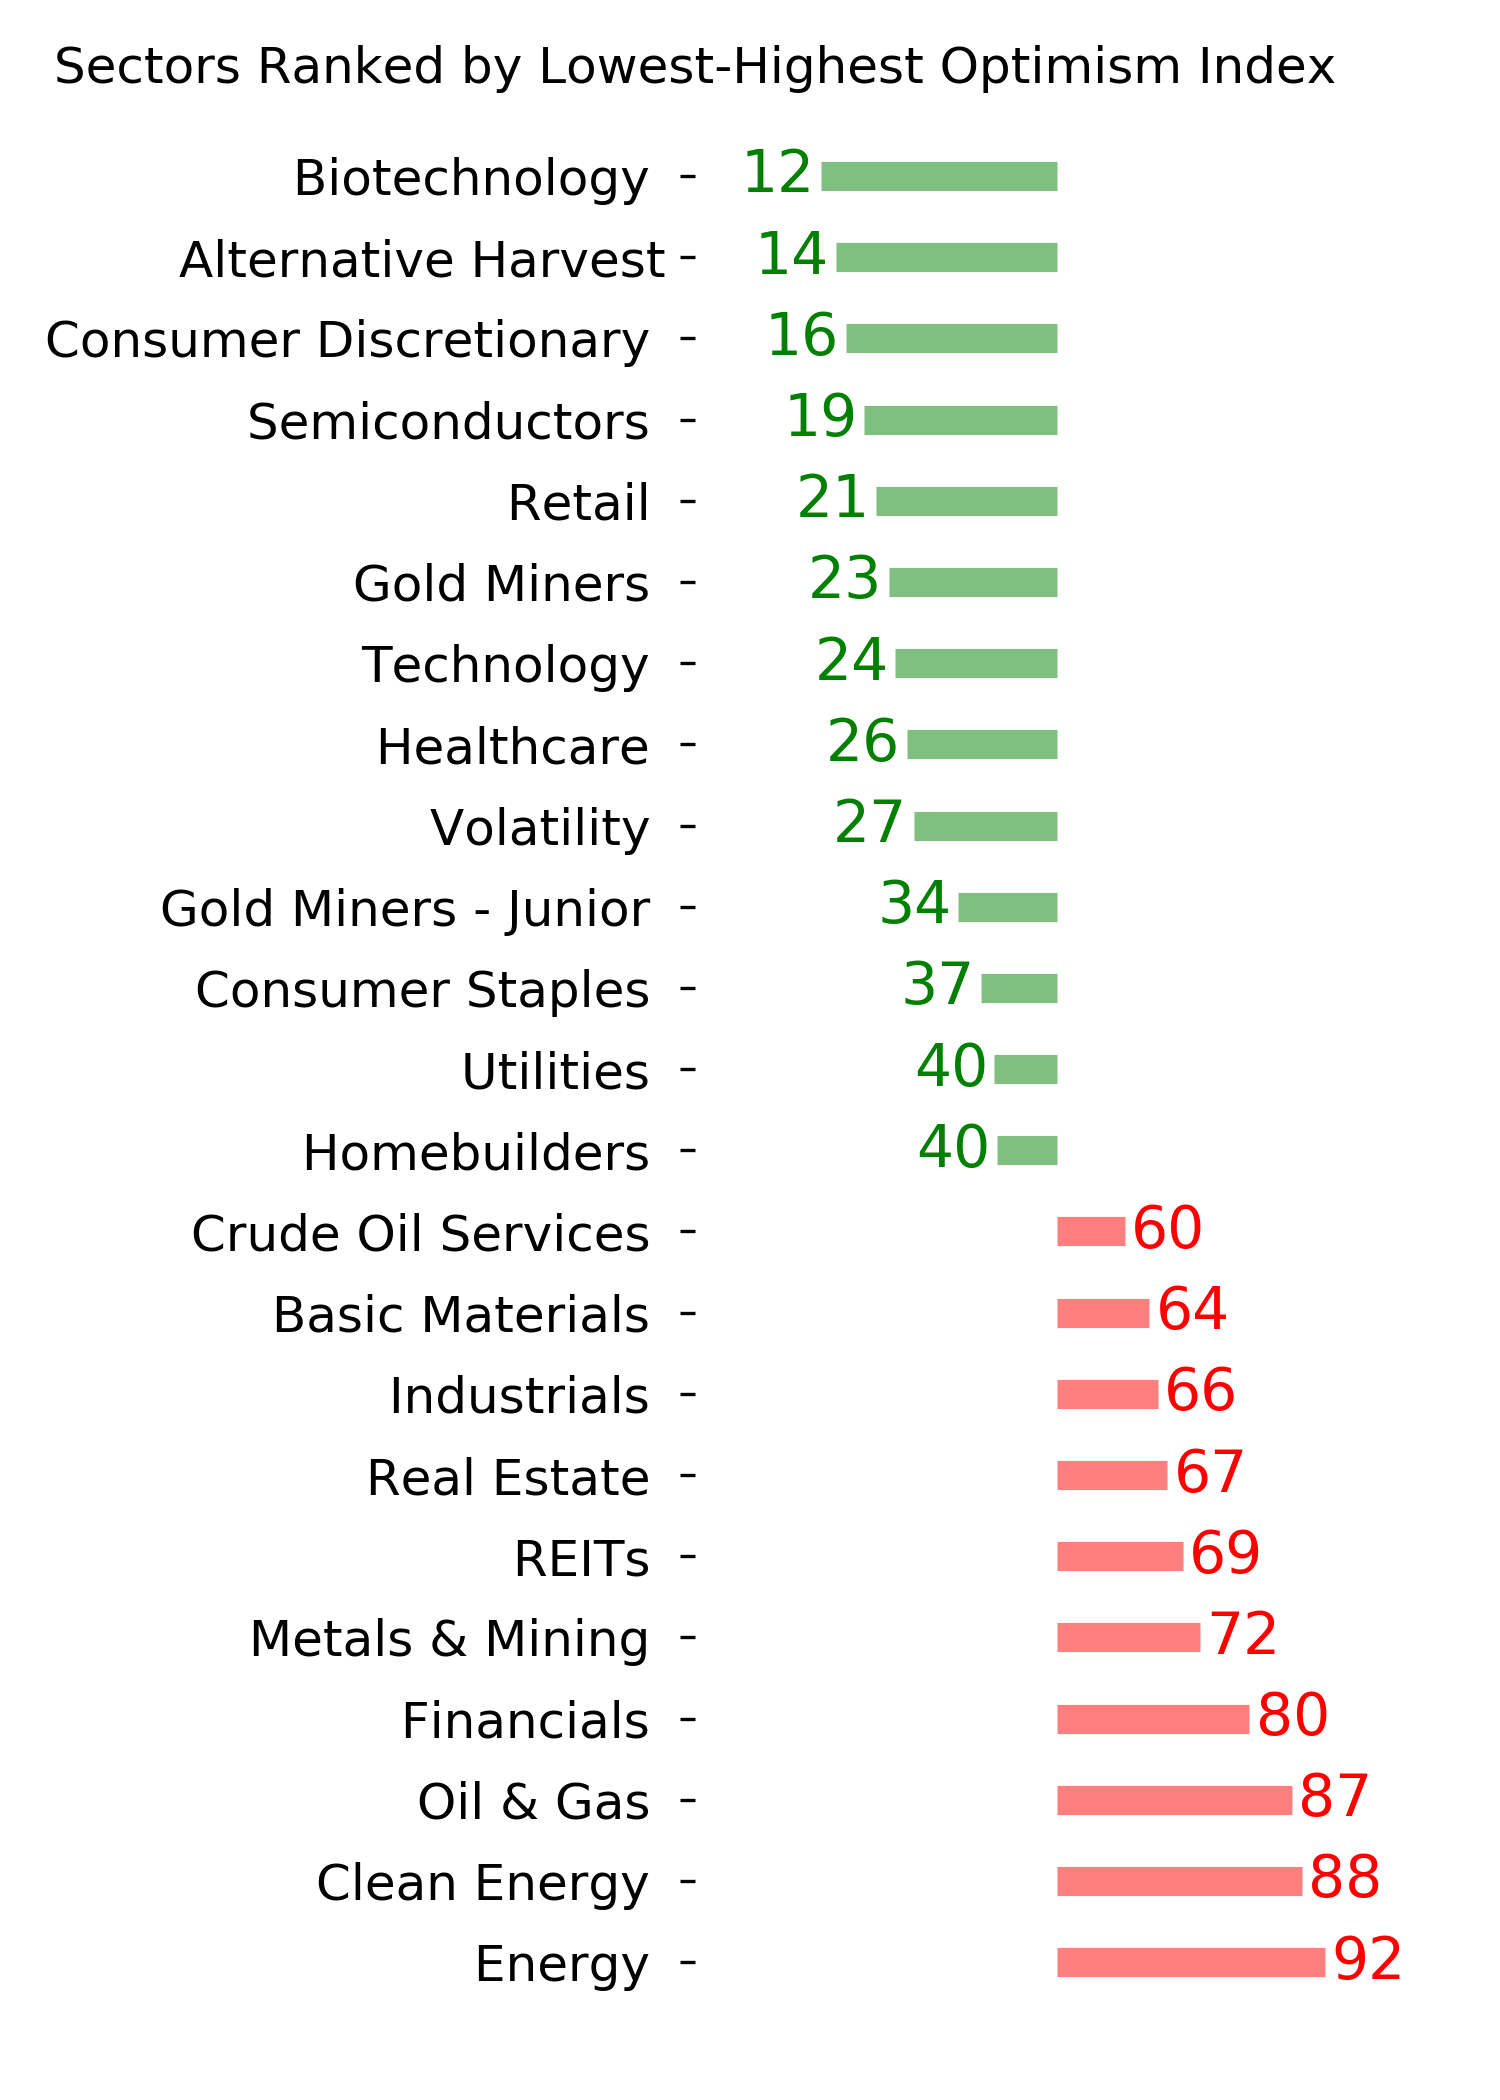
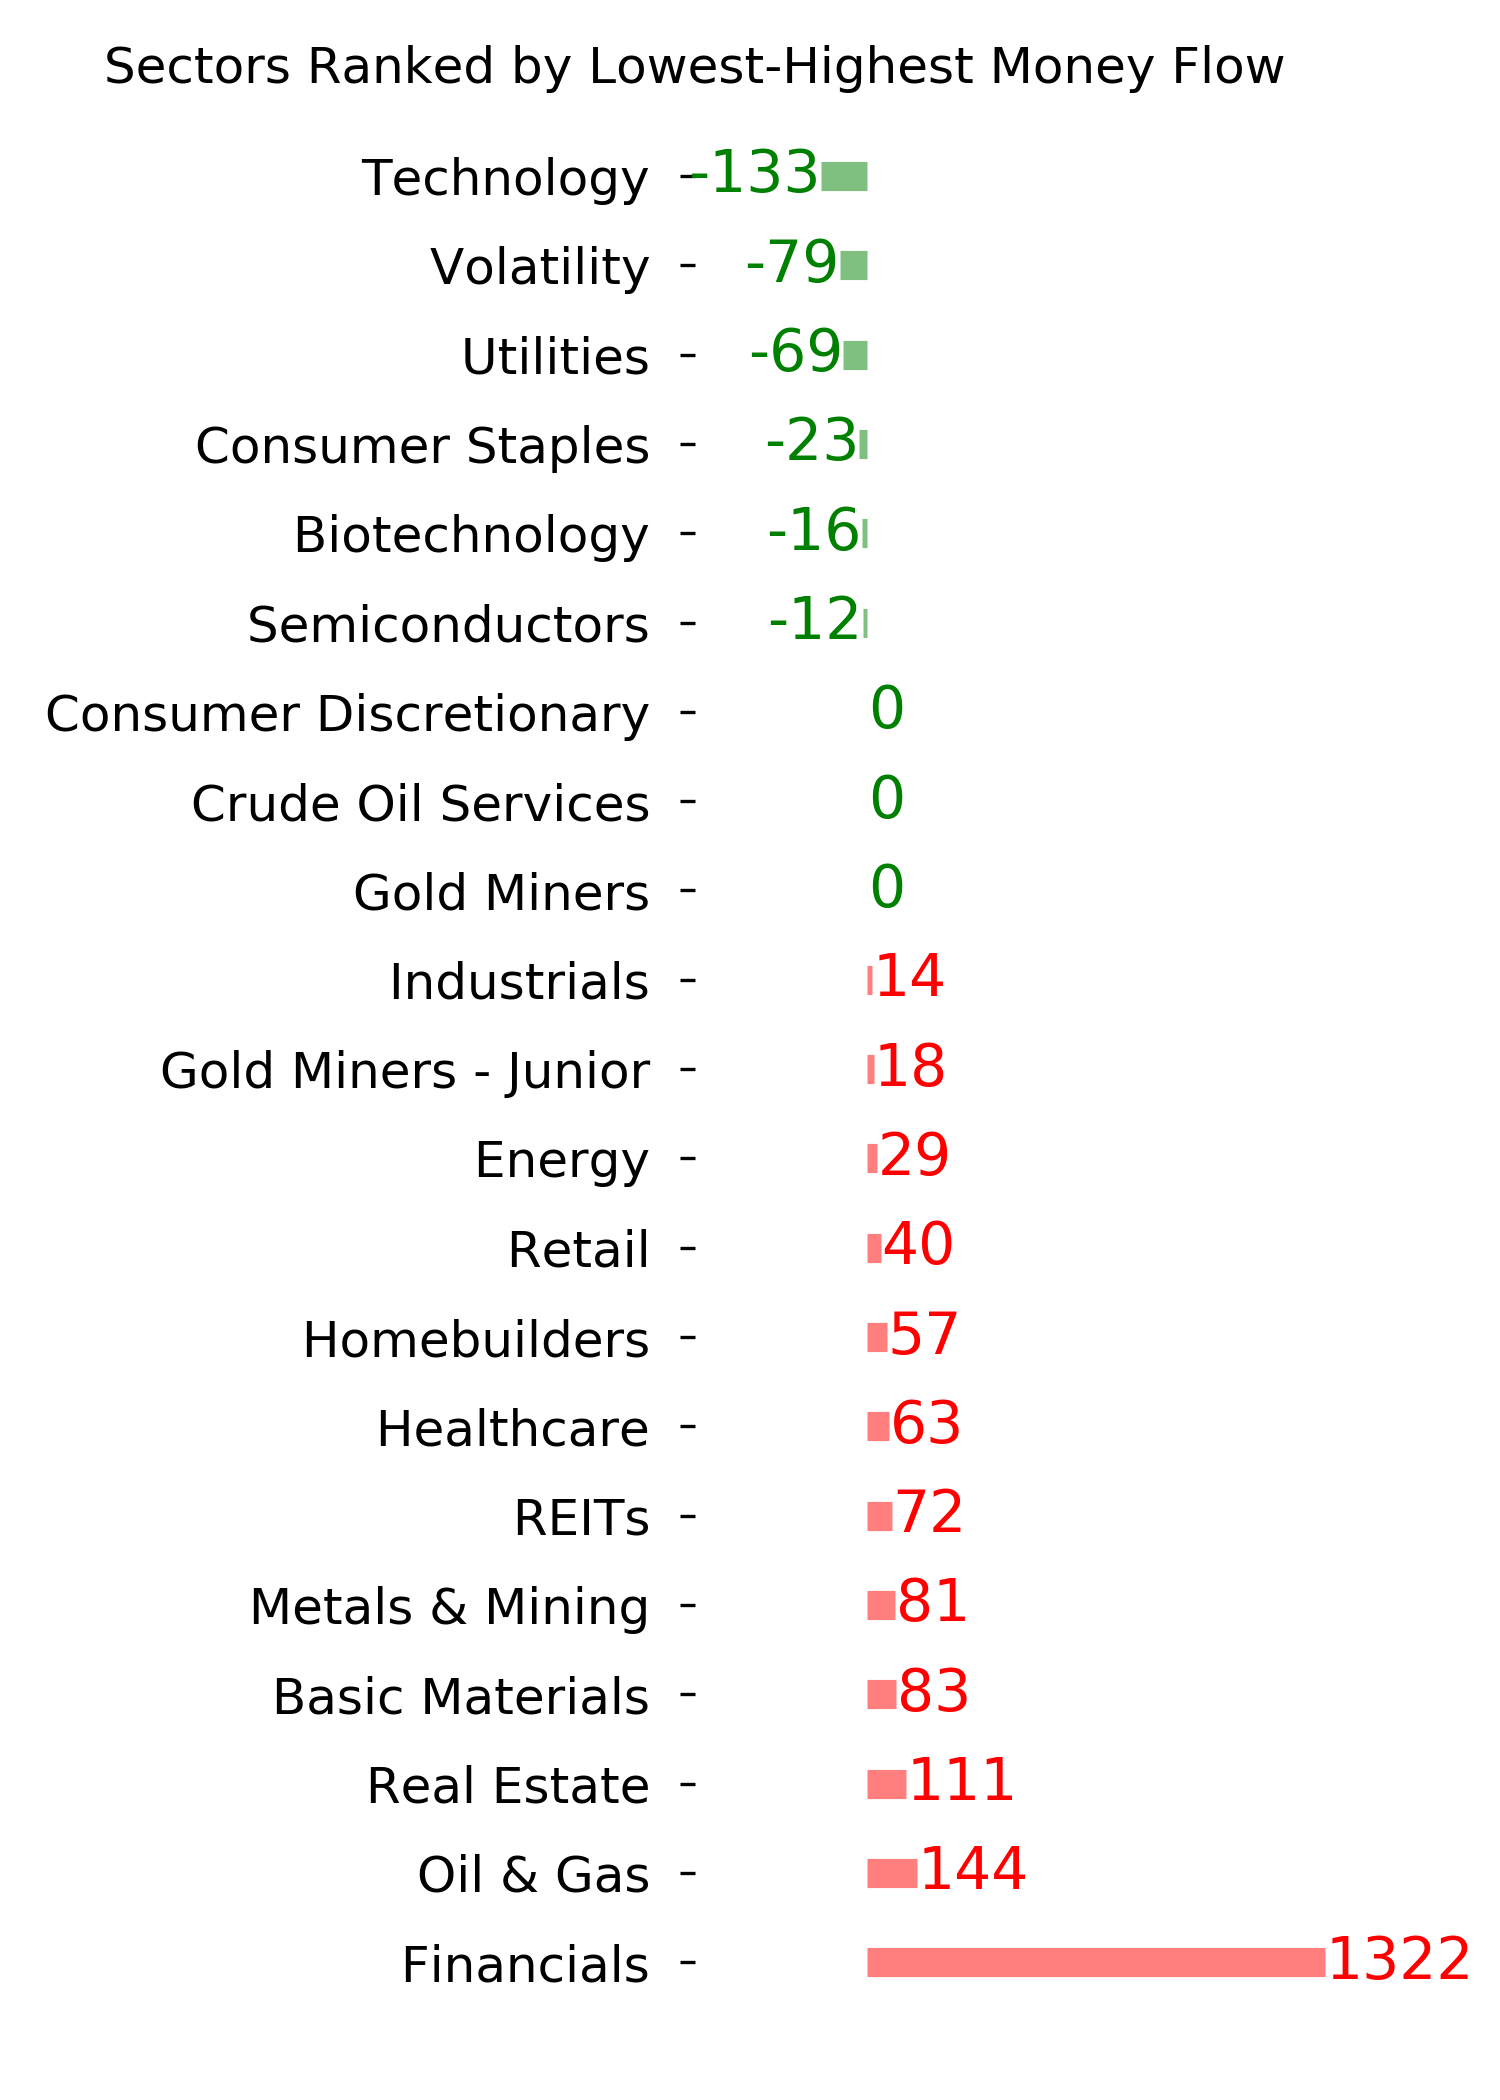
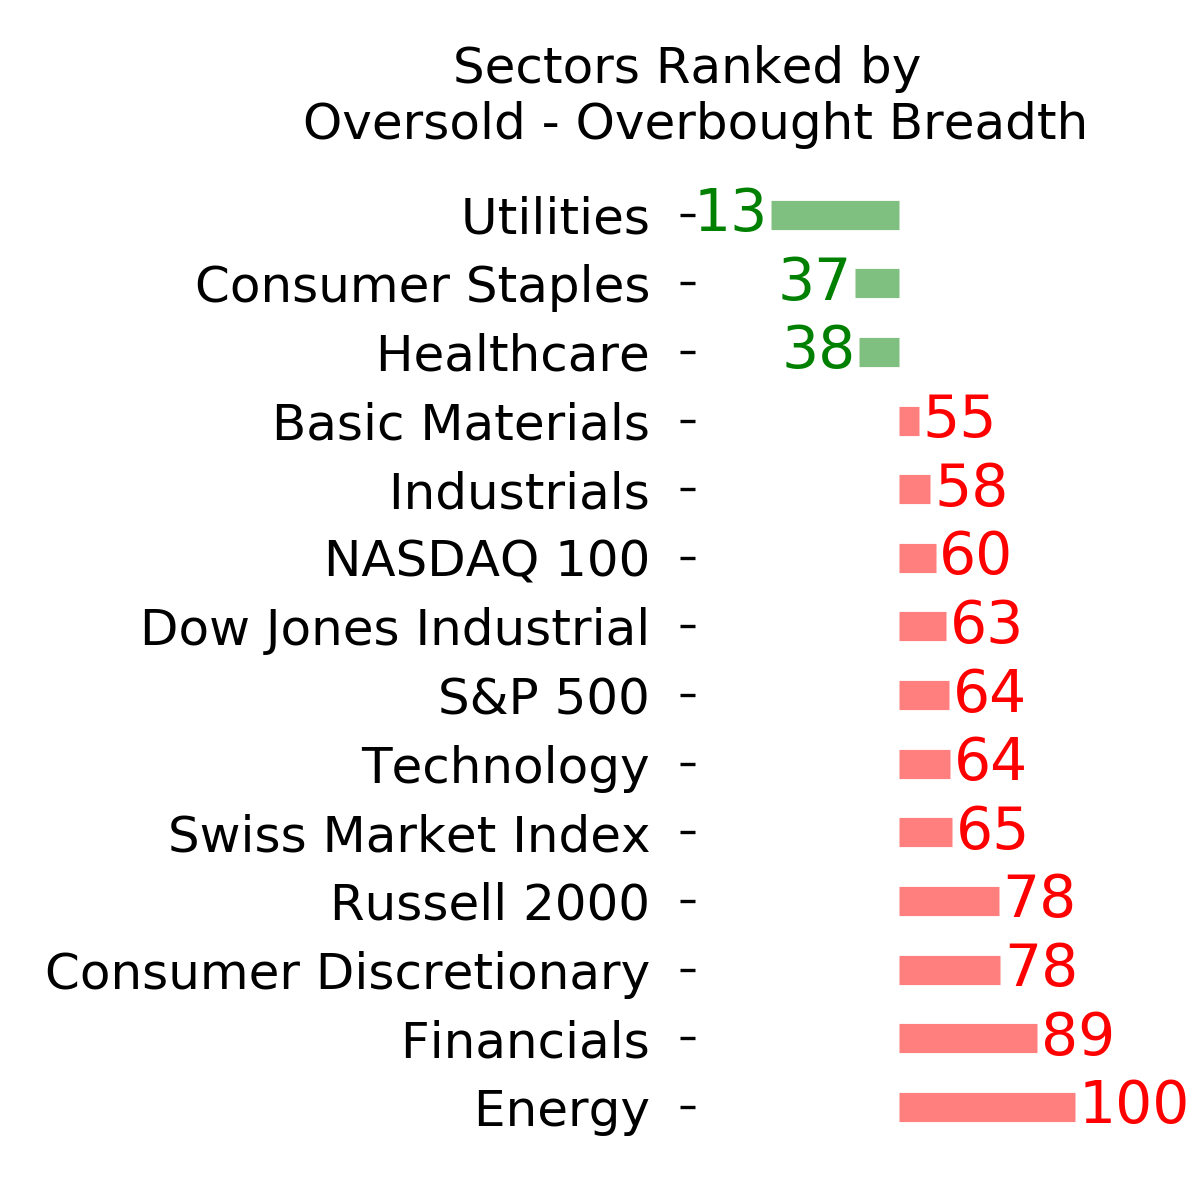
Ranks
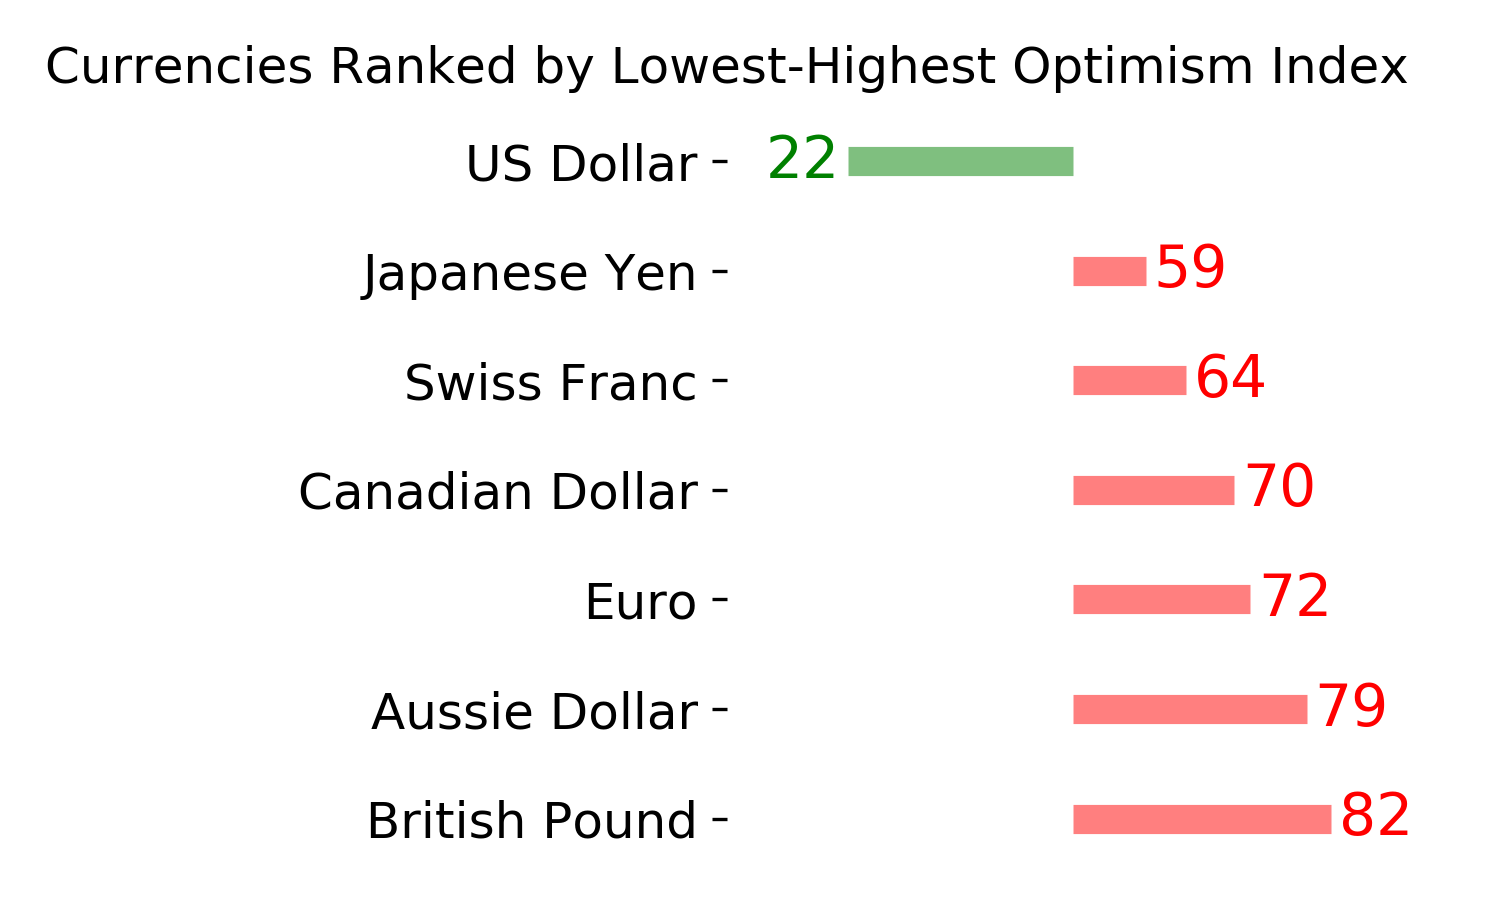
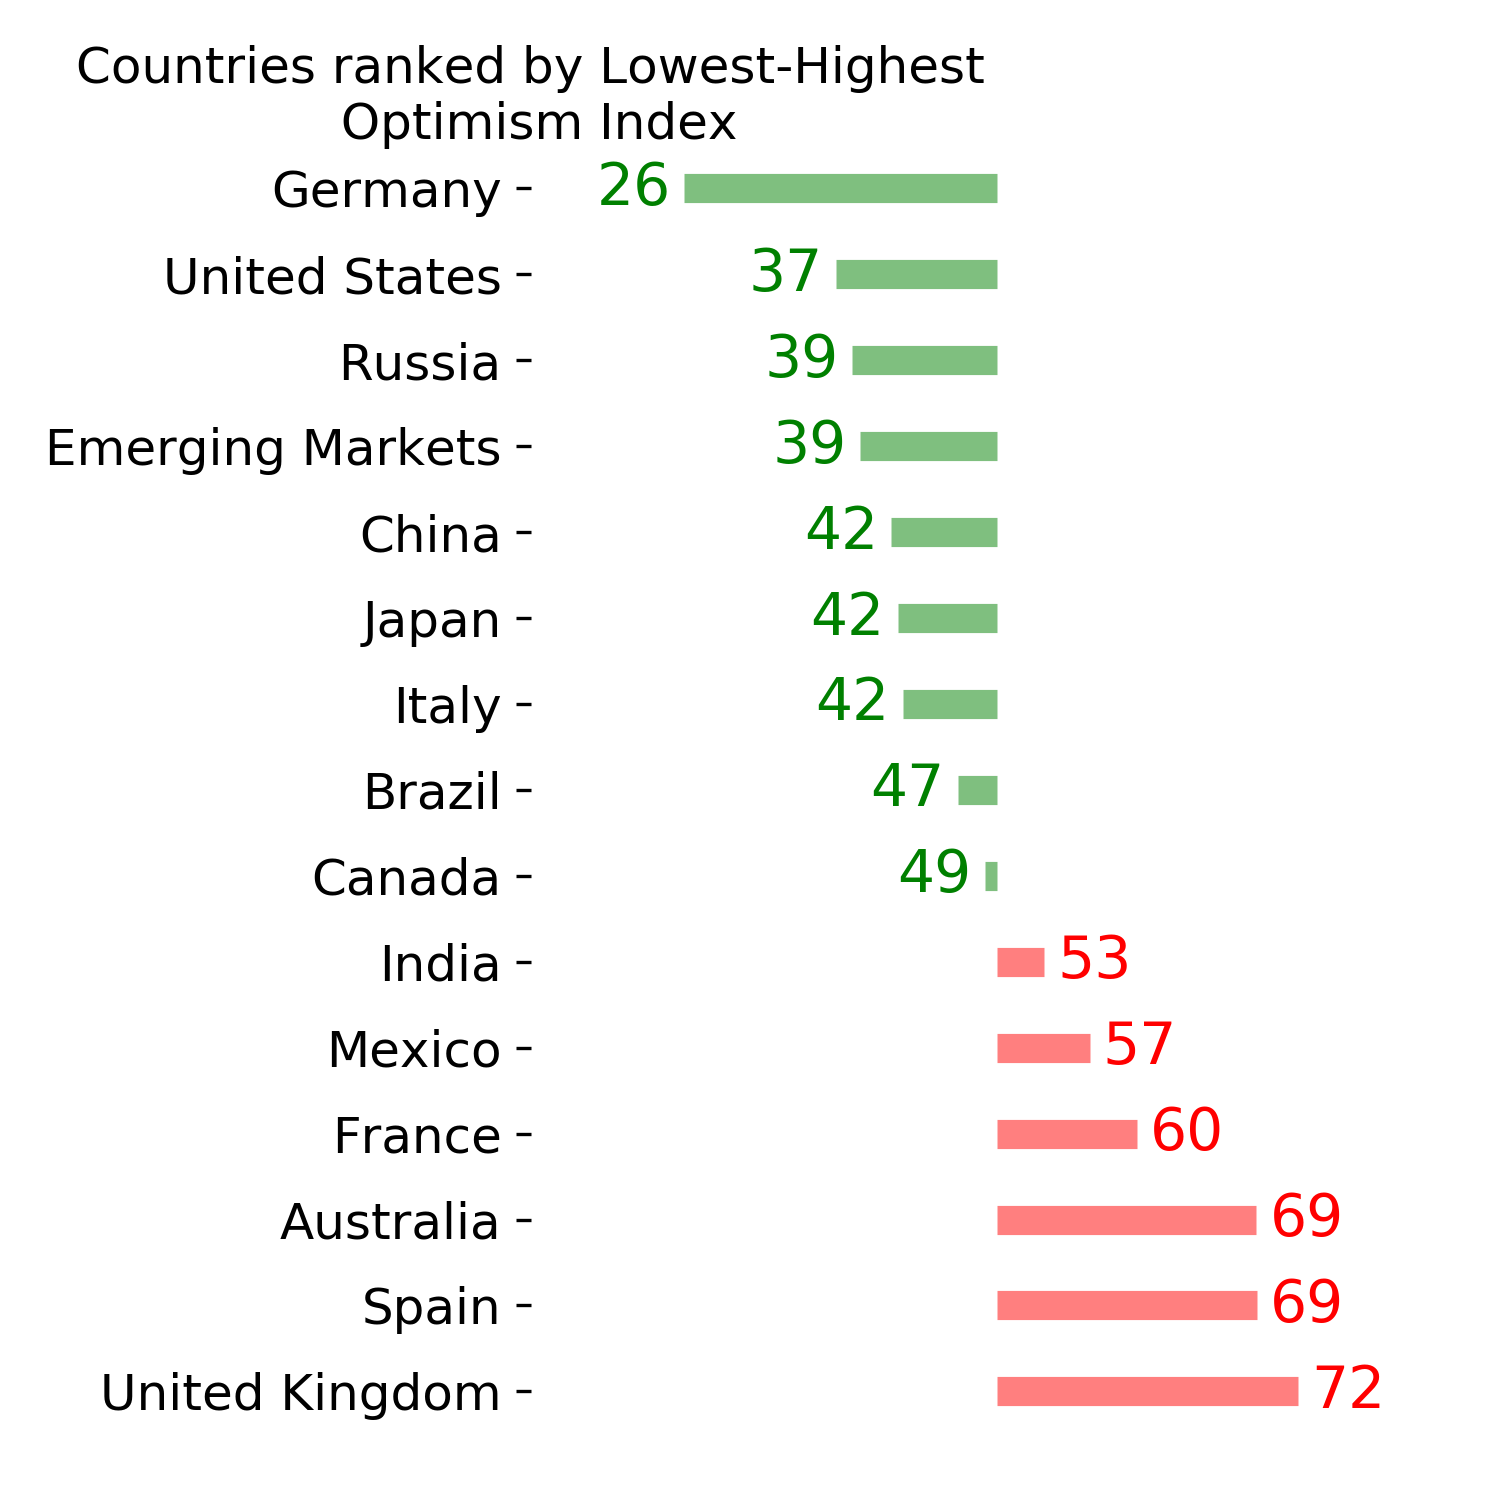
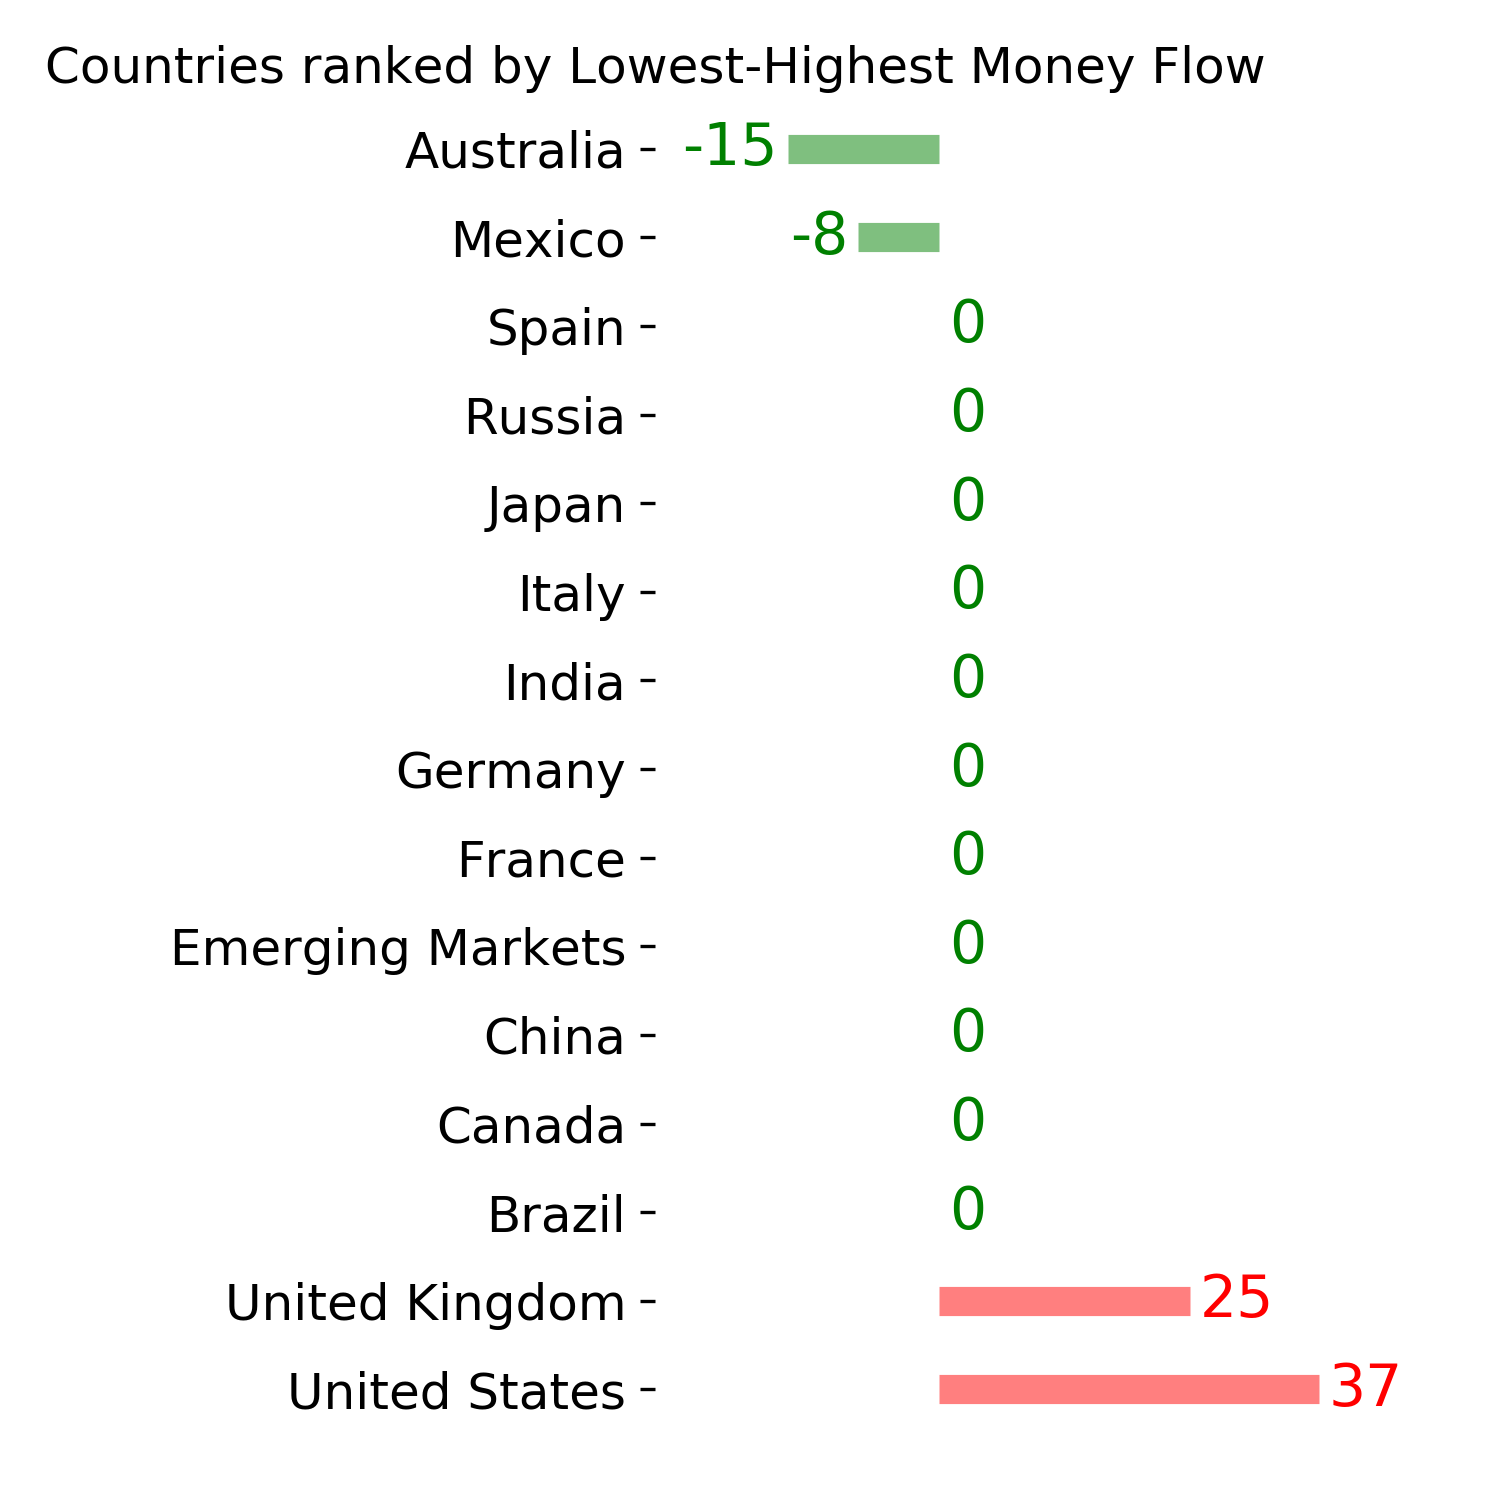
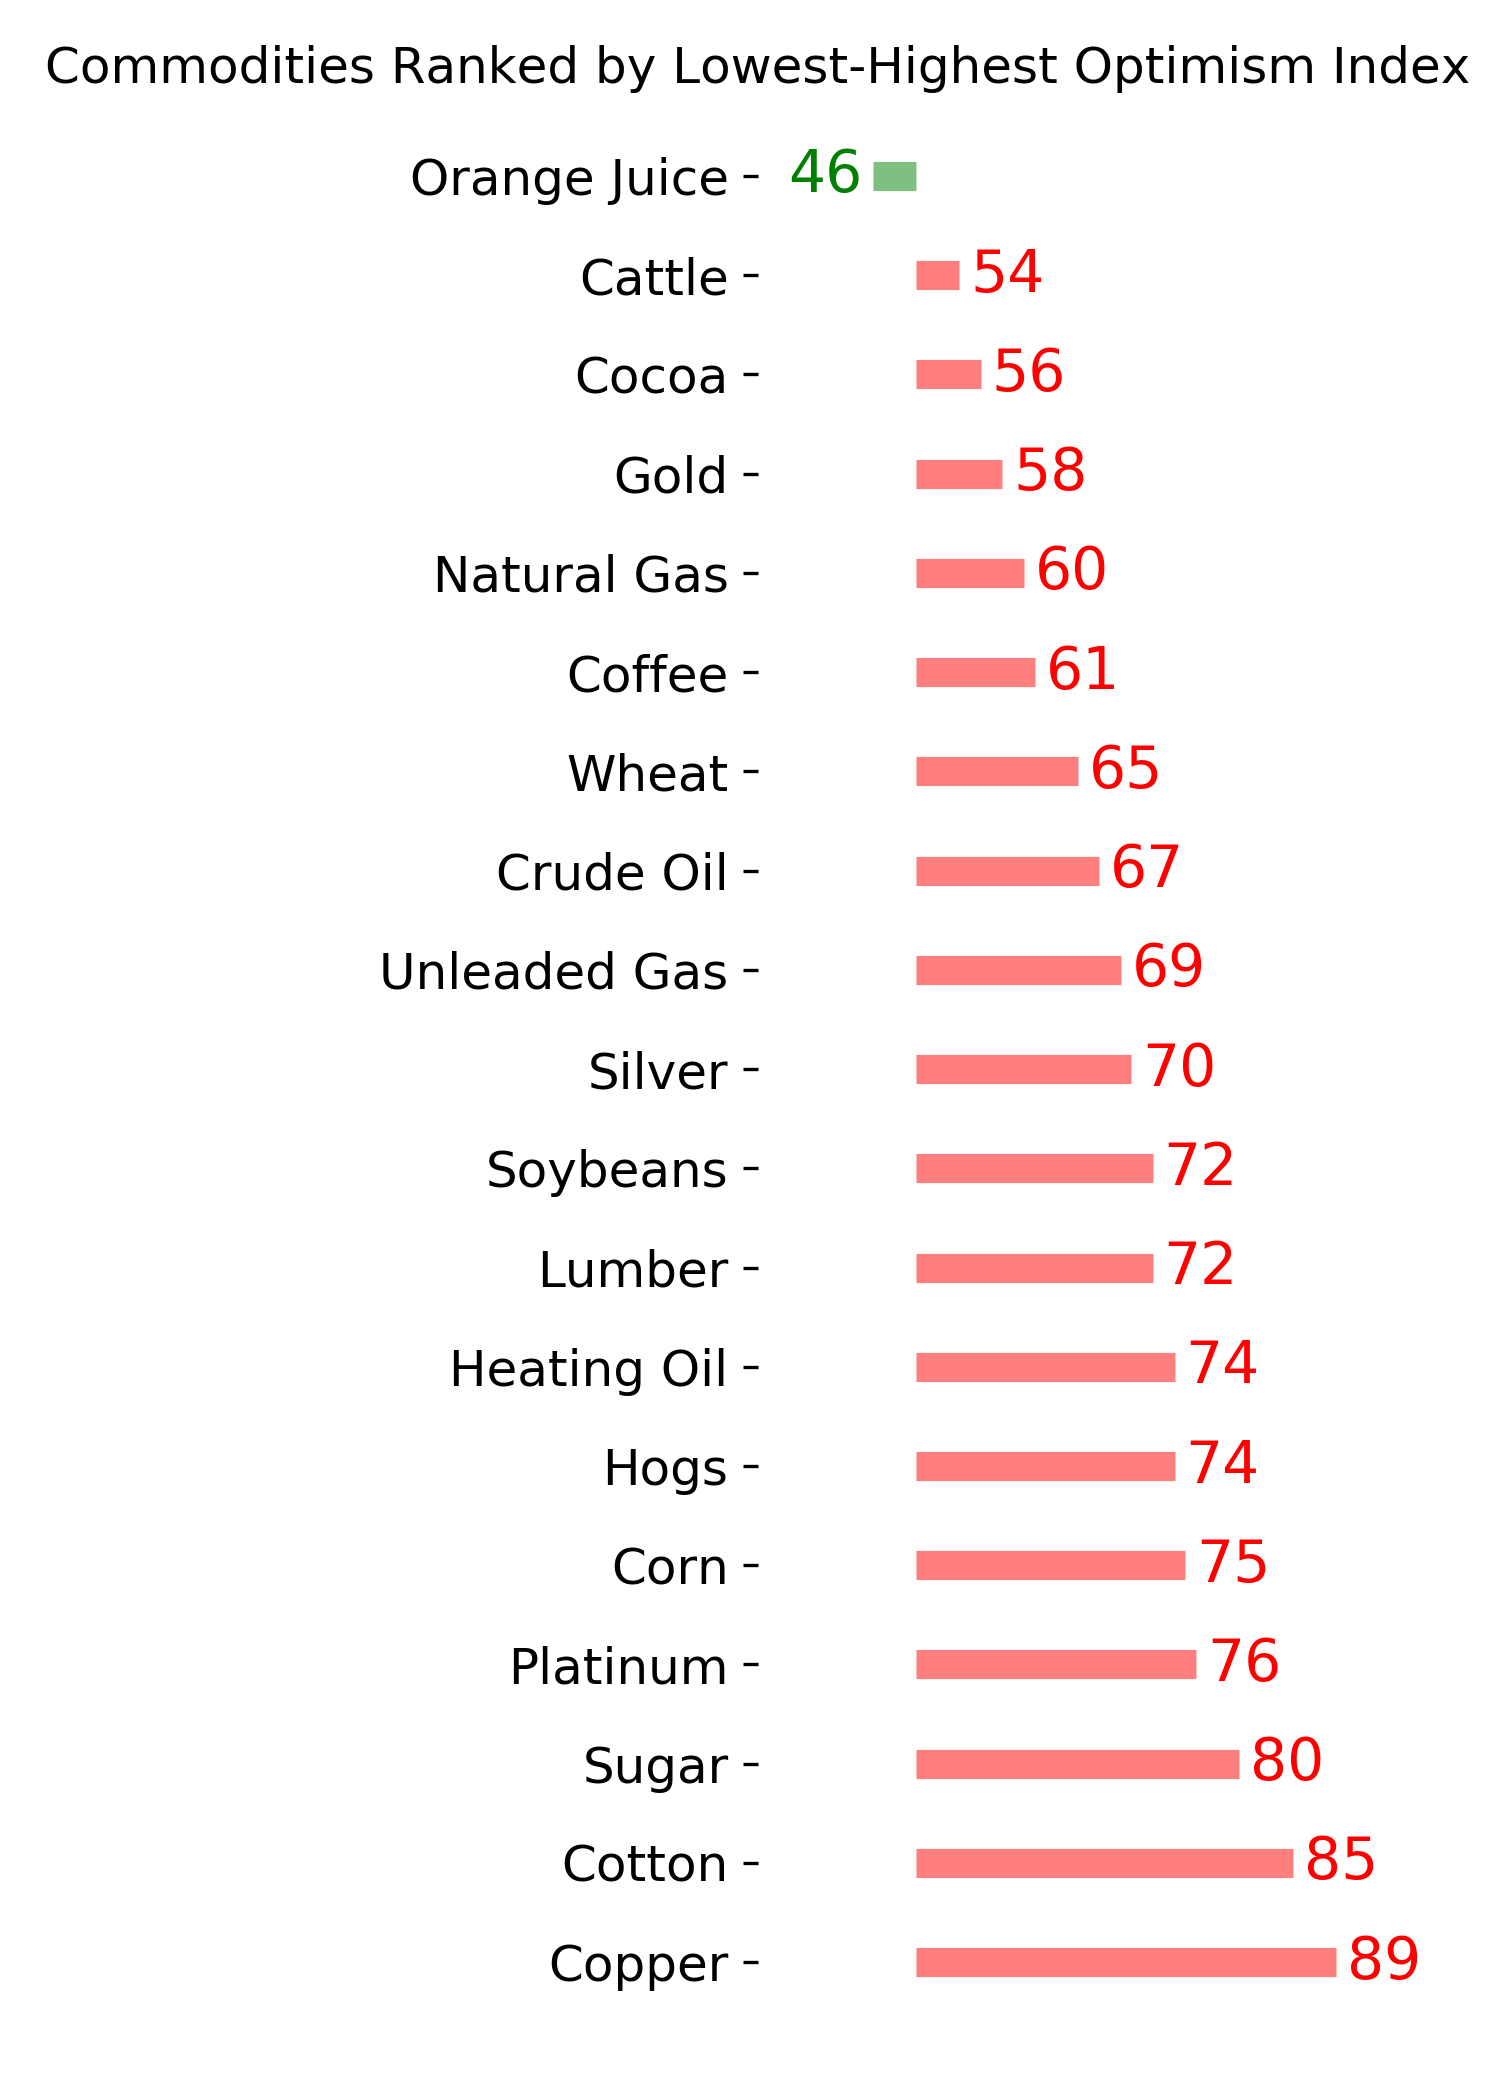
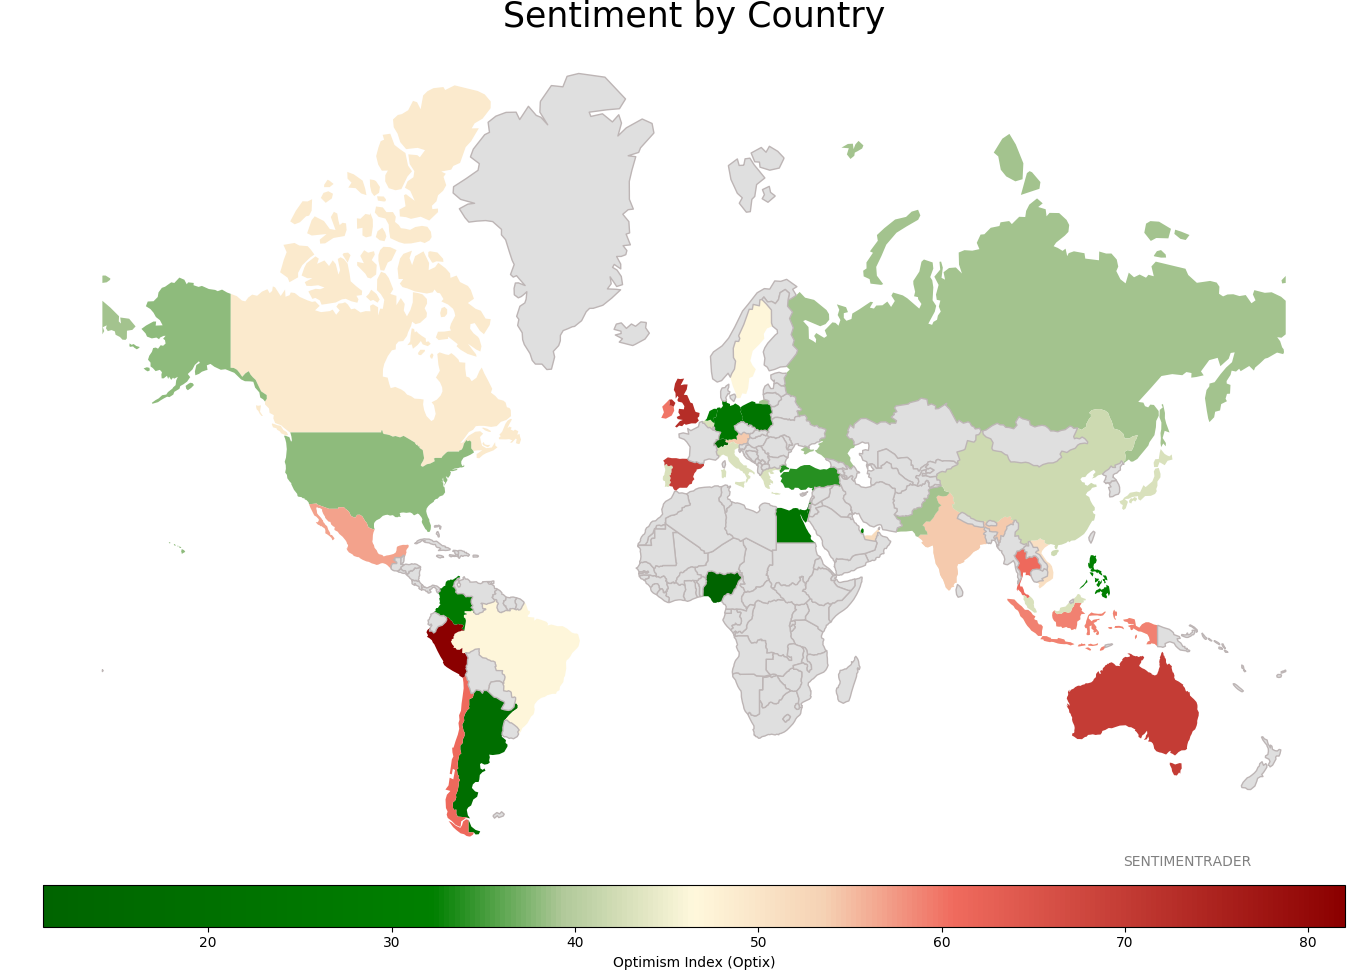
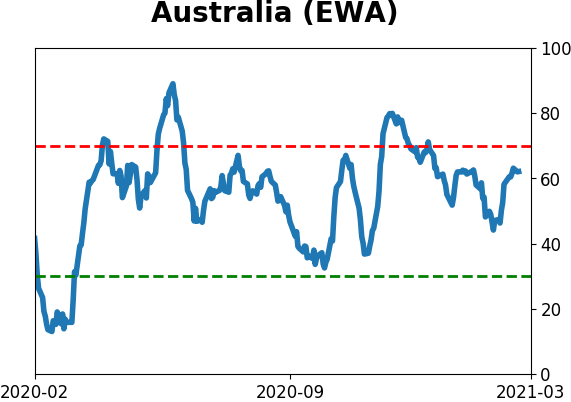
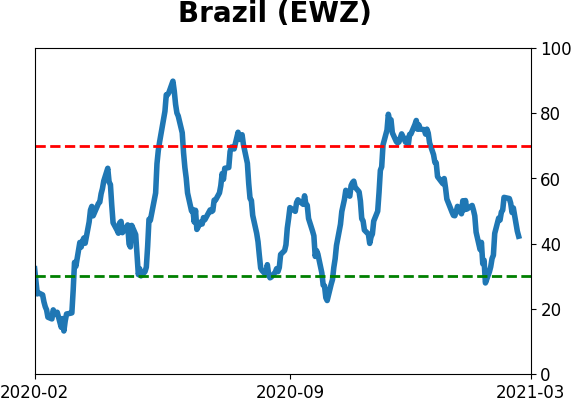
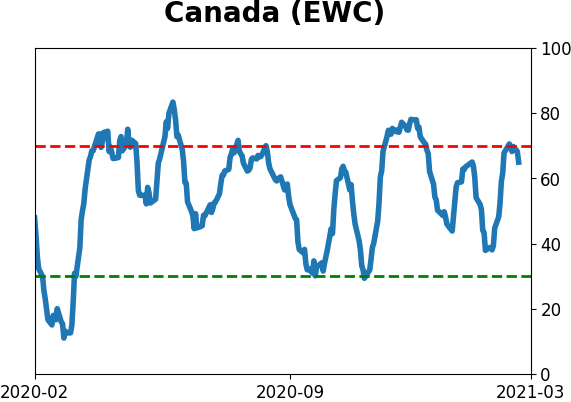
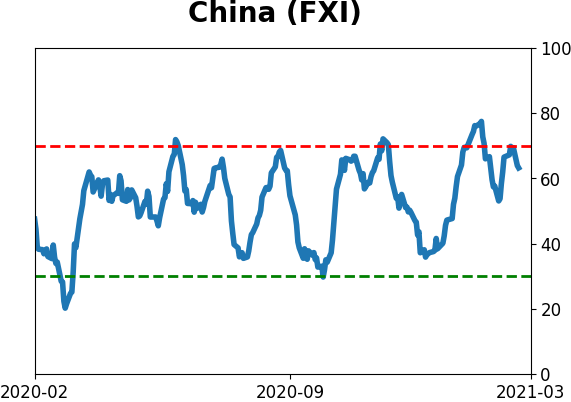
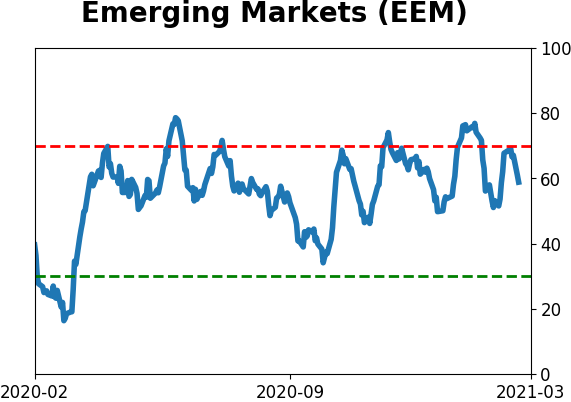
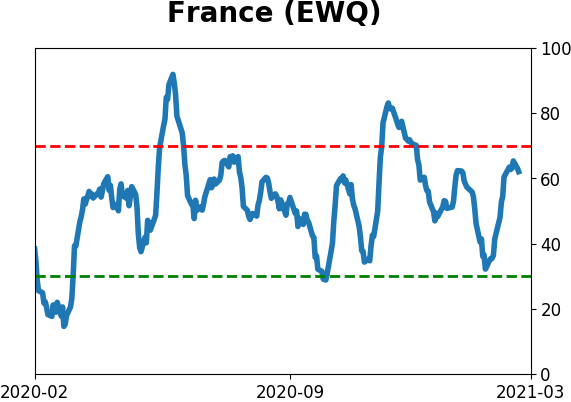
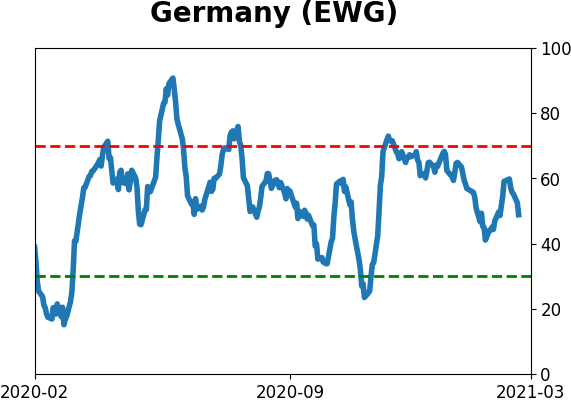
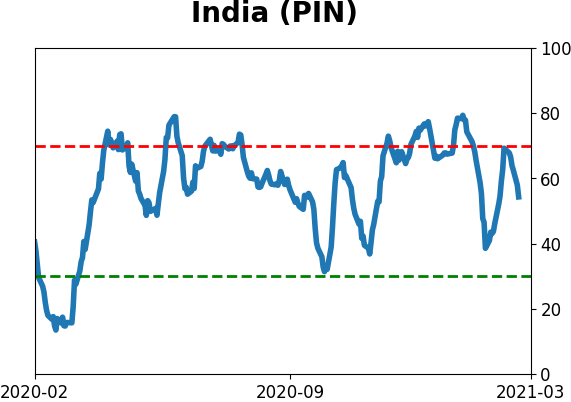
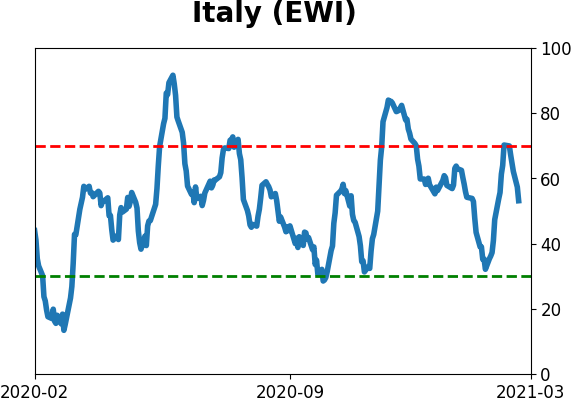
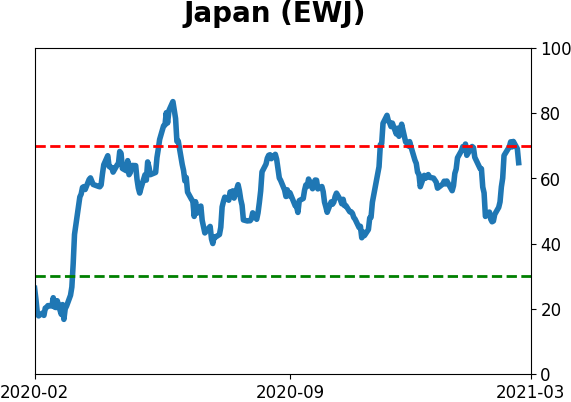
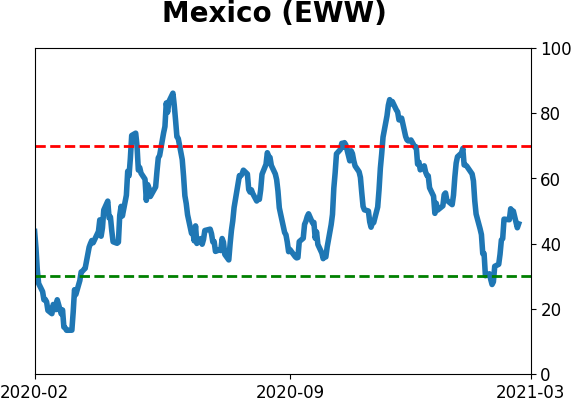
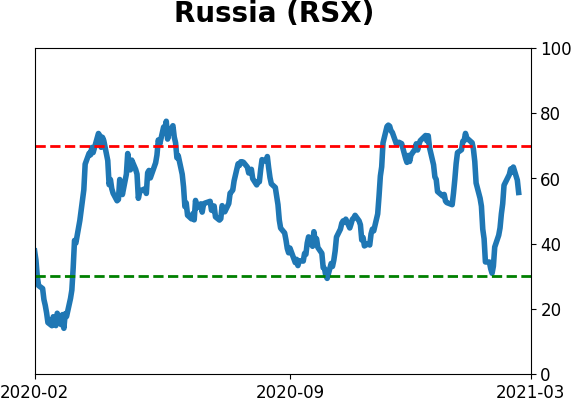
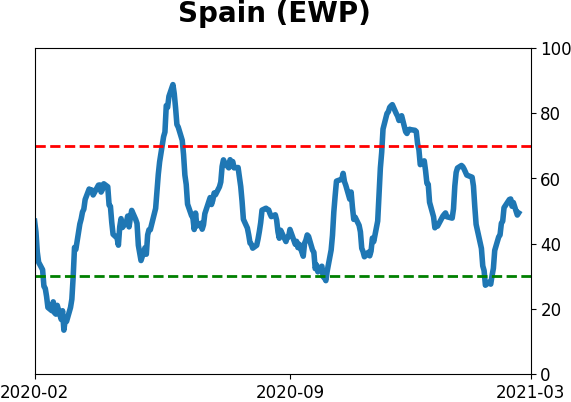
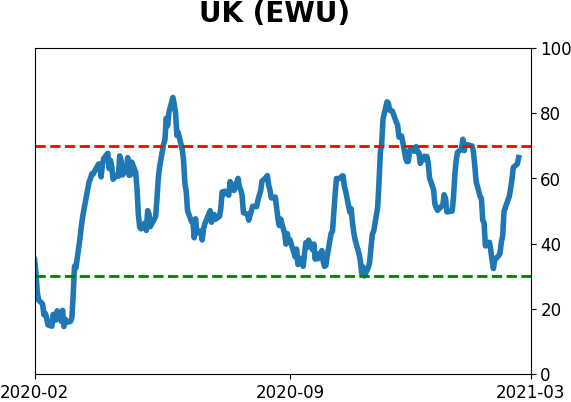
Sentiment Around The World
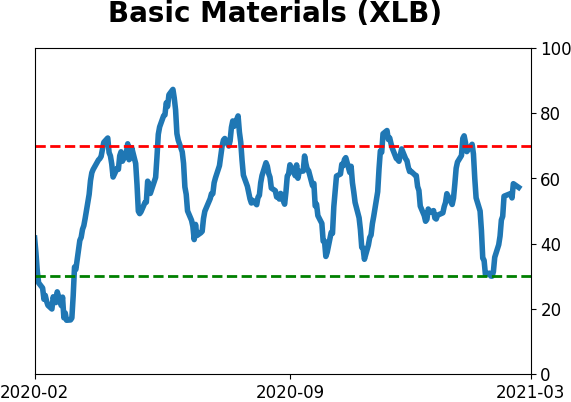
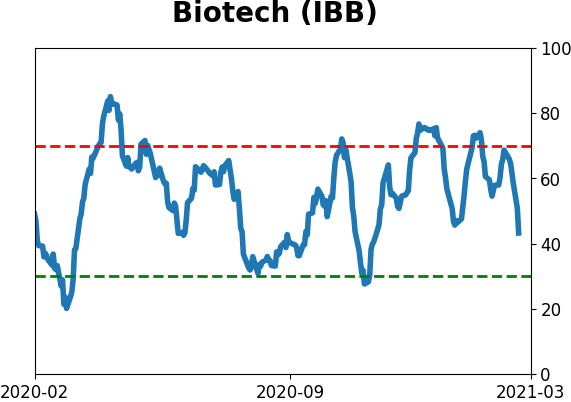
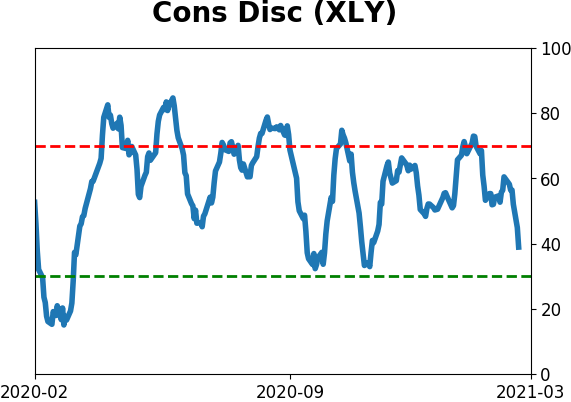
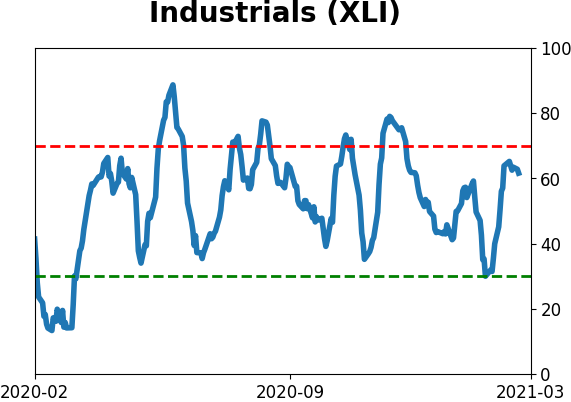
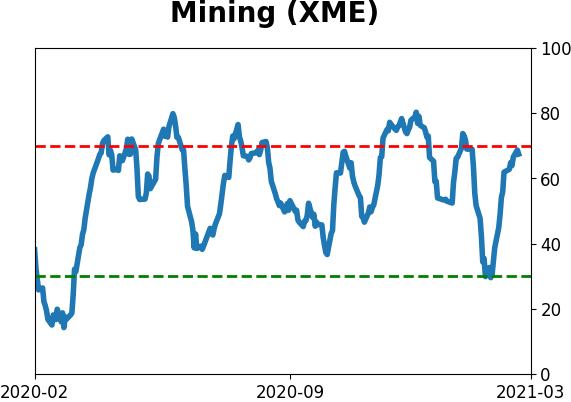
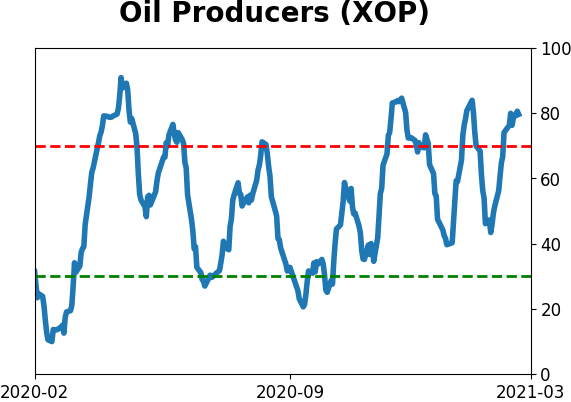
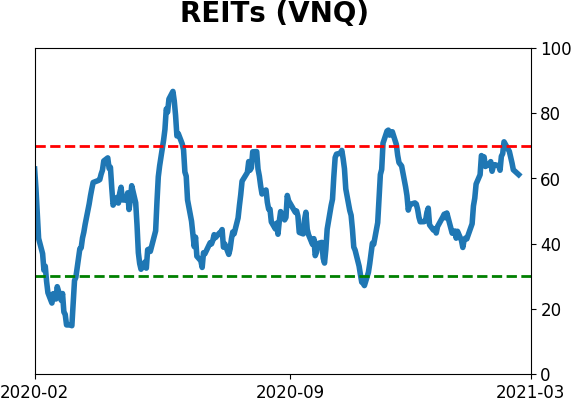
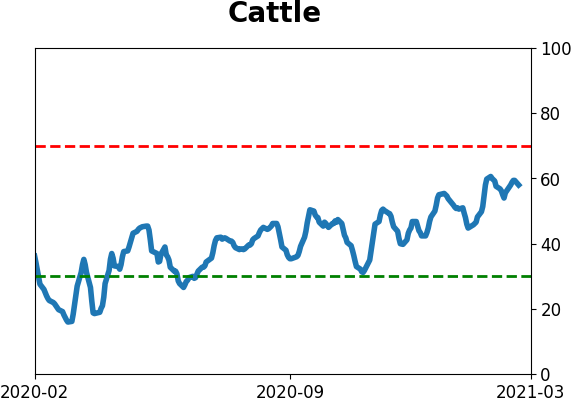
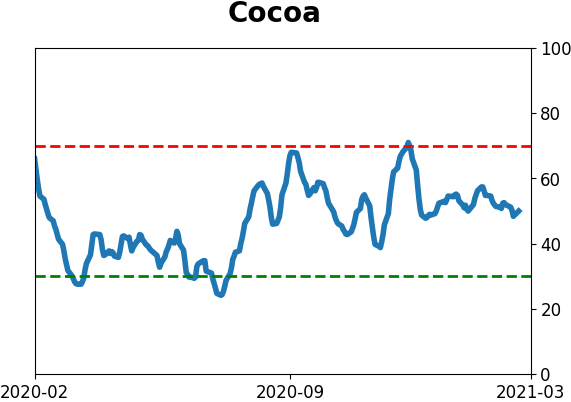
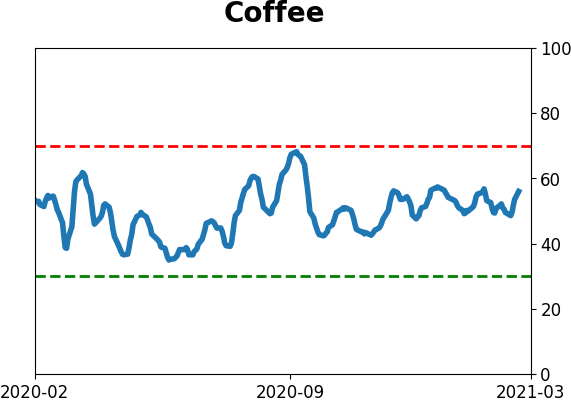
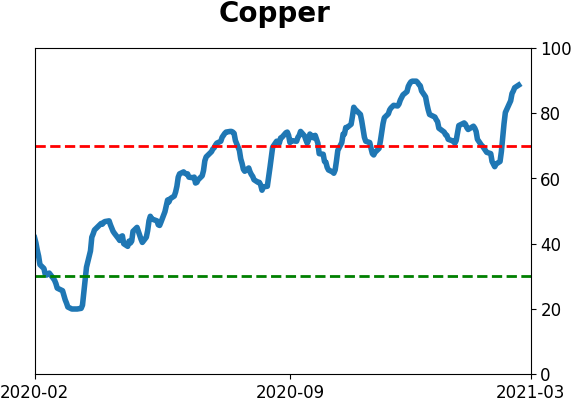
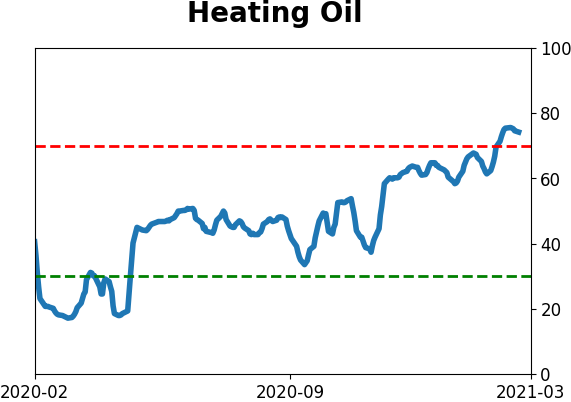
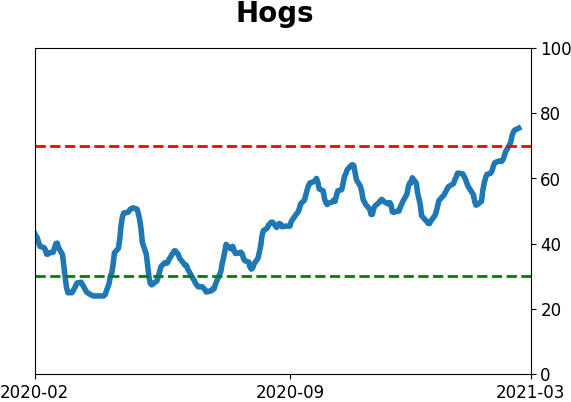
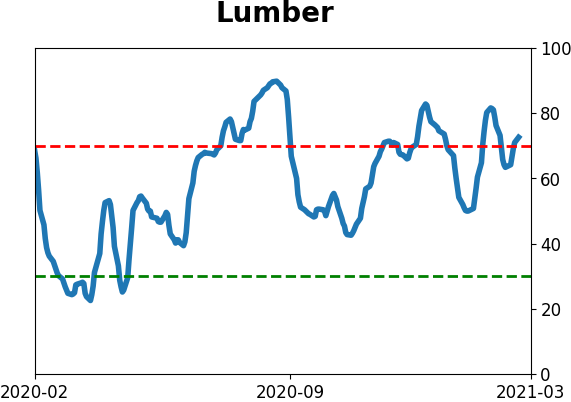
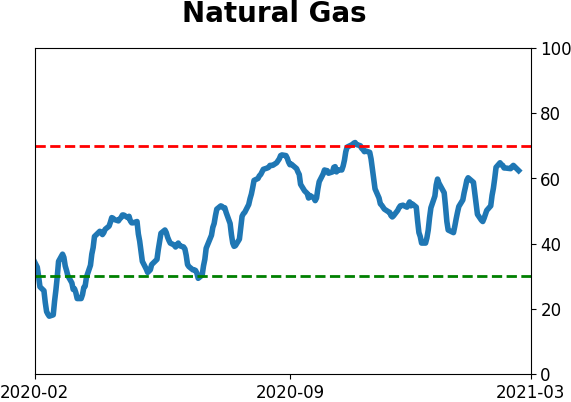
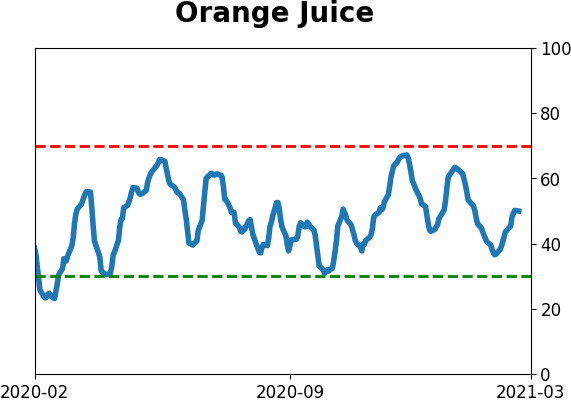
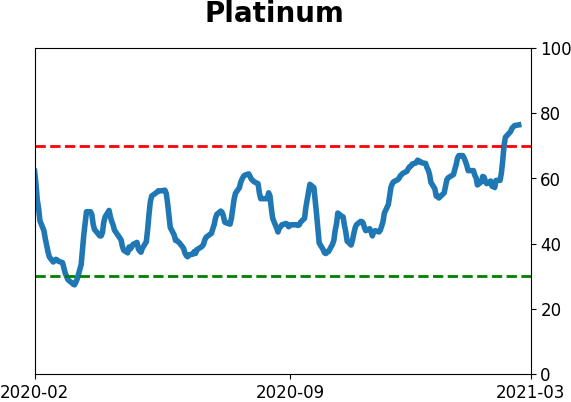
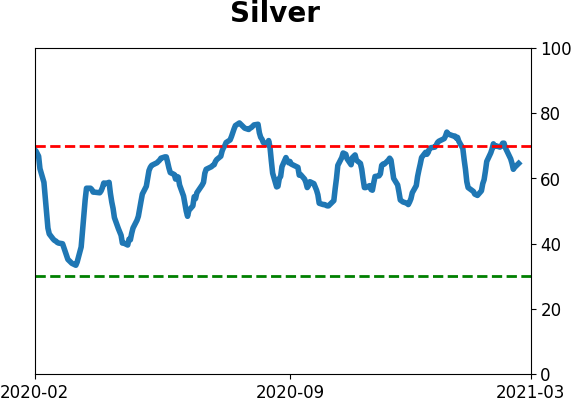
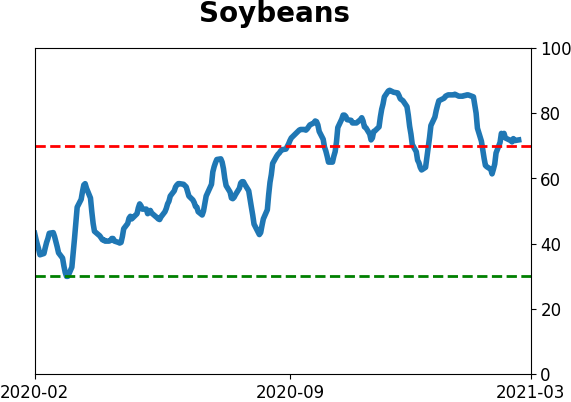
Optimism Index Thumbnails
|
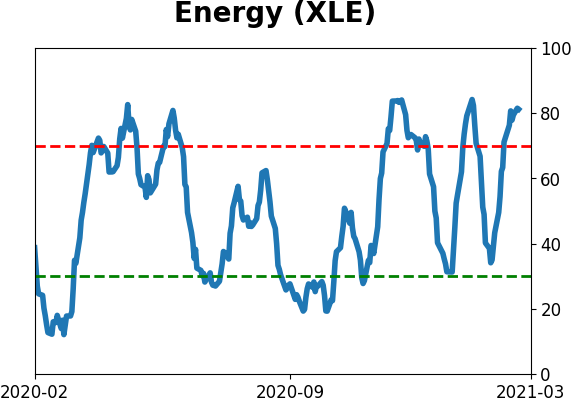
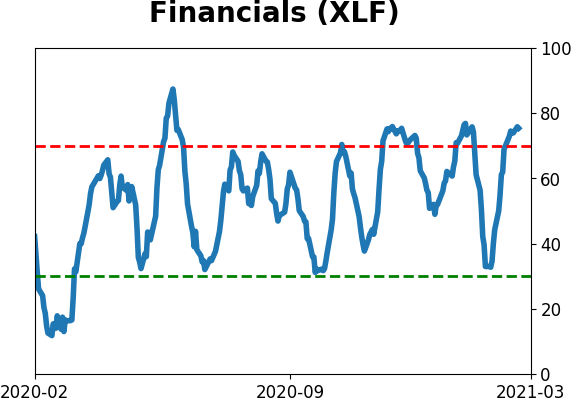
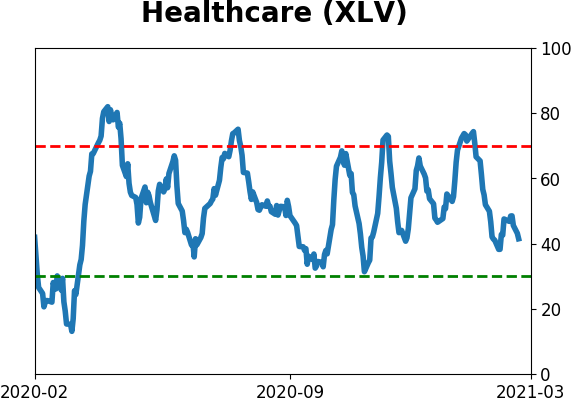
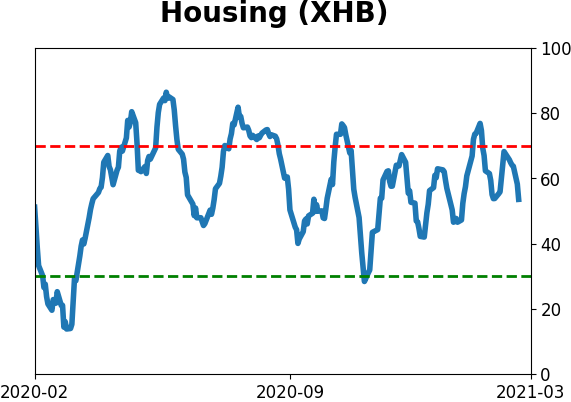
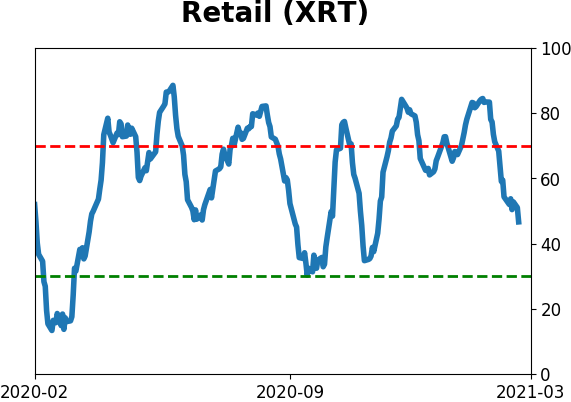
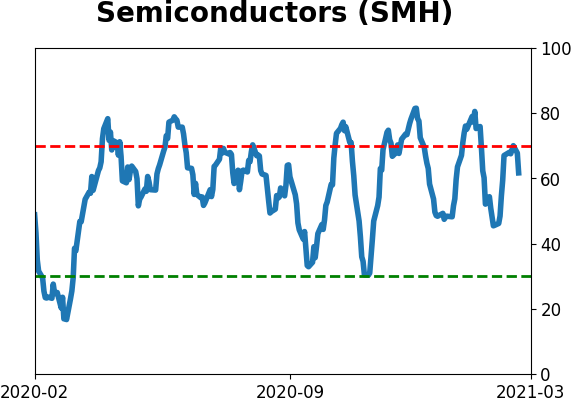
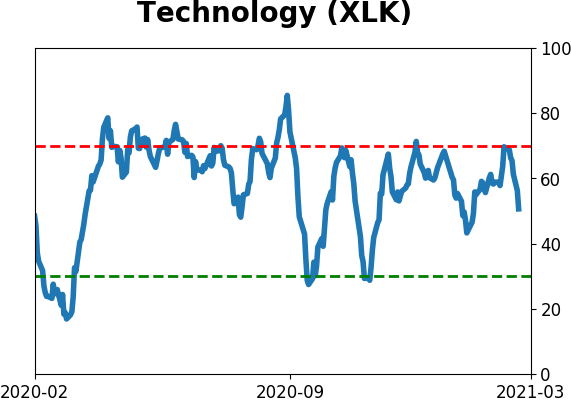
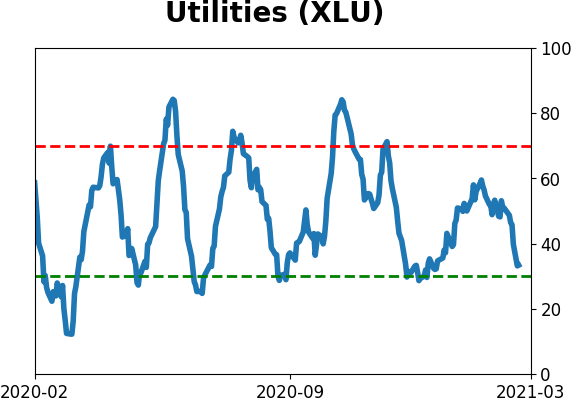
Sector ETF's - 10-Day Moving Average
|
|
|
Country ETF's - 10-Day Moving Average
|
|
|
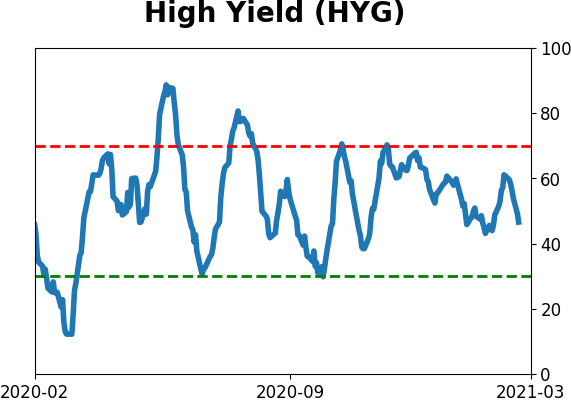
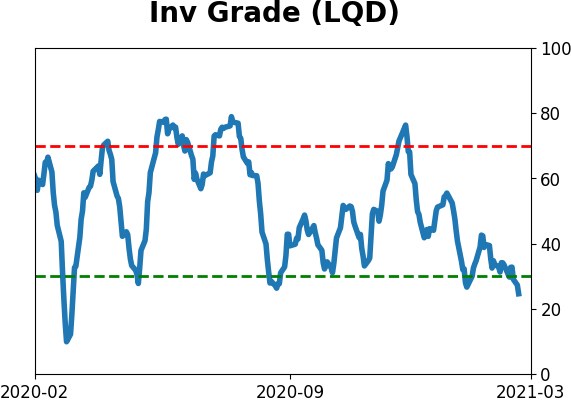
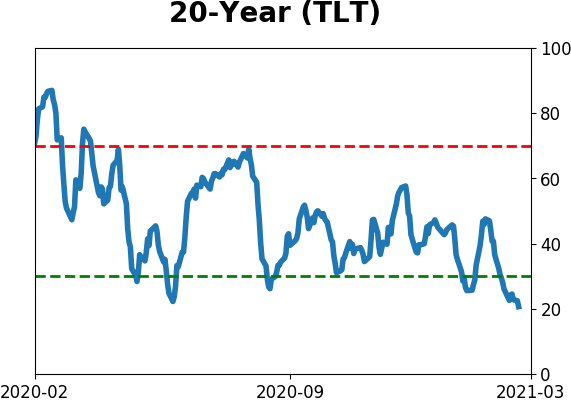
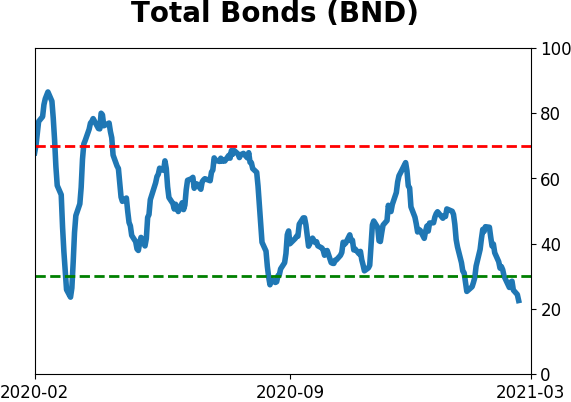
Bond ETF's - 10-Day Moving Average
|
|
|
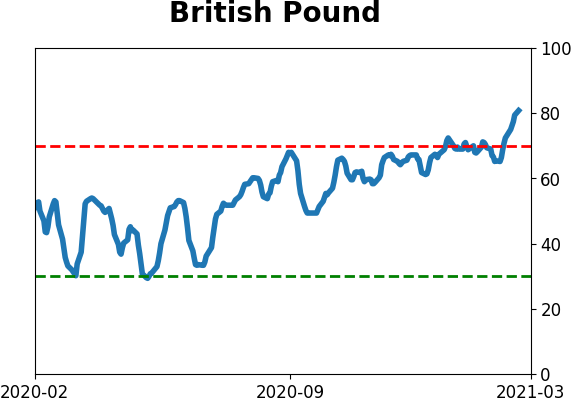
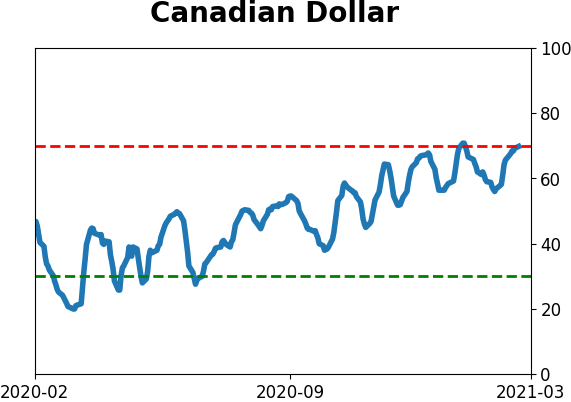
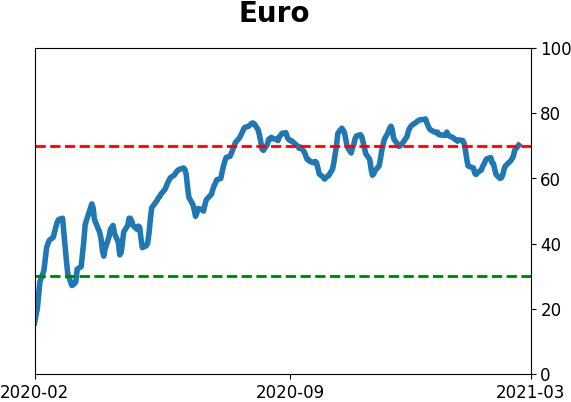
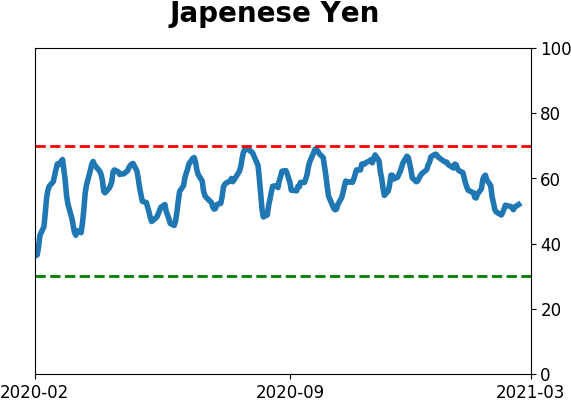
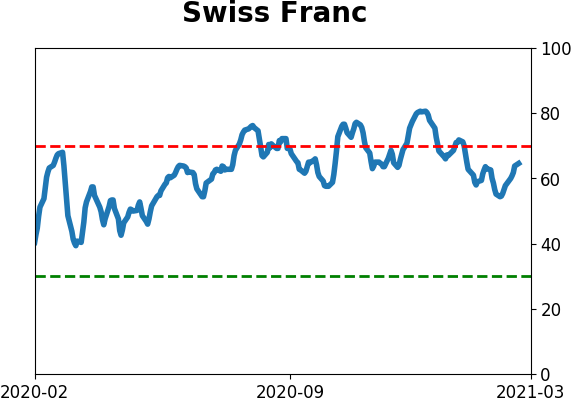
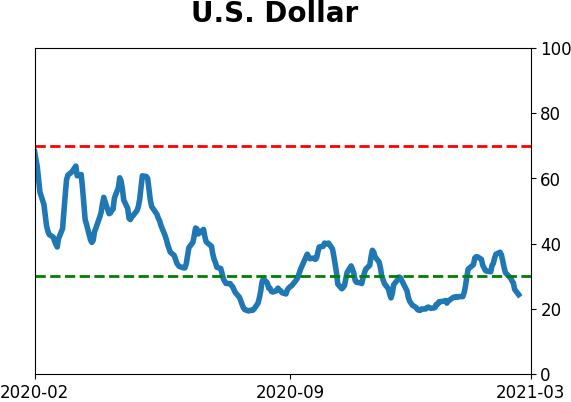
Currency ETF's - 5-Day Moving Average
|
|
|
Commodity ETF's - 5-Day Moving Average
|
|