Headlines
|
|
Gold is sinking, even against other metals:
The ratio of gold to platinum has plunged to the lowest level in years, even while stocks hold near their highs.
Bond options: As much as traders are buying calls on stocks and equity ETFs, they're (presumably) buying puts on bonds. For only the 3rd time in 22 years, more than 1 million put options were traded on 10-year Treasury notes on Tuesday. The other dates were 2018-10-04 and 2016-11-10. The 50-day average of the put/call ratio for the 10-year is now approaching 2.25 and challenging its record high from January 2014.
Bottom Line:
See the Outlook & Allocations page for more details on these summaries STOCKS: Weak sell
We're in an extremely speculative environment that is enough to become defensive, especially with recent cracks showing in what had been pristine breadth conditions. The spike in fear from a couple of weeks ago has dissipated and likely not enough to offset the negatives over a medium-term time frame. BONDS: Weak buy
Various parts of the market have been hit in recent weeks, with mild oversold conditions. Treasuries have been hit hard and will likely start to register some extremes soon. GOLD: Weak buy
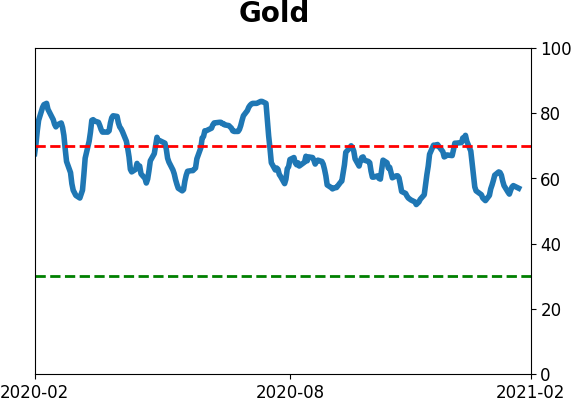
A dollar trying to rebound from a severe short position has weighed on gold and miners. The types of signals they've given in recent weeks, within the context of their recent surge, have usually resulted in higher prices over a medium- to long-term time frame.
|
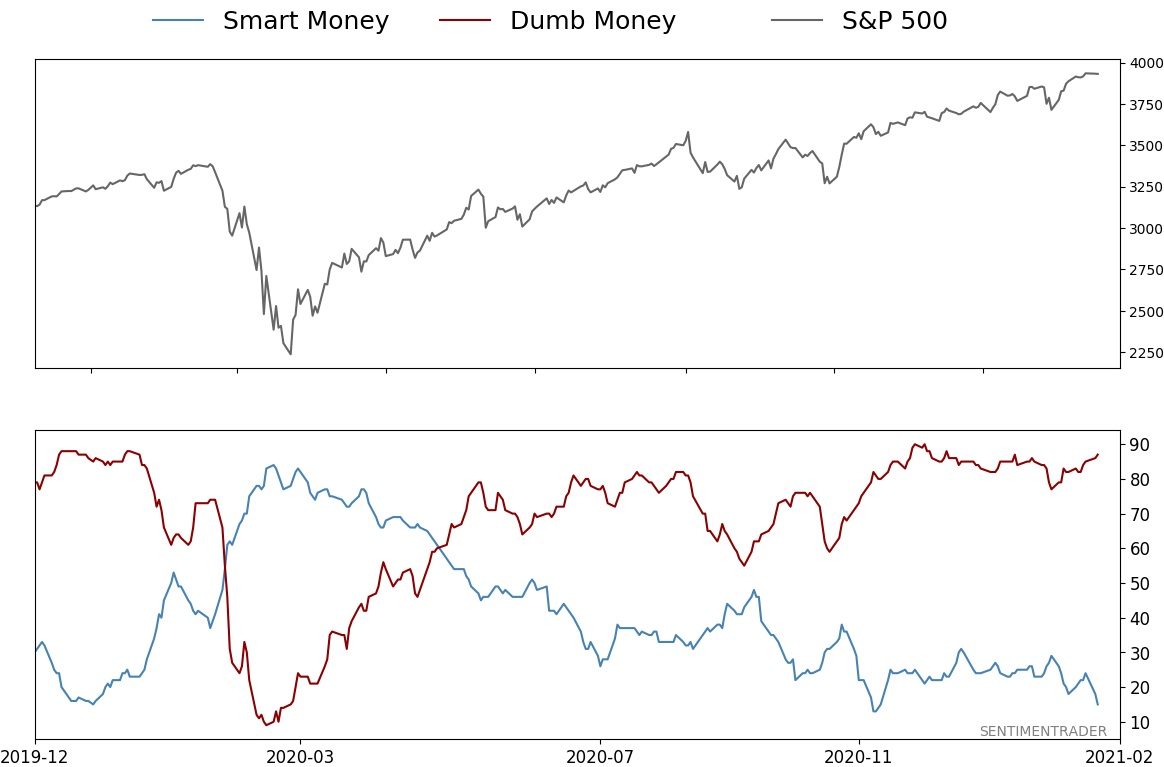
Smart / Dumb Money Confidence
|
Smart Money Confidence: 15%
Dumb Money Confidence: 87%
|
|
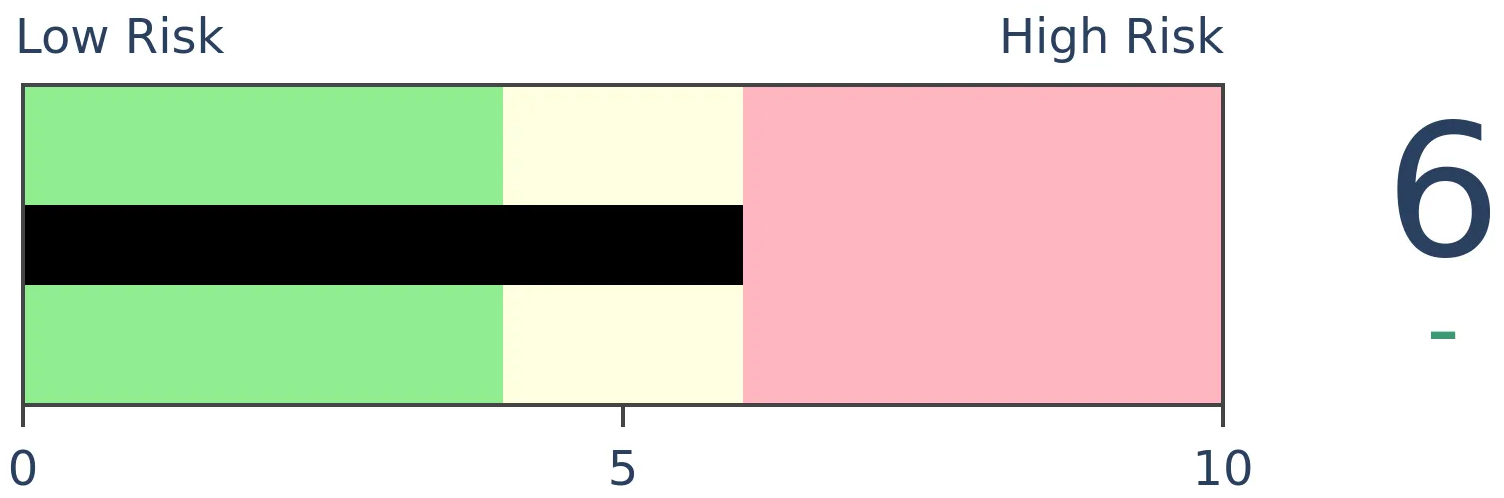
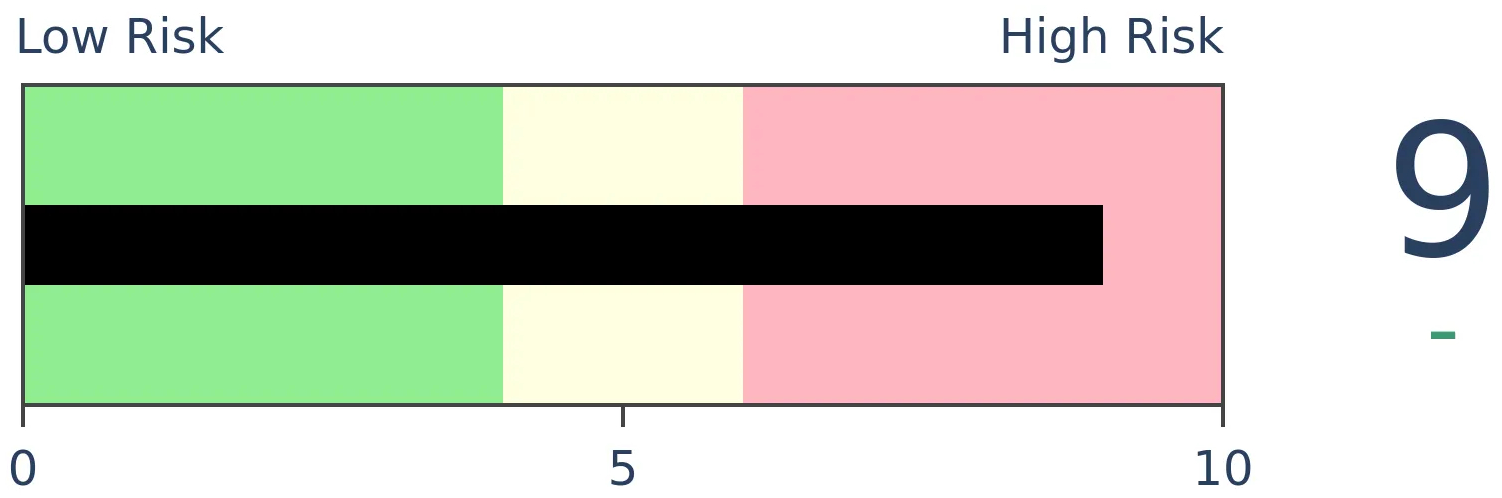
Risk Levels
Stocks Short-Term
|
Stocks Medium-Term
|
|
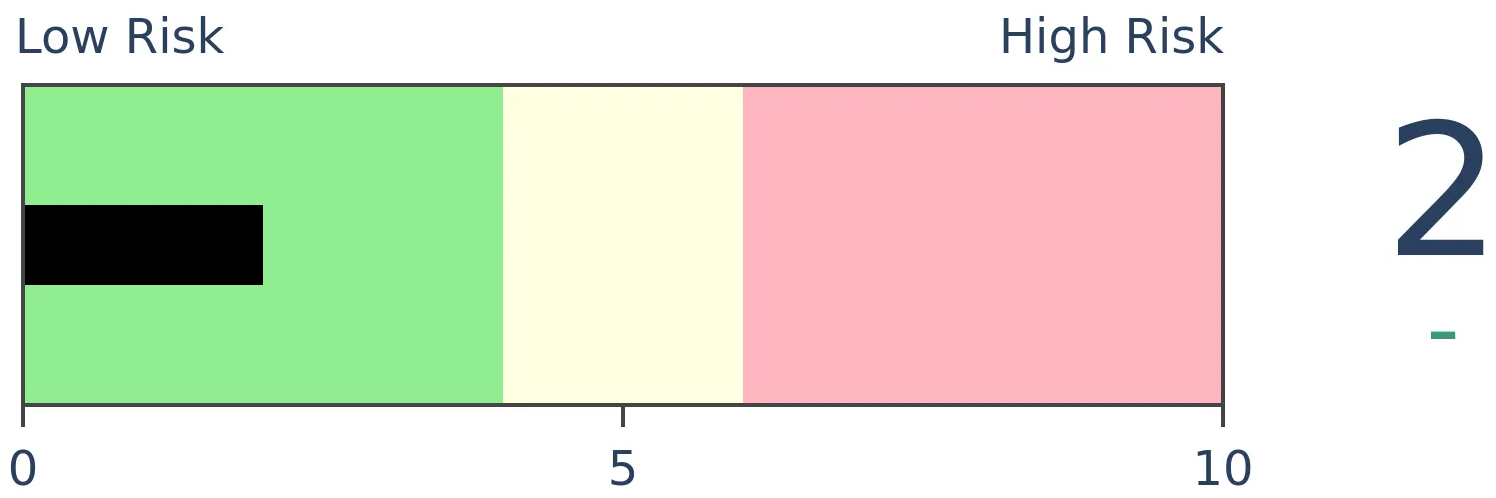
Bonds
|
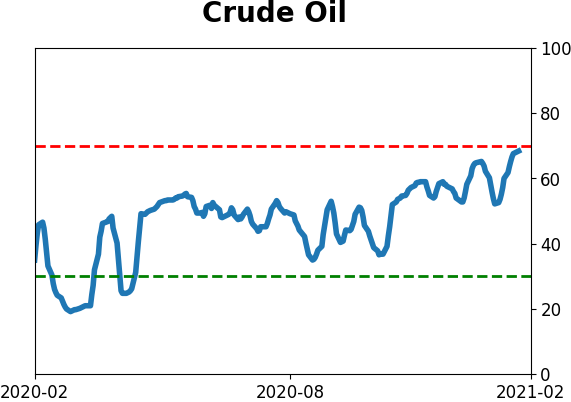
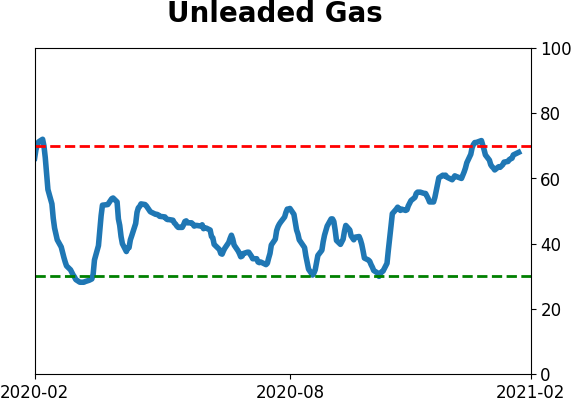
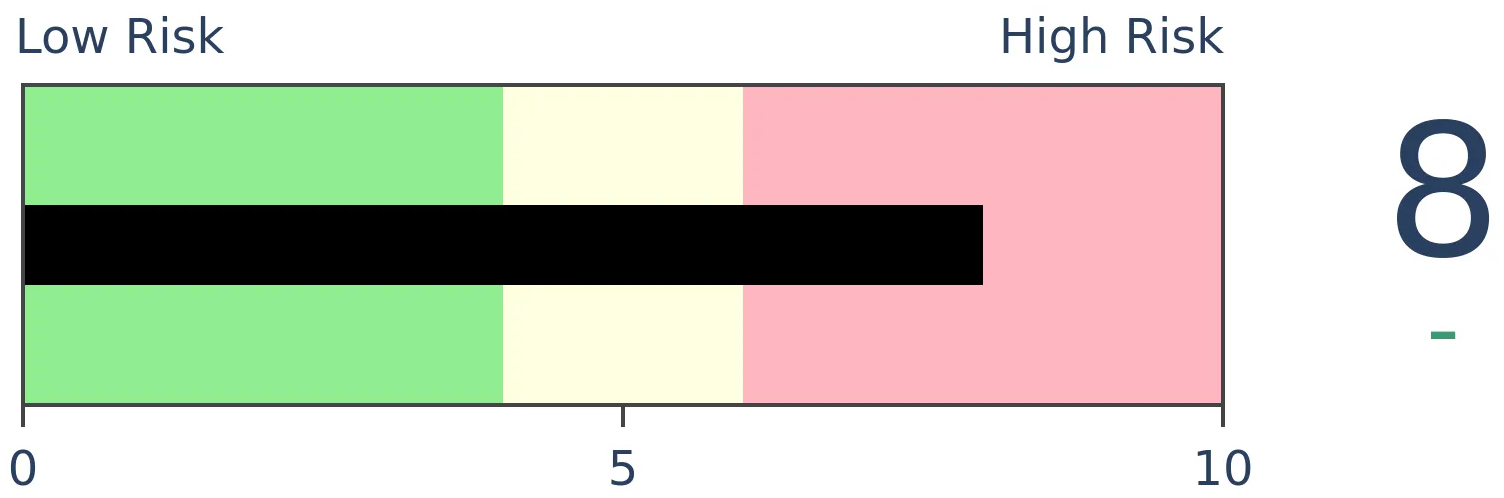
Crude Oil
|
|
Gold

|
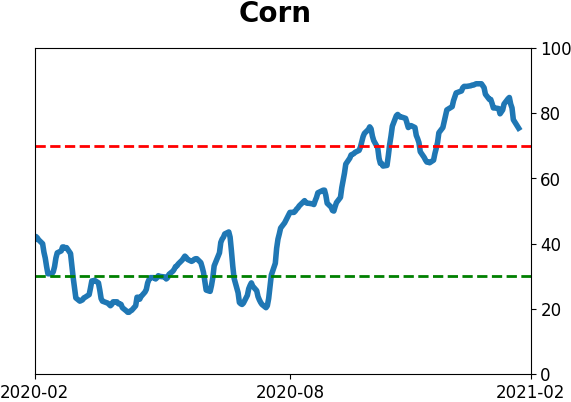
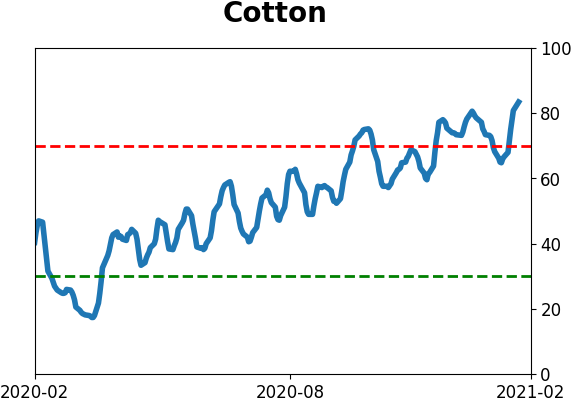
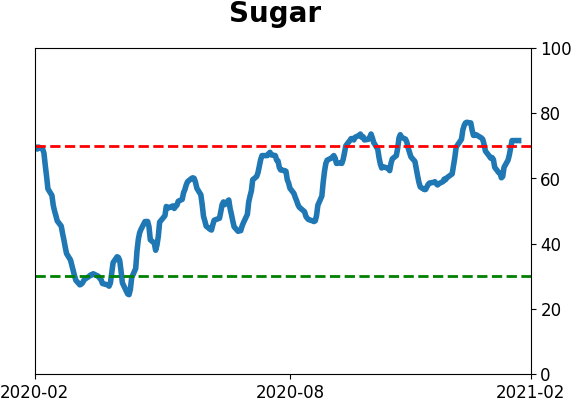
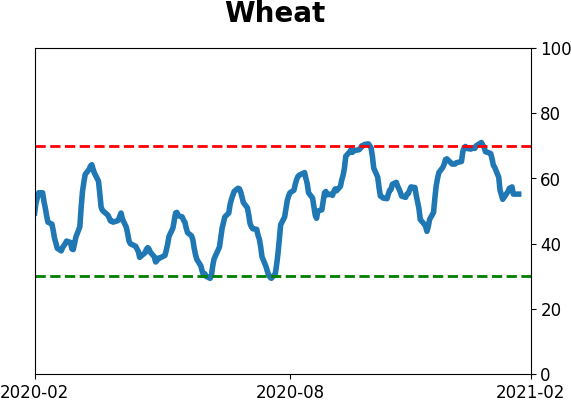
Agriculture

|
|
Research
BOTTOM LINE
The ratio of gold to platinum has plunged to the lowest level in years, even while stocks hold near their highs.
FORECAST / TIMEFRAME
None
|
Gold has had a tough 2021, even when measured against some other metals. So much so that the ratio of gold to platinum has plunged to its lowest level in years.
Marketwatch noted that this hasn't been a great sign for stocks.
Consider a 2019 academic study in the Journal of Financial Economics: It showed that a declining gold-platinum ratio forecasts lower stock market returns over the subsequent 12 months - not higher.
A 2016 research paper by Huang and Kilic points out that:
High [gold / platinum ratio] is associated with more negative risk-neutral skewness.
In other words, gold rises against platinum during times of economic distress, and options traders price in a higher probability of adverse outcomes.
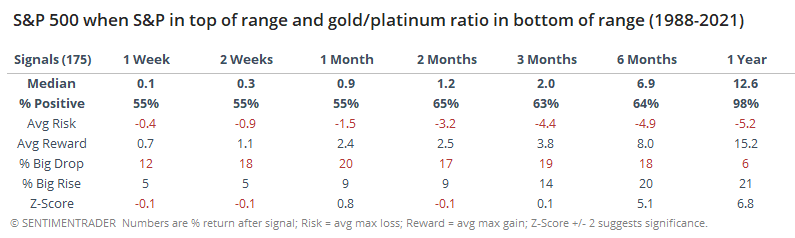
We can see the ratio below superimposed against the S&P 500. The red highlights show dates when the S&P 500 was at or near a 1-year high while the gold/platinum ratio was at or near a low.
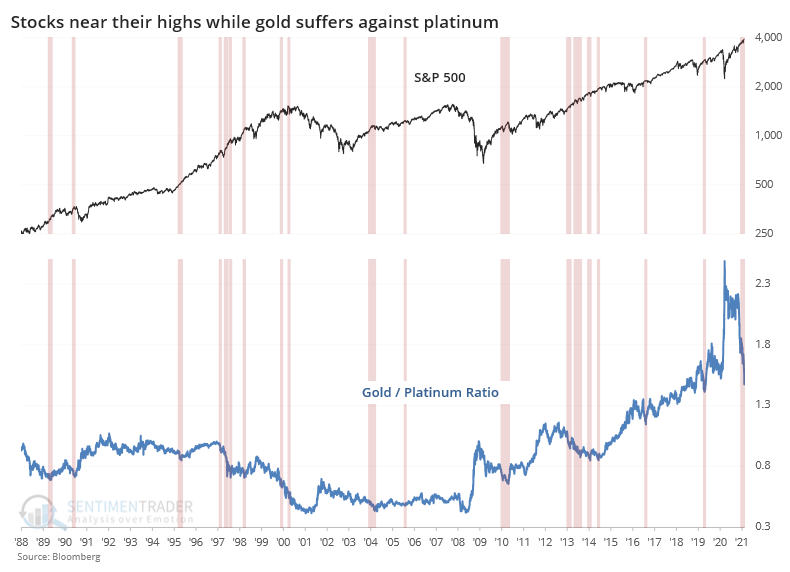
Out of 175 days that met these criteria, forward returns in the S&P were subpar but not consistently so, especially after the first couple of months. Up to 3 months later, risk was higher than reward, which is fairly unusual given the uptrend in stocks since 1988. So, there's a bit of support for the argument that this is negative, or at least "not positive," for stocks.
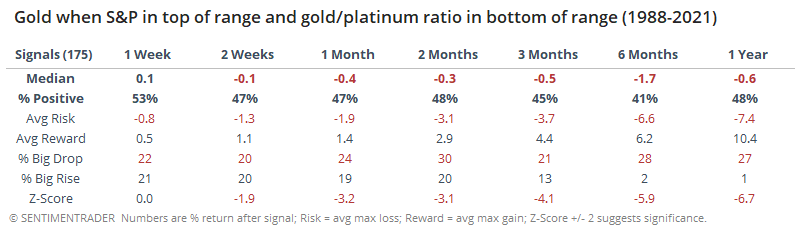
It wasn't a great sign for gold, despite the idea that it might indicate oversold conditions.
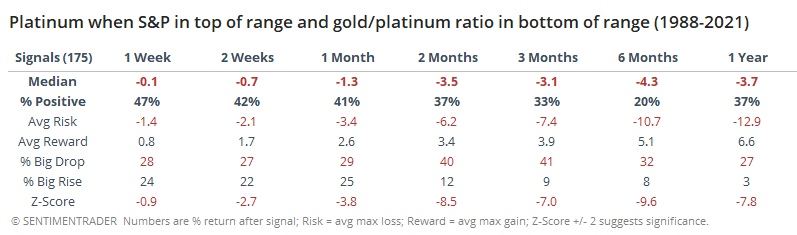
Curiously, it was an even worse sign for platinum.
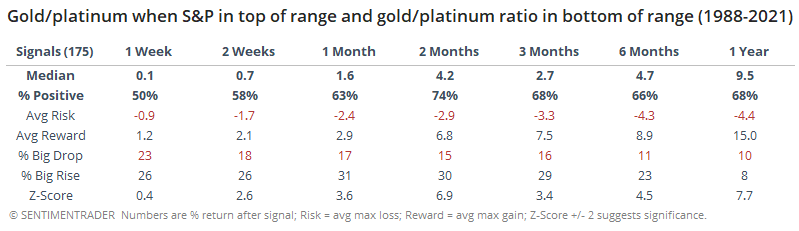
That means that between the two metals, forward returns favored gold over platinum. The ratio of gold to platinum rose over the next 2 months 74% of the time, with an abnormally positive average return.
These kinds of ratios often go in and out of fashion depending on their recent record. It's like intermarket relationships - they work great for a while, then don't. Most of them are too inconsistent to rely on, and we'd probably lump this mostly into that category. If anything, it might be a bit of a positive for gold over platinum, and kinda-sorta a shorter-term negative for stocks, but we wouldn't put too much weight on it beyond that.
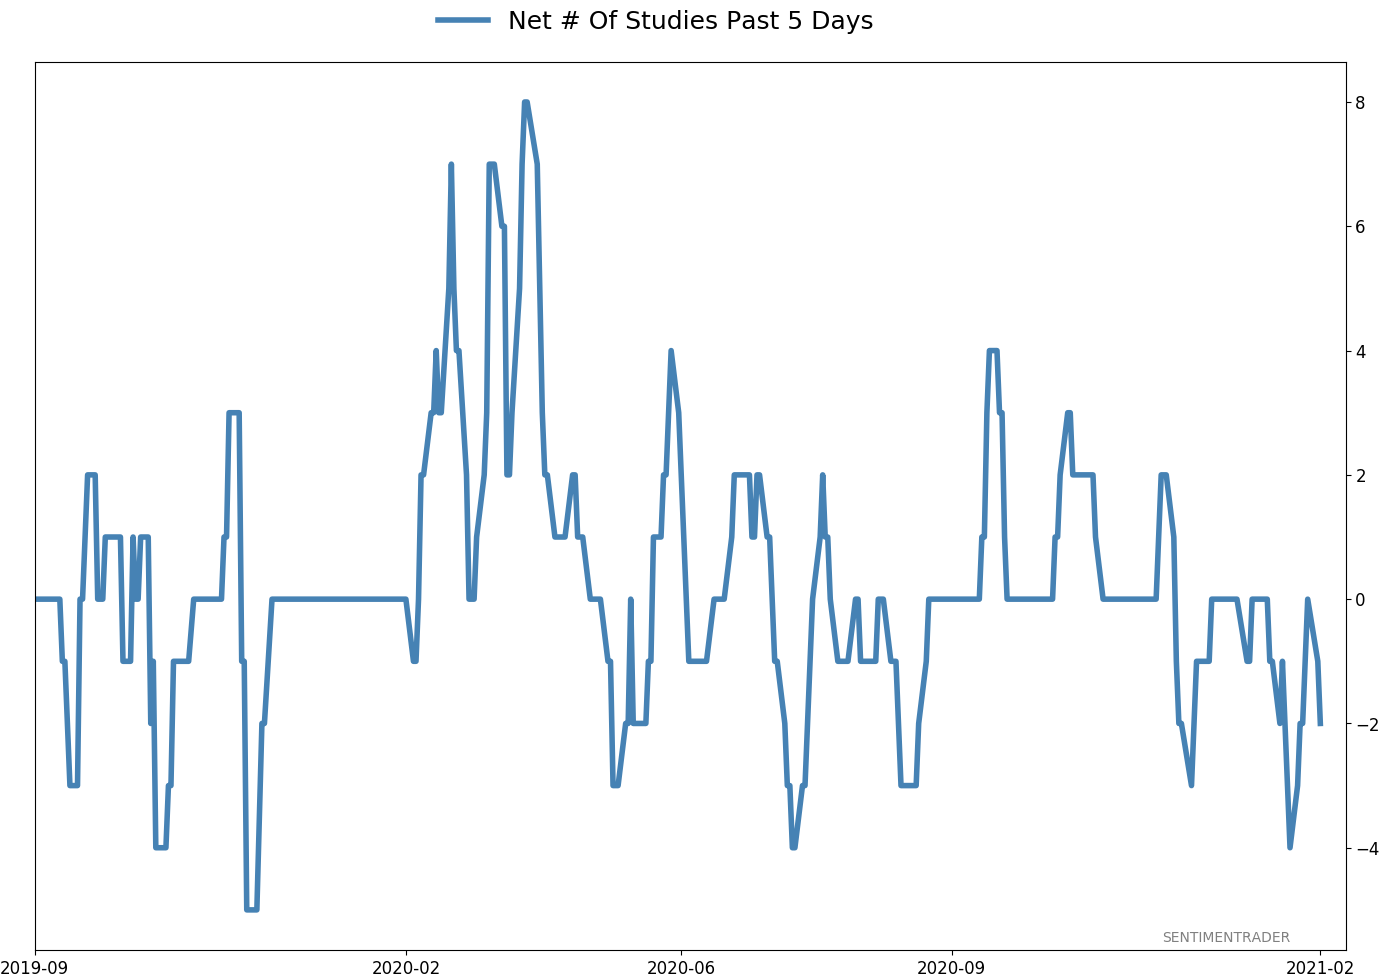
Active Studies
| Time Frame | Bullish | Bearish | | Short-Term | 0 | 0 | | Medium-Term | 2 | 8 | | Long-Term | 16 | 3 |
|
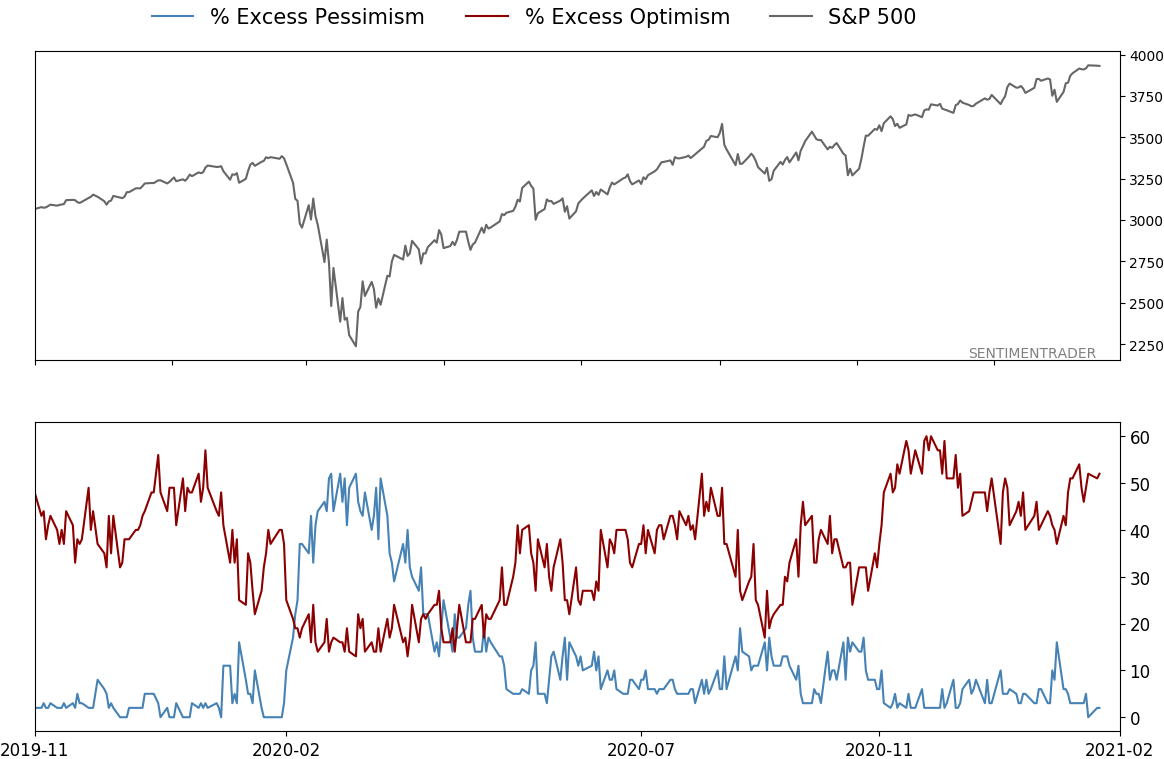
Indicators at Extremes
% Showing Pessimism: 2%
Bullish for Stocks
VIX
|
|
Portfolio
| Position | Description | Weight % | Added / Reduced | Date | | Stocks | RSP | 4.9 | Reduced 4% | 2021-02-09 | | Bonds | 10% BND, 8.9% SCHP, 4.8% ANGL | 23.7 | Reduced 4% | 2021-02-09 | | Commodities | GCC | 2.3 | Reduced 2.1%
| 2020-09-04 | | Precious Metals | GDX | 8.9 | Added 4.8% | 2020-12-01 | | Special Situations | 9.6% XLE, 8.2% PSCE | 17.8 | Reduced 1.5% | 2021-02-09 | | Cash | | 42.8 | | |
|
Updates (Changes made today are underlined)
With a market that has seen the kinds of broad participation and big breath thrusts like we did in the fall, it's hard to become too negative. Those kinds of conditions have consistently preceded higher returns over the next 6-12 months. It's the interim that's more of an issue. Even conditions like that haven't prevented some shorter-term pullbacks. And when we combine an environment where speculation is rampant and recent days have seen an increase in cracks under the surface of the indexes, it's enough to become more defensive over a short- to medium-term time frame. We still don't have much confirmation from the price action in the indexes, so those who are more conservative would likely wait before increasing cash levels. Not much has changed, but I'm getting increasingly anxious and prefer to hold cash over riskier assets so I increased the cash cushion. RETURN YTD: 6.0% 2020: 8.1%, 2019: 12.6%, 2018: 0.6%, 2017: 3.8%, 2016: 17.1%, 2015: 9.2%, 2014: 14.5%, 2013: 2.2%, 2012: 10.8%, 2011: 16.5%, 2010: 15.3%, 2009: 23.9%, 2008: 16.2%, 2007: 7.8%
|
|
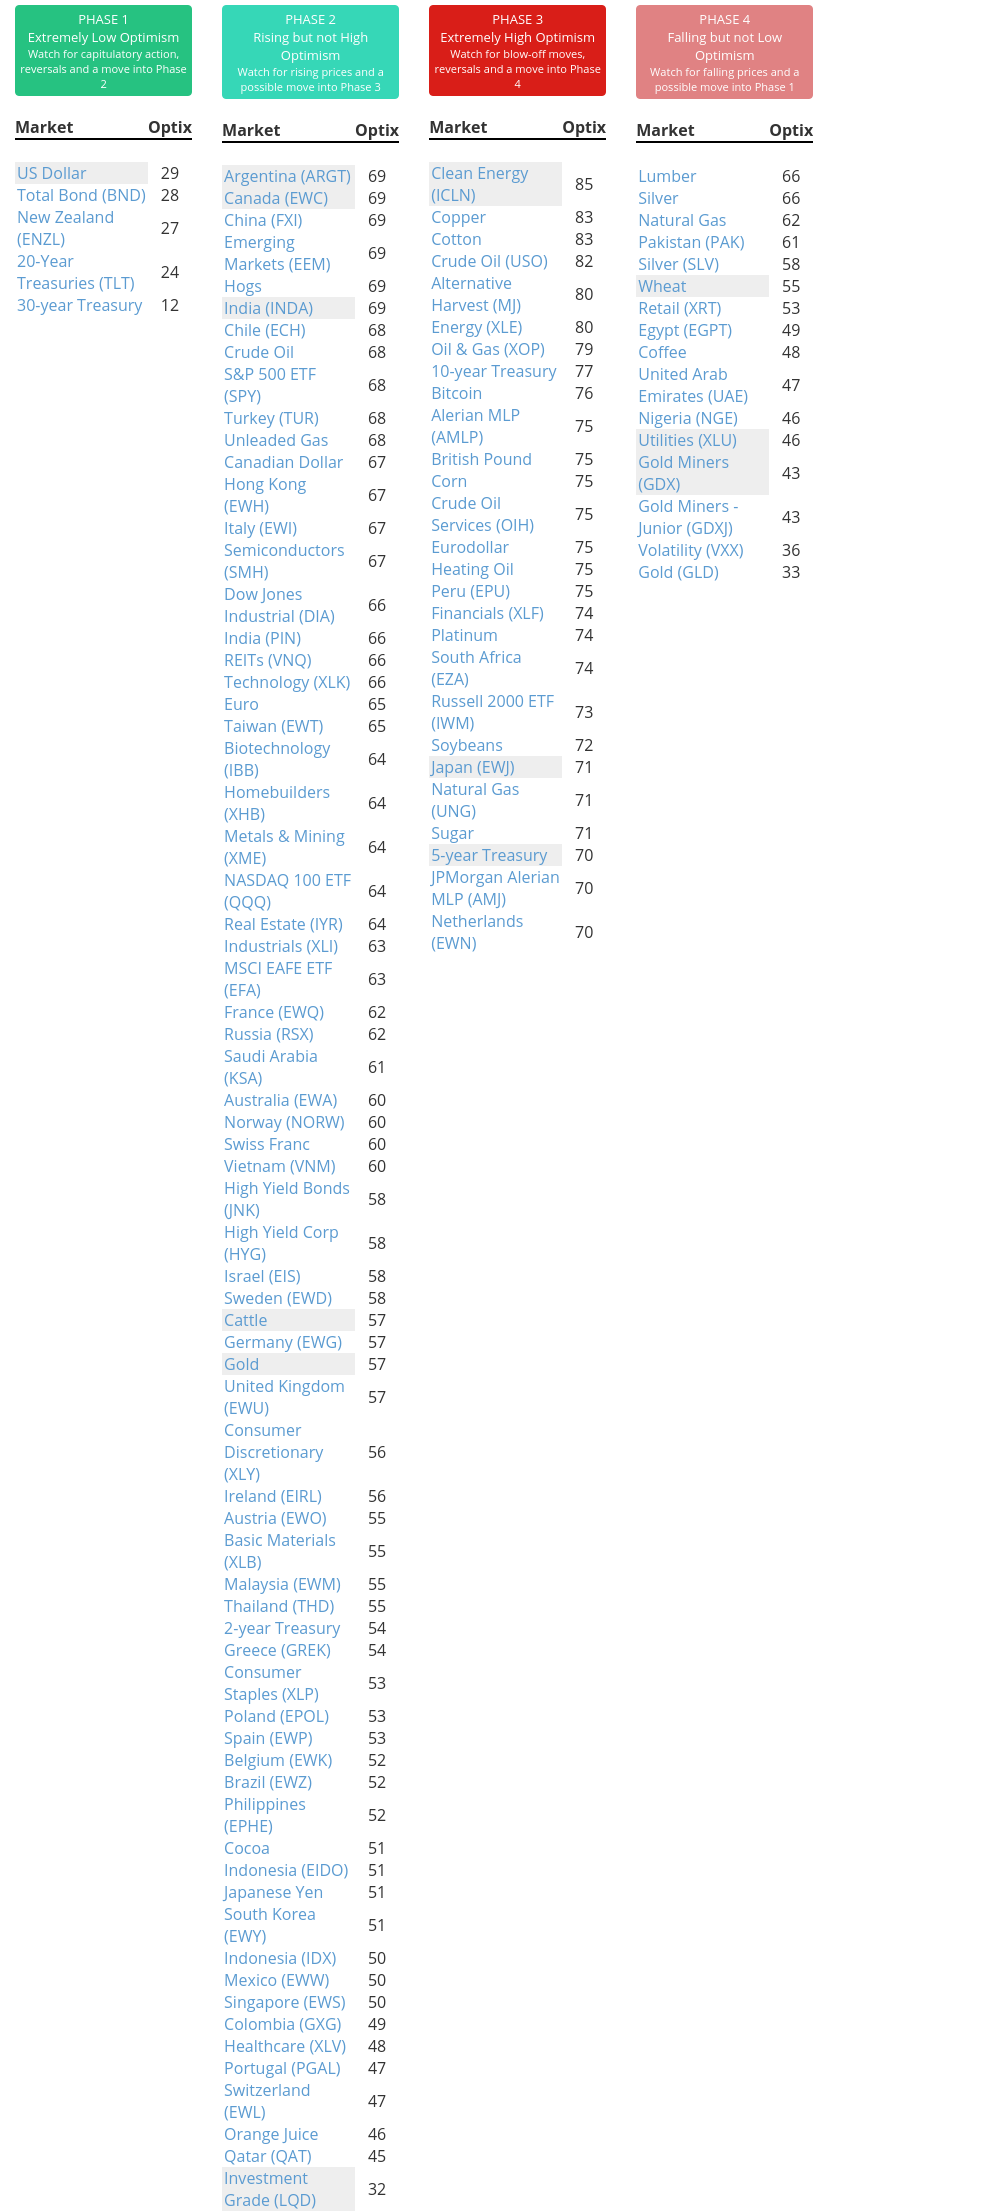
Phase Table
Ranks
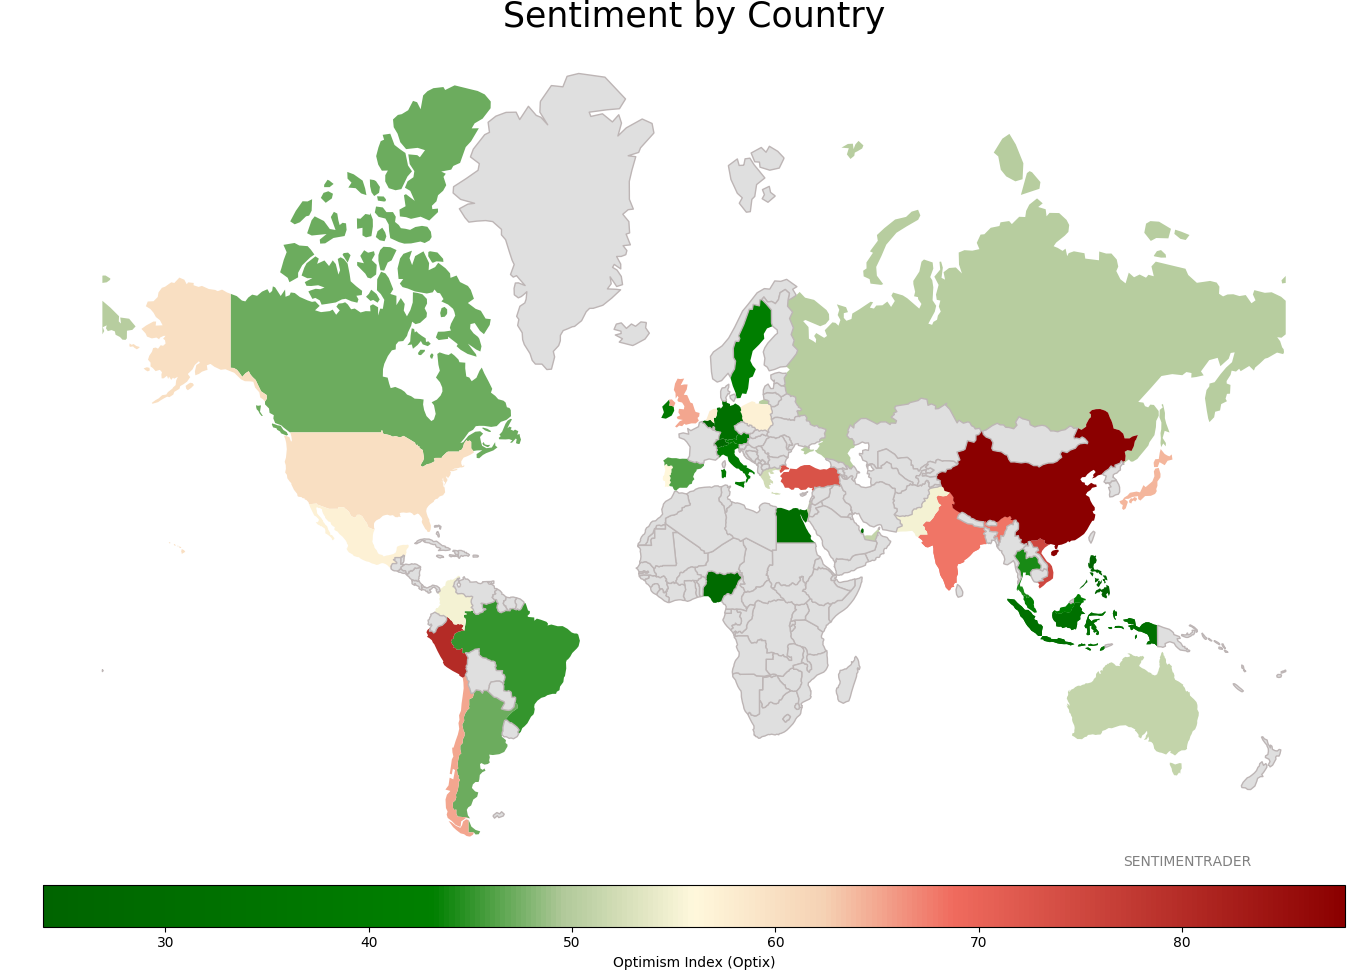
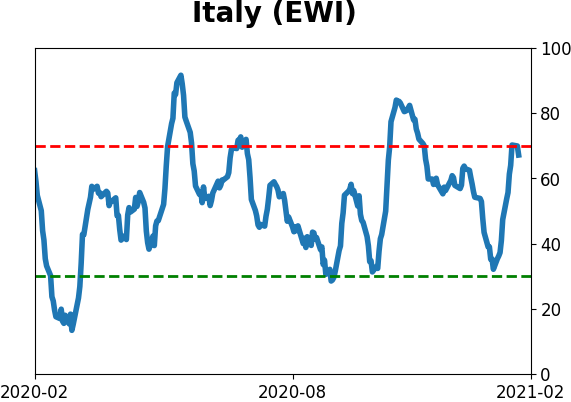
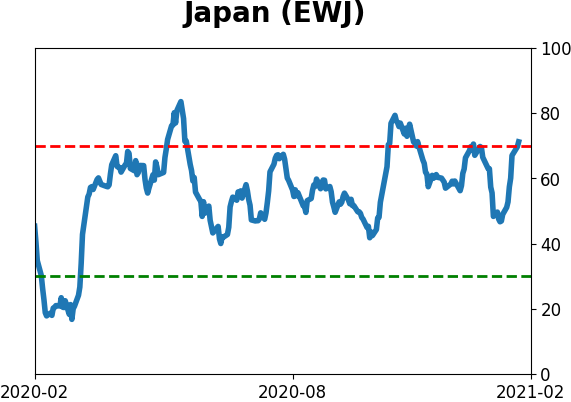
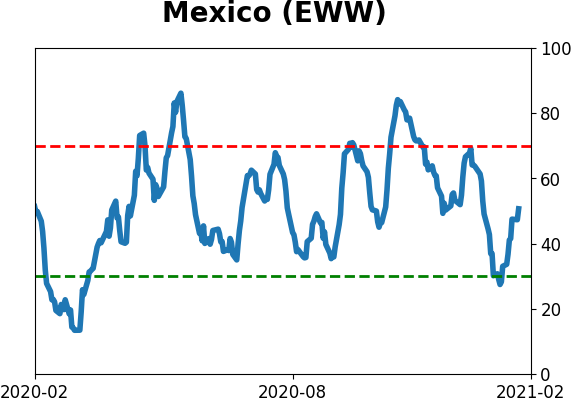
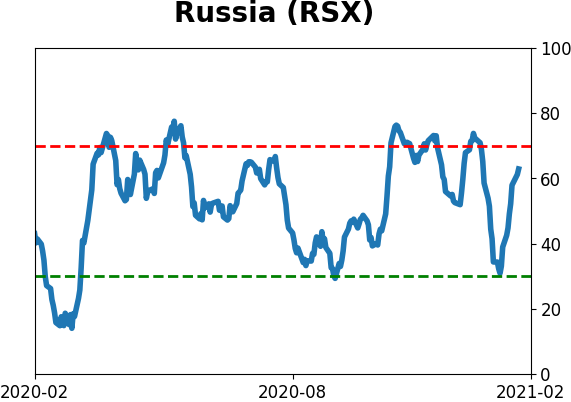
Sentiment Around The World
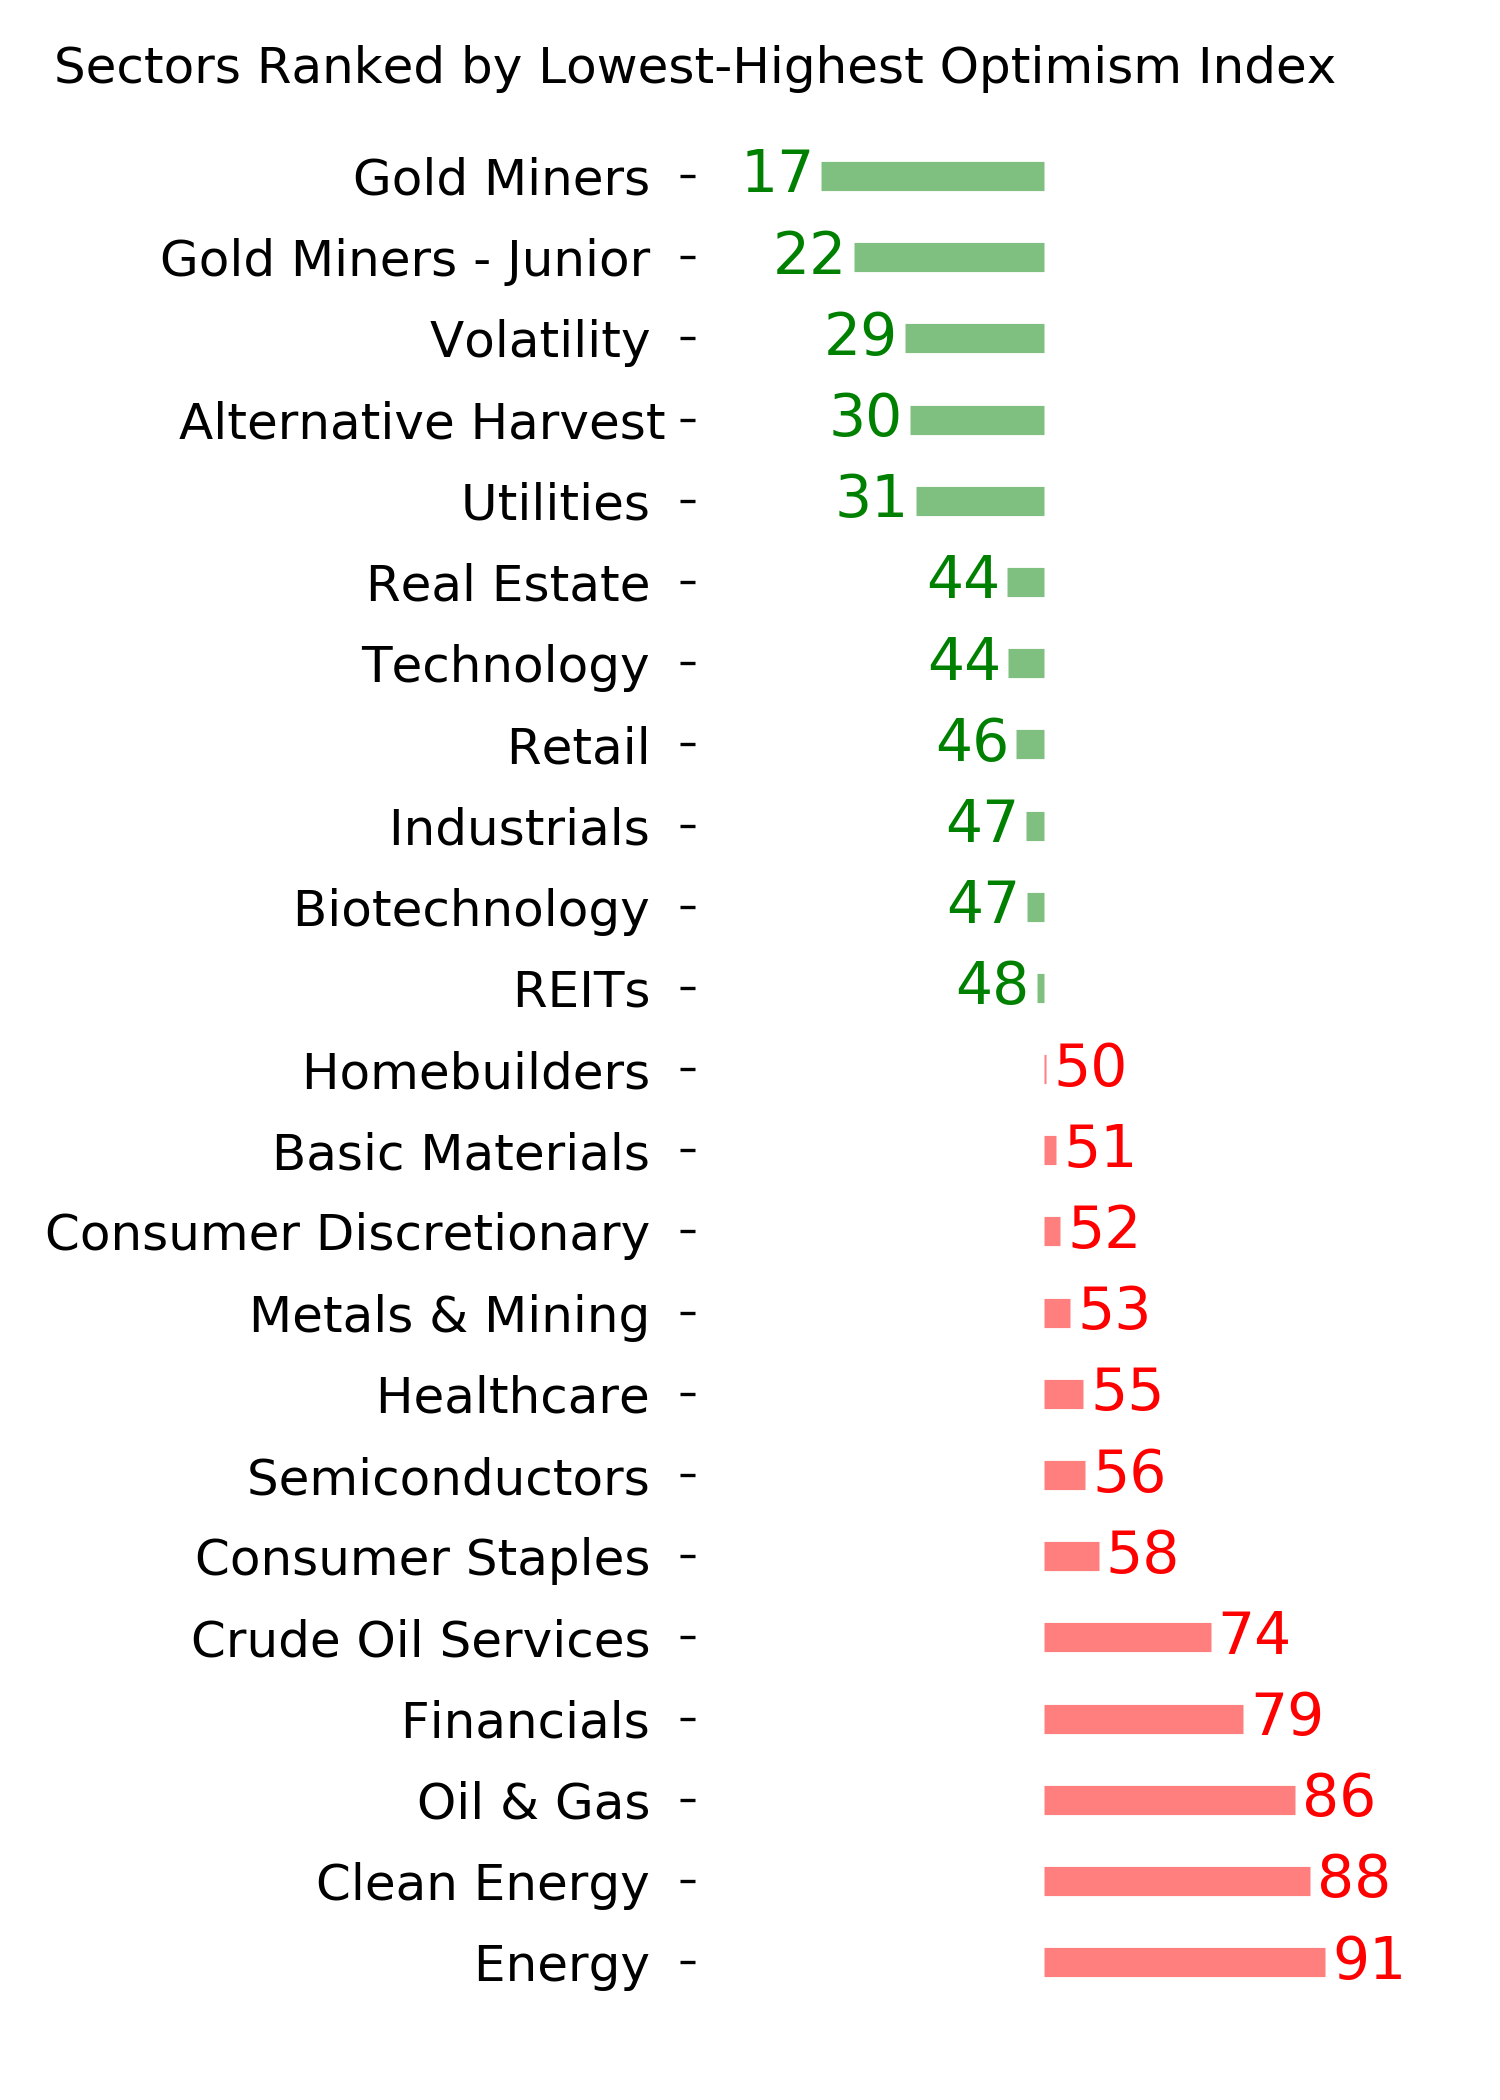
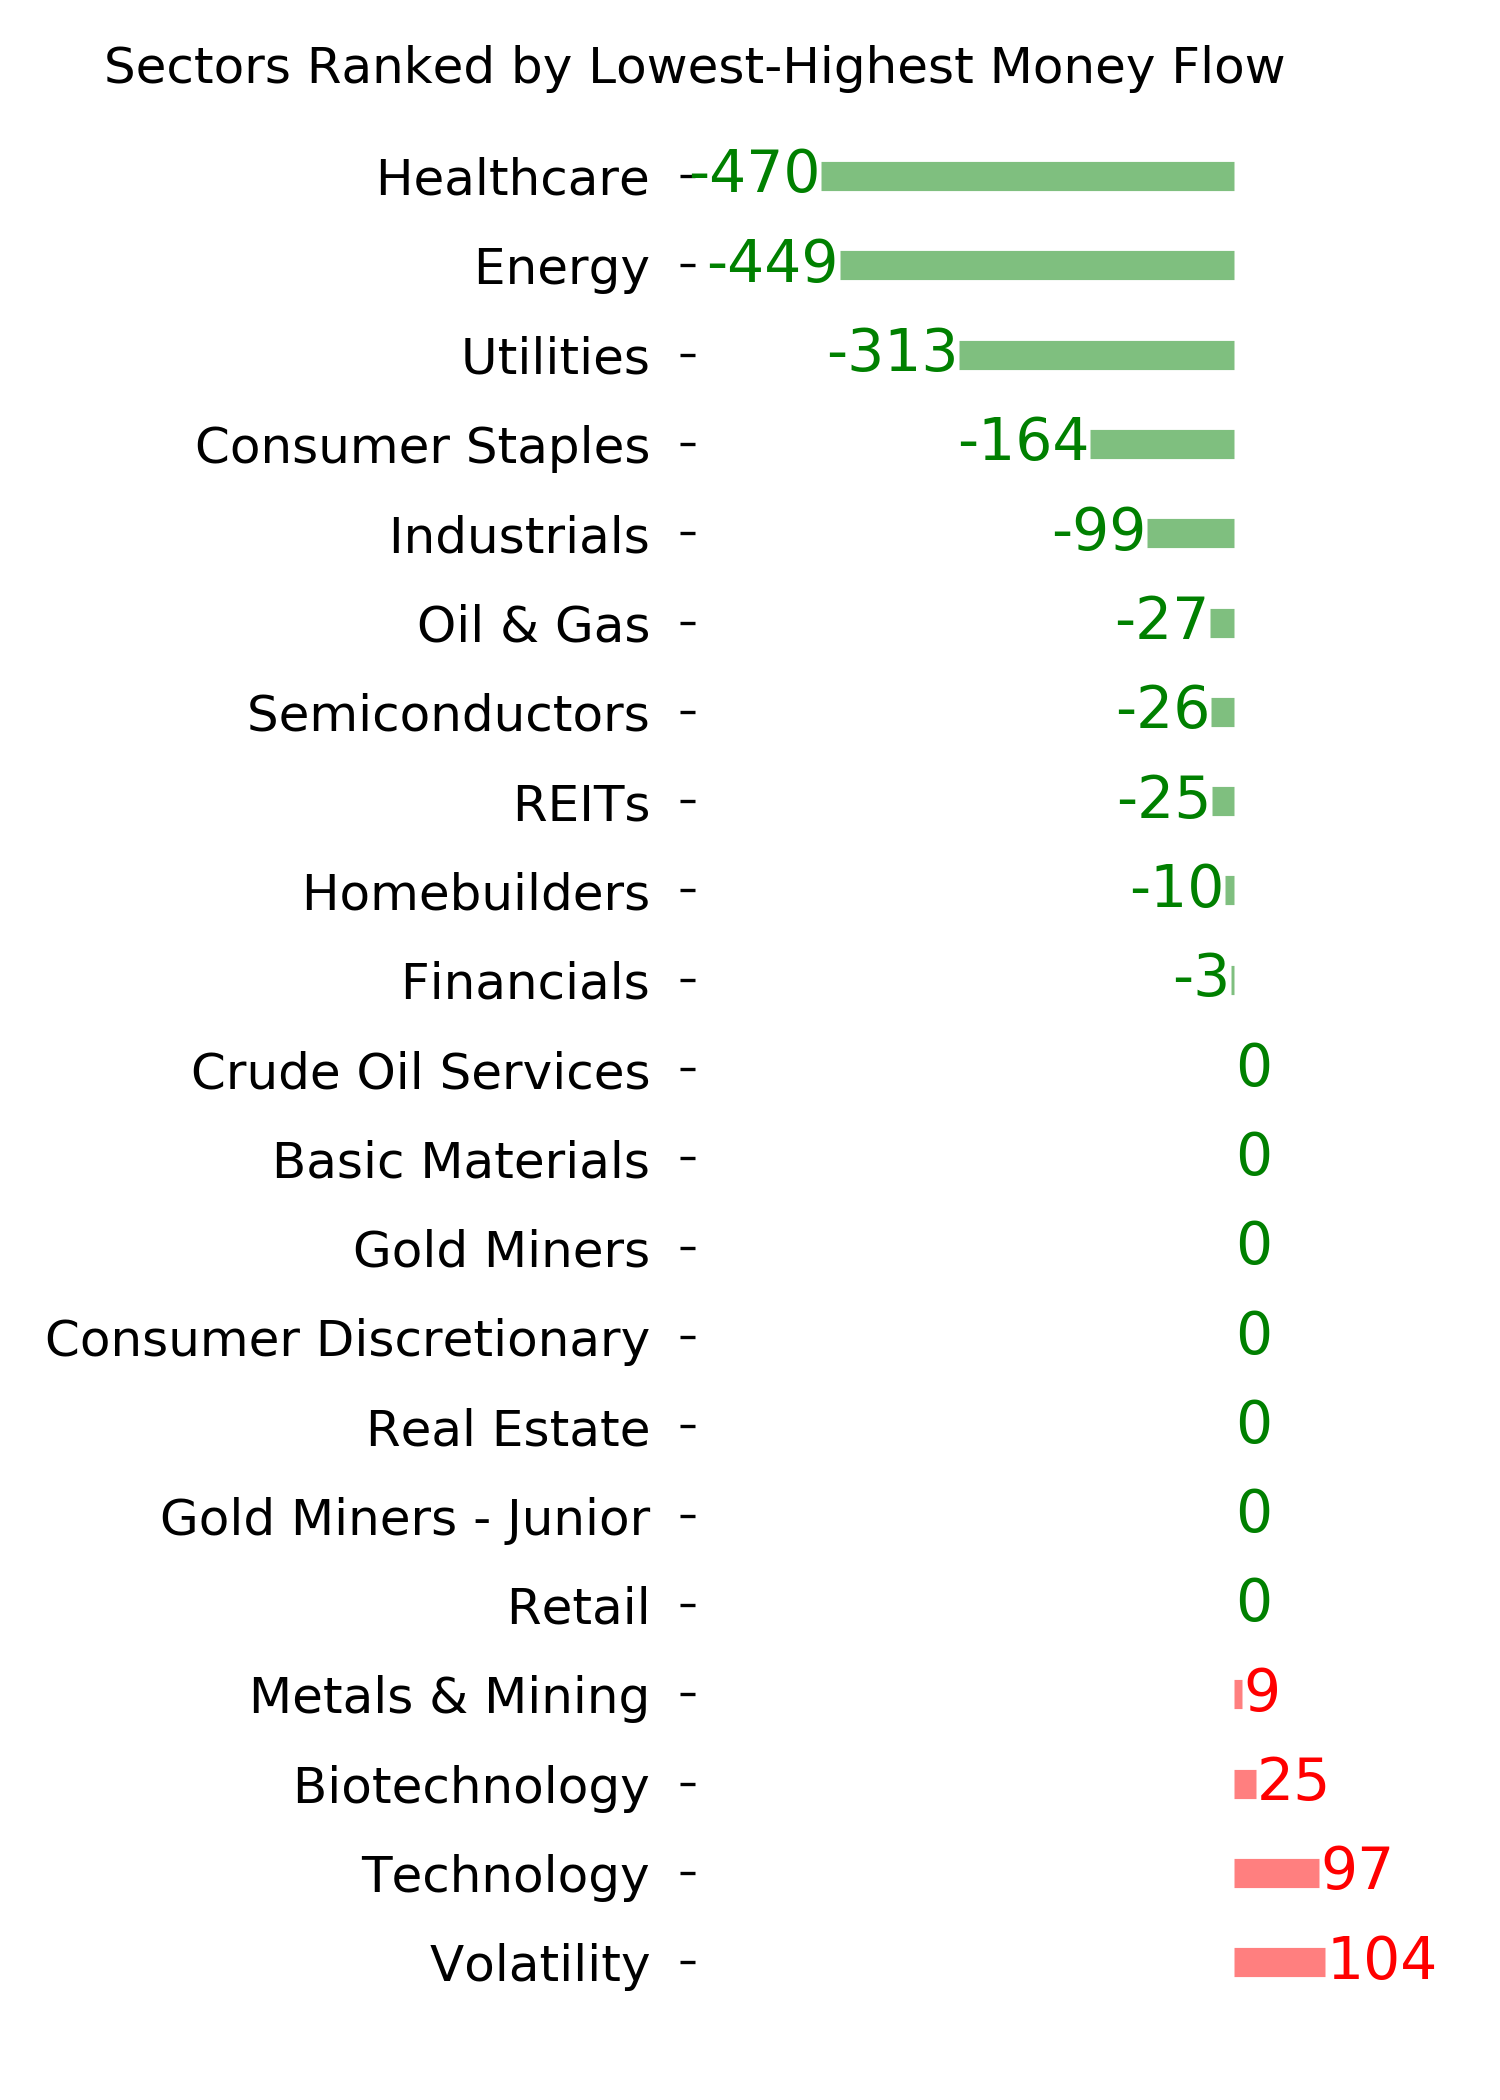
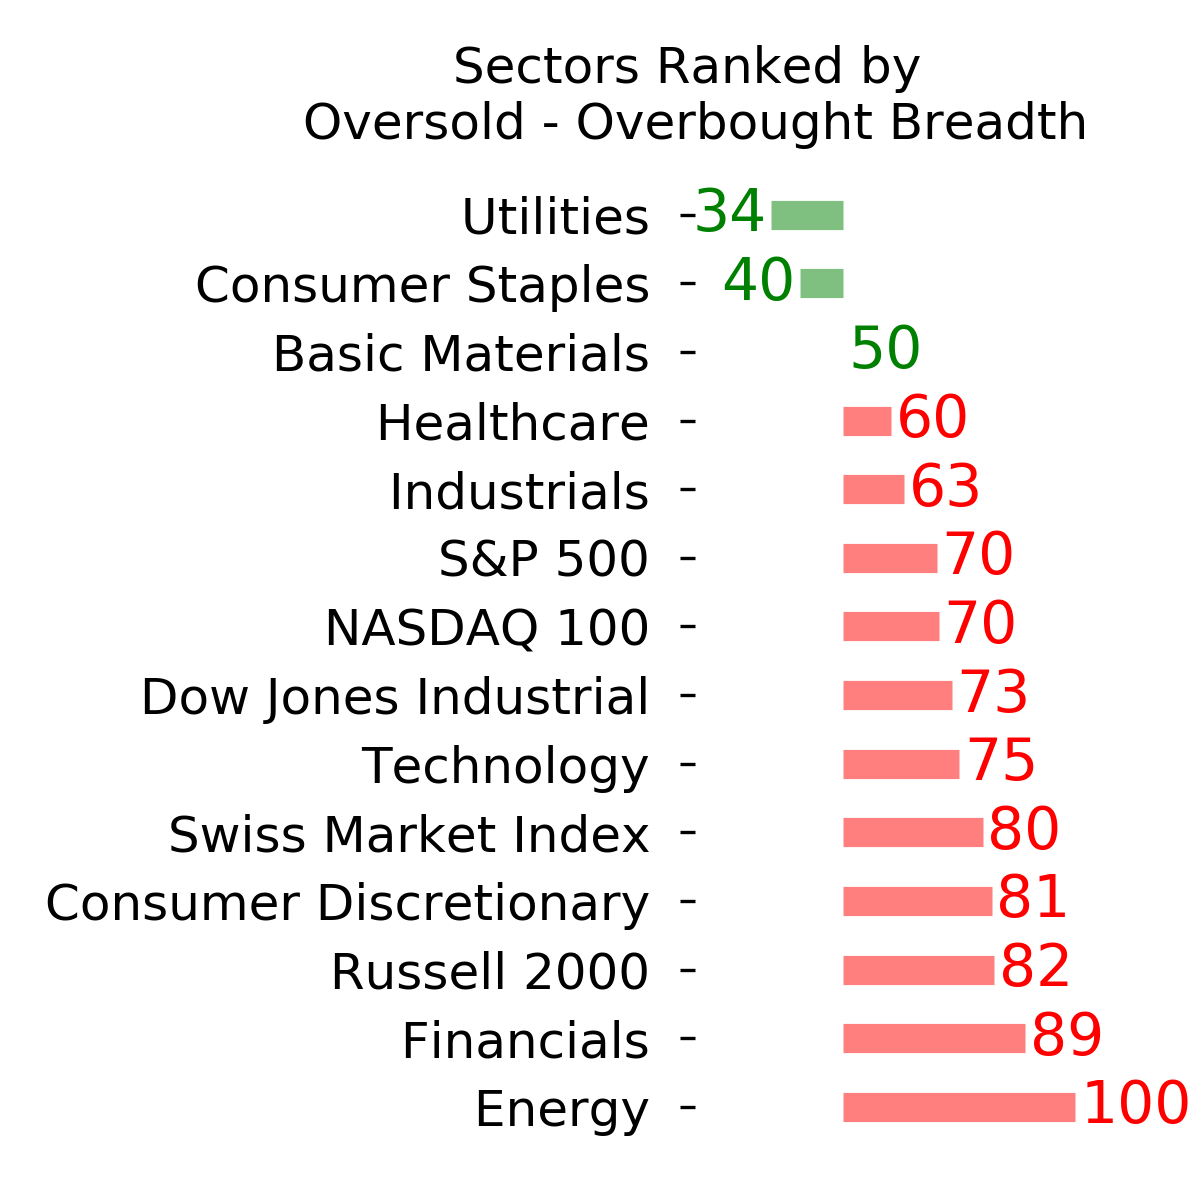
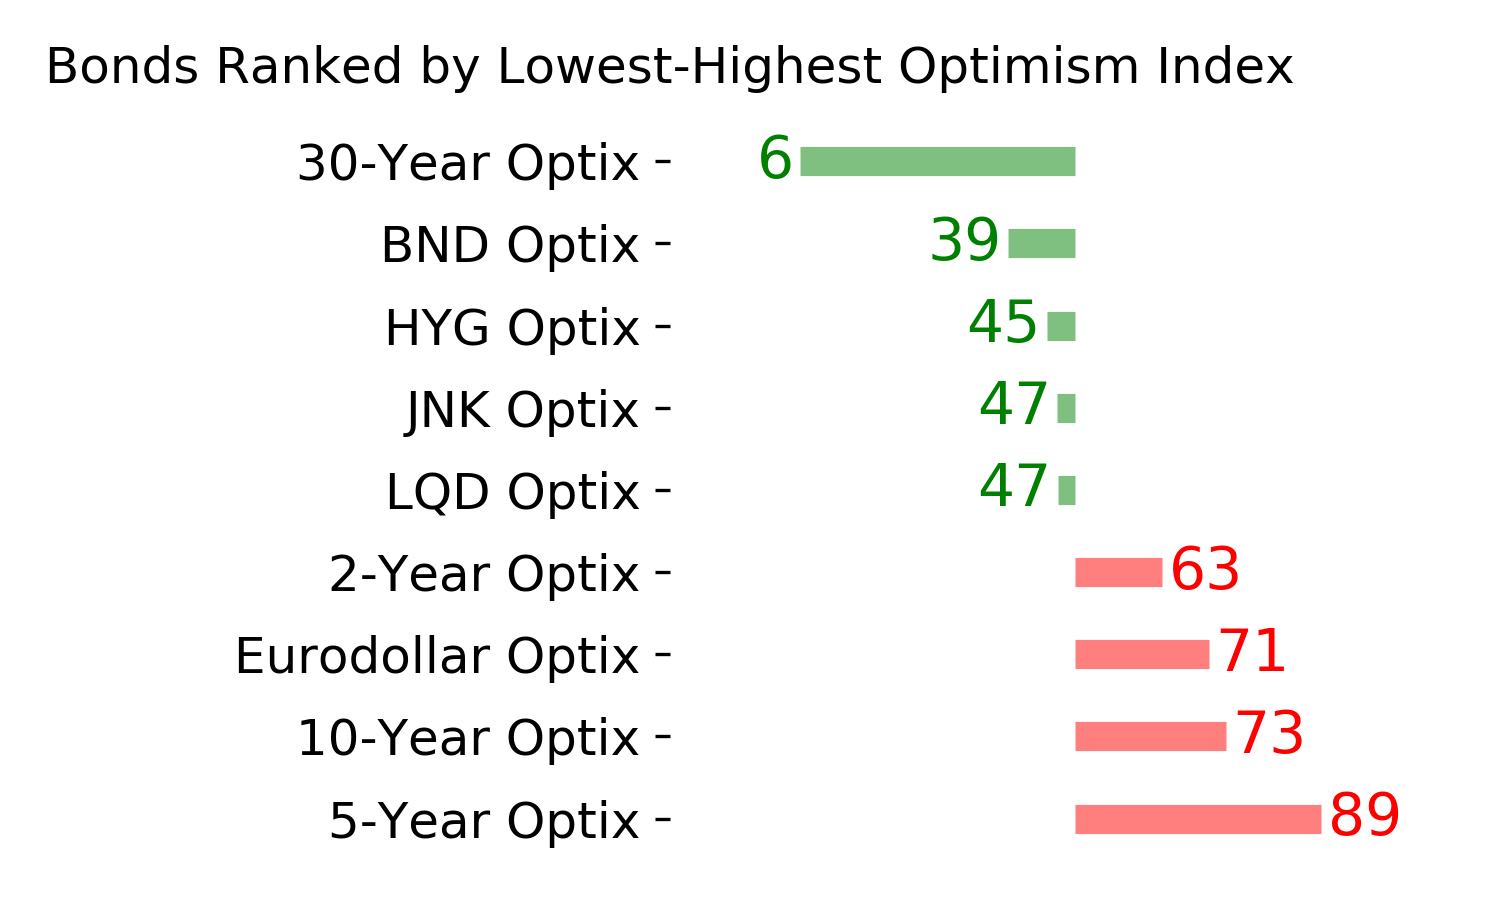
Optimism Index Thumbnails
|
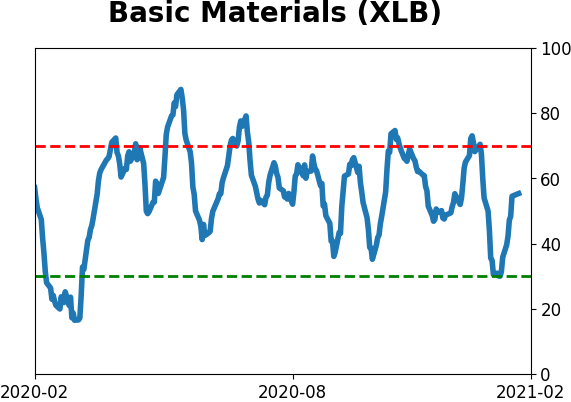
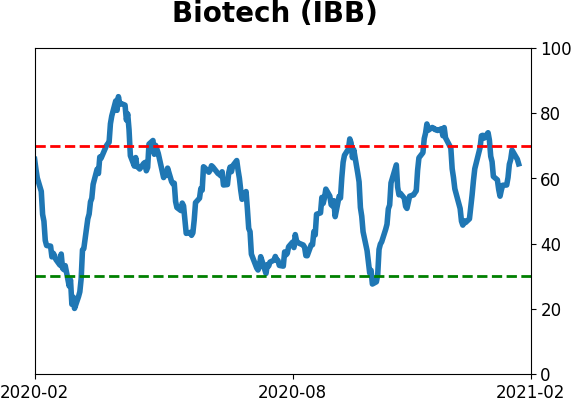
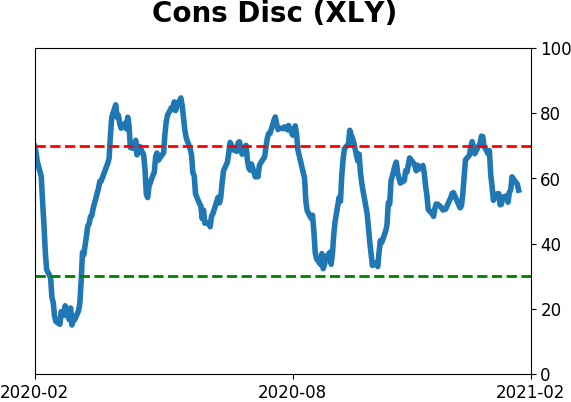
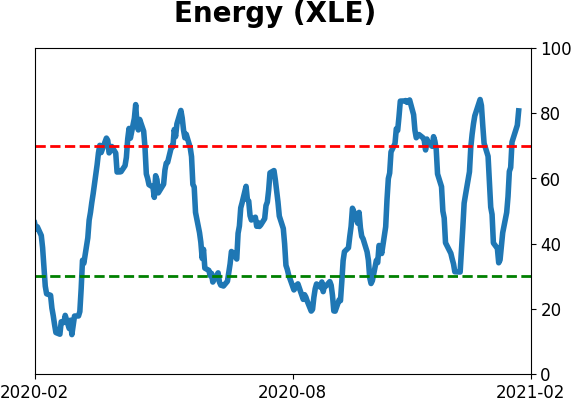
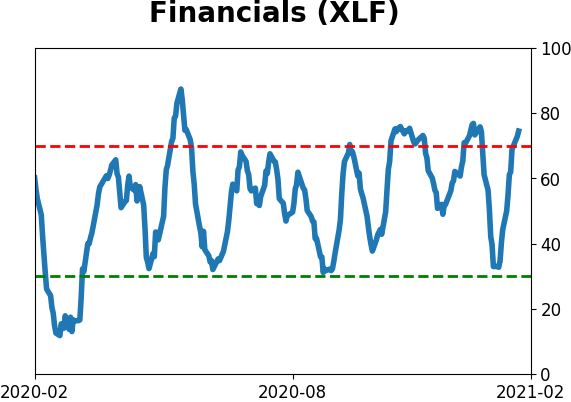
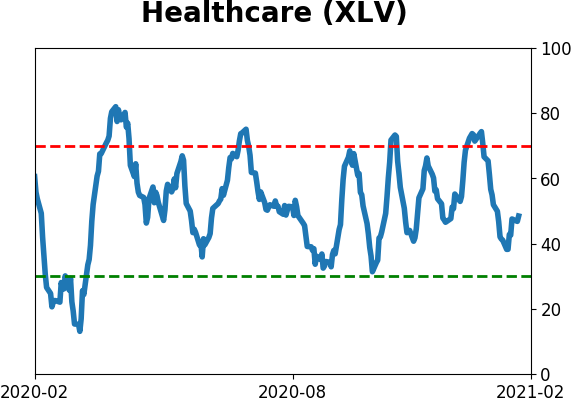
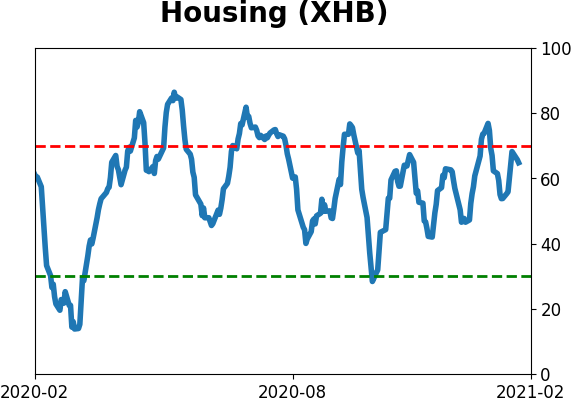
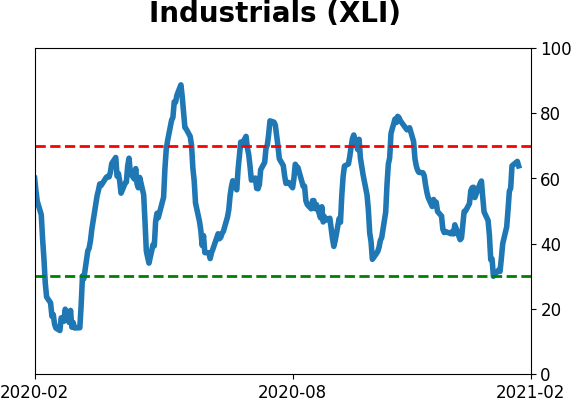
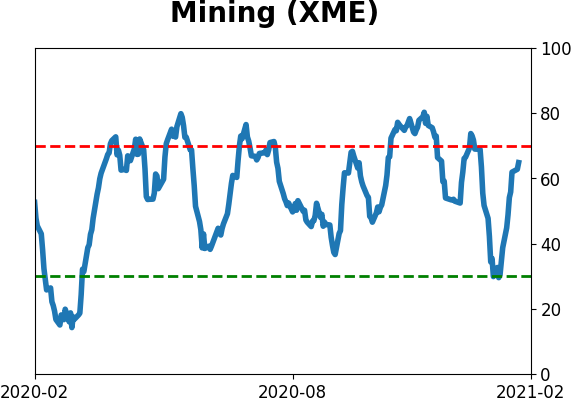
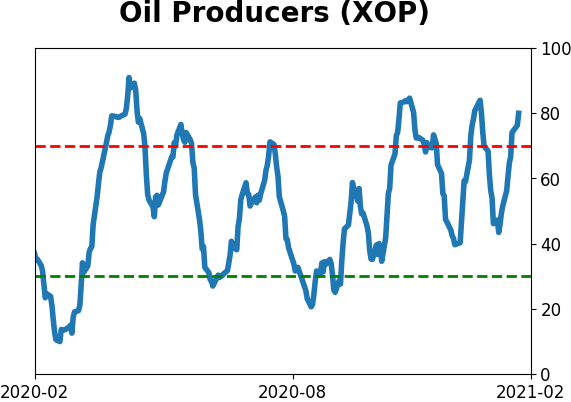
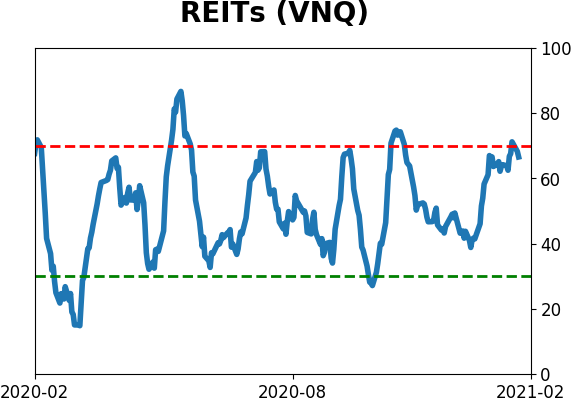
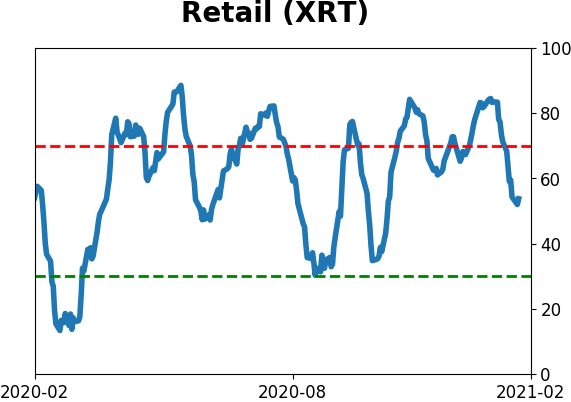
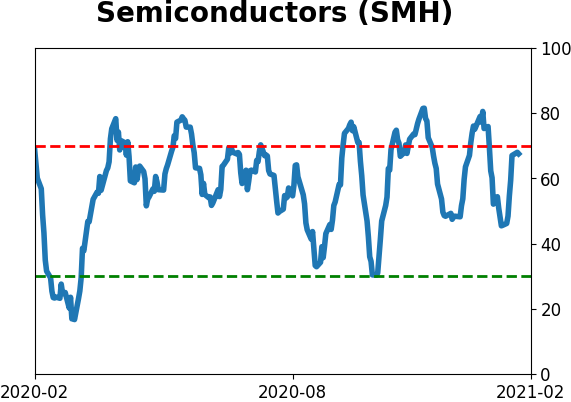
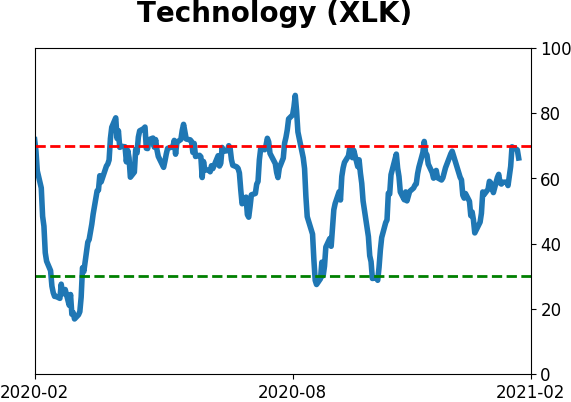
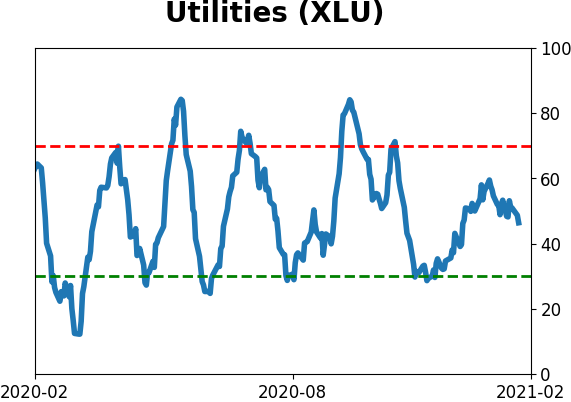
Sector ETF's - 10-Day Moving Average
|
|
|
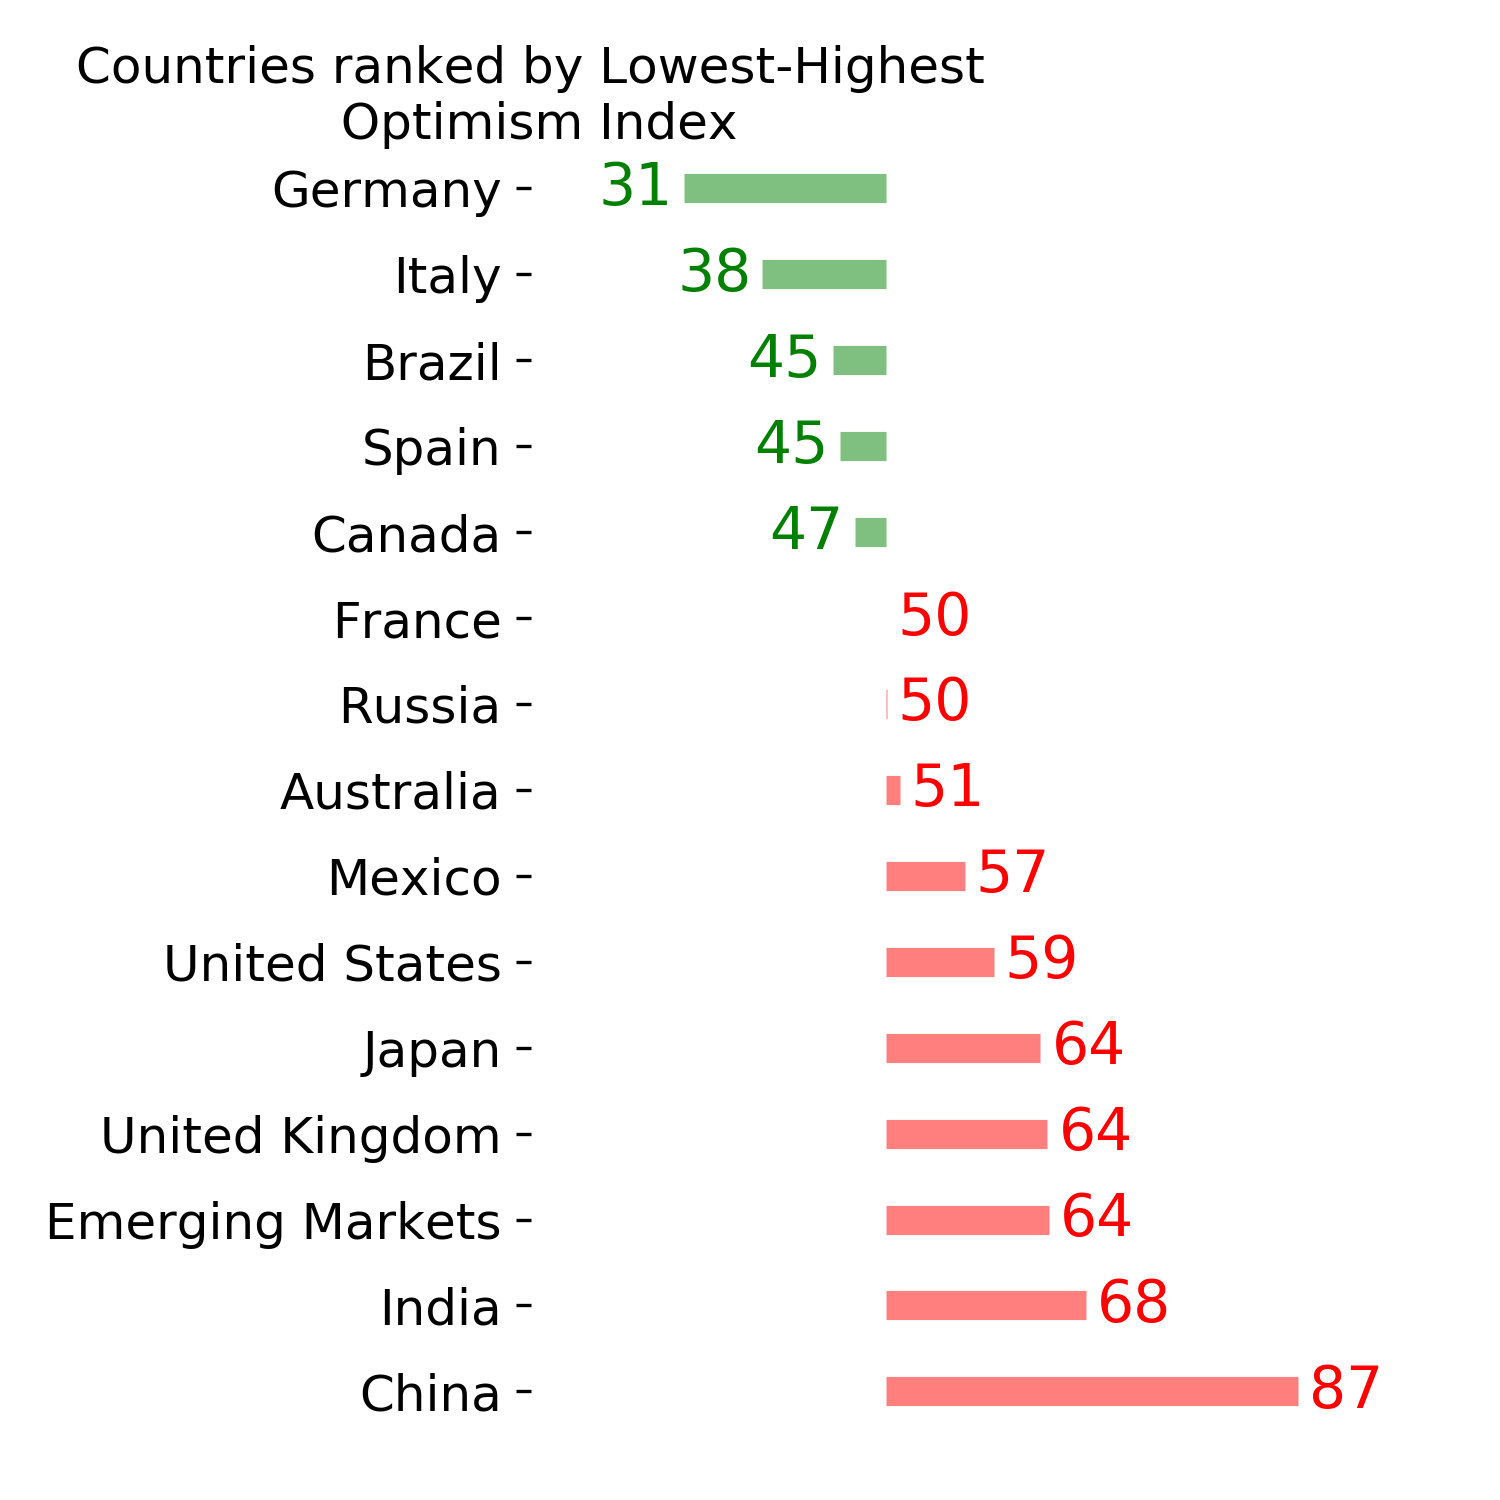
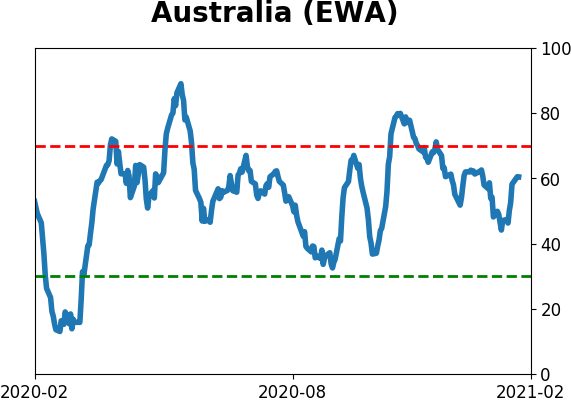
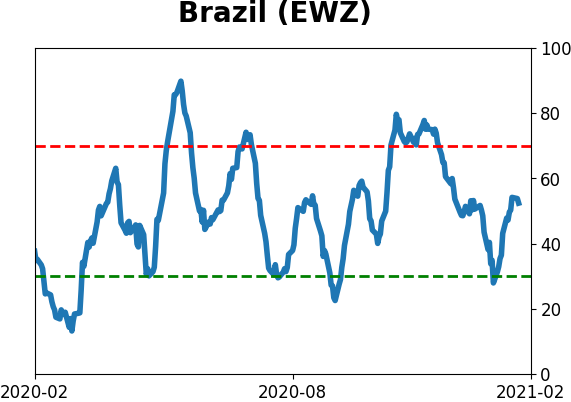
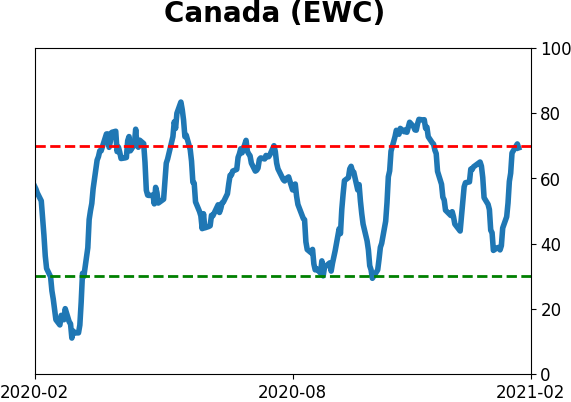
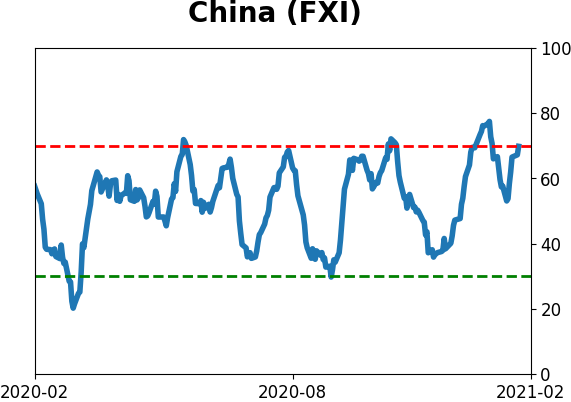
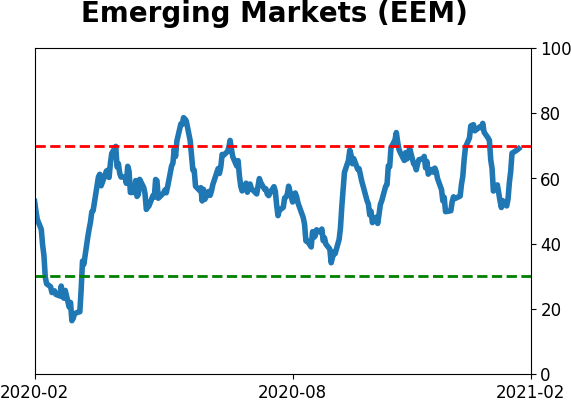
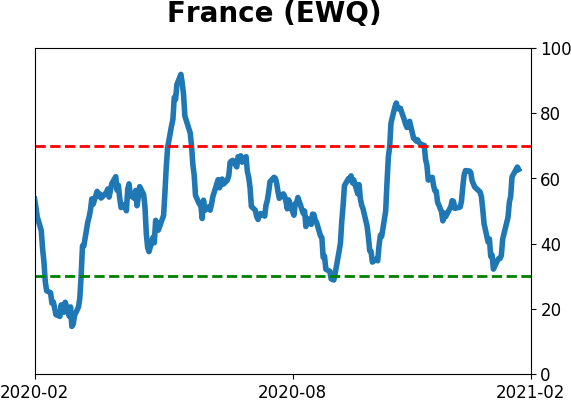
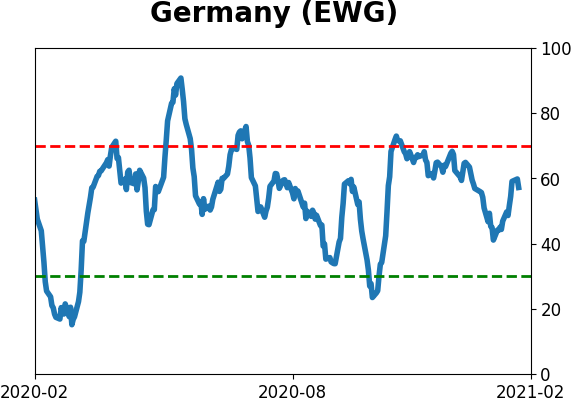
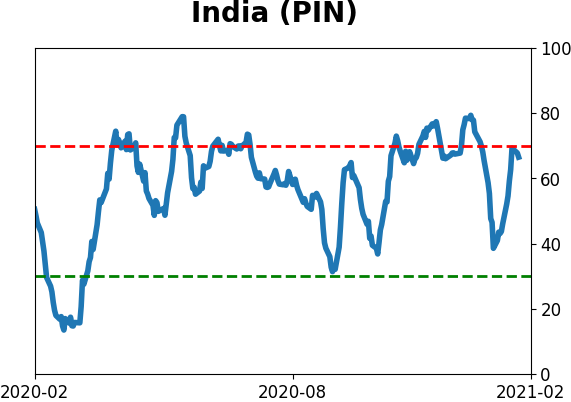
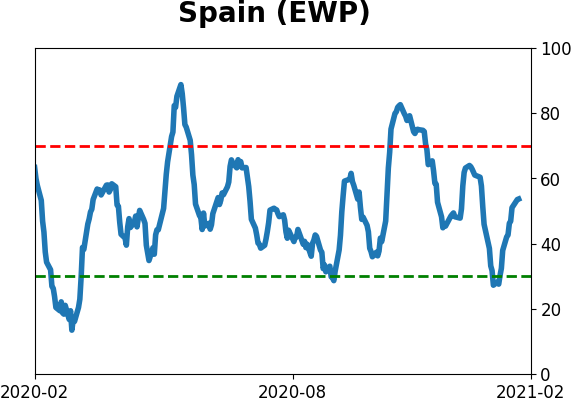
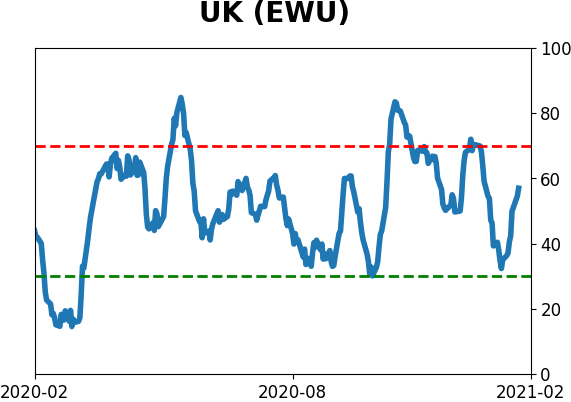
Country ETF's - 10-Day Moving Average
|
|
|
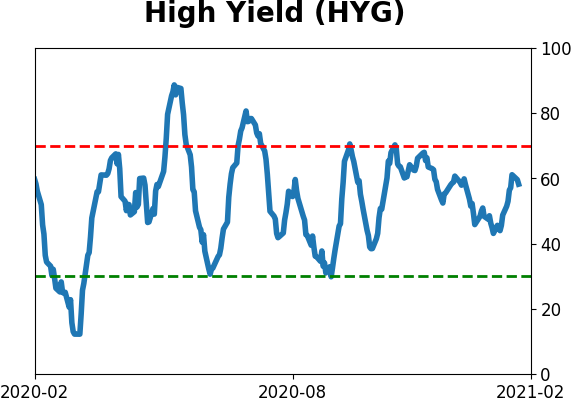
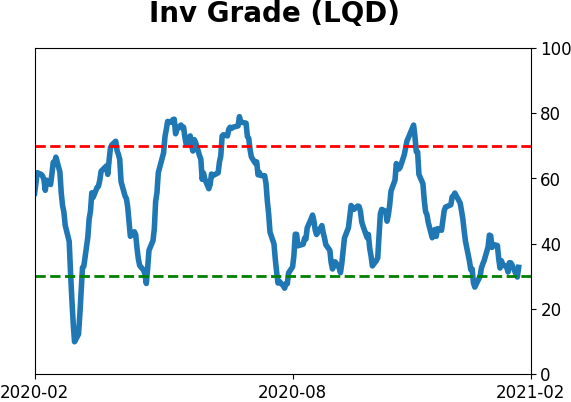
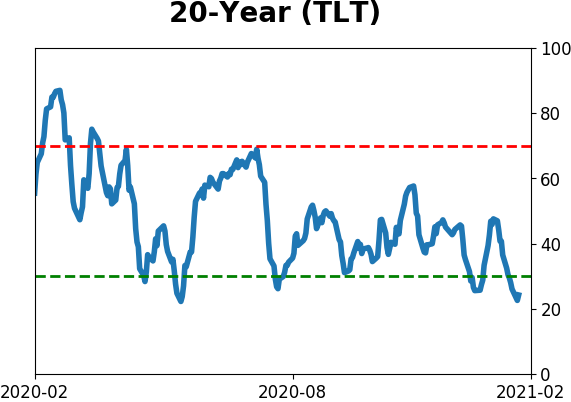
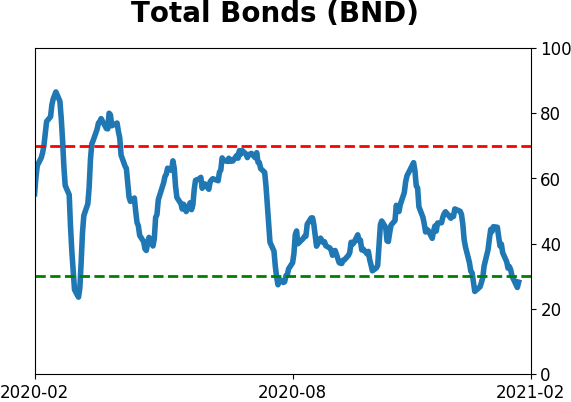
Bond ETF's - 10-Day Moving Average
|
|
|
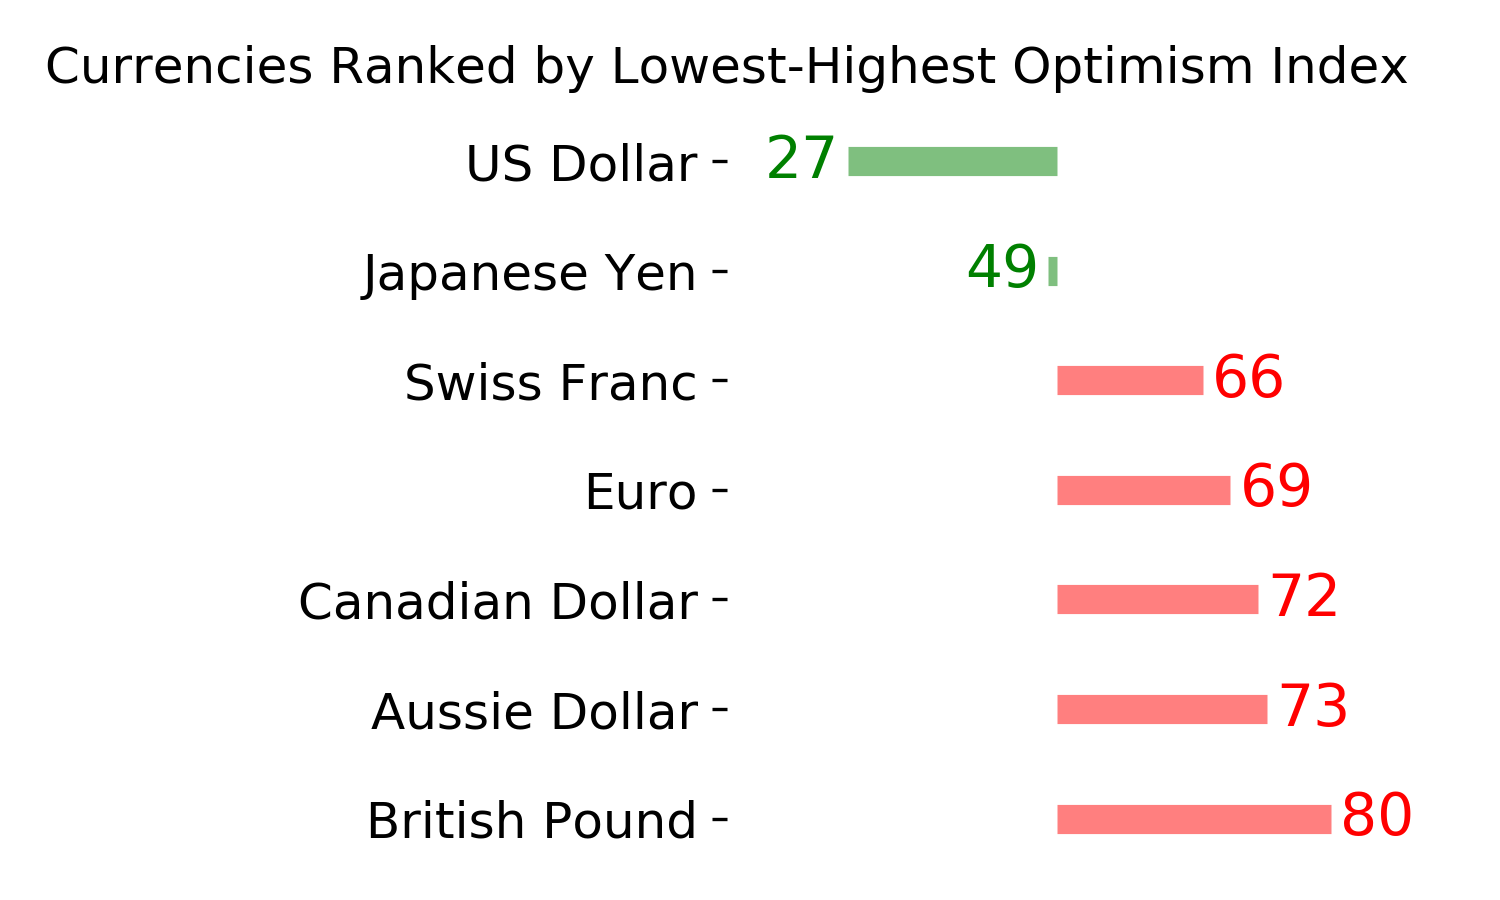
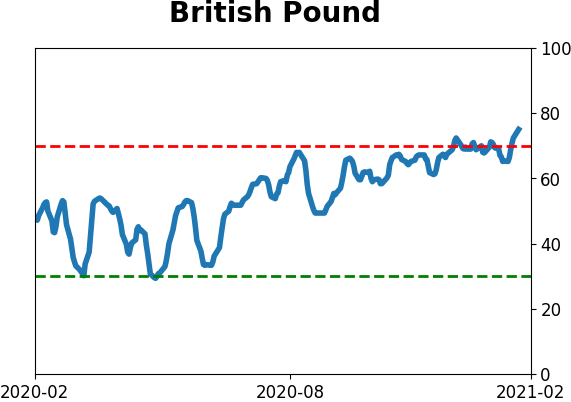
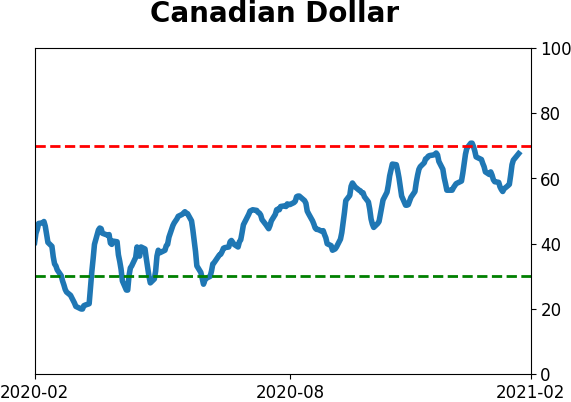
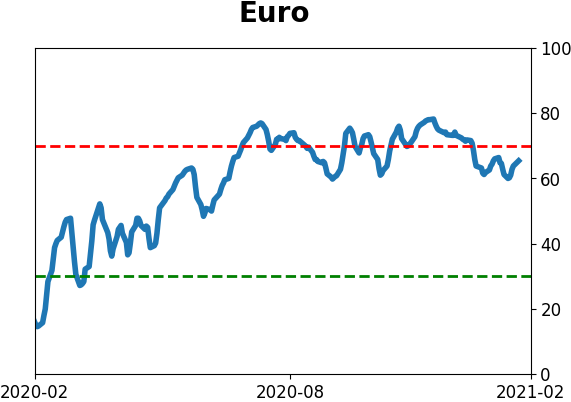
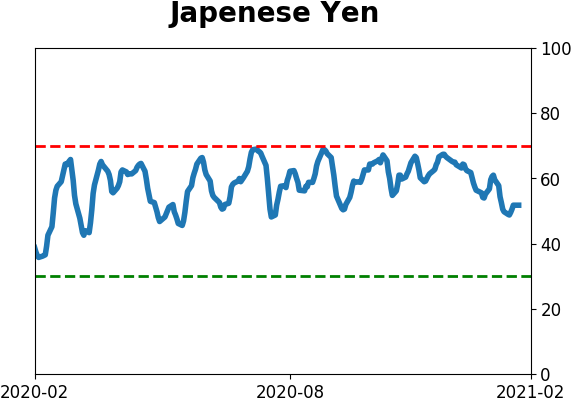
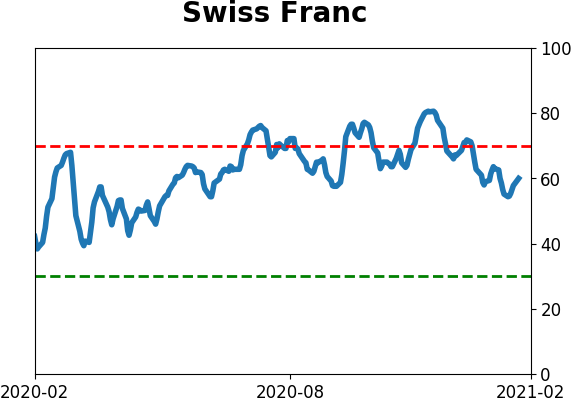
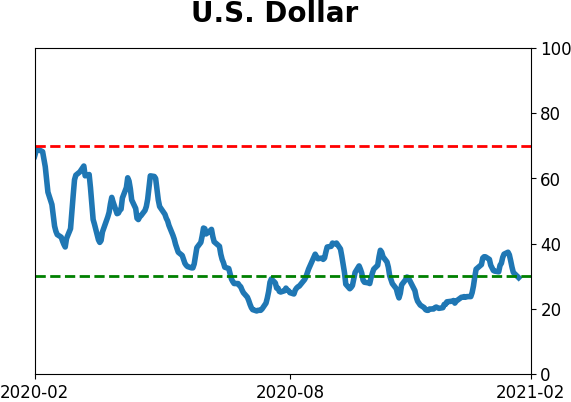
Currency ETF's - 5-Day Moving Average
|
|
|
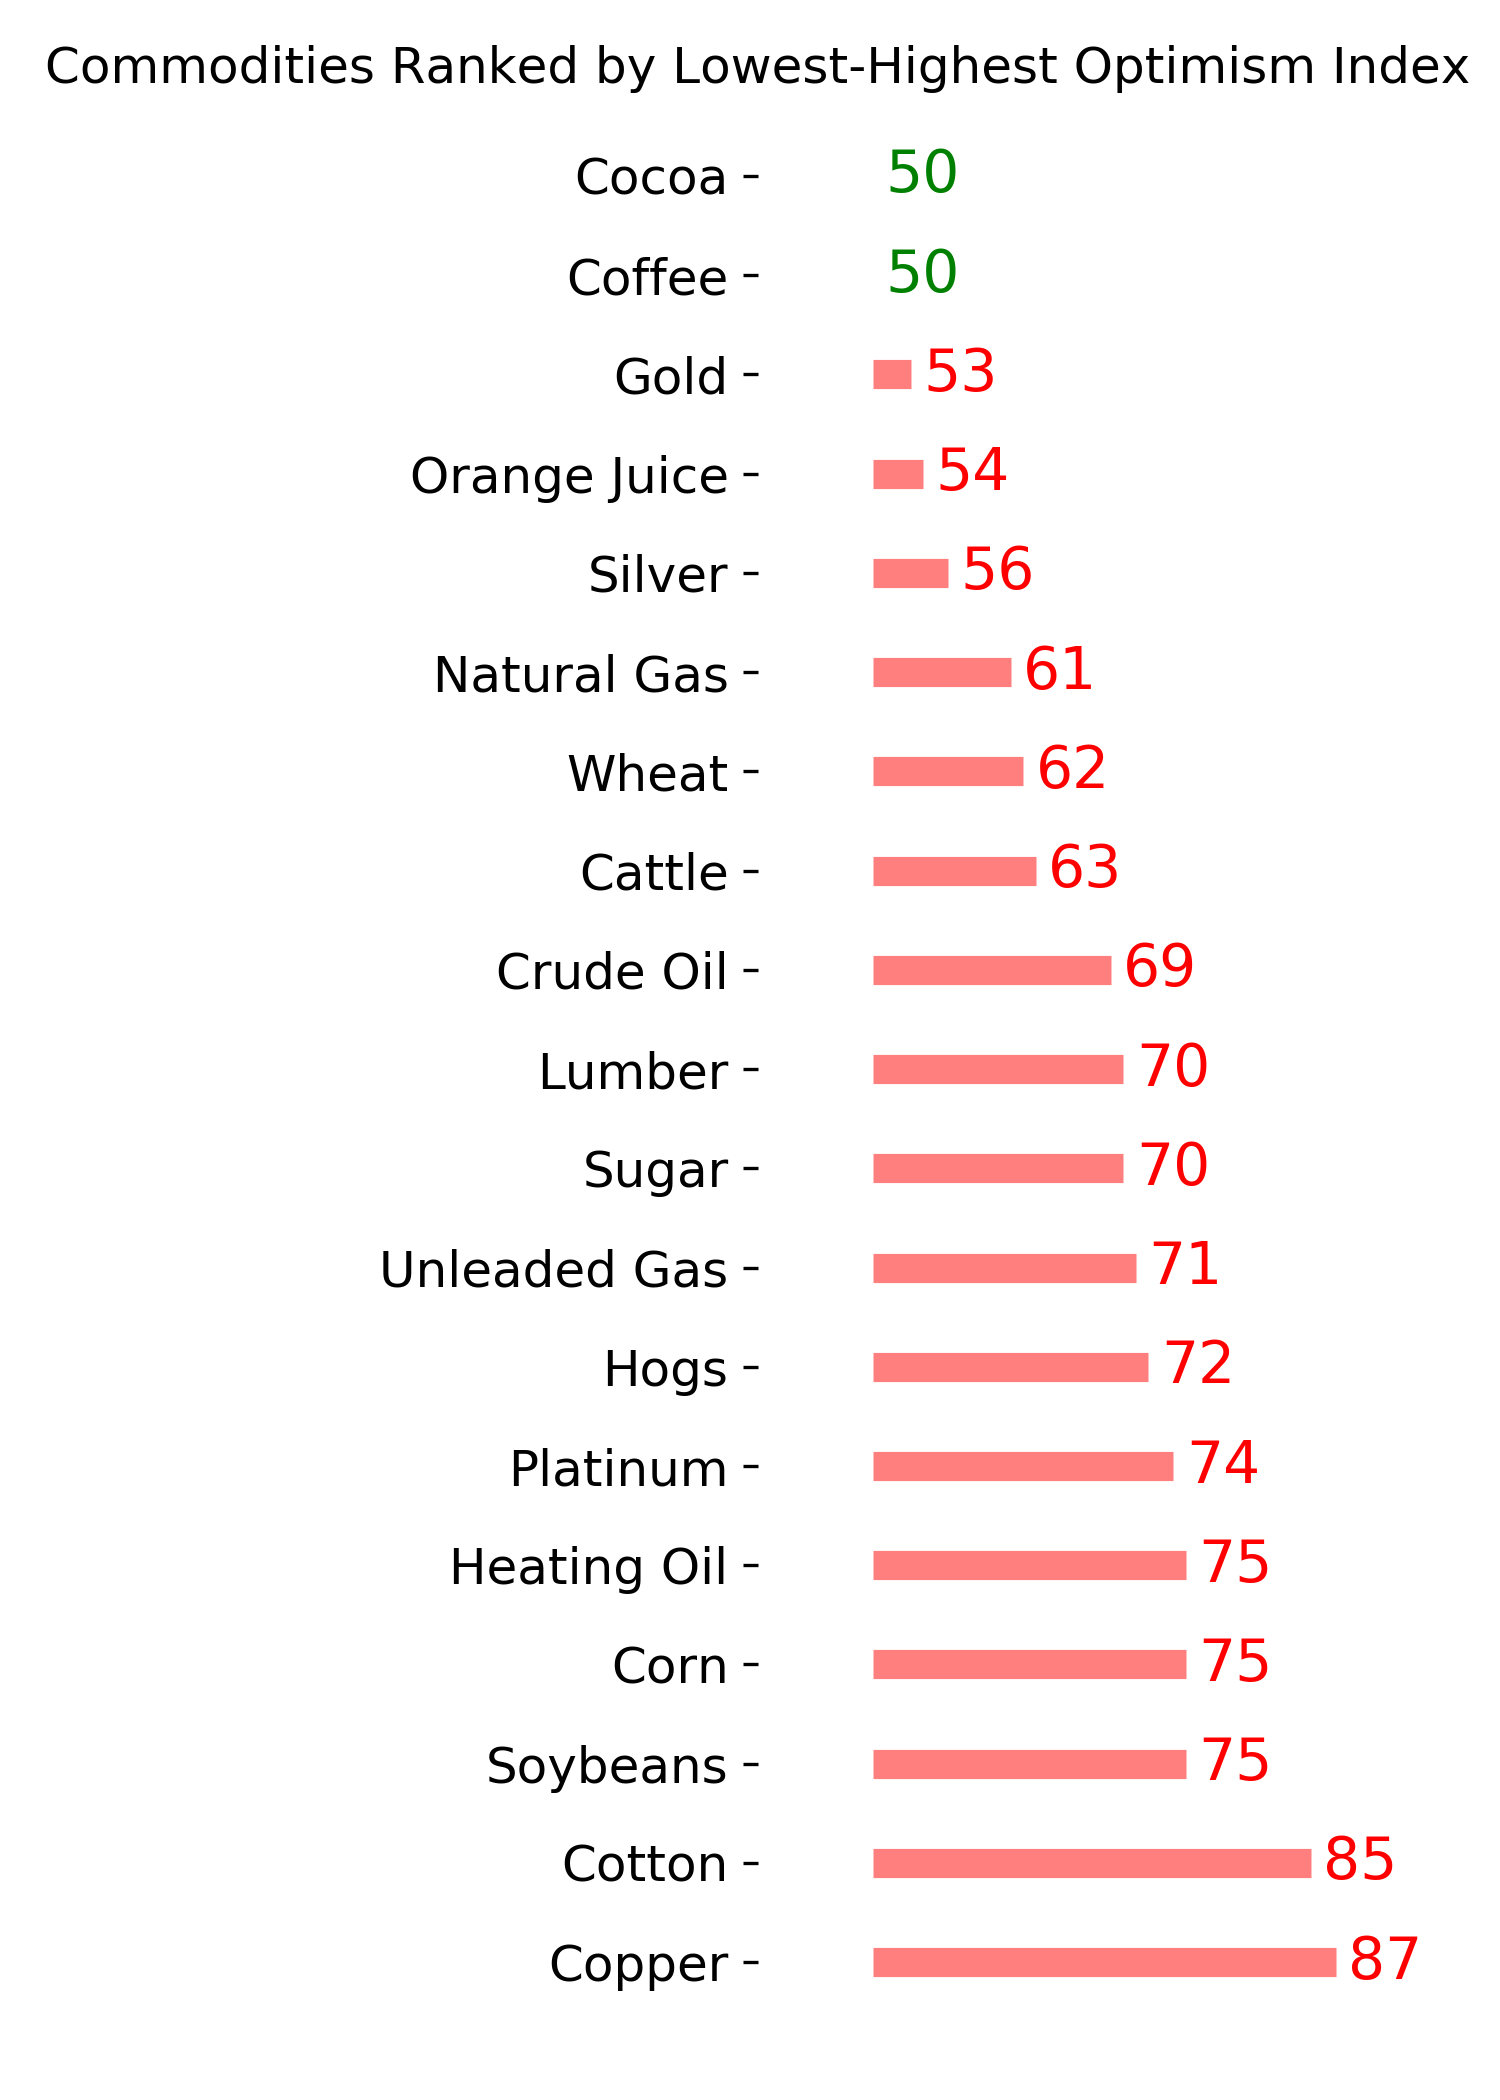
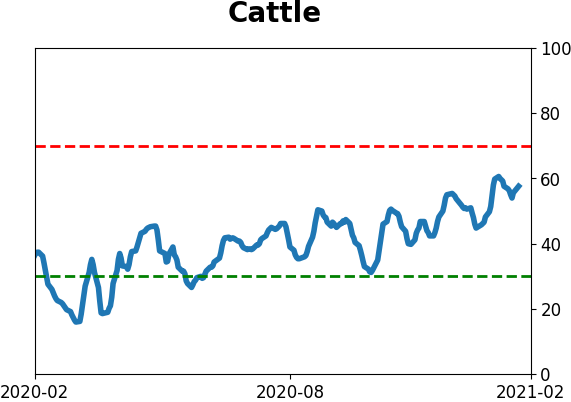
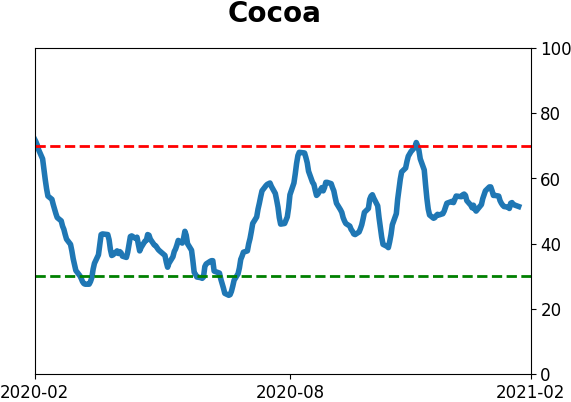
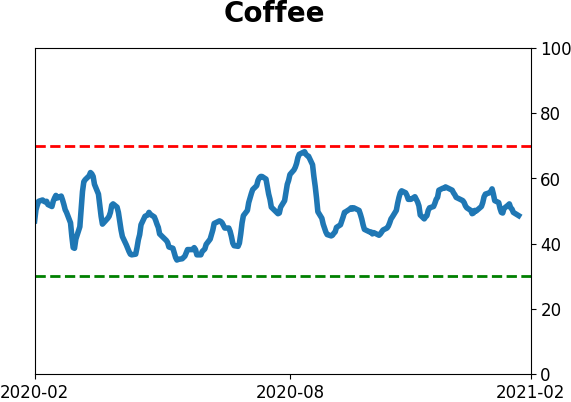
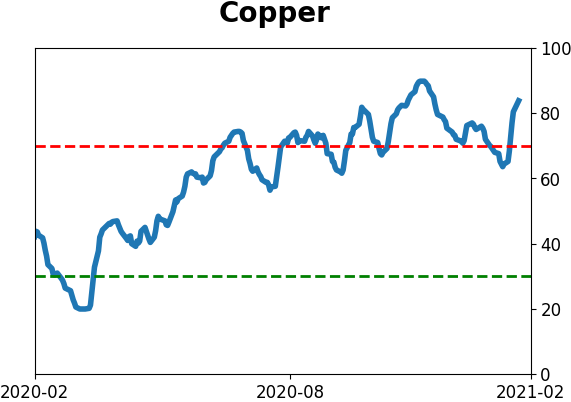
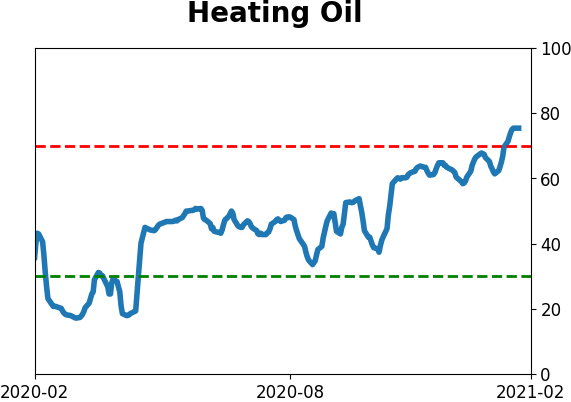
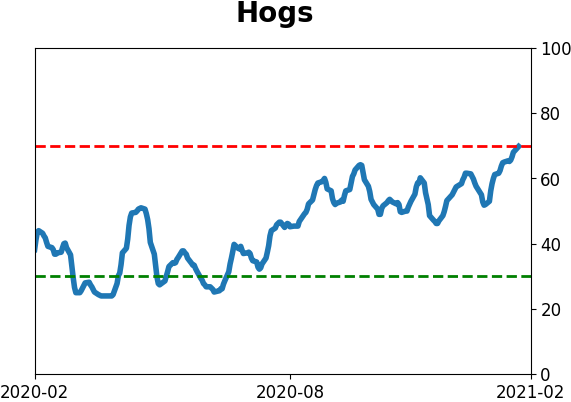
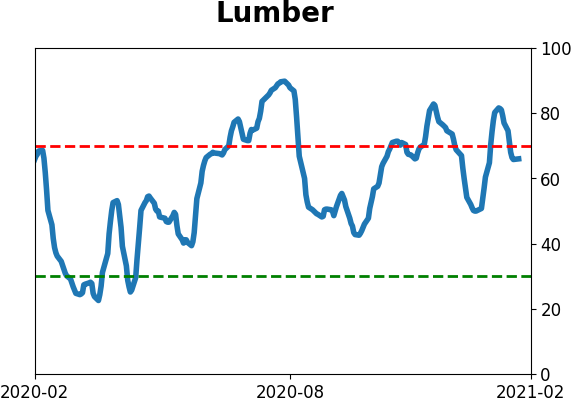
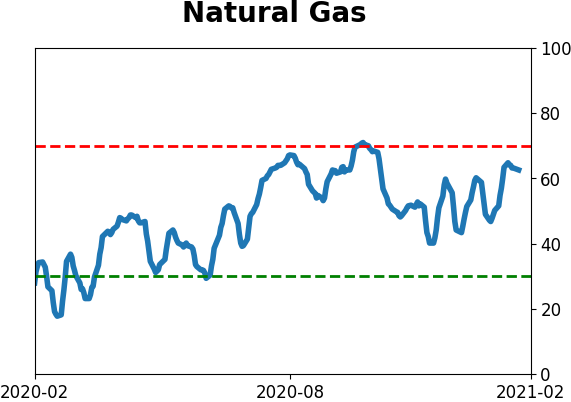
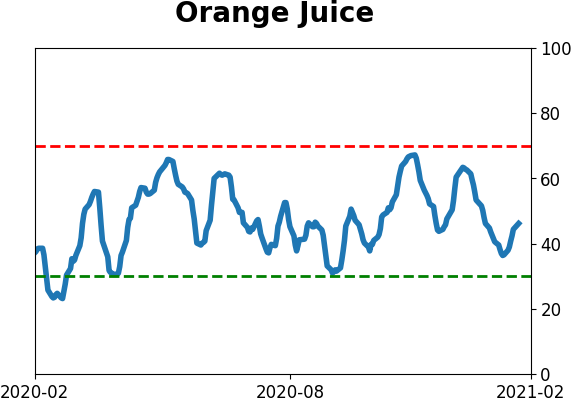
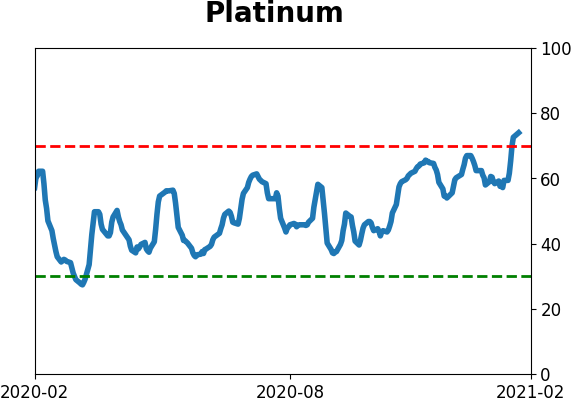
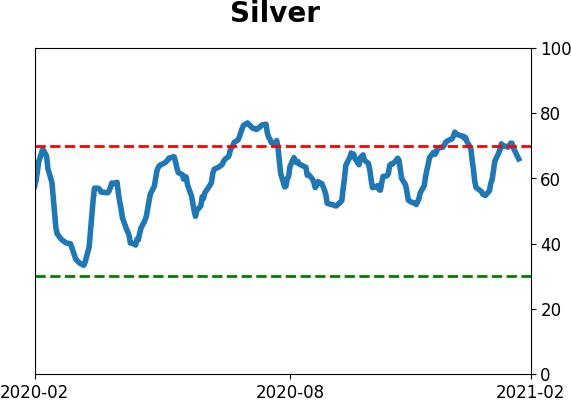
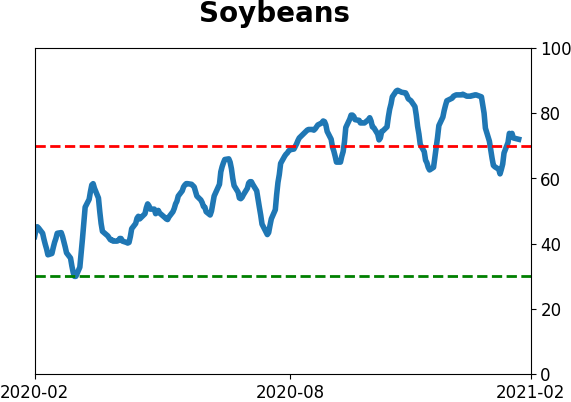
Commodity ETF's - 5-Day Moving Average
|
|