Headlines
|
|
The jump in options activity isn't what it seems:
As stocks have rebounded, so has optimism, which includes a jump in options activity. Despite media reports to the contrary, small options traders have not gone all-in on speculative options bets. In fact, recent activity remains far less optimistic than it had been at any major S&P 500 peak in 23 years.
|
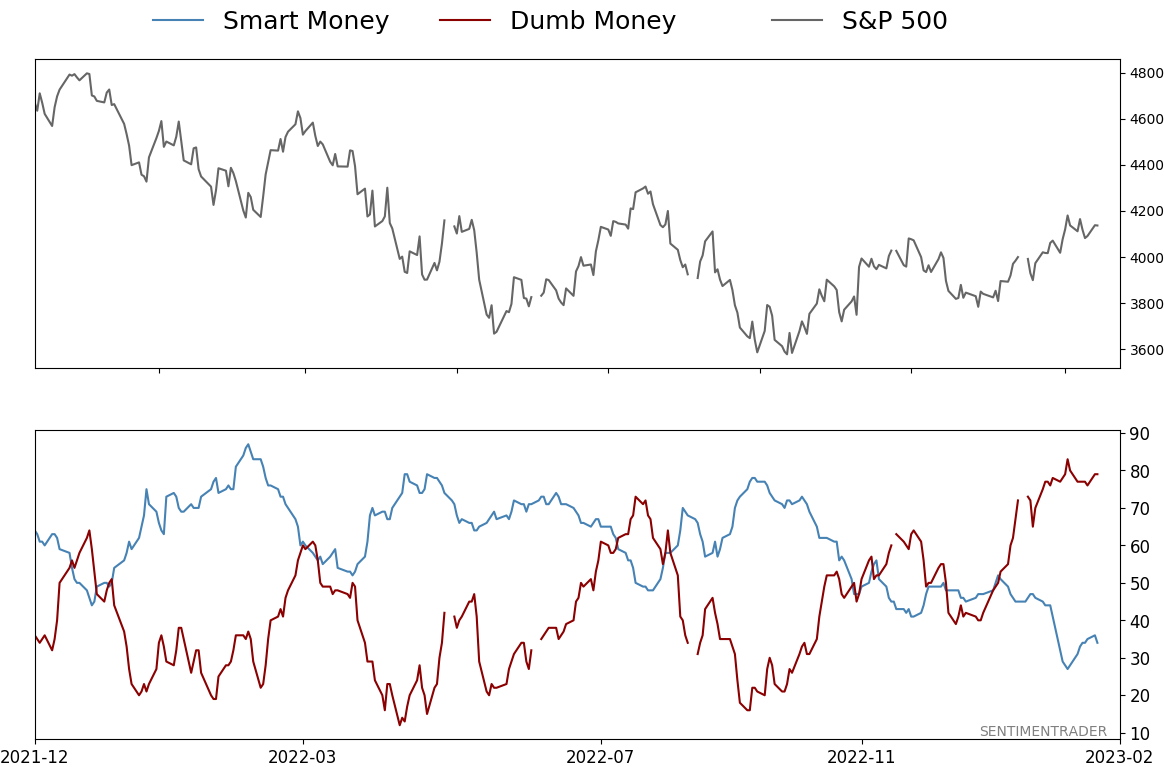
Smart / Dumb Money Confidence
|
Smart Money Confidence: 34%
Dumb Money Confidence: 79%
|
|
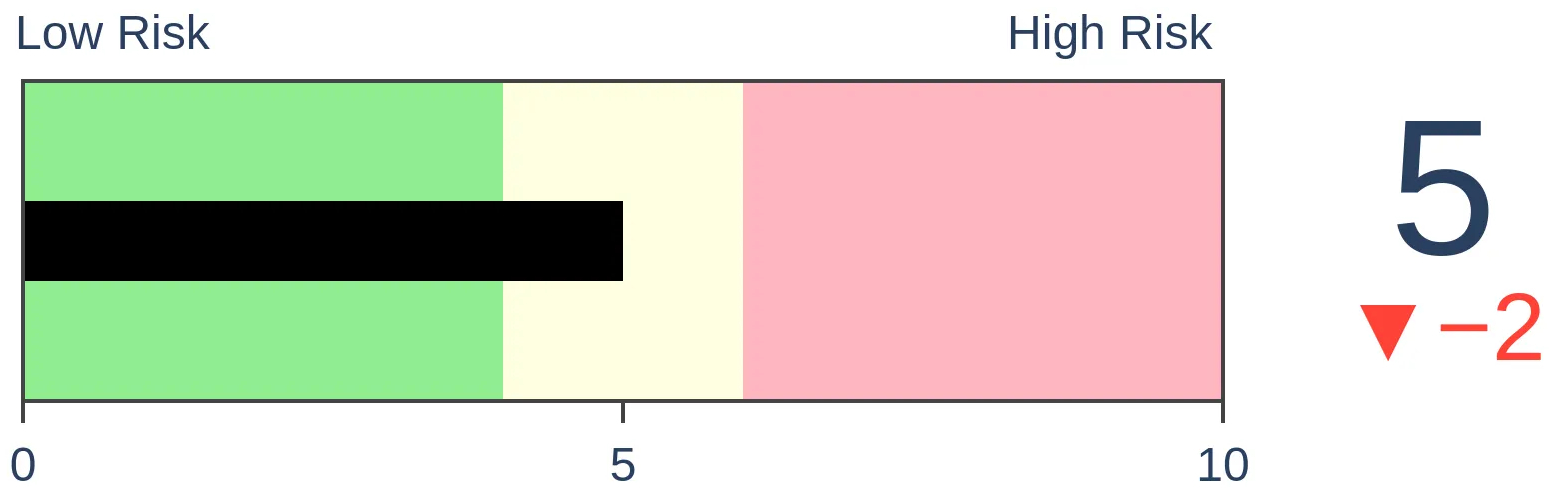
Risk Levels
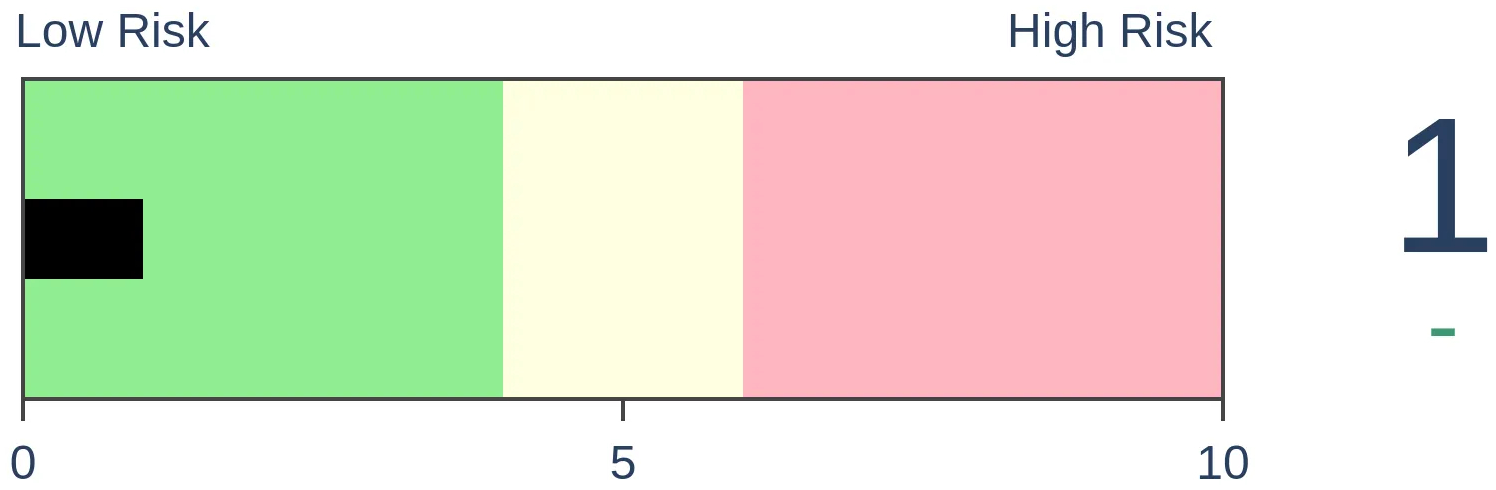
Stocks Short-Term
|
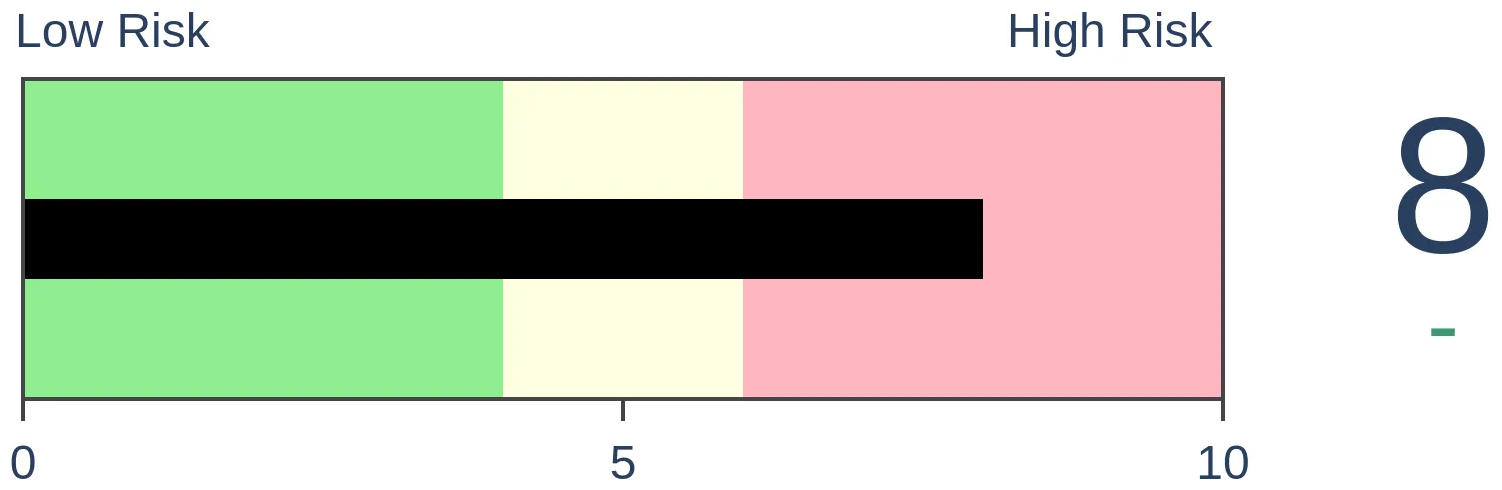
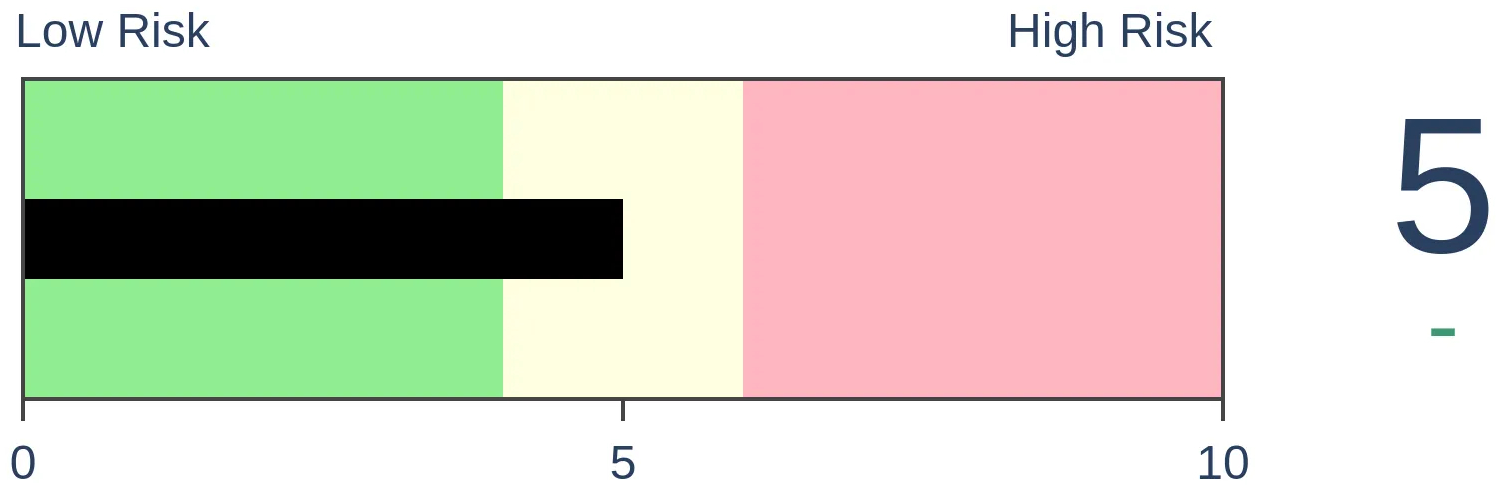
Stocks Medium-Term
|
|
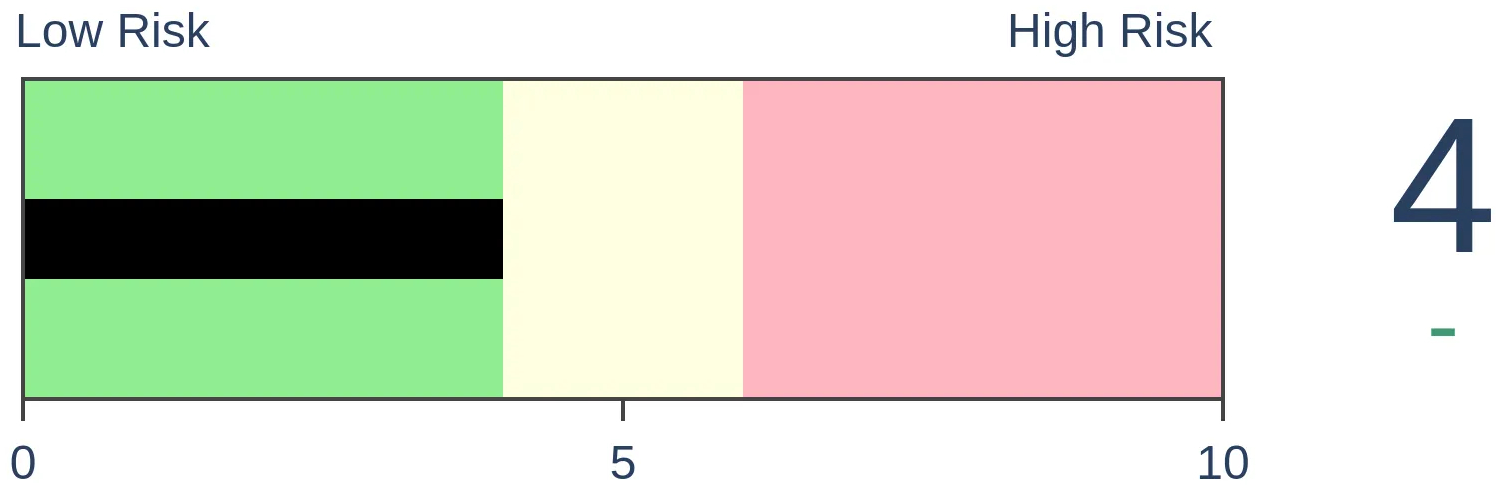
Bonds
|
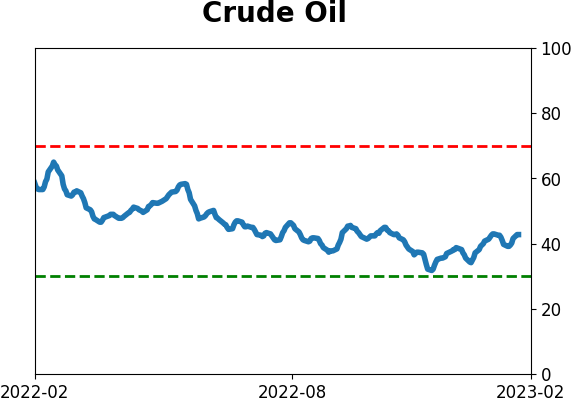
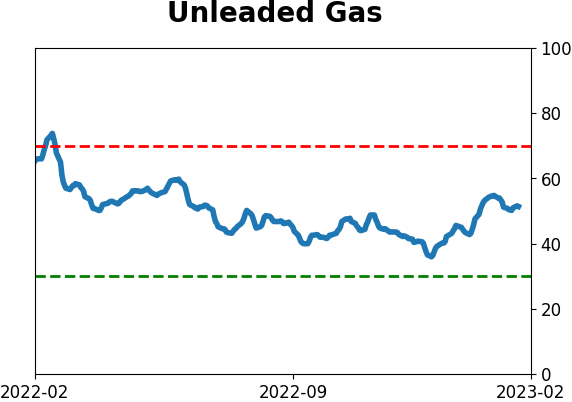
Crude Oil

|
|
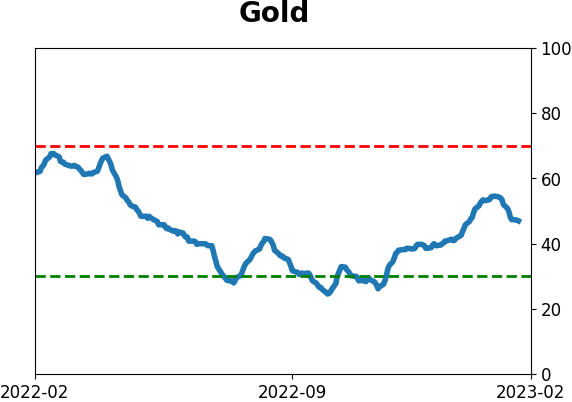
Gold
|
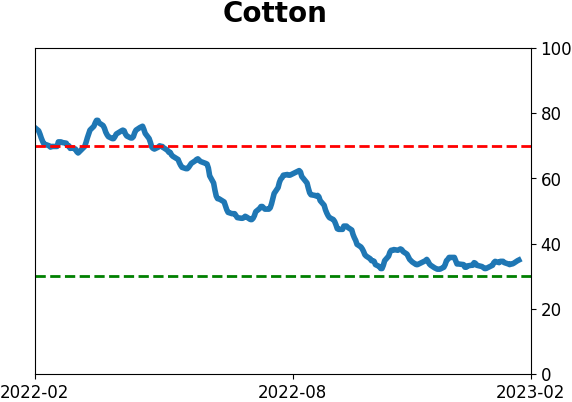
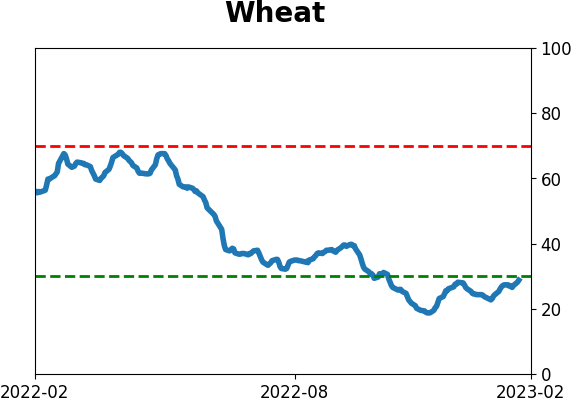
Agriculture
|
|
Research
By Jason Goepfert
BOTTOM LINE
As stocks have rebounded, so has optimism, which includes a jump in options activity. Despite media reports to the contrary, small options traders have not gone all-in on speculative options bets. In fact, recent activity remains far less optimistic than it had been at any major S&P 500 peak in 23 years.
FORECAST / TIMEFRAME
None
|
Key points:
- There is an increasing concern that options traders are once again engaged in highly speculative behavior
- That data is misleading, and under the surface, we can see this is not the case
- Weekly data showing who is doing what tells us that retail options traders are far from betting like at past peaks
Retail traders aren't as optimistic as it looks
A historically bad bear market, when essentially every major financial asset declines together, has caused investors to become supremely skeptical. While there are signs that optimism has returned in some respects, there is also a tendency to see a monster under every bed.
Because we witnessed a blowoff peak in options activity two years ago, everyone is looking for a repeat, with a similar repeat of the outcome. That's fighting the last war. Humans never change.
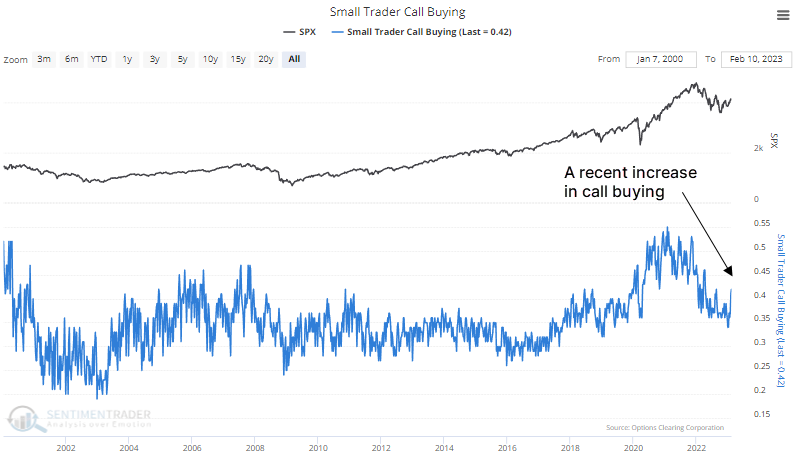
As CNBC reported recently, there has been another jump in options activity.
A speculative frenzy after Fed Chairman Jerome Powell spoke last week helped drive record trading in call options Thursday, and there could be more Powell-related options action Tuesday as investors await his midday speech. But the record volume in call options on stocks last week may also be the sign of a medium-term peak in speculative behavior, according to Julian Emanuel, head of equity, derivatives and quantitative research at Evercore ISI.
Using exchange-wide data is fraught with misleading data. The jump in activity can be due to many factors, most of which have nothing to do with speculation. That's why we place the greatest emphasis on weekly activity that encompasses all U.S. options exchanges and breaks the activity down by who is doing what.
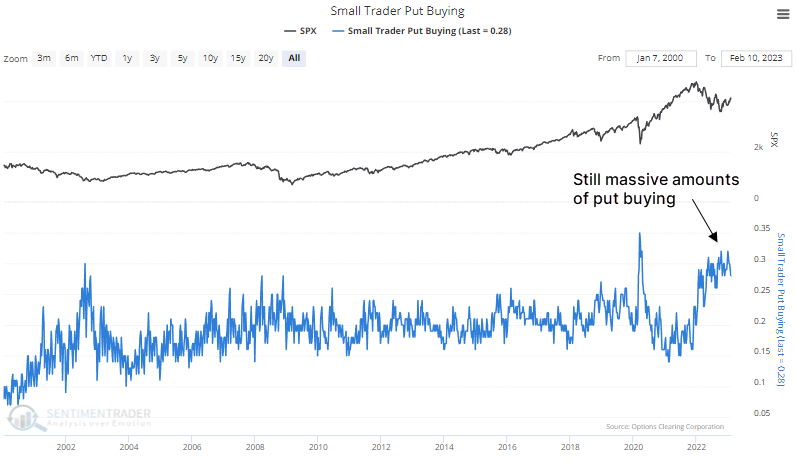
And there has been a recent jump in call buying to open among small options traders.
But they continue to buy massive numbers of put options as well.
That means the ROBO Put/Call Ratio remains elevated. It's well above its average for when the S&P 500 has formed a significant peak. On average, the ROBO Ratio was at 0.44 when the S&P hit a six-month peak and averaged 0.47 over the prior four weeks. This time, the Ratio was way above those levels.
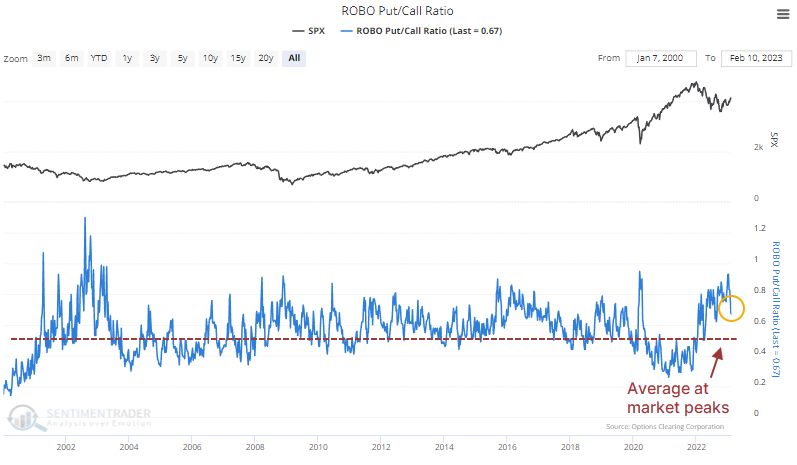
In fact, the ROBO Put/Call Ratio is above where it was at every single major peak in the S&P over the past 23 years. This means that if the S&P is peaking now, it wouldn't be because of excessive speculative activity among retail traders.
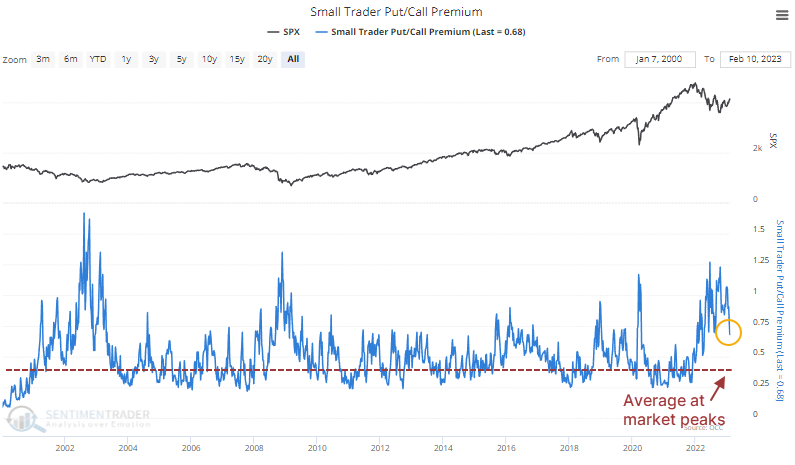
It's even more pronounced when we consider the premiums traders spent on those puts relative to calls.
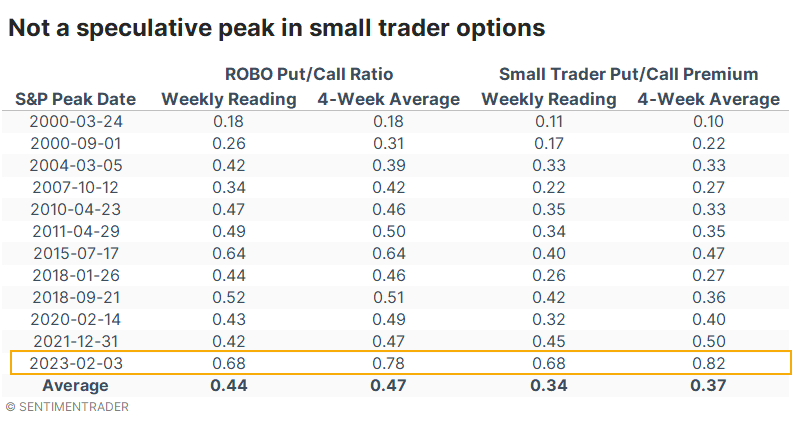
If we look at every major peak in the S&P 500 over the past 23 years, along with the weekly and four-week average ROBO Put/Call Ratio reading at those times, the most recent peak is far away from any of the others. If the S&P peaked in February, it would be a total outlier, with much higher readings (more pessimism) in the options data than any other peak.
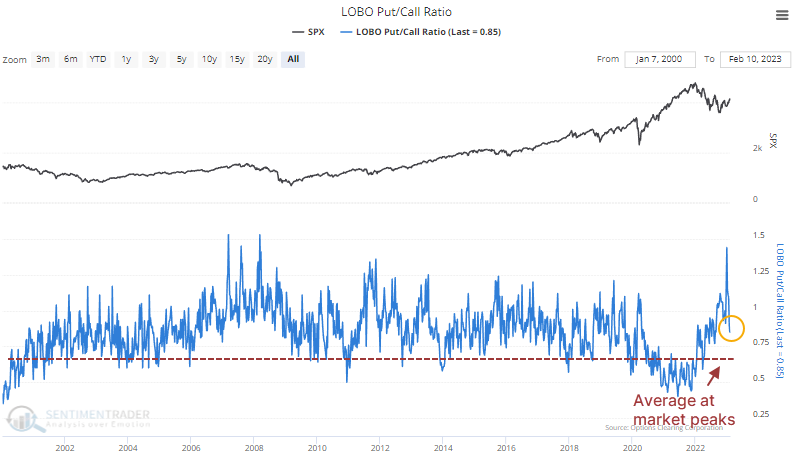
There seem to have been some games played in the options market among the largest of traders, but they also have picked up their call buying. Even so, put buying remains high, the LOBO Put/Call Ratio is elevated, and overall options premiums remain skewed to the put side.
What the research tells us...
There is little doubt that optimism has rebounded along with stock prices. The relationship between the two is so close as to essentially be tautological. But just because optimism is rebounding doesn't necessarily mean it's a contrary indicator, given where it originated.
The biggest caveat is assuming that all indicators are always contrary indicators, especially when the data is suspect. With the options market, caution is warranted because there is a lot of bad data out there and a lot of snap judgments, given the explosive rise in trading in 2020 and 2021. When we look at the most reliable data we have, we can see that while the most consistent wrong-way (at extremes) traders have picked up their bullish trading activity, it remains in neutral territory at worst and far outside of the norm seen at any other major peak in 23 years.
Indicators at Extremes
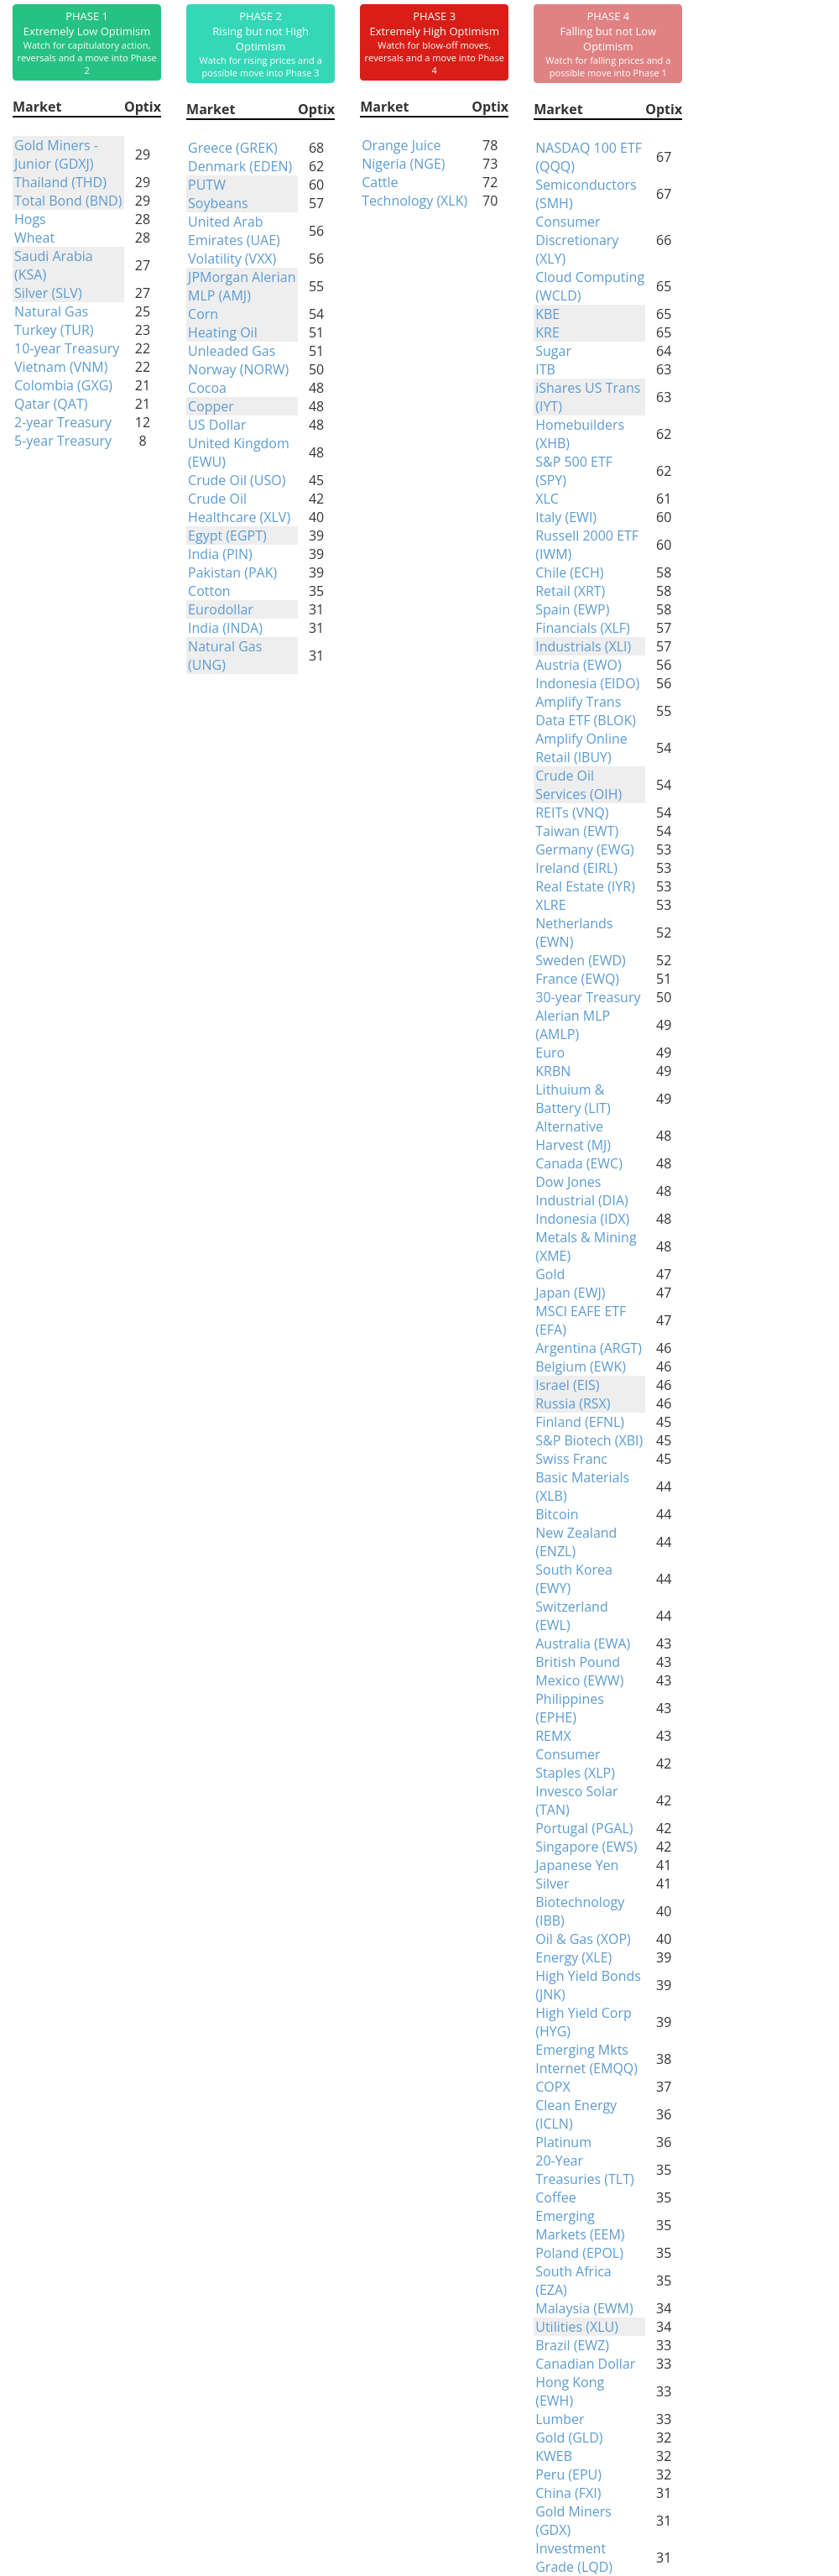
Phase Table
Ranks
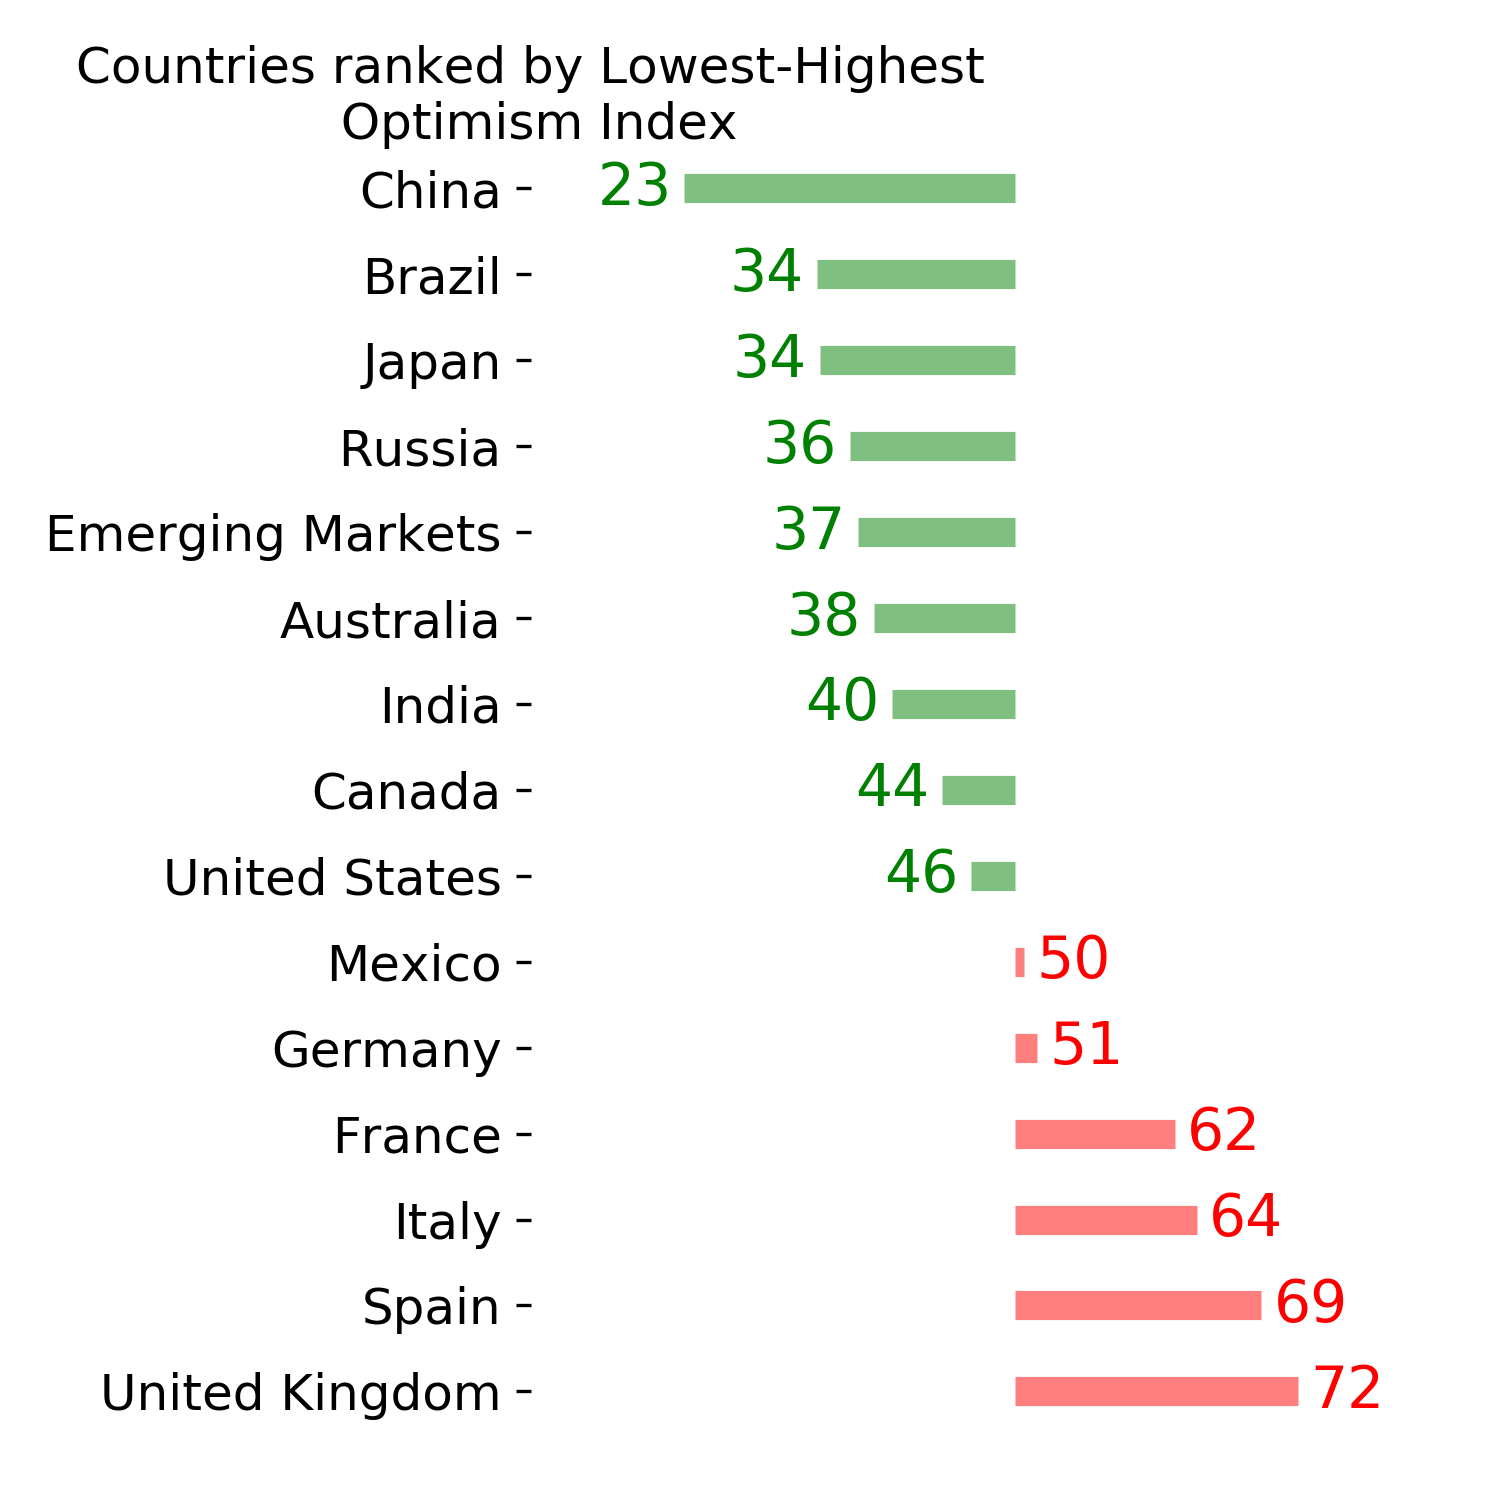
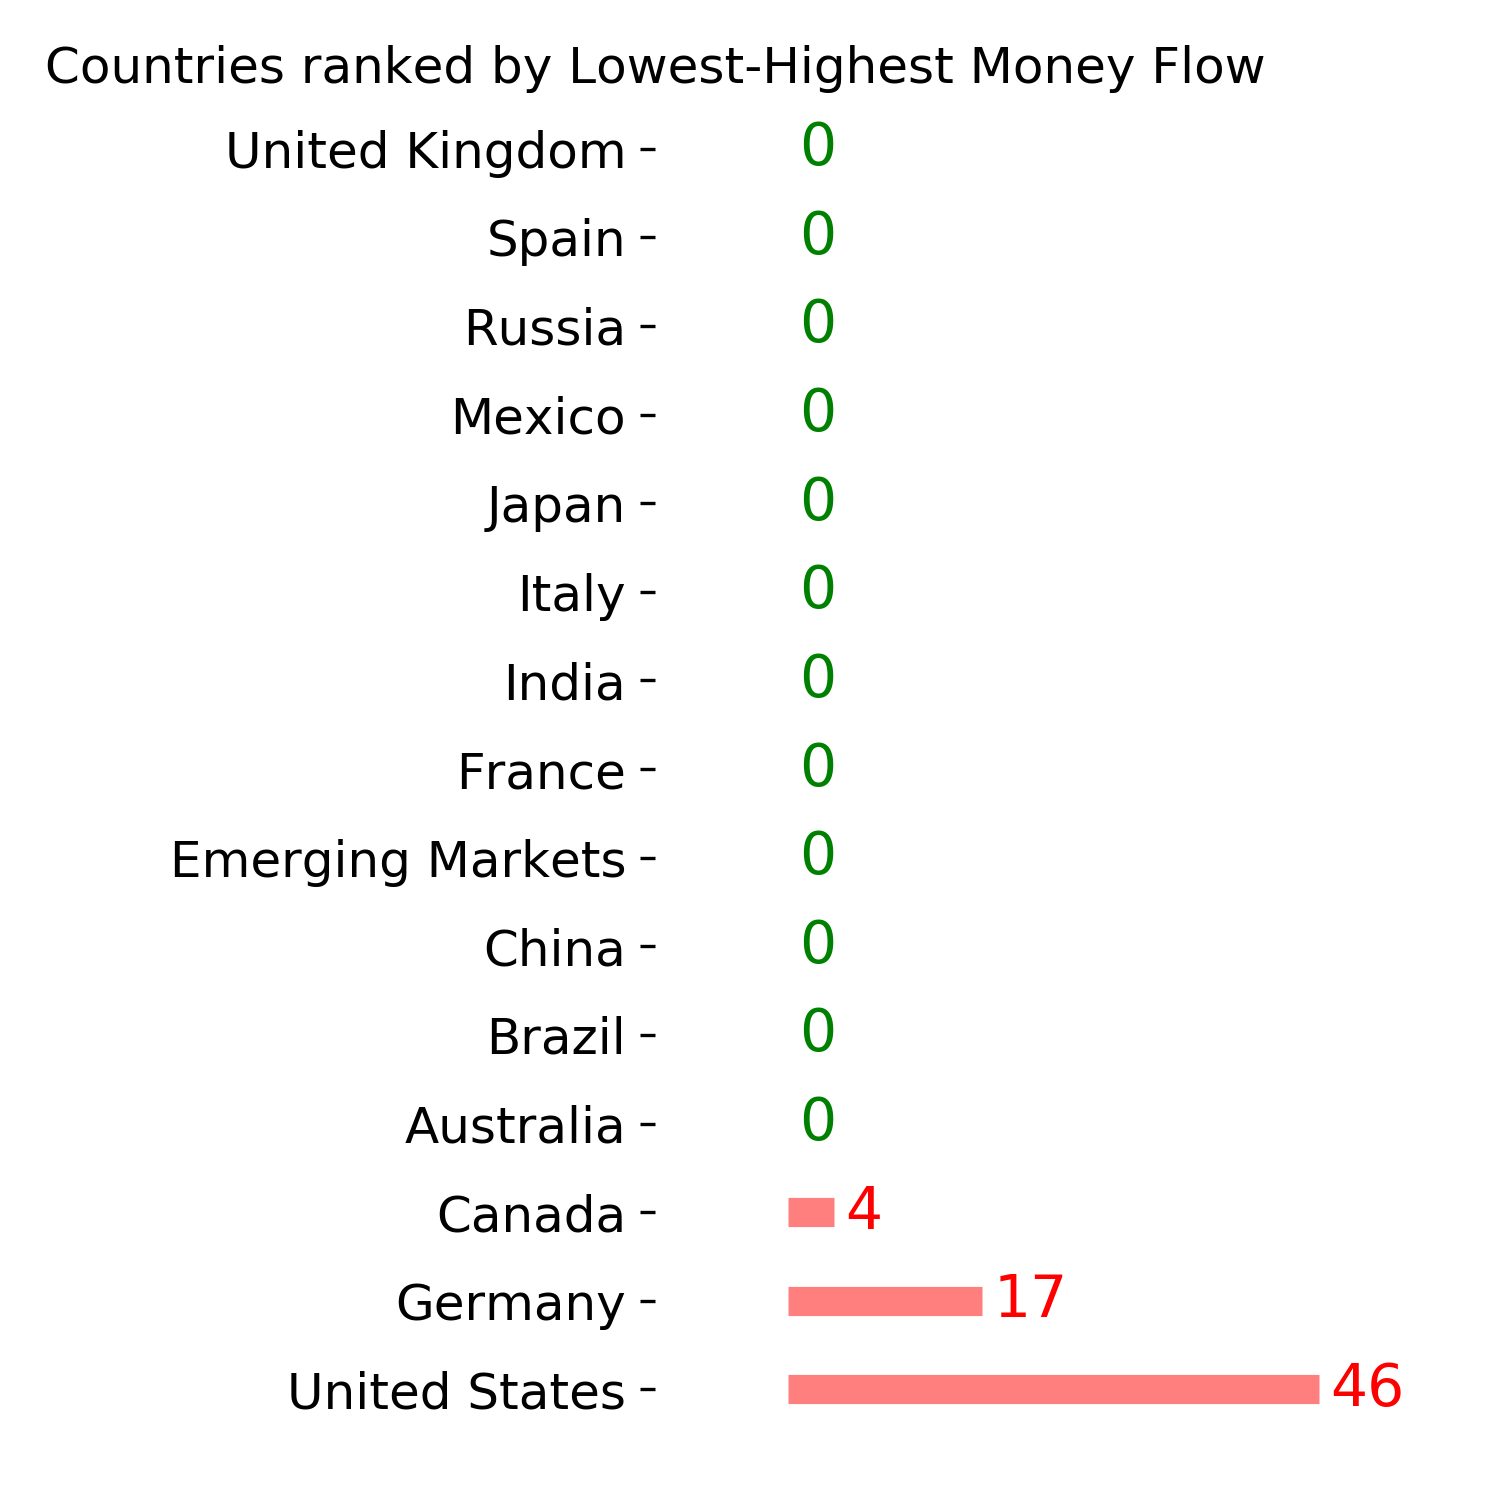
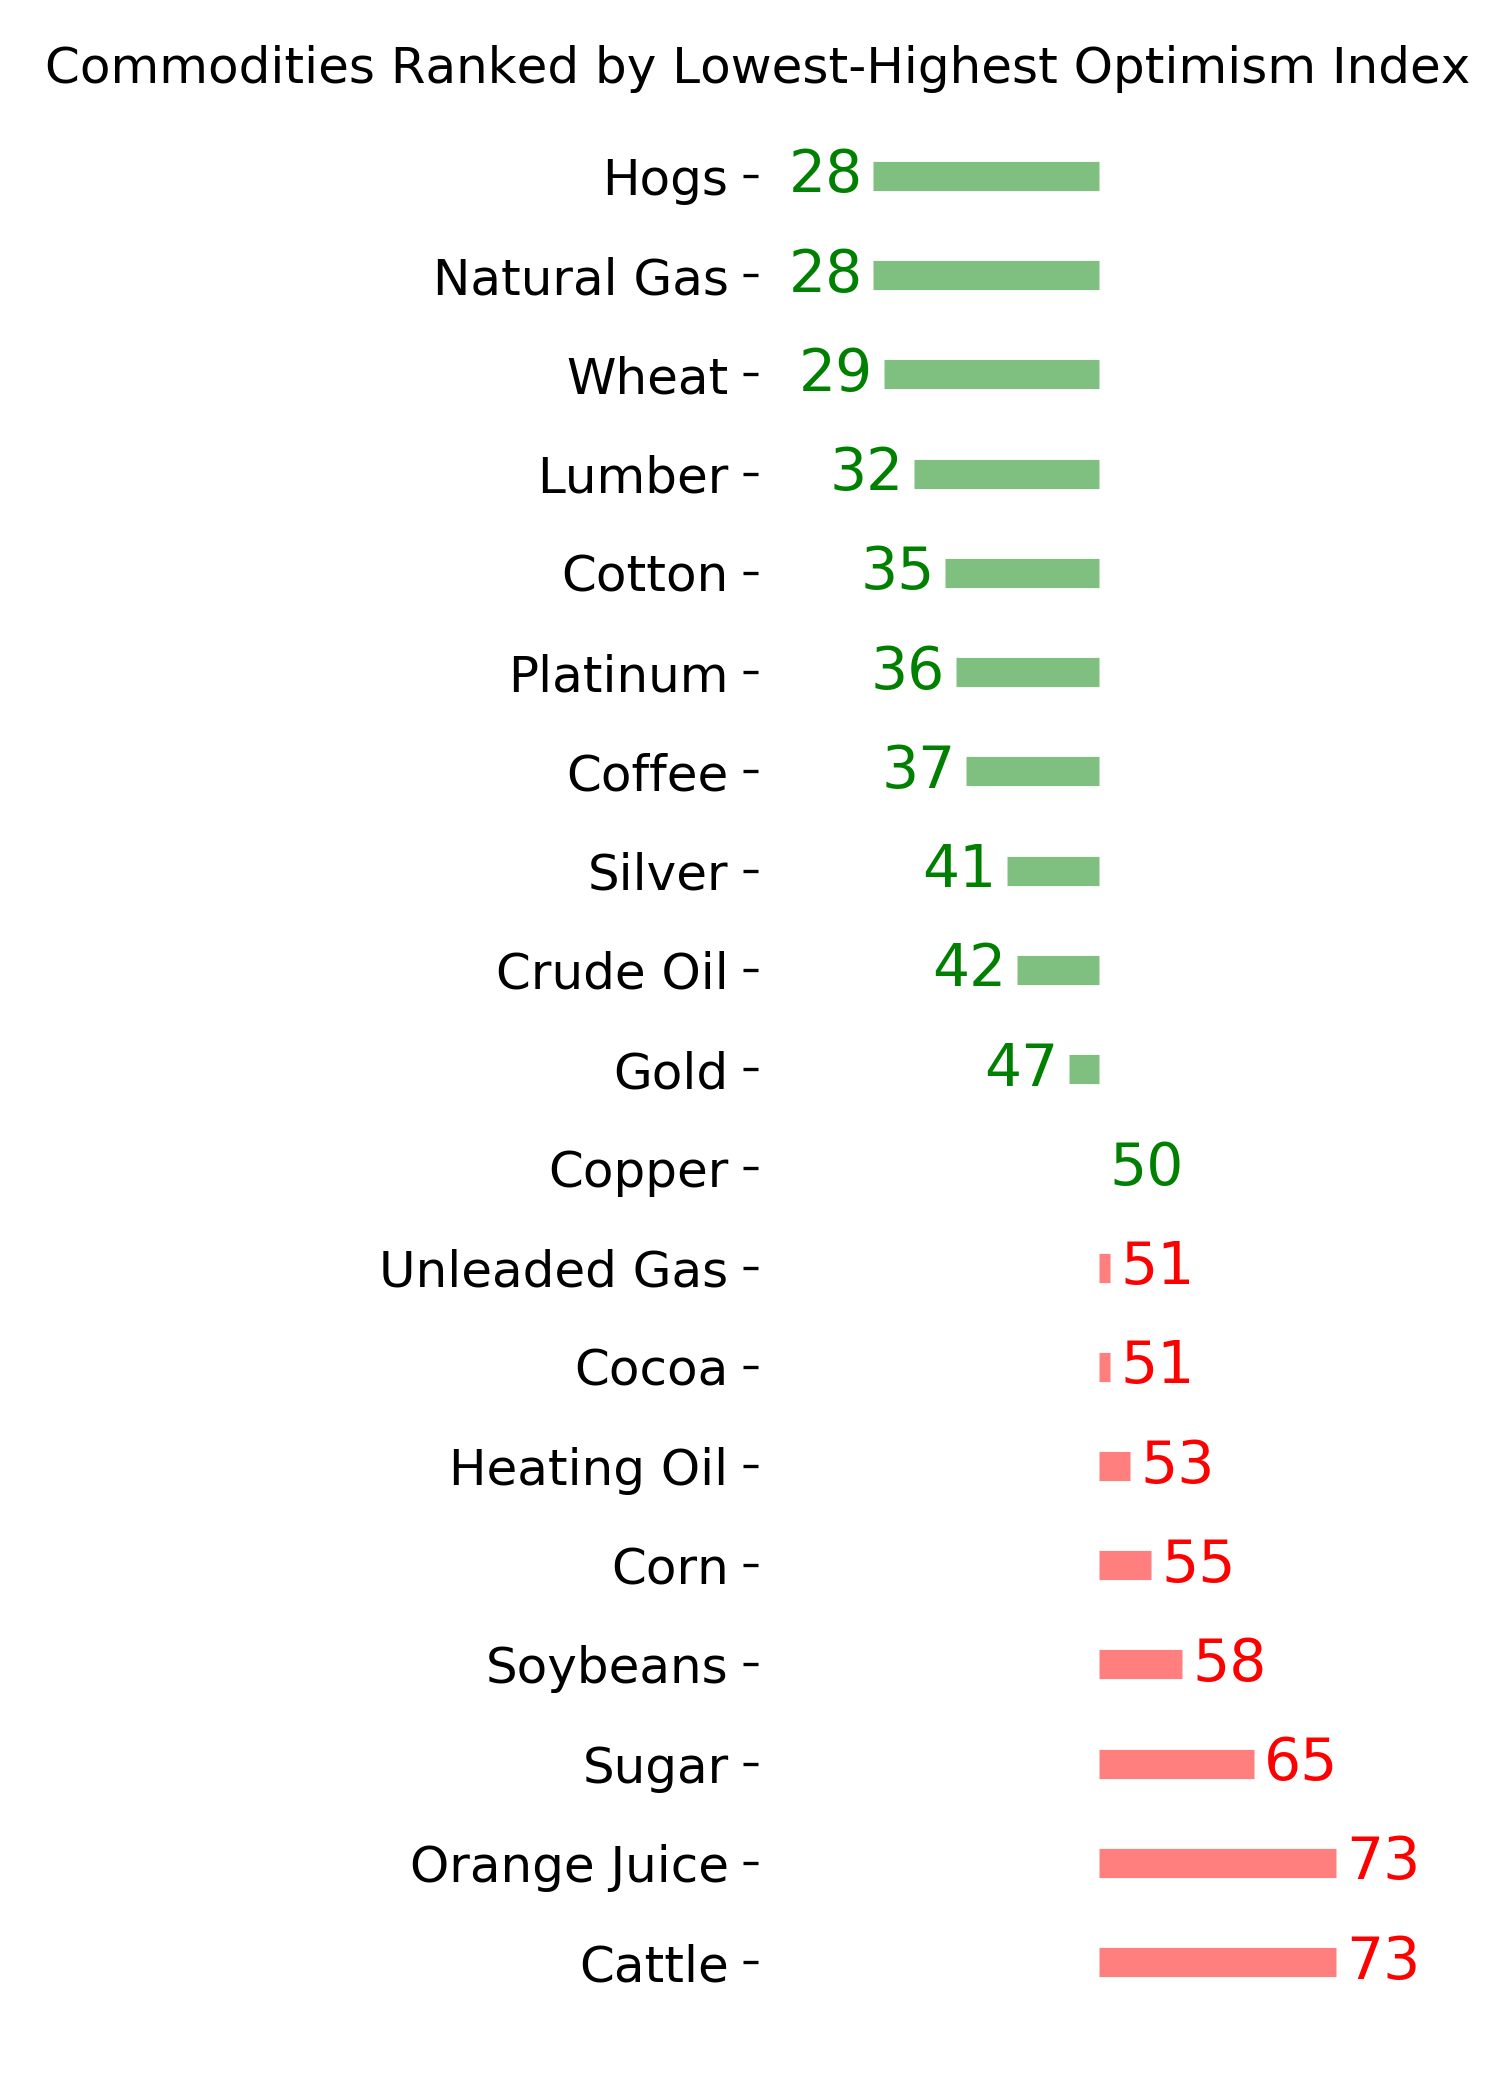
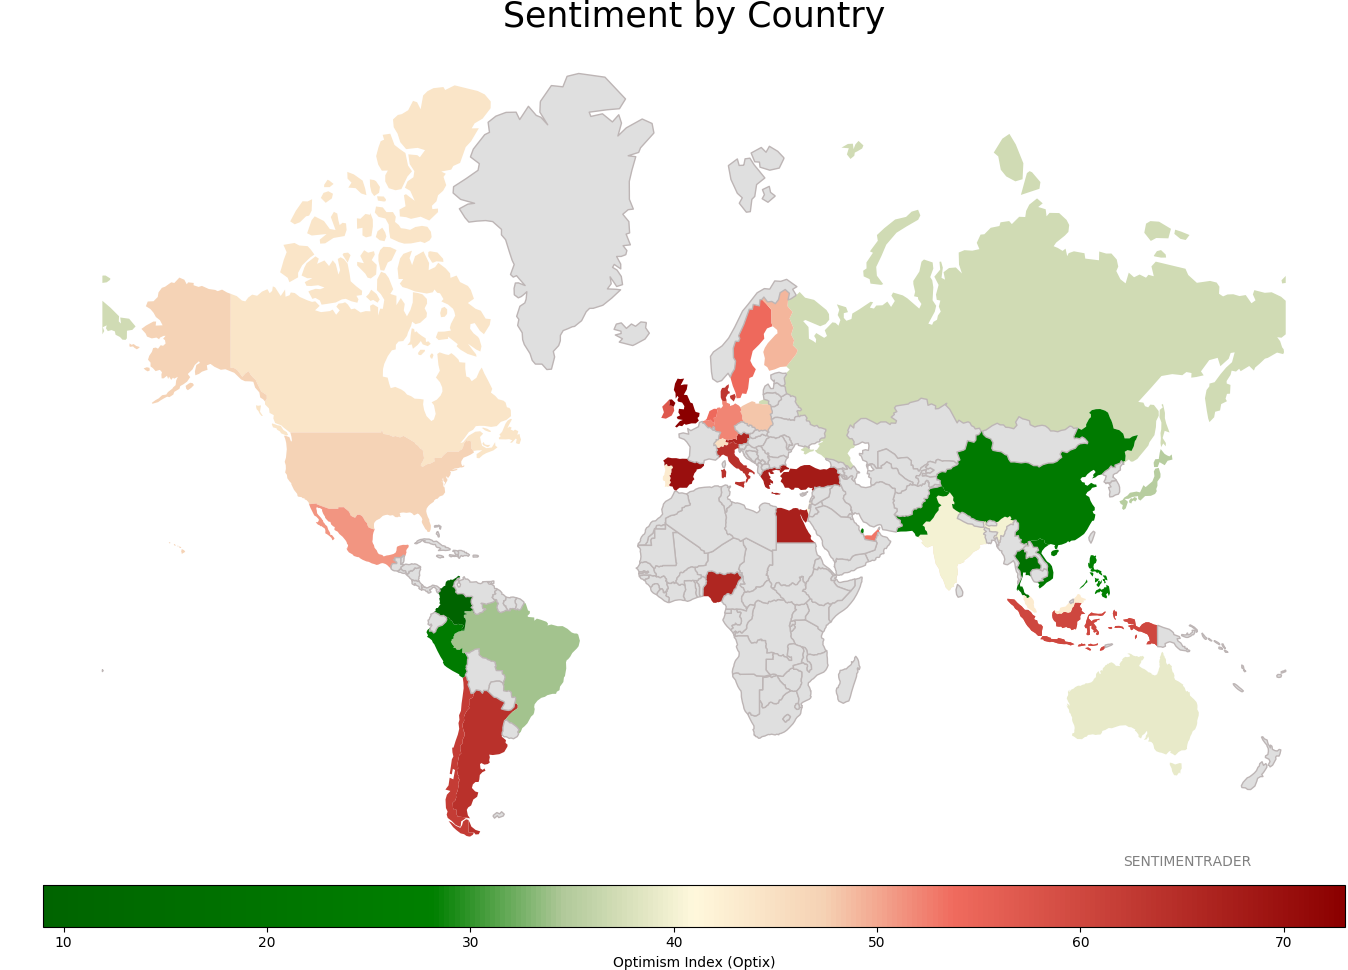
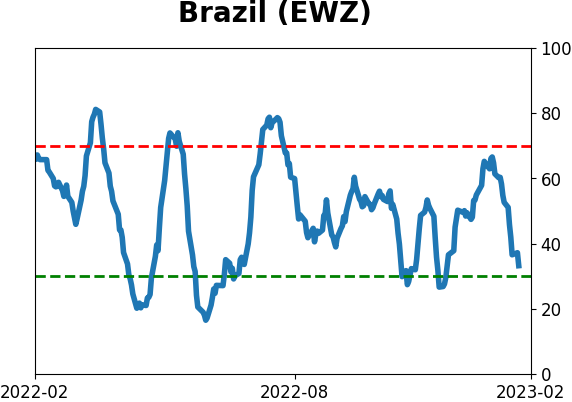
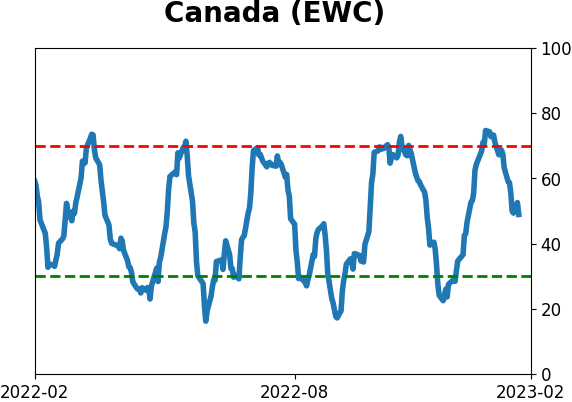
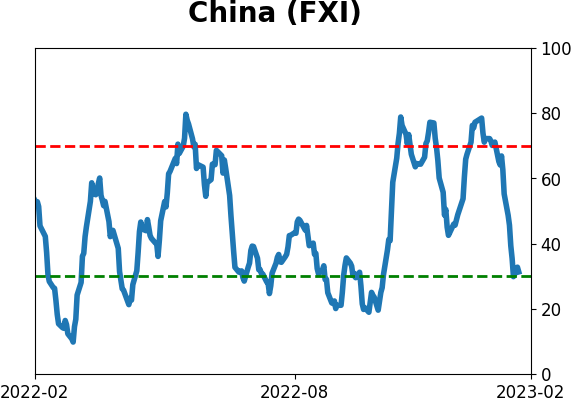
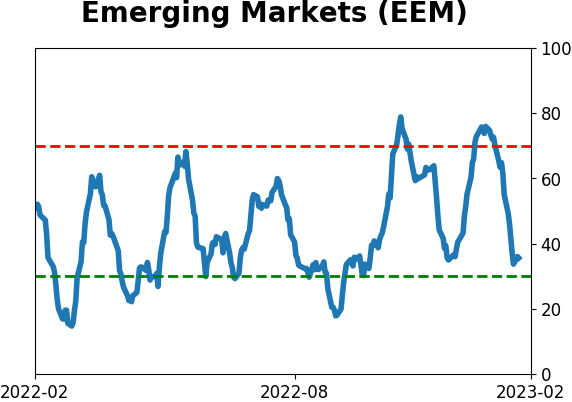
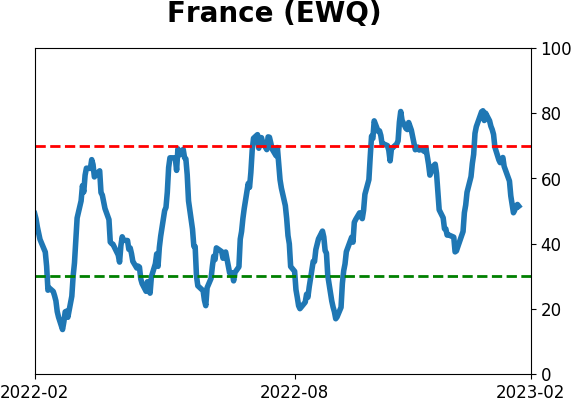
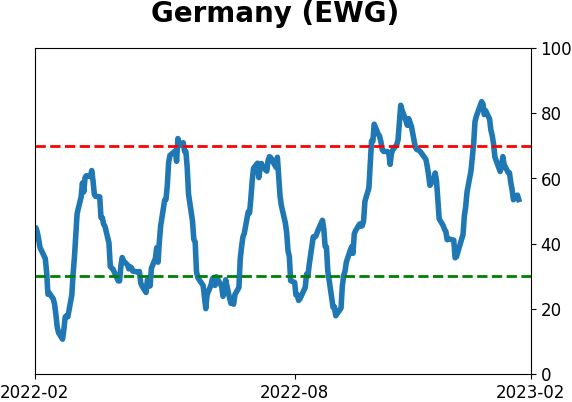
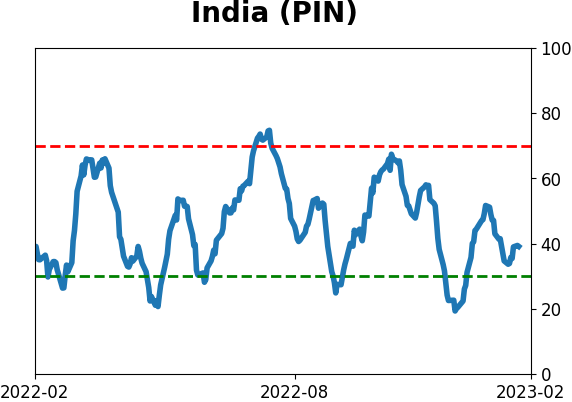
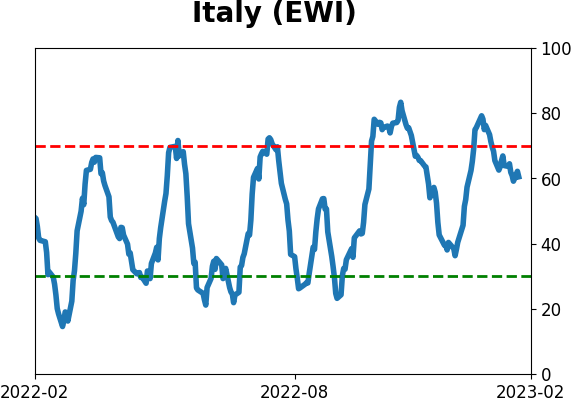
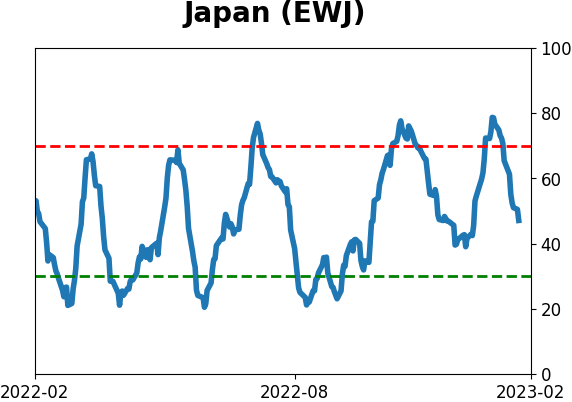
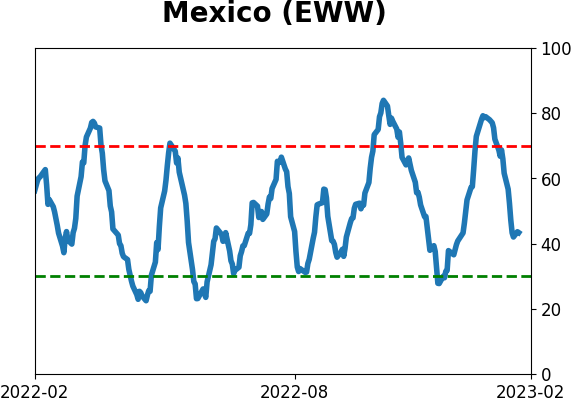
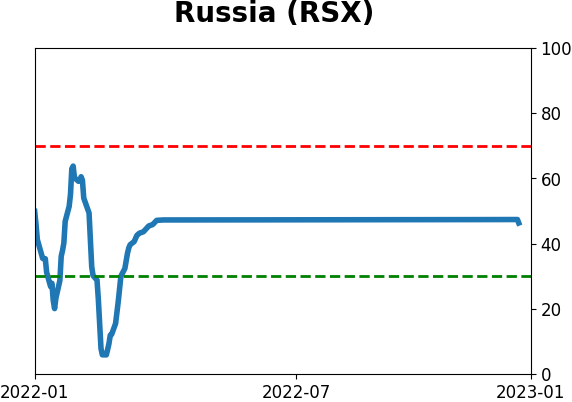
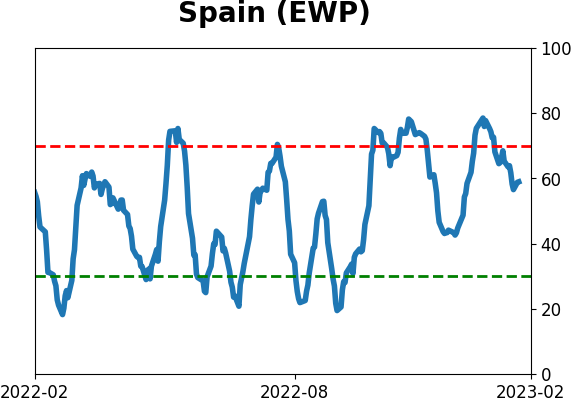
Sentiment Around The World
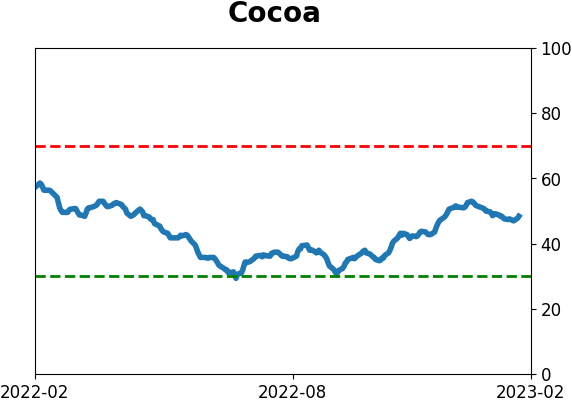
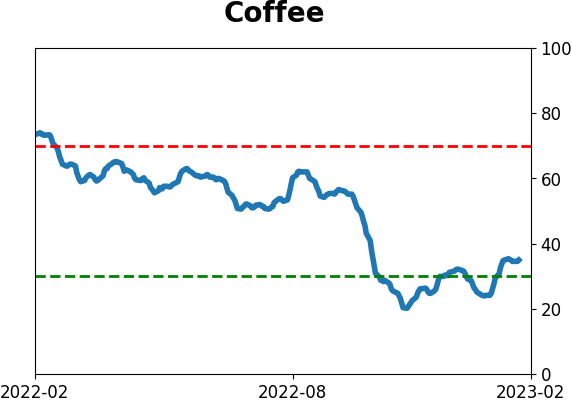
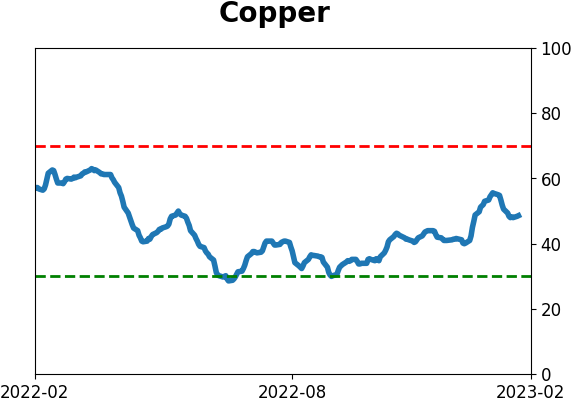
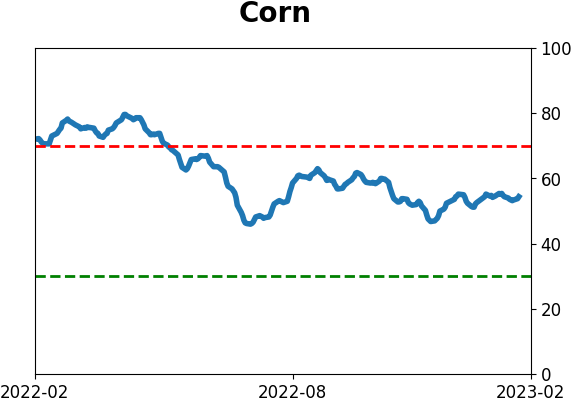
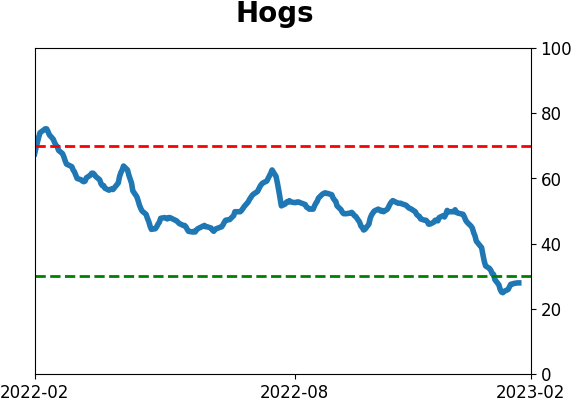
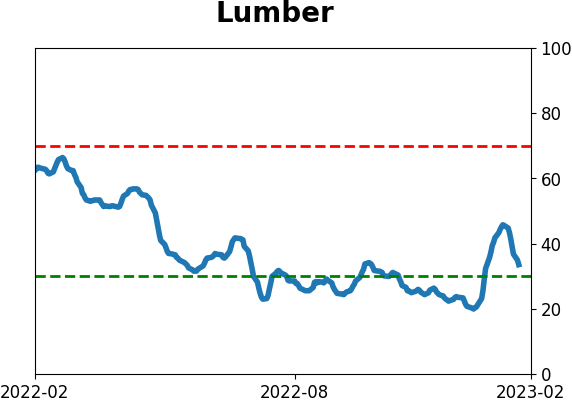
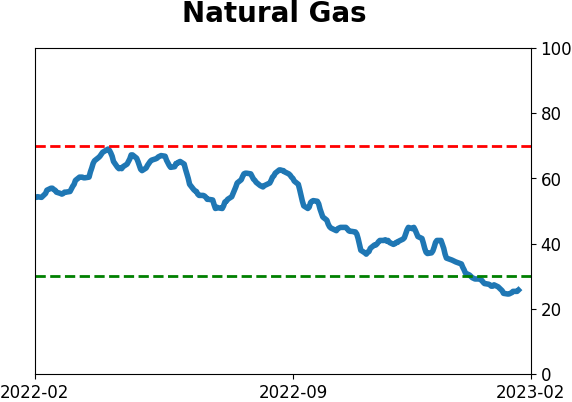
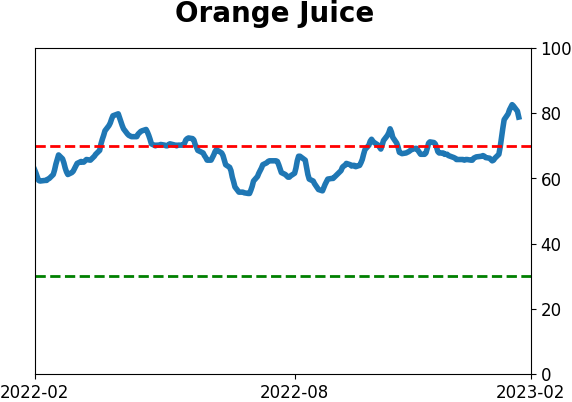
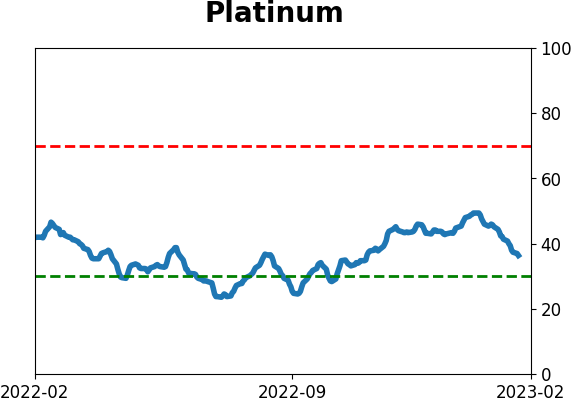
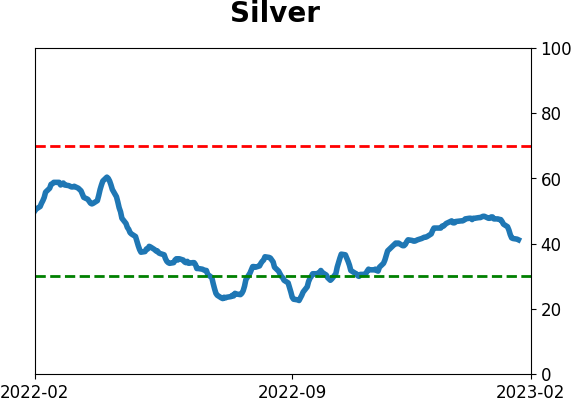
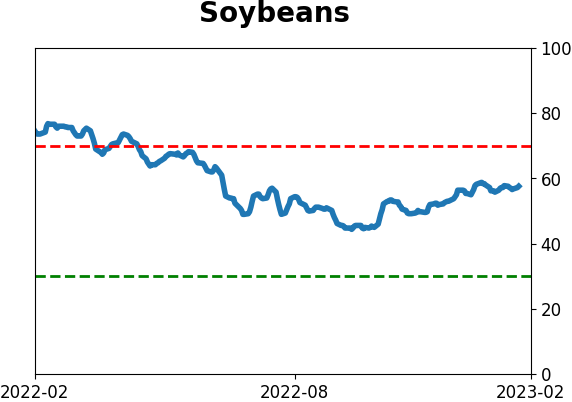
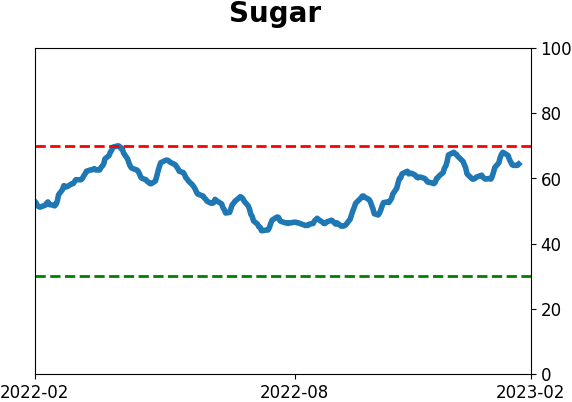
Optimism Index Thumbnails
|
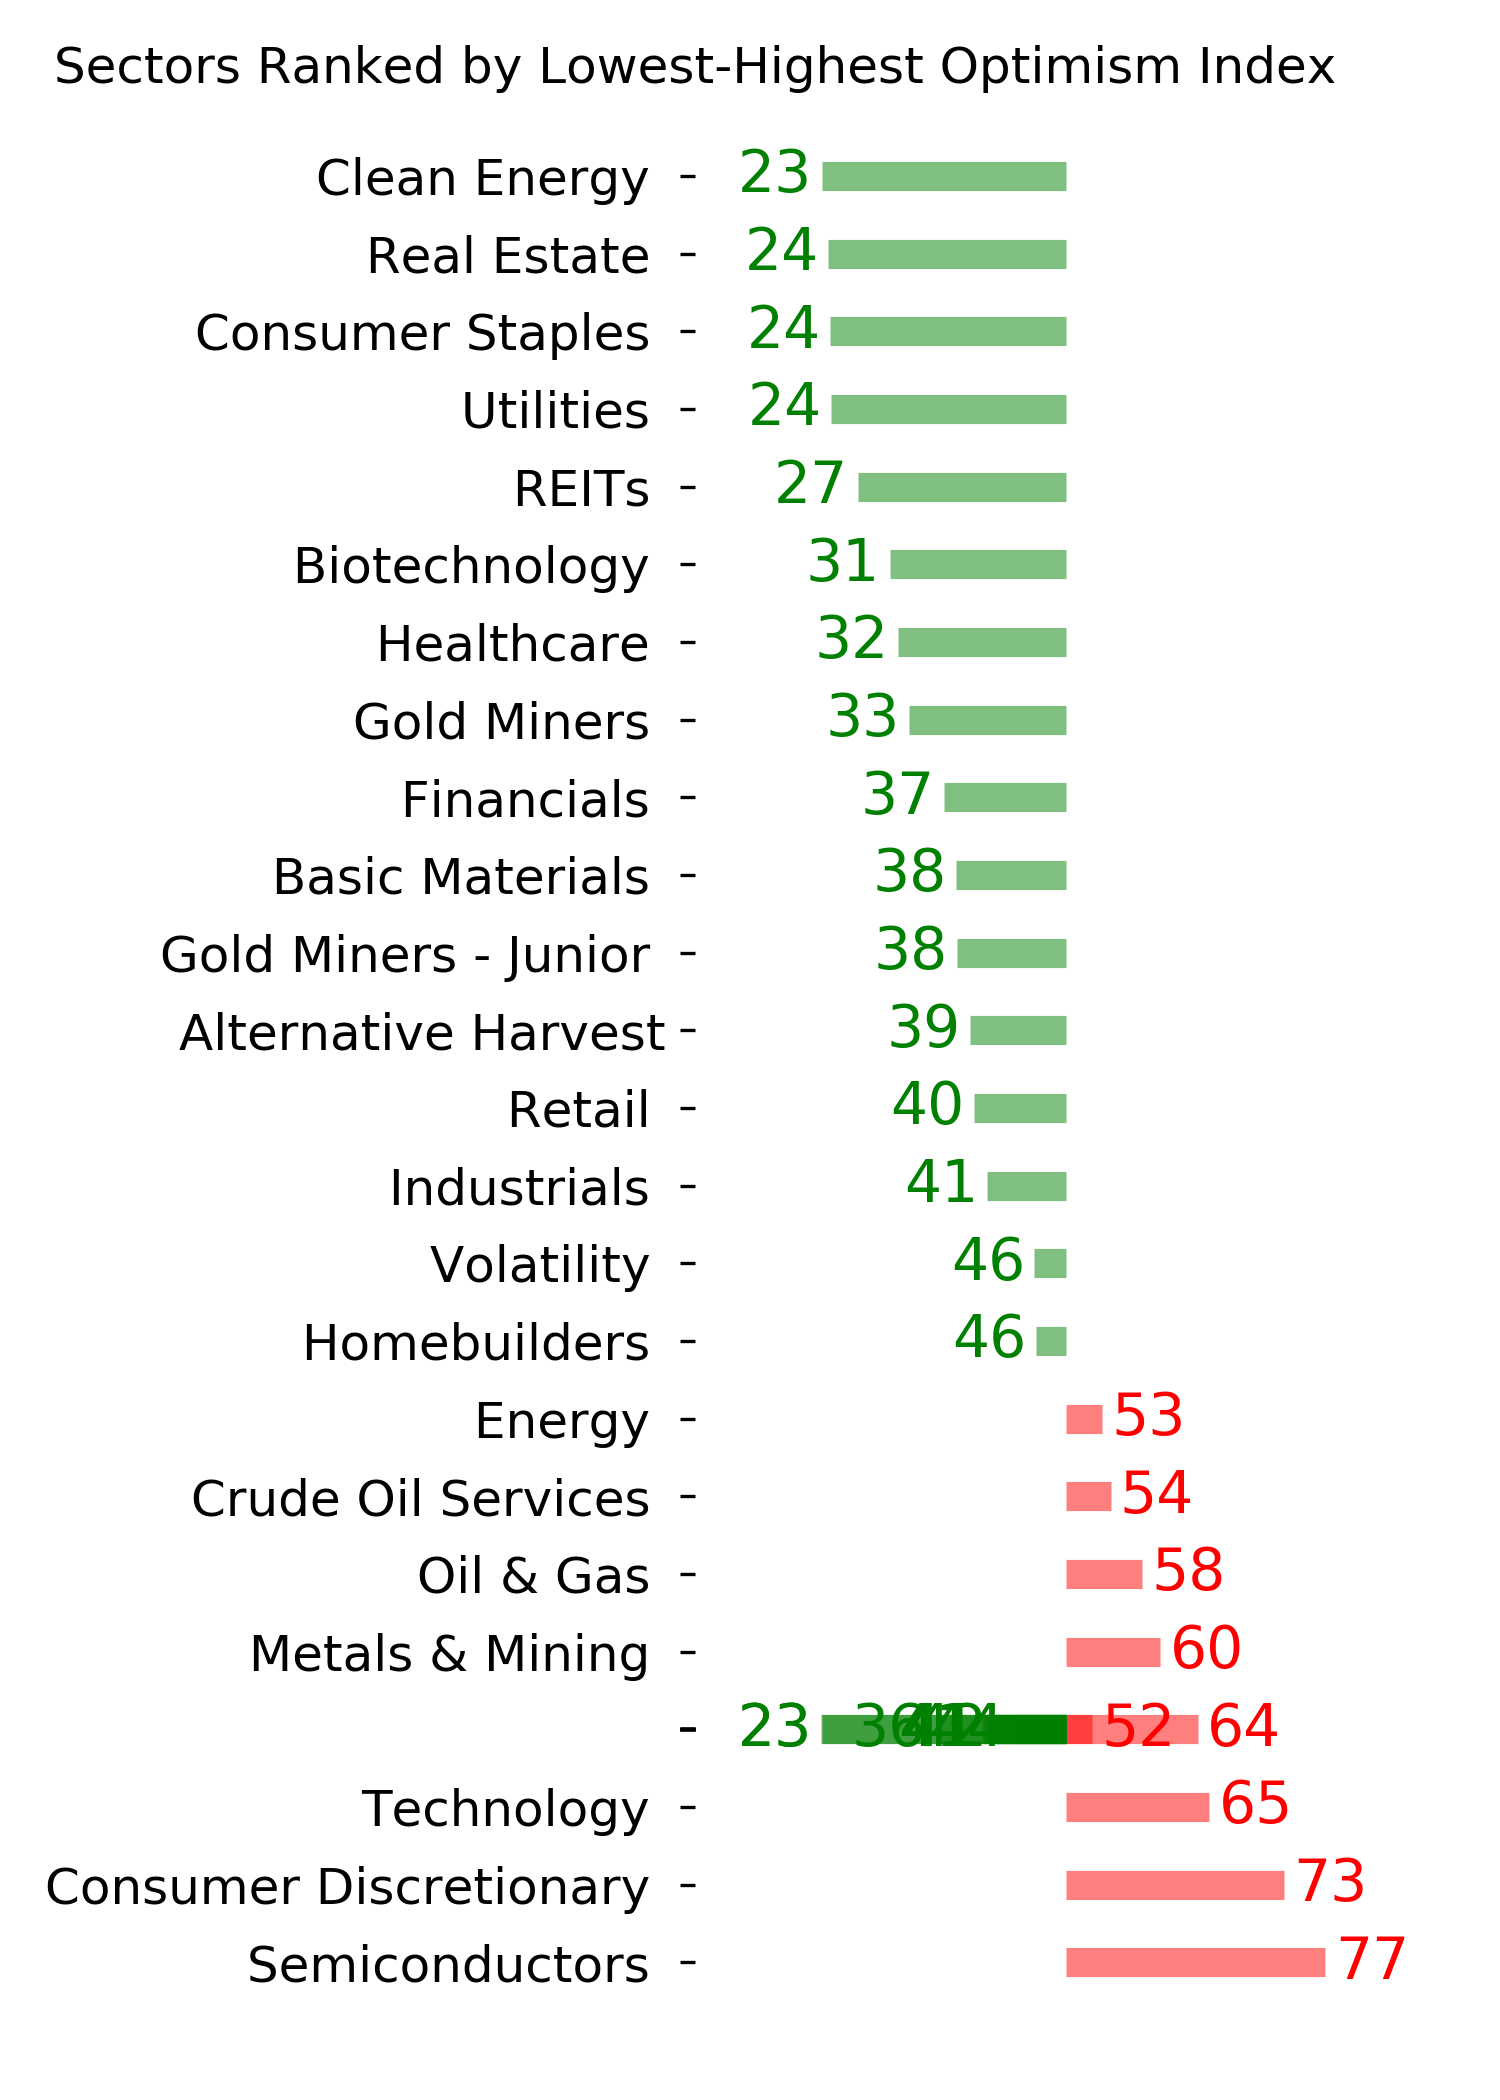
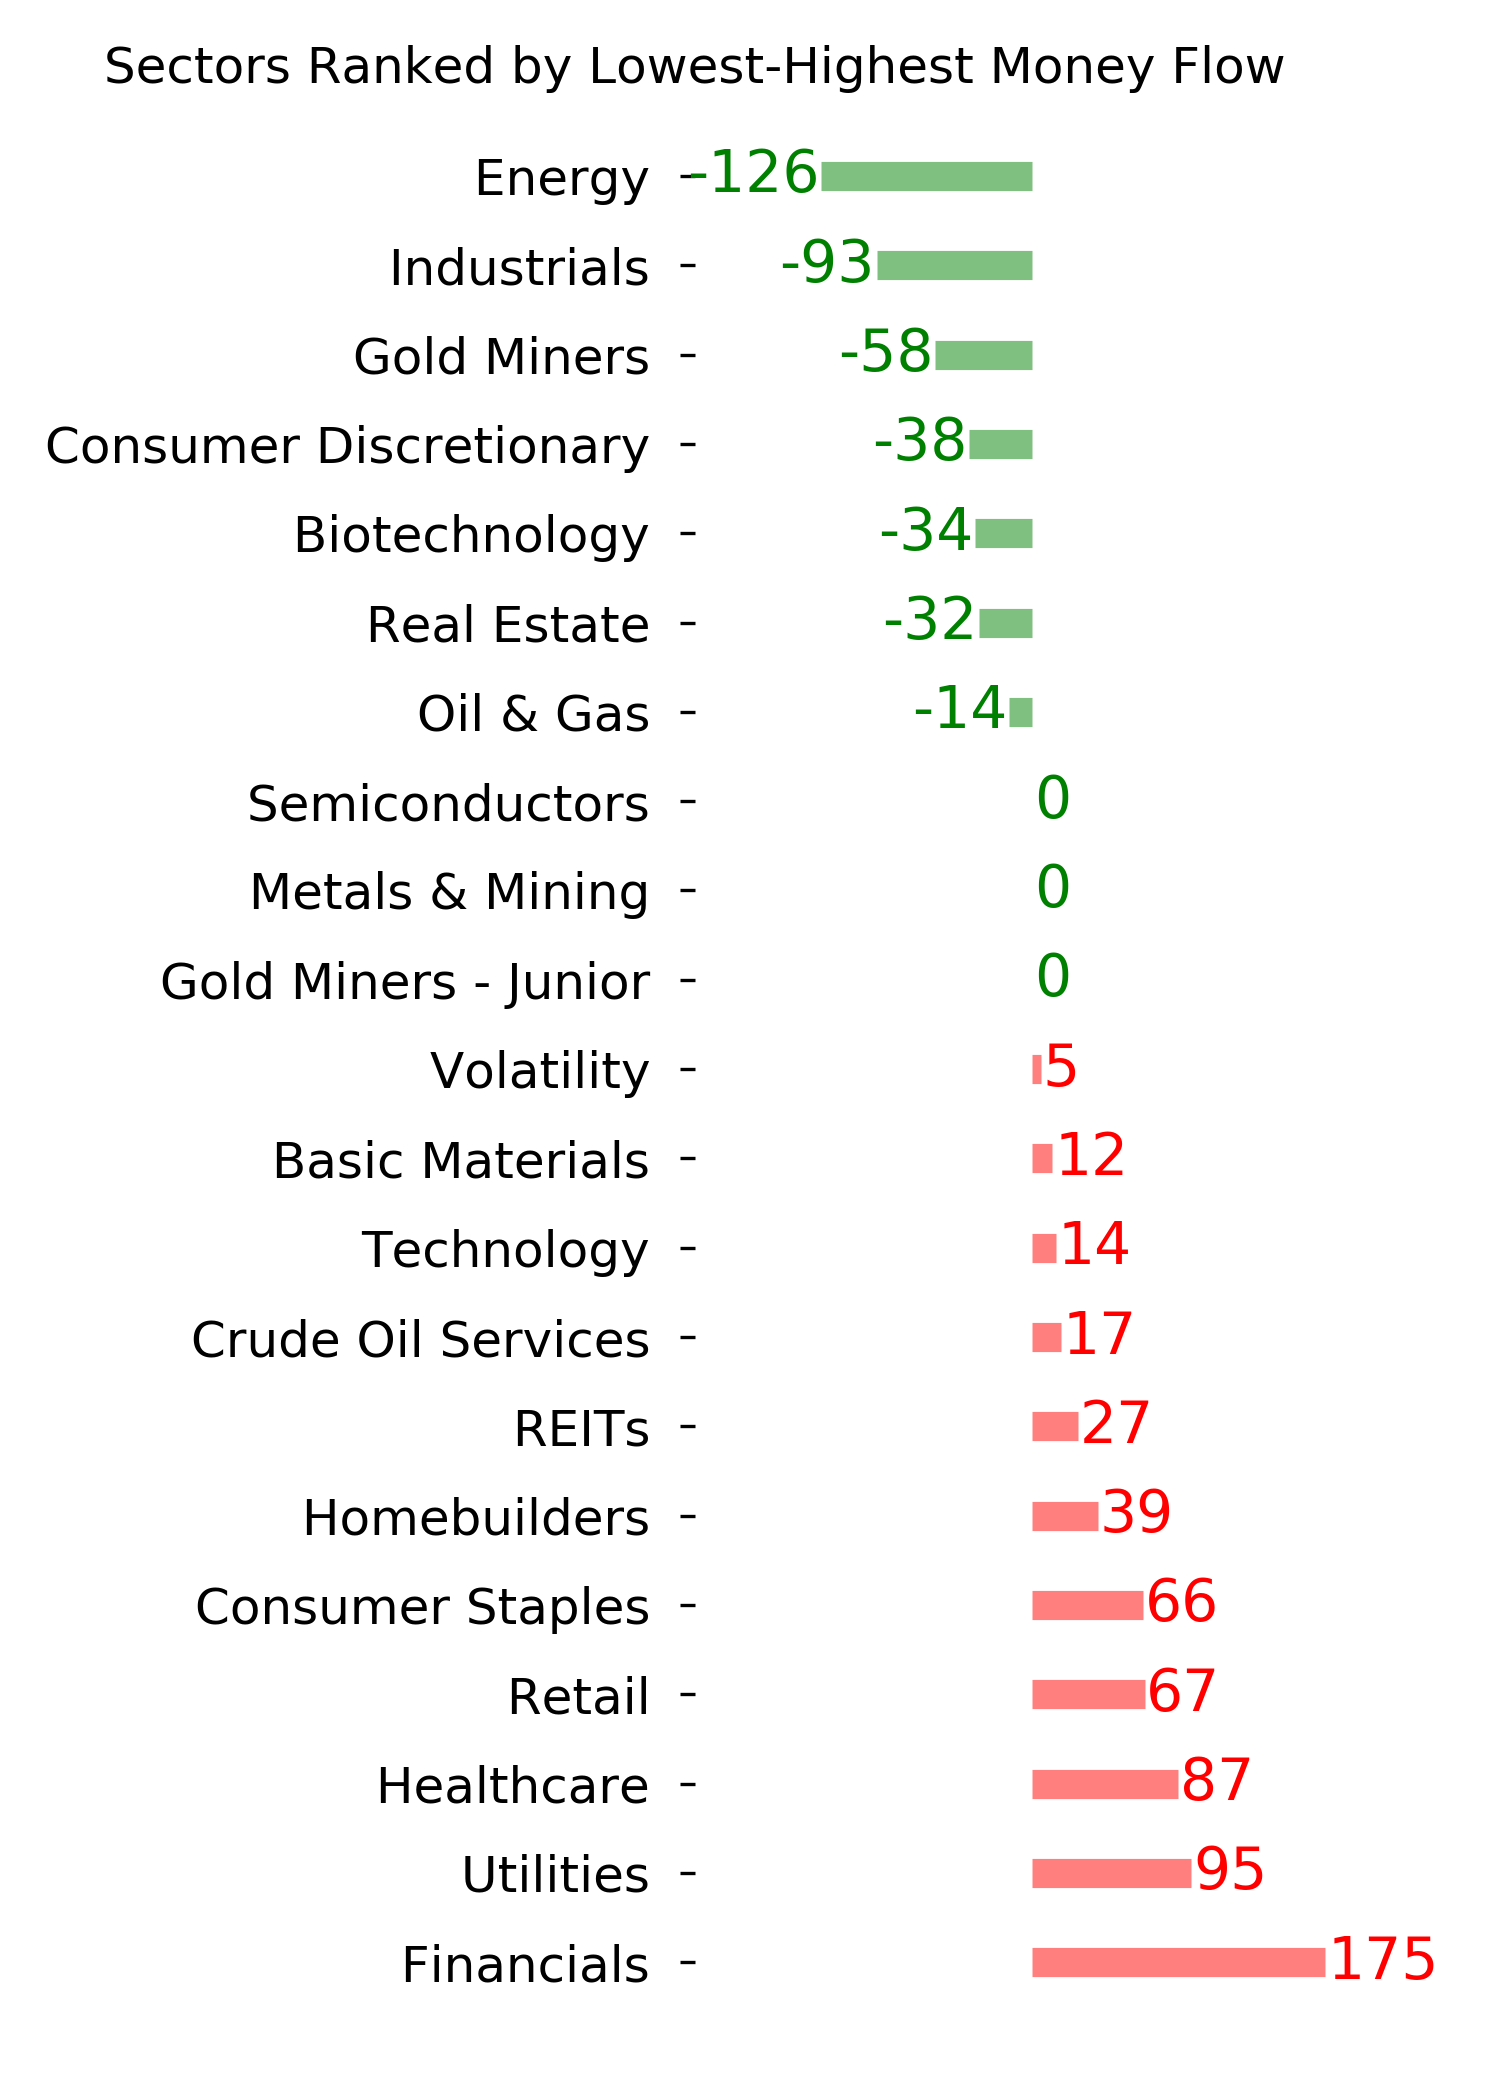
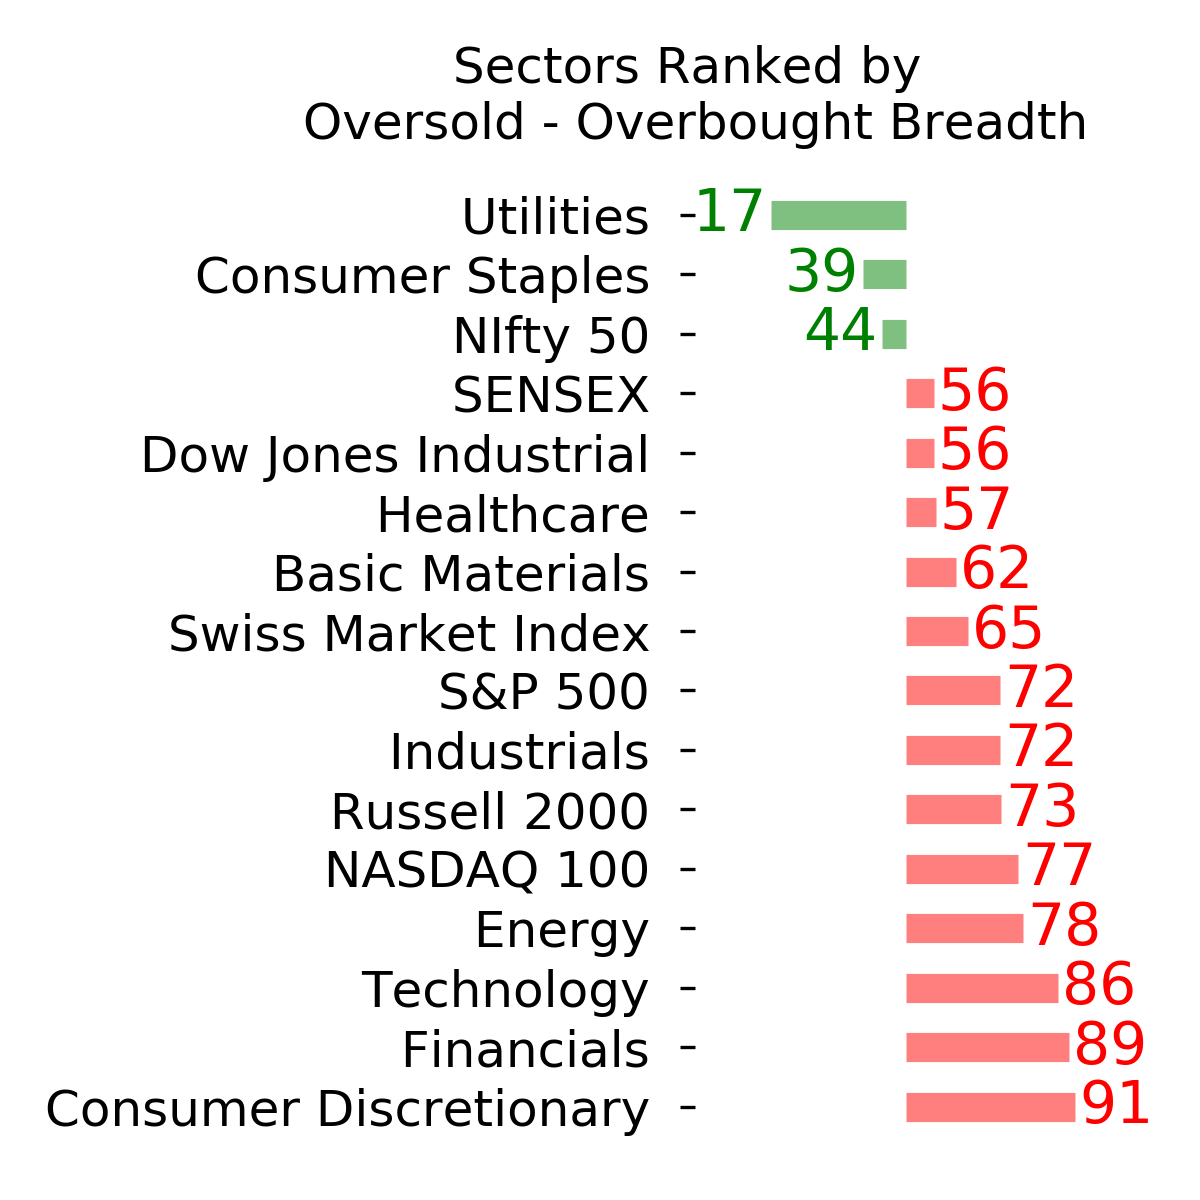
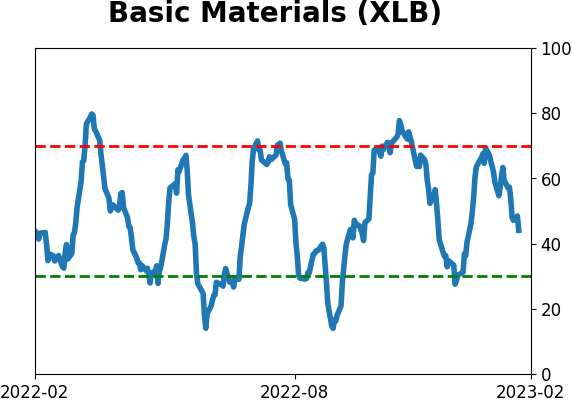
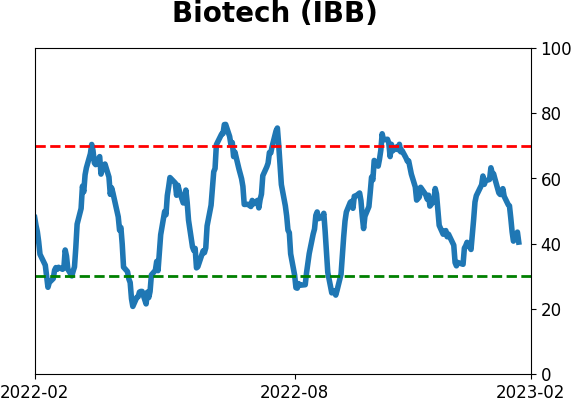
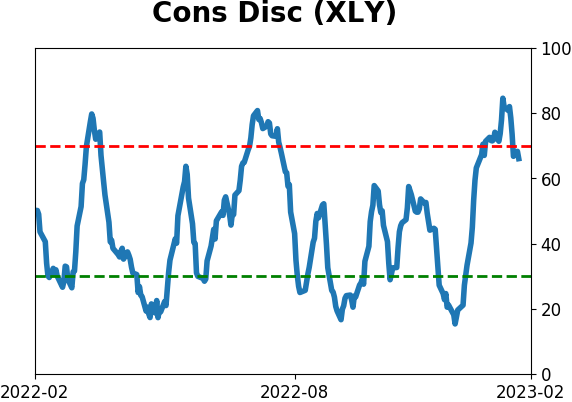
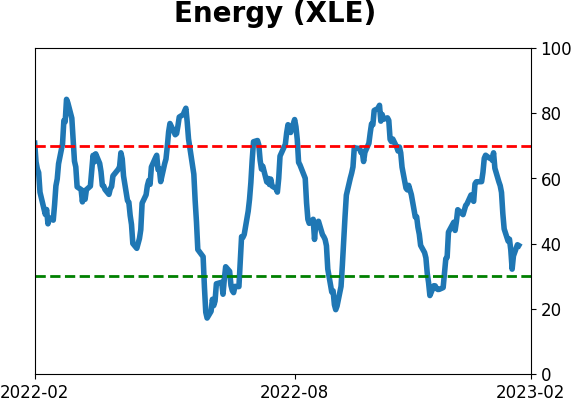
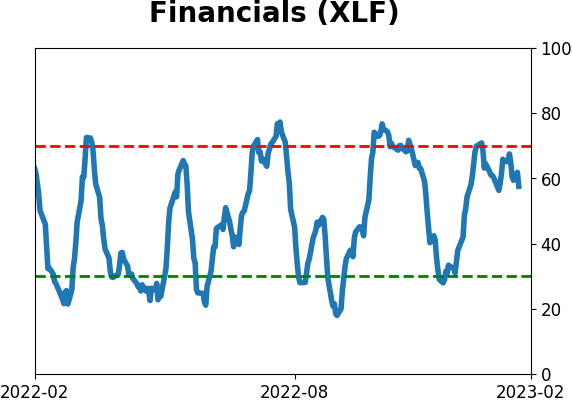
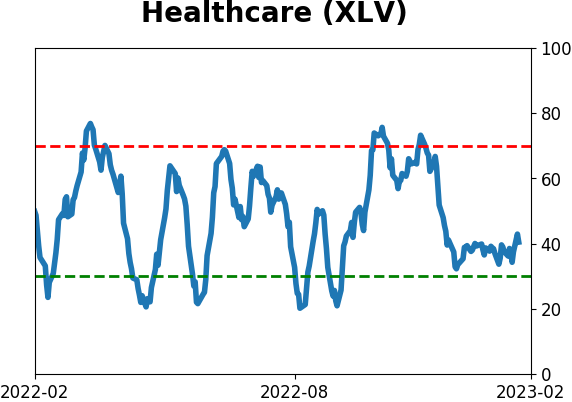
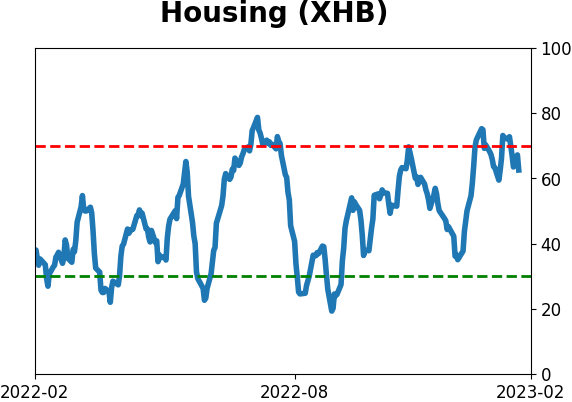
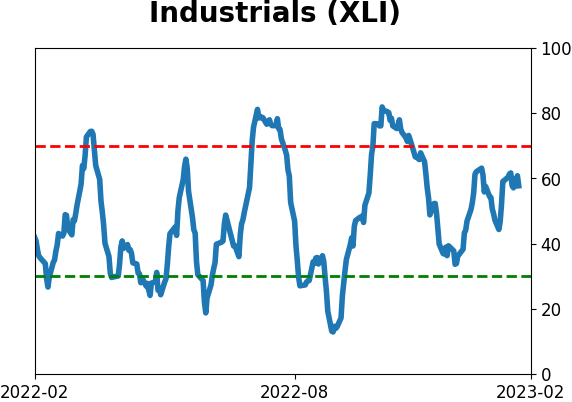
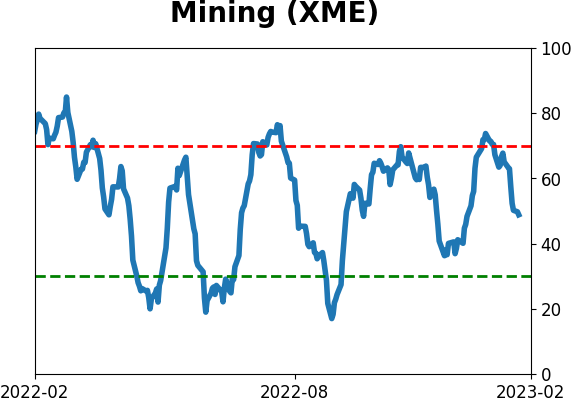
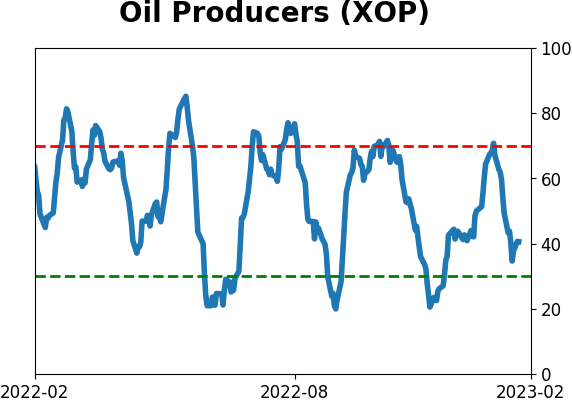
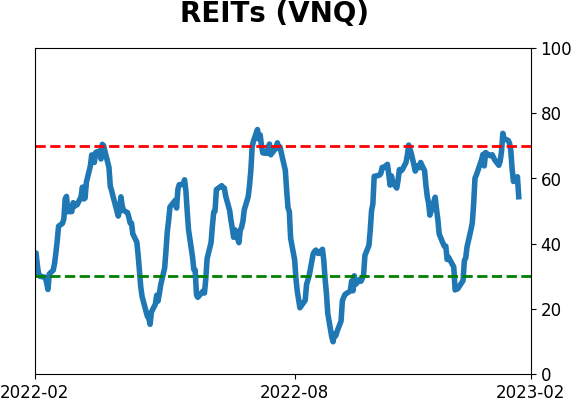
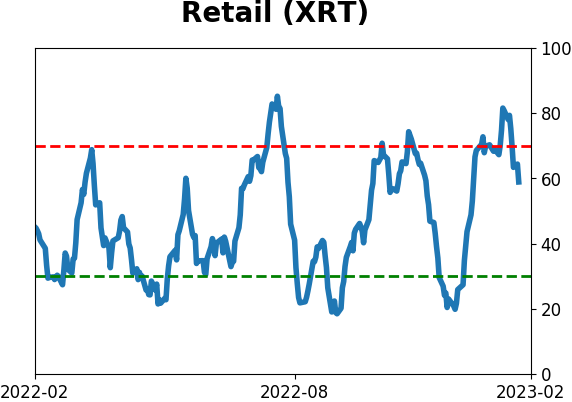
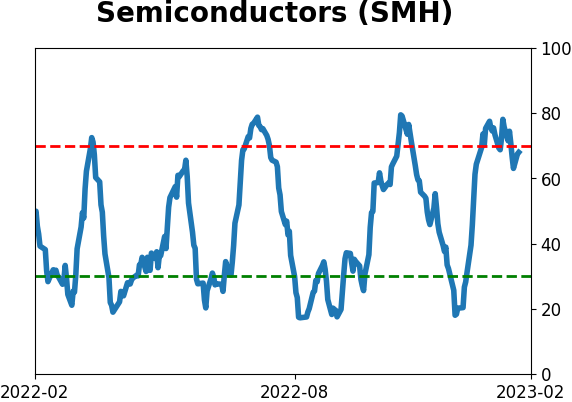
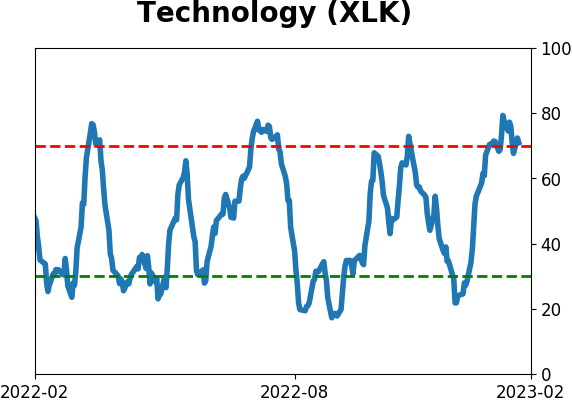
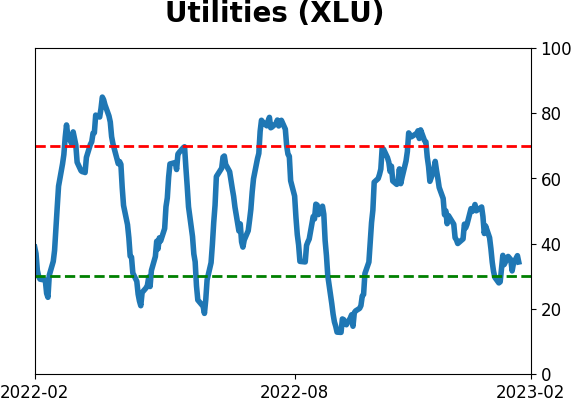
Sector ETF's - 10-Day Moving Average
|
|
|
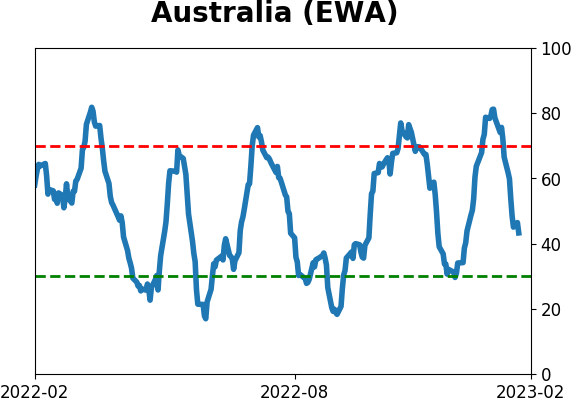
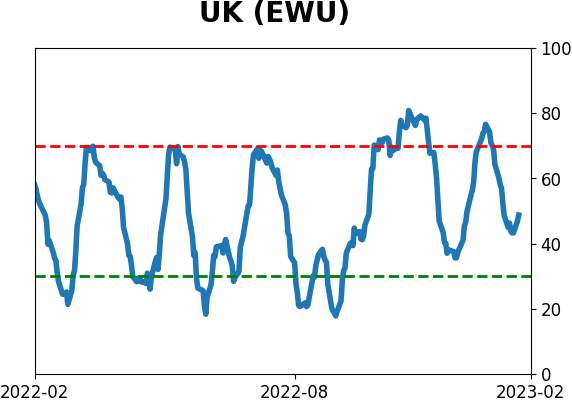
Country ETF's - 10-Day Moving Average
|
|
|
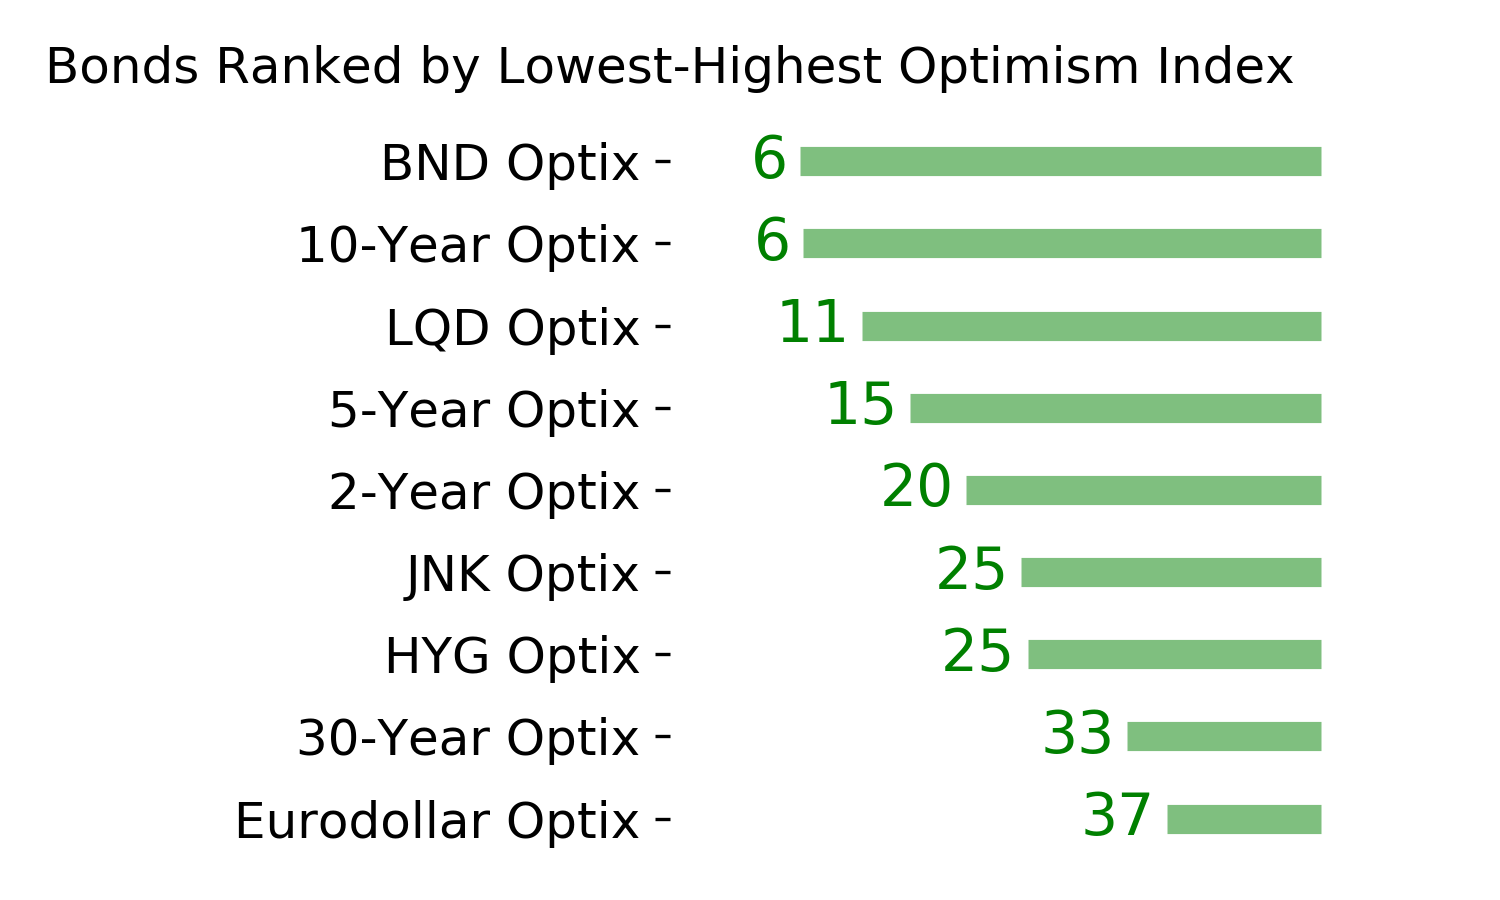
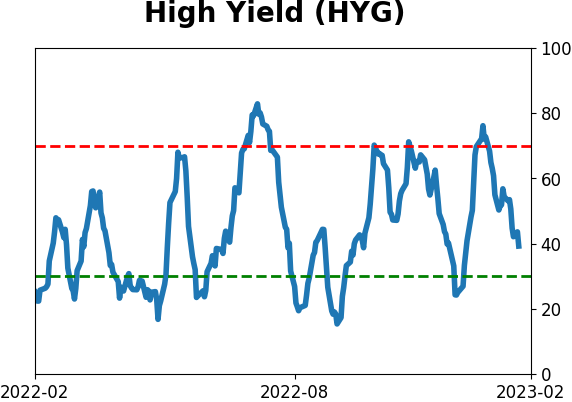
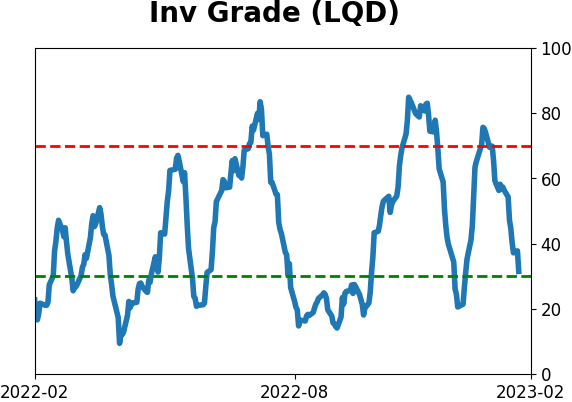
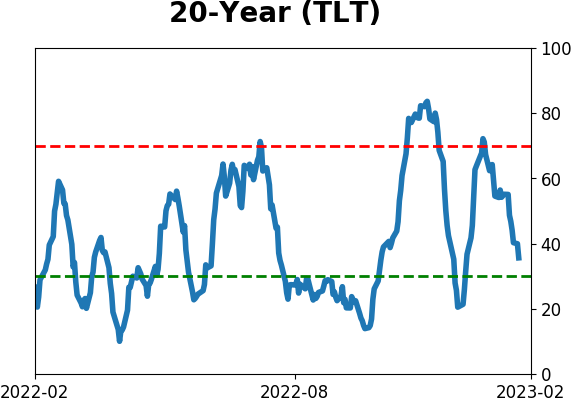
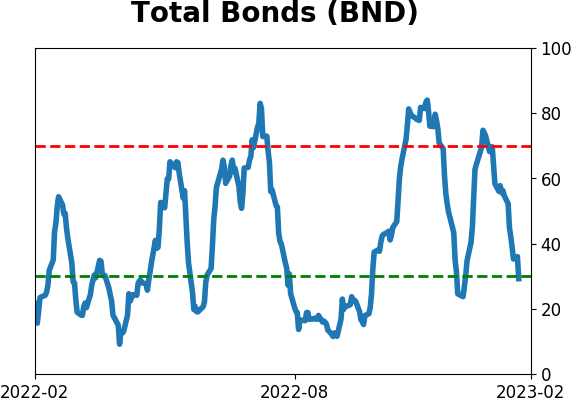
Bond ETF's - 10-Day Moving Average
|
|
|
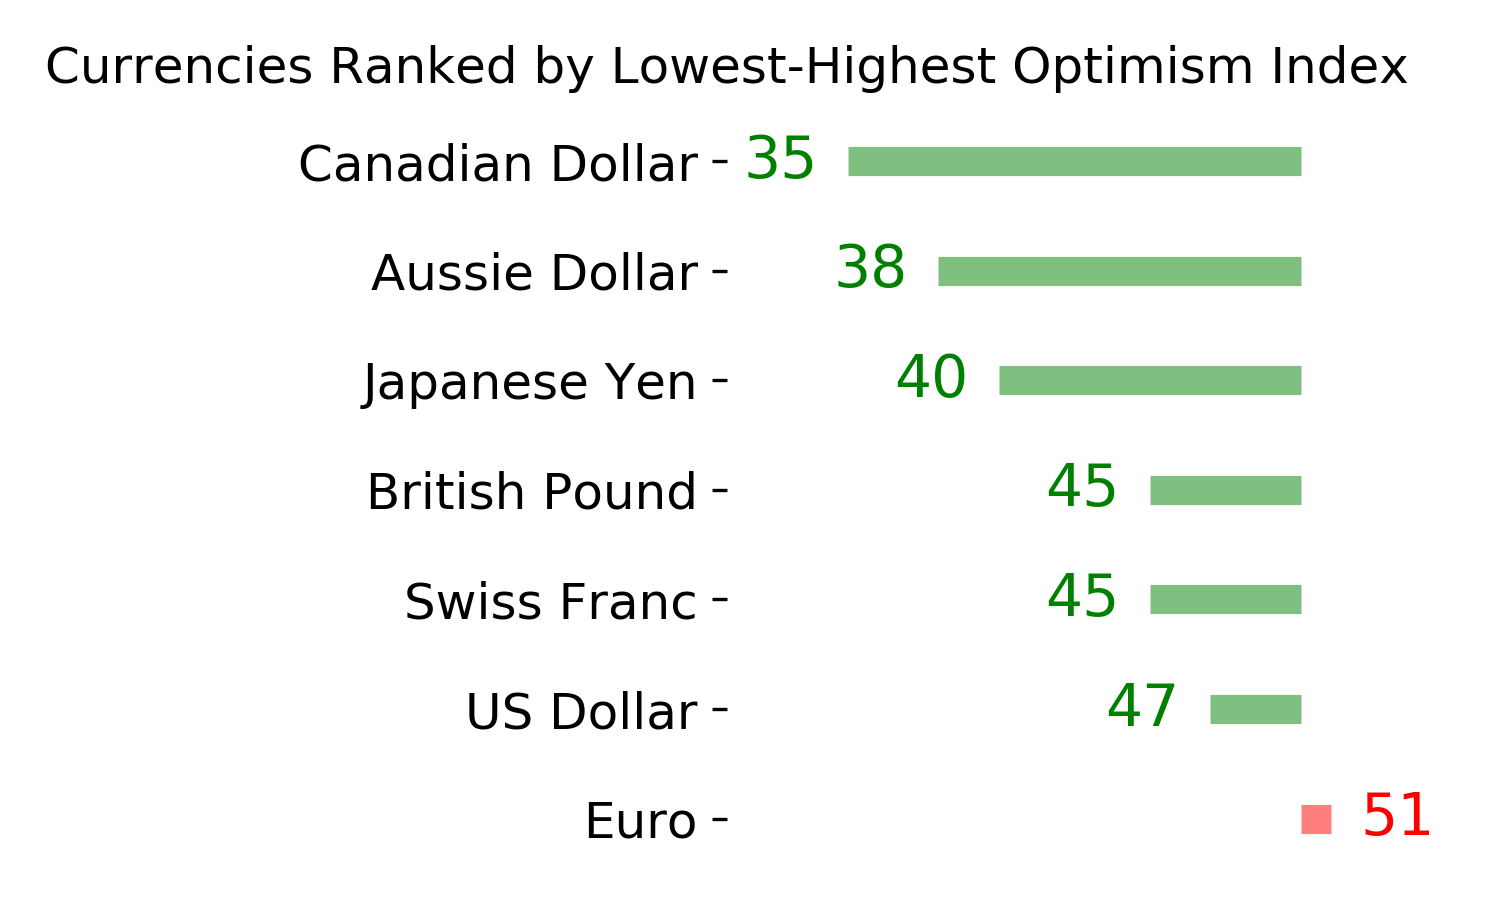
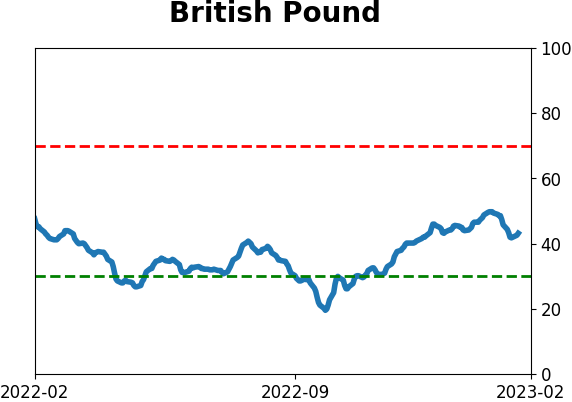
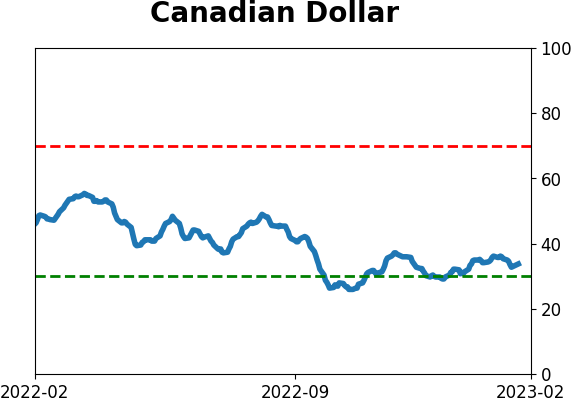
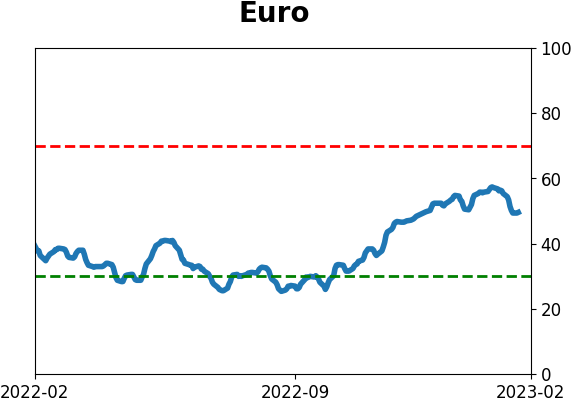
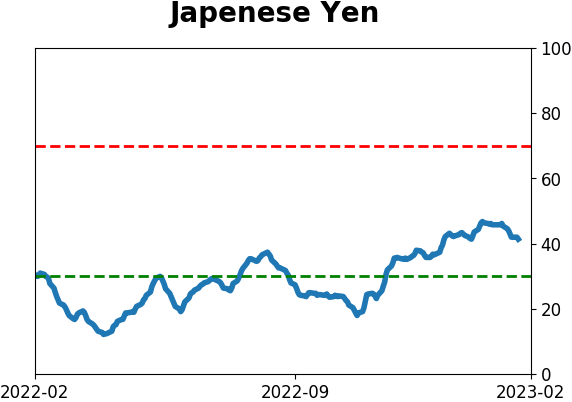
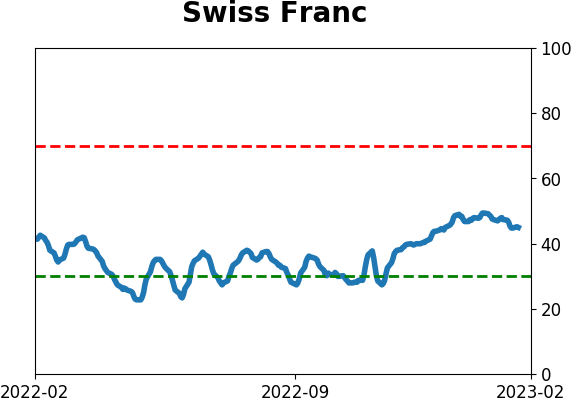
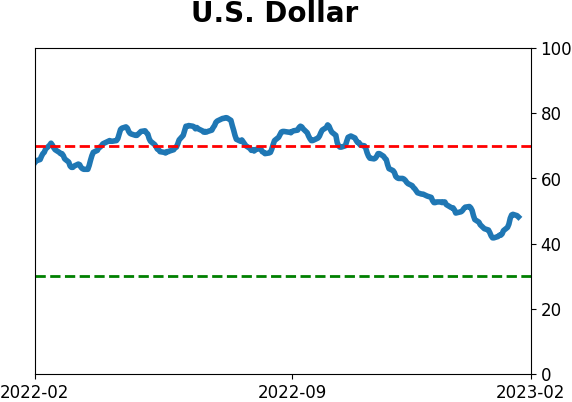
Currency ETF's - 5-Day Moving Average
|
|
|
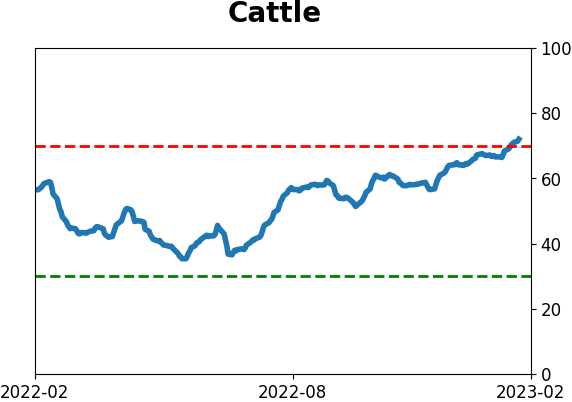
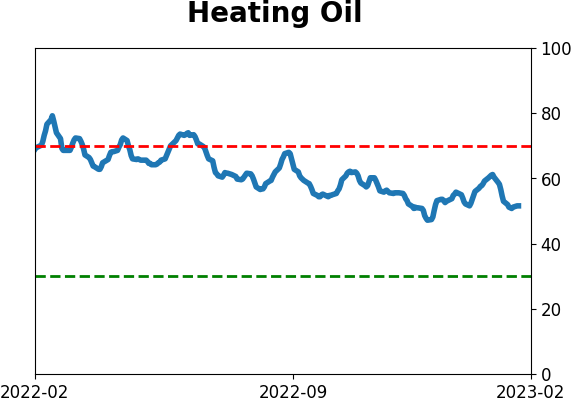
Commodity ETF's - 5-Day Moving Average
|
|