Headlines
|
|
Weekly Wrap for Feb 12 - Yet more fervor with odd volume:
Another week with displays of stunning speculative activity, even with some troubling late-day selling pressure. Internal momentum is still mostly positive, though. There has been a big surge in commodities, which have a seasonal tailwind (some of them, anyway).
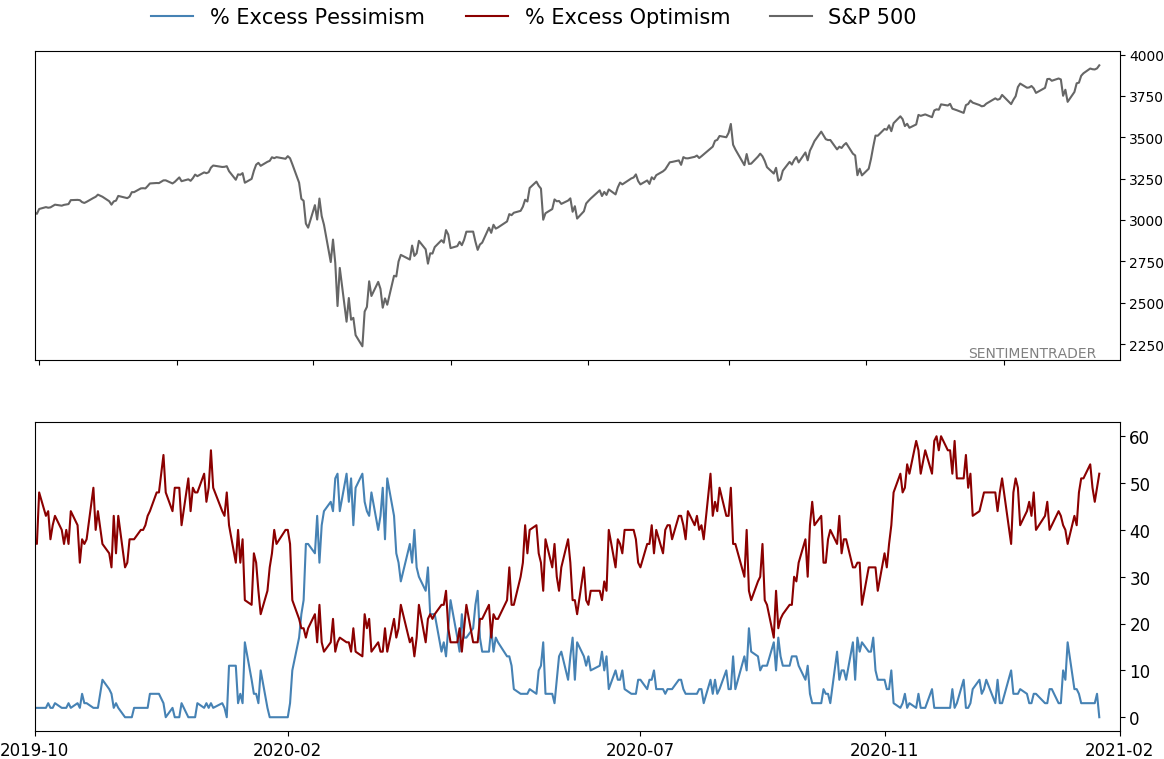
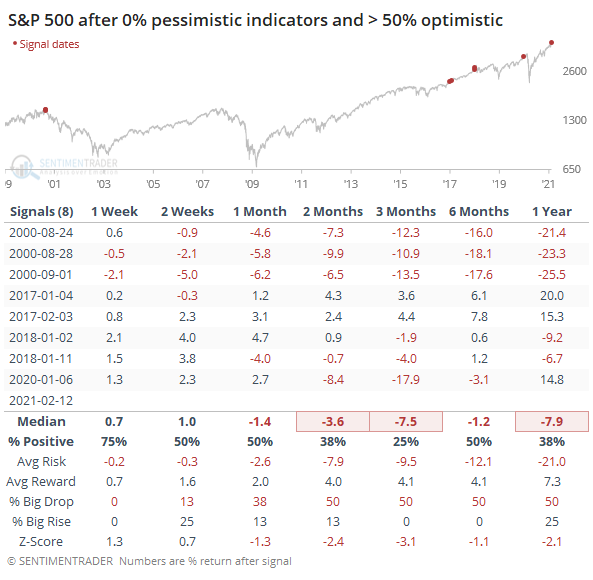
Another extreme in extremes: For the first time since January 2020, as of Friday's close, not a single one of our core indicators is showing pessimism, while more than 50% of them are showing optimism. It didn't have any impact during the nothing-matters momo market in 2017, while the others showed high risk.
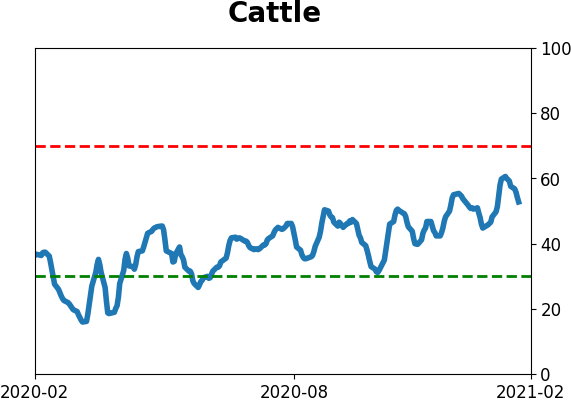
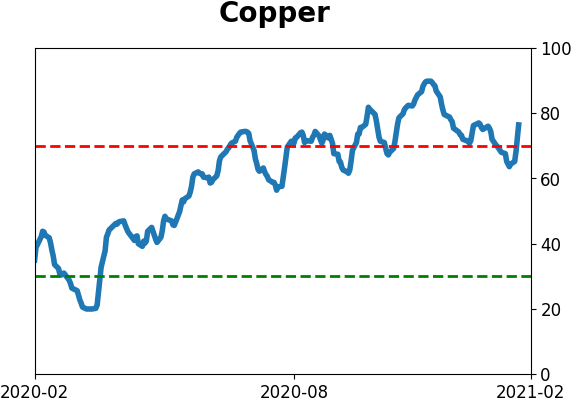
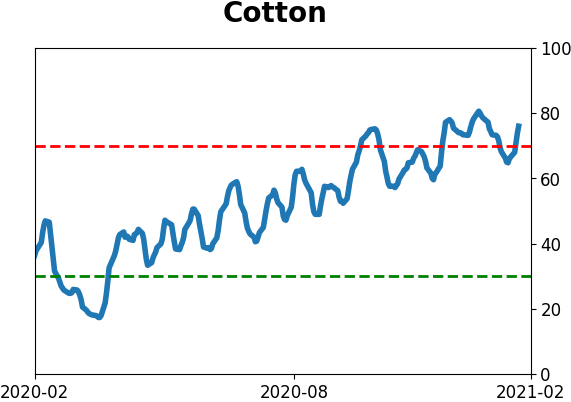
The latest Commitments of Traders report was released, covering positions through Tuesday: The 3-Year Min/Max Screen shows another week of relative quiet for "smart money" commercial hedgers, with no new extremes of note. They remain heavily short the "C"s - cattle, copper, cotton, corn, and crude, and it hasn't changed much in recent weeks. They added a bit more to already-heavy long exposure in 30-year Treasuries and now hold more than 19% of the open interest net long. The Backtest Engine shows that funds like TLT showed a gain over the next 6 months 82% of the time, averaging 8.0%, when they held this much net long. A caveat is that they're just barely net long 10-year Treasuries and don't seem to be in a hurry to add. Hedgers reduced their net short in major equity index futures and are now holding only about $5 billion worth of contracts against them. That should be a good sign - at least they're not shorting heavily - but this data has acted strangely since the early summer and that makes it a bit tough to rely on it too heavily. Another caveat is that they've been adding to VIX futures, too, and now hold more than 145,000 contracts net long. Of the 37 other weeks they've held this many contracts, the VIX was higher 6 months later 34 times averaging more than 100% per the Backtest Engine.
Bottom Line:
See the Outlook & Allocations page for more details on these summaries STOCKS: Weak sell
We're in an extremely speculative environment that is enough to become defensive, especially with recent cracks showing in what had been pristine breadth conditions. The spike in fear from a couple of weeks ago has dissipated and likely not enough to offset the negatives over a medium-term time frame. BONDS: Weak buy
Various parts of the market have been hit in recent weeks, with mild oversold conditions. Treasuries have been hit hard and will likely start to register some extremes soon. GOLD: Weak buy
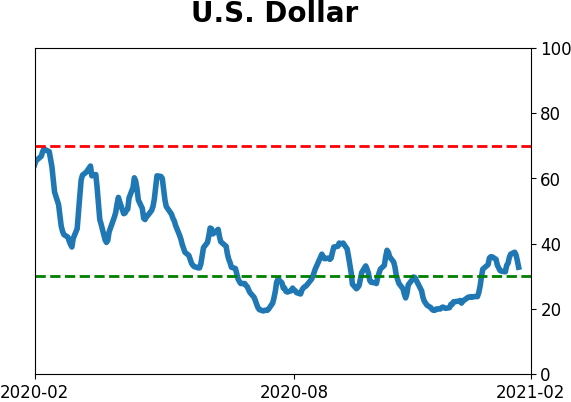
A dollar trying to rebound from a severe short position has weighed on gold and miners. The types of signals they've given in recent weeks, within the context of their recent surge, have usually resulted in higher prices over a medium- to long-term time frame.
|
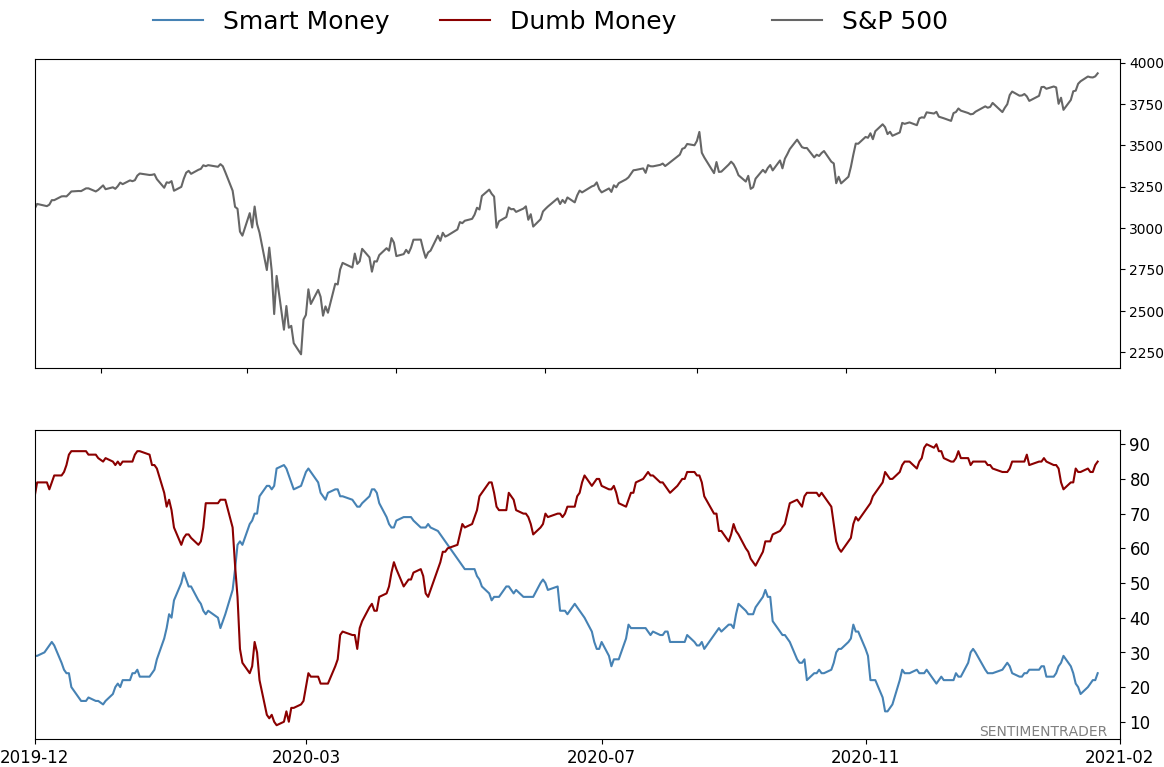
Smart / Dumb Money Confidence
|
Smart Money Confidence: 24%
Dumb Money Confidence: 85%
|
|
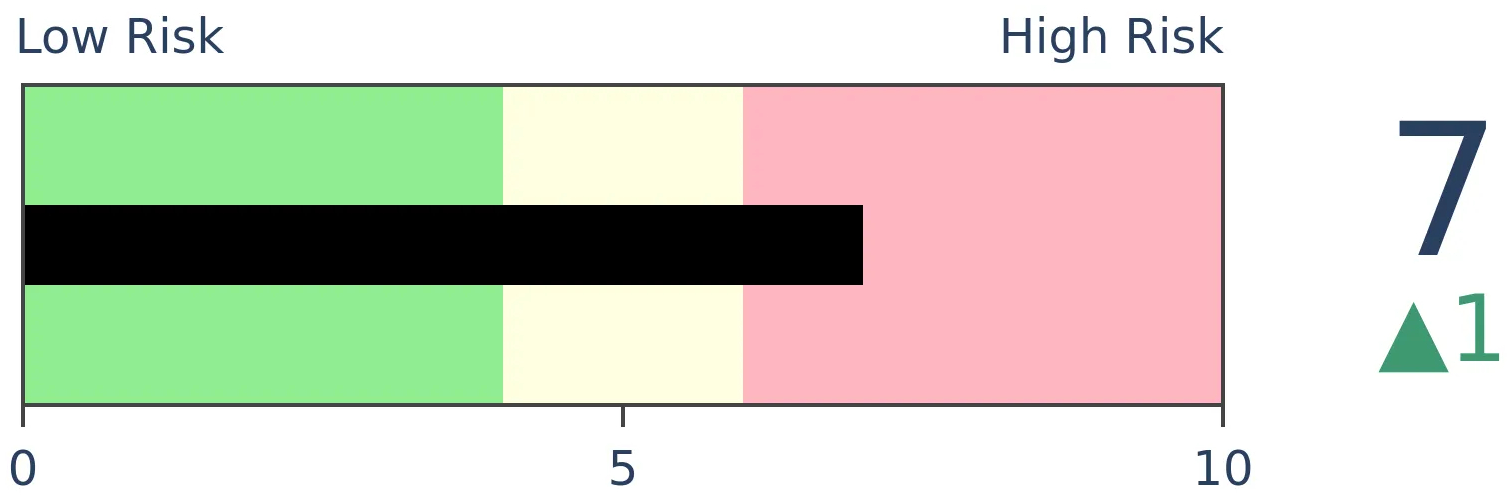
Risk Levels
Stocks Short-Term
|
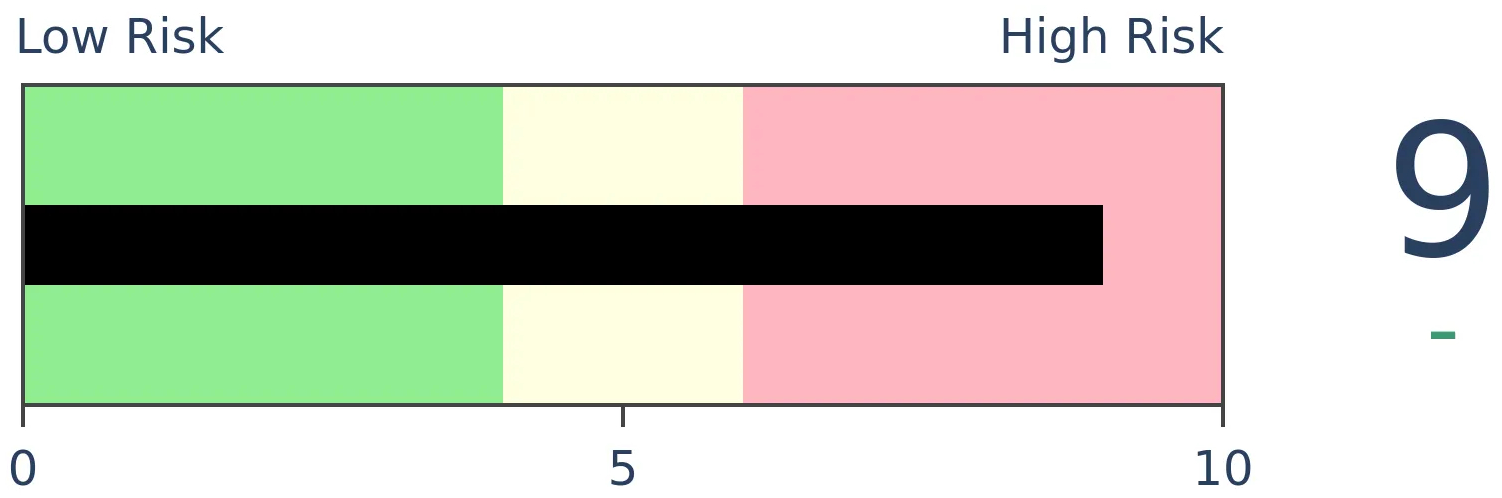
Stocks Medium-Term
|
|
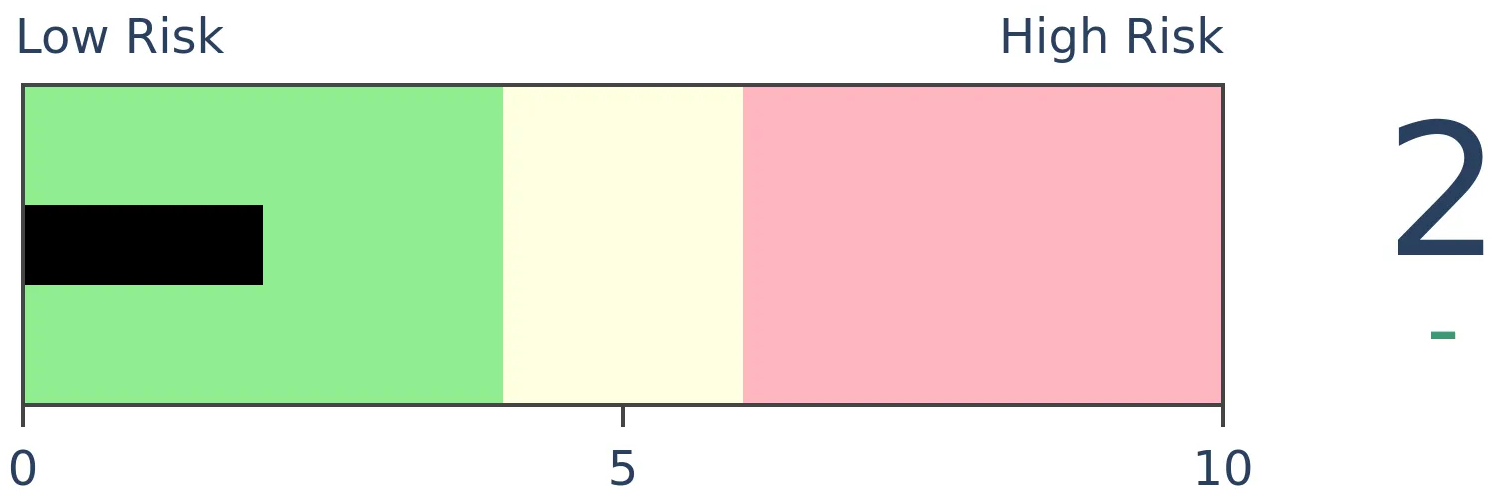
Bonds

|
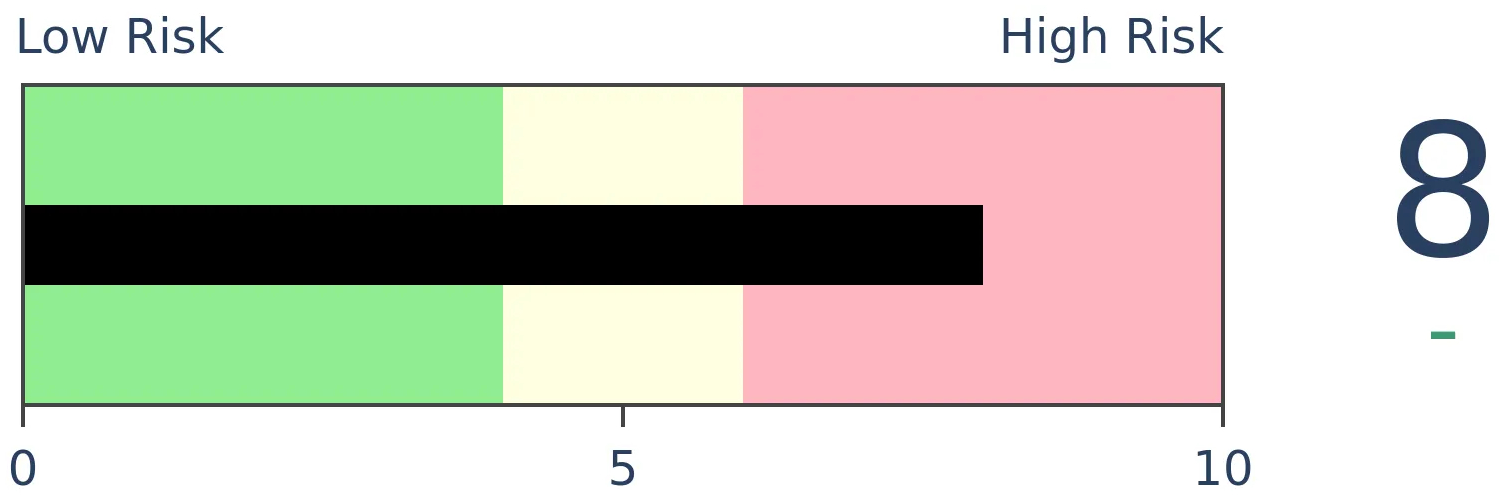
Crude Oil

|
|
Gold
|
Agriculture
|
|
Research
BOTTOM LINE
Another week with displays of stunning speculative activity, even with some troubling late-day selling pressure. Internal momentum is still mostly positive, though. There has been a big surge in commodities, which have a seasonal tailwind (some of them, anyway).
FORECAST / TIMEFRAME
None
|
The goal of the Weekly Wrap is to summarize our recent research. Some of it includes premium content (underlined links), but we're highlighting the key focus of the research for all. Sometimes there is a lot to digest, with this summary meant to highlight the highest conviction ideas we discussed. Tags will show any related symbols and time frames related to the research.
| STOCKS |
 |
|
|
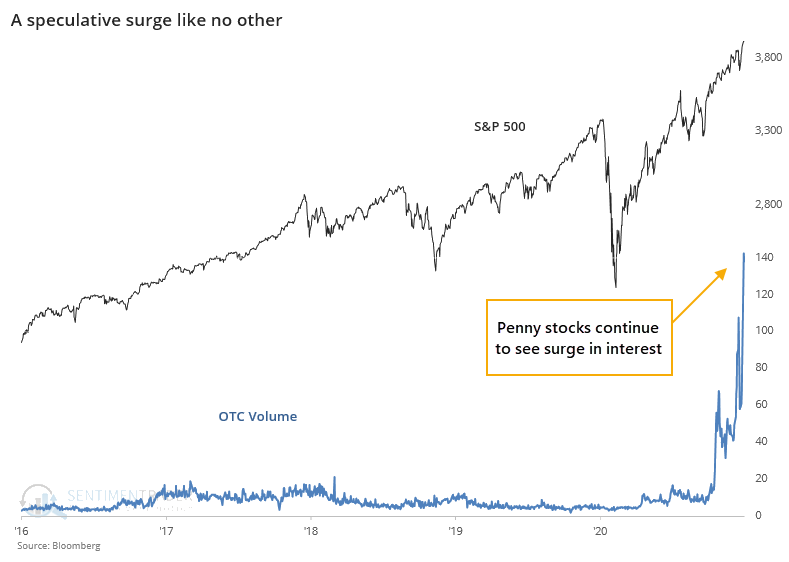
The roaming horde of speculators found that niche in December, with more than 1 trillion shares traded. It picked up even more in January. A Bloomberg calculation of over-the-counter activity has continued to rocket higher this week. We haven't seen anything anywhere near this type of speculative activity in the past 5 years, at least.
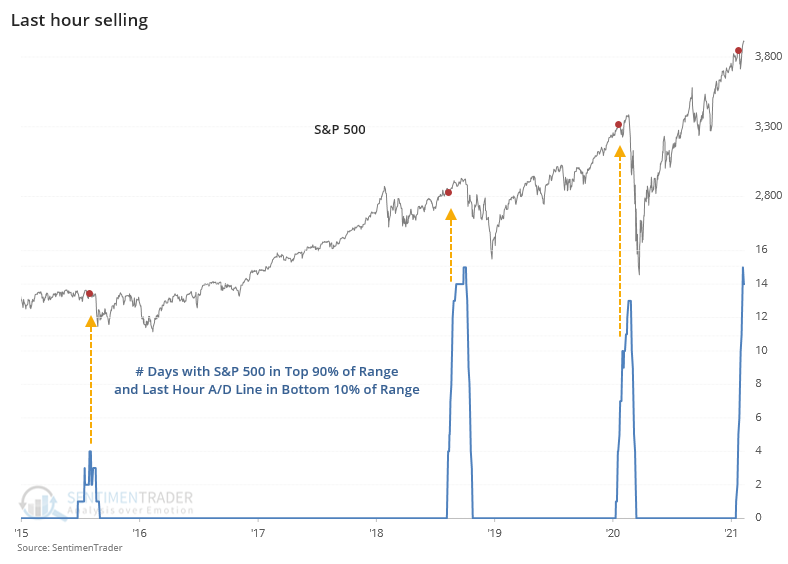
And yet, during the last hour of trading, stocks have been struggling, arguably a sign of "smart money" selling.
We calculate a cumulative advance/decline line of last-hour activity. If the S&P 500 rises during the last hour, then this indicator adds 1 to its running total; if the S&P sees selling to end the day, then the indicator subtracts 1. We've seen so much last-hour selling lately that this has been hovering near its lowest level since 2016.
There have never been so many days with this measure near its lows while the S&P is near its highs. Its recent record is especially troubling.
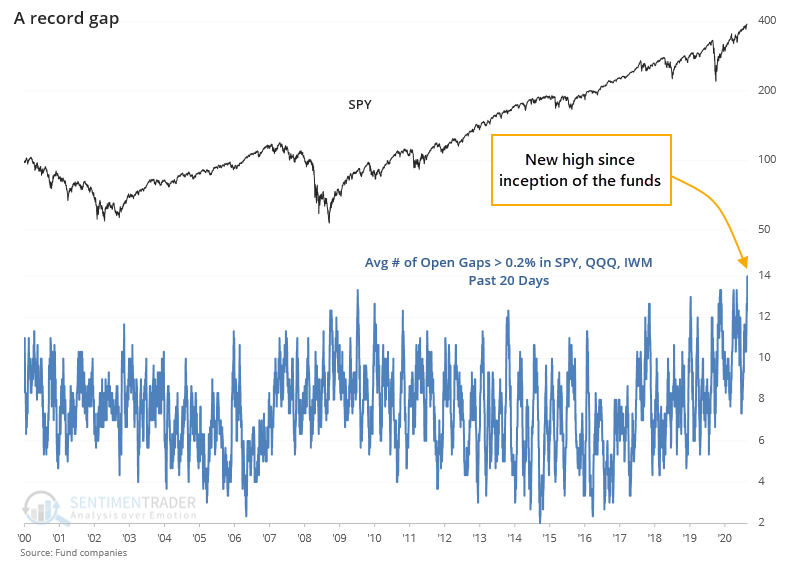
Much of the recent gain has come overnight. Futures traders have been pushing the major indexes higher seemingly every day. And not just for marginal gains of a few points. On 14 out of the past 20 sessions, the S&P 500 fund, SPY, has gapped up at the open by at least 0.2%, nearly the biggest cluster in its history.
Averaging across SPY, QQQ, and IWM since they all came into existence more than 20 years ago, Thursday marked a new all-time high in at least moderately positive opening gaps.
All of this volume coming into stocks, particularly near the open, is activity we usually see when people are panicking. It's very odd to see volume across exchanges spike higher while implied volatility falls. Right now, volume is near the highest in 200 days while the VIX is near the lowest.
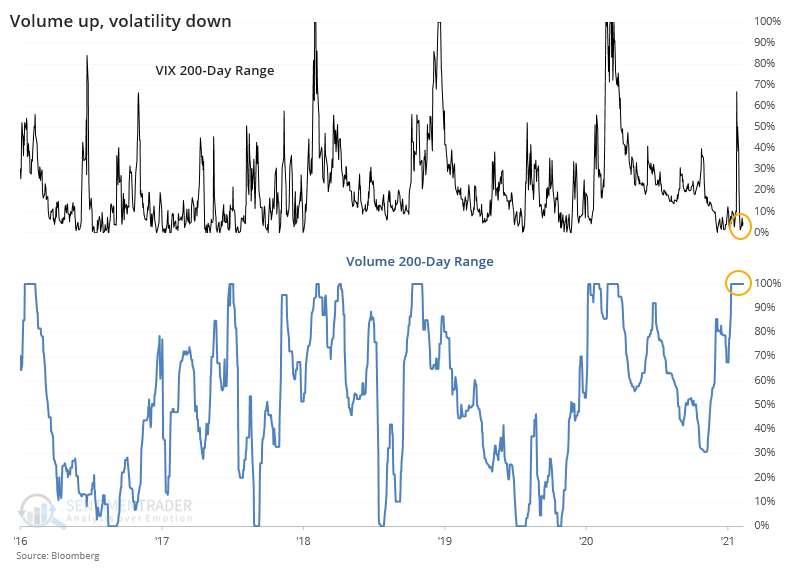
This happened in 2017 before a sustained trend higher, but the other instances since 1997 typically led to minor gains or, more commonly, losses over the next couple of months.
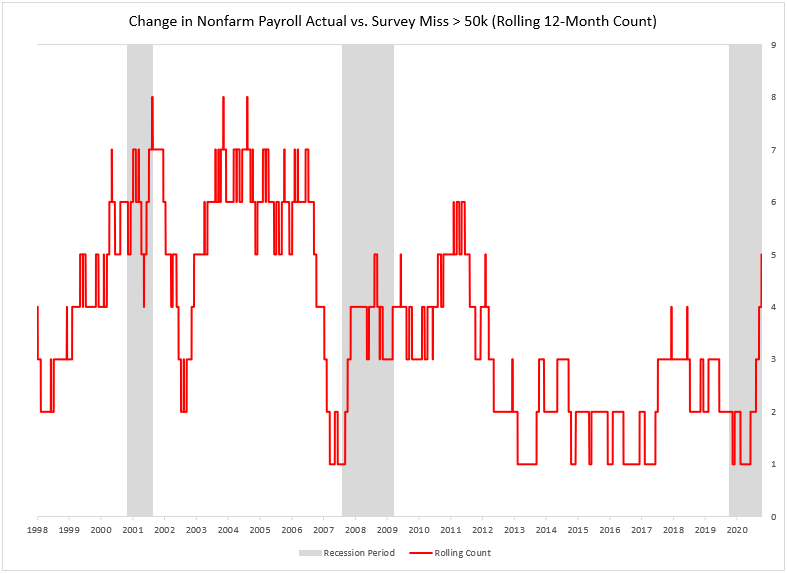
Stocks have continued to climbed despite potentially negative fundamentals, in some senses. Dean pointed out that big misses on the Nonfarm Payroll report have been increasing. They've had a fairly consistent tendency for next-day returns across various markets, but perhaps most notably, misses are the highest since 2011.
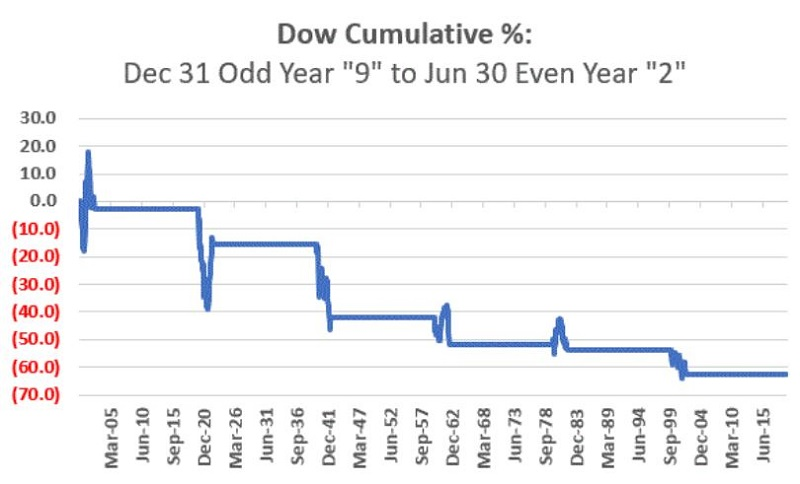
Jay highlighted the idea that seasonality "is climate, not weather," and we're still in a seasonally unpleasant part of a 20-year cycle that started in 2019. Other cycles showed consistently poor returns.
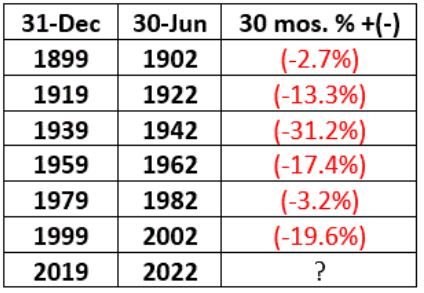
Figure 2 displays the cumulative results of buying and holding the Dow ONLY from Dec 31st of "odd" year 9 through June 30th of "even" year 2, from 1899 to the present.
Internal momentum (mostly) continues to roll along, though, which has been the biggest caveat against becoming too bearish, too soon.
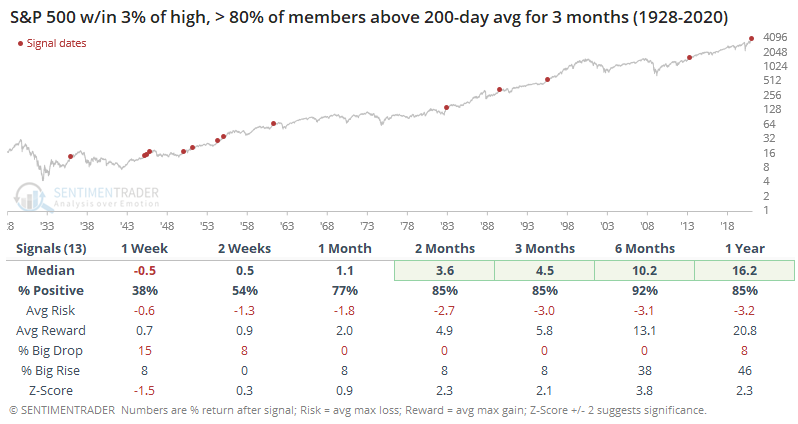
A "normal" market sees some oscillations back and forth in the number of stocks in uptrends, but not this one. The percentage of stocks above their long-term averages has been stuck at a high level since that note three months ago. Going back to 1928, this is one of the longest streaks that so many stocks have traded above their 200-day moving averages.
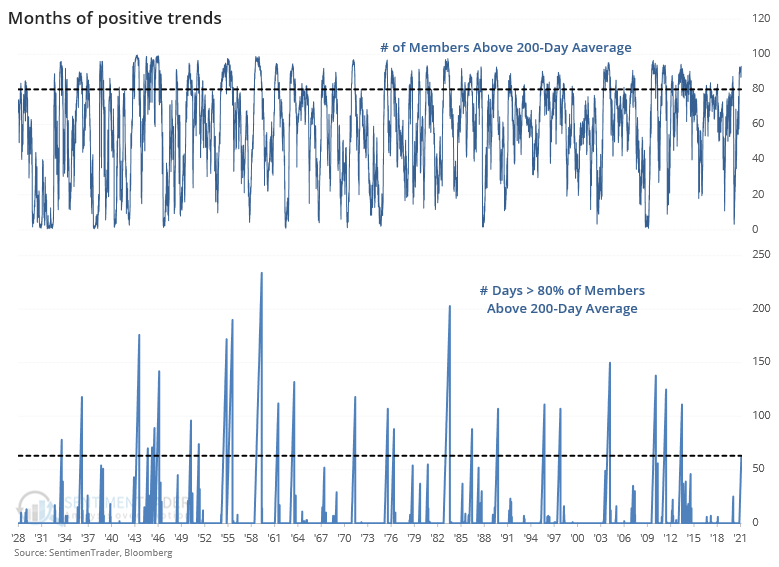
Sometimes, when we see momentum like this, it's only because stocks are climbing out of prolonged declines. It's rarer to see it when stocks are at or near a multi-year high. That didn't dent the results too much, except in the shorter-term. The next 6 months were almost perfect.
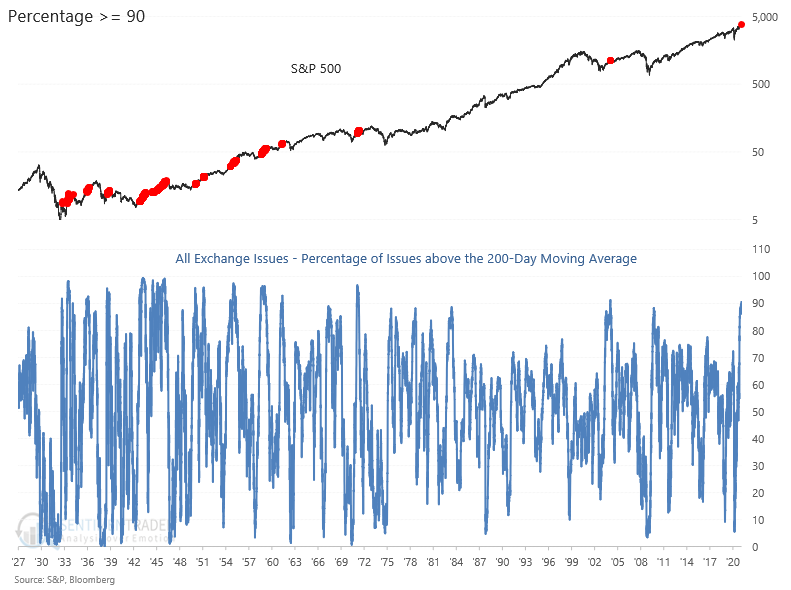
It's not just stocks within the S&P 500. Dean noted that across all exchanges, more than 90% of securities are above their 200-day average. That's a stunning figure, and again this kind of recovery has usually led to positive long-term returns.
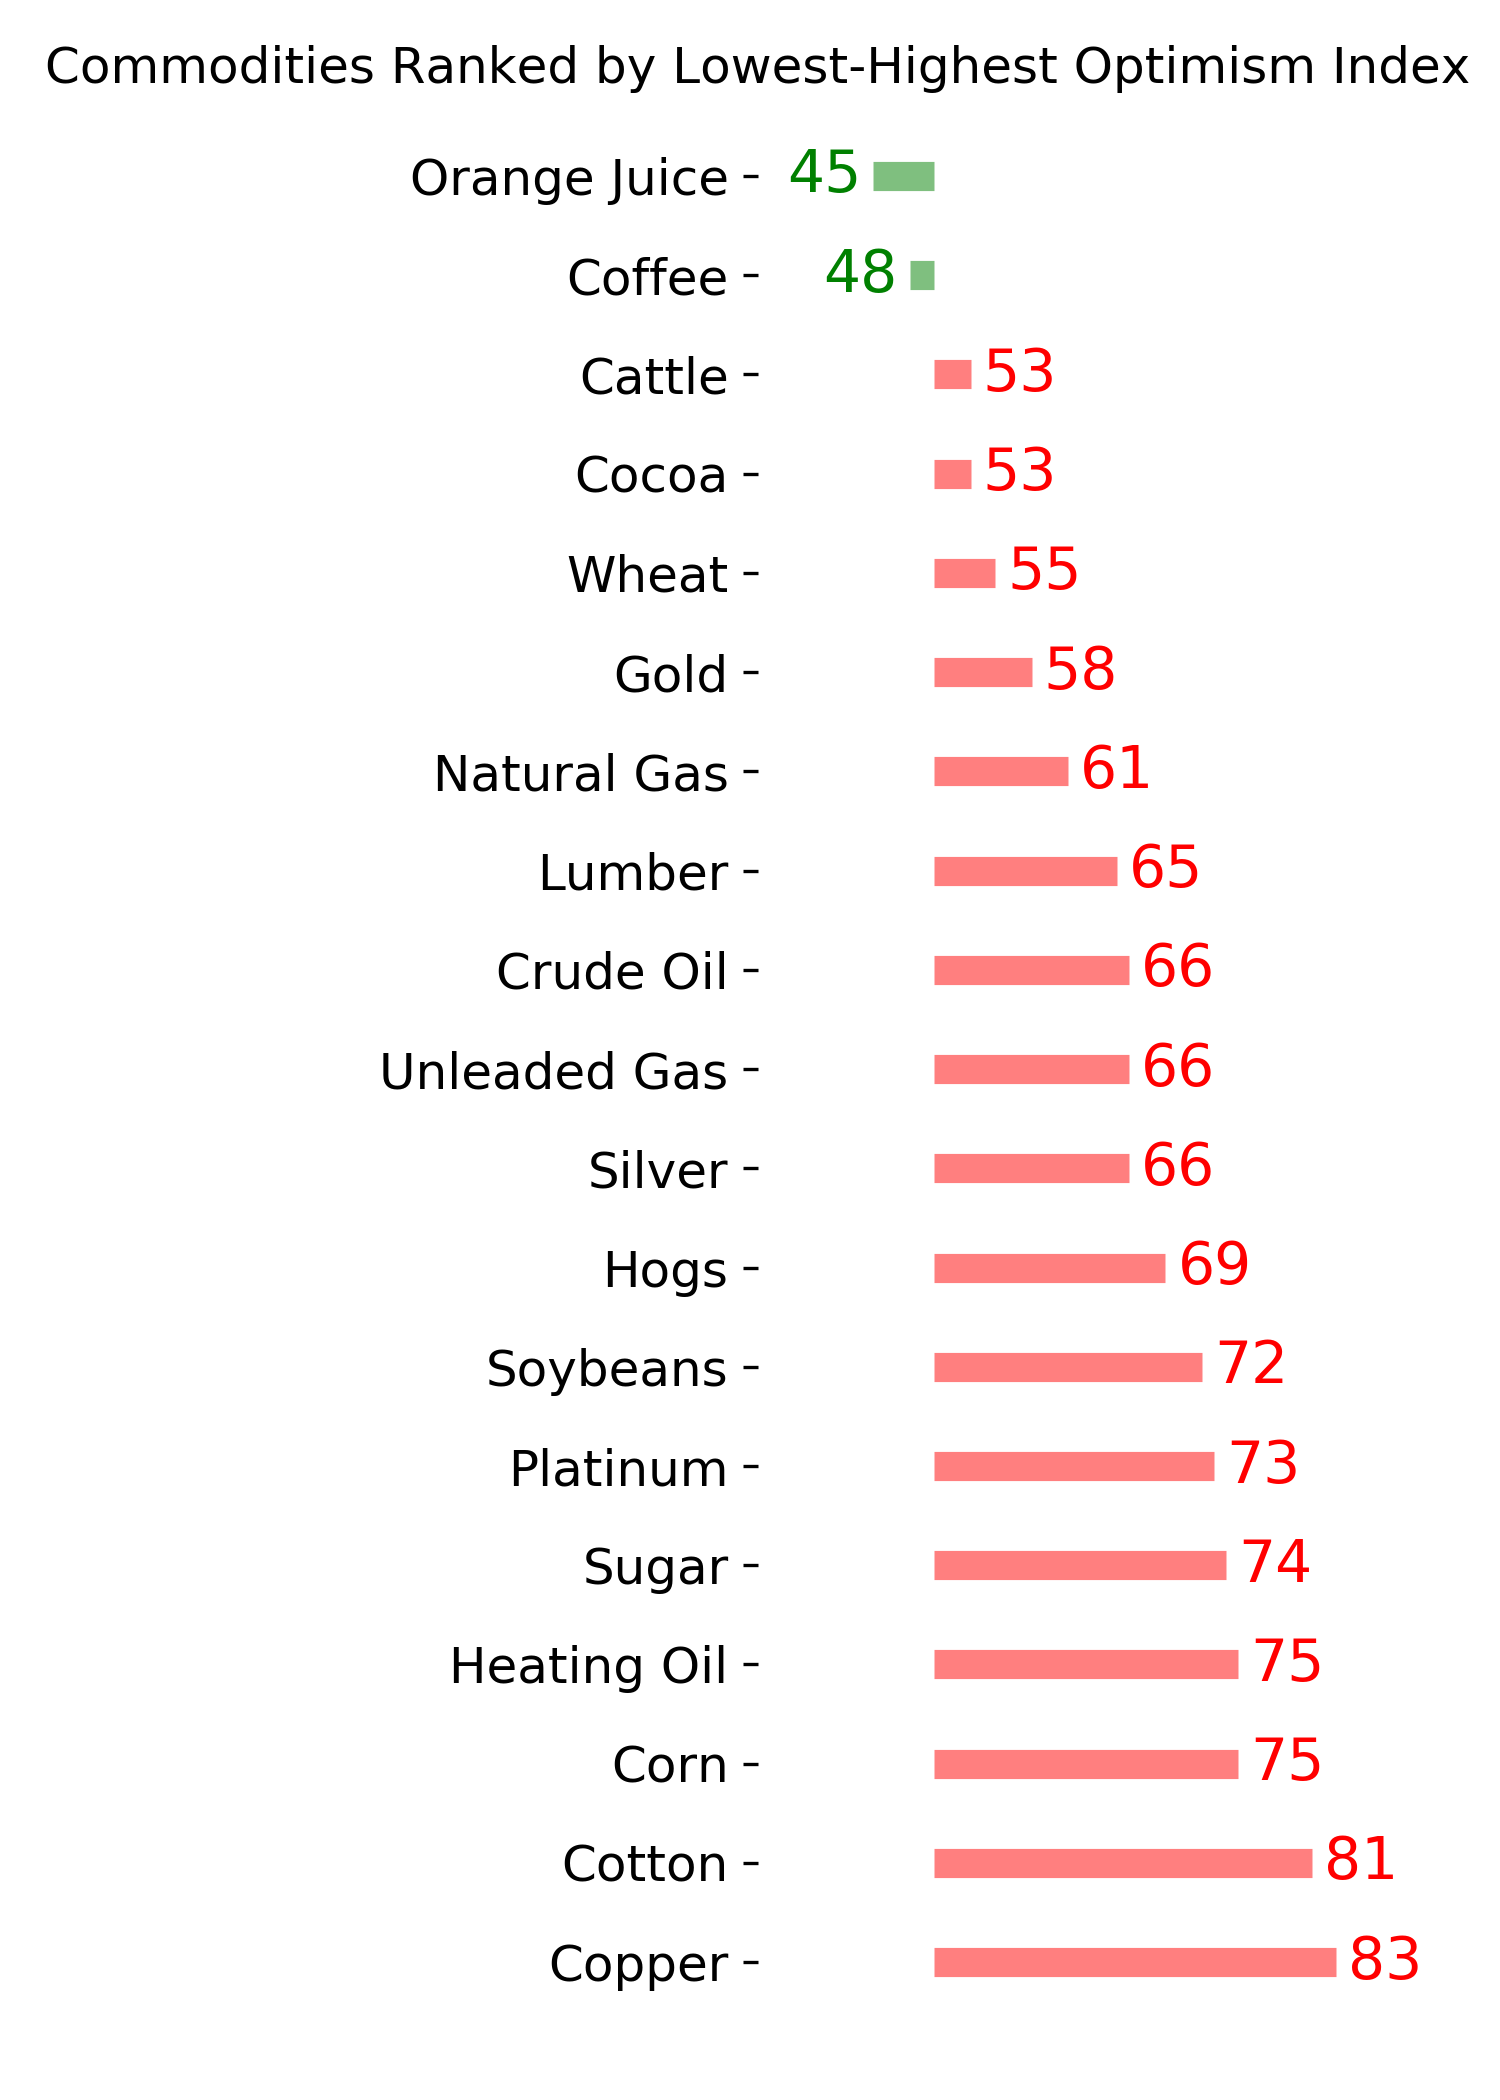
| COMMODITIES |
|  |
|
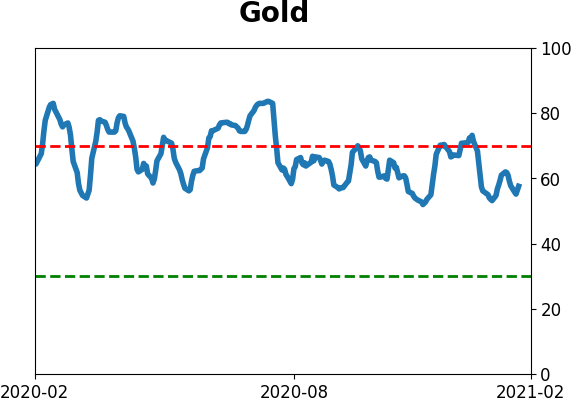
The long-term uptrend in gold is teetering on the edge.
When it comes to the companies tasked with pulling the metal out of the ground, they've gotten hit hard enough that on an average day over the past 2 weeks, only 20% of them were holding above their 200-day moving averages.
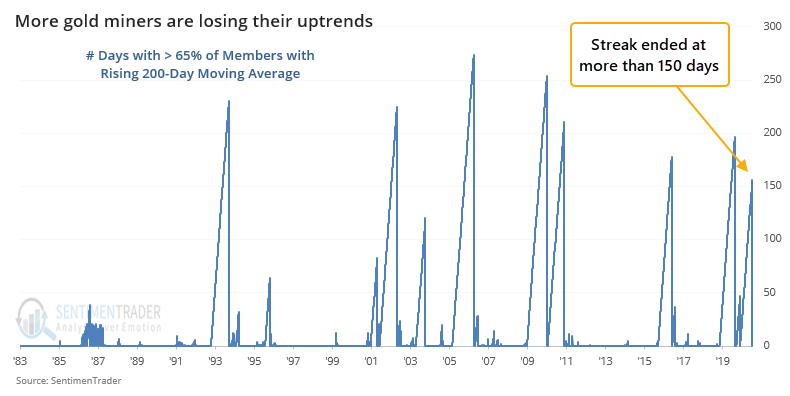
Because more and more miners are falling below their 200-day averages and staying there, the number of those stocks with a rising 200-day moving average is also falling quickly. After all of them had been in strong uptrends, now fewer than 65% of them are.
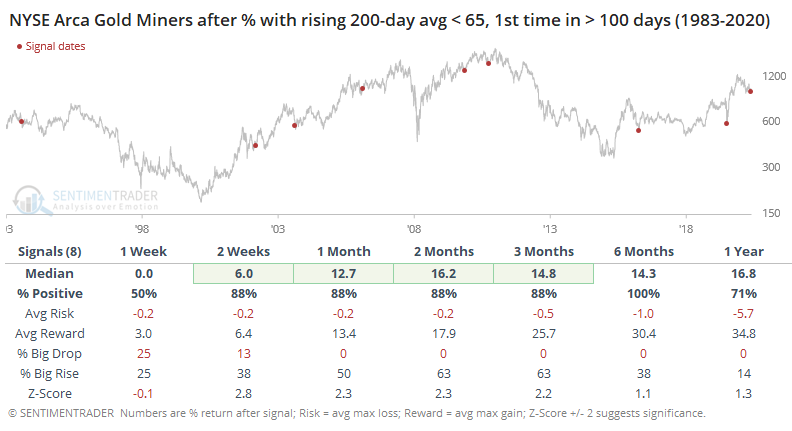
These trends had held for a long time. It's the first time in more than 150 days that fewer than 65% of gold miners have rising 200-day averages, ending one of the longest streaks in nearly 40 years.
When a long streak of positive momentum ends, miners have tended to rally afterward. Over the past 20 years, they've had a perfect record of regaining their upside momentum.
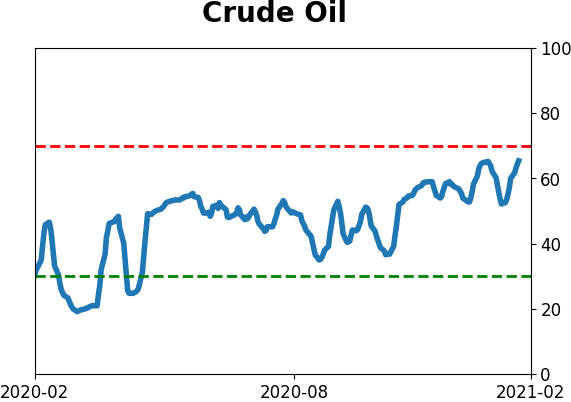
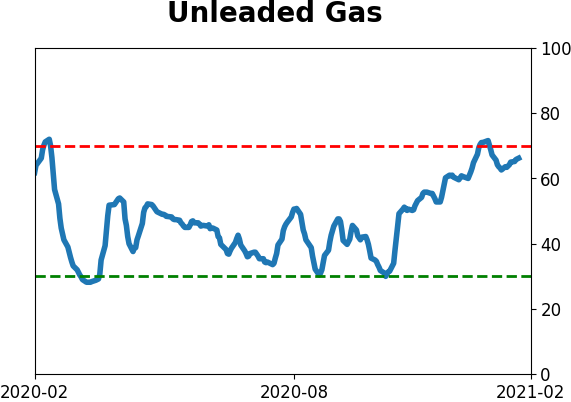
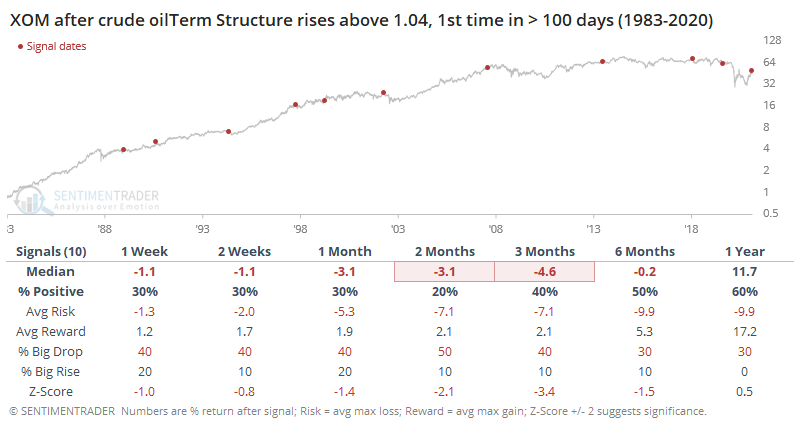
Thanks to demand, the front-month crude oil futures contract is being priced quite a bit higher than back months. When traders panic, the reverse happens. That has turned the Term Structure higher than it has been in a year.
Curiously, these signals have led to very poor returns for majors like Exxon. Only the signal in 1999 didn't lead to a negative return on some medium- to long-term time frame.
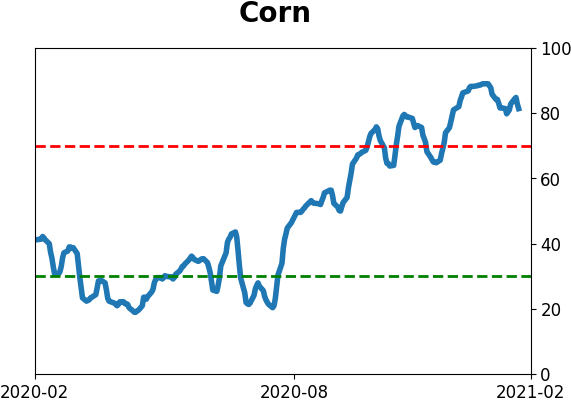
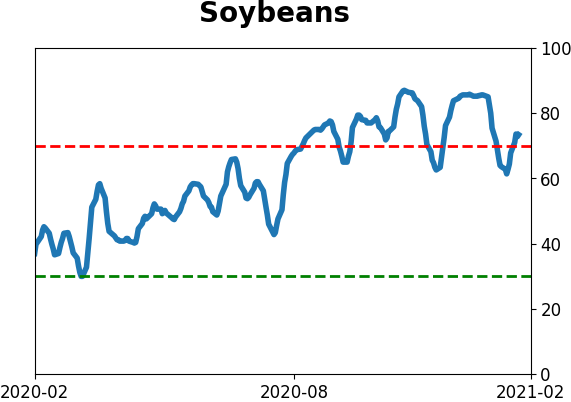
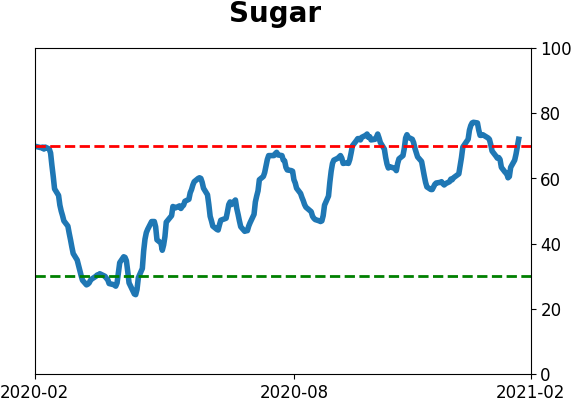
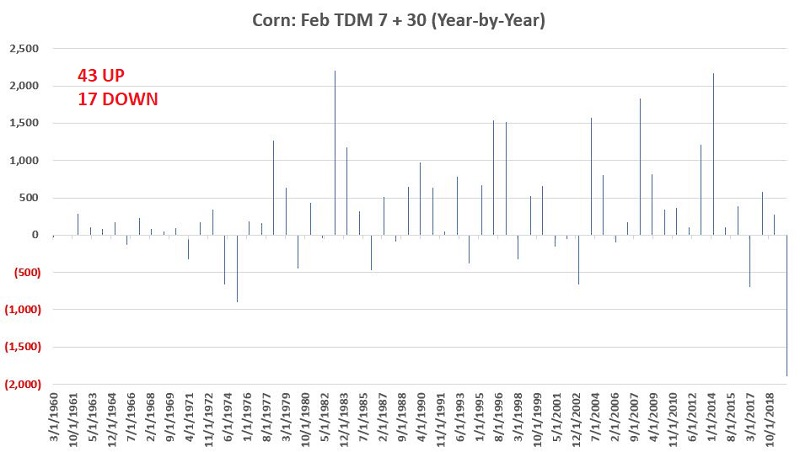
Jay pointed out that sentiment on corn is extremely elevated, but at least it has a seasonal tailwind behind it.
A seasonally favorable period for corn begins at the close of February Trading Day #7 (2/9/2021 this year) and lasts for 30 trading days (ending 3/24/2021). The chart below displays the hypothetical gain achieved by holding a long 1-lot position in corn futures each year since 1960 during this period.
The year-by-year hypothetical profit/loss from a 1-lot long position in corn during this favorable period appears below.
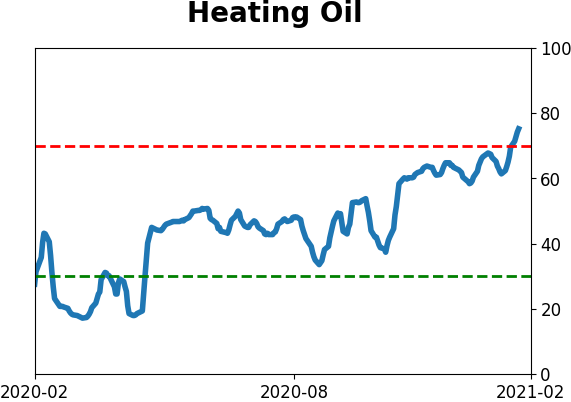
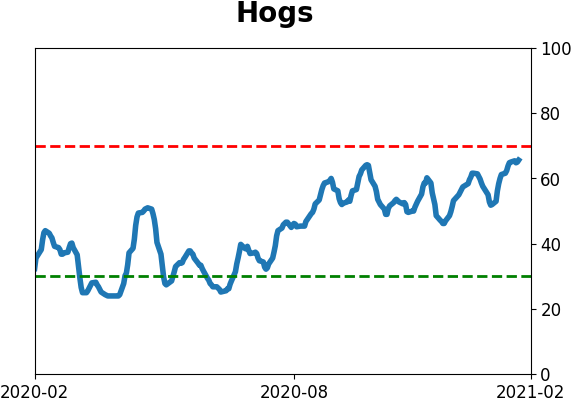
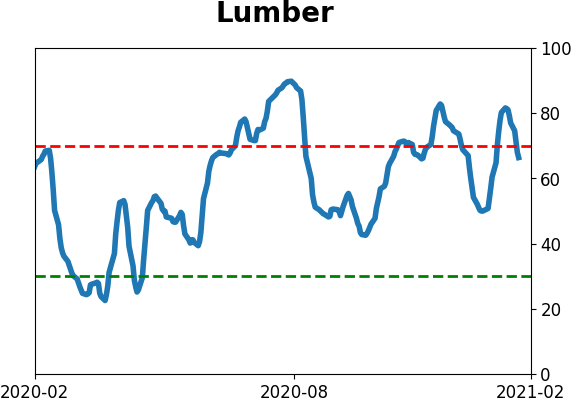
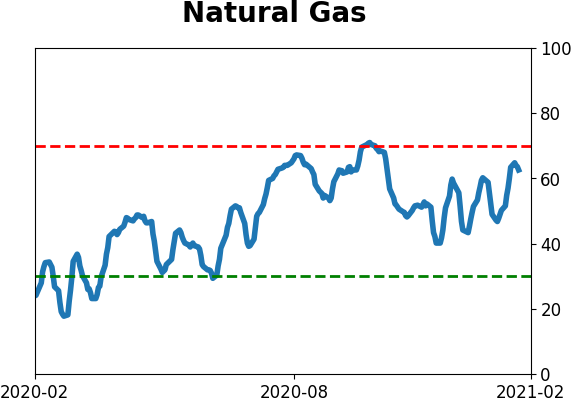
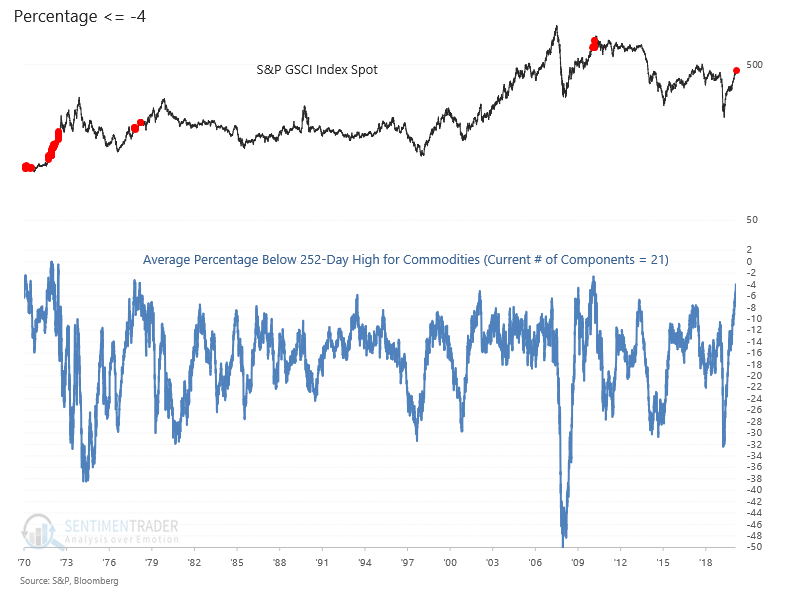
Dean showed that the breadth of participation for a basket of 21 commodities remains strong. The advance from the pandemic lows looks similar to other post-recession periods. For commodities themselves, that was about the peak in 2010, but the others were nearer the beginning of major moves higher.
Active Studies
| Time Frame | Bullish | Bearish | | Short-Term | 0 | 0 | | Medium-Term | 2 | 7 | | Long-Term | 16 | 3 |
|
Indicators at Extremes
Portfolio
| Position | Description | Weight % | Added / Reduced | Date | | Stocks | RSP | 4.9 | Reduced 4% | 2021-02-09 | | Bonds | 10% BND, 8.9% SCHP, 4.8% ANGL | 23.7 | Reduced 4% | 2021-02-09 | | Commodities | GCC | 2.3 | Reduced 2.1%
| 2020-09-04 | | Precious Metals | GDX | 8.9 | Added 4.8% | 2020-12-01 | | Special Situations | 9.6% XLE, 8.2% PSCE | 17.8 | Reduced 1.5% | 2021-02-09 | | Cash | | 42.8 | | |
|
Updates (Changes made today are underlined)
With a market that has seen the kinds of broad participation and big breath thrusts like we did in the fall, it's hard to become too negative. Those kinds of conditions have consistently preceded higher returns over the next 6-12 months. It's the interim that's more of an issue. Even conditions like that haven't prevented some shorter-term pullbacks. And when we combine an environment where speculation is rampant and recent days have seen an increase in cracks under the surface of the indexes, it's enough to become more defensive over a short- to medium-term time frame. We still don't have much confirmation from the price action in the indexes, so those who are more conservative would likely wait before increasing cash levels. Not much has changed, but I'm getting increasingly anxious and prefer to hold cash over riskier assets so I increased the cash cushion. RETURN YTD: 5.7% 2020: 8.1%, 2019: 12.6%, 2018: 0.6%, 2017: 3.8%, 2016: 17.1%, 2015: 9.2%, 2014: 14.5%, 2013: 2.2%, 2012: 10.8%, 2011: 16.5%, 2010: 15.3%, 2009: 23.9%, 2008: 16.2%, 2007: 7.8%
|
|
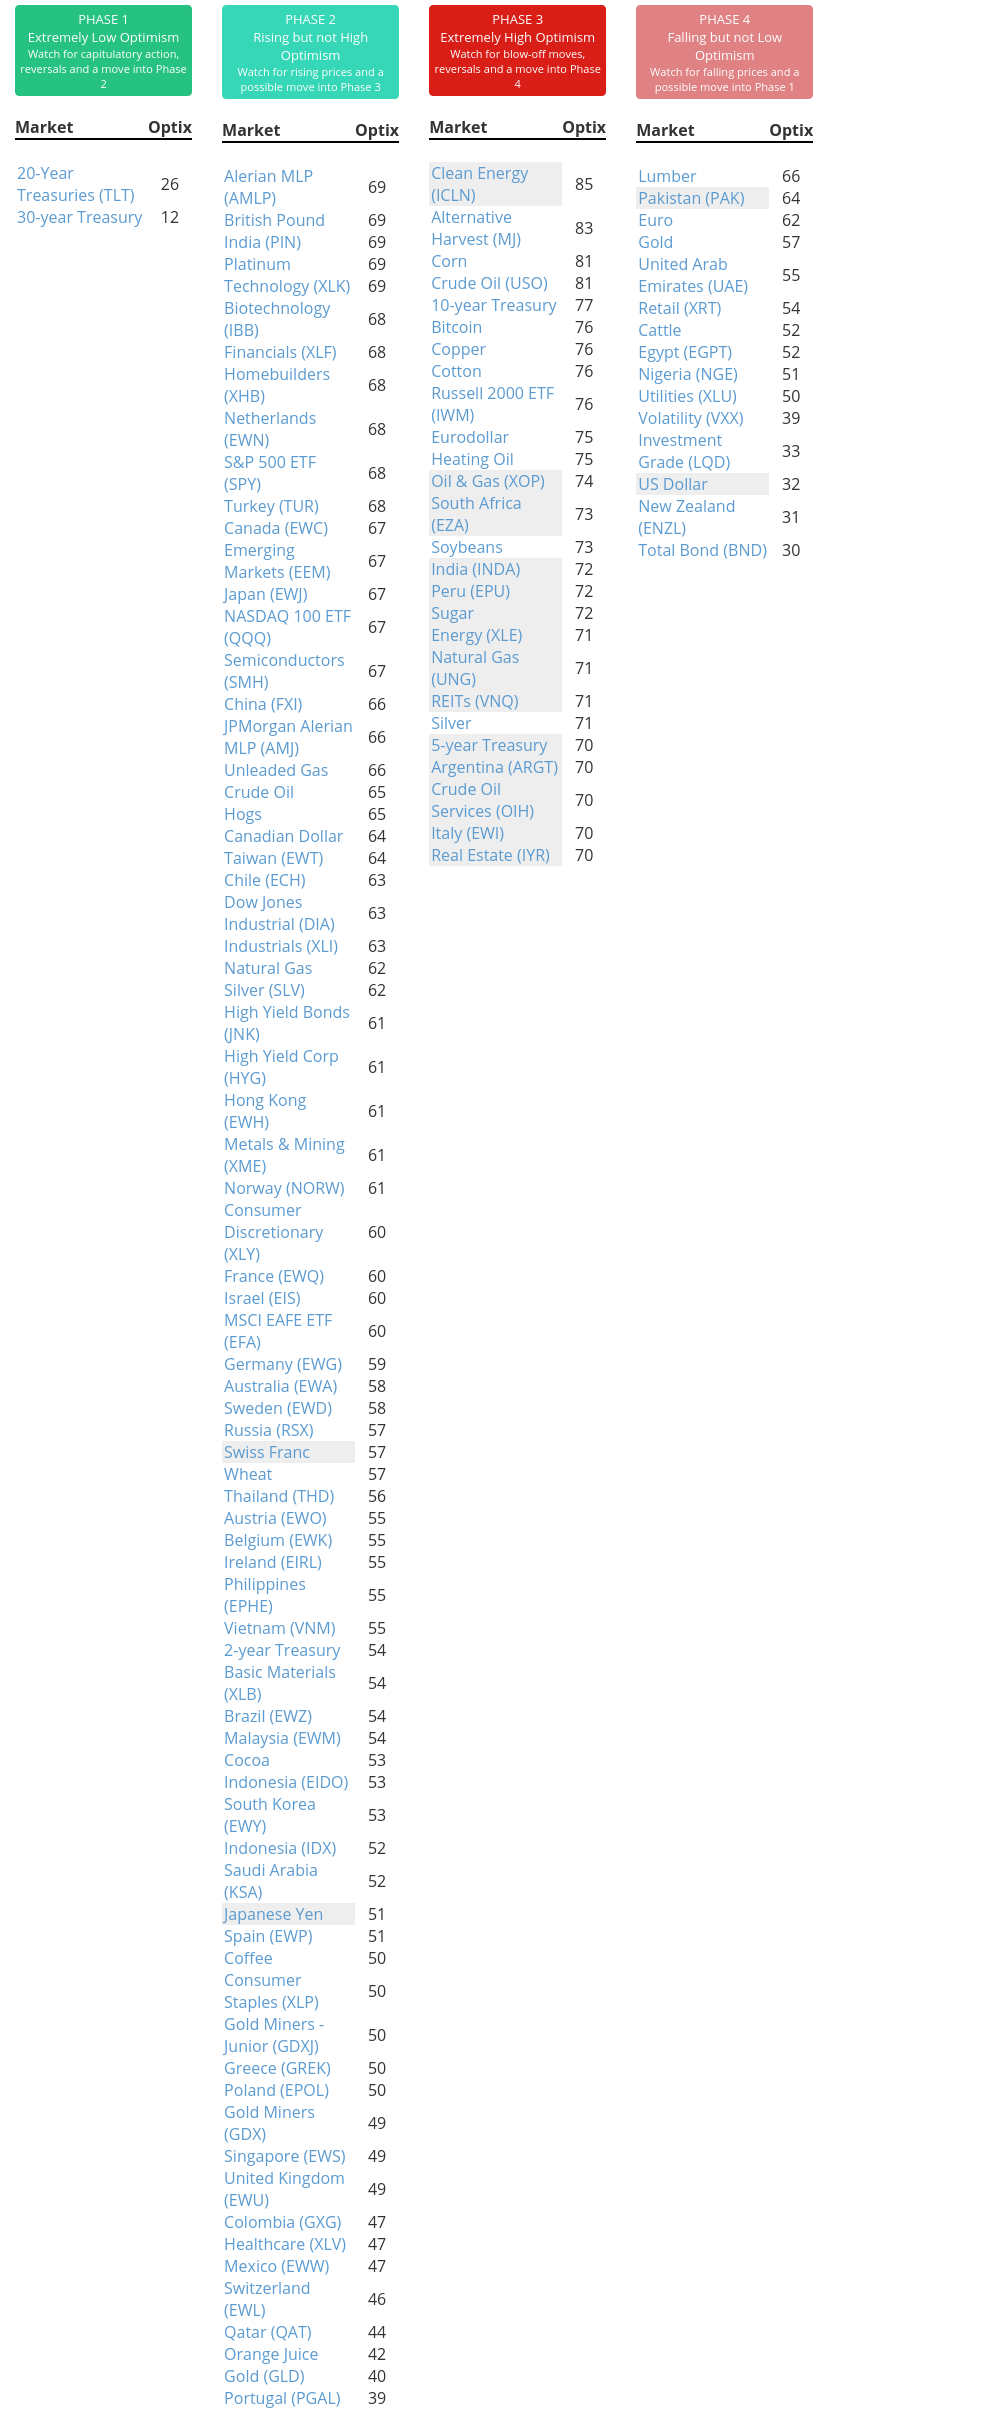
Phase Table
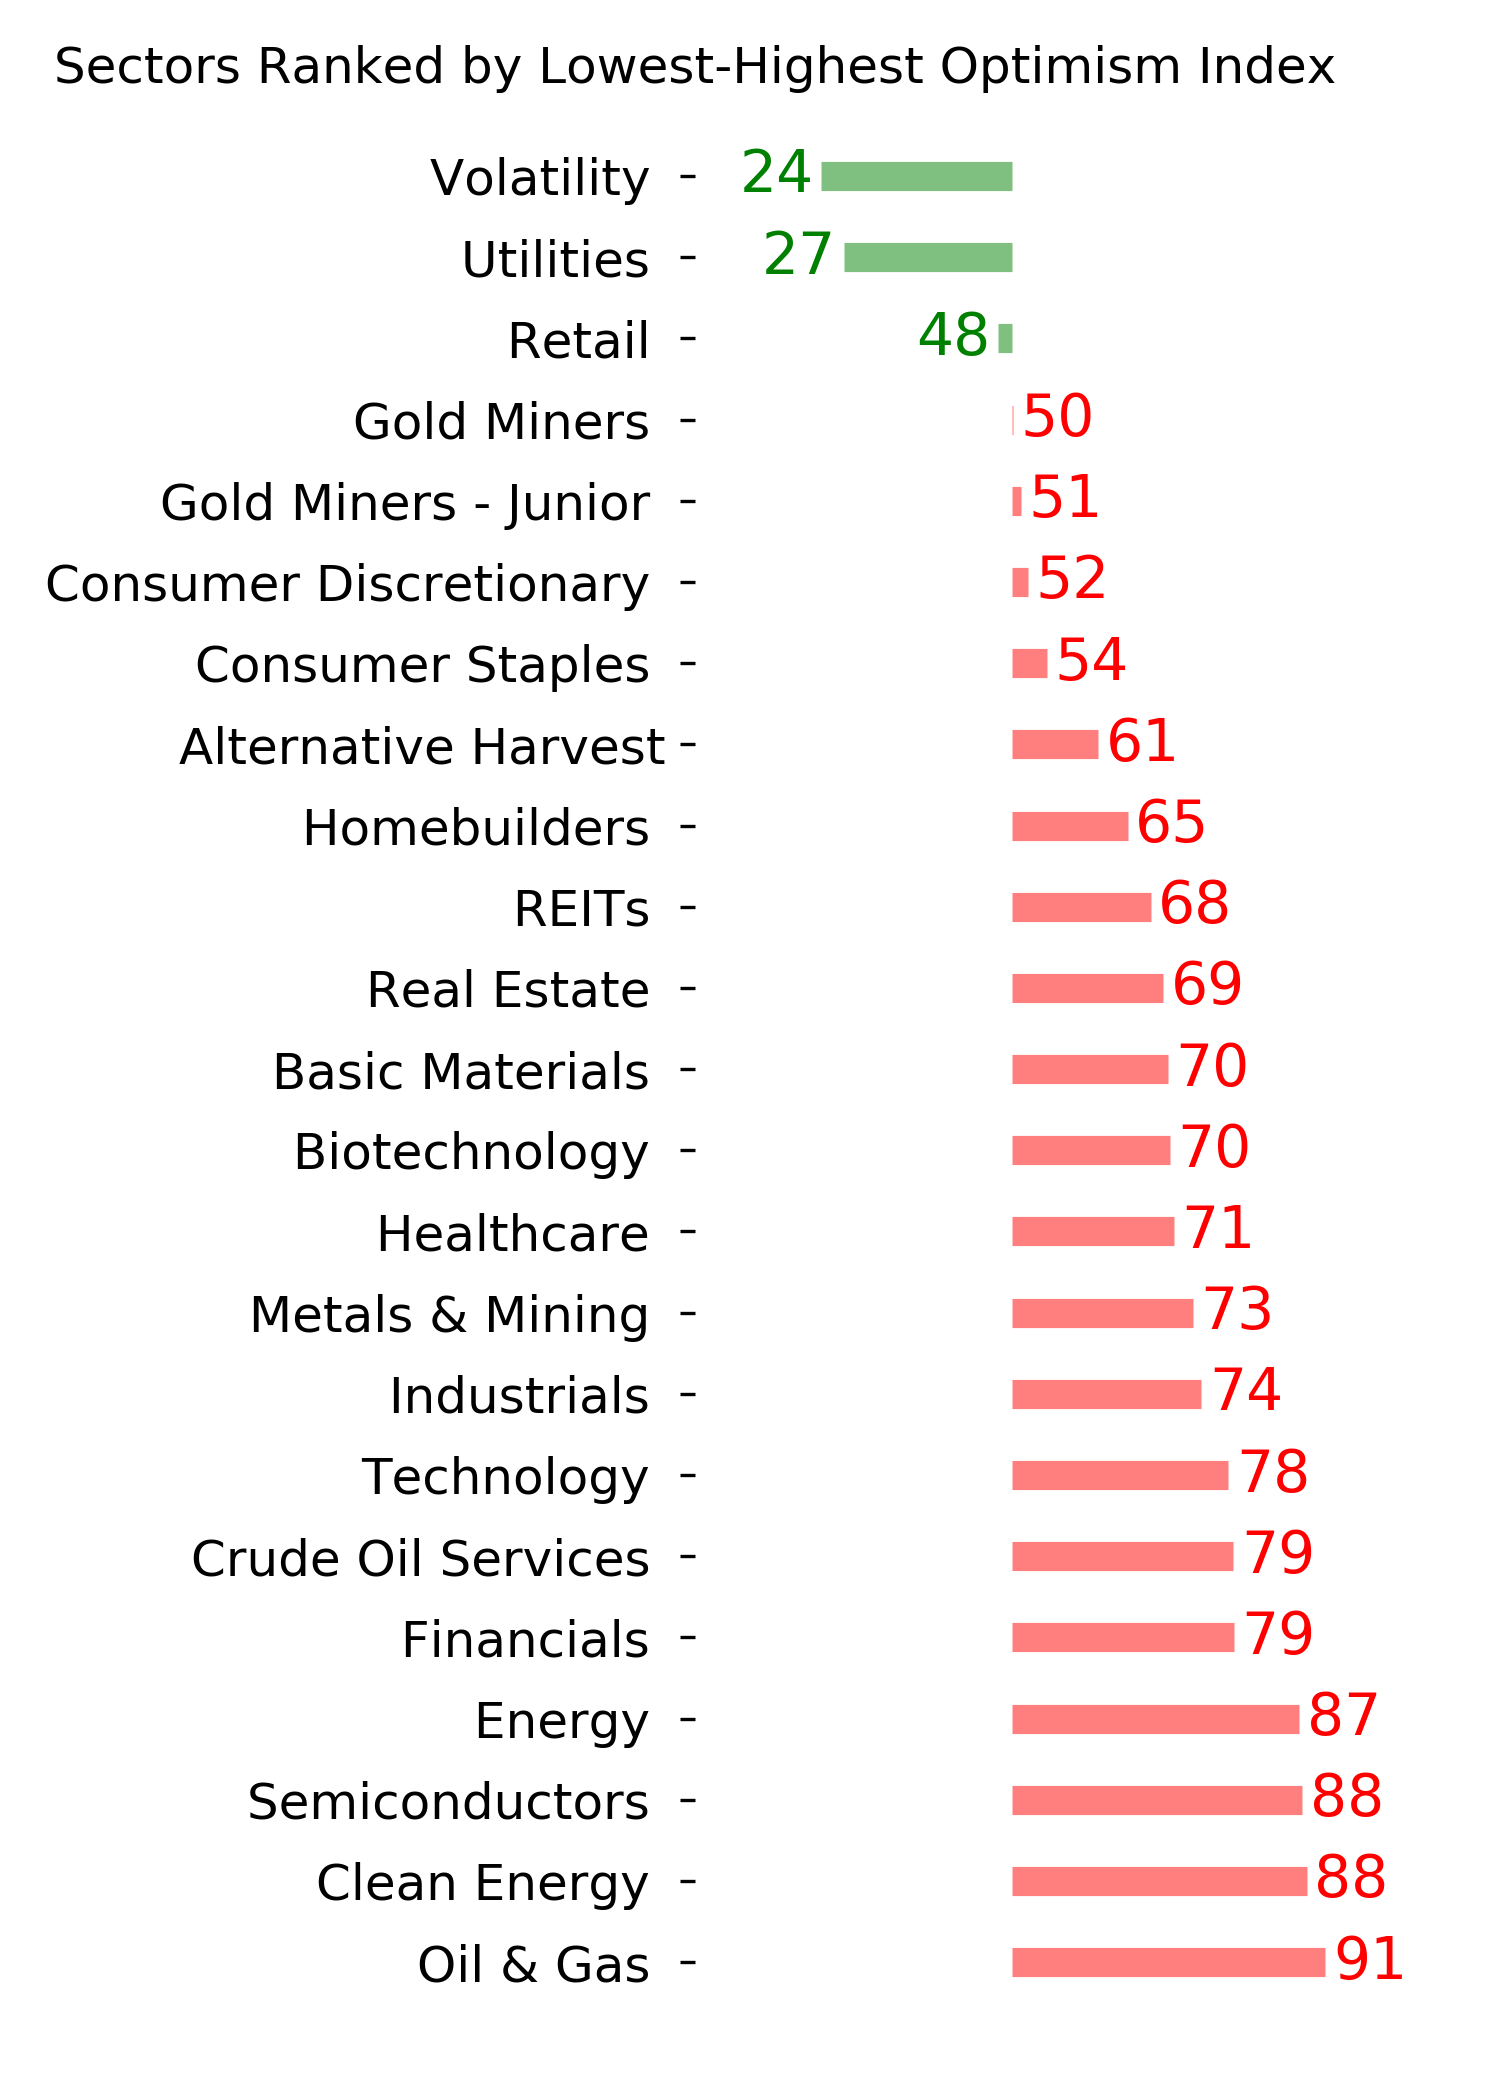
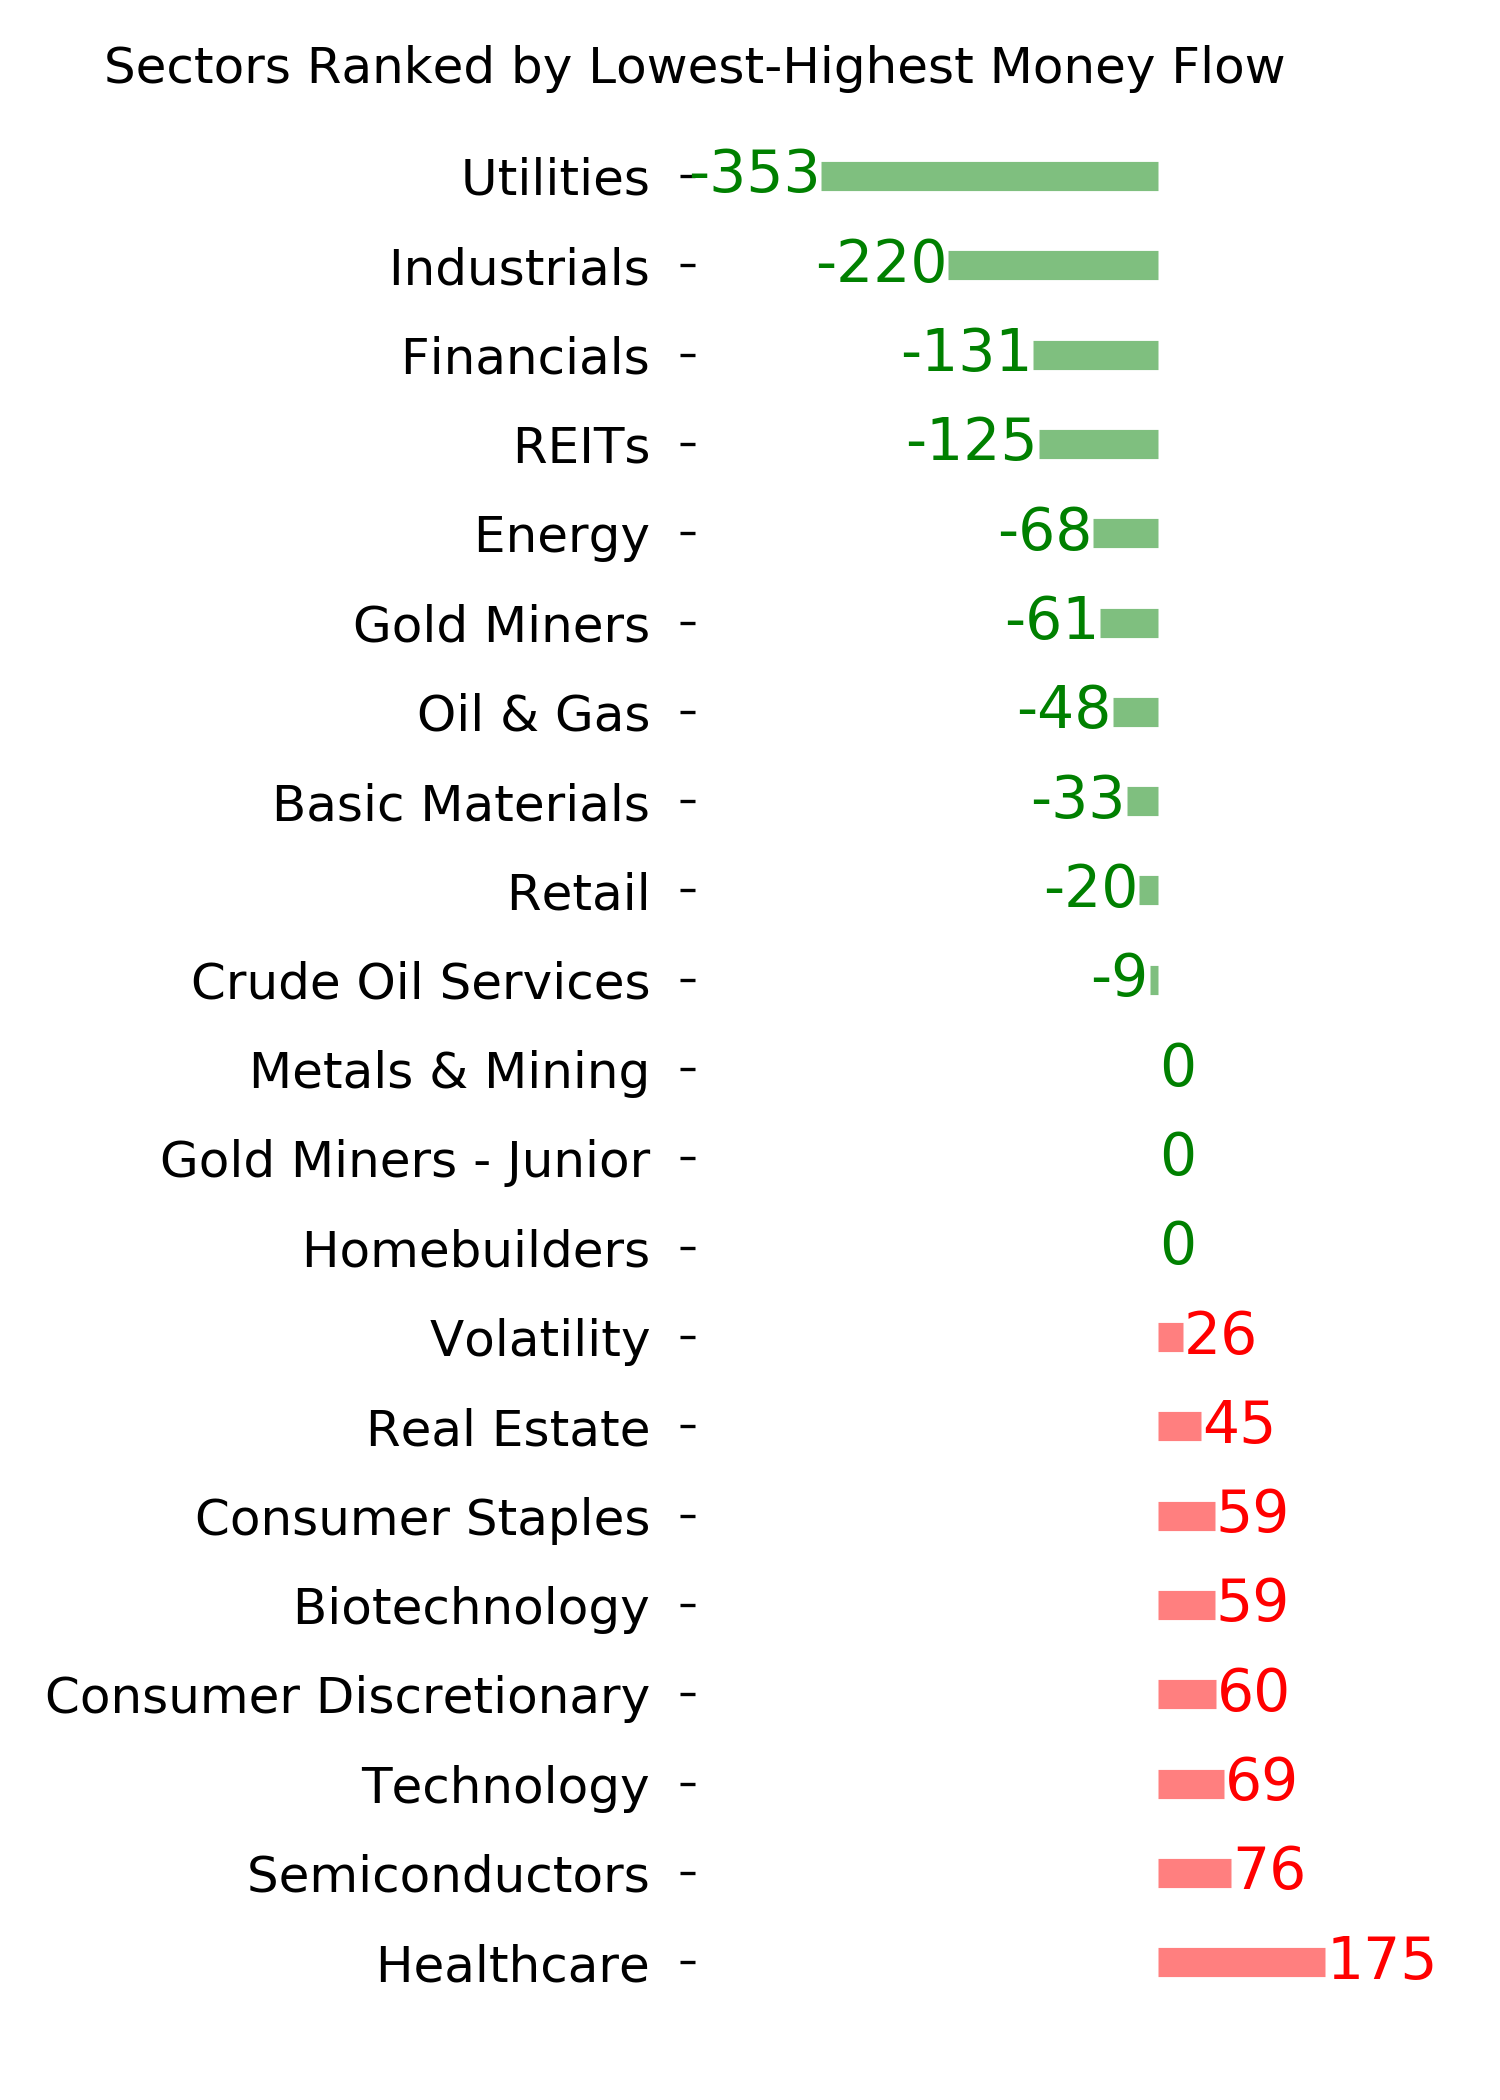
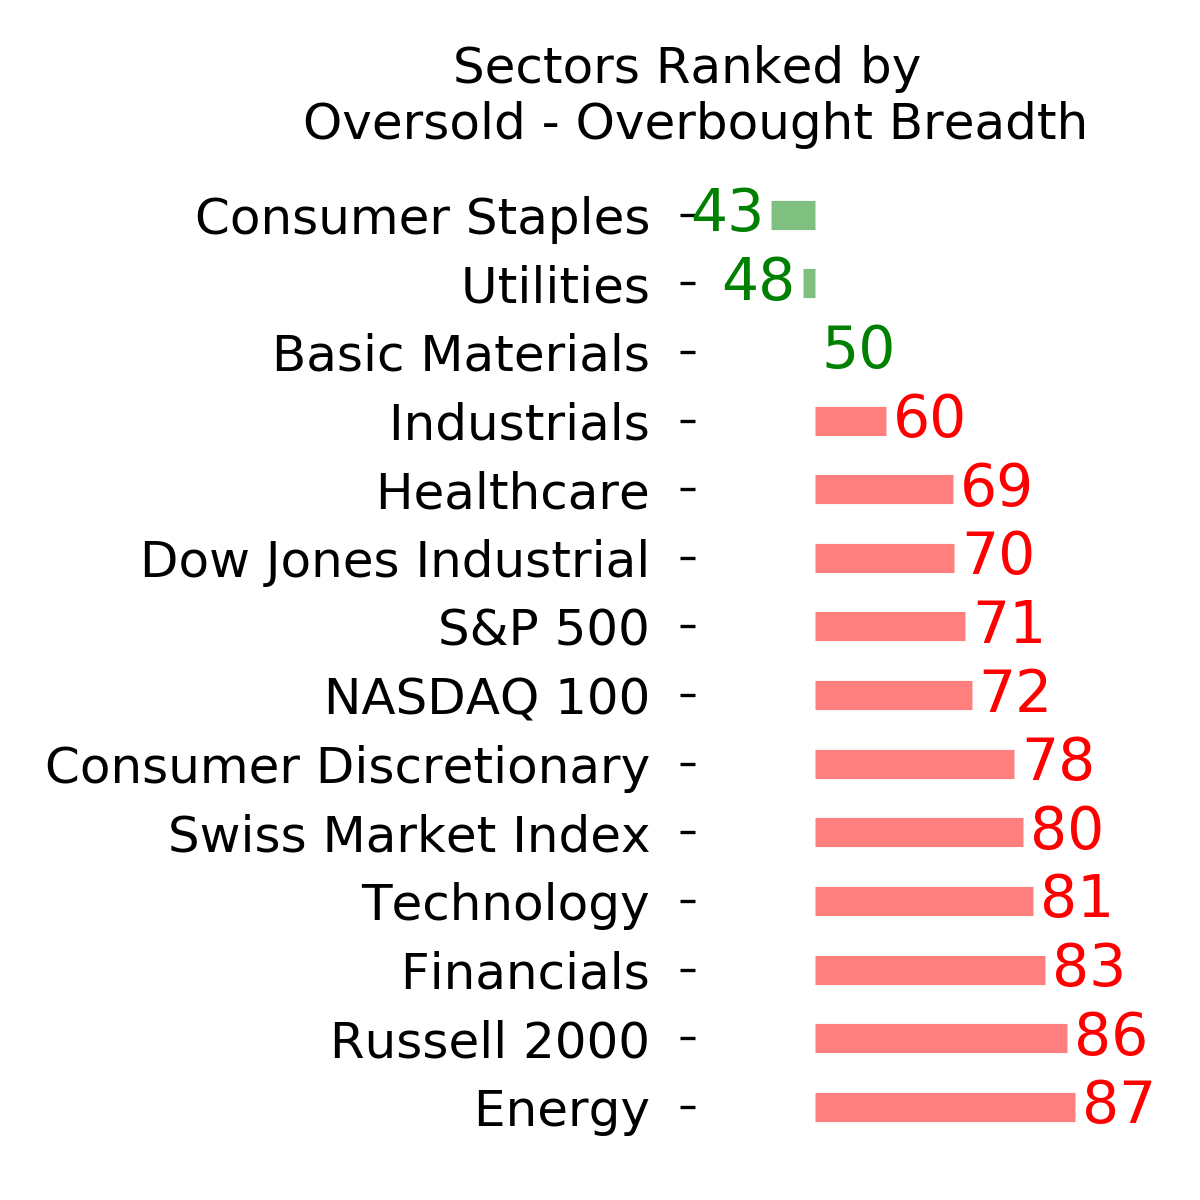
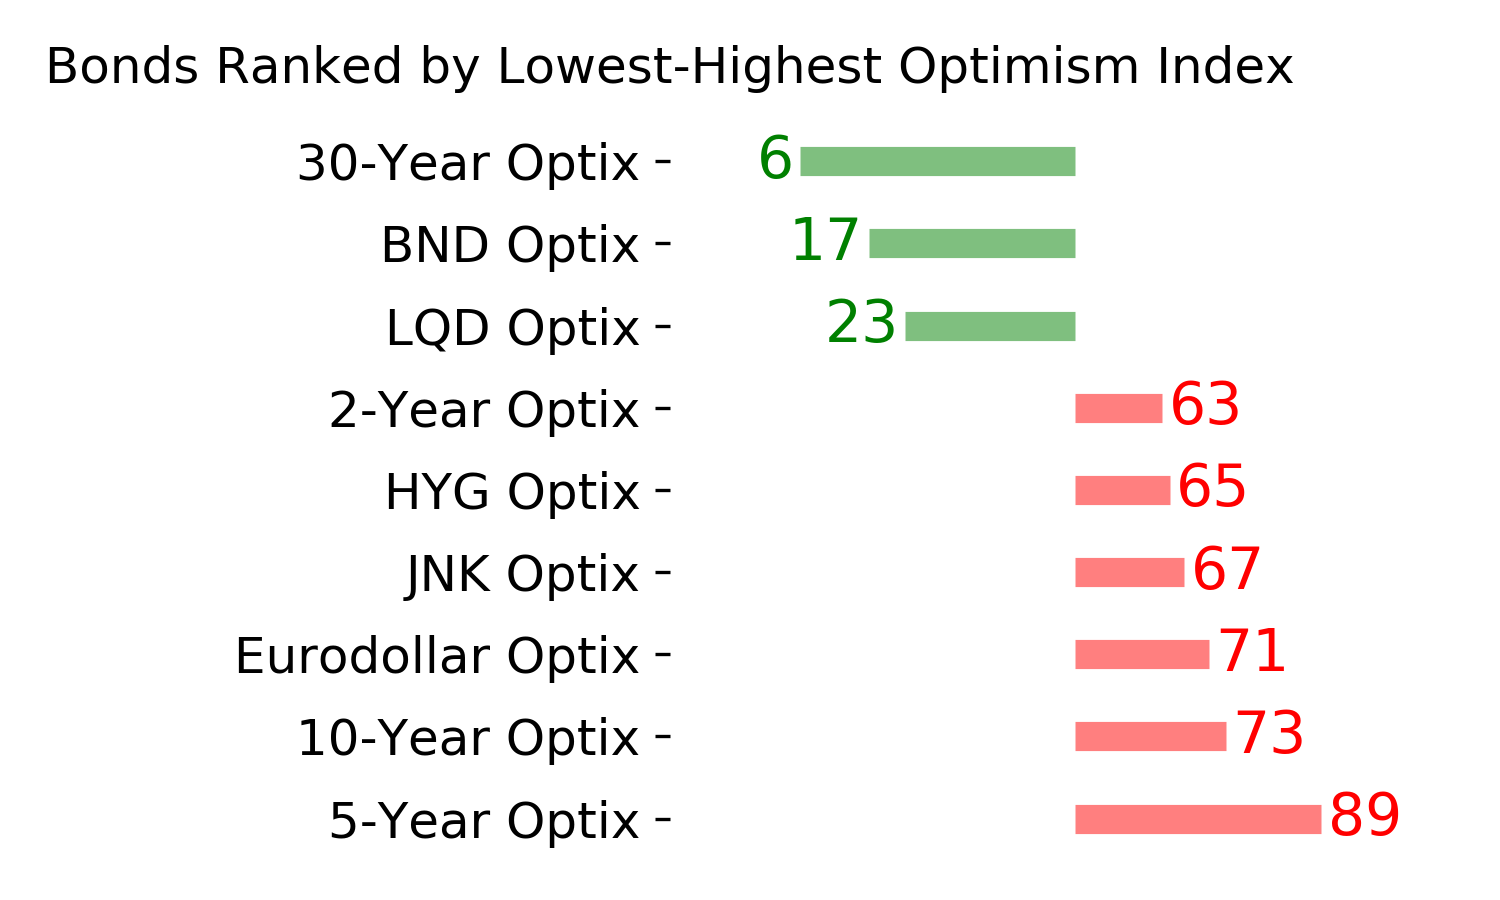
Ranks
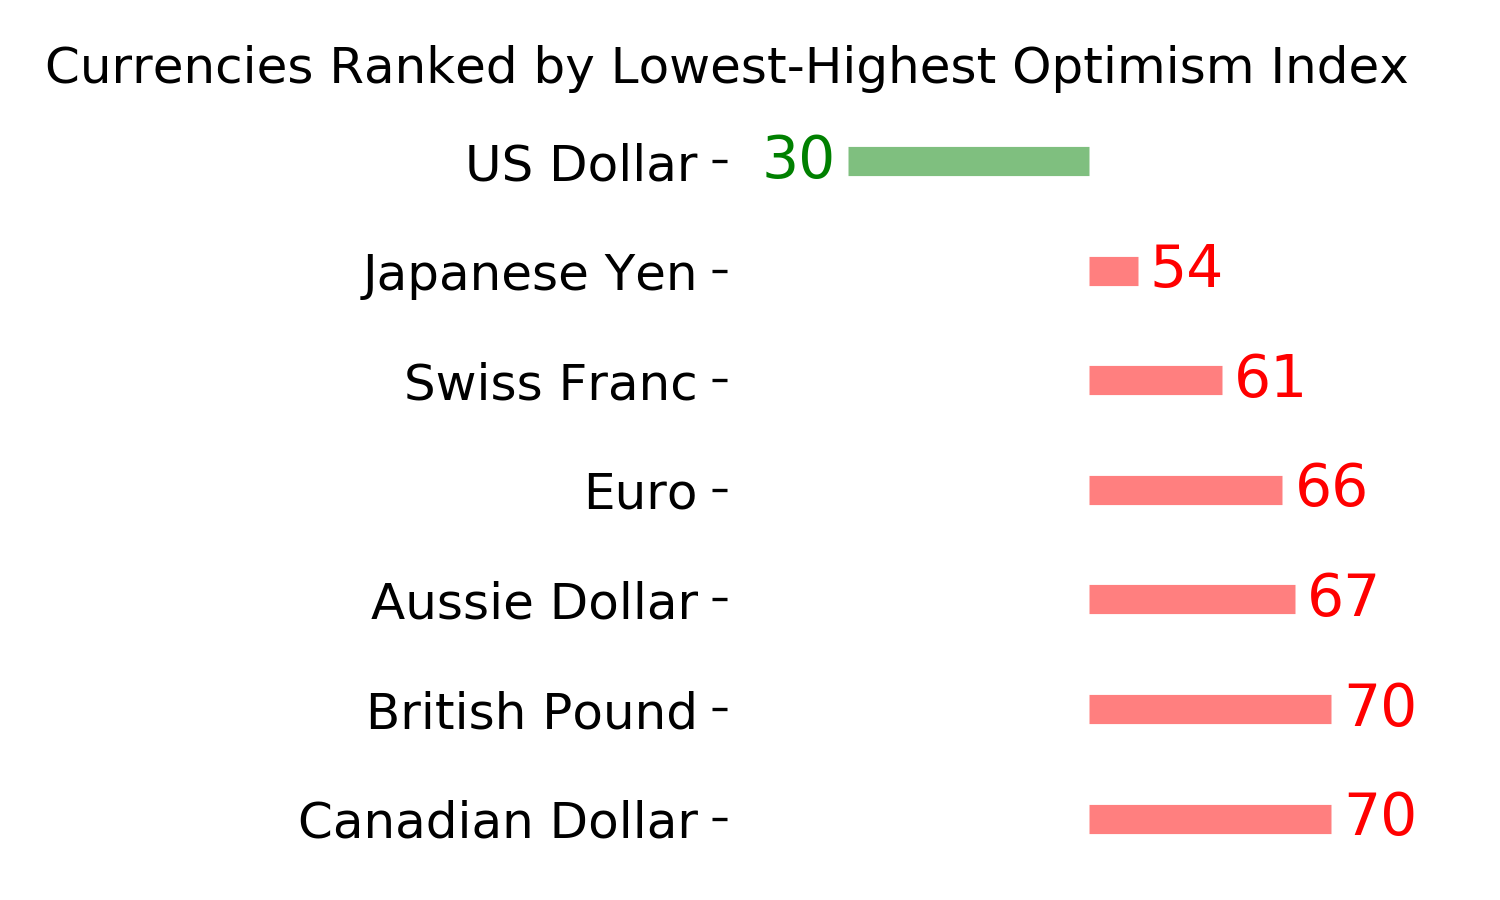
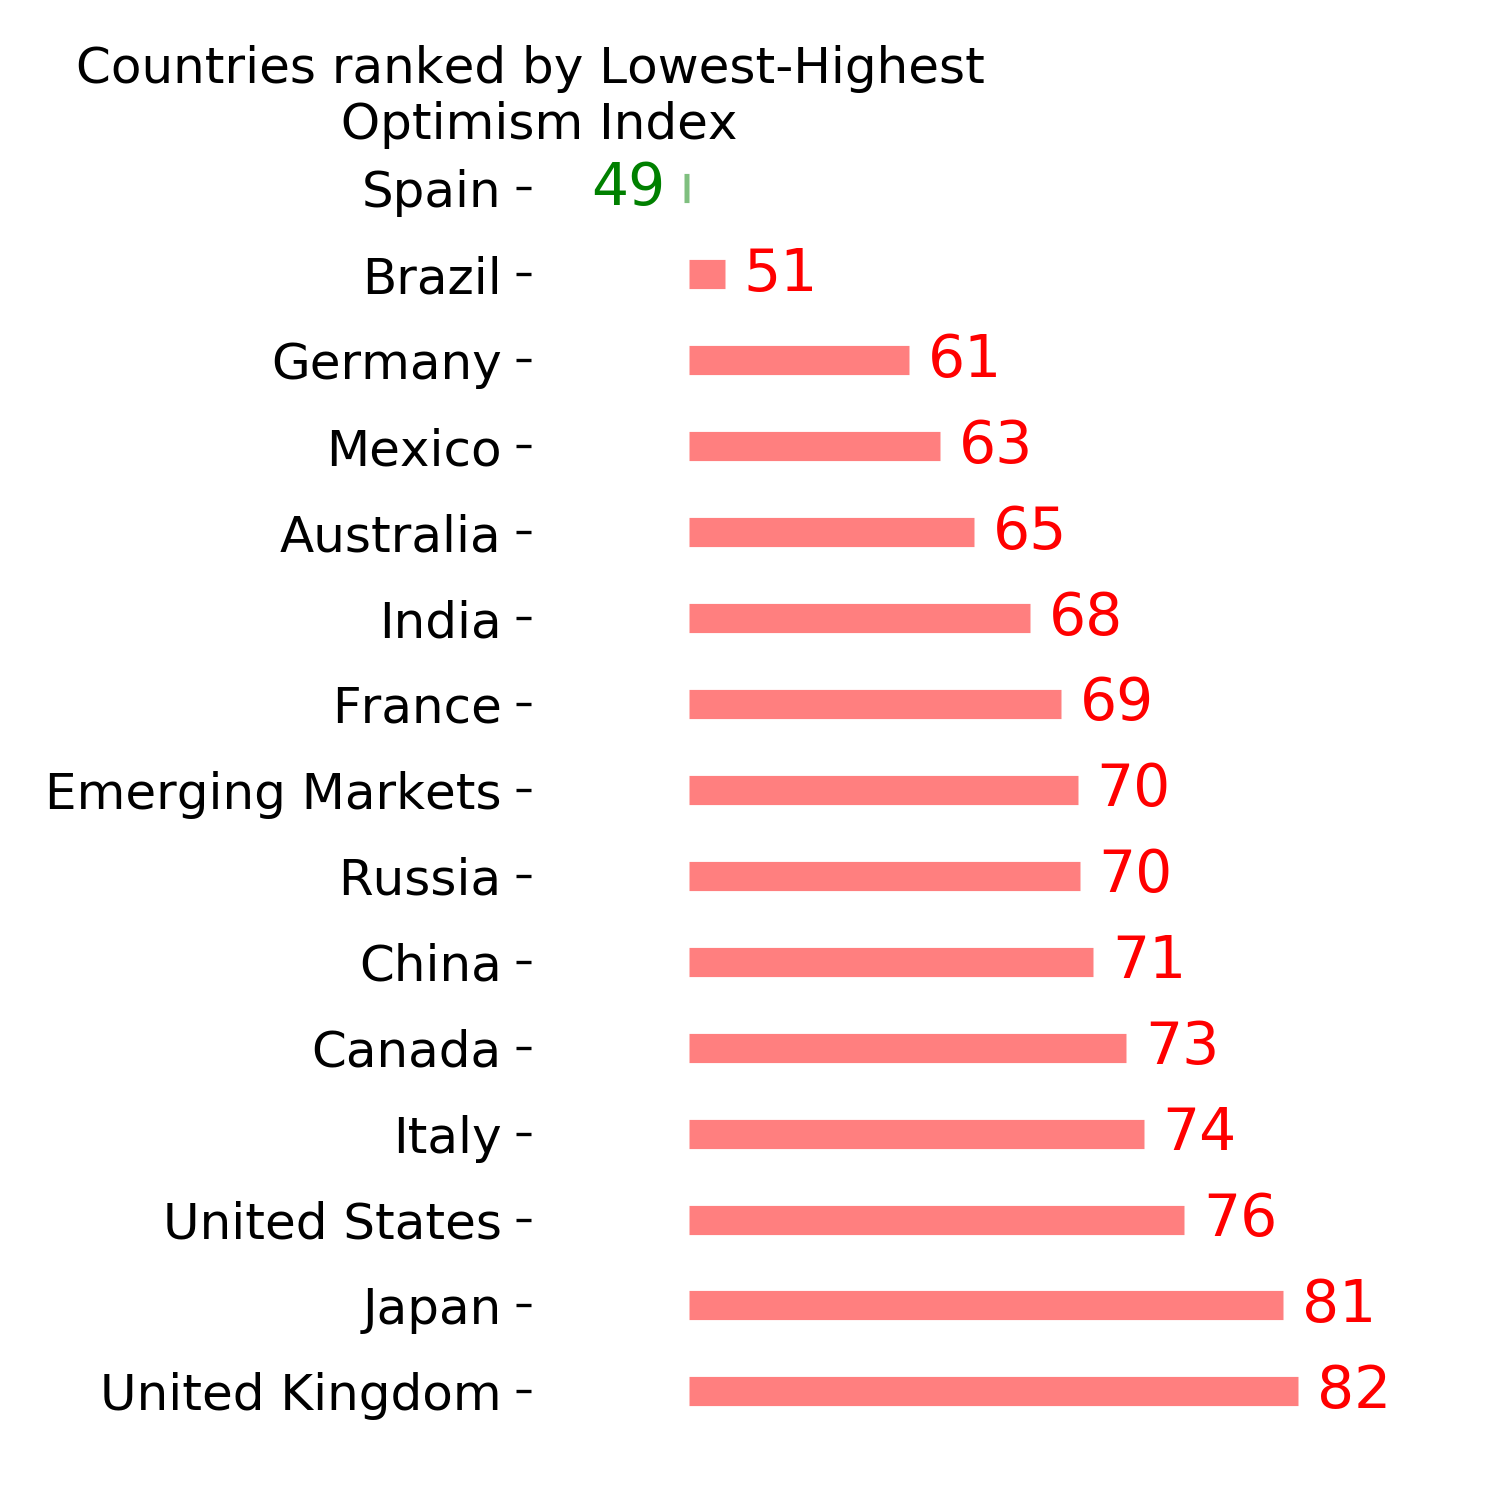
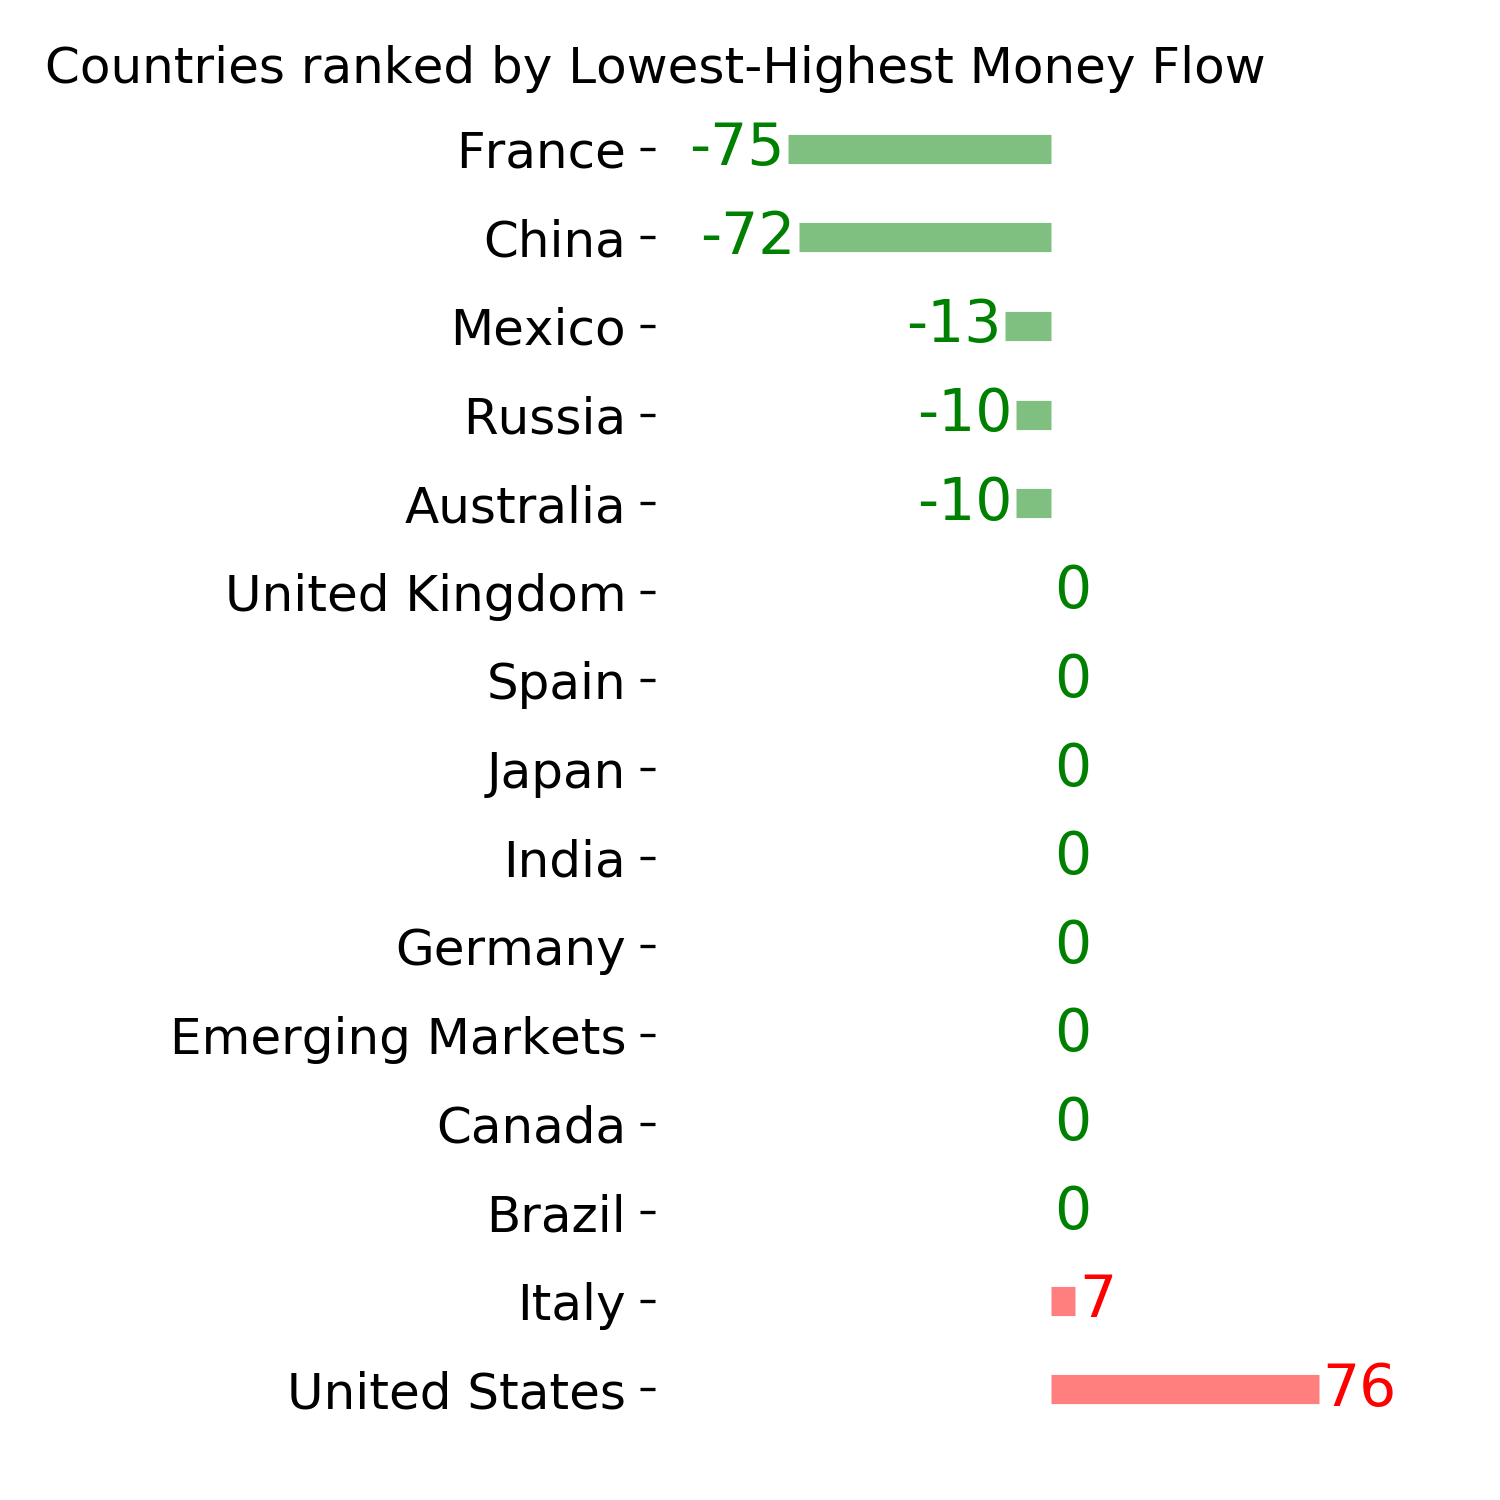
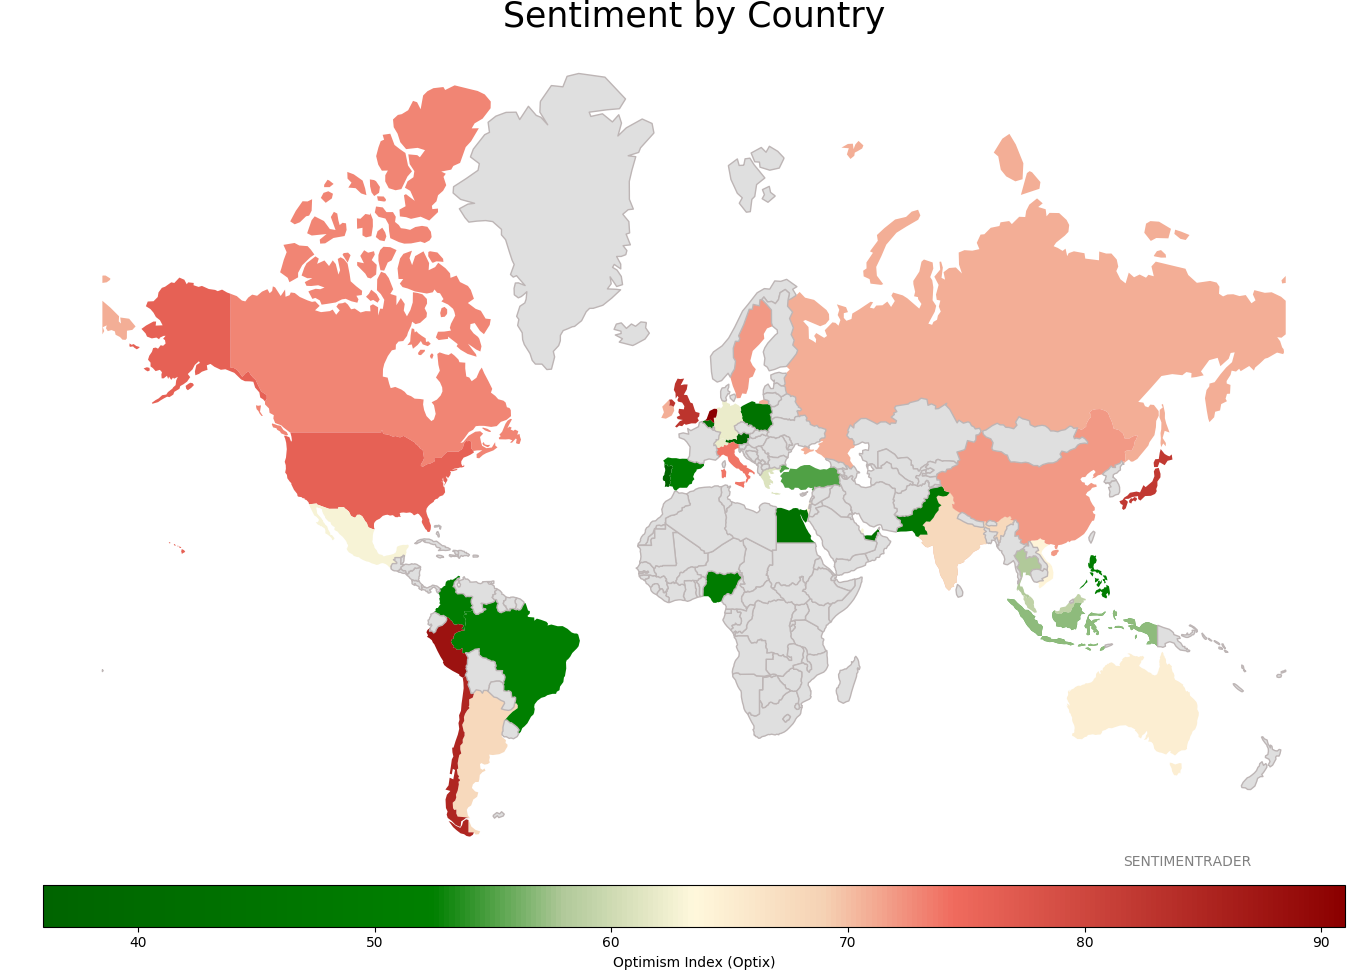
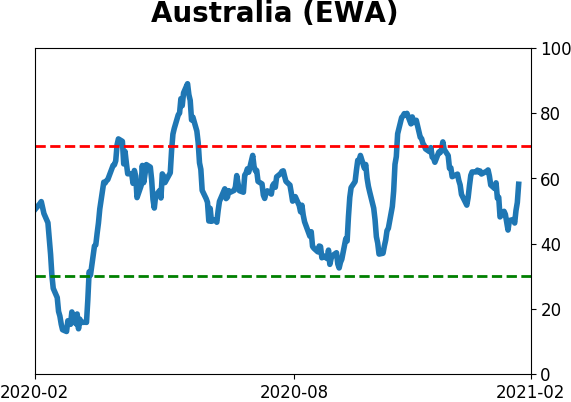
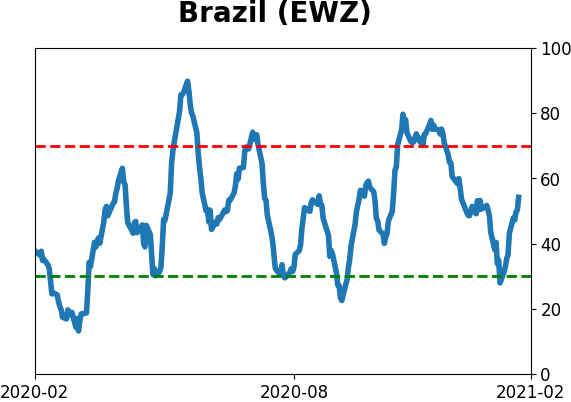
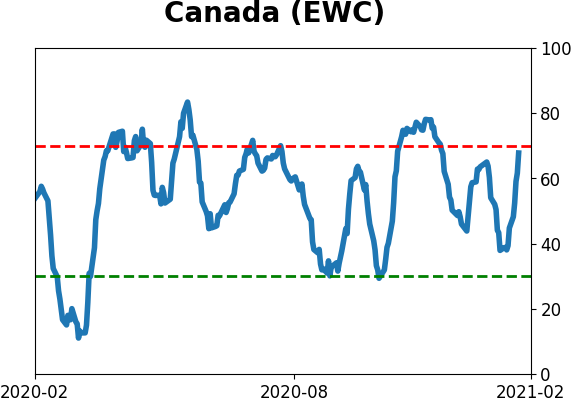
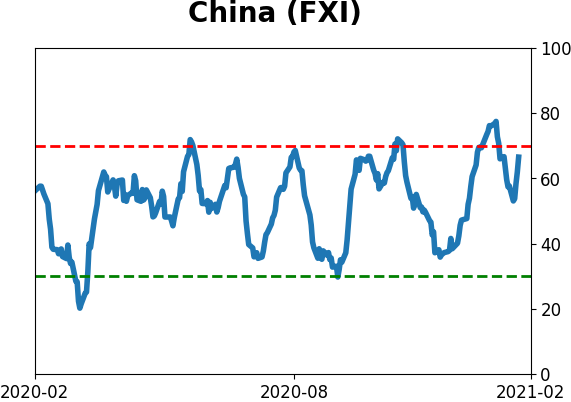
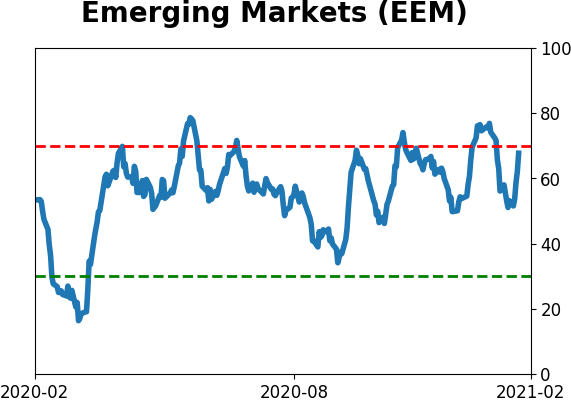
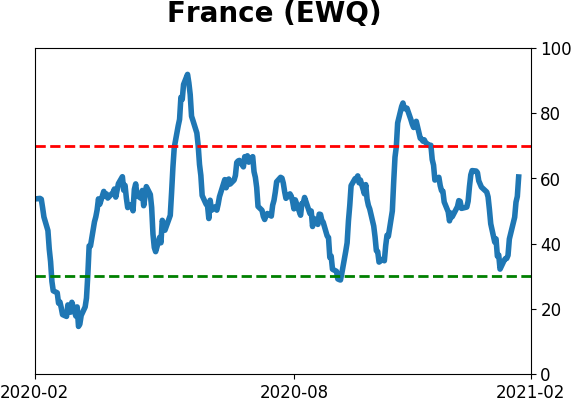
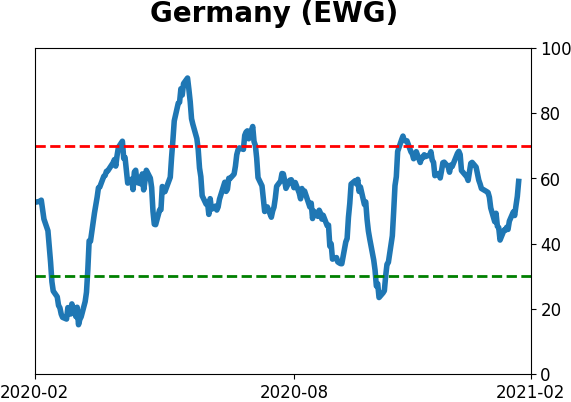
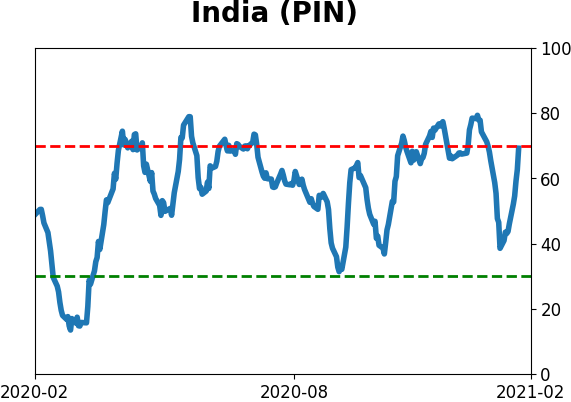
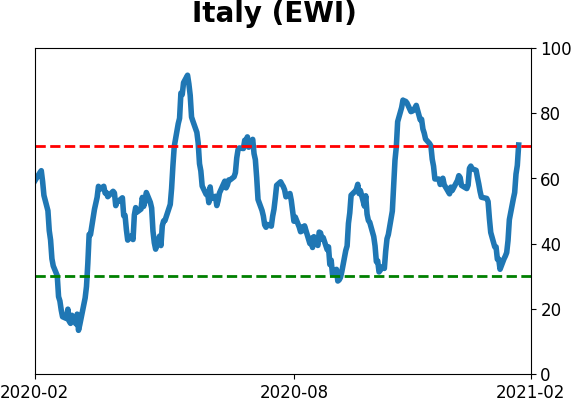
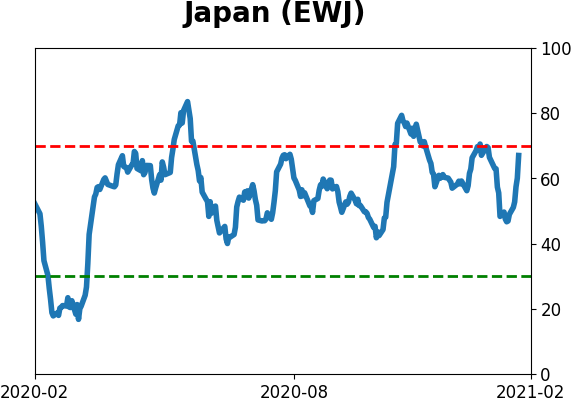
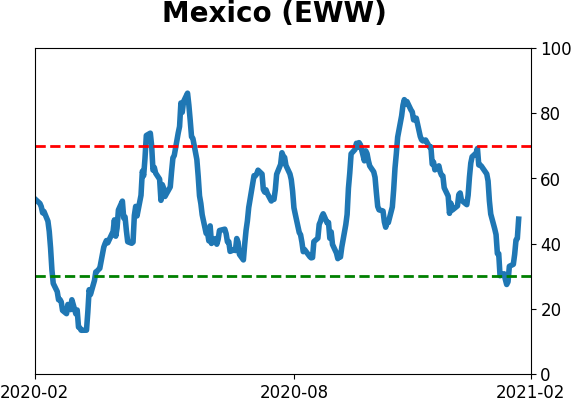
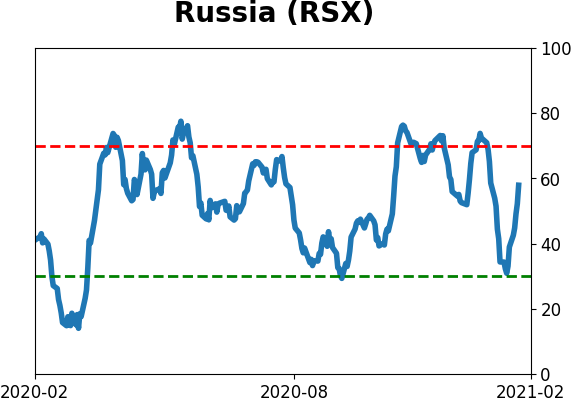
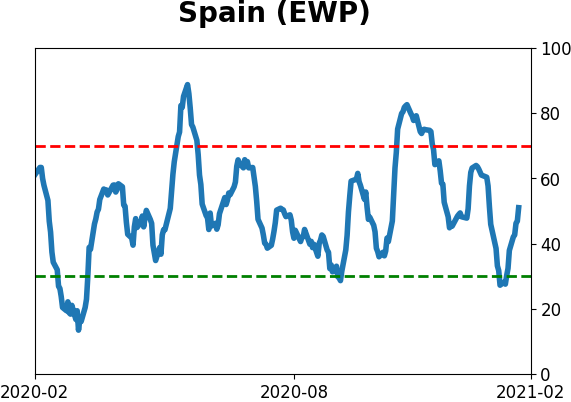
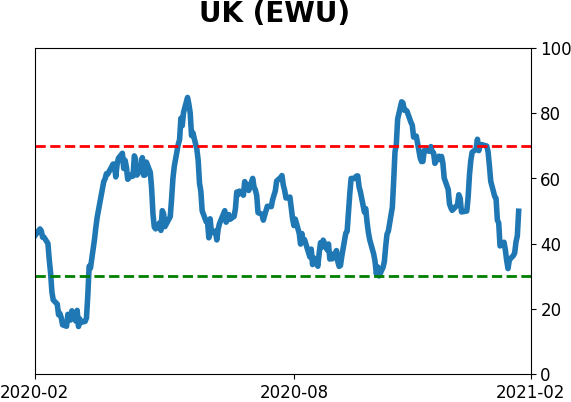
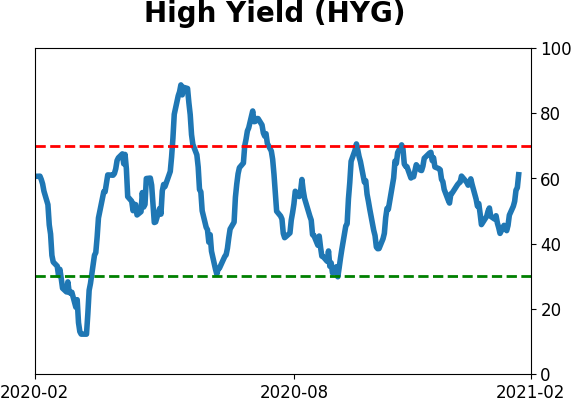
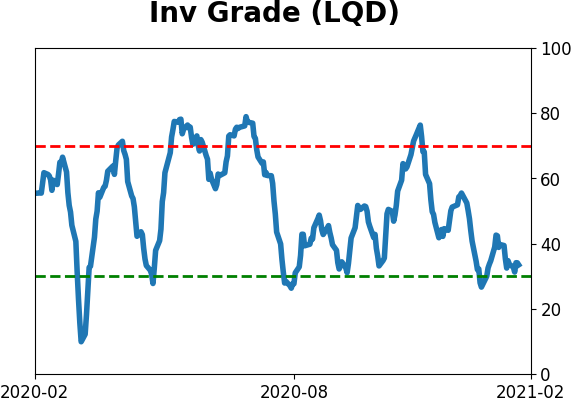
Sentiment Around The World
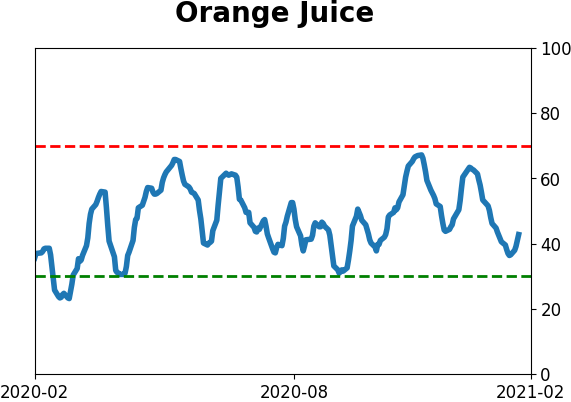
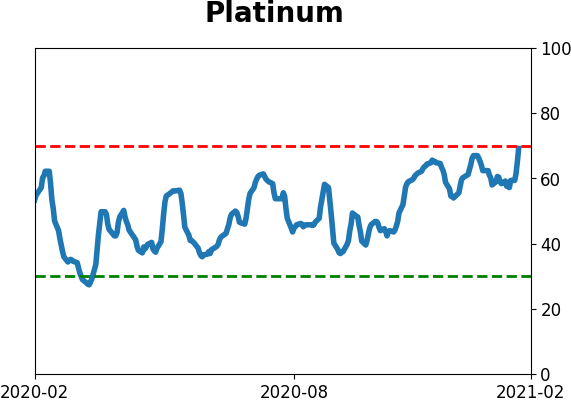
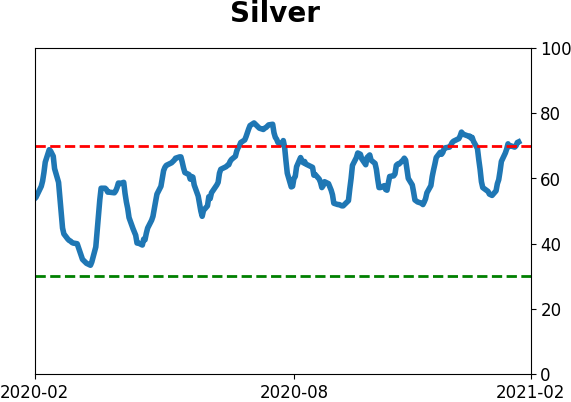
Optimism Index Thumbnails
|
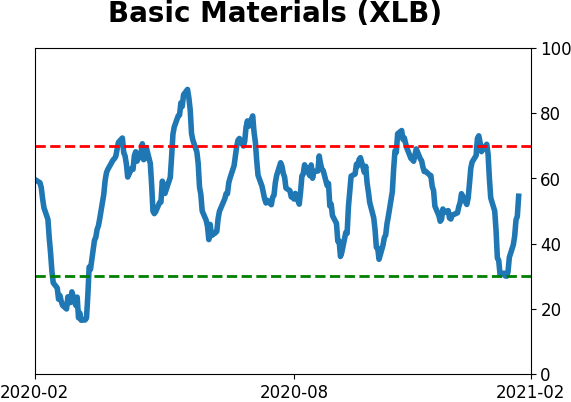
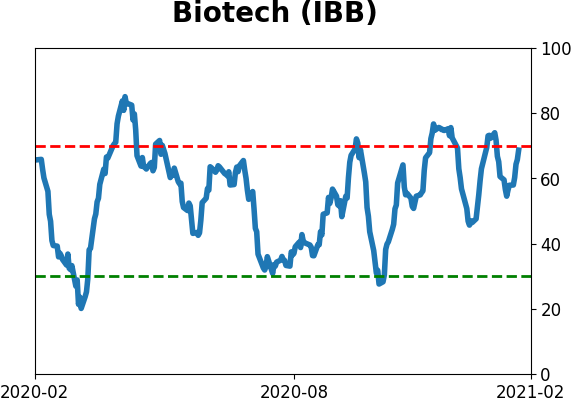
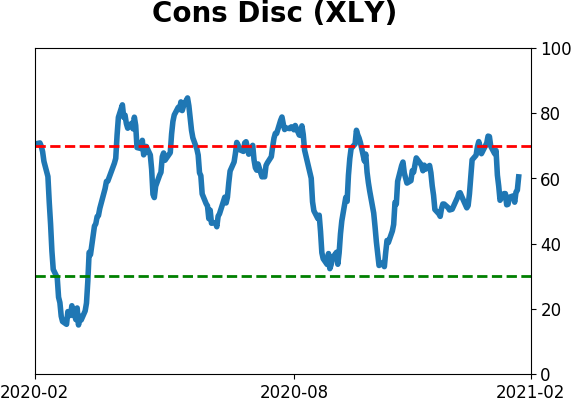
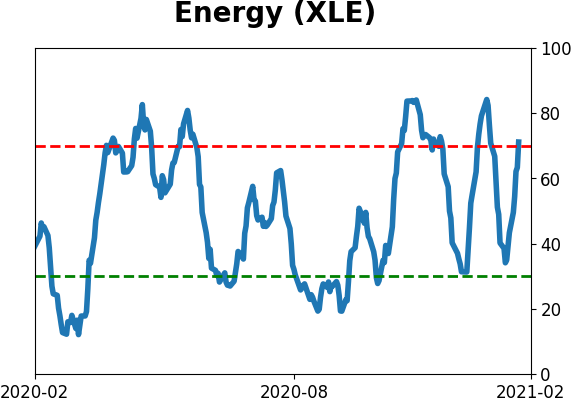
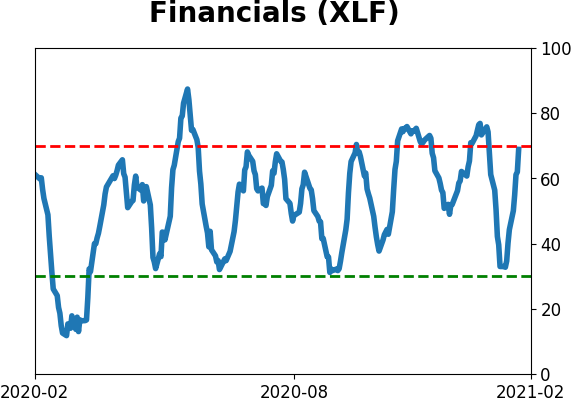
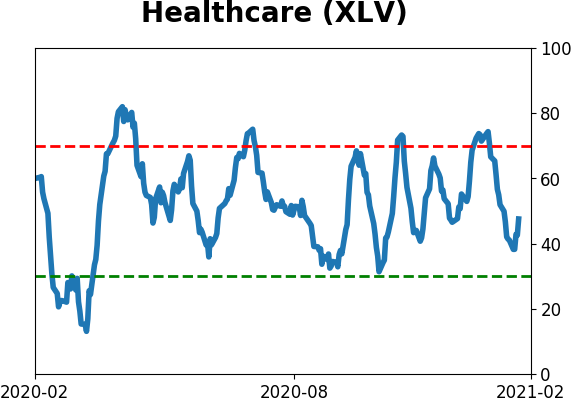
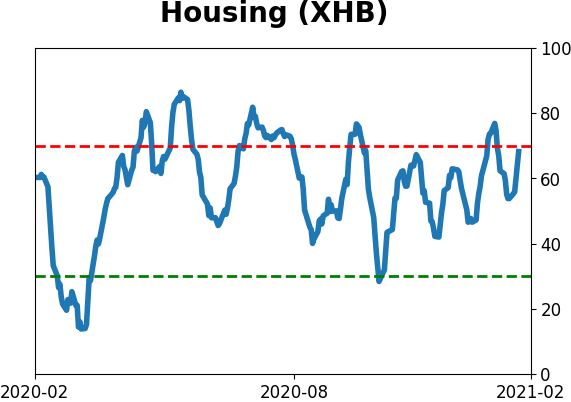
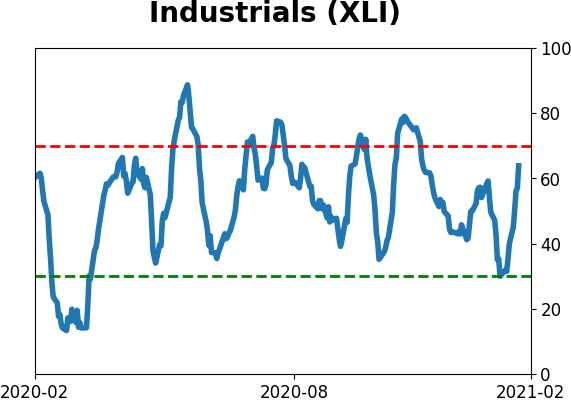
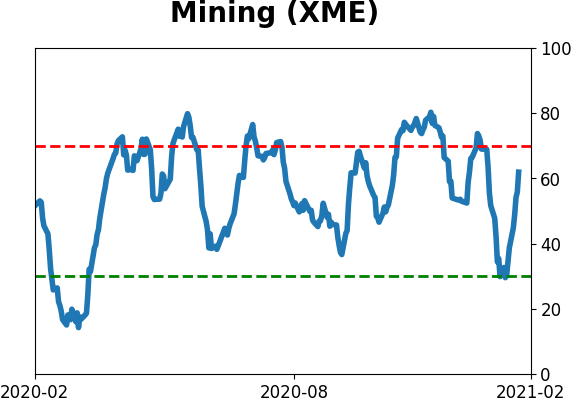
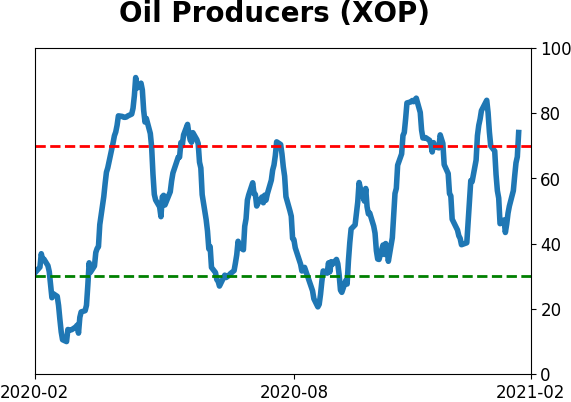
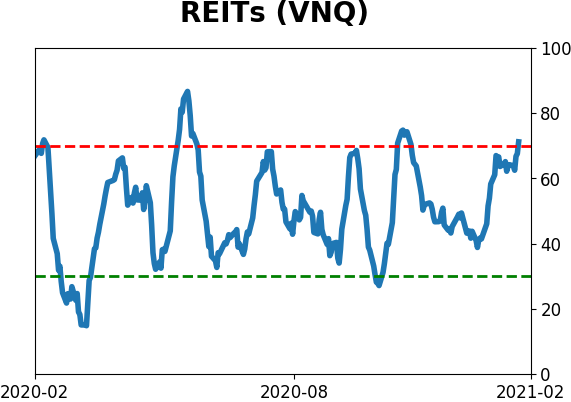
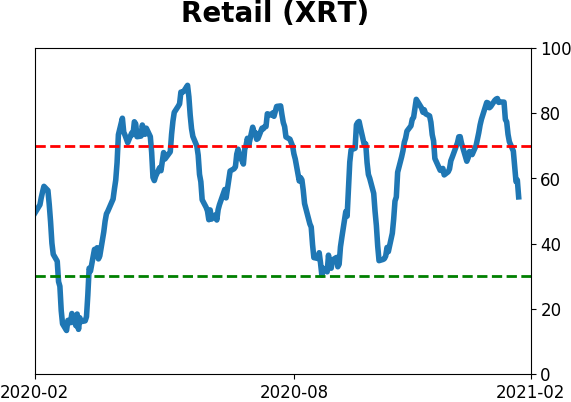
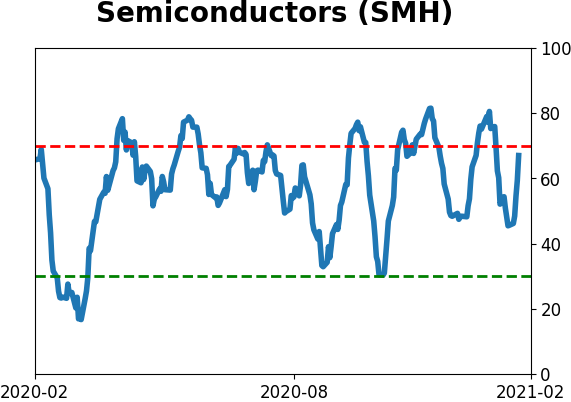
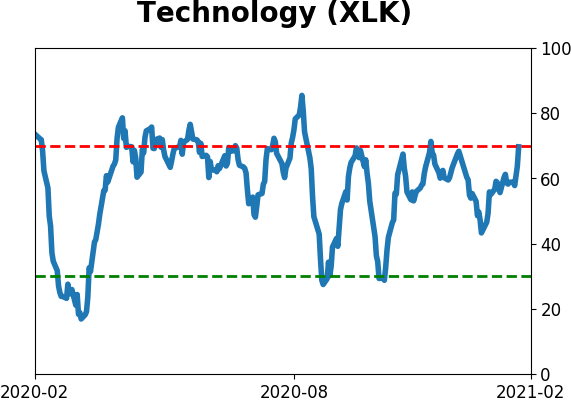
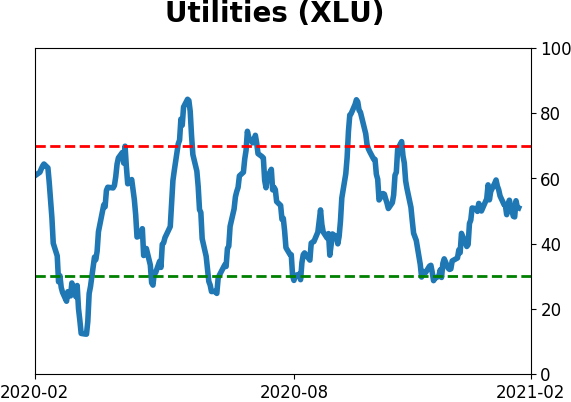
Sector ETF's - 10-Day Moving Average
|
|
|
Country ETF's - 10-Day Moving Average
|
|
|
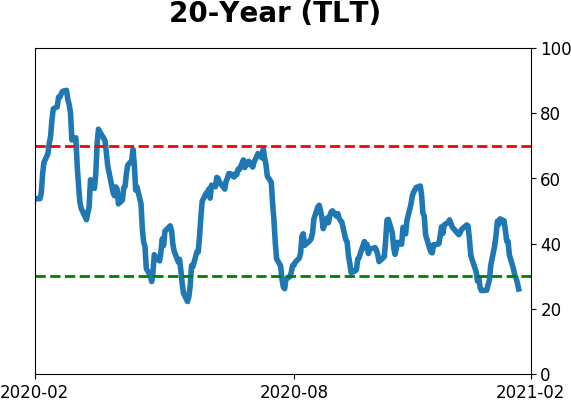
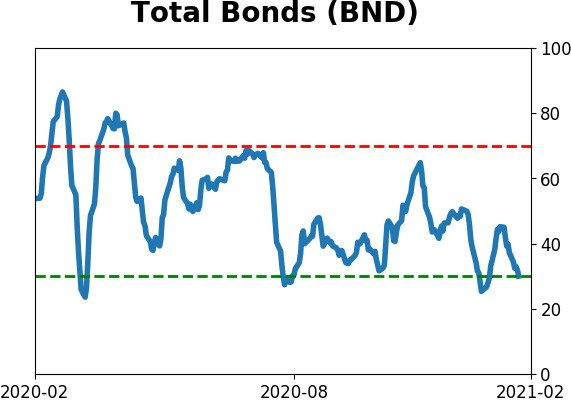
Bond ETF's - 10-Day Moving Average
|
|
|
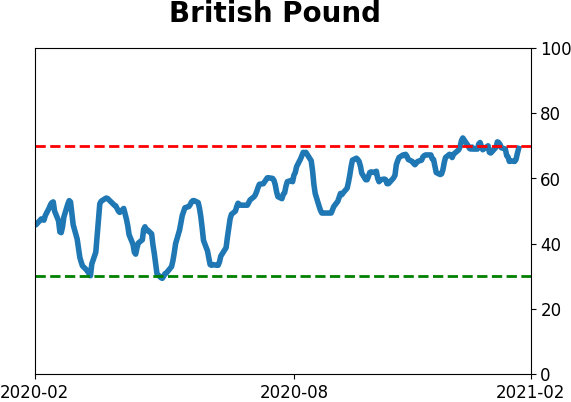
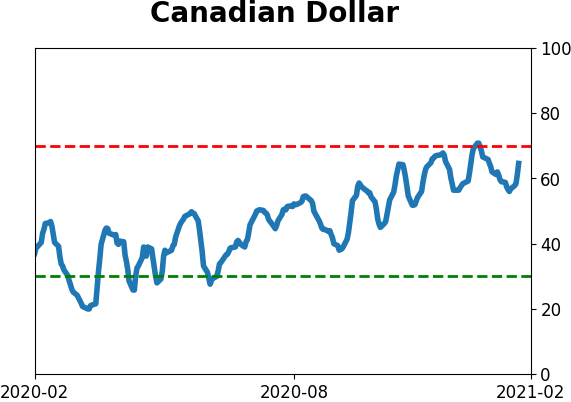
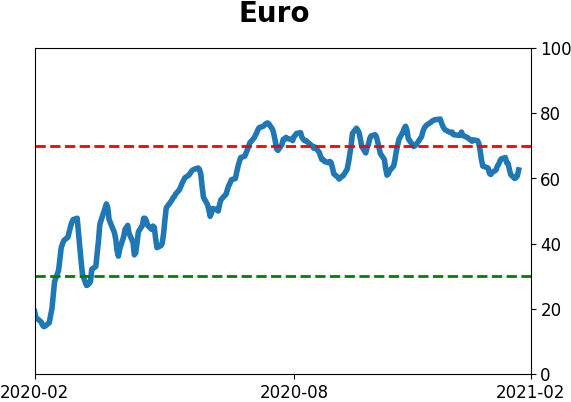
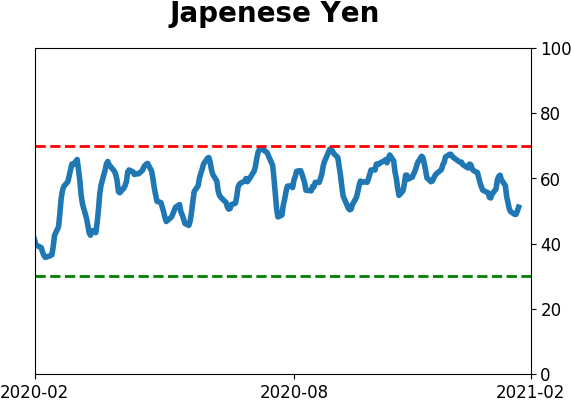
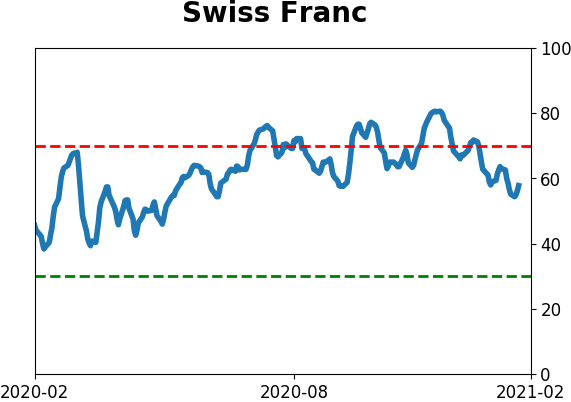
Currency ETF's - 5-Day Moving Average
|
|
|
Commodity ETF's - 5-Day Moving Average
|
|