Headlines
|
|
The rise in rates reaches an extreme level:
The yield on 10-year Treasury notes has risen steadily, as has the yield curve. Both are now more than 1.5 standard deviations from their 1-year average. This has led to mostly higher stocks and commodities, with a lower dollar.
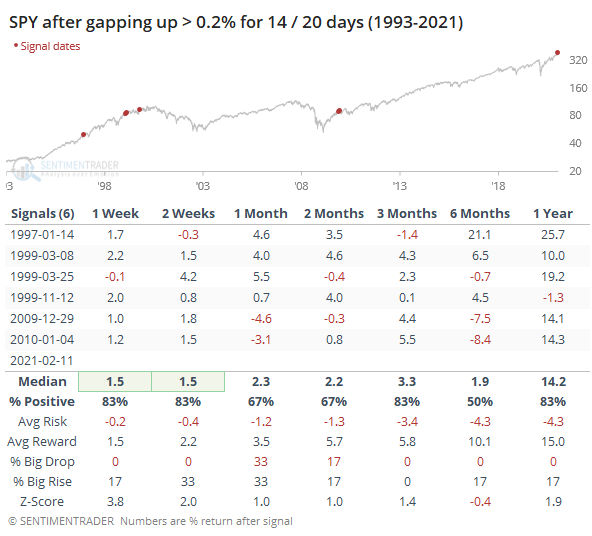
Gappy behavior: Stocks keep getting pushed up at the open. Across SPY, QQQ, and IWM, they have gapped up at least 0.2% from the prior close on 14 out of the past 20 sessions, a new record since all 3 funds came into existence. For the S&P 500 fund alone, it's just shy of a record. Other times it gapped up 14 out of 20 days, it continued to run in March 1999, but the others all ended up leading to negative returns at some point.
Bottom Line:
See the Outlook & Allocations page for more details on these summaries STOCKS: Weak sell
We're in an extremely speculative environment that is enough to become defensive, especially with recent cracks showing in what had been pristine breadth conditions. The spike in fear from a couple of weeks ago has dissipated and likely not enough to offset the negatives over a medium-term time frame. BONDS: Weak buy
Various parts of the market have been hit in recent weeks, with mild oversold conditions. Treasuries have been hit hard and will likely start to register some extremes soon. GOLD: Weak buy
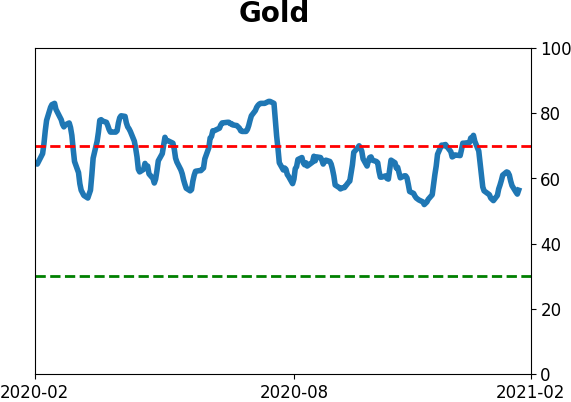
A dollar trying to rebound from a severe short position has weighed on gold and miners. The types of signals they've given in recent weeks, within the context of their recent surge, have usually resulted in higher prices over a medium- to long-term time frame.
|
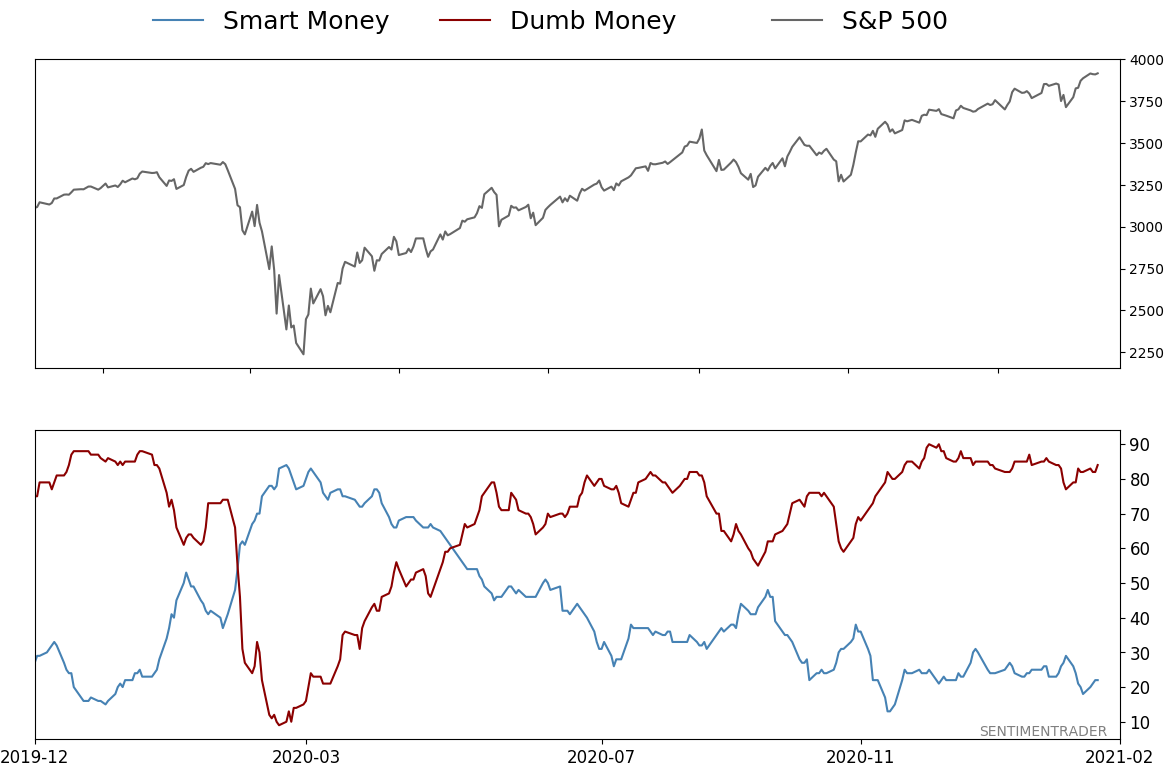
Smart / Dumb Money Confidence
|
Smart Money Confidence: 22%
Dumb Money Confidence: 84%
|
|
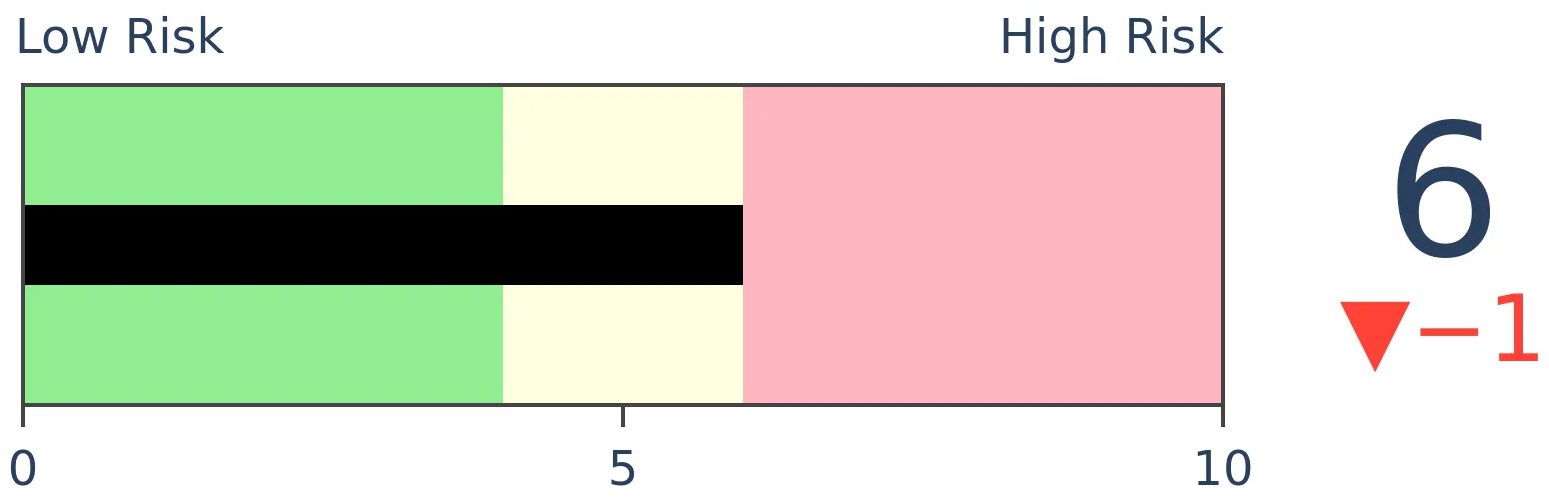
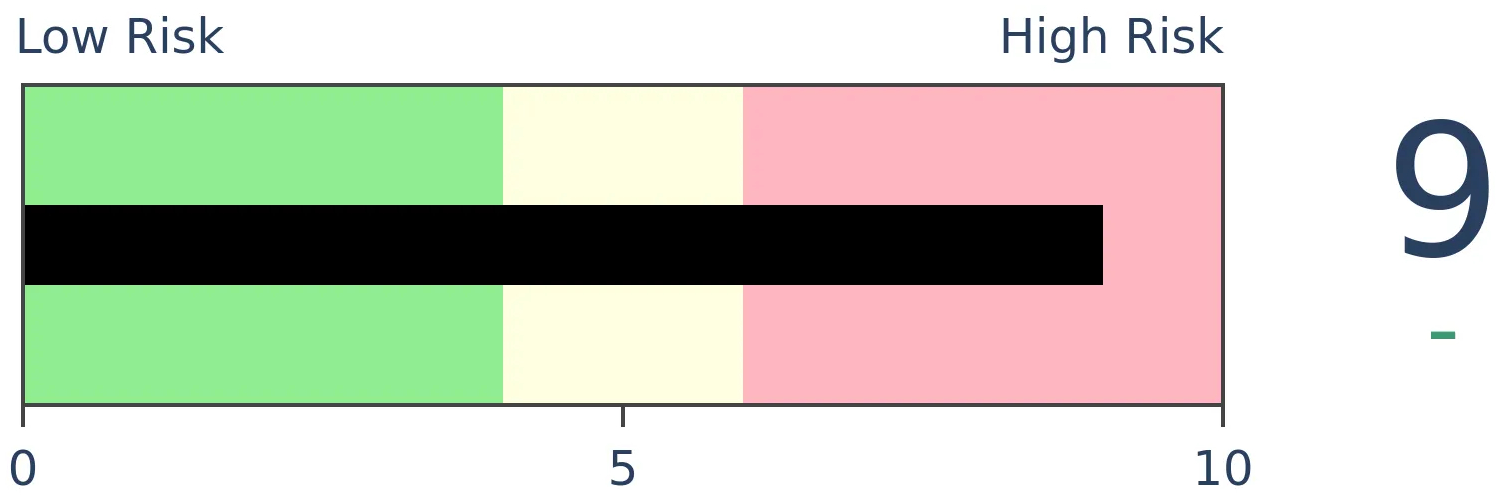
Risk Levels
Stocks Short-Term
|
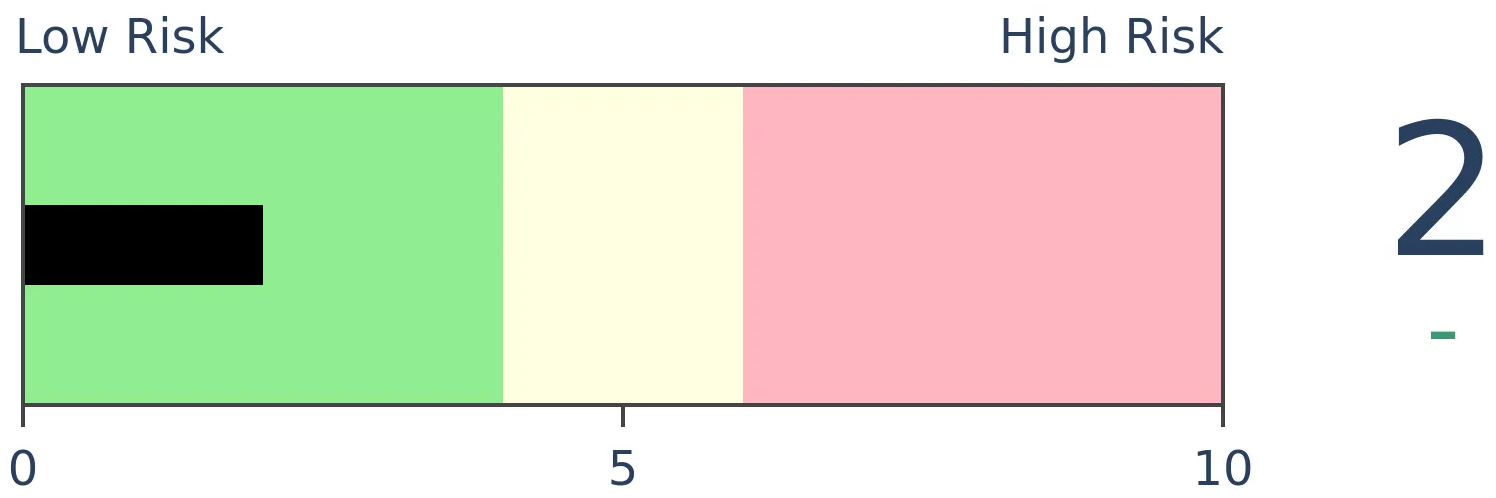
Stocks Medium-Term
|
|
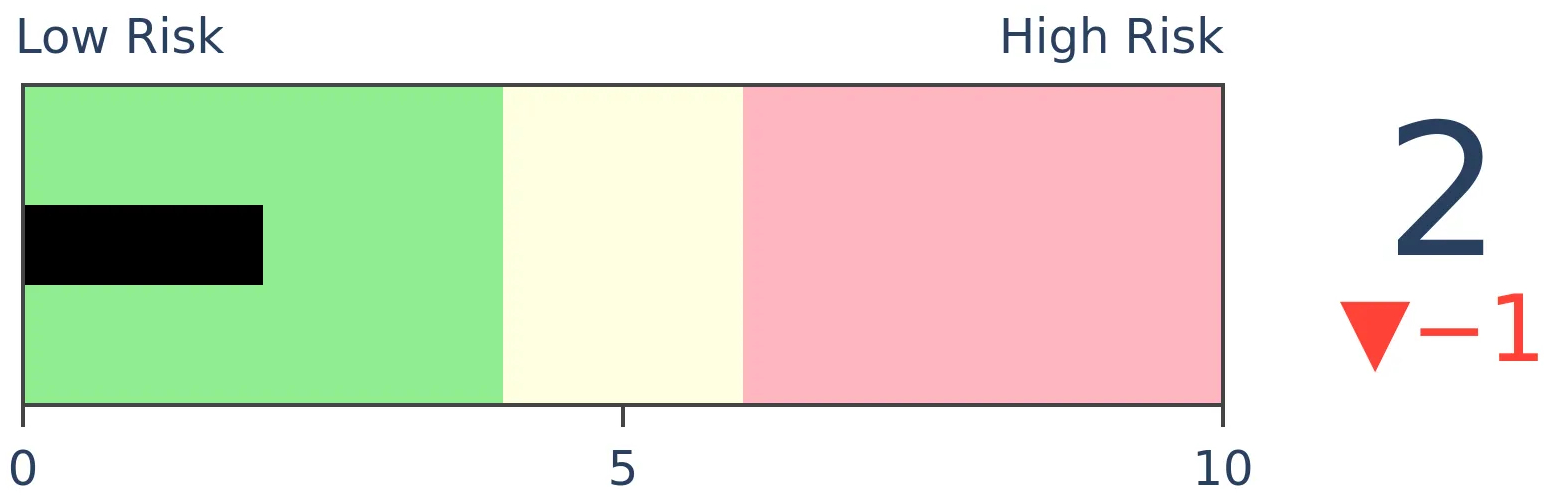
Bonds
|
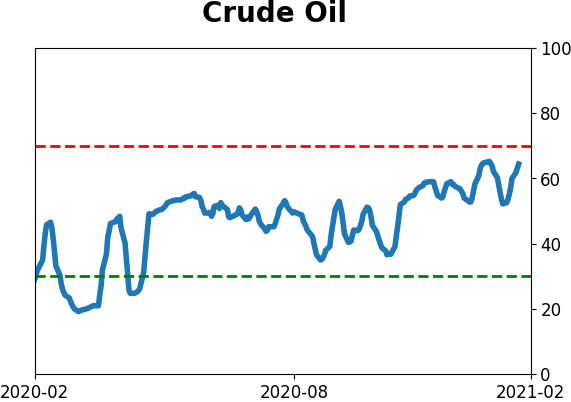
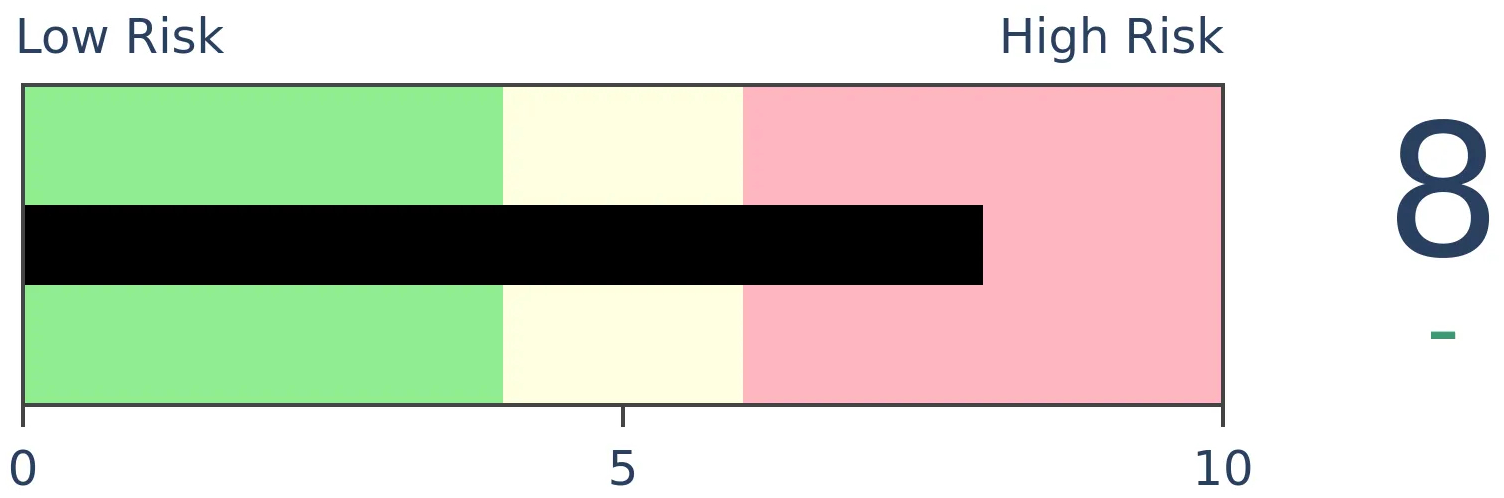
Crude Oil

|
|
Gold
|
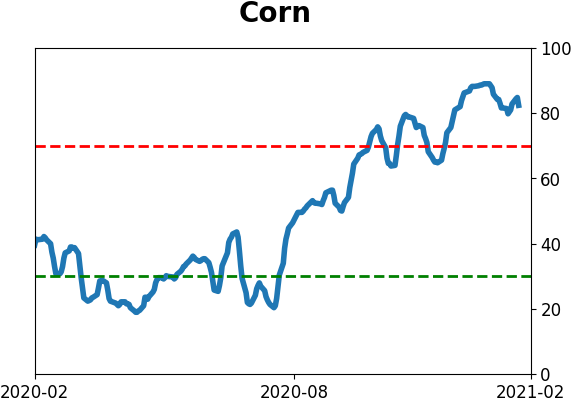
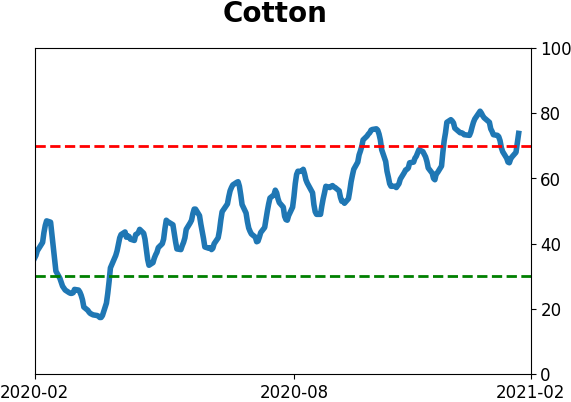
Agriculture
|
|
Research
BOTTOM LINE
The yield on 10-year Treasury notes has risen steadily, as has the yield curve. Both are now more than 1.5 standard deviations from their 1-year average. This has led to mostly higher stocks and commodities, with a lower dollar.
FORECAST / TIMEFRAME
None
|
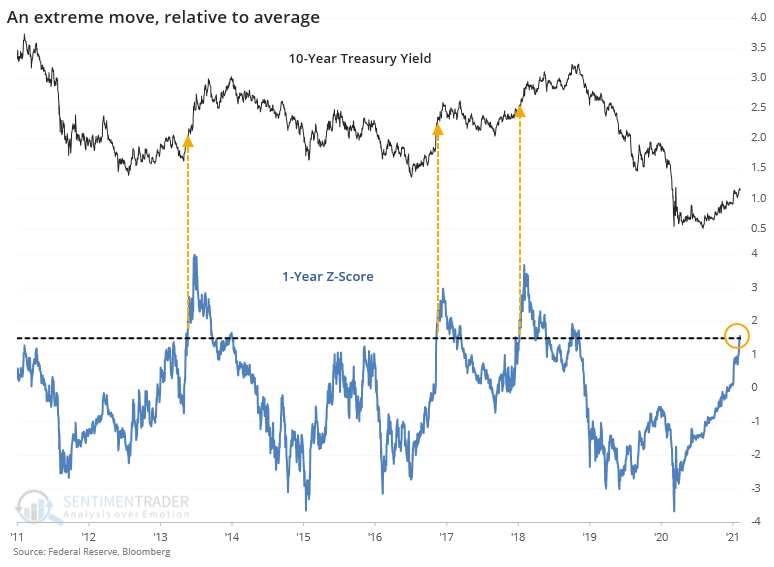
The march higher in the yield on 10-year Treasury notes took a breather in recent days, but it's mostly been a steady rise for most of the last 6 months.
So much so that the 1-year z-score, a measure of how unusual the move is relative to recent history, just reached 1.5 standard deviations for the 4th distinct time in the past decade.
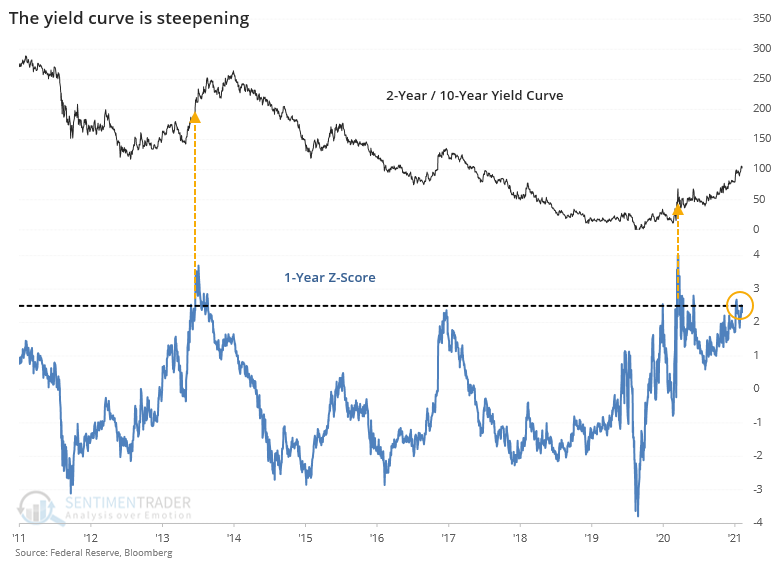
The push higher in rates has been focused mostly on the longer end of the Treasury yield curve, so the 2-year / 10-year spread has also made an extreme move.
This is typically taken as a reflection of economic growth and should be a positive for stocks going forward. When both the yield on 10-year notes and the yield curve were more than 1.5 deviations above trend, that mostly proved true. Over the next couple of months, there were only a couple of small losses.
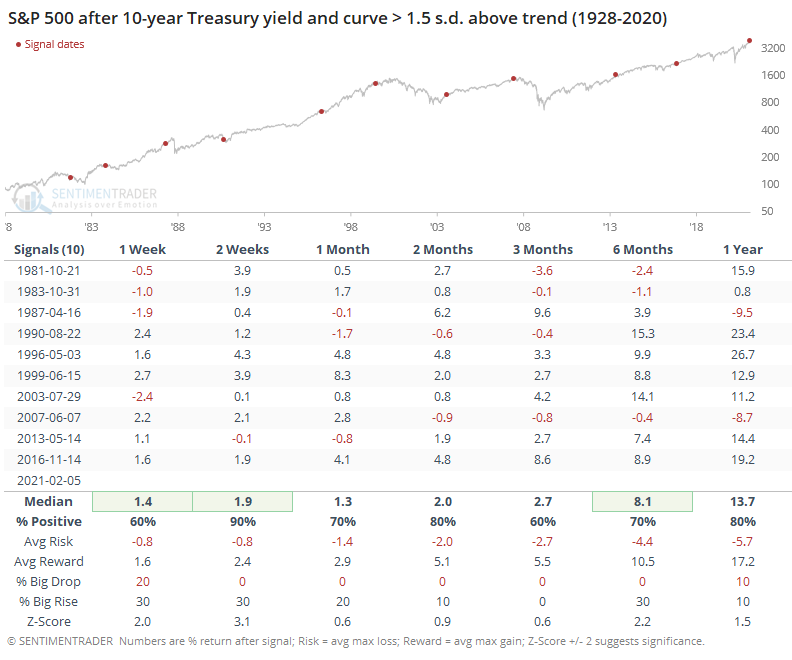
From the chart, we can see little red dots near the peaks in 1987, 2000, and 2007, but they triggered well before stocks peaked. Returns over the medium-term were middling, as was the risk/reward ratio, but overall there was a modest positive bias.
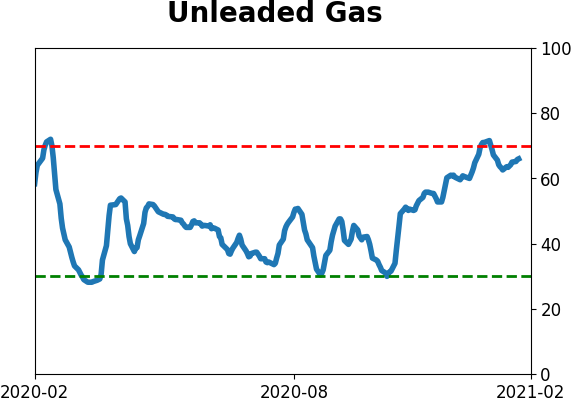
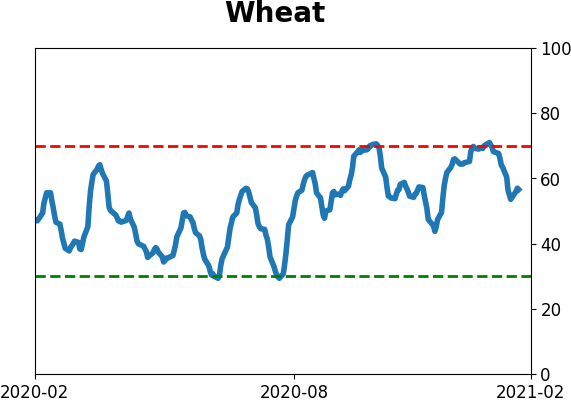
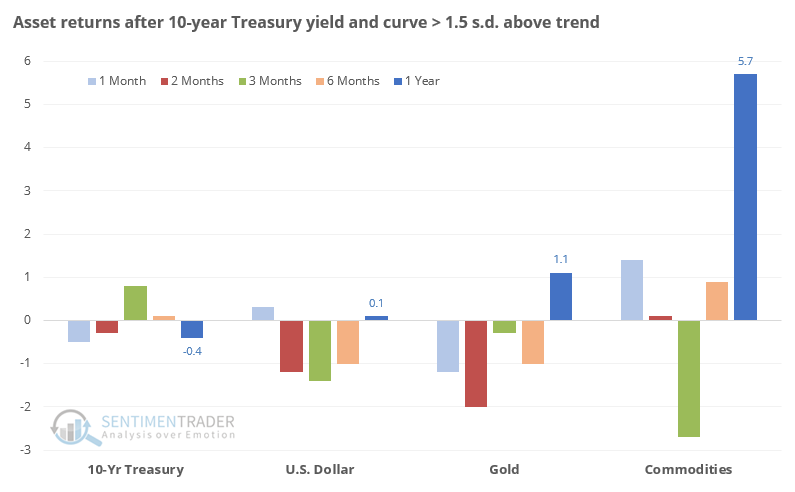
As for other assets, it preceded mostly negative returns, with commodities holding up the best over the next year. That is a general basket of commodities weighted by trading volume and world production as calculated by Bloomberg.
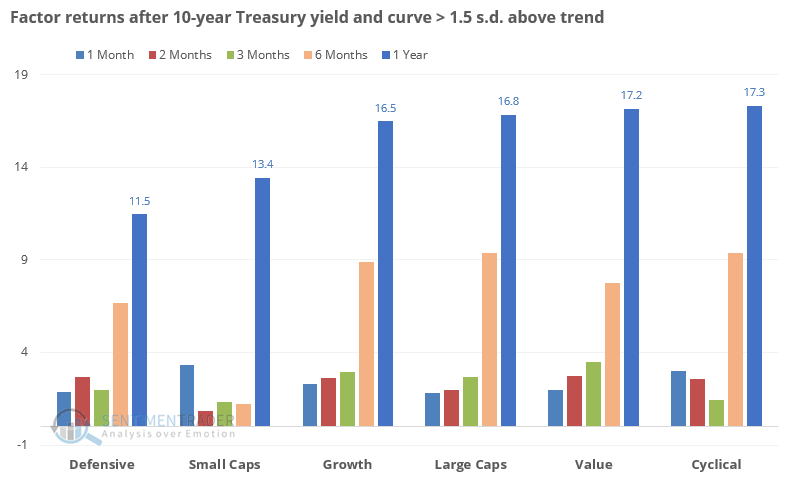
Among equity factors, returns were fairly balanced. Surprisingly so, actually. There was a bit of a medium-term blah among small-cap stocks, but other than that, there wasn't much of a bias between them.
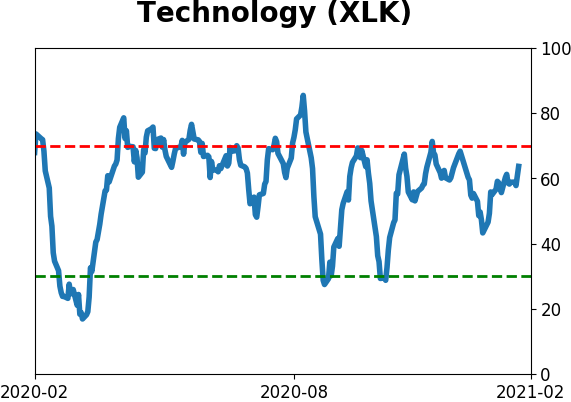
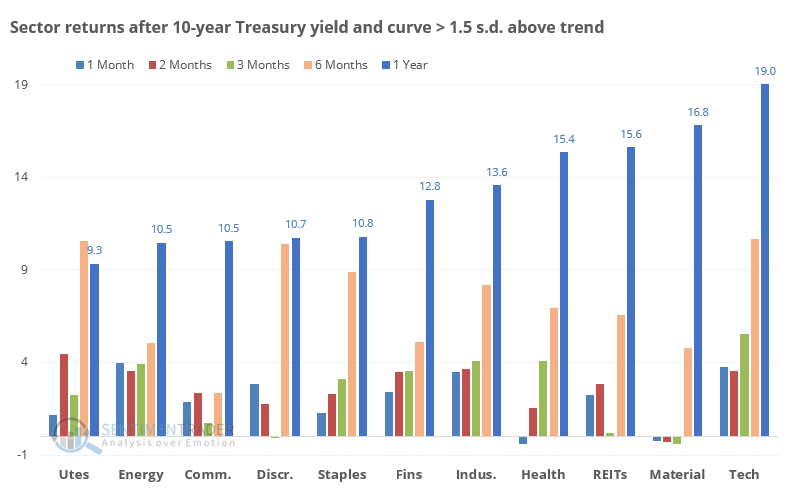
It's also perhaps surprising that among major sectors, tech stocks showed the largest gains a year later. One of the bearish arguments right now for tech is that rising rates will cause investors to reprice the risk inherent in a sector where so many companies are struggling to turn a profit. Energy, financial, and industrial stocks also held up well across time frames.
Ask 10 investors about what the rise in rates is likely to mean, and you're likely to get 10 different responses. We're at such a unique moment in history that perhaps history isn't any guide at all. From what we can determine, though, the trend of rising rates, which ostensibly signals an economic recovery, is more of a modest point in bulls' favor than bears.
Active Studies
| Time Frame | Bullish | Bearish | | Short-Term | 0 | 0 | | Medium-Term | 2 | 7 | | Long-Term | 16 | 3 |
|
Indicators at Extremes
Portfolio
| Position | Description | Weight % | Added / Reduced | Date | | Stocks | RSP | 4.9 | Reduced 4% | 2021-02-09 | | Bonds | 10% BND, 8.9% SCHP, 4.8% ANGL | 23.7 | Reduced 4% | 2021-02-09 | | Commodities | GCC | 2.3 | Reduced 2.1%
| 2020-09-04 | | Precious Metals | GDX | 8.9 | Added 4.8% | 2020-12-01 | | Special Situations | 9.6% XLE, 8.2% PSCE | 17.8 | Reduced 1.5% | 2021-02-09 | | Cash | | 42.8 | | |
|
Updates (Changes made today are underlined)
With a market that has seen the kinds of broad participation and big breath thrusts like we did in the fall, it's hard to become too negative. Those kinds of conditions have consistently preceded higher returns over the next 6-12 months. It's the interim that's more of an issue. Even conditions like that haven't prevented some shorter-term pullbacks. And when we combine an environment where speculation is rampant and recent days have seen an increase in cracks under the surface of the indexes, it's enough to become more defensive over a short- to medium-term time frame. We still don't have much confirmation from the price action in the indexes, so those who are more conservative would likely wait before increasing cash levels. Not much has changed, but I'm getting increasingly anxious and prefer to hold cash over riskier assets so I increased the cash cushion. RETURN YTD: 5.3% 2020: 8.1%, 2019: 12.6%, 2018: 0.6%, 2017: 3.8%, 2016: 17.1%, 2015: 9.2%, 2014: 14.5%, 2013: 2.2%, 2012: 10.8%, 2011: 16.5%, 2010: 15.3%, 2009: 23.9%, 2008: 16.2%, 2007: 7.8%
|
|
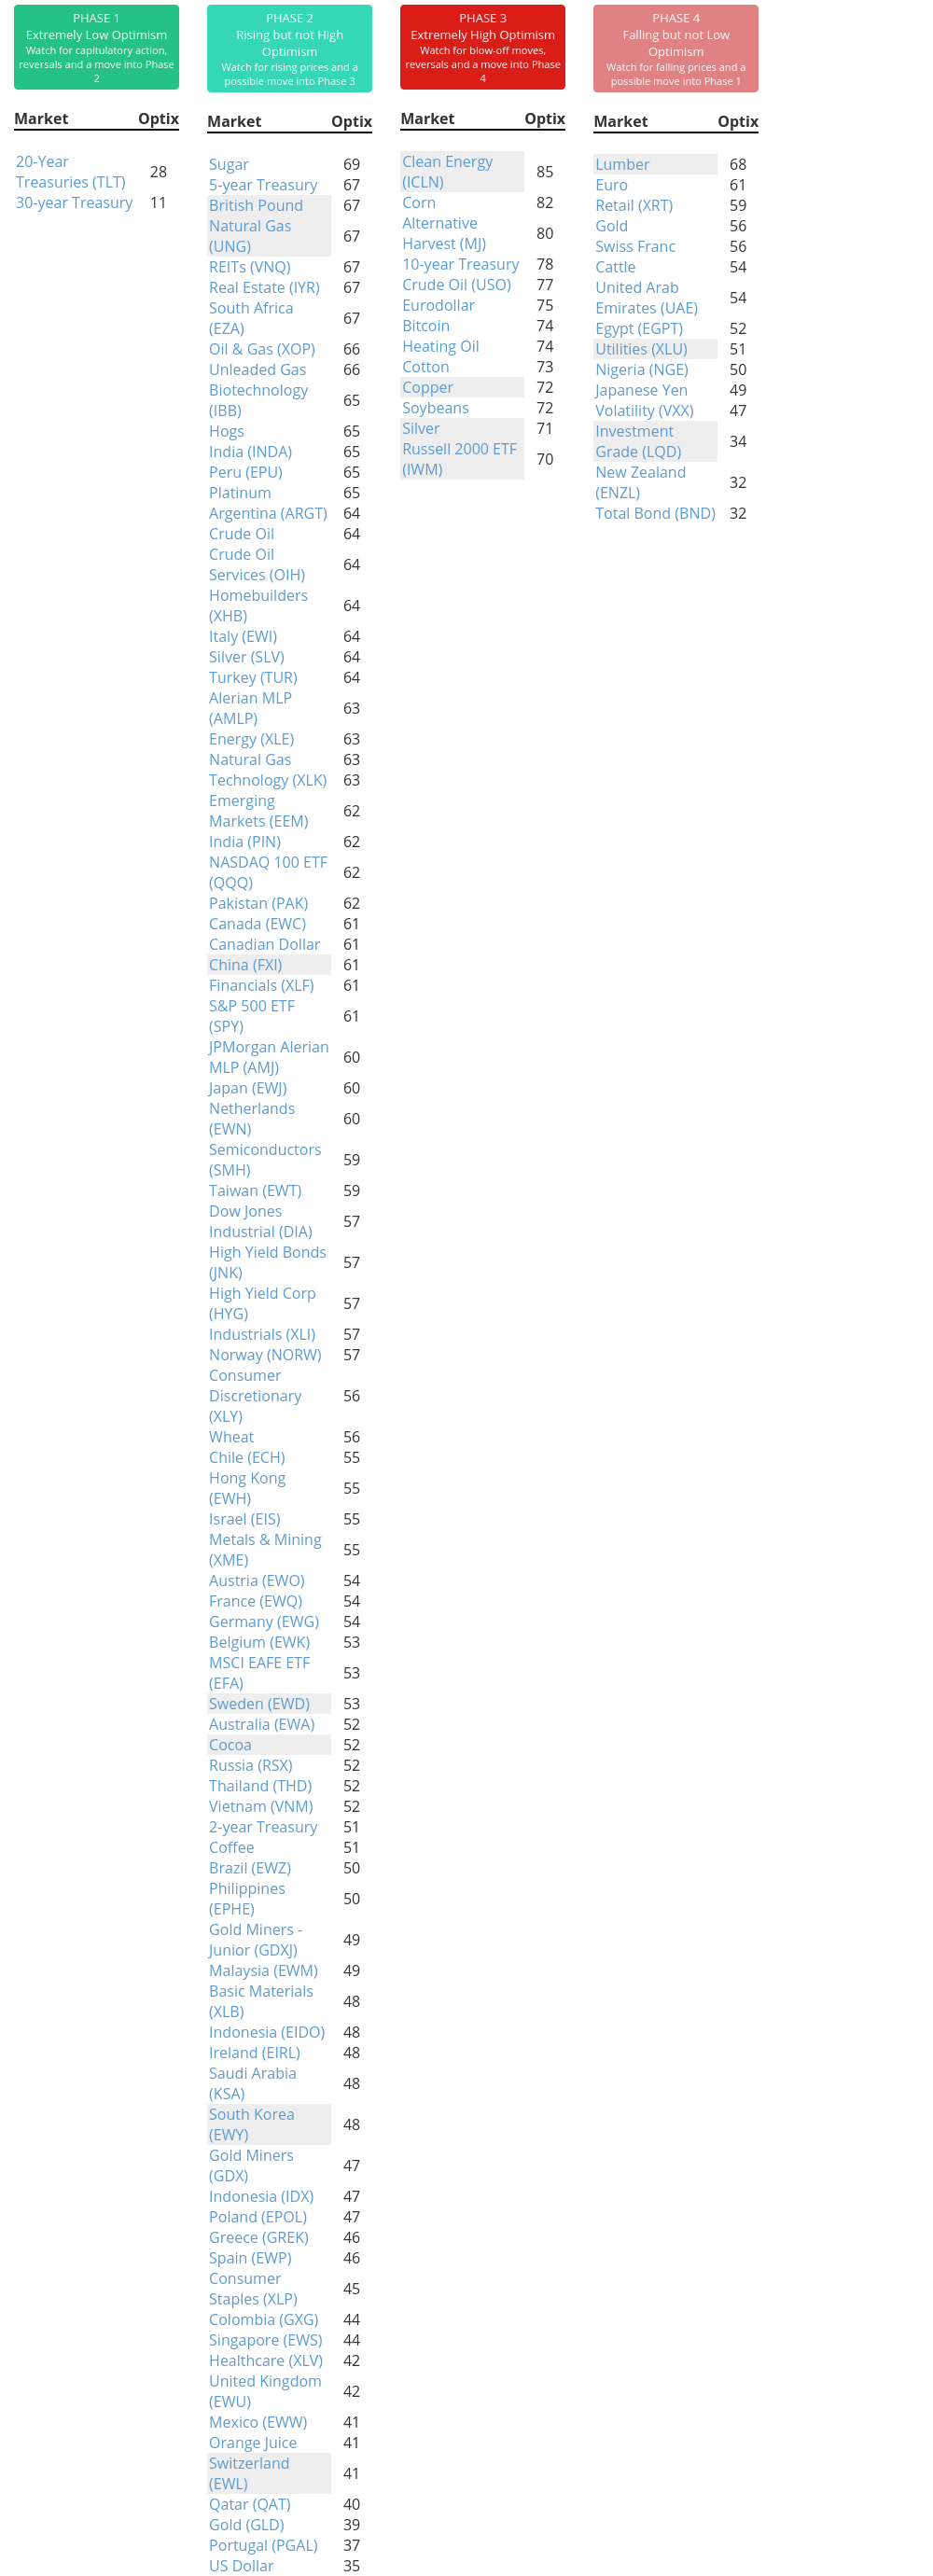
Phase Table
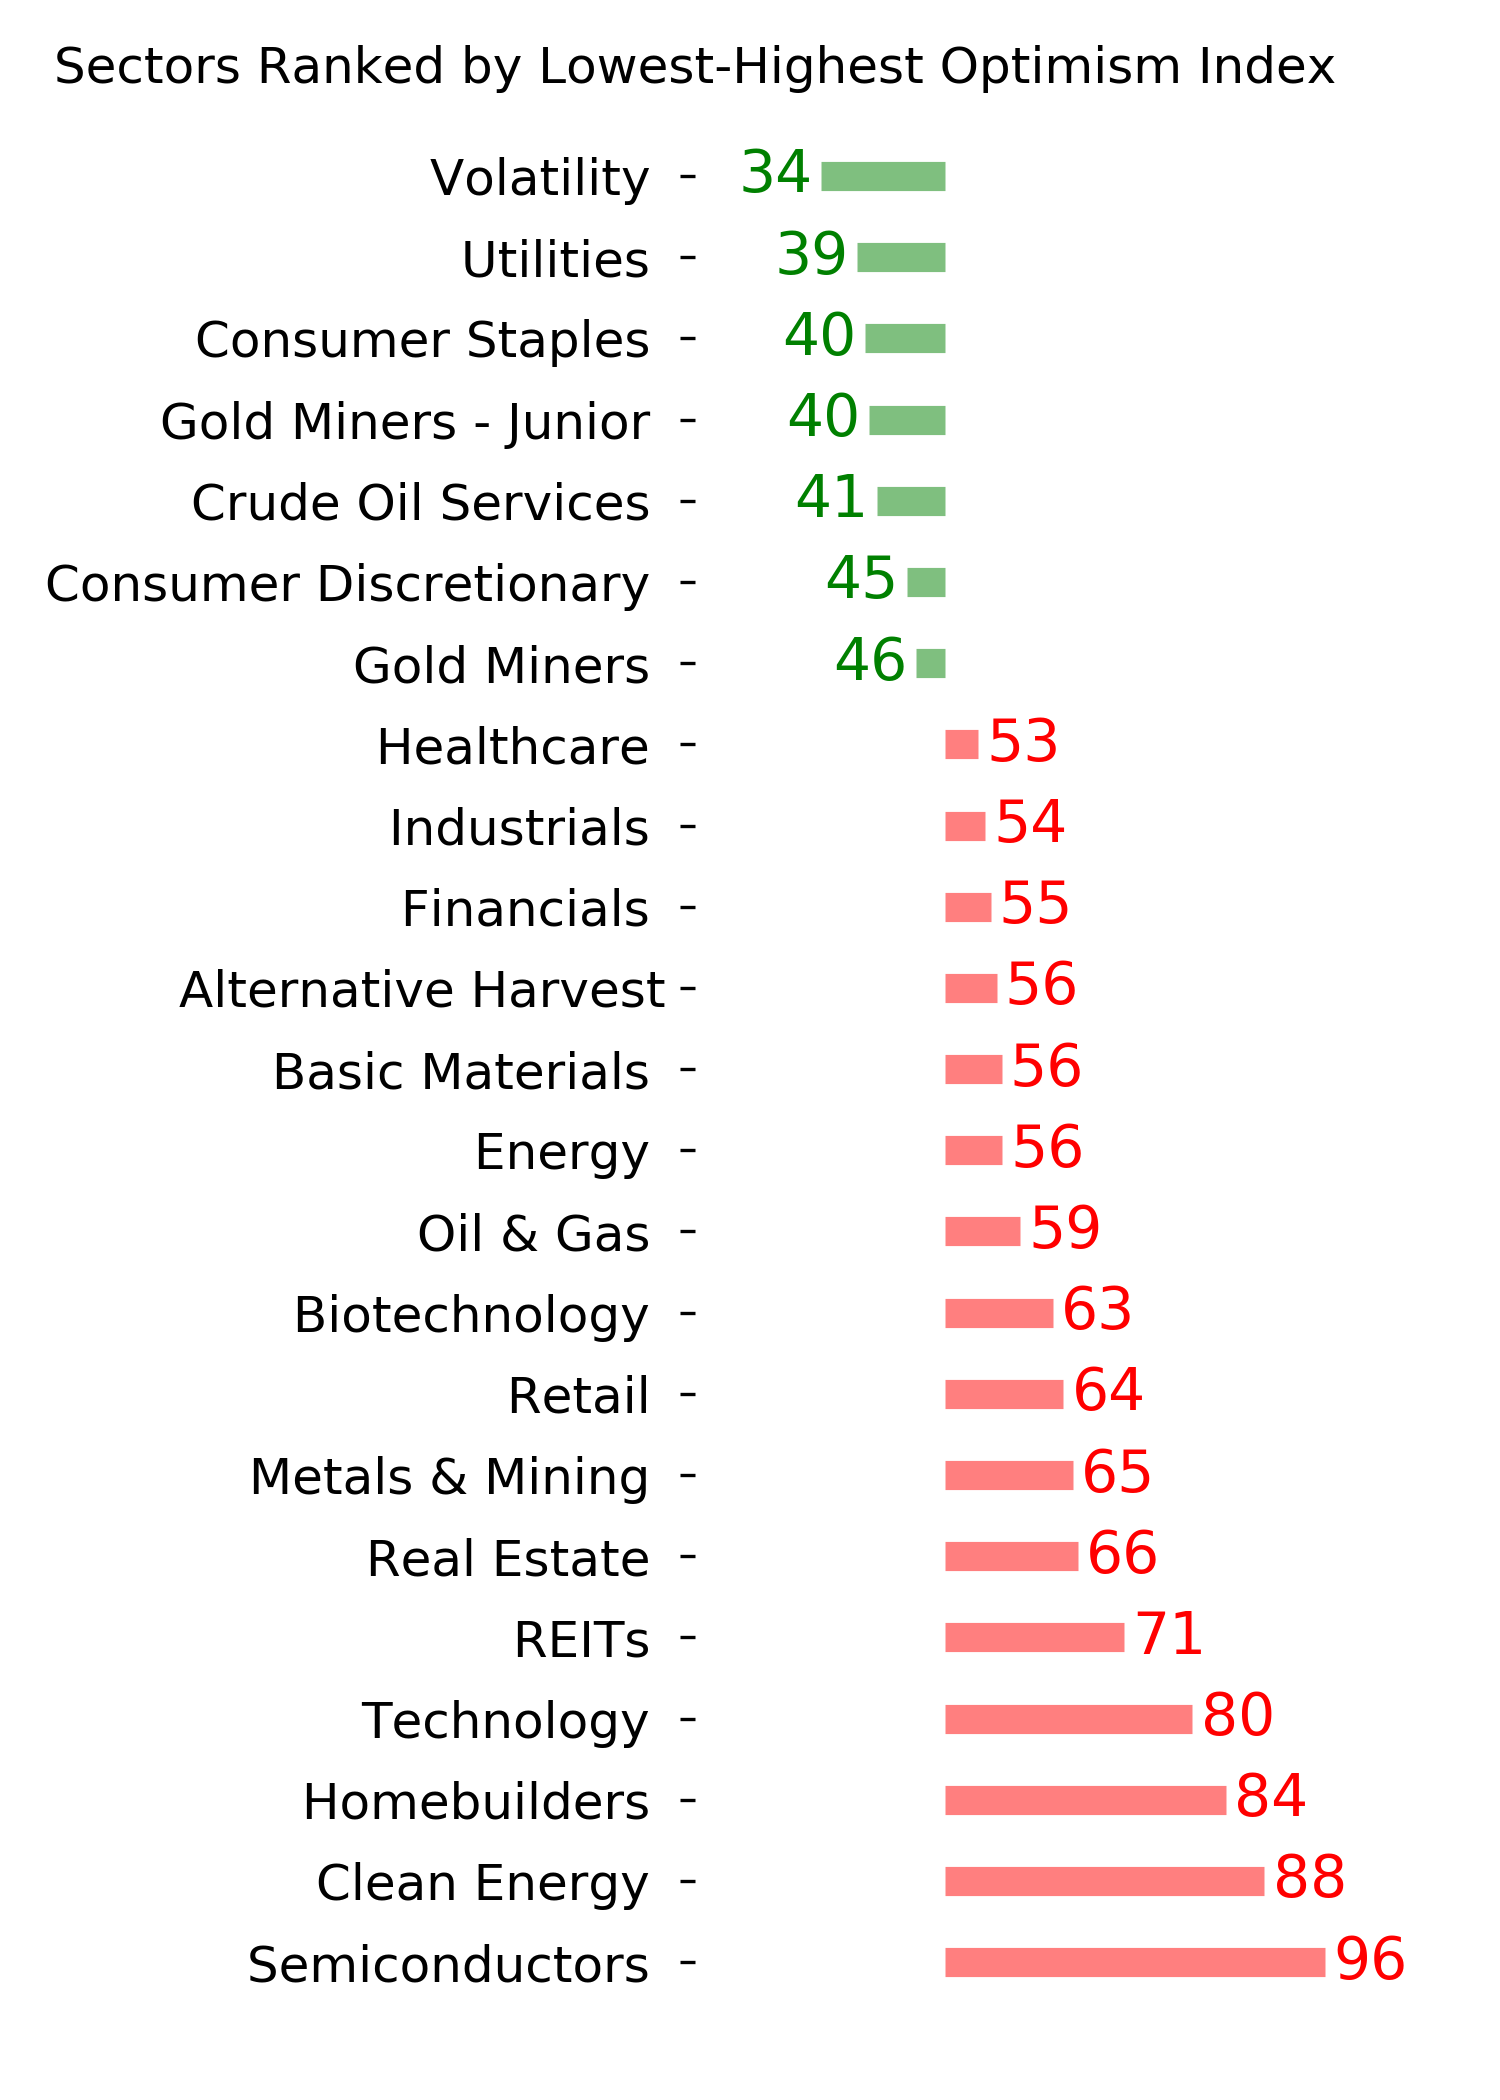
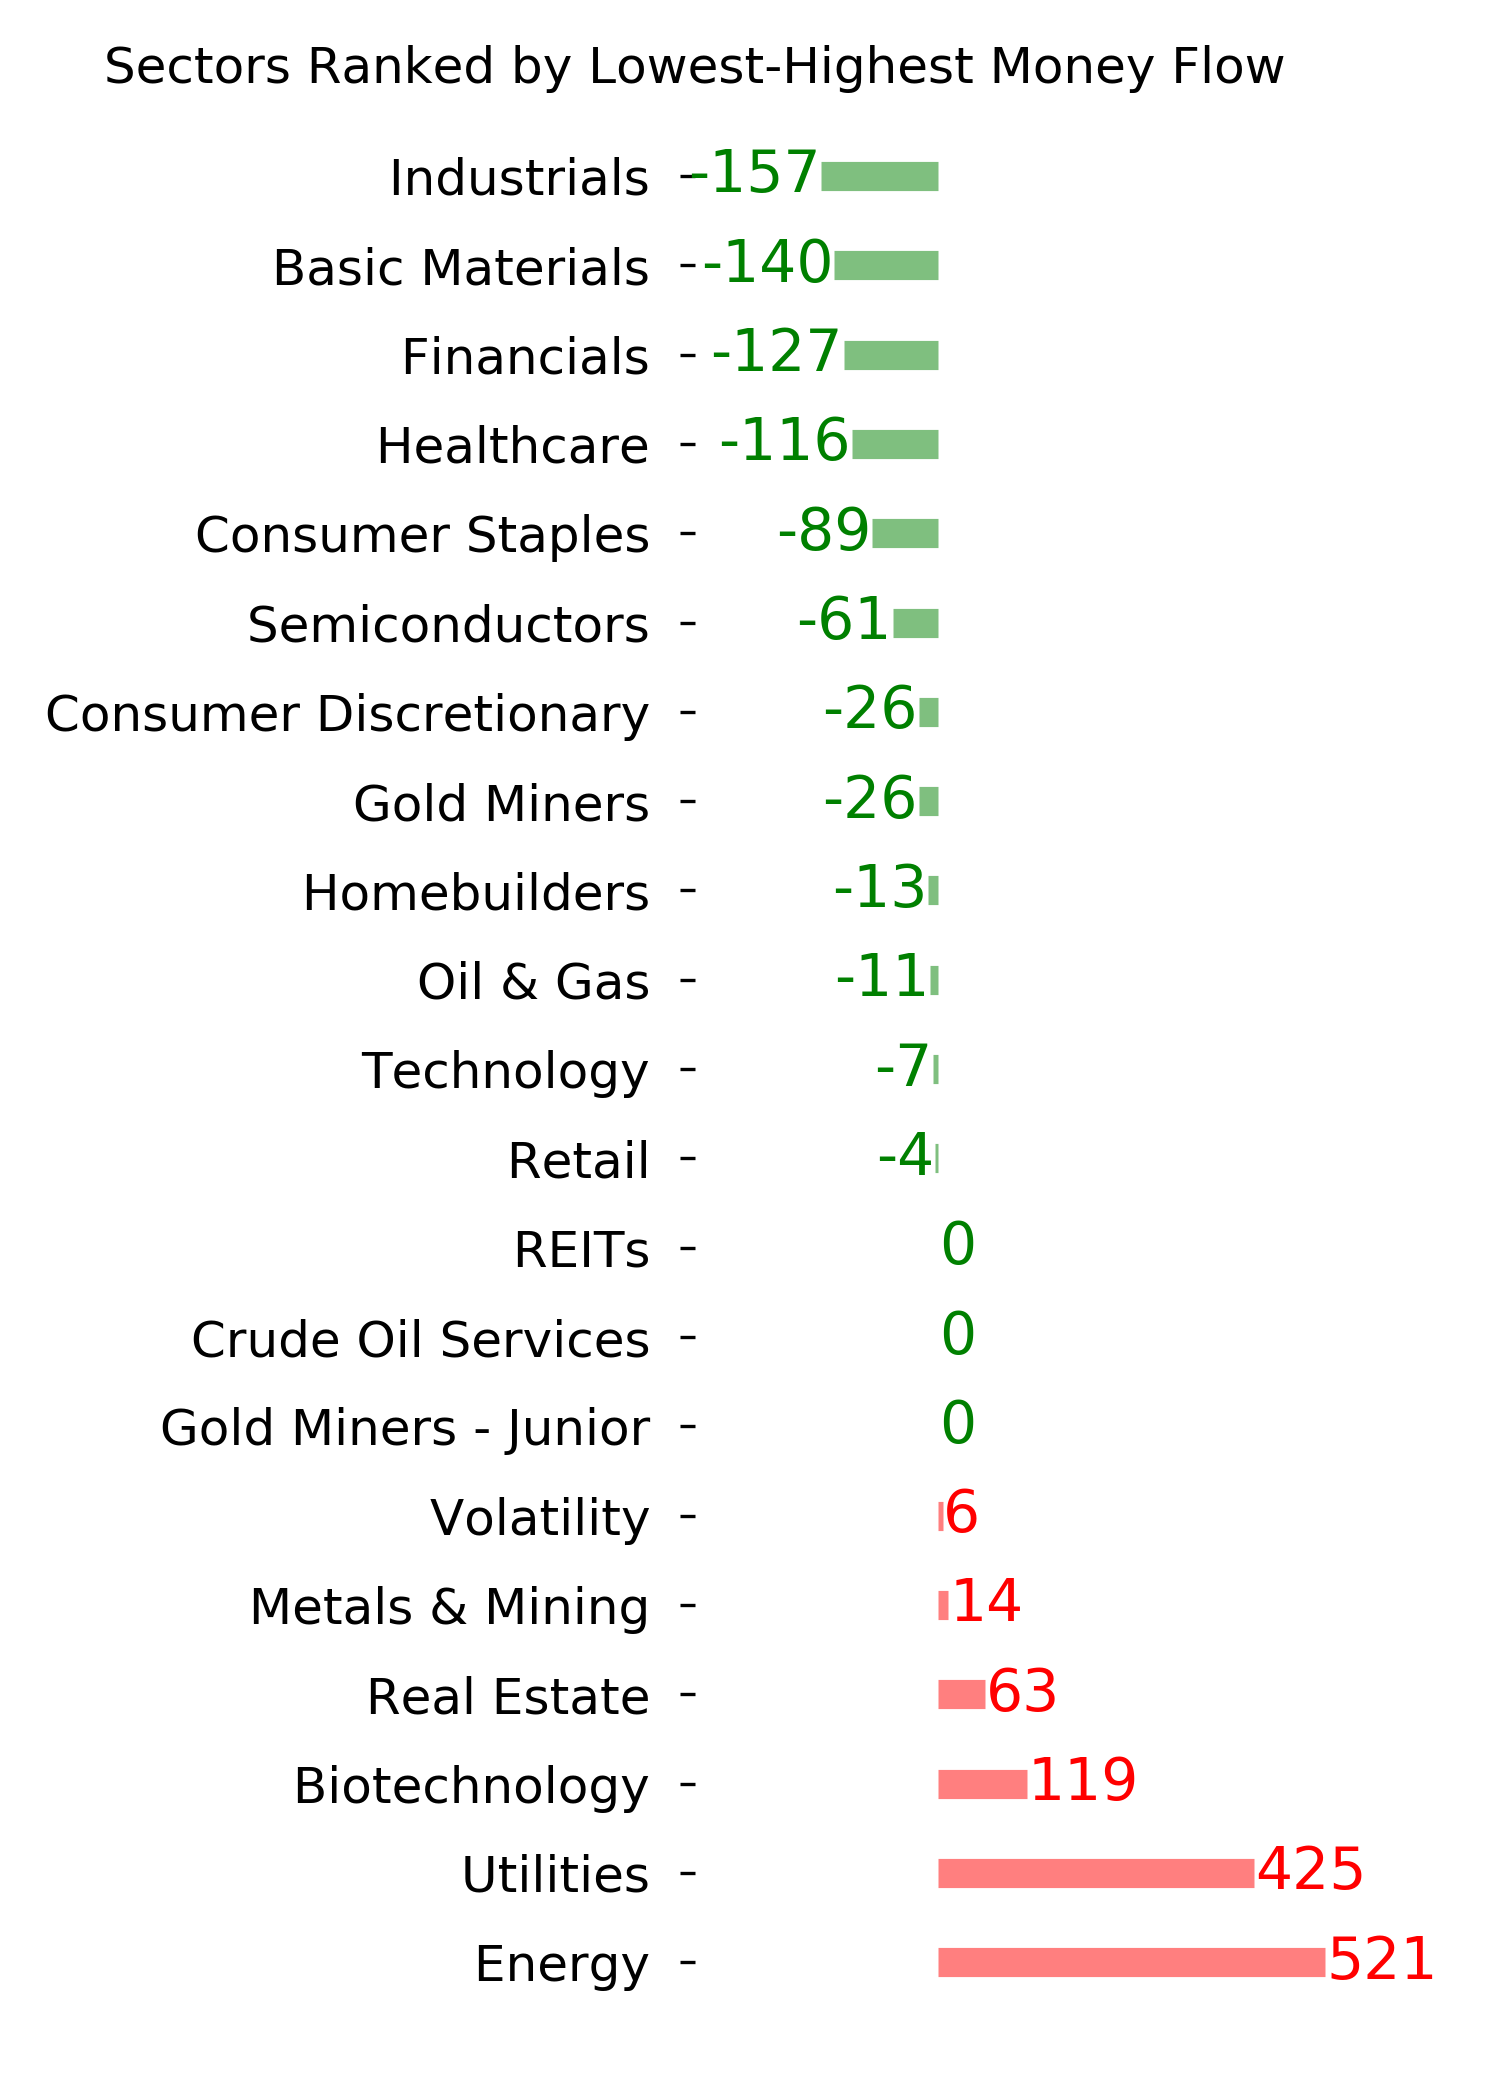
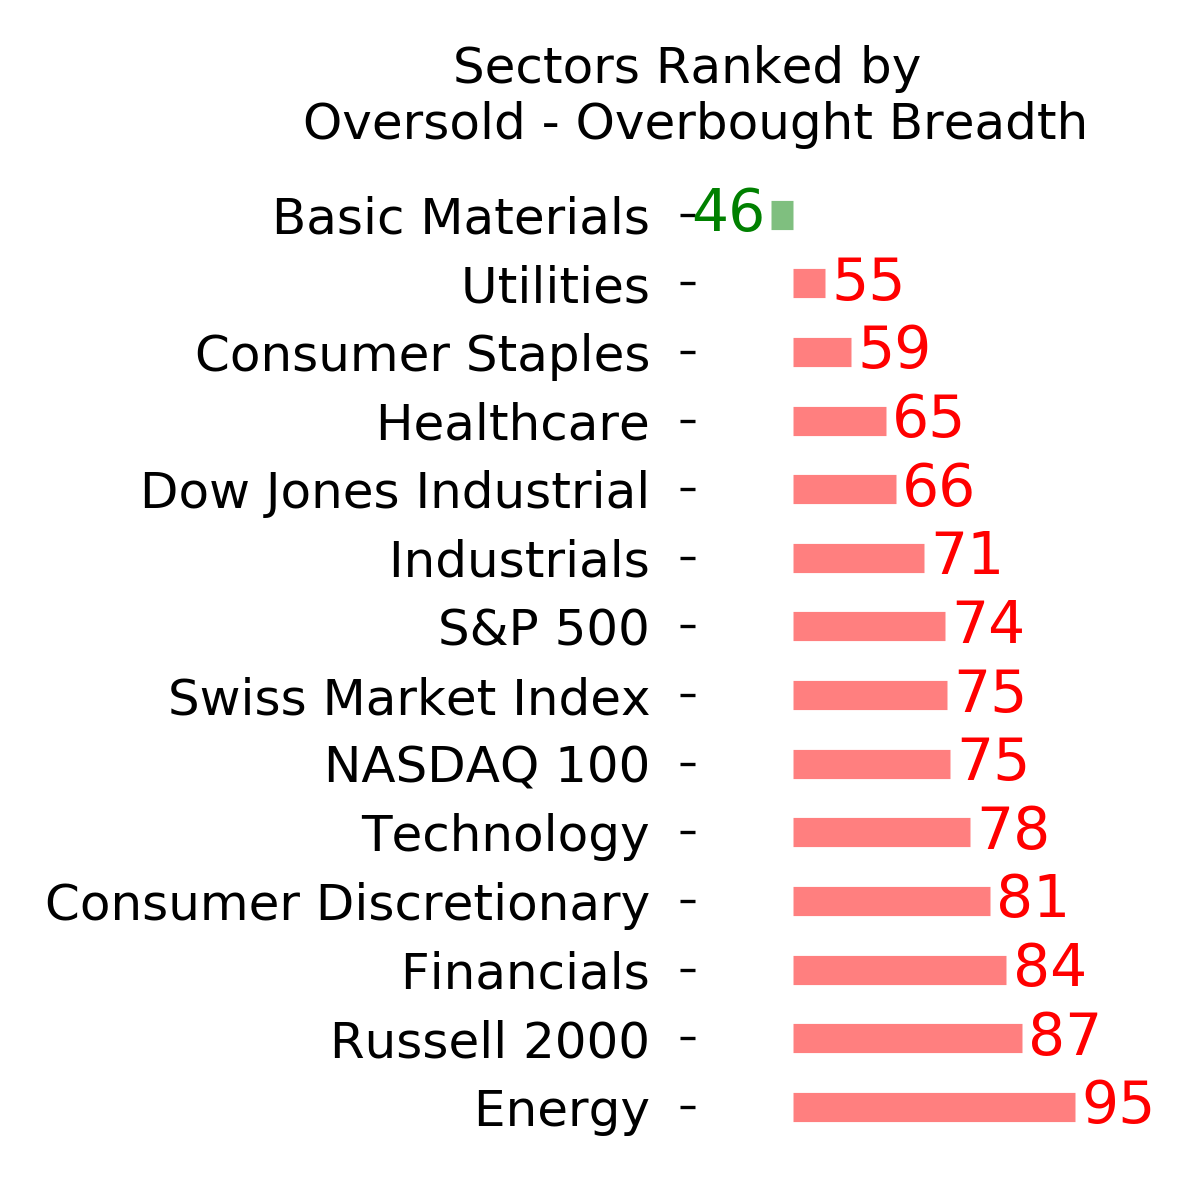
Ranks
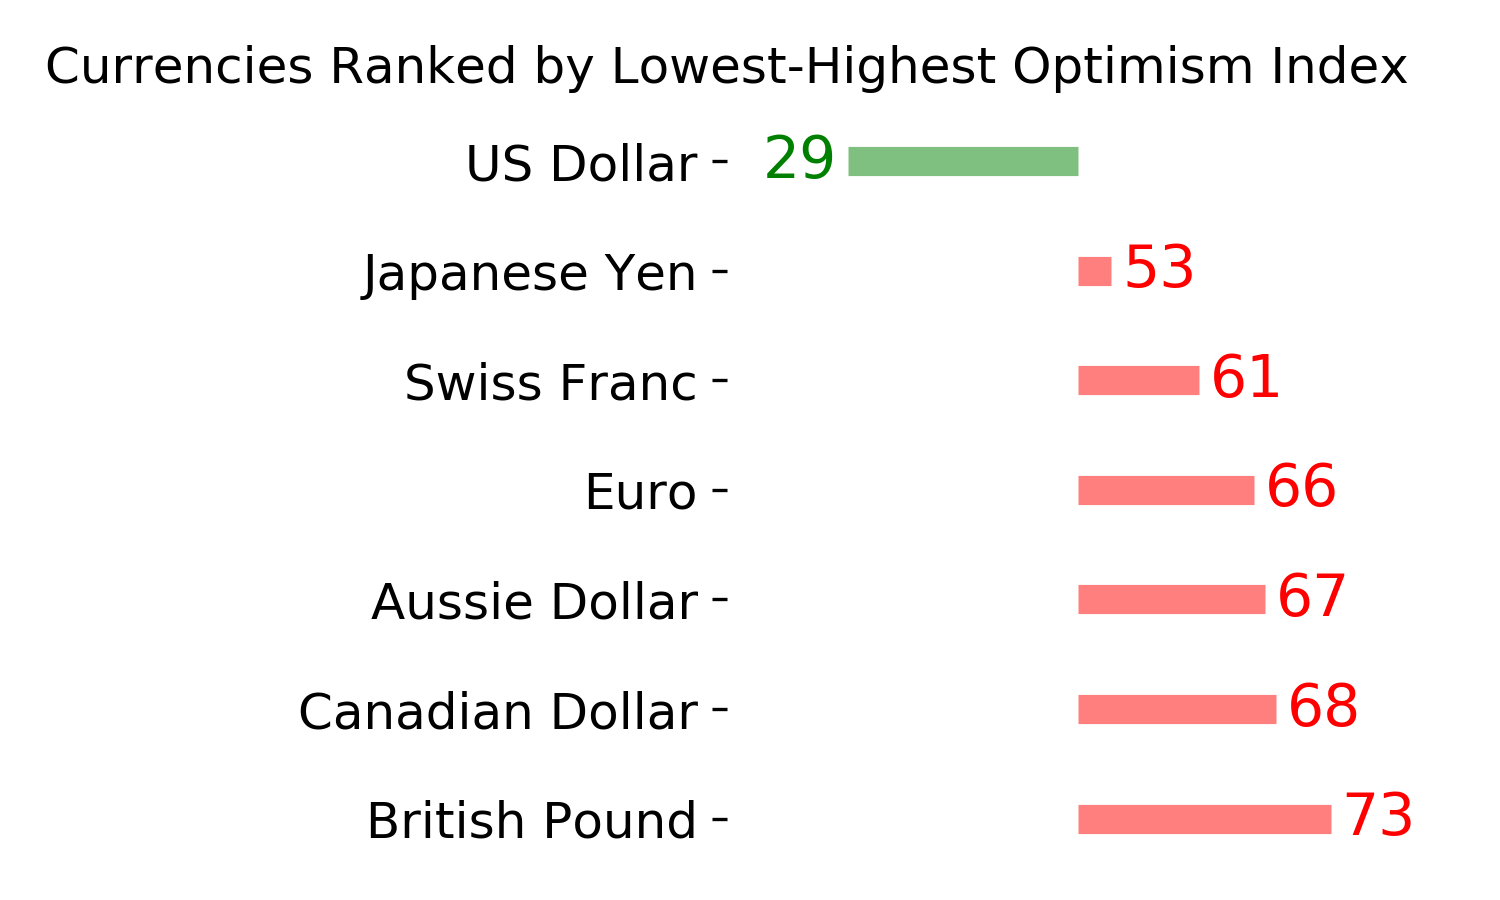
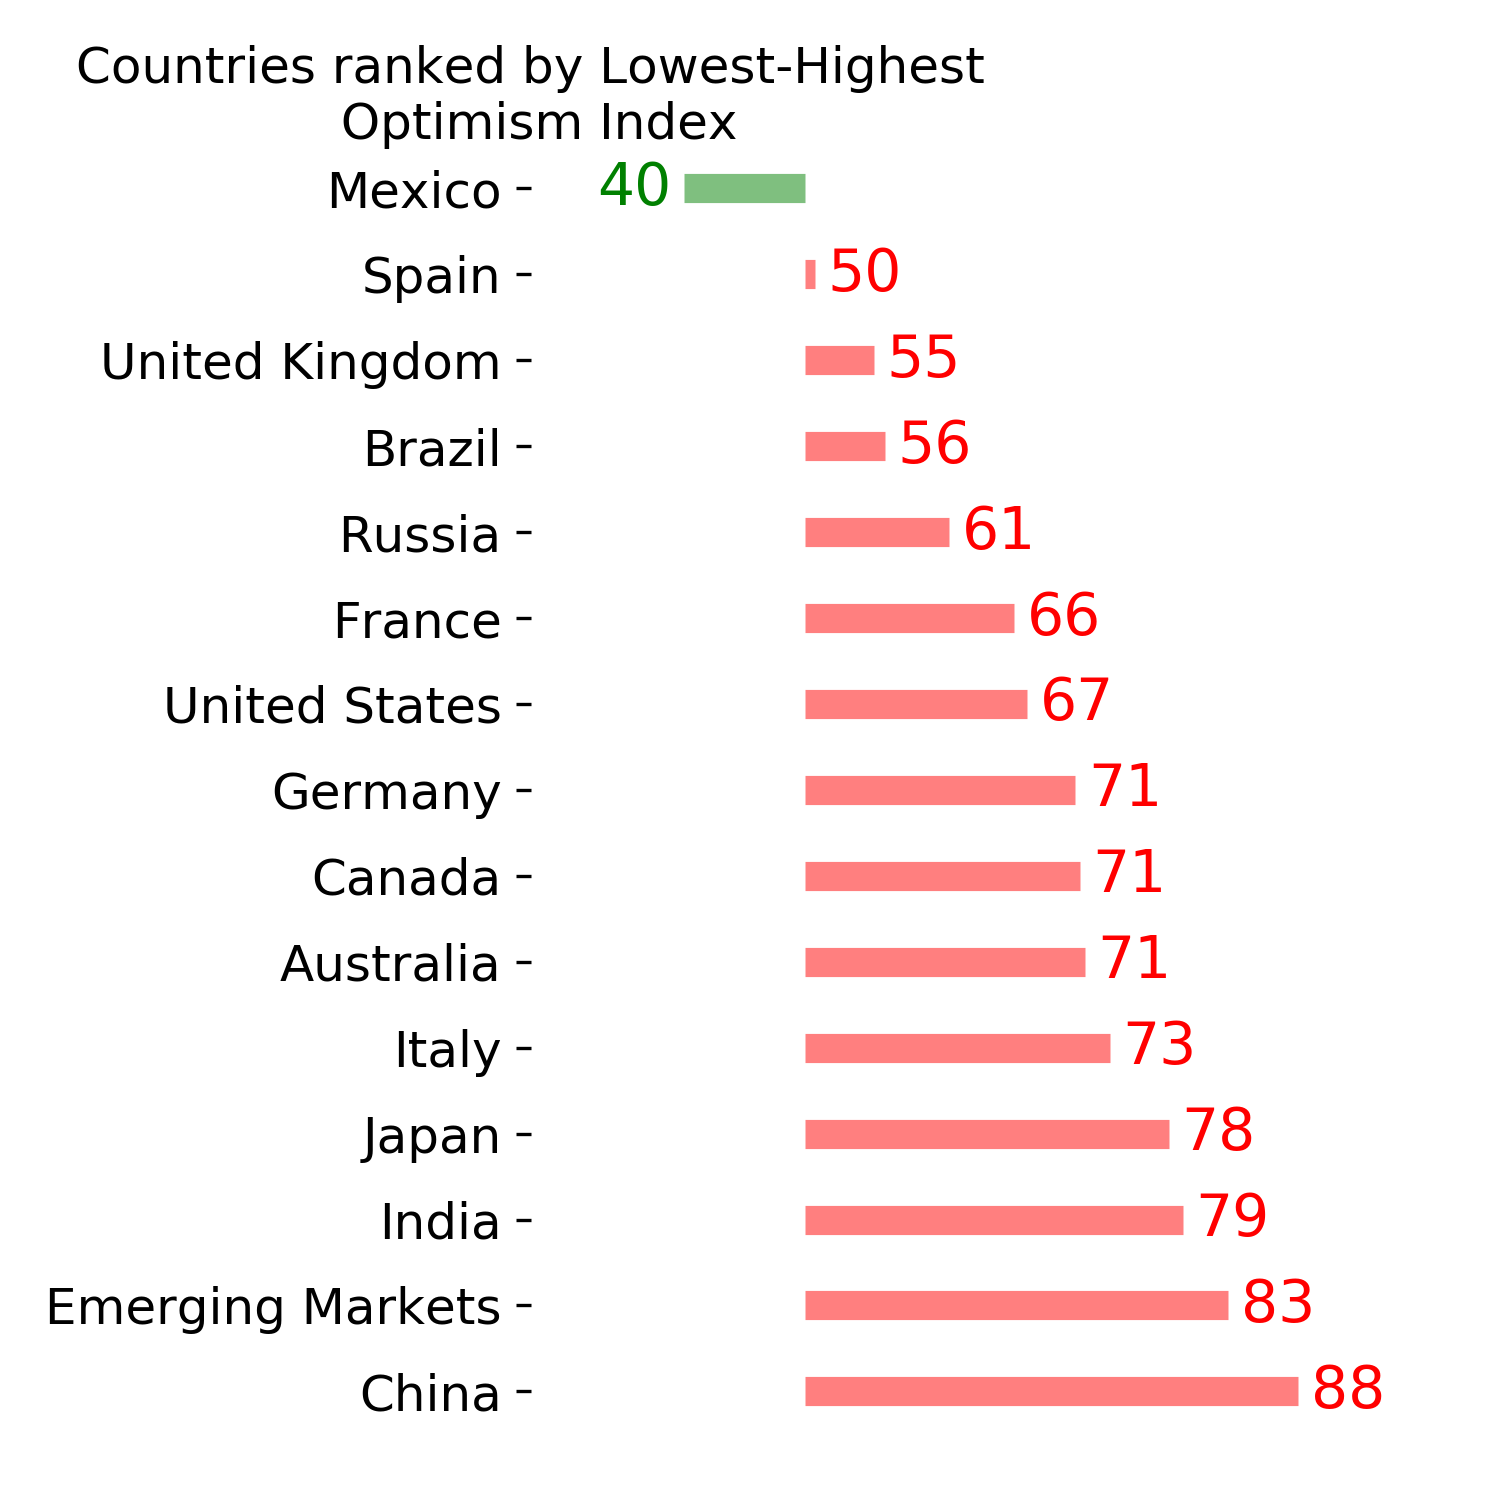
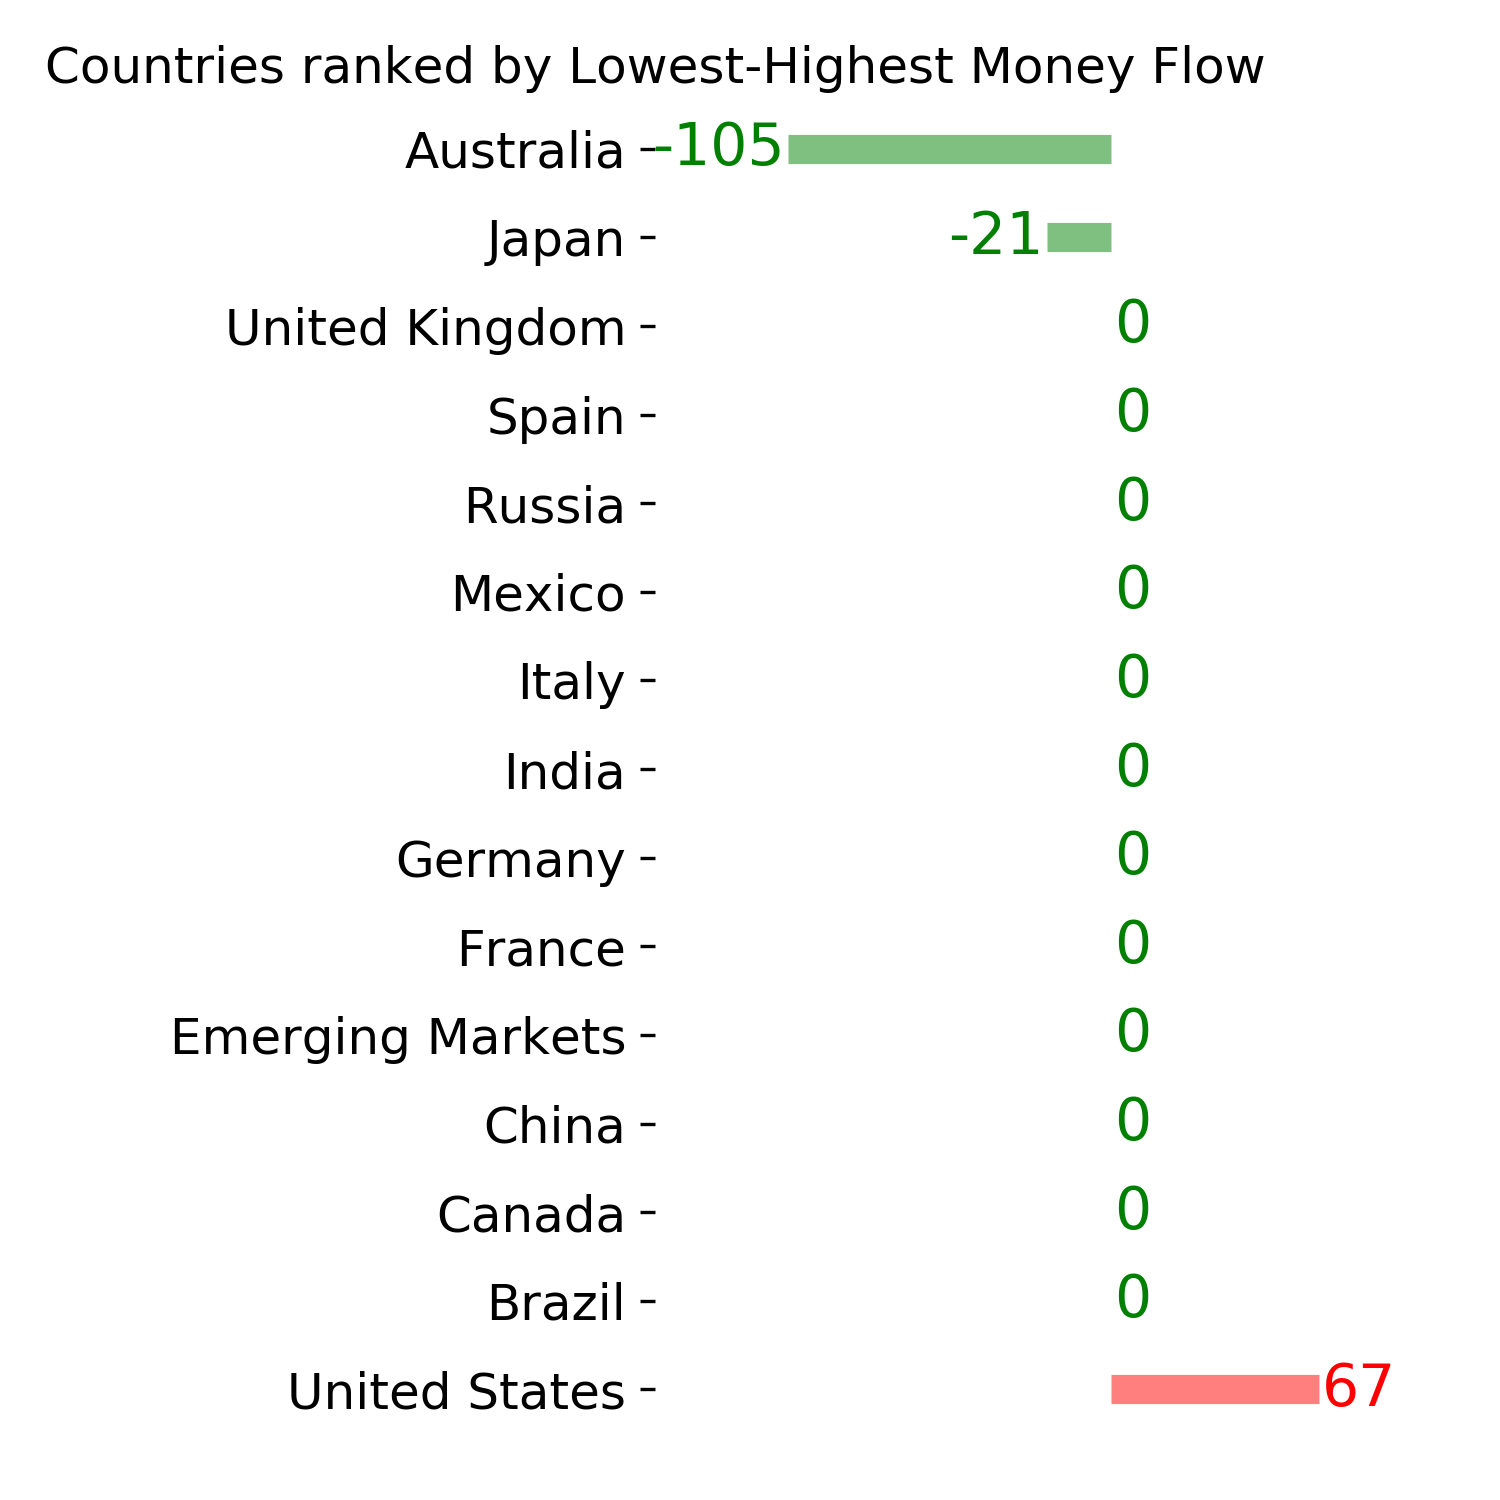
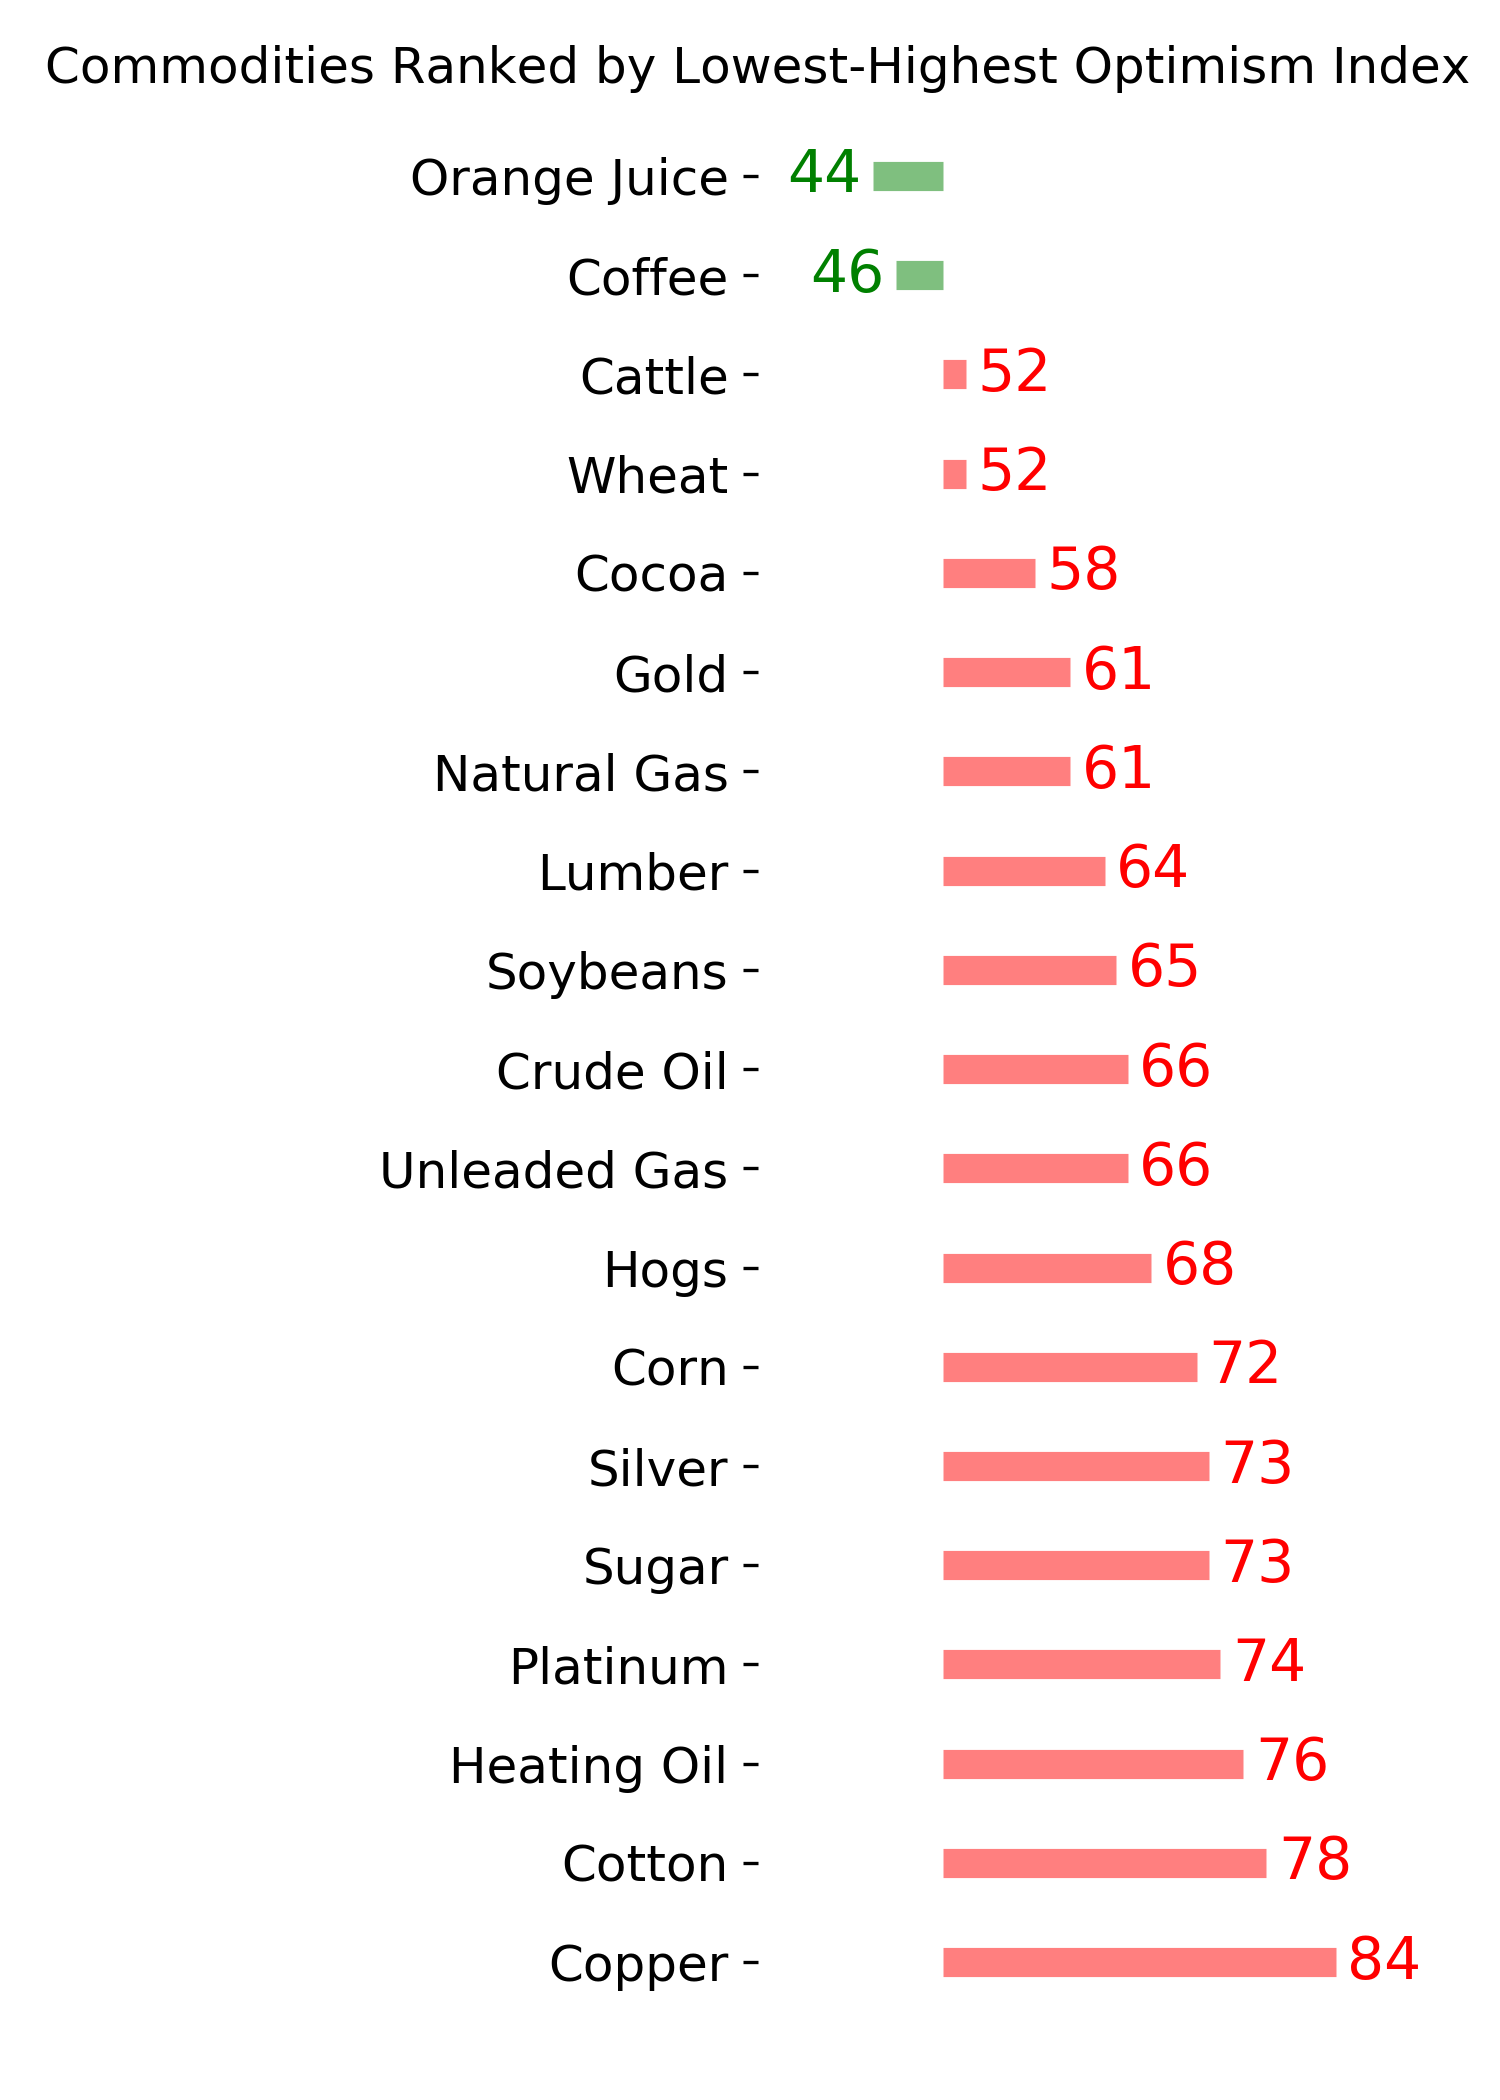
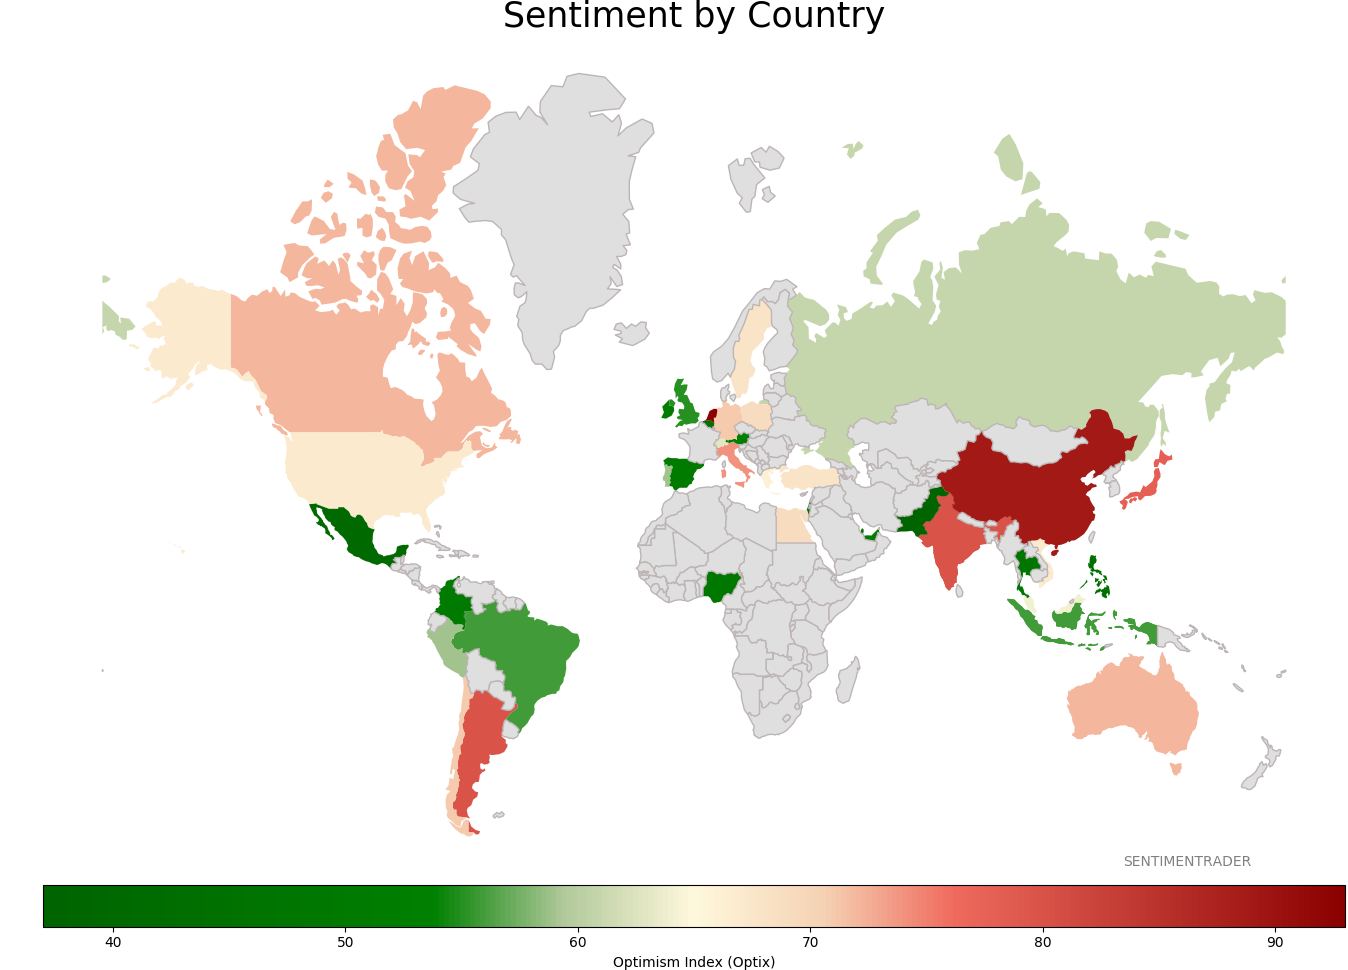
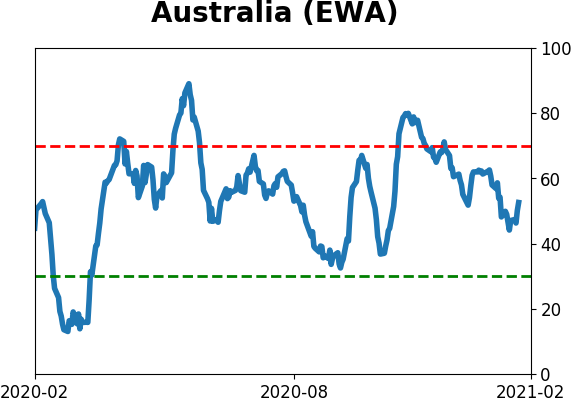
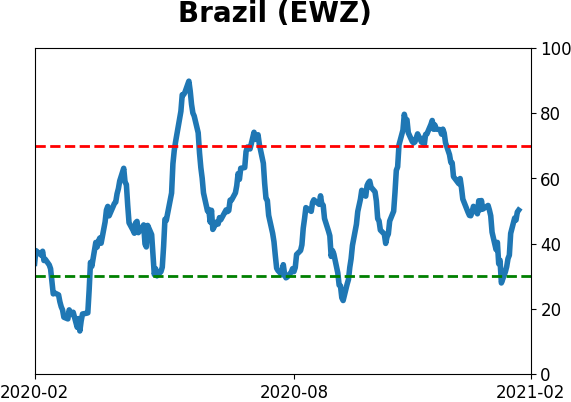
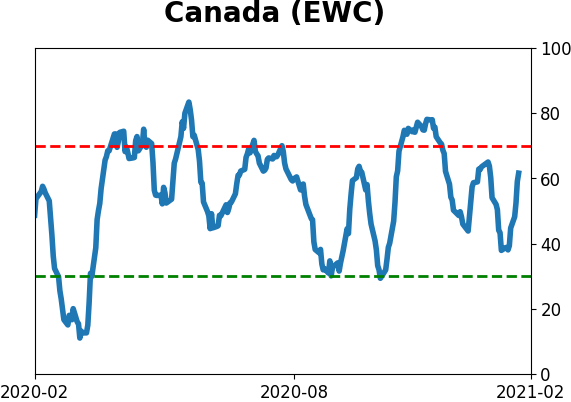
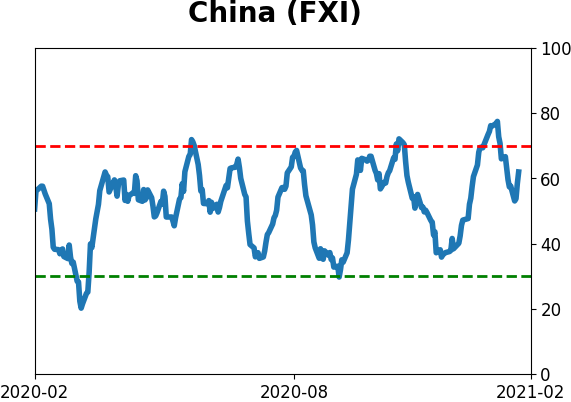
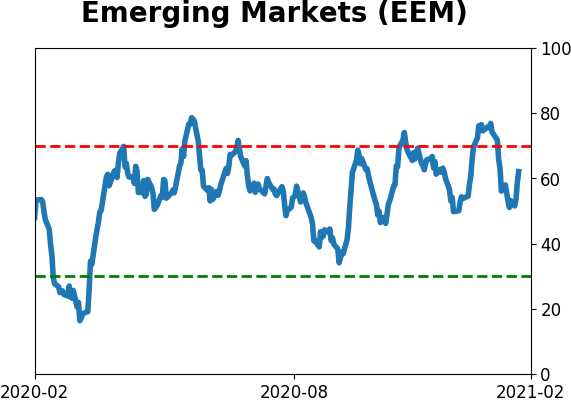
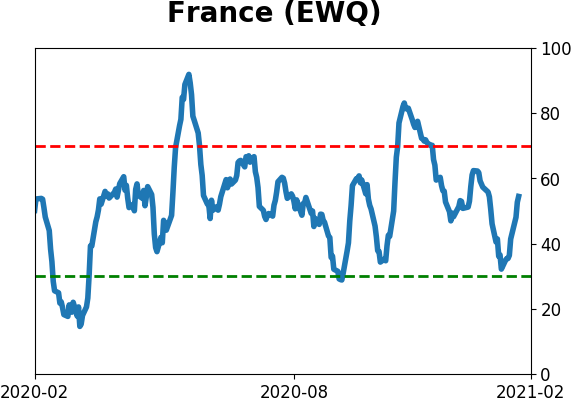
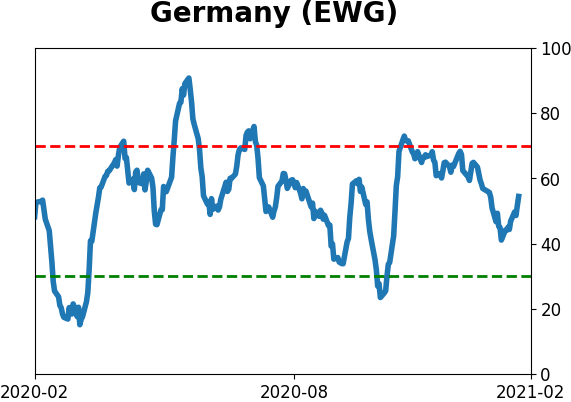
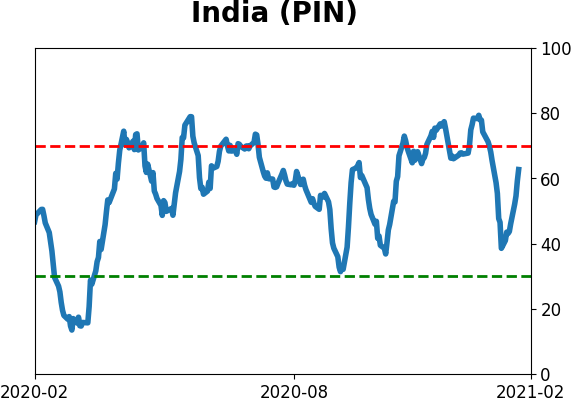
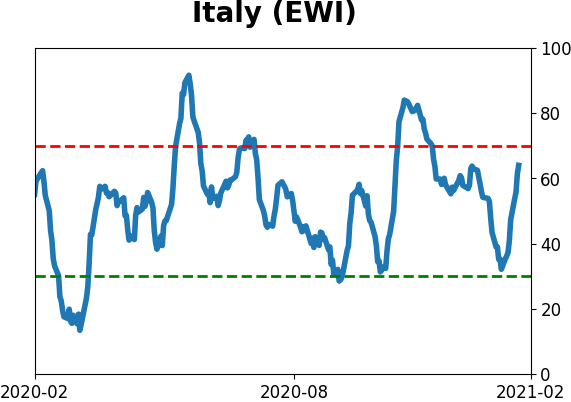
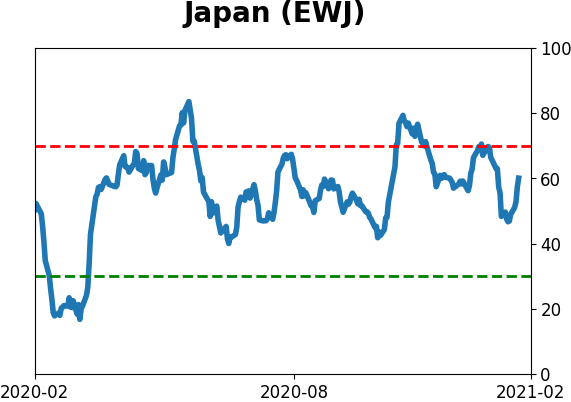
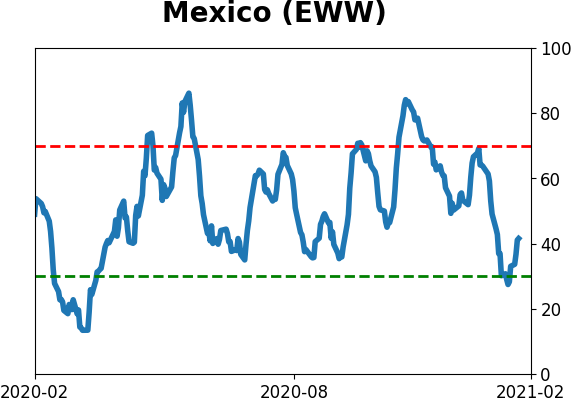
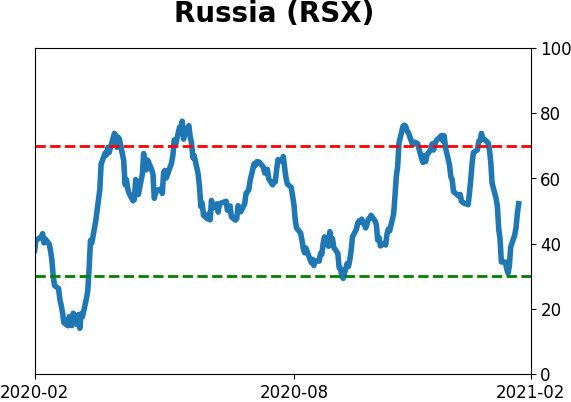
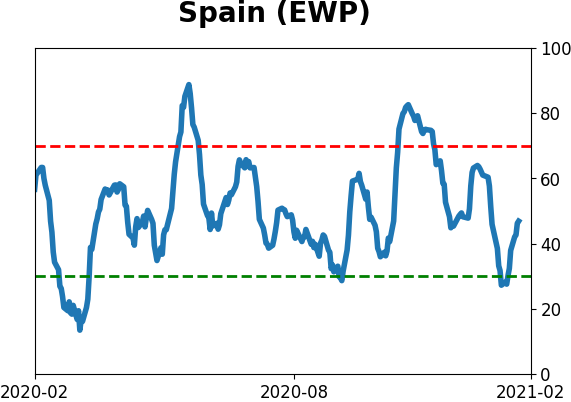
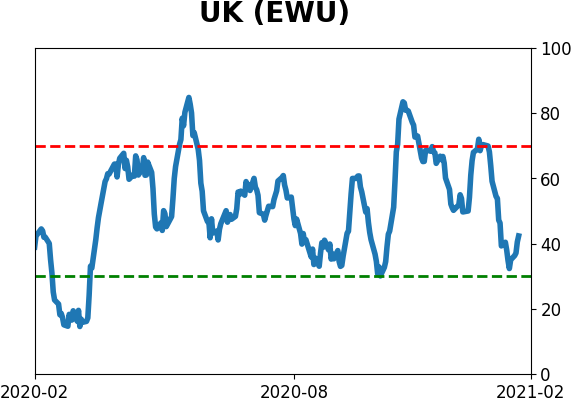
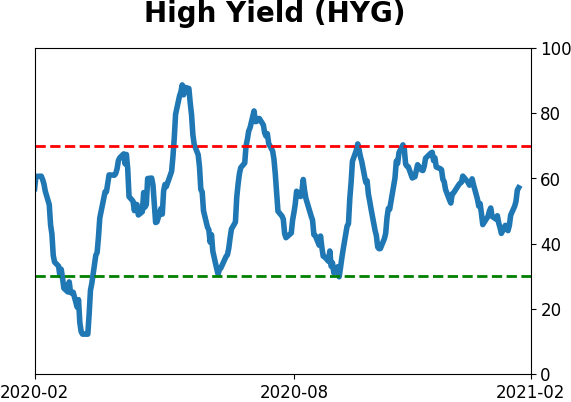
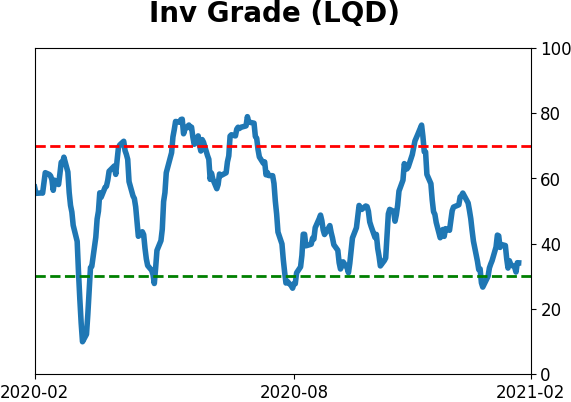
Sentiment Around The World
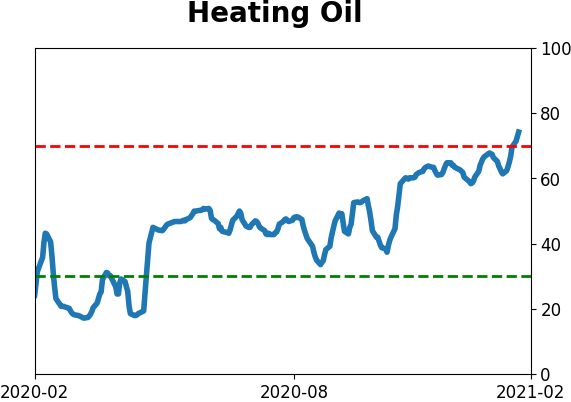
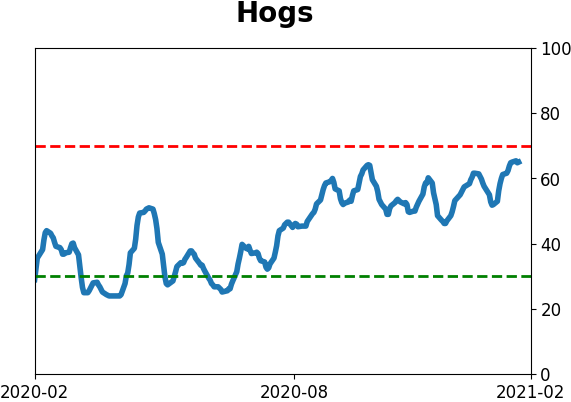
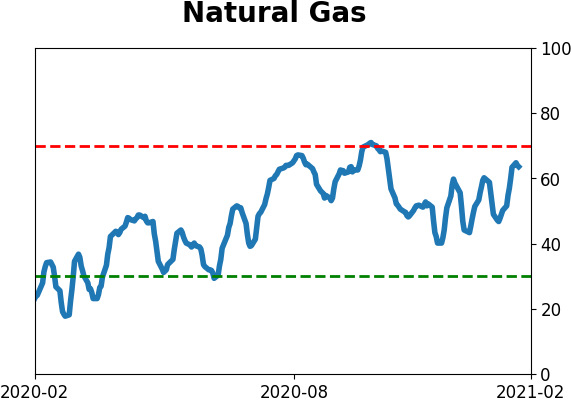
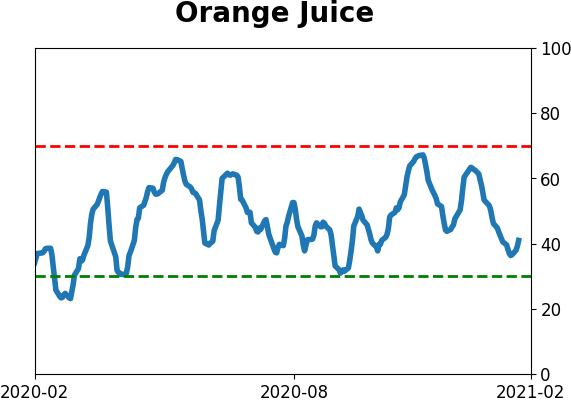
Optimism Index Thumbnails
|
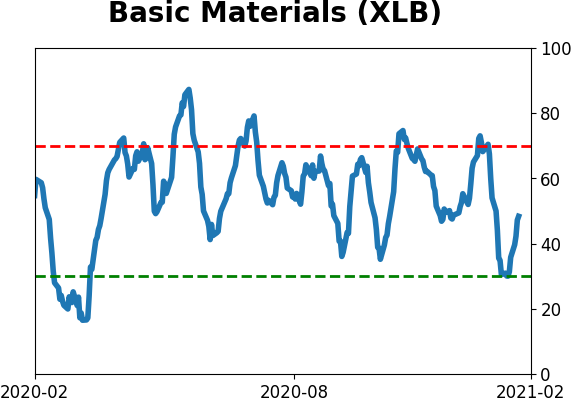
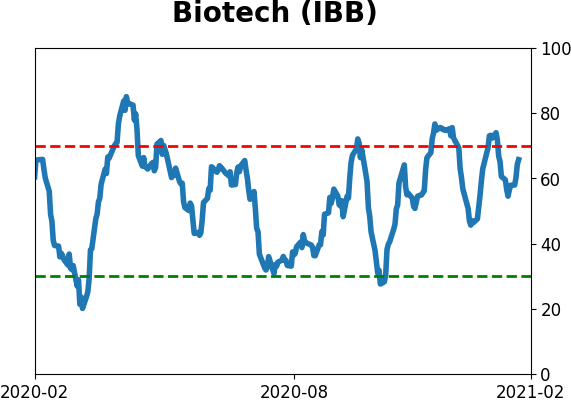
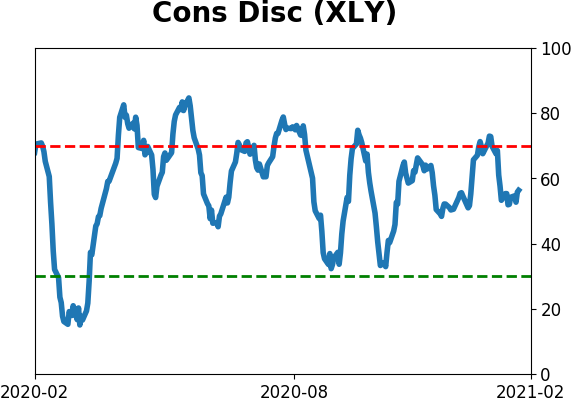
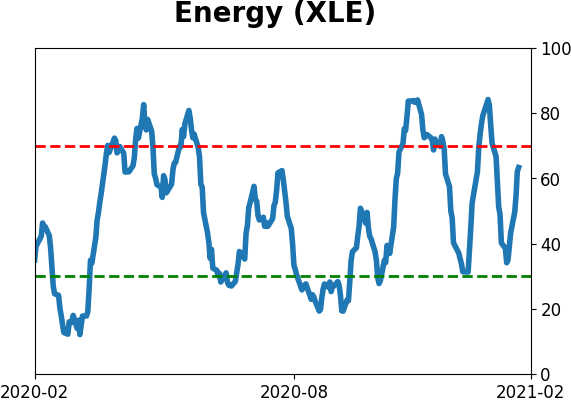
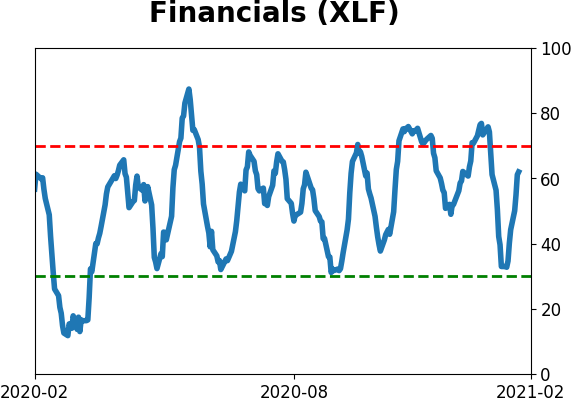
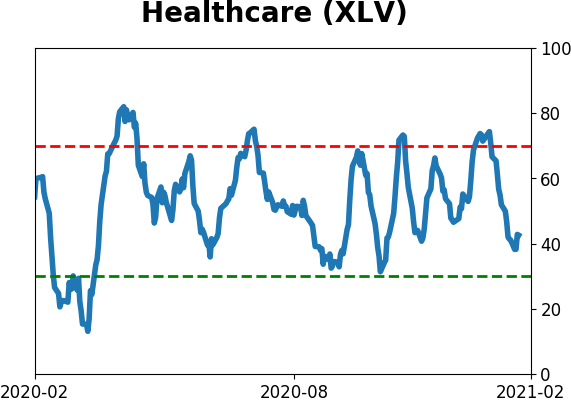
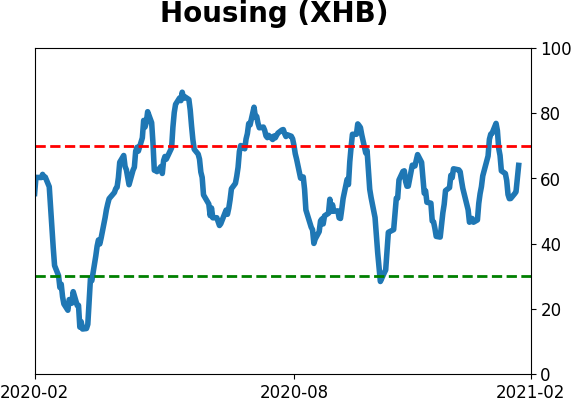
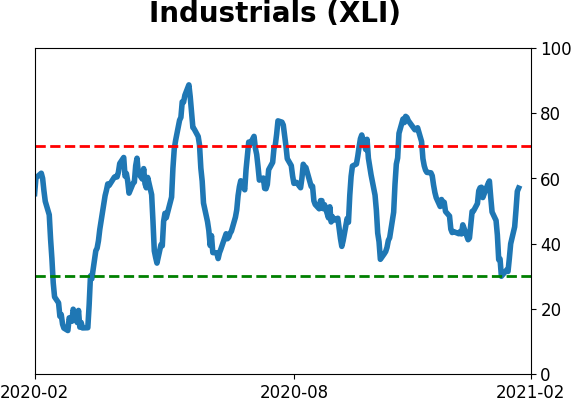
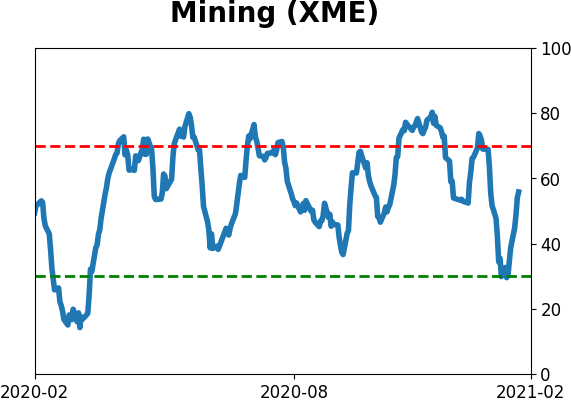
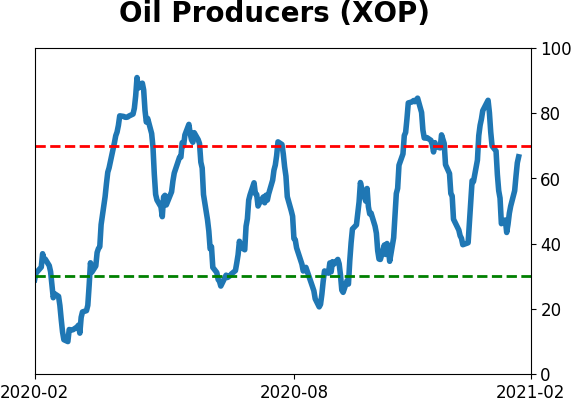
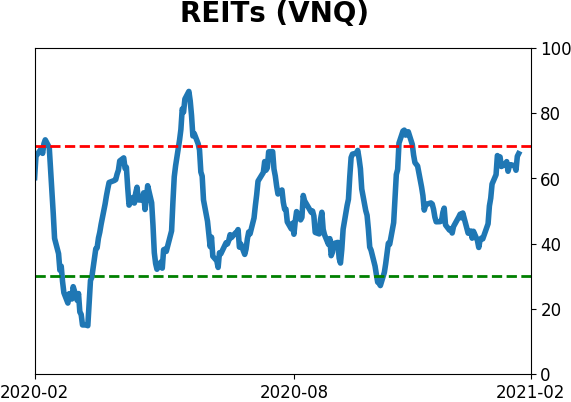
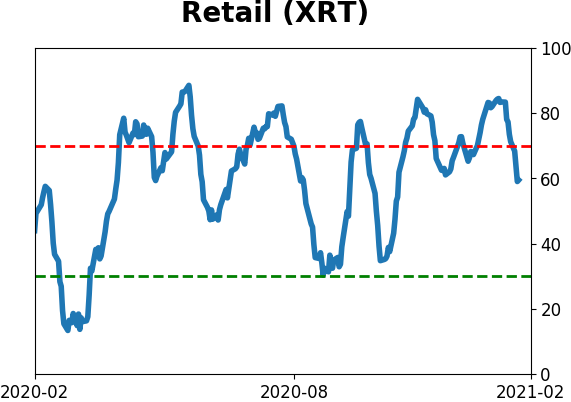
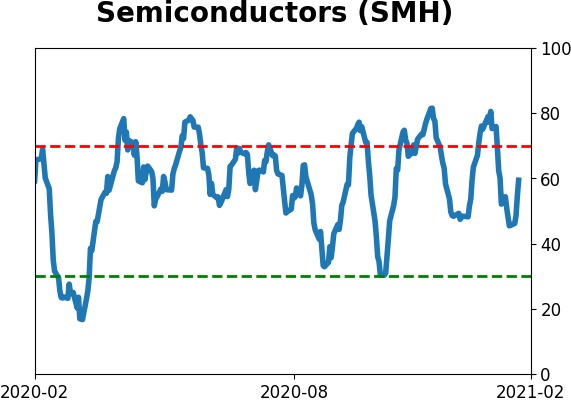
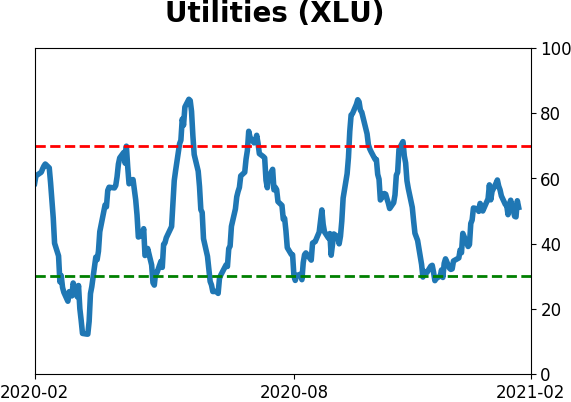
Sector ETF's - 10-Day Moving Average
|
|
|
Country ETF's - 10-Day Moving Average
|
|
|
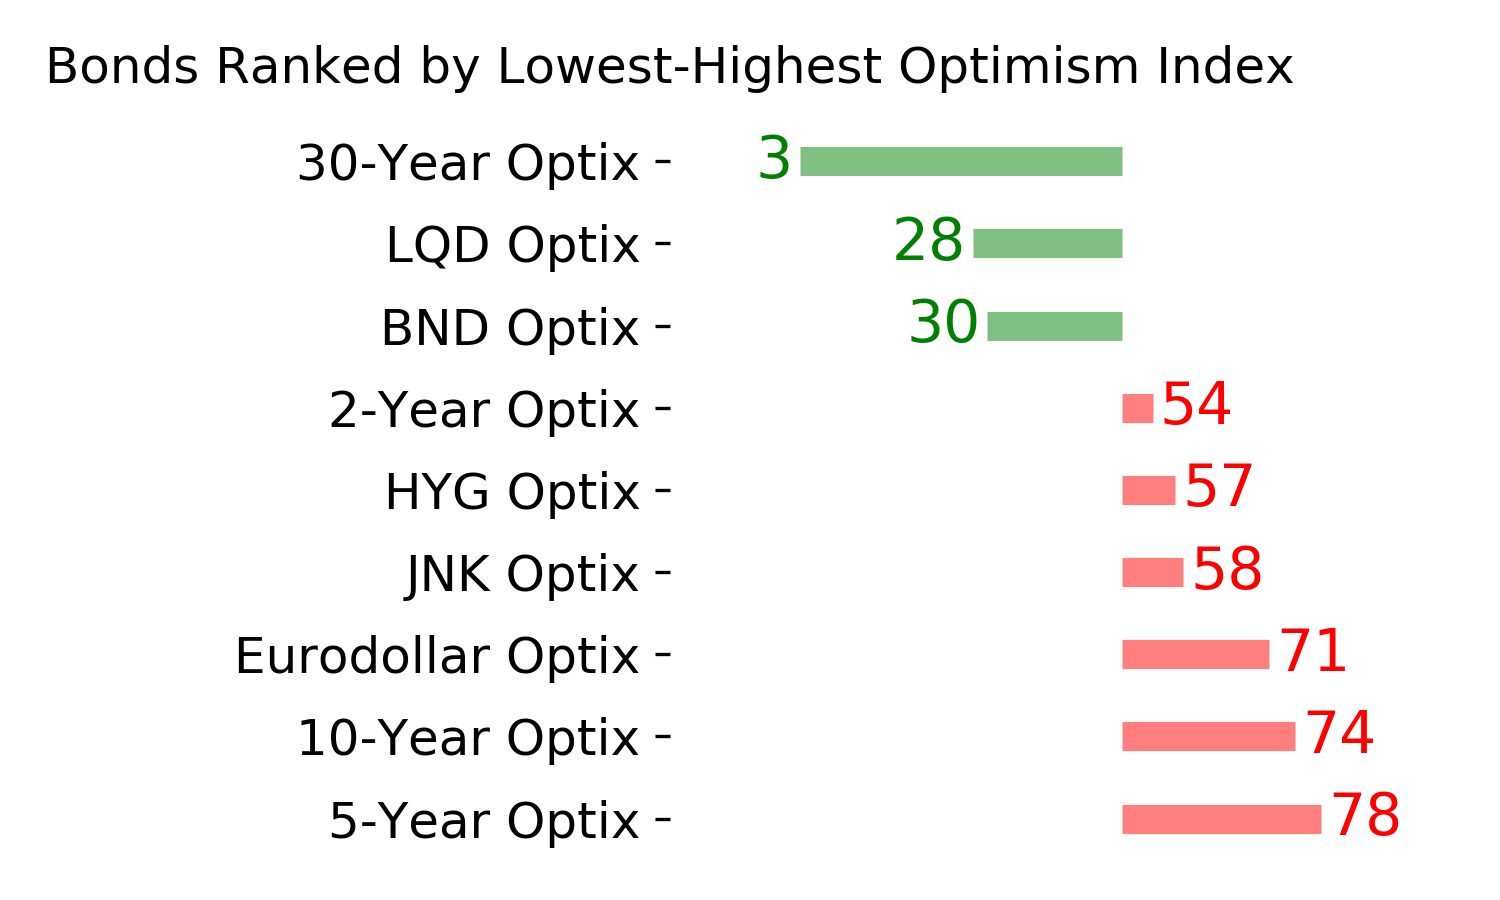
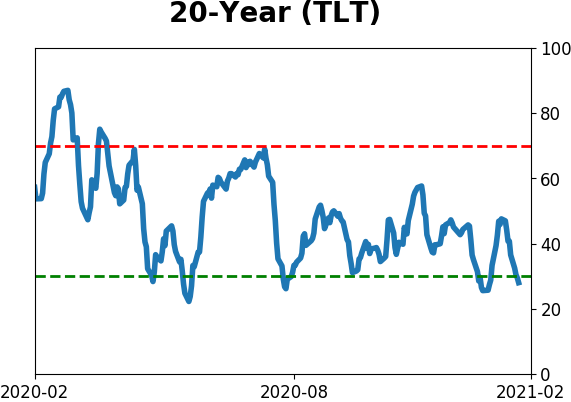
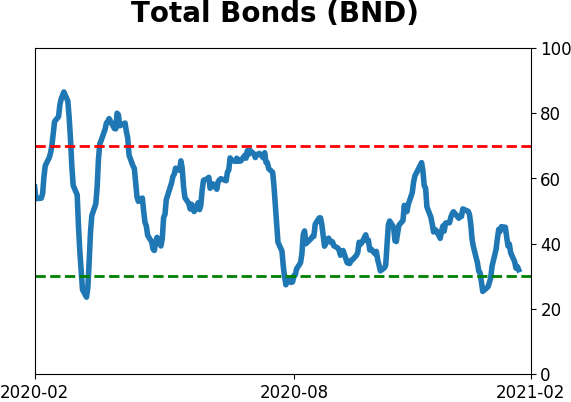
Bond ETF's - 10-Day Moving Average
|
|
|
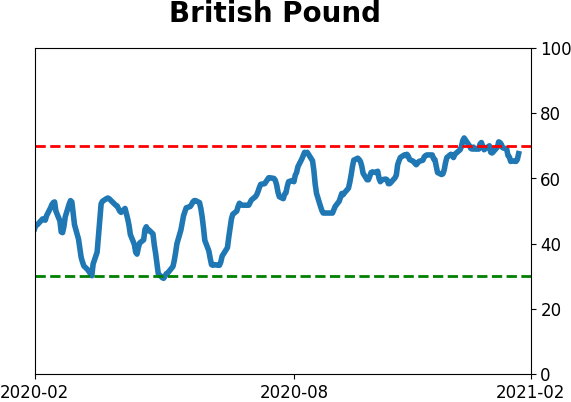
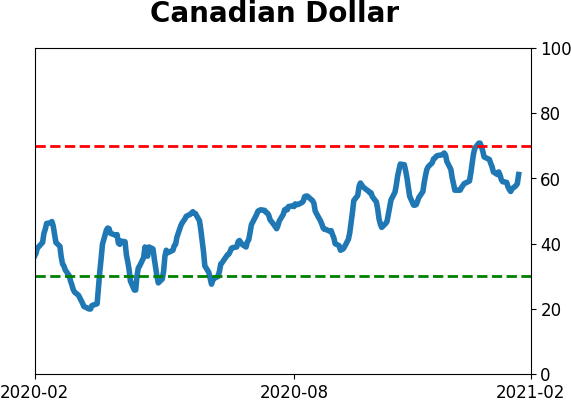
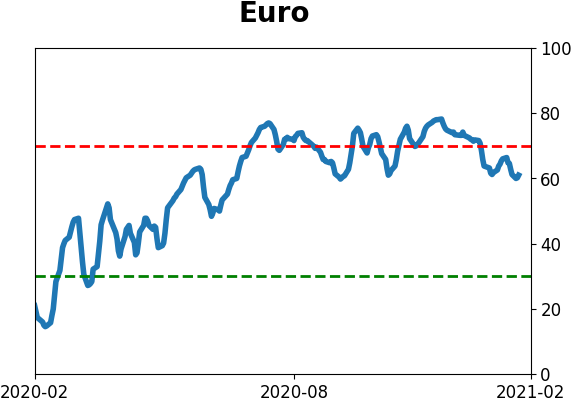
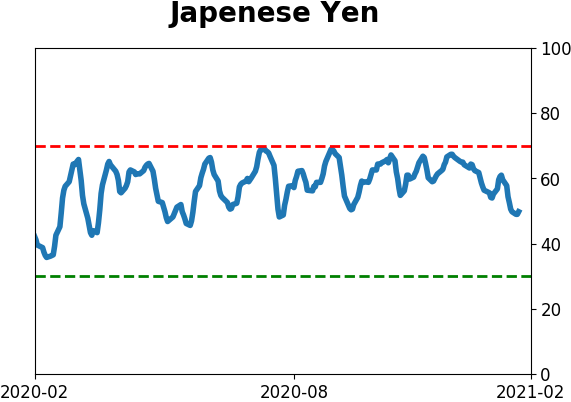
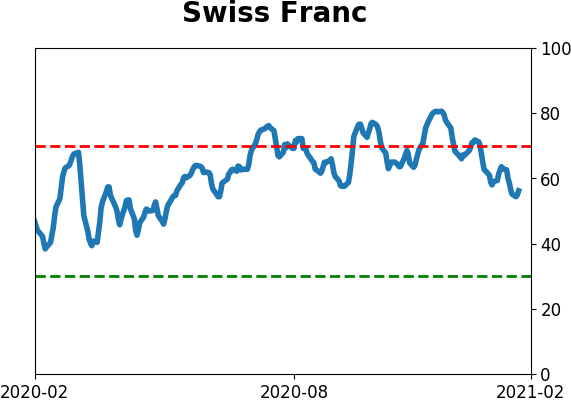
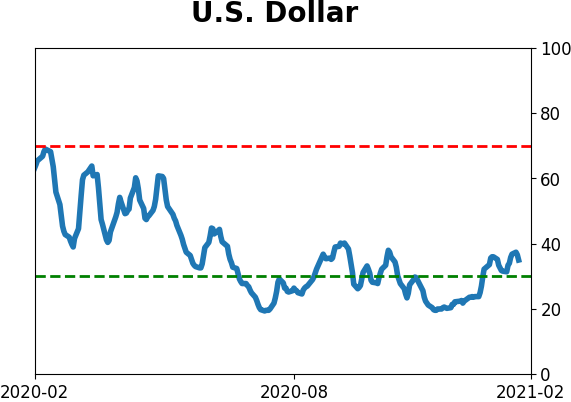
Currency ETF's - 5-Day Moving Average
|
|
|
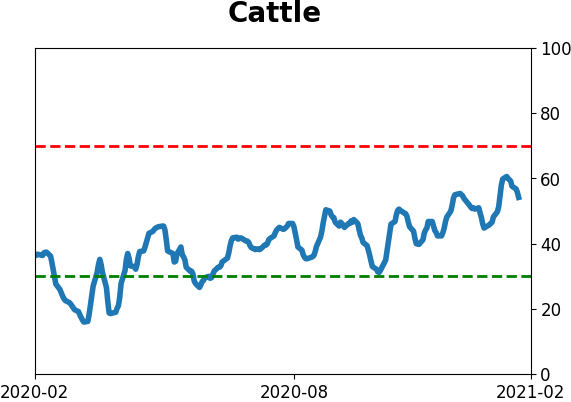
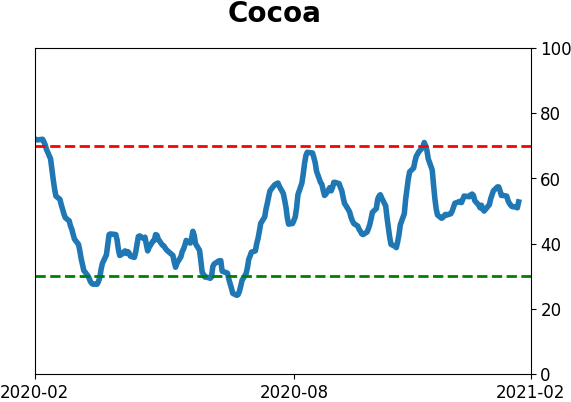
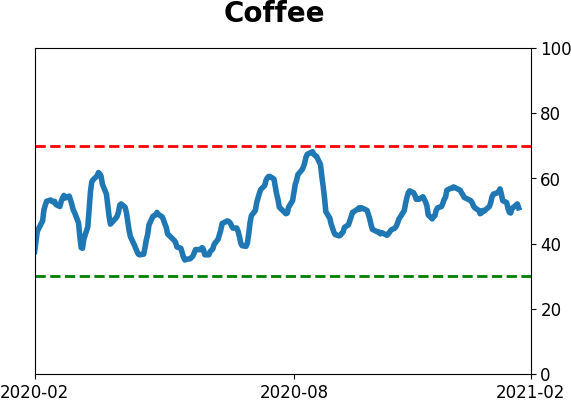
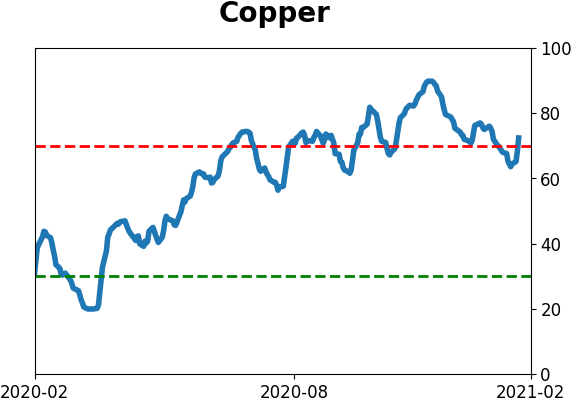
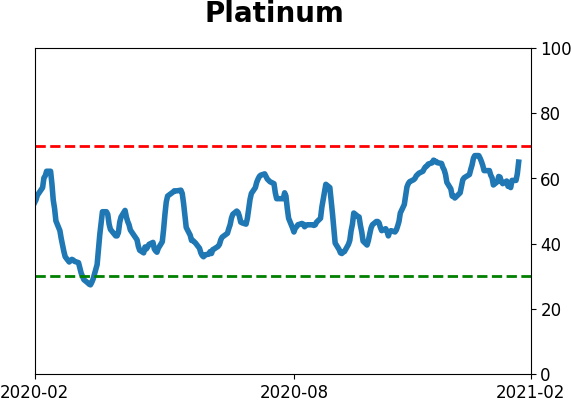
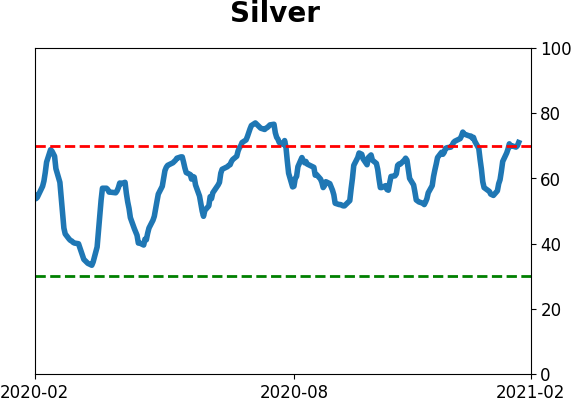
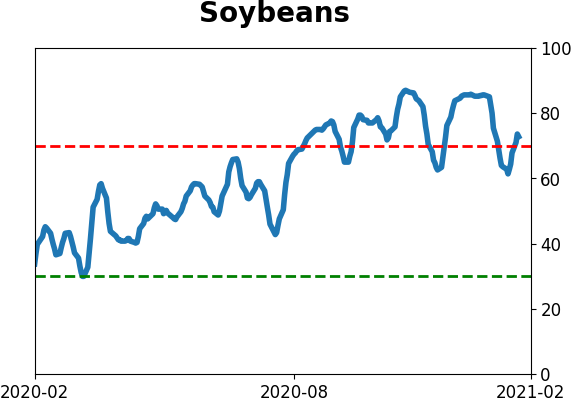
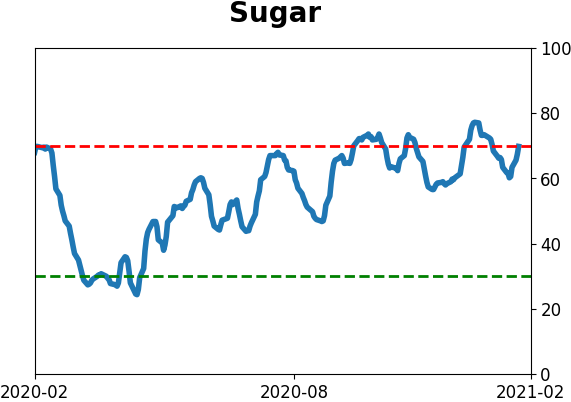
Commodity ETF's - 5-Day Moving Average
|
|