Headlines
|
|
Speculative volume skyrockets as smart money sells:
Speculative volume on the Nasdaq, especially in penny stocks, has reached a fever pitch. At the same time, there has been persistent selling during the last hour of trading, commonly believed to be "smart money" investors.
Bottom Line:
See the Outlook & Allocations page for more details on these summaries STOCKS: Weak sell
We're in an extremely speculative environment that is enough to become defensive, especially with recent cracks showing in what had been pristine breadth conditions. The spike in fear from last week has already mostly dissipated and likely not enough to offset the negatives over a medium-term time frame. BONDS: Weak buy
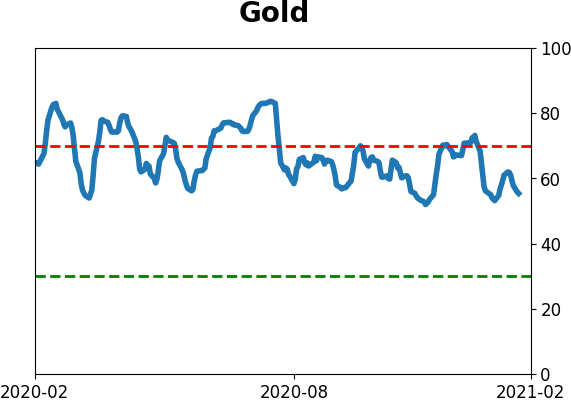
Various parts of the market have been hit in recent weeks, with mild oversold conditions. Treasuries have been hit hard and will likely start to register some extremes soon. GOLD: Weak buy
A dollar trying to rebound from a severe short position has weighed on gold and miners. The types of signals they've given in recent weeks, within the context of their recent surge, have usually resulted in higher prices over a medium- to long-term time frame.
|
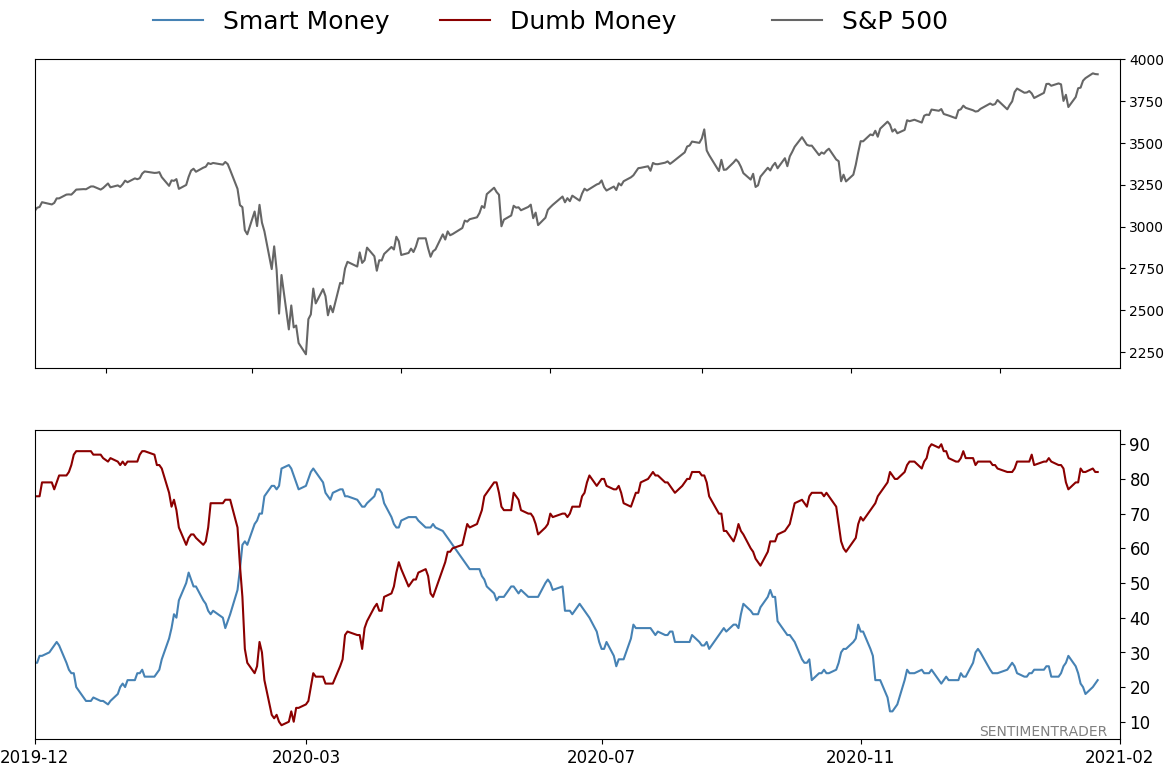
Smart / Dumb Money Confidence
|
Smart Money Confidence: 22%
Dumb Money Confidence: 82%
|
|
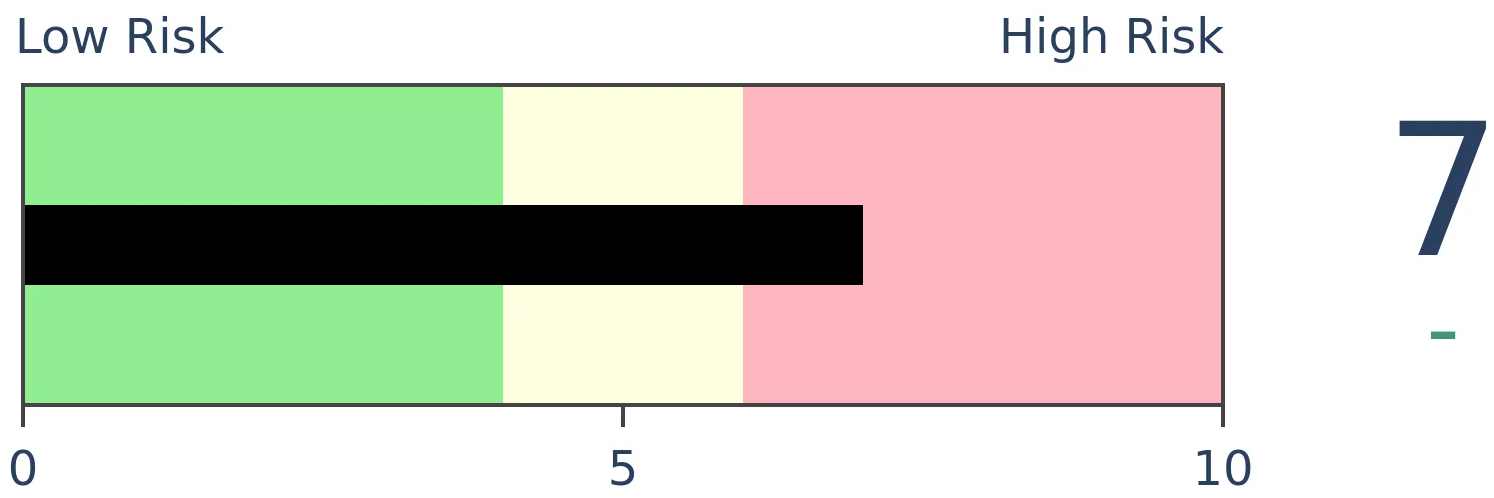
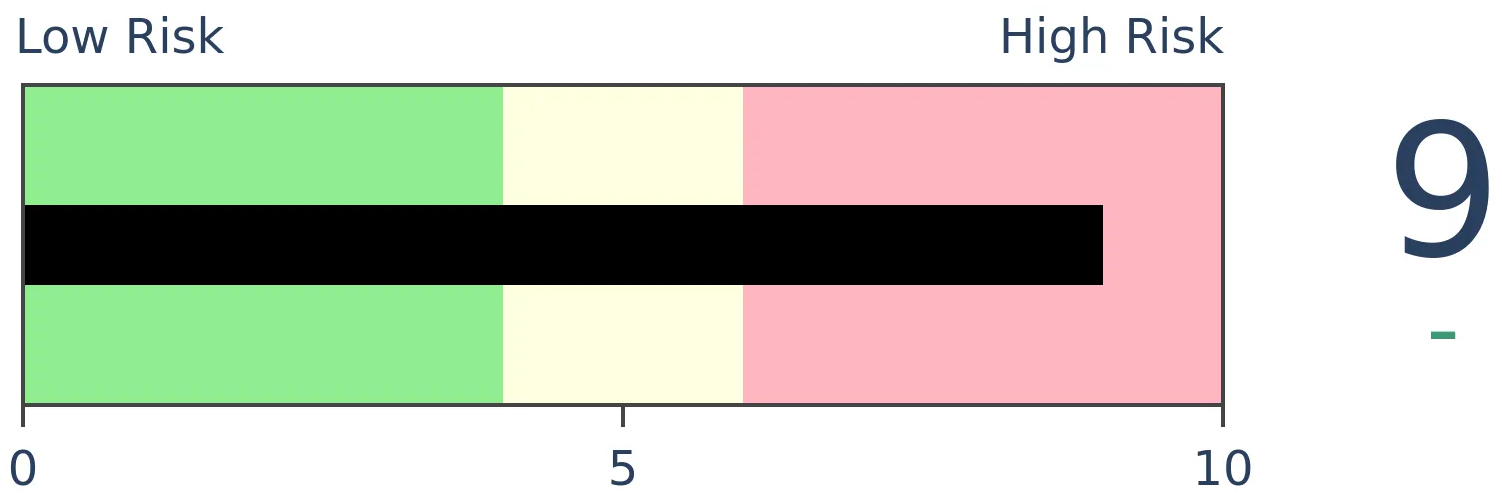
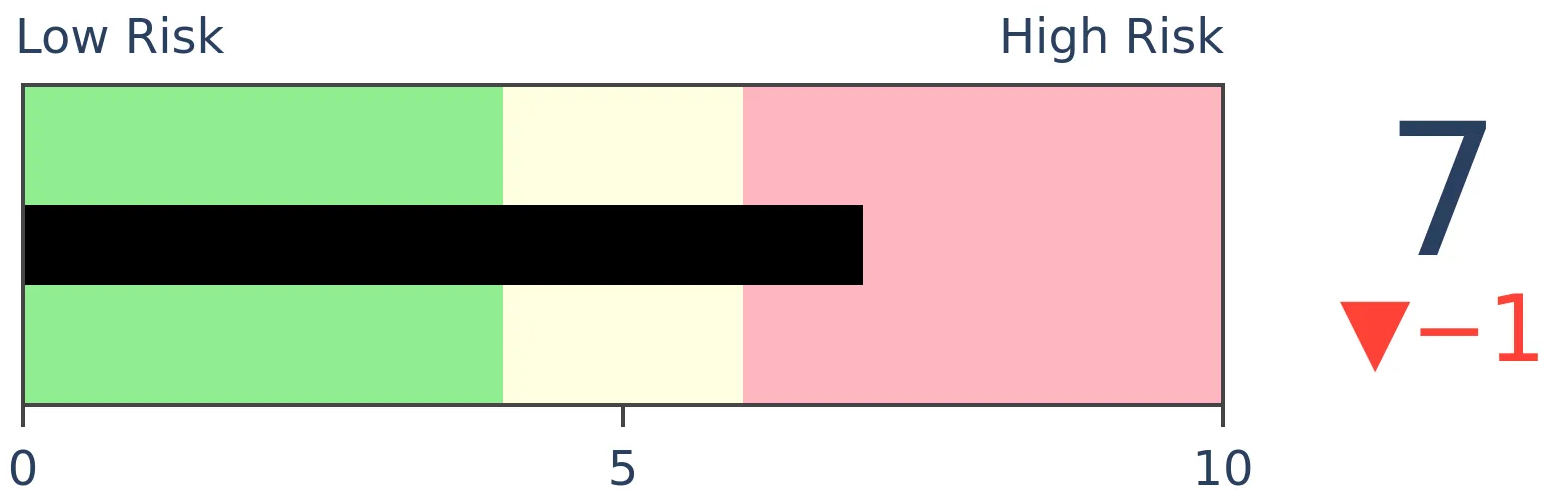
Risk Levels
Stocks Short-Term
|
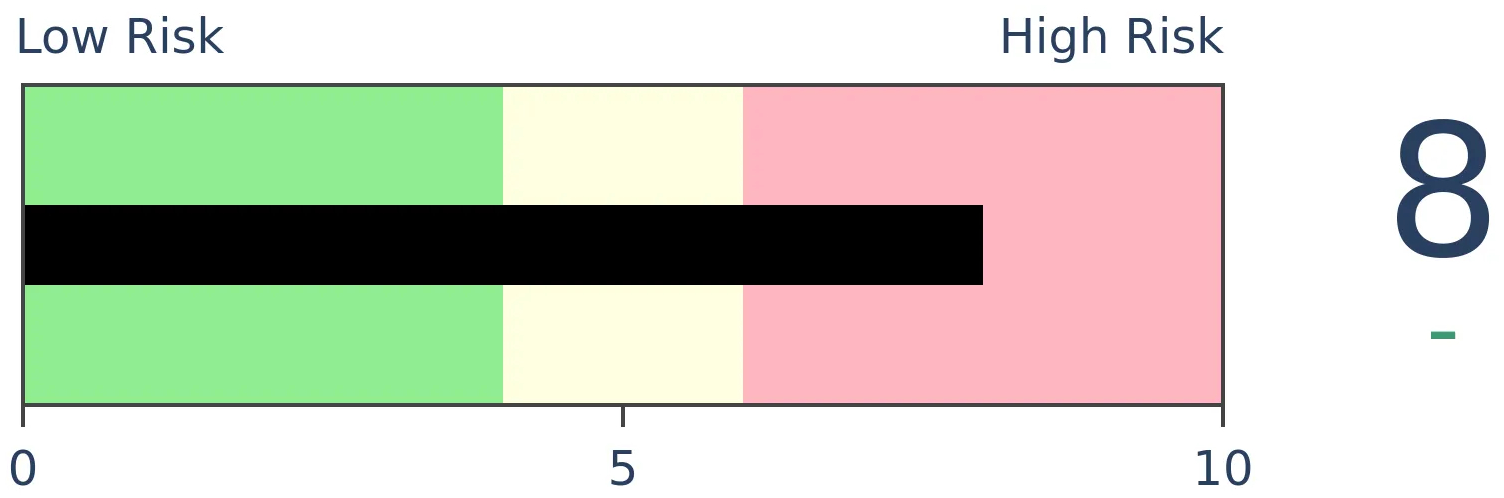
Stocks Medium-Term
|
|
Bonds
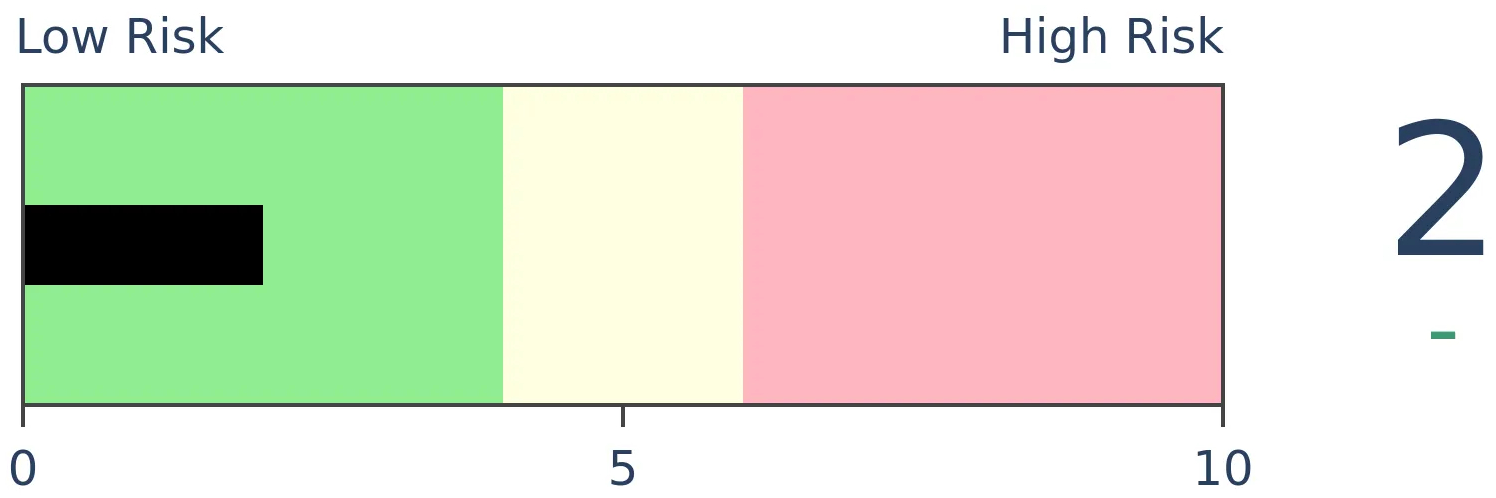
|
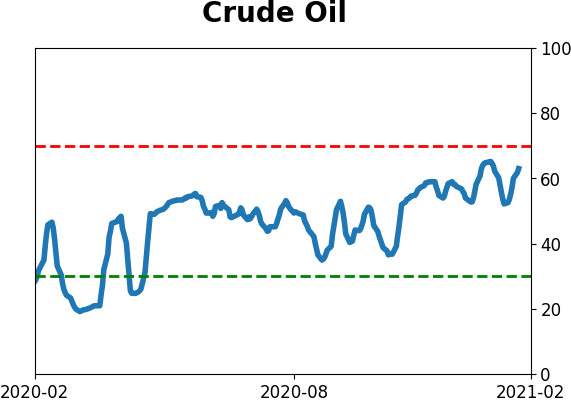
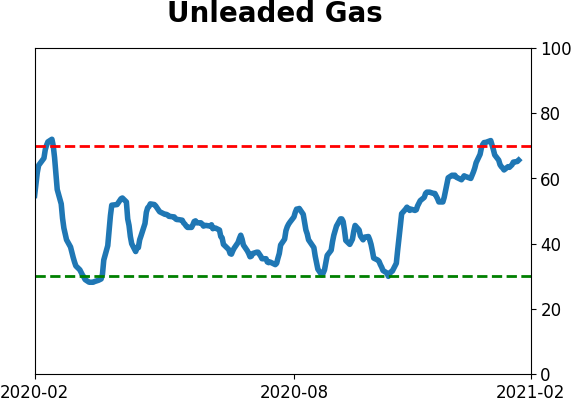
Crude Oil
|
|
Gold
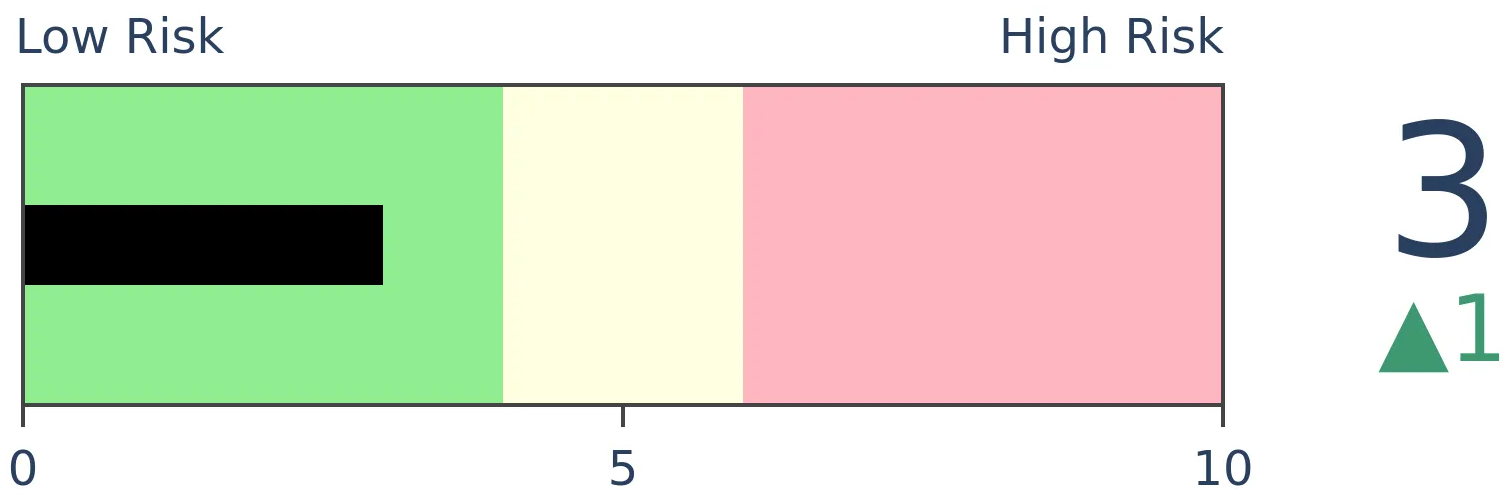
|
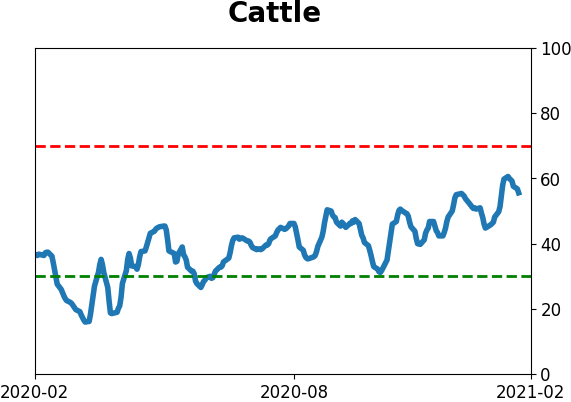
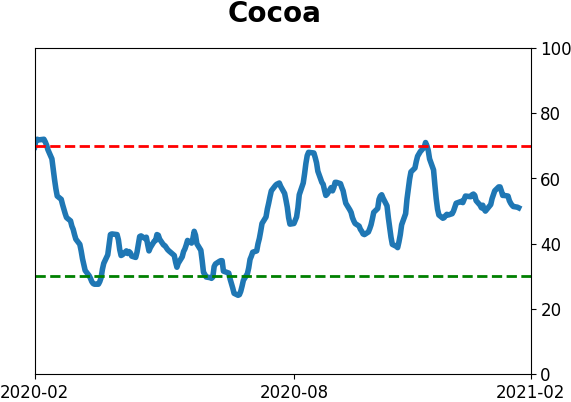
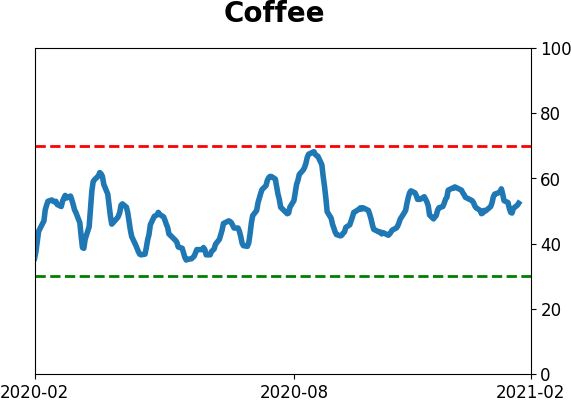
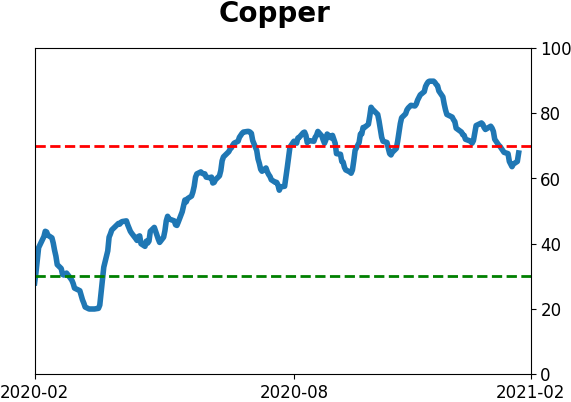
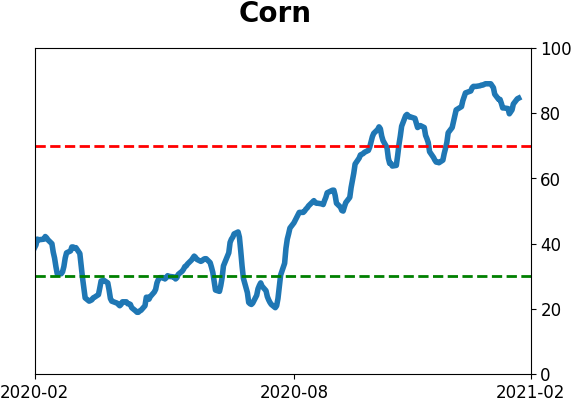
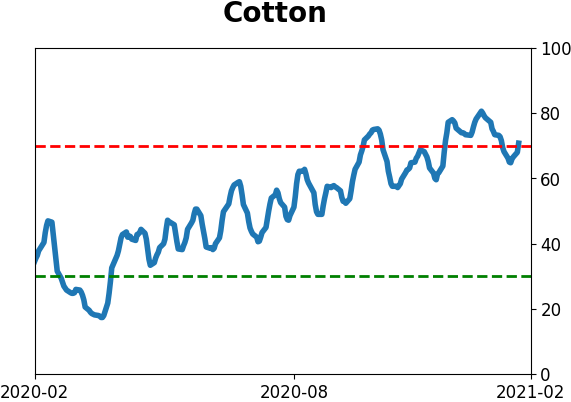
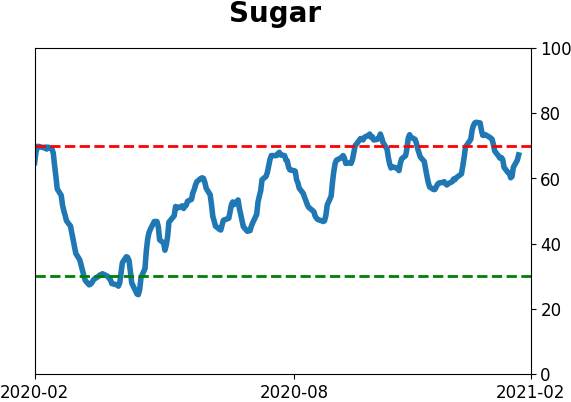
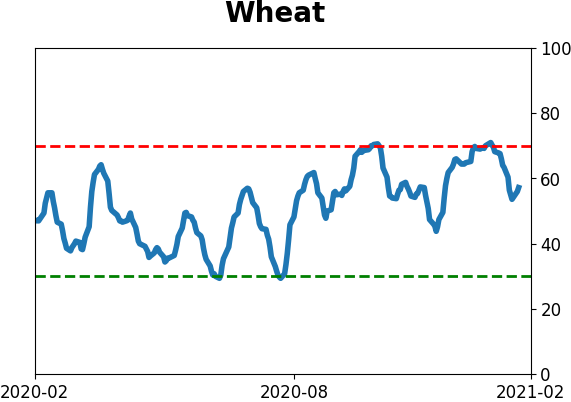
Agriculture
|
|
Research
BOTTOM LINE
Speculative volume on the Nasdaq, especially in penny stocks, has reached a fever pitch. At the same time, there has been persistent selling during the last hour of trading, commonly believed to be "smart money" investors.
FORECAST / TIMEFRAME
SPY -- Down, Medium-Term
|
Last month, there was a remarkable jump in the most speculative corners of the market, including leveraged vehicles like options and margin trading, and lottery ticket shares in the form of penny stocks.
The roaming horde of speculators found that niche in December, with more than 1 trillion shares traded. It picked up even more in January.
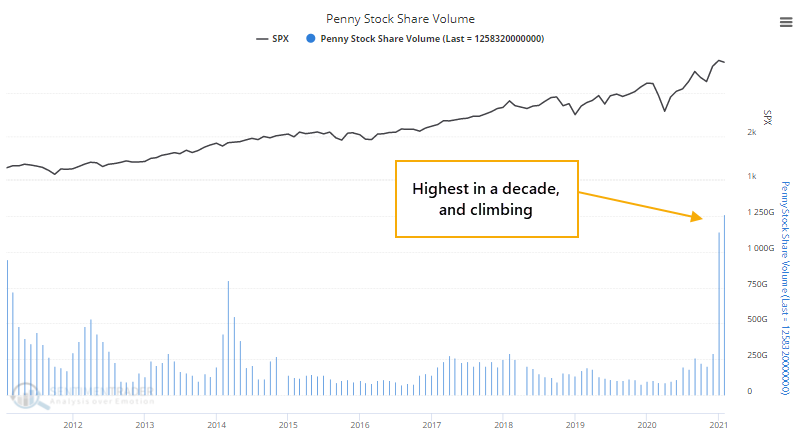
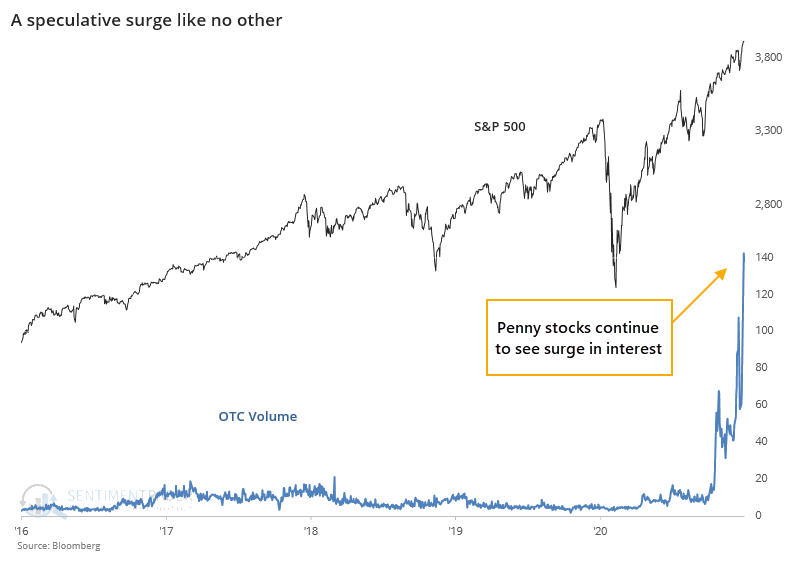
A Bloomberg calculation of over-the-counter activity has continued to rocket higher in recent weeks. We haven't seen anything anywhere near this type of speculative activity in the past 5 years, at least.
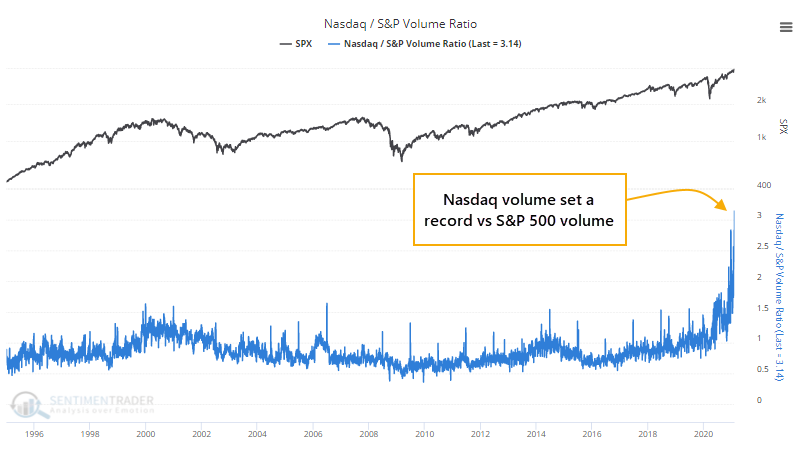
All of this activity has pushed the ratio of Nasdaq volume to S&P 500 volume to a record high. As a proxy for trading activity among speculators versus investors, once again we've never seen anything like the past month.
At the same time, the smart money is selling. At least, if we can consider activity during the last hour of trading to be the work of more informed investors, the theory behind the Smart Money Index. As calculated by Bloomberg, this measure is hanging near its lows despite indexes being at new highs.
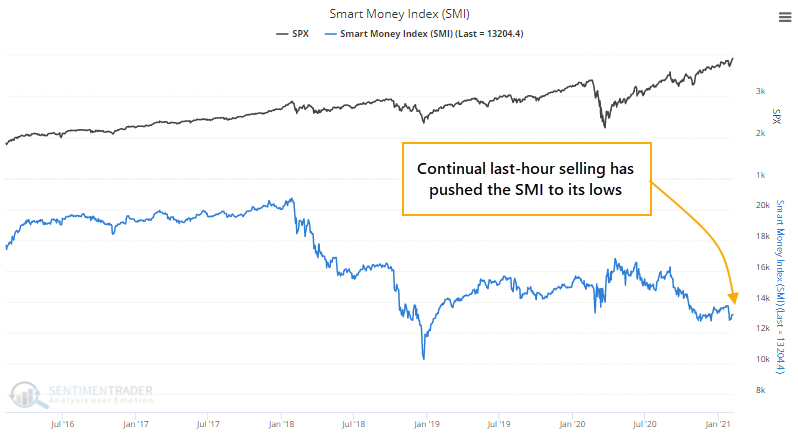
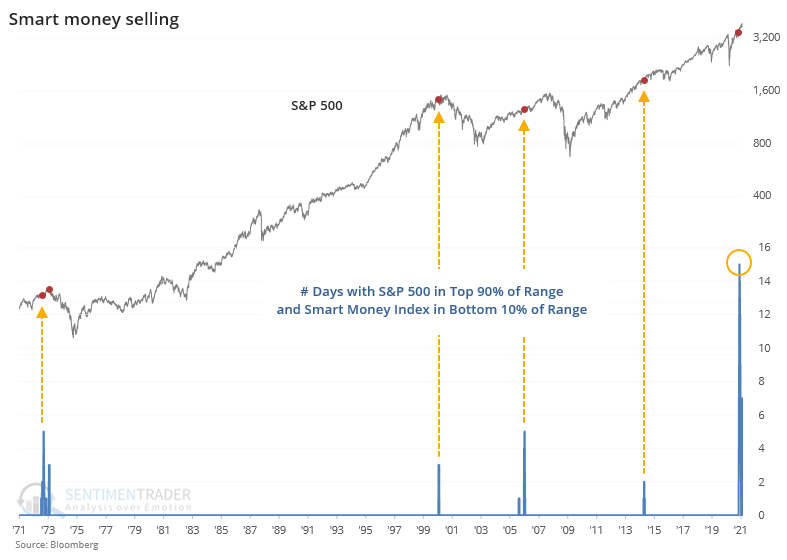
This has been the case for much of the past few weeks. So much so, that never before have we seen so many days when the S&P 500 was in the upper 90% of its 1-year range while the Smart Money Index is in the bottom 10% of its own 1-year range.
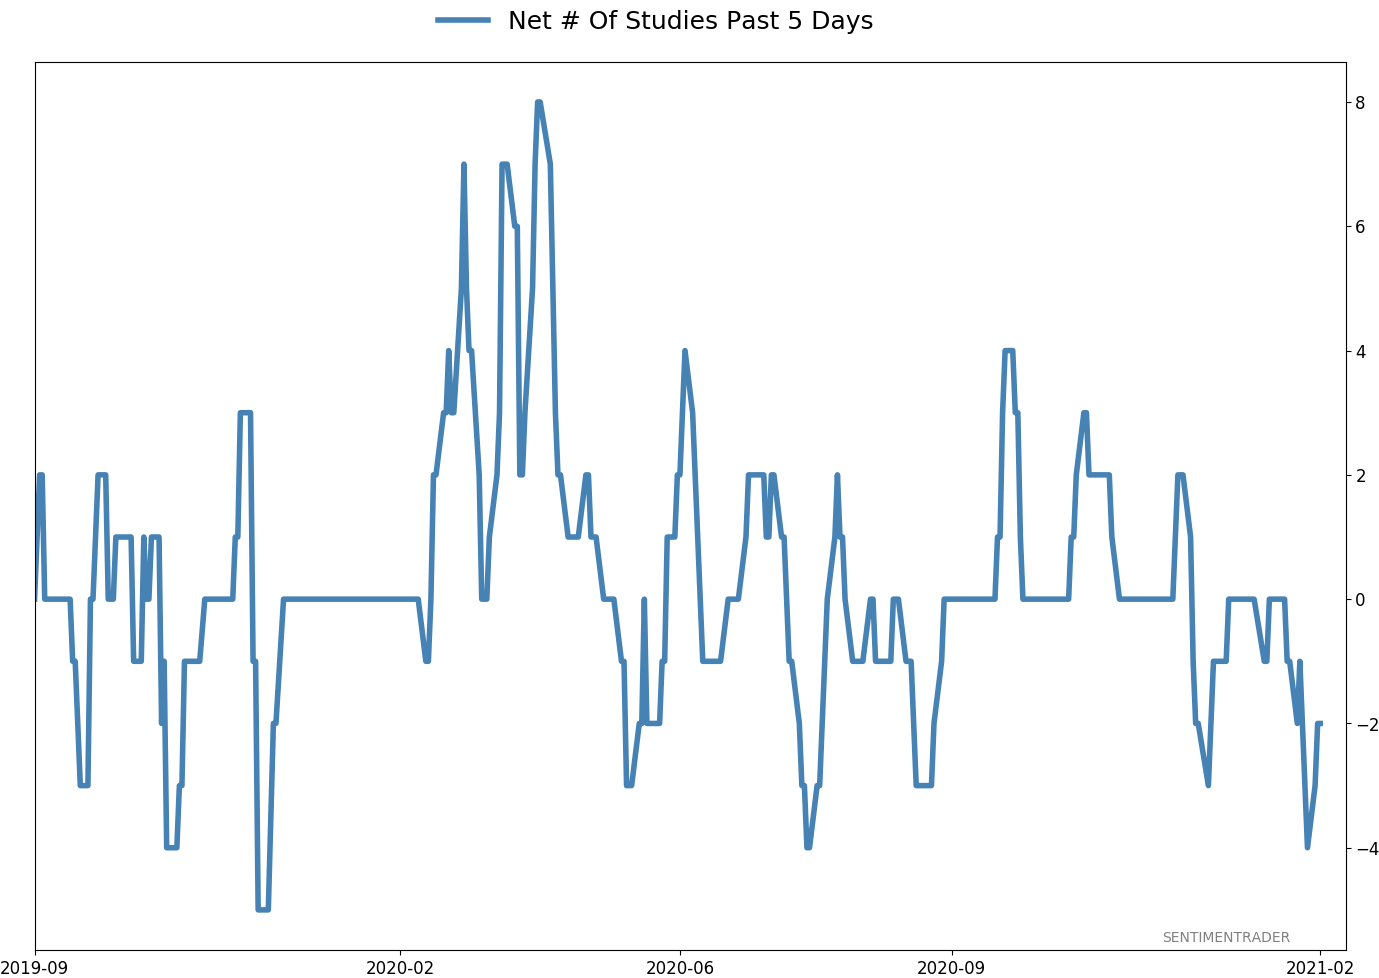
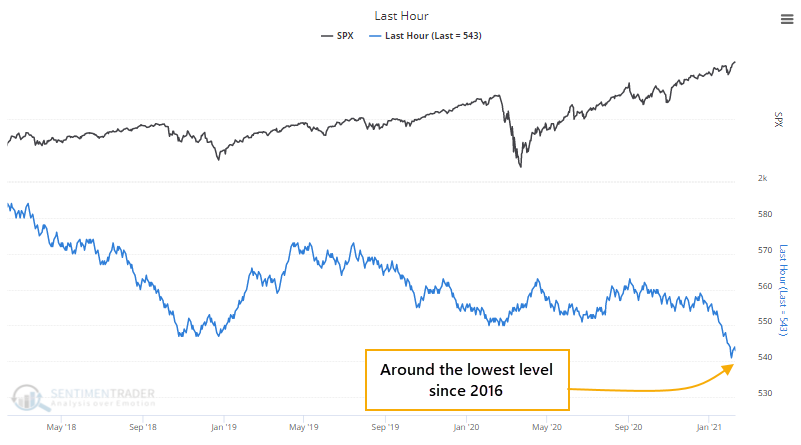
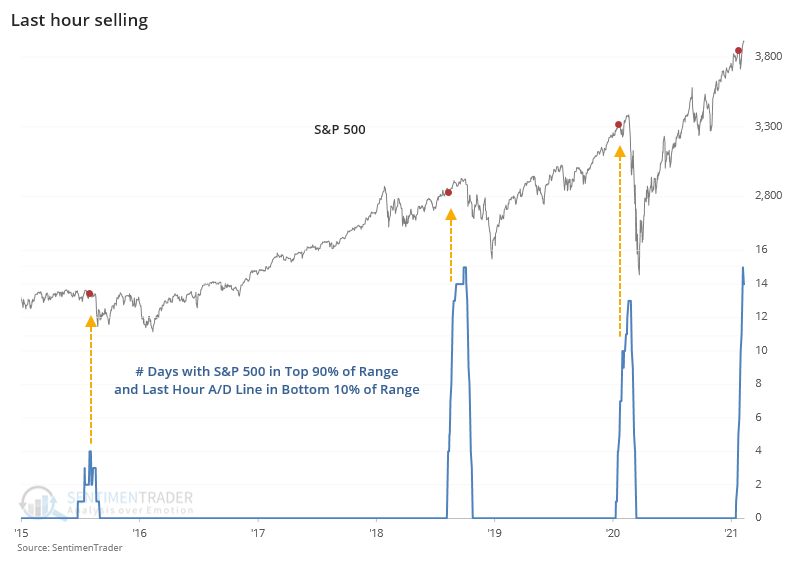
A little while back, Dean outlined a risk-off model he calculates using the last hour of trading. This is a cumulative advance/decline line of last-hour activity. If the S&P 500 rises during the last hour, then this indicator adds 1 to its running total; if the S&P sees selling to end the day, then the indicator subtracts 1. We've seen so much last-hour selling lately that this has been hovering near its lowest level since 2016.
Again, we've never seen so many days with this measure near its lows while the S&P is near its highs.
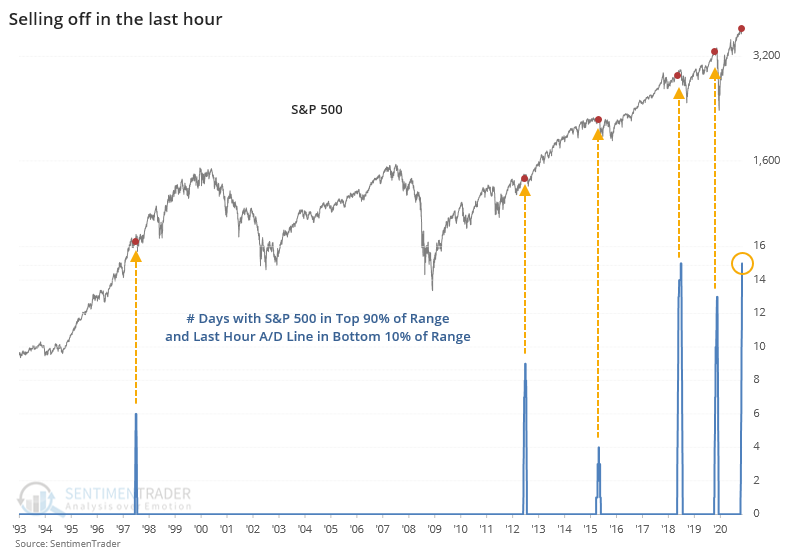
Its recent record is especially troubling.
There has been no shortage of signs of extreme, even record, speculation in recent weeks. The biggest counter-point to that has been widespread and impressive buying interest. That started to show some cracks in the past few weeks, but recent days have started to make up for it. It's a challenging dichotomy but risks in the short- to medium-term appear high, and the persistent last-hour selling adds to those concerns.
Active Studies
| Time Frame | Bullish | Bearish | | Short-Term | 0 | 0 | | Medium-Term | 2 | 7 | | Long-Term | 16 | 3 |
|
Indicators at Extremes
Portfolio
| Position | Description | Weight % | Added / Reduced | Date | | Stocks | RSP | 4.9 | Reduced 4% | 2021-02-09 | | Bonds | 10% BND, 8.9% SCHP, 4.8% ANGL | 23.7 | Reduced 4% | 2021-02-09 | | Commodities | GCC | 2.3 | Reduced 2.1%
| 2020-09-04 | | Precious Metals | GDX | 8.9 | Added 4.8% | 2020-12-01 | | Special Situations | 9.6% XLE, 8.2% PSCE | 17.8 | Reduced 1.5% | 2021-02-09 | | Cash | | 42.8 | | |
|
Updates (Changes made today are underlined)
With a market that has seen the kinds of broad participation and big breath thrusts like we did in the fall, it's hard to become too negative. Those kinds of conditions have consistently preceded higher returns over the next 6-12 months. It's the interim that's more of an issue. Even conditions like that haven't prevented some shorter-term pullbacks. And when we combine an environment where speculation is rampant and recent days have seen an increase in cracks under the surface of the indexes, it's enough to become more defensive over a short- to medium-term time frame. We still don't have much confirmation from the price action in the indexes, so those who are more conservative would likely wait before increasing cash levels. Not much has changed, but I'm getting increasingly anxious and prefer to hold cash over riskier assets so I increased the cash cushion. RETURN YTD: 6.0% 2020: 8.1%, 2019: 12.6%, 2018: 0.6%, 2017: 3.8%, 2016: 17.1%, 2015: 9.2%, 2014: 14.5%, 2013: 2.2%, 2012: 10.8%, 2011: 16.5%, 2010: 15.3%, 2009: 23.9%, 2008: 16.2%, 2007: 7.8%
|
|
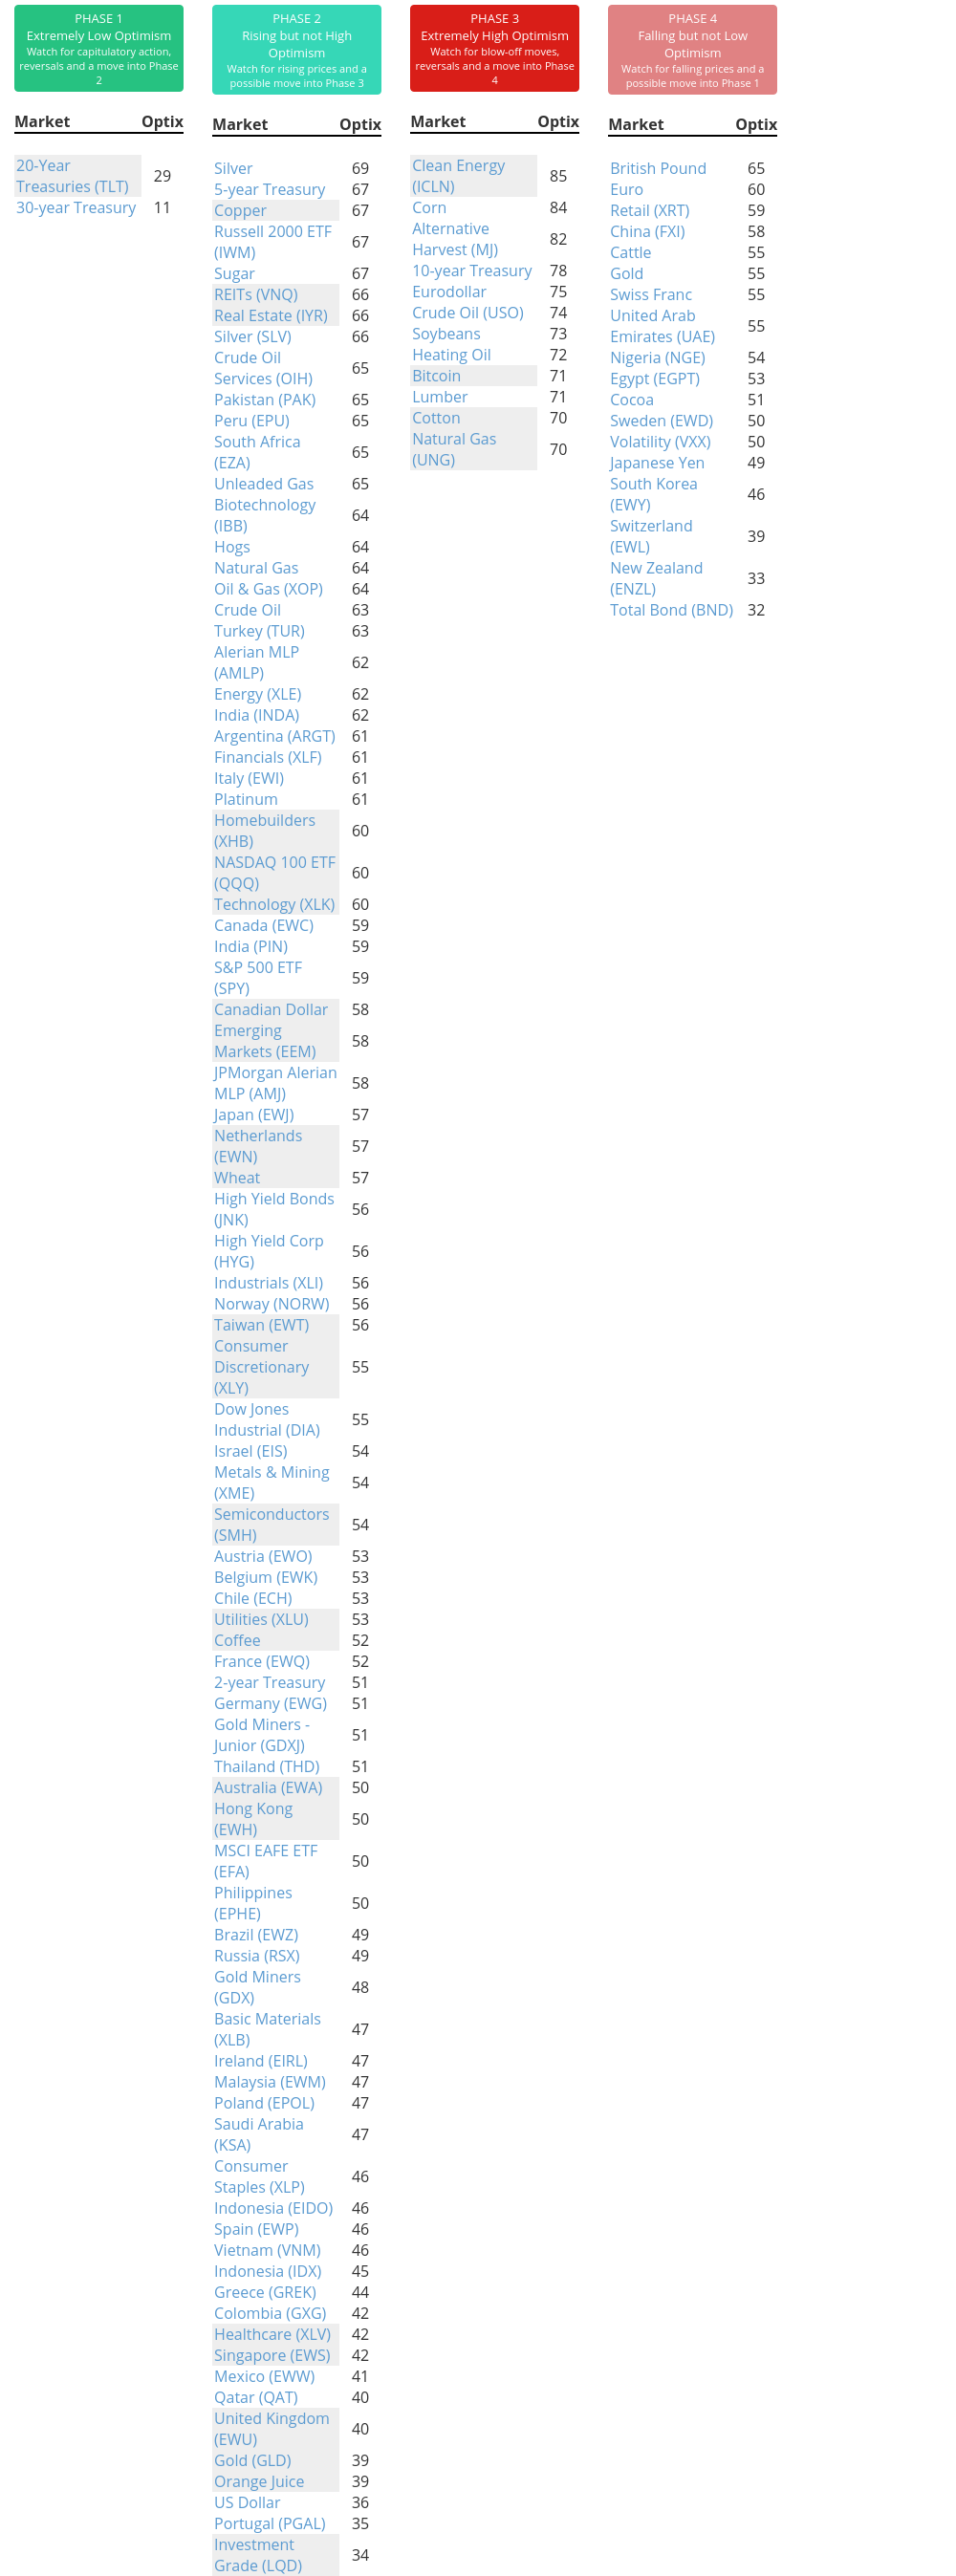
Phase Table
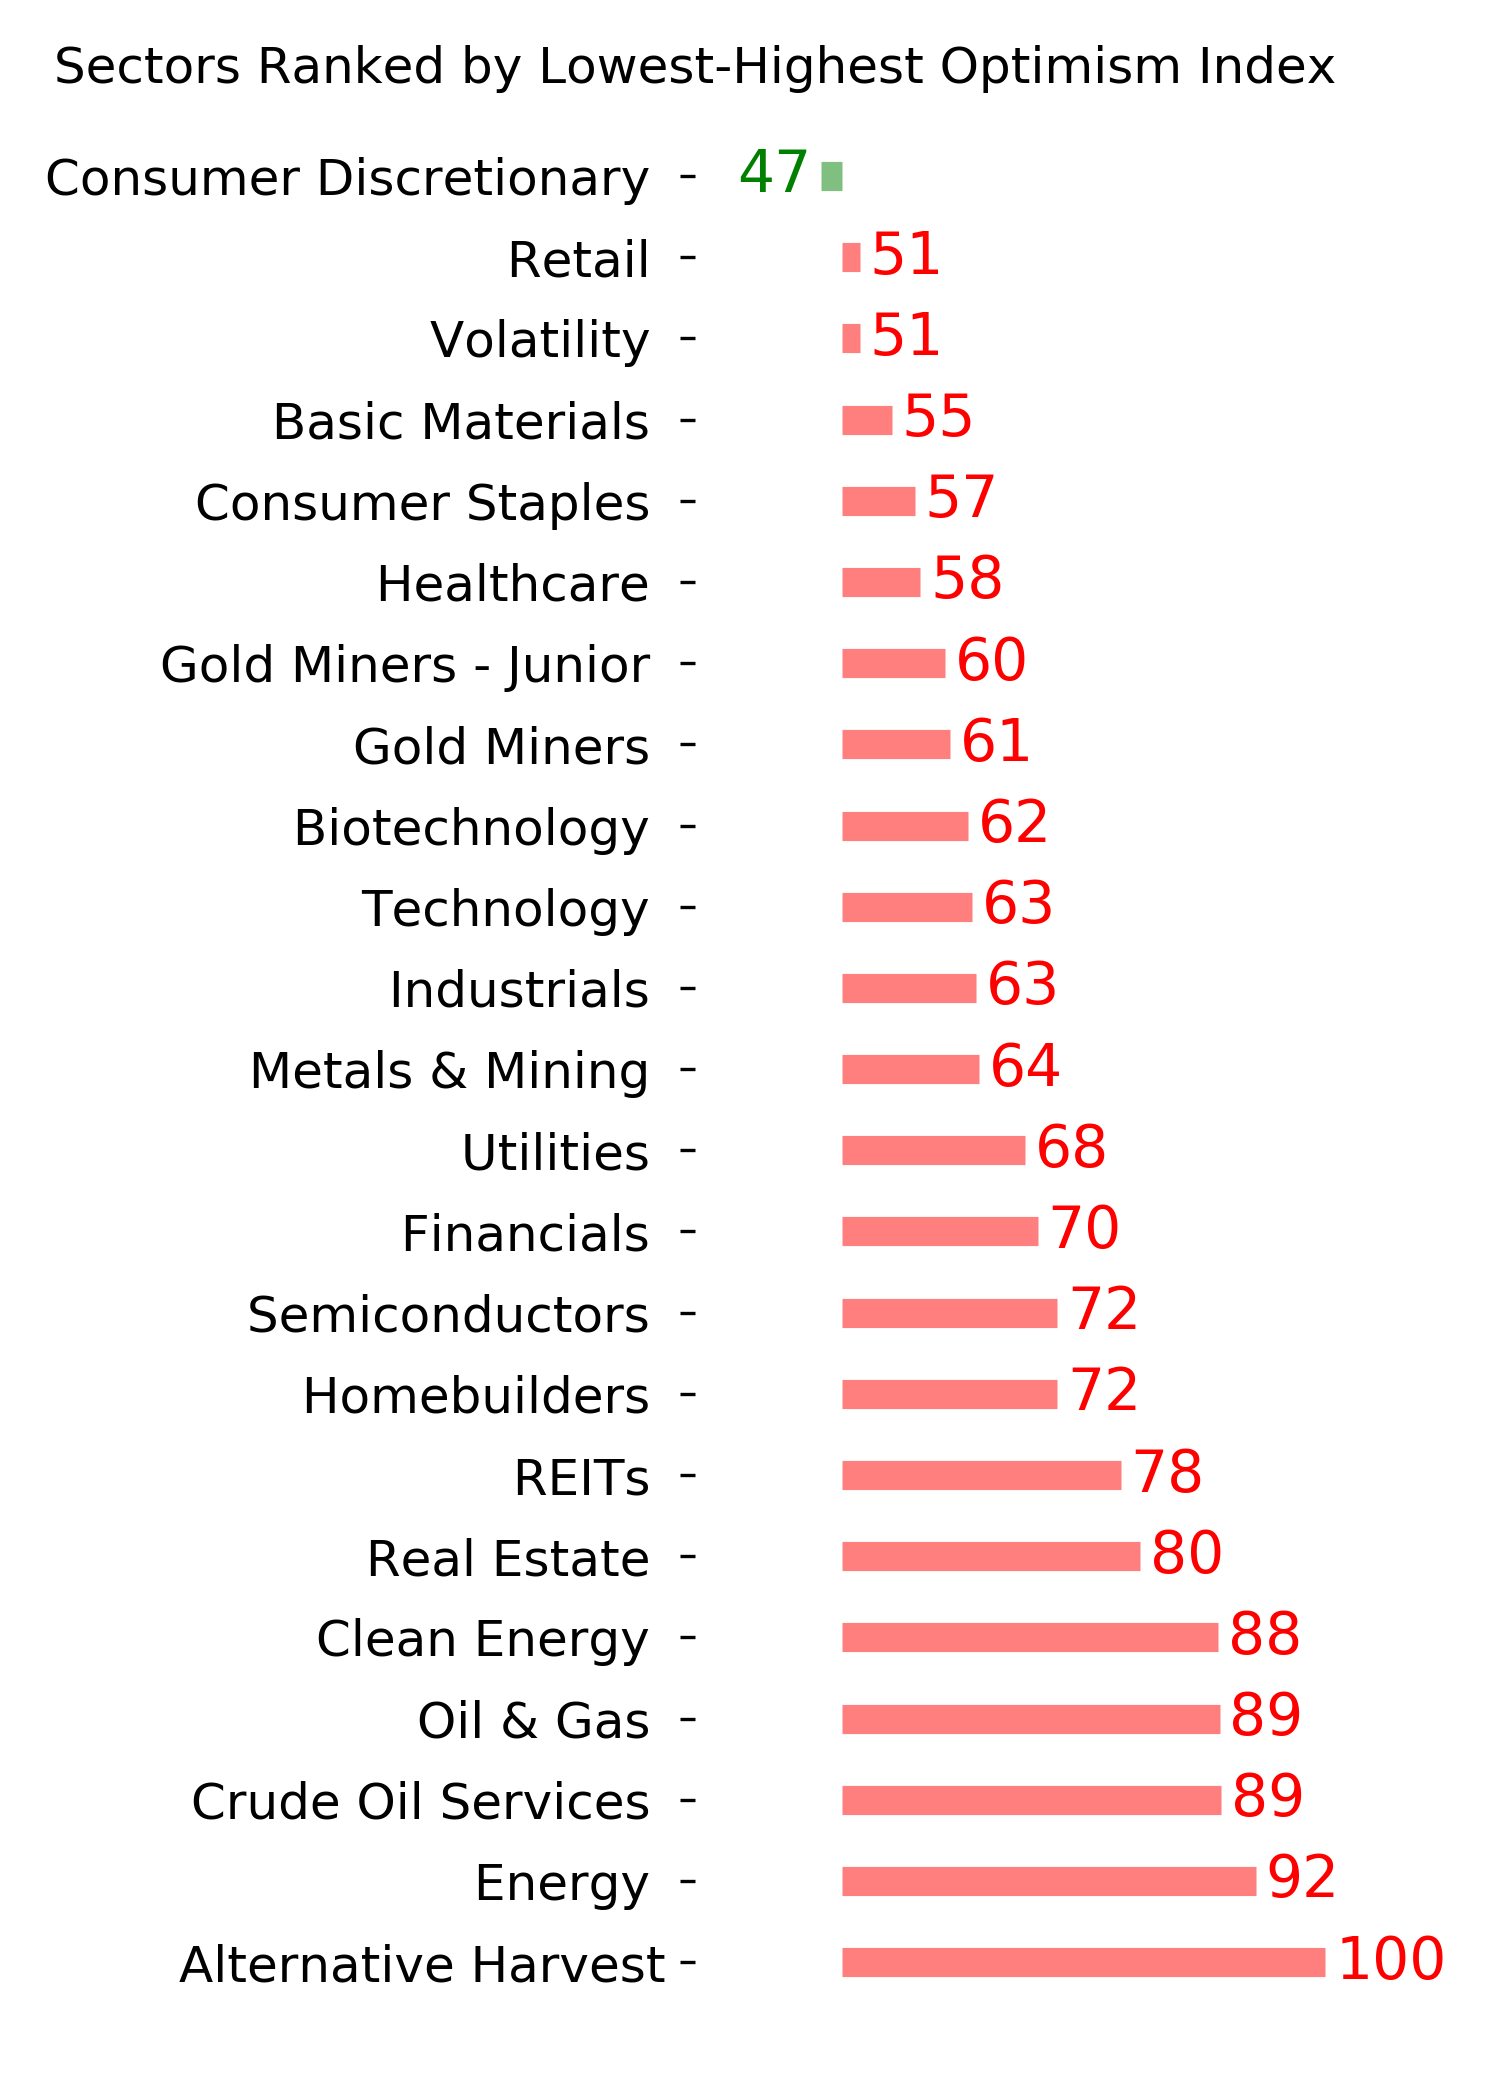
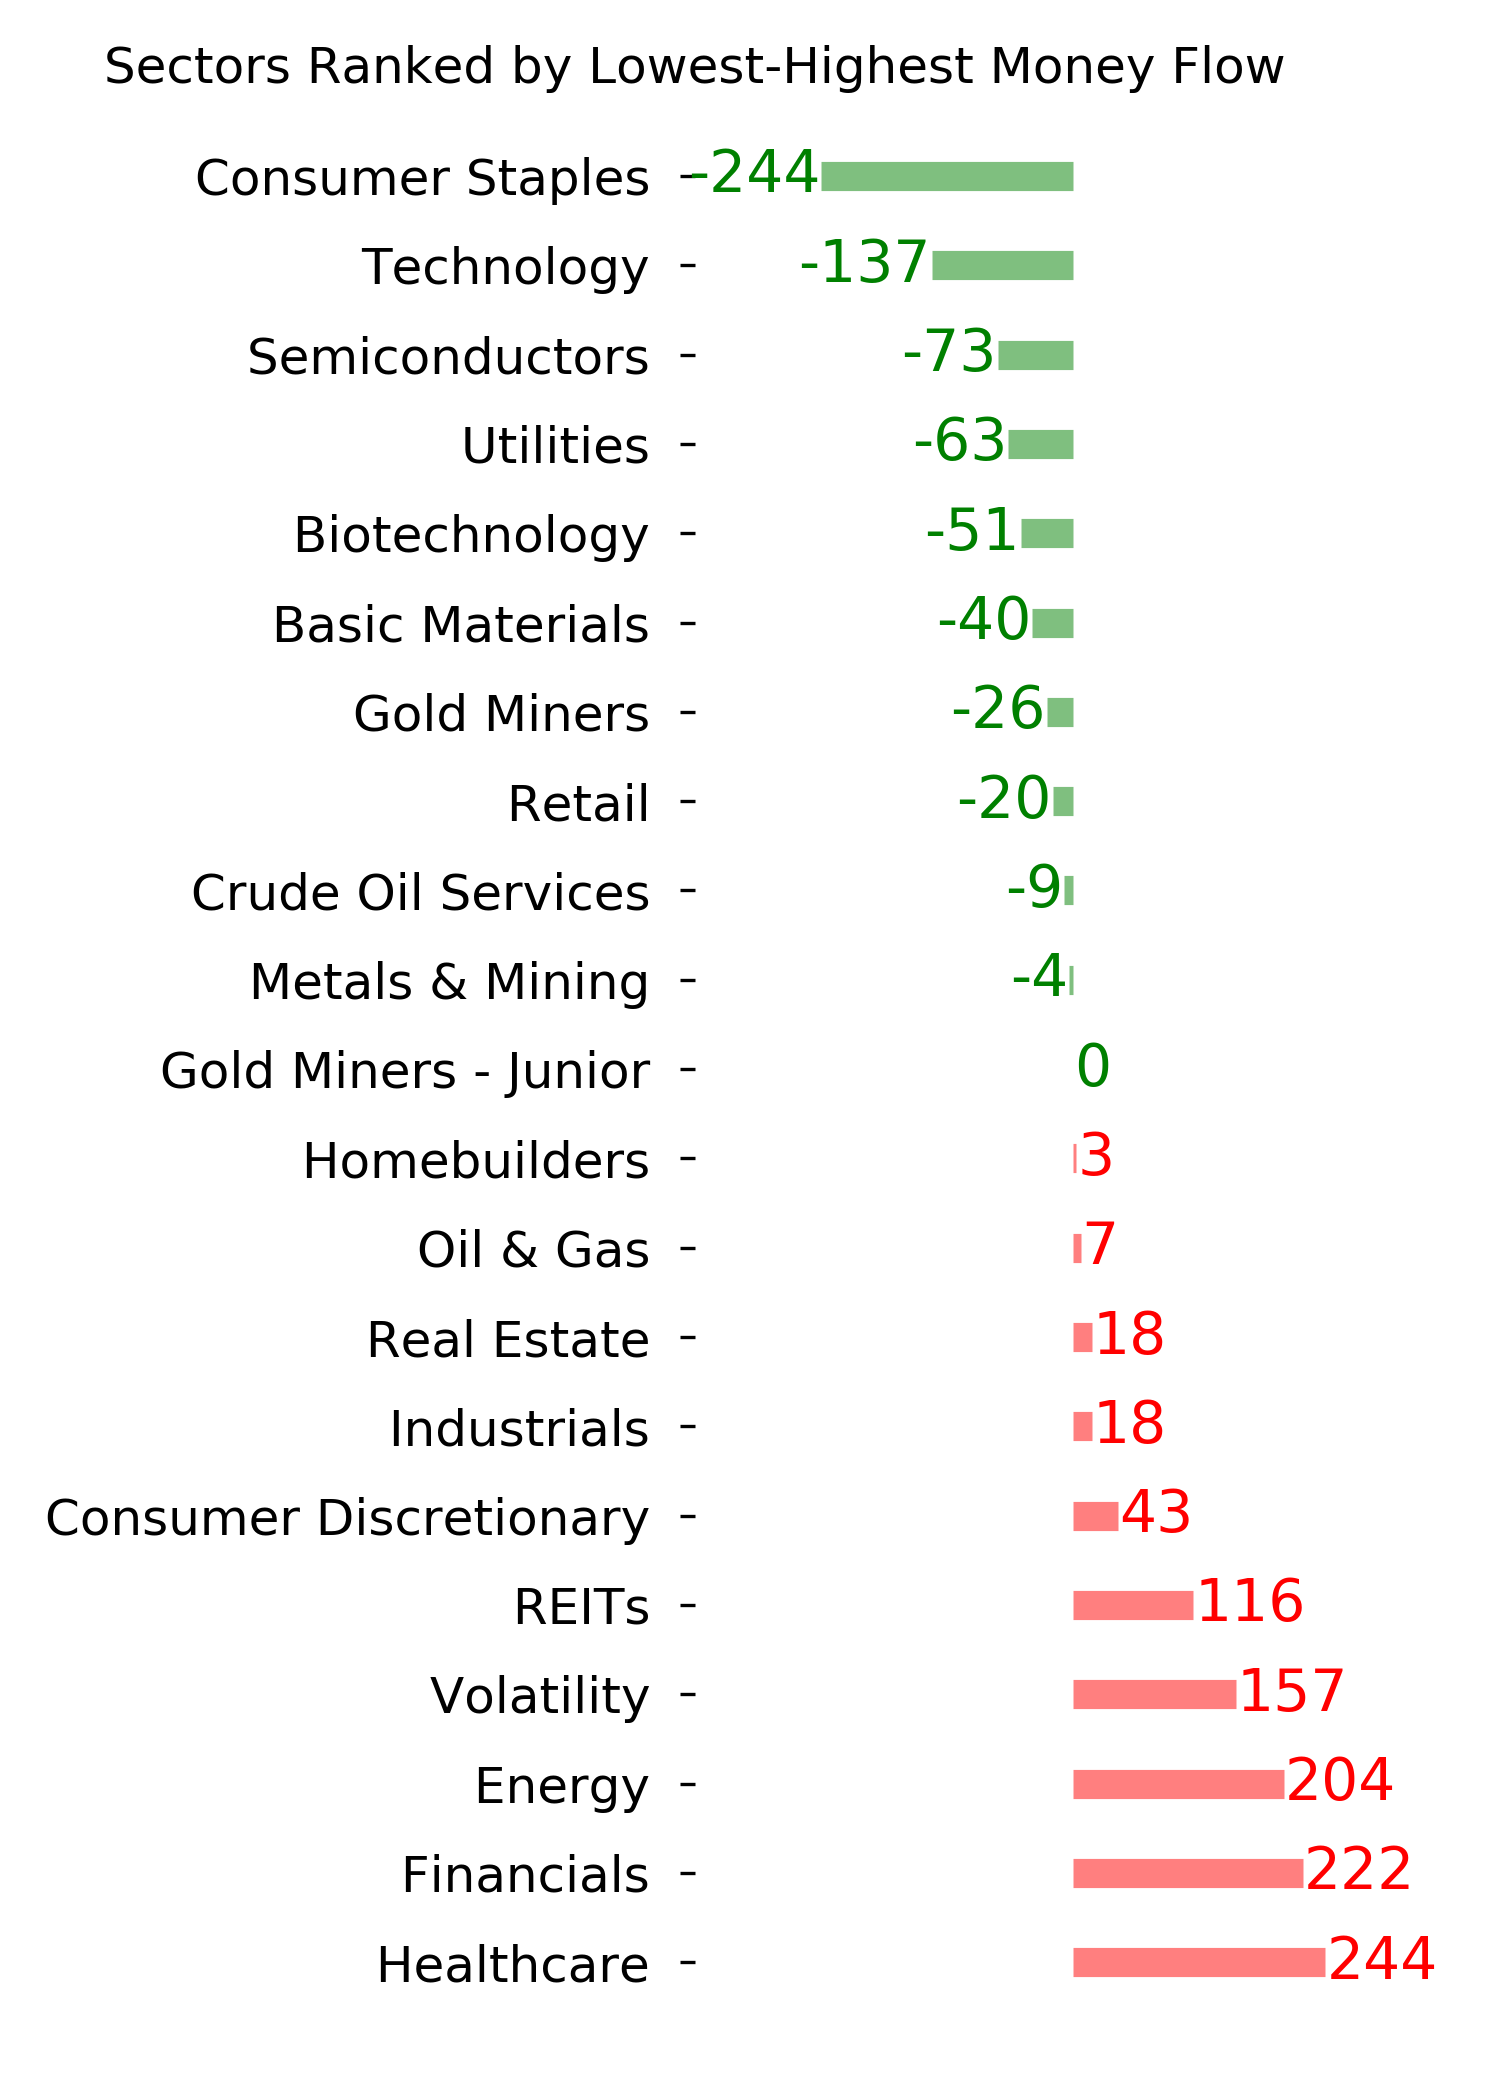
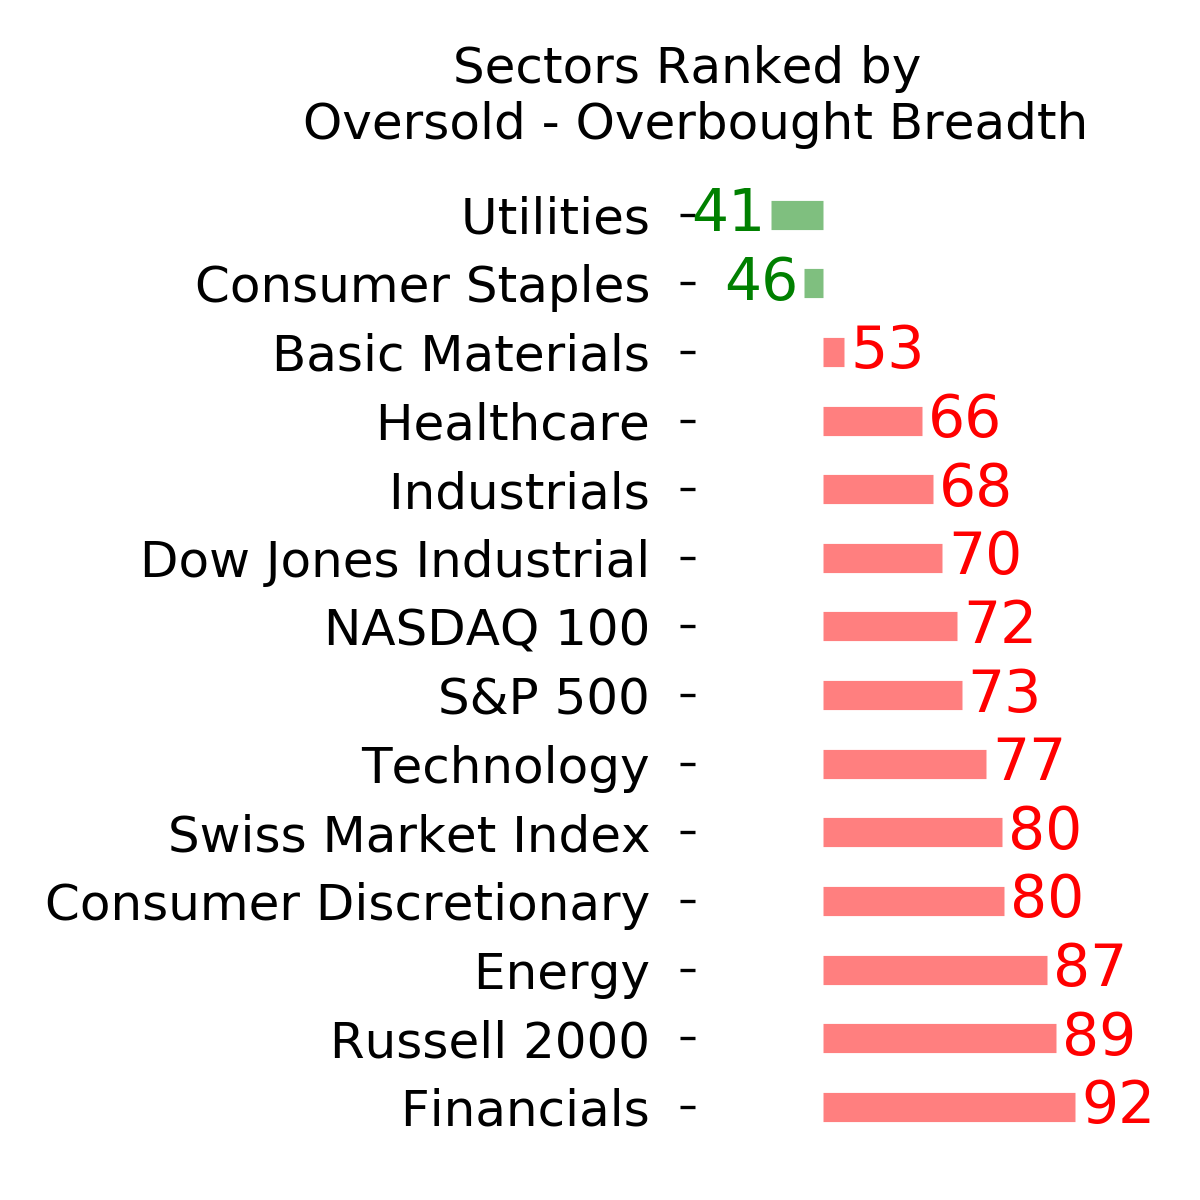
Ranks
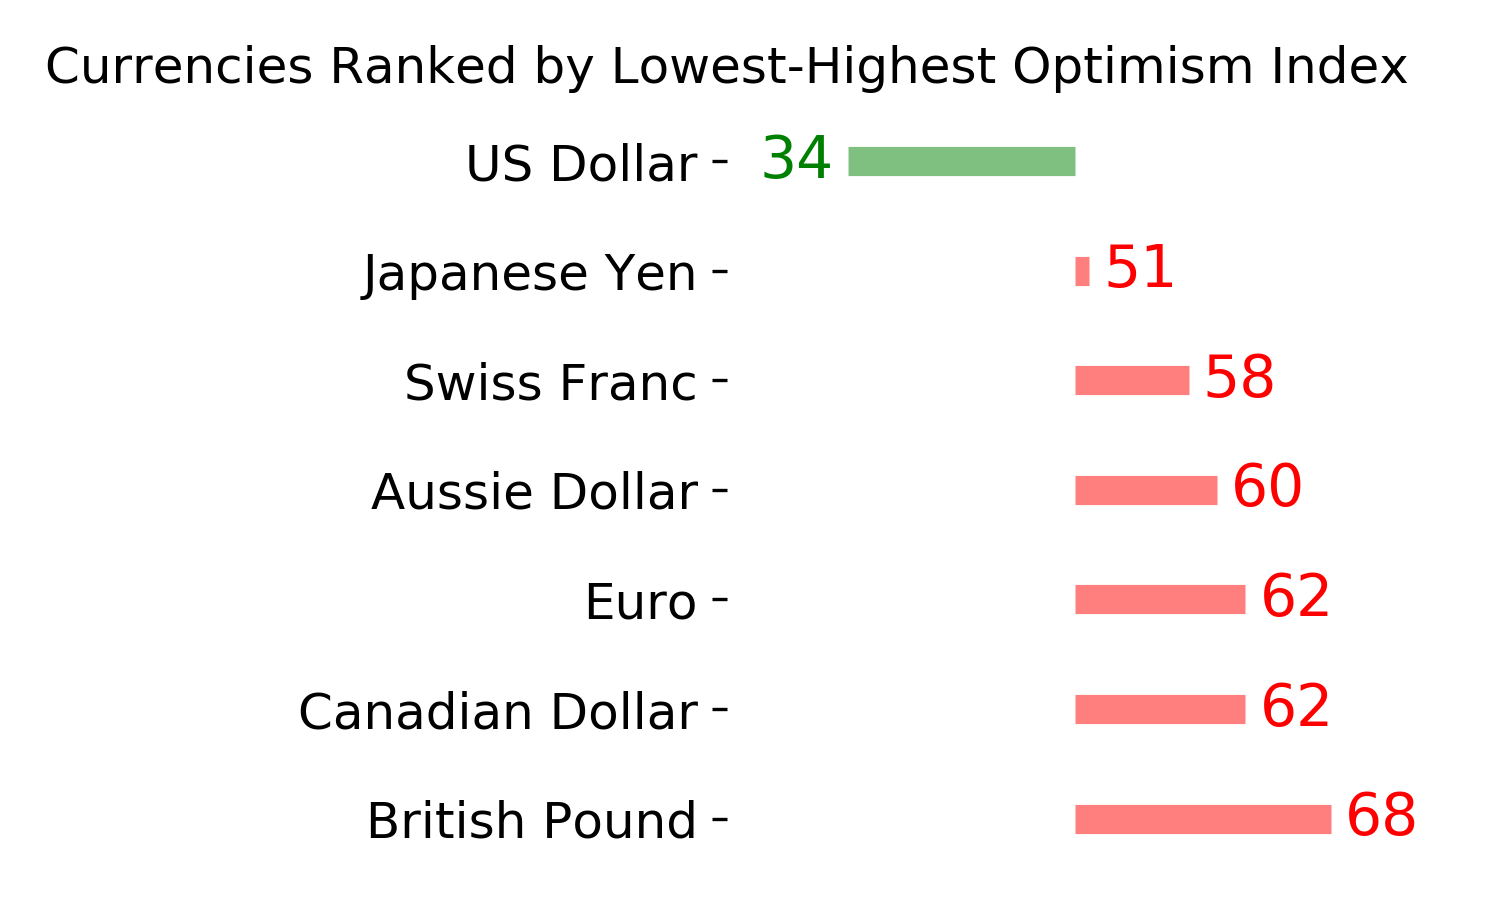
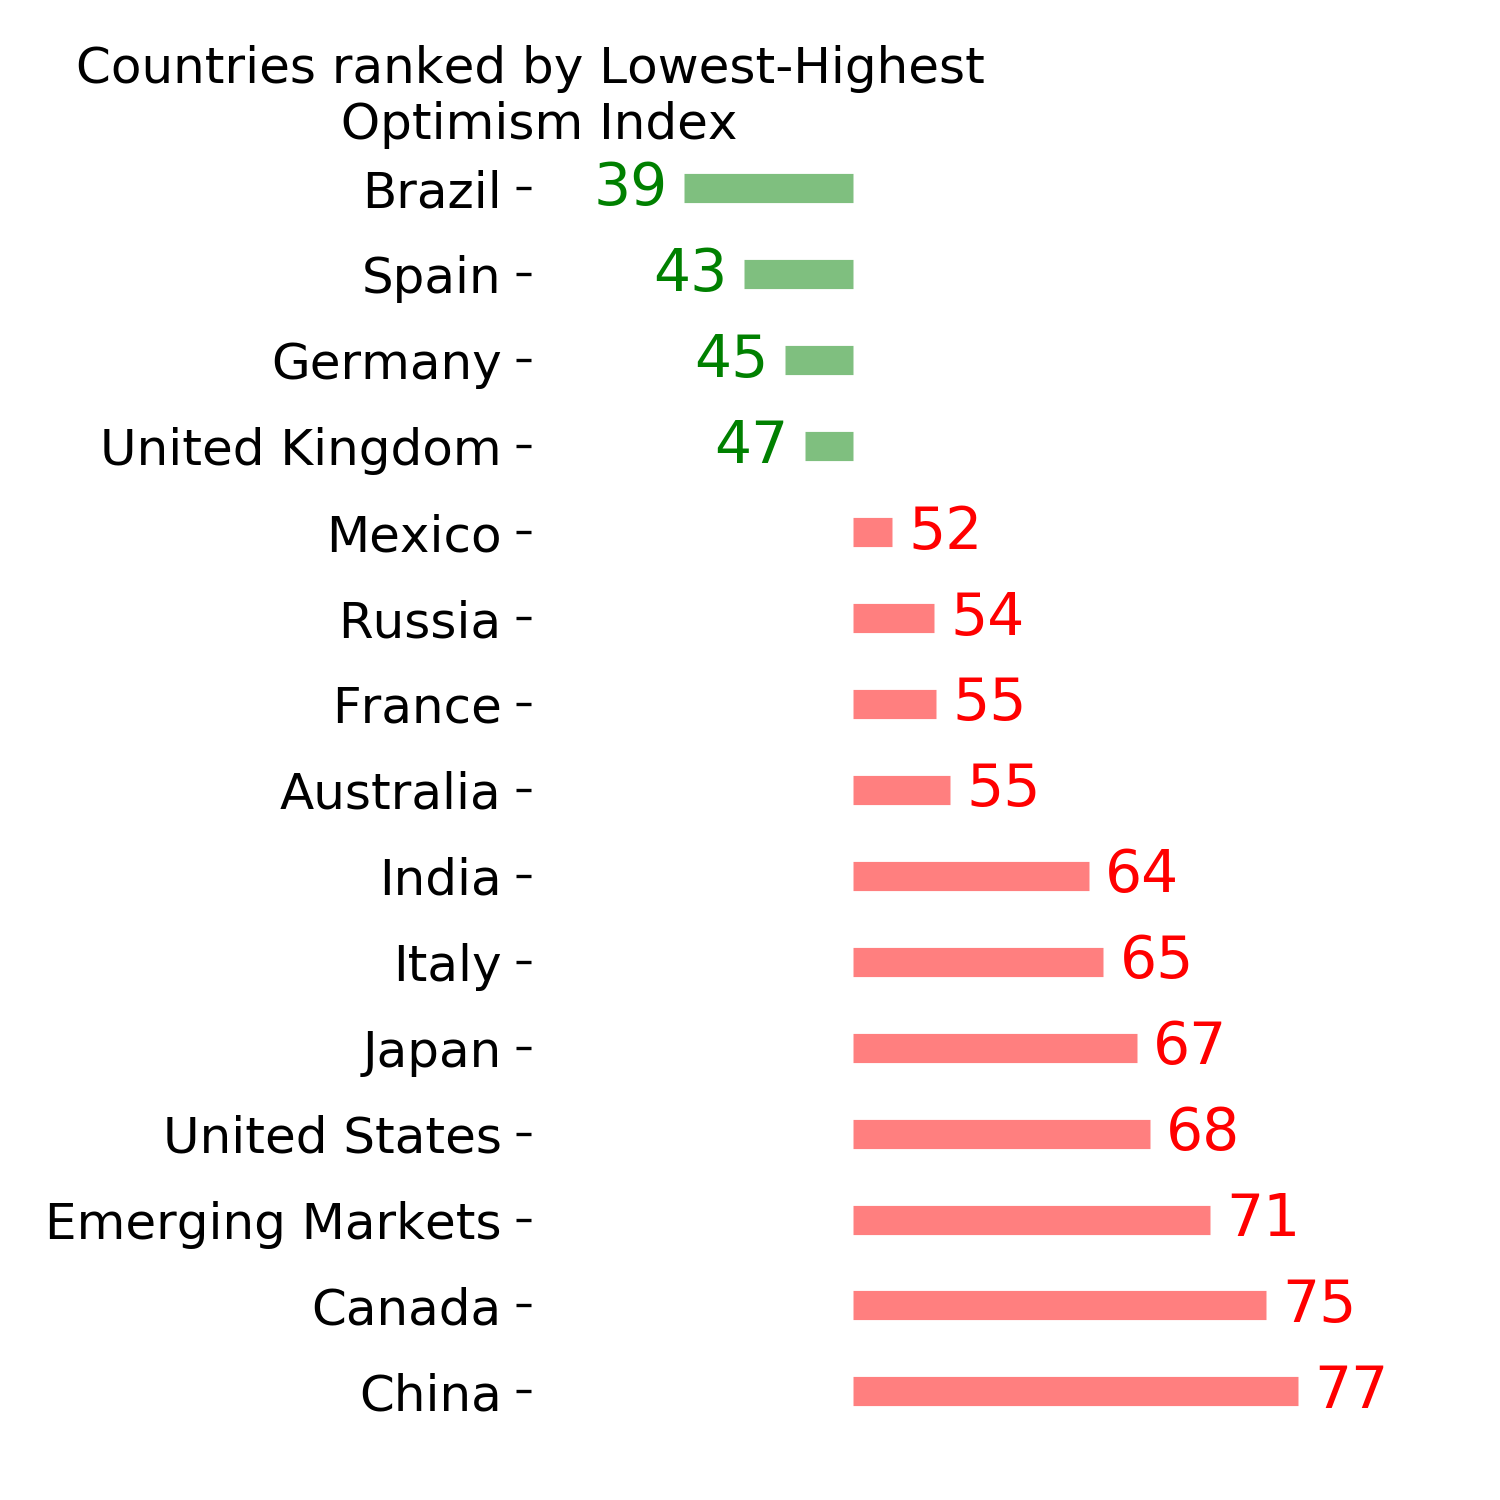
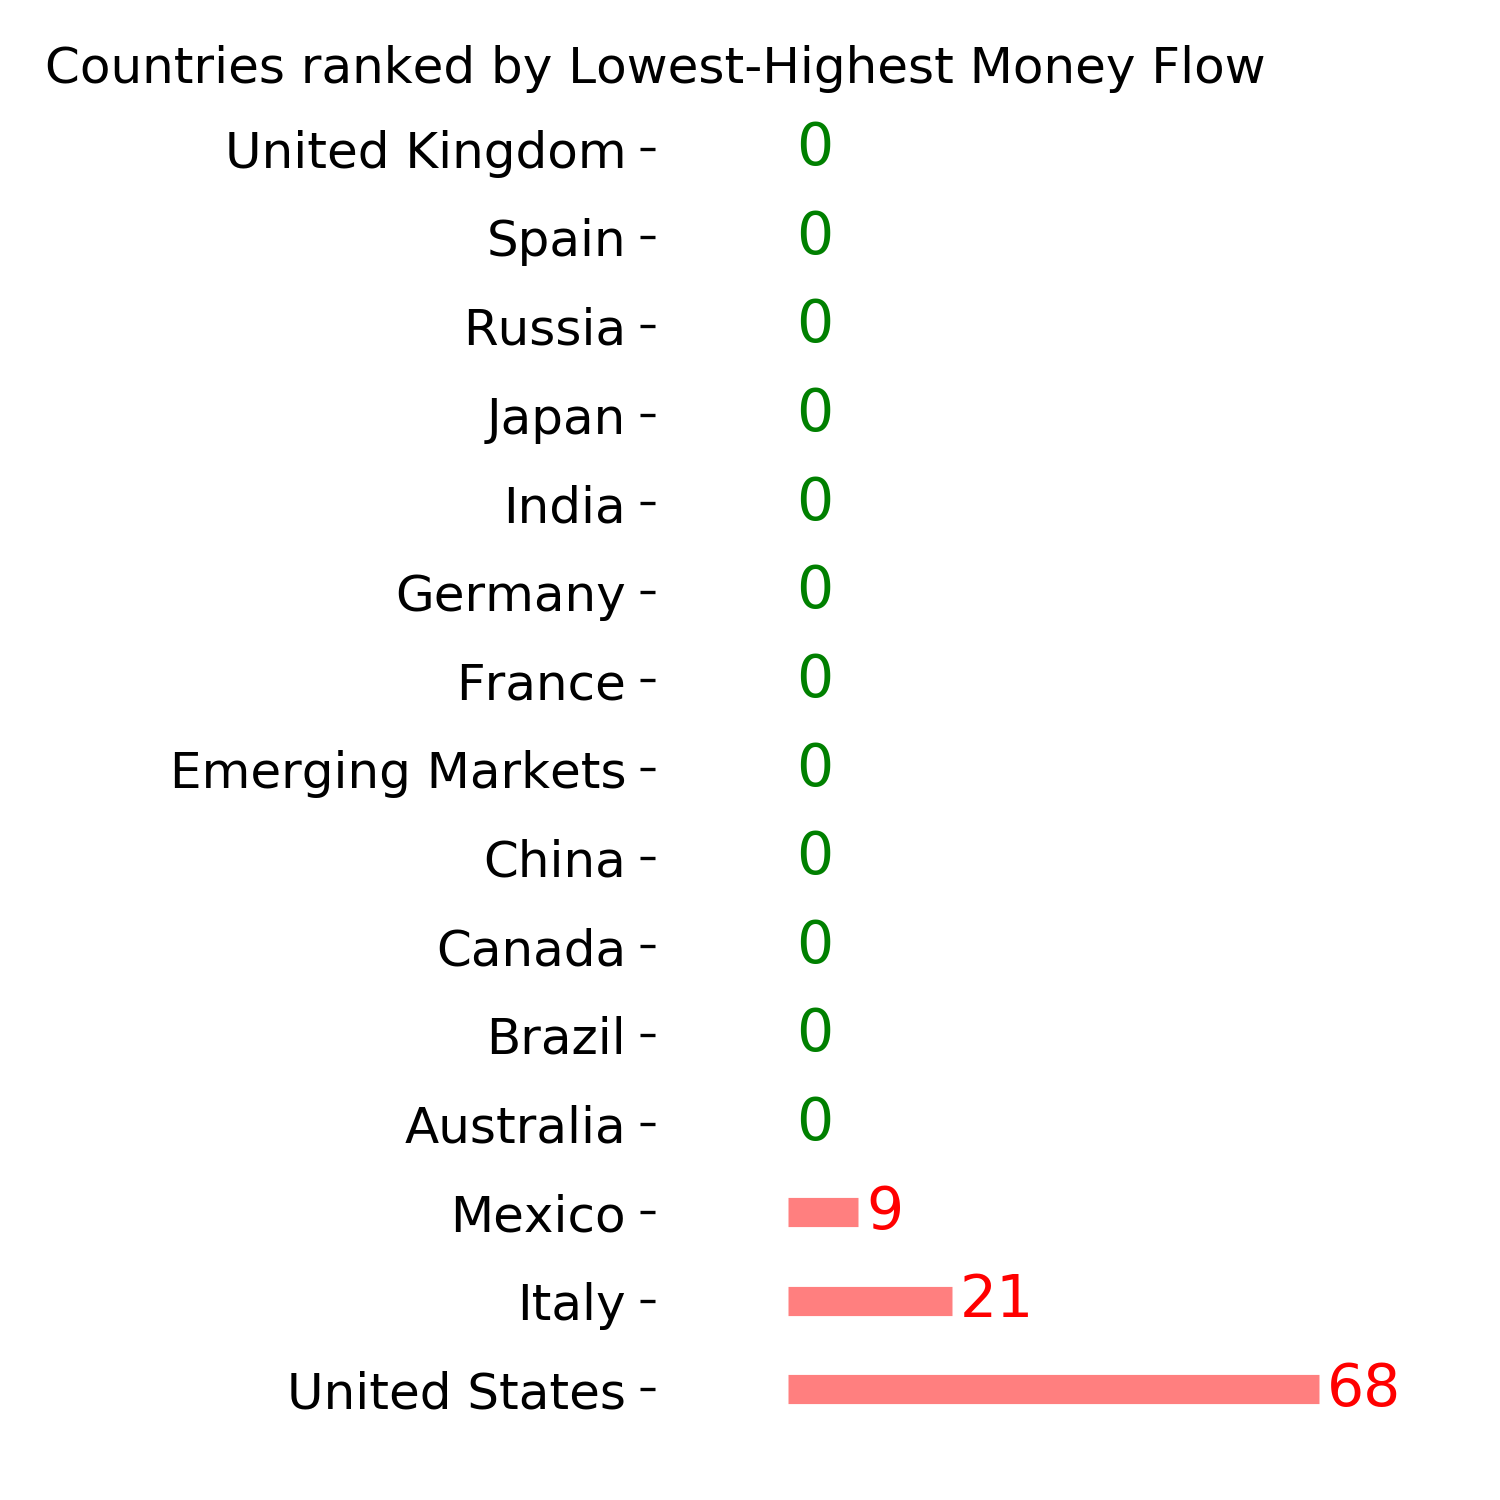
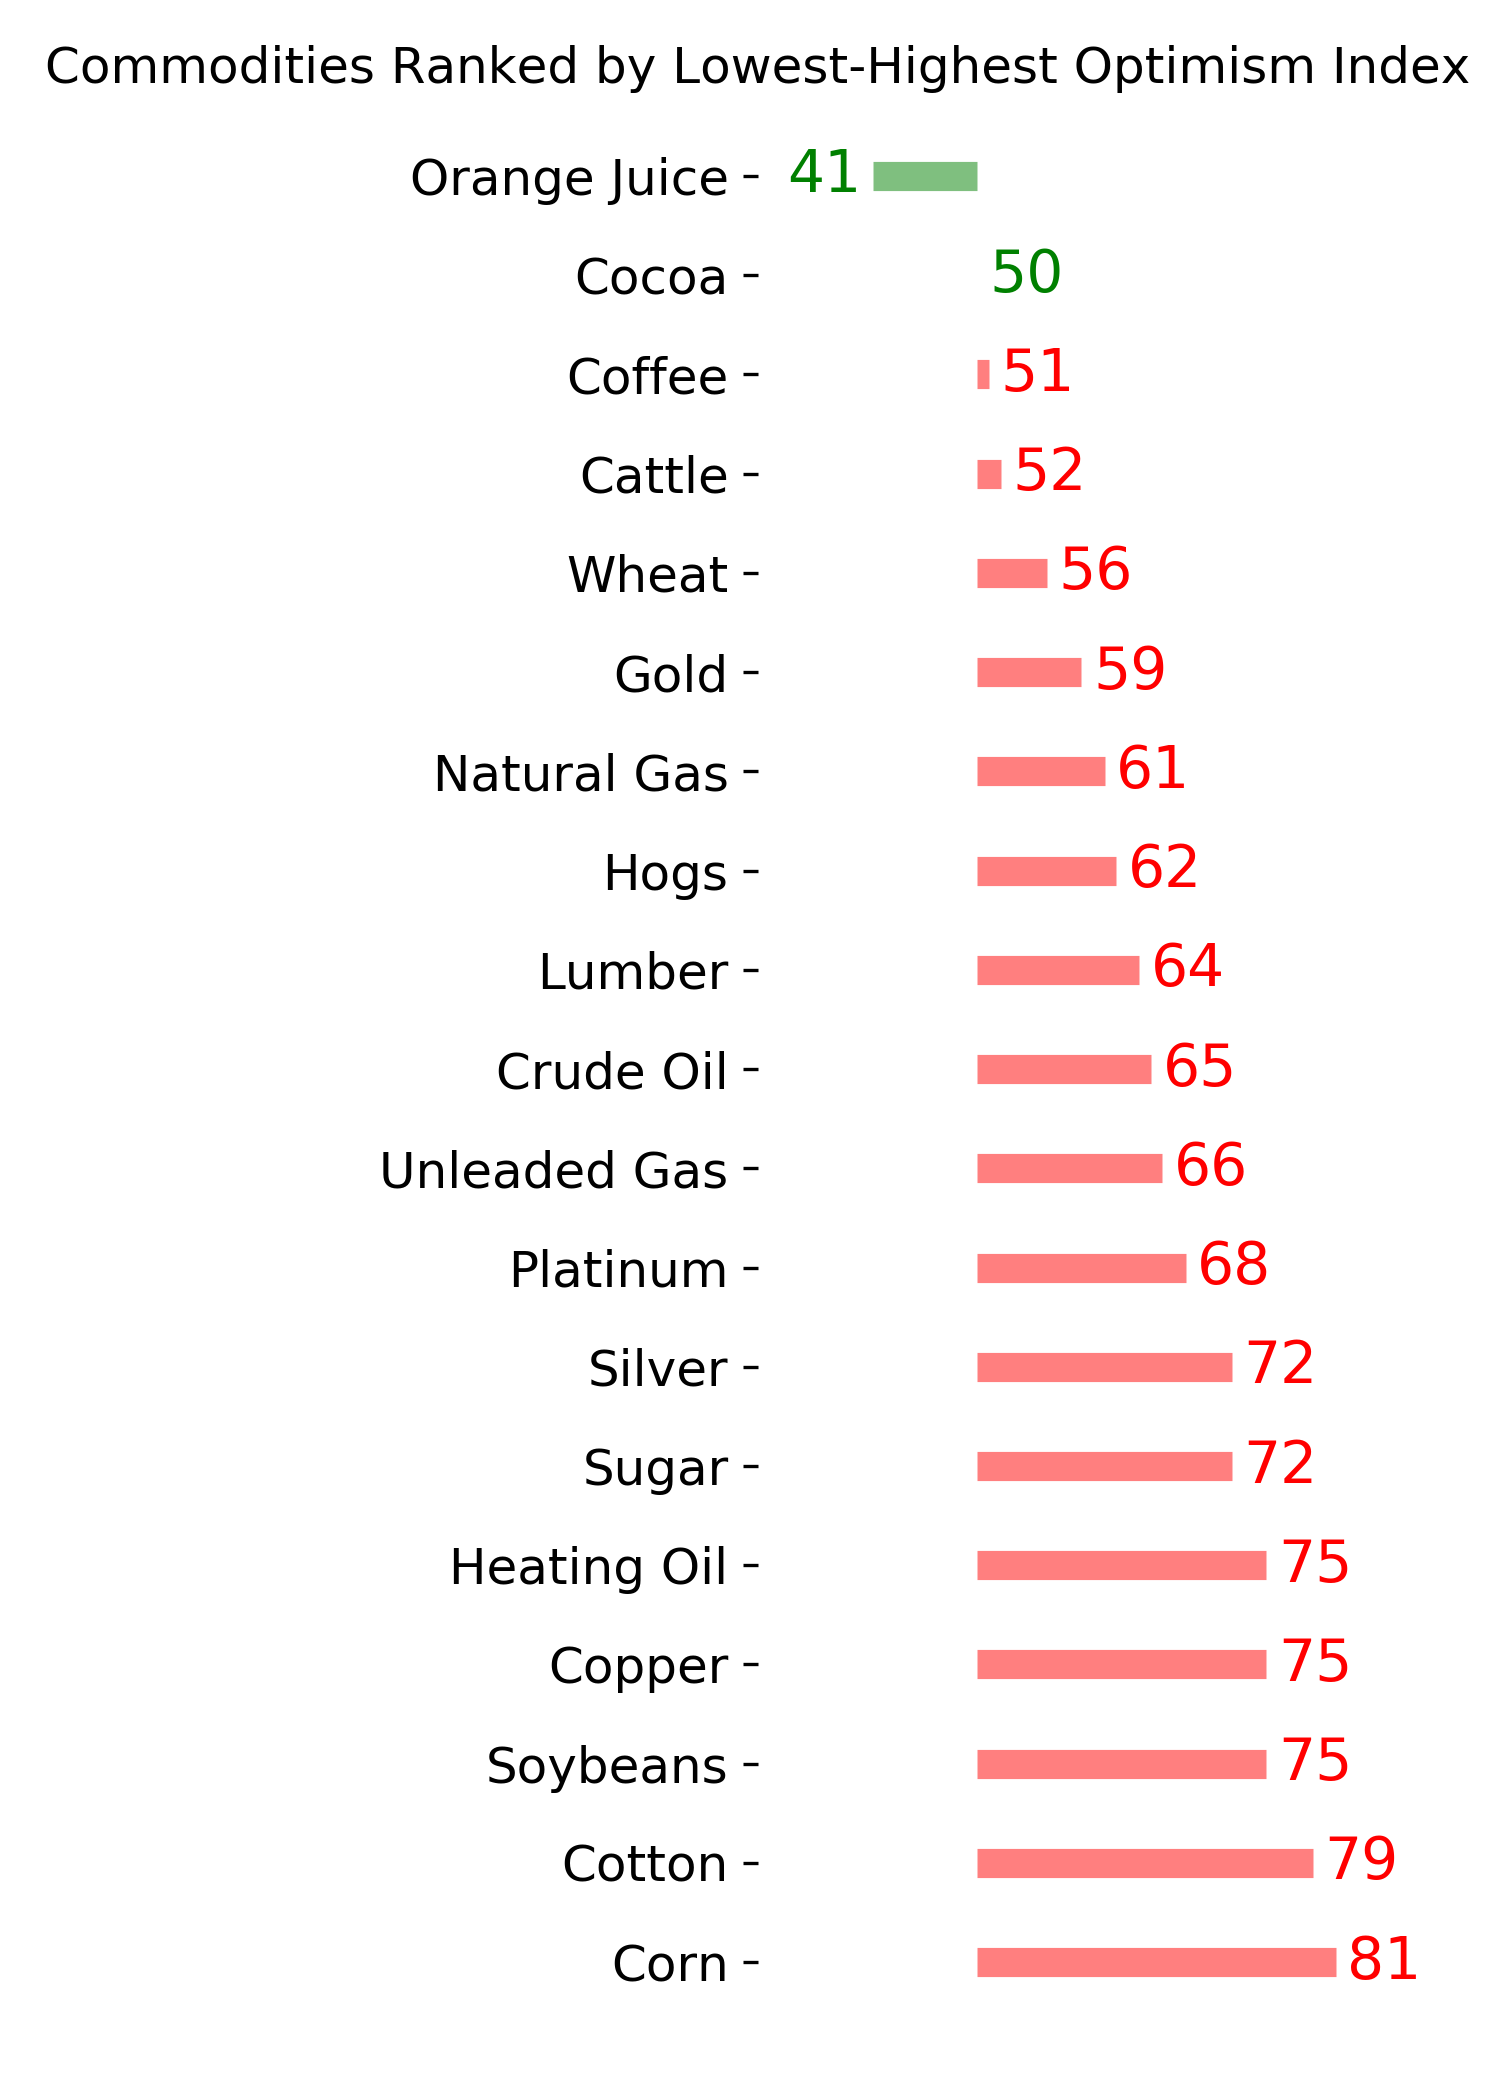
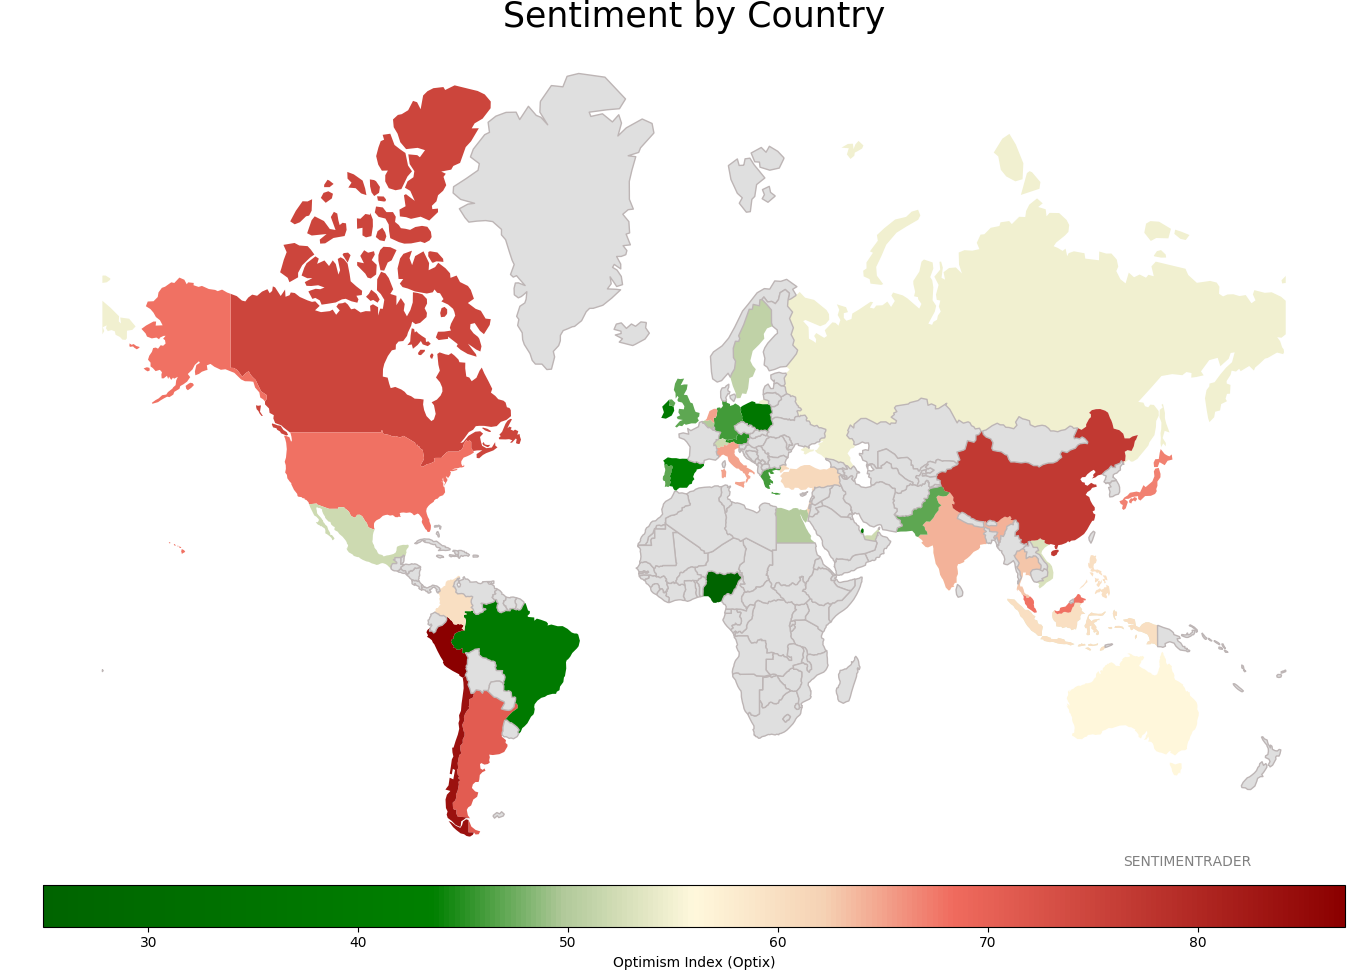
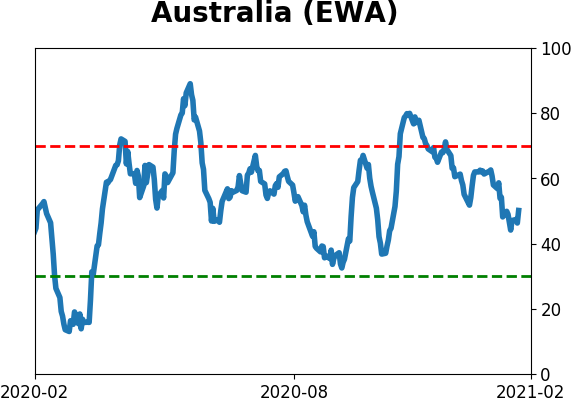
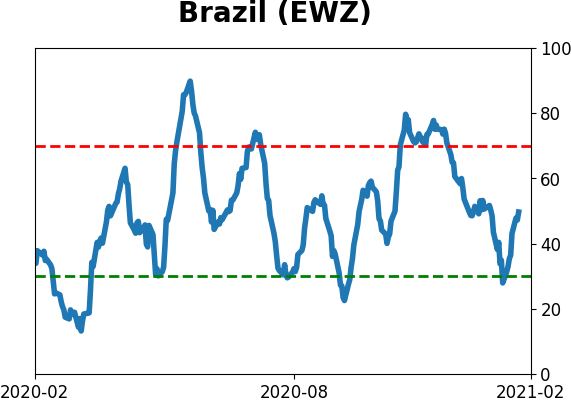
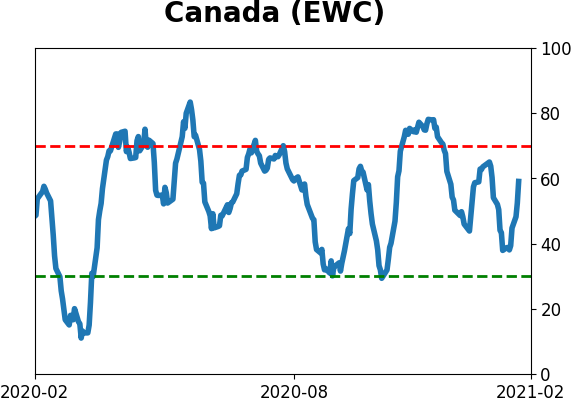
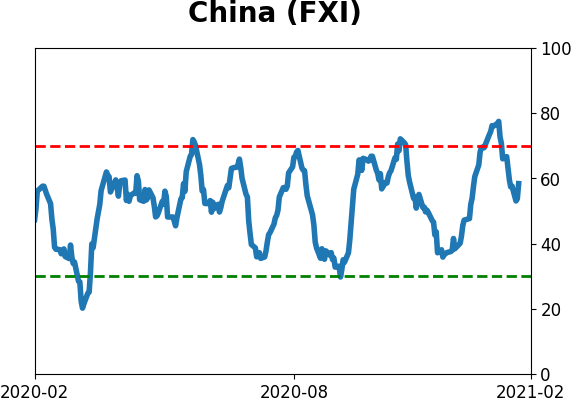
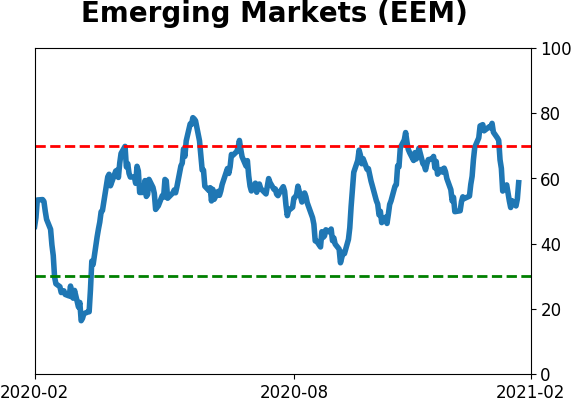
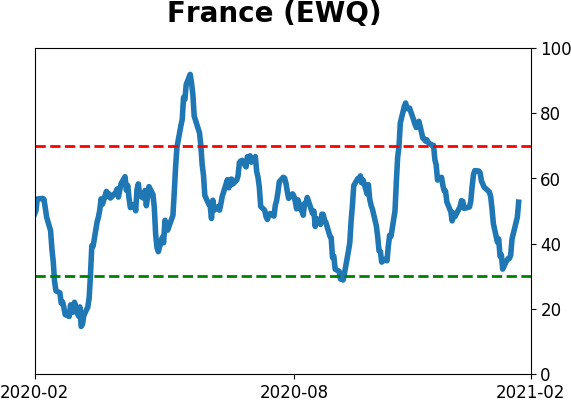
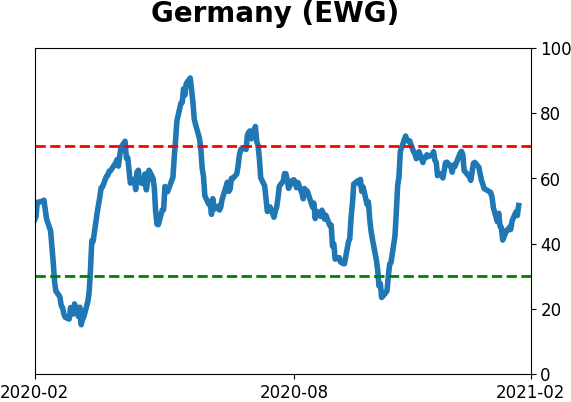
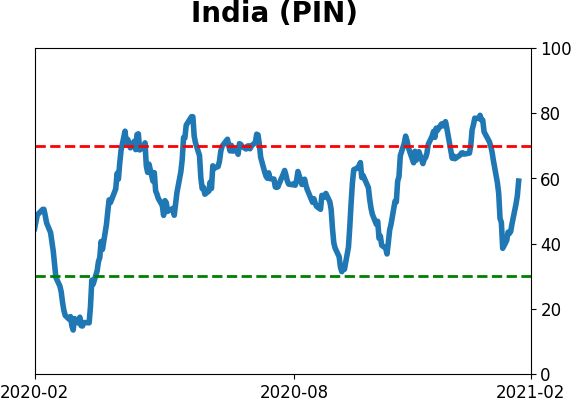
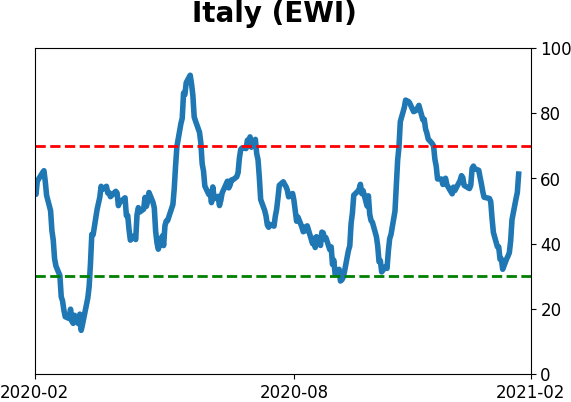
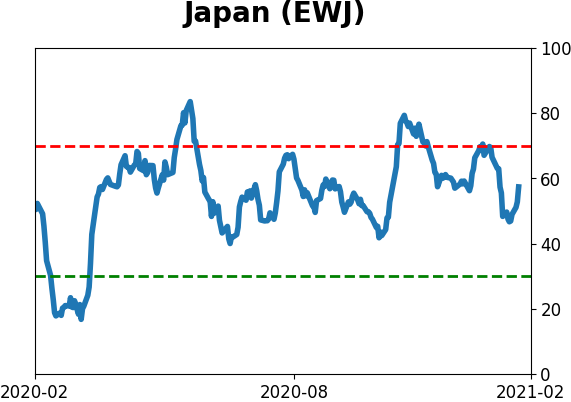
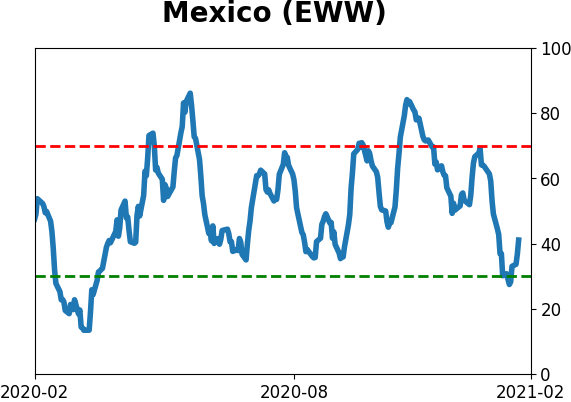
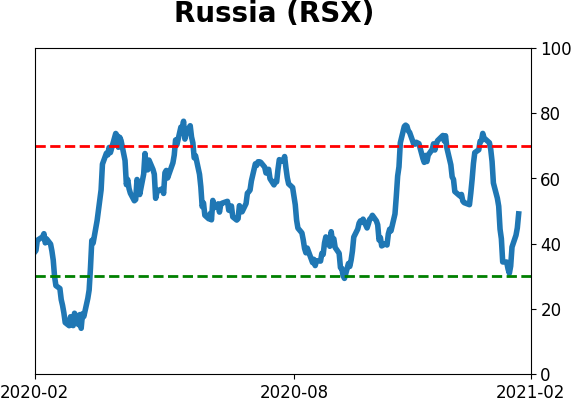
Sentiment Around The World
Optimism Index Thumbnails
|
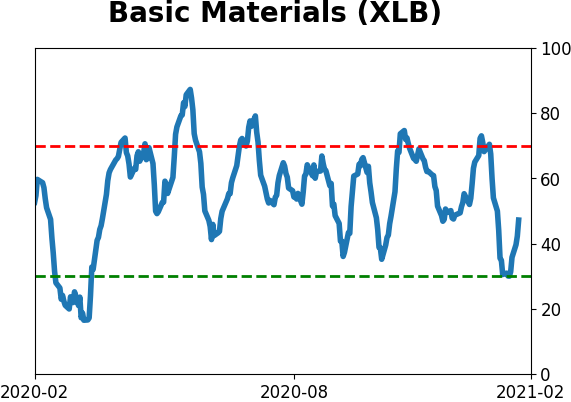
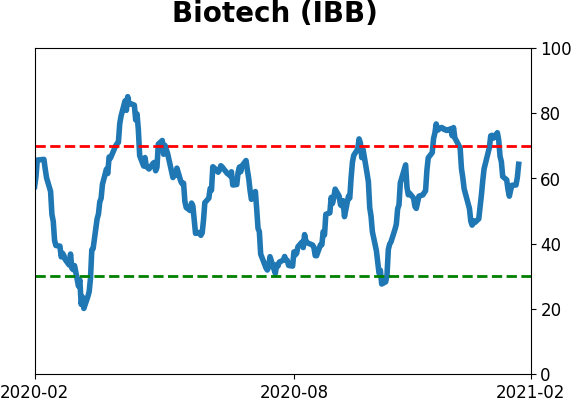
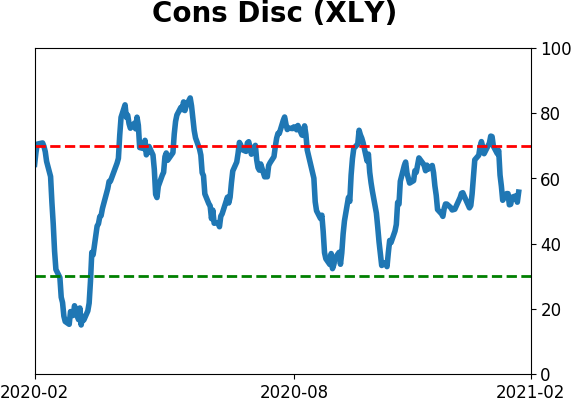
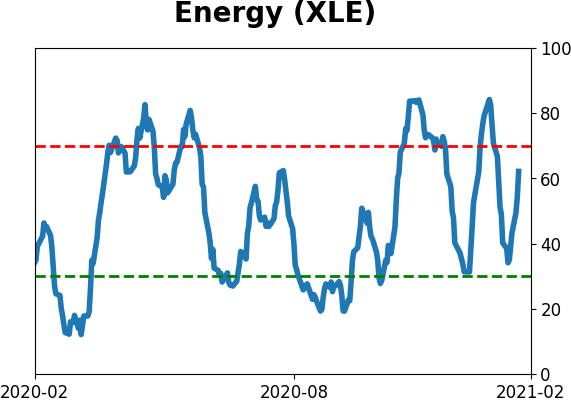
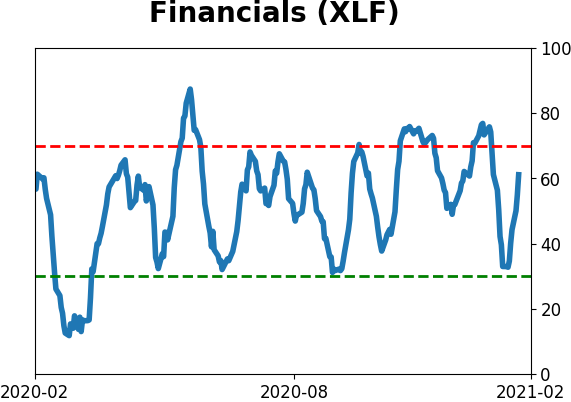
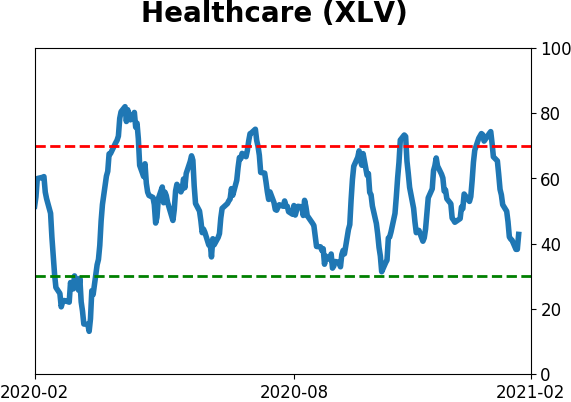
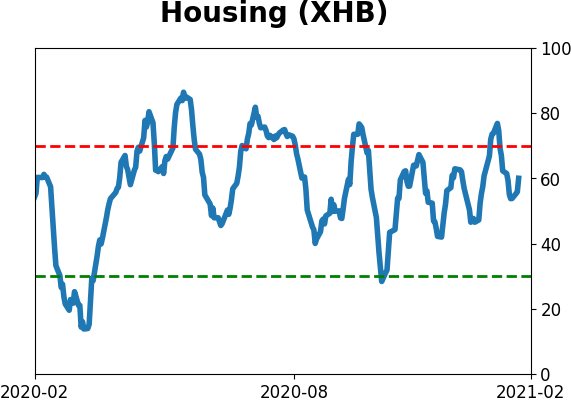
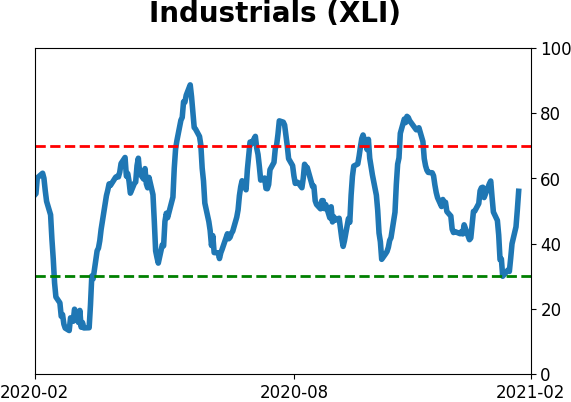
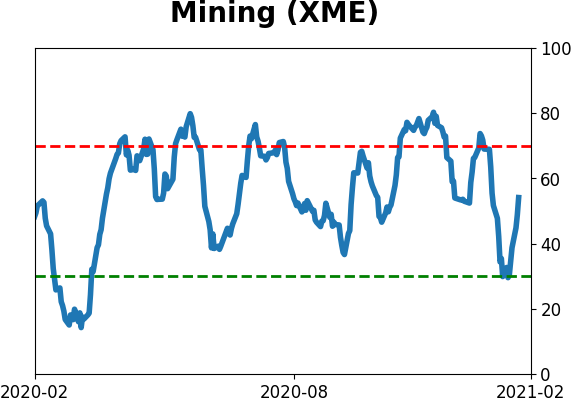
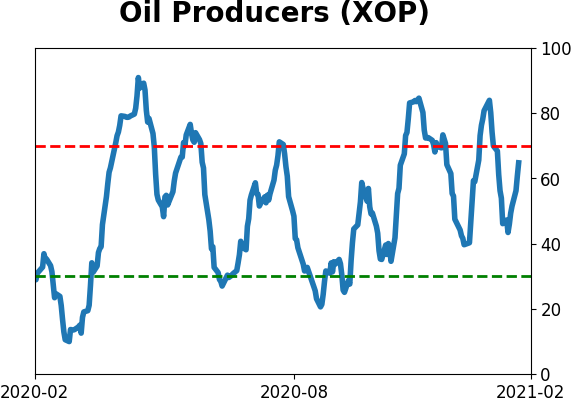
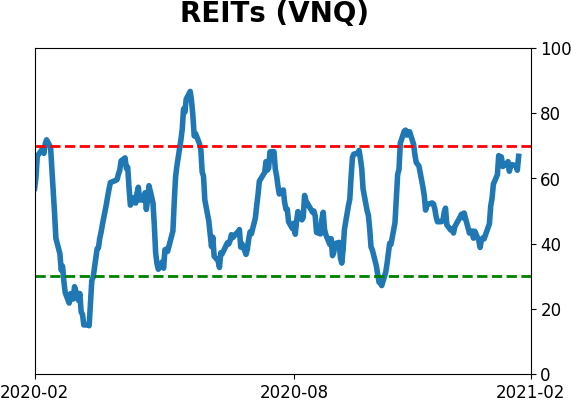
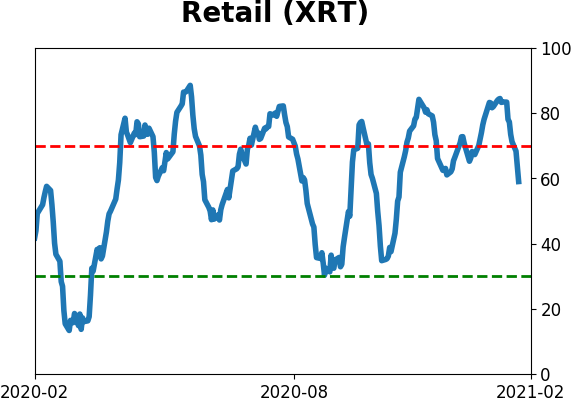
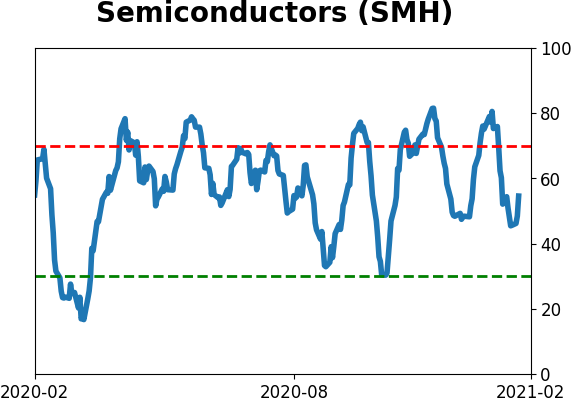
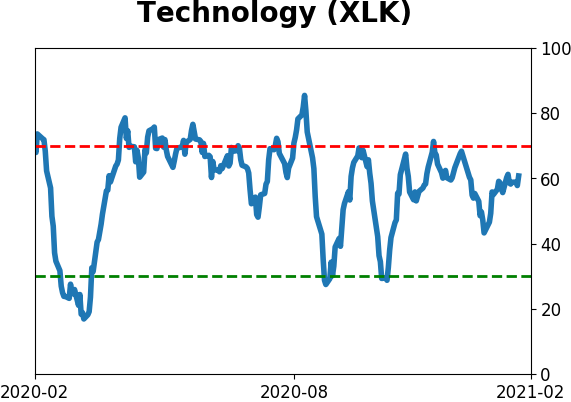
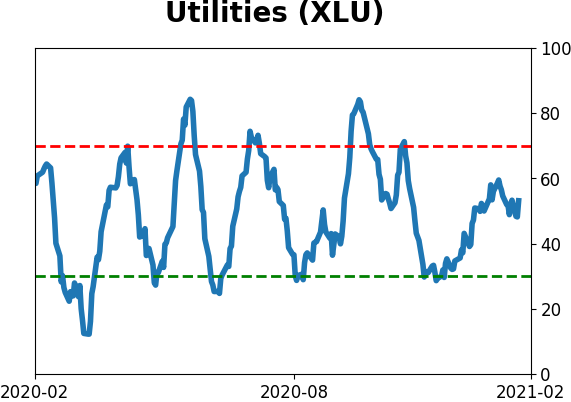
Sector ETF's - 10-Day Moving Average
|
|
|
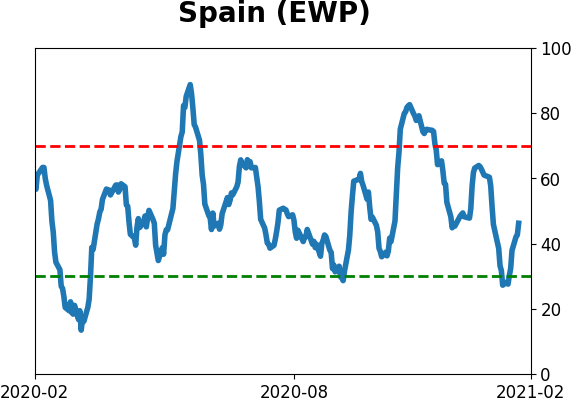
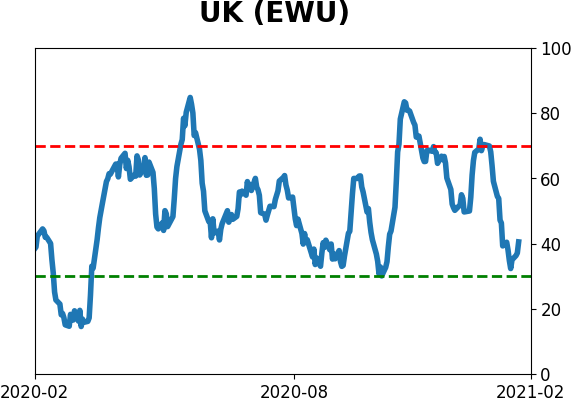
Country ETF's - 10-Day Moving Average
|
|
|
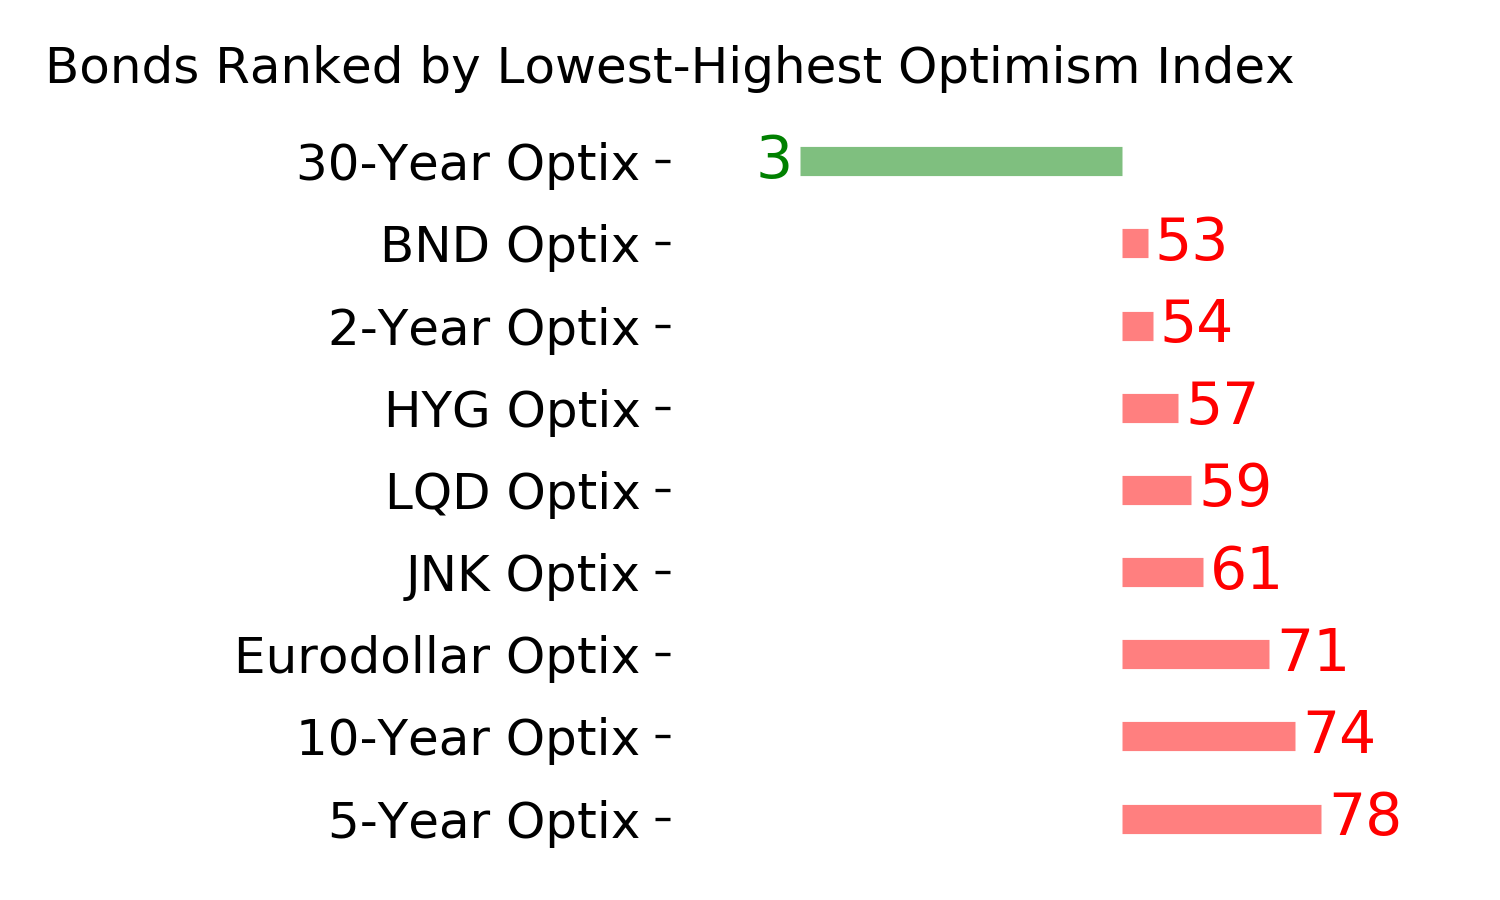
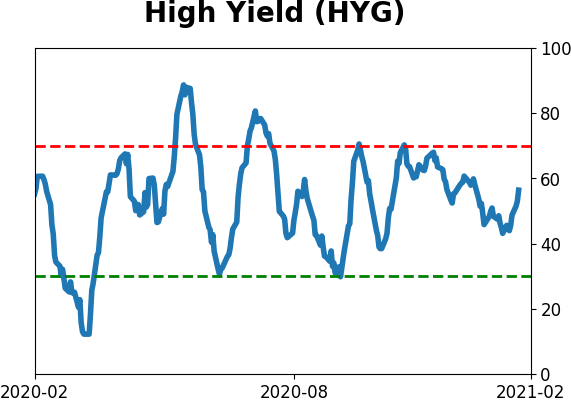
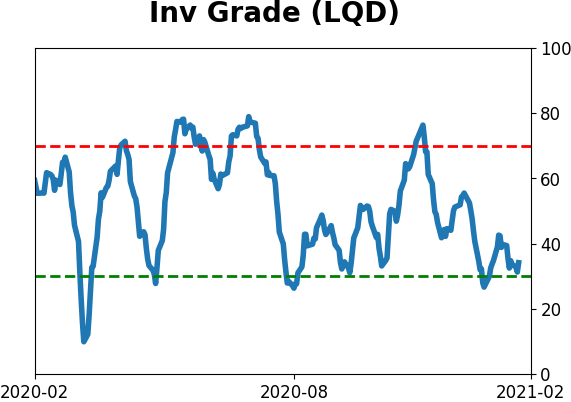
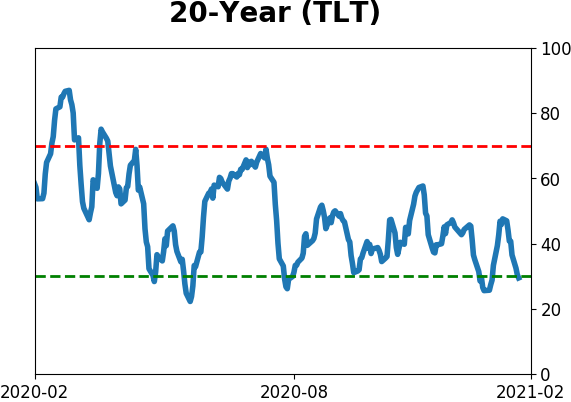
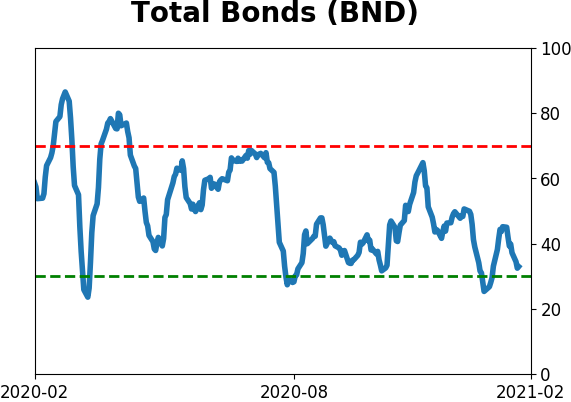
Bond ETF's - 10-Day Moving Average
|
|
|
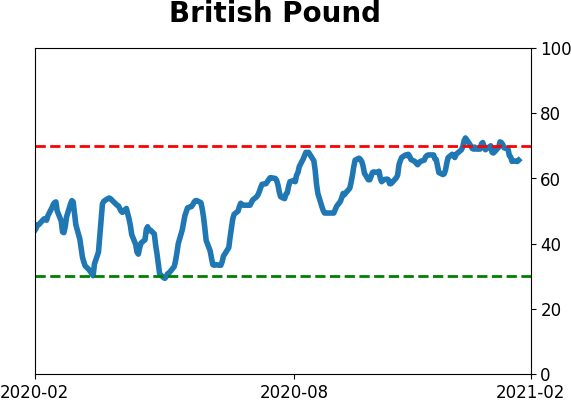
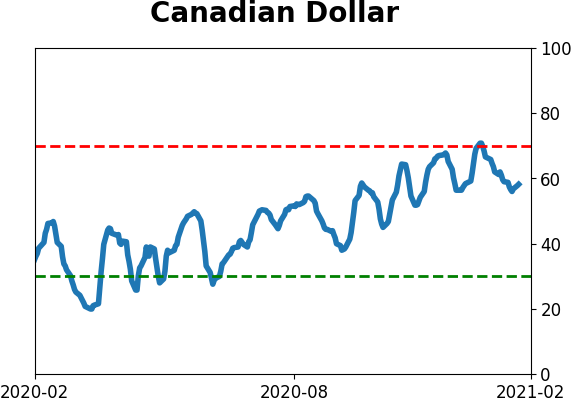
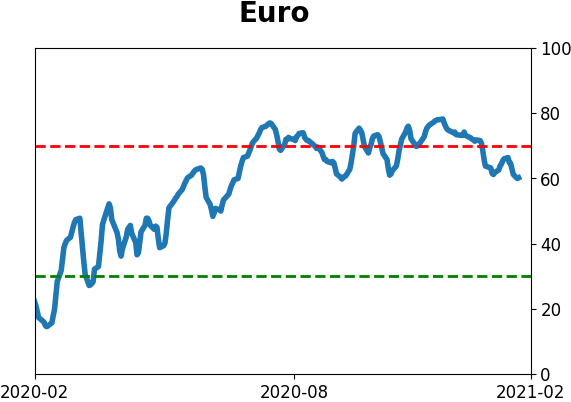
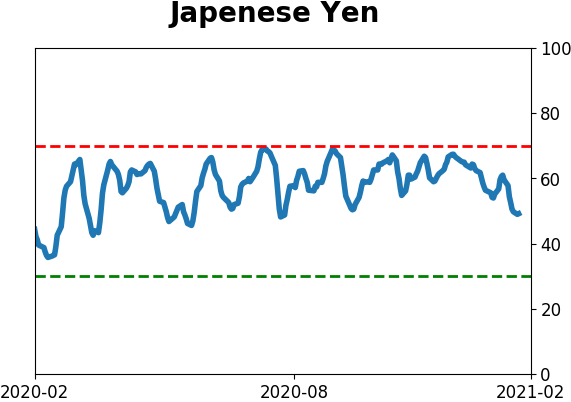
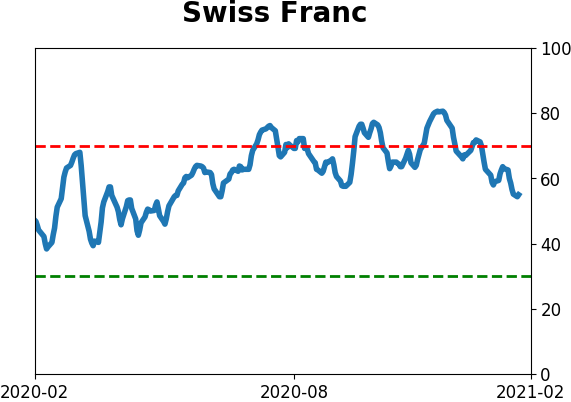
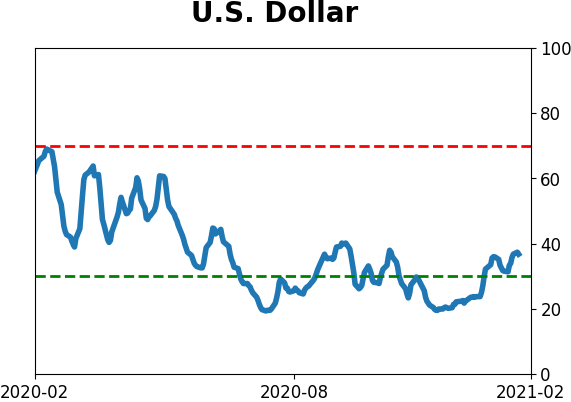
Currency ETF's - 5-Day Moving Average
|
|
|
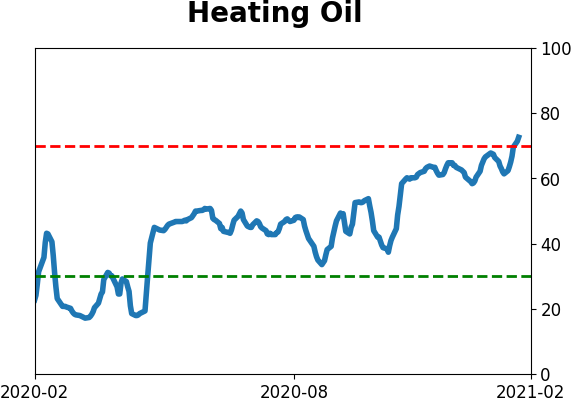
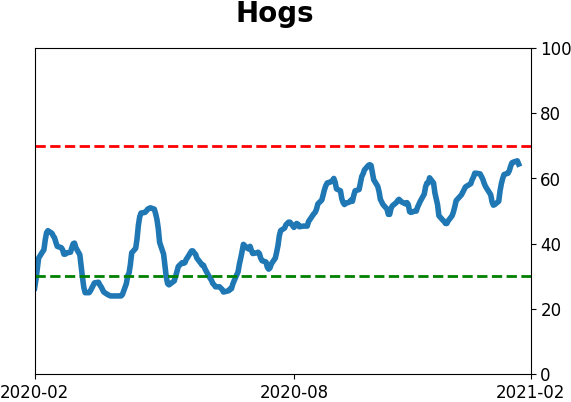
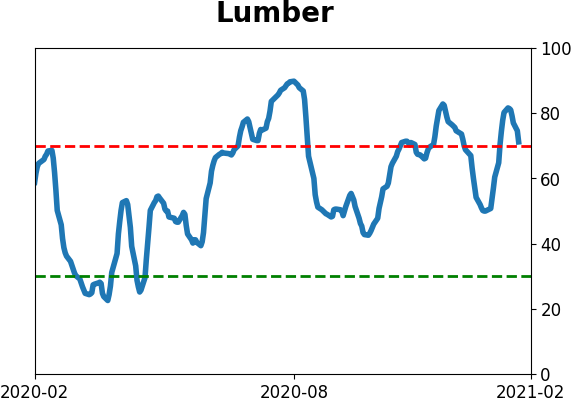
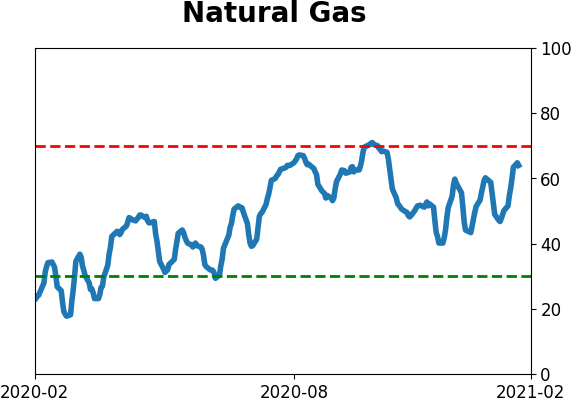
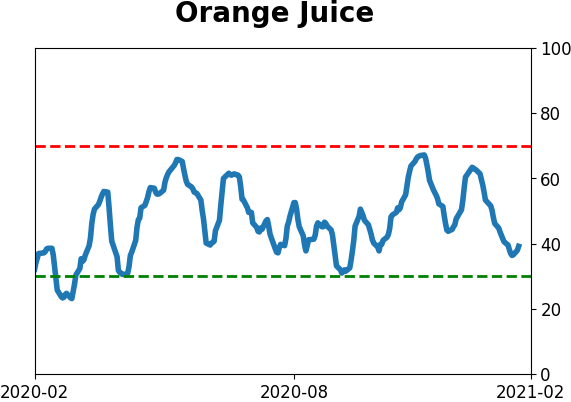
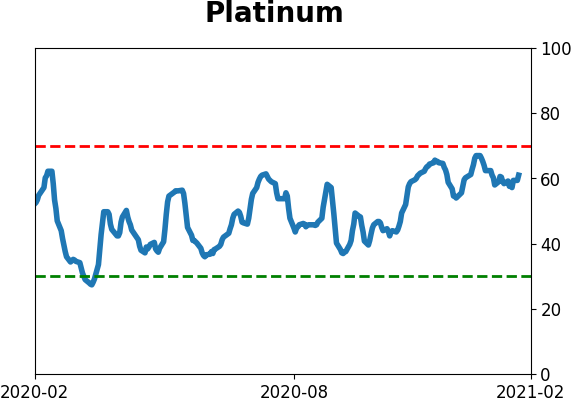
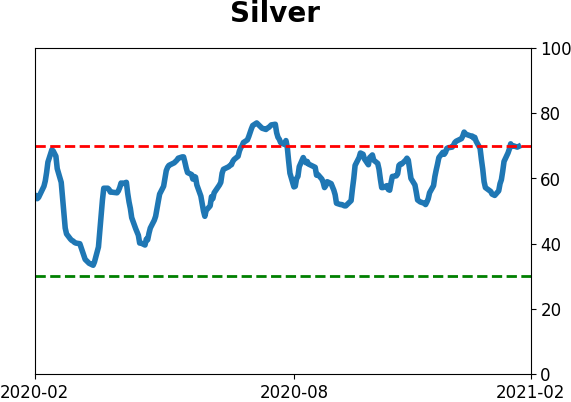
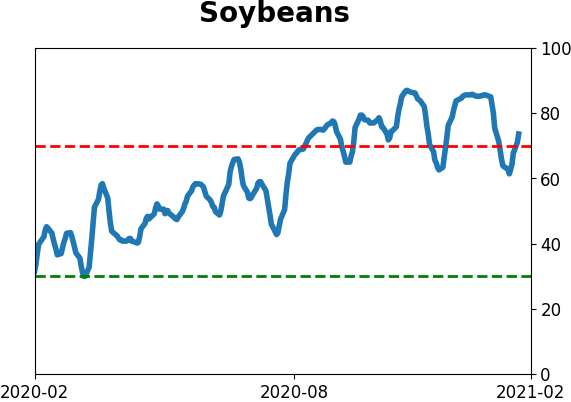
Commodity ETF's - 5-Day Moving Average
|
|