Headlines
|
|
Warning signs continue to trigger on the Nasdaq:
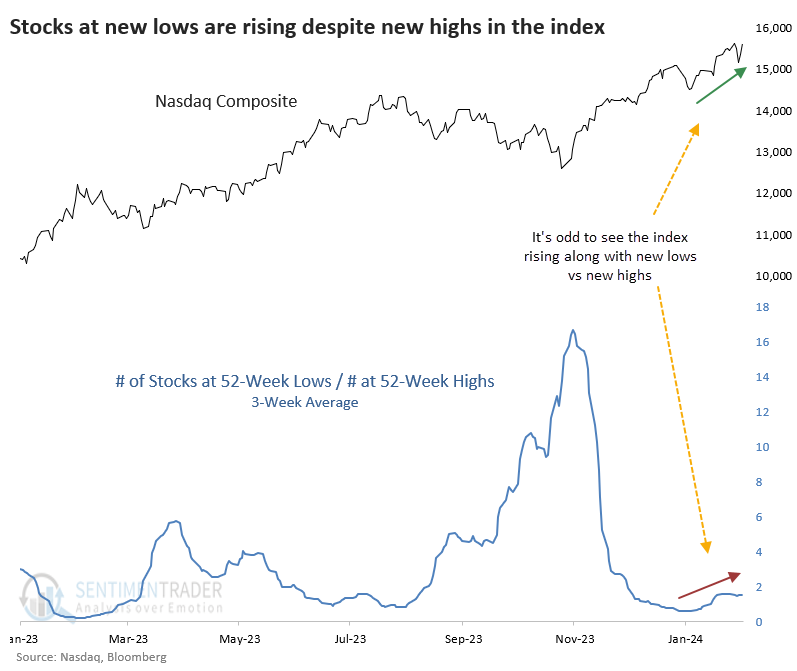
While the Nasdaq Composite has consistently hit 52-week highs over the past few weeks, more stocks have been falling to new lows than have been rising to new highs. Signs of a split market are rising, and those have had a tendency to precede poor returns for the Nasdaq and S&P.
|
Smart / Dumb Money Confidence
|
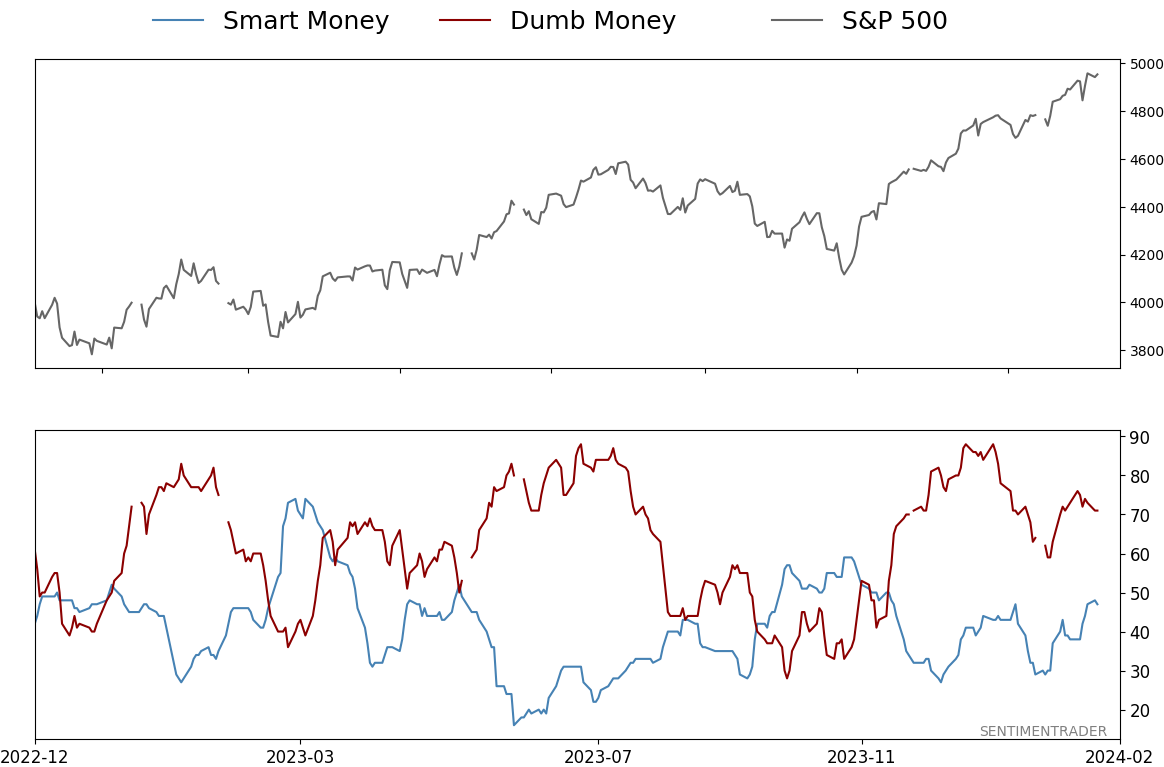
Smart Money Confidence: 47%
Dumb Money Confidence: 71%
|
|
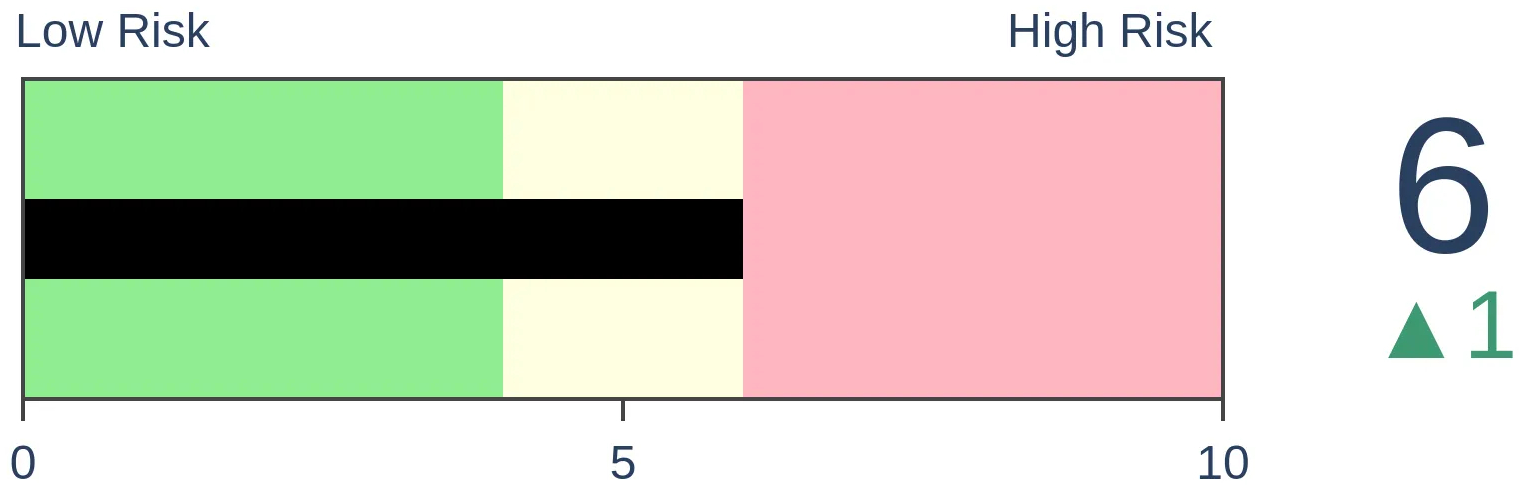
Risk Levels
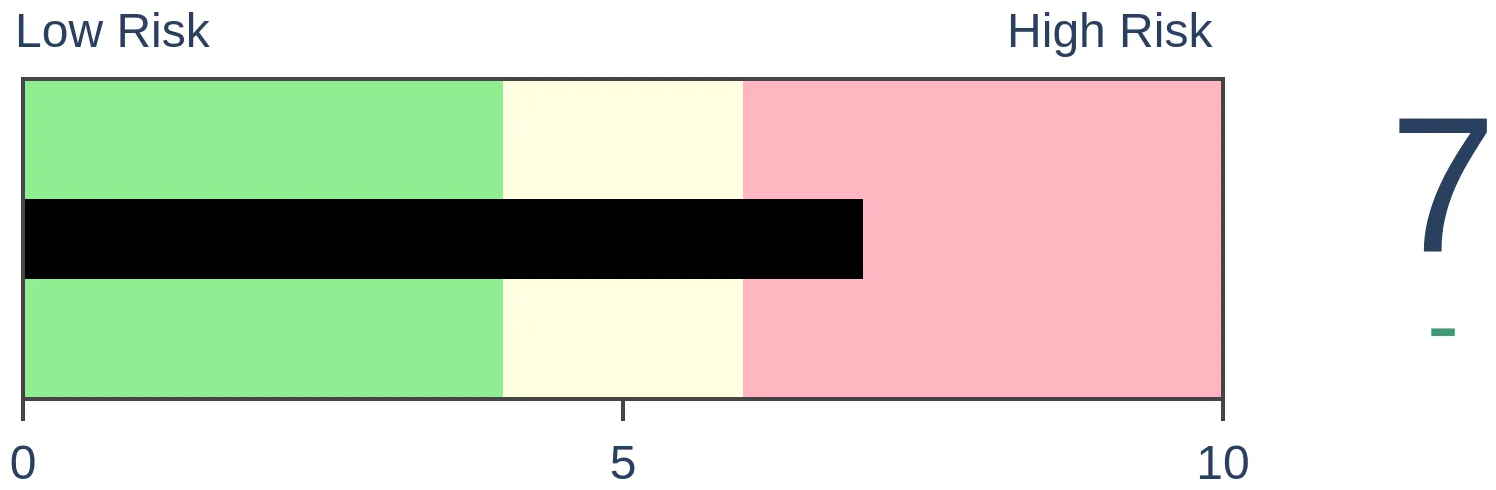
Stocks Short-Term
|
Stocks Medium-Term
|
|
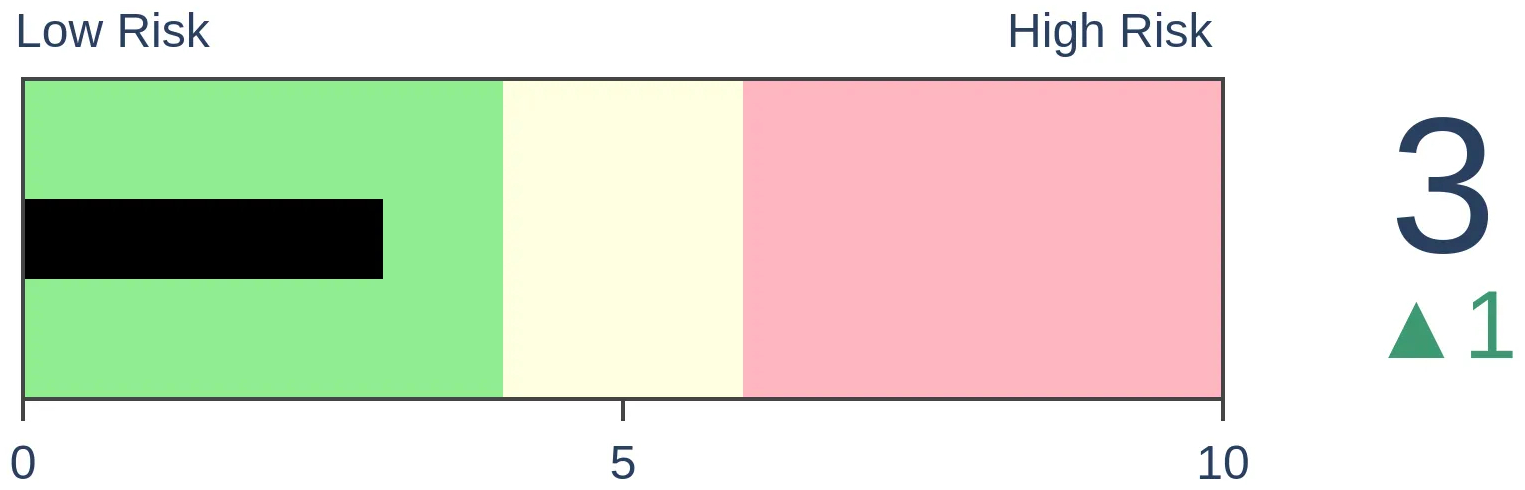
Bonds
|
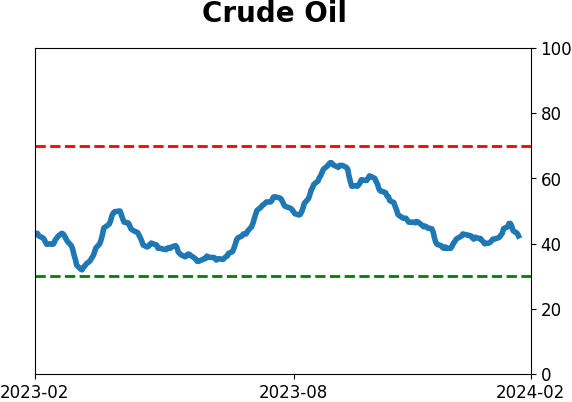
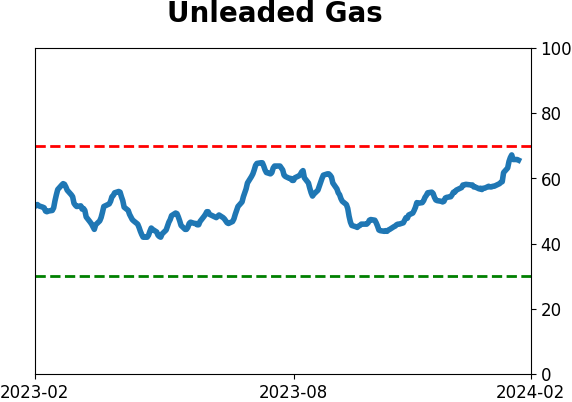
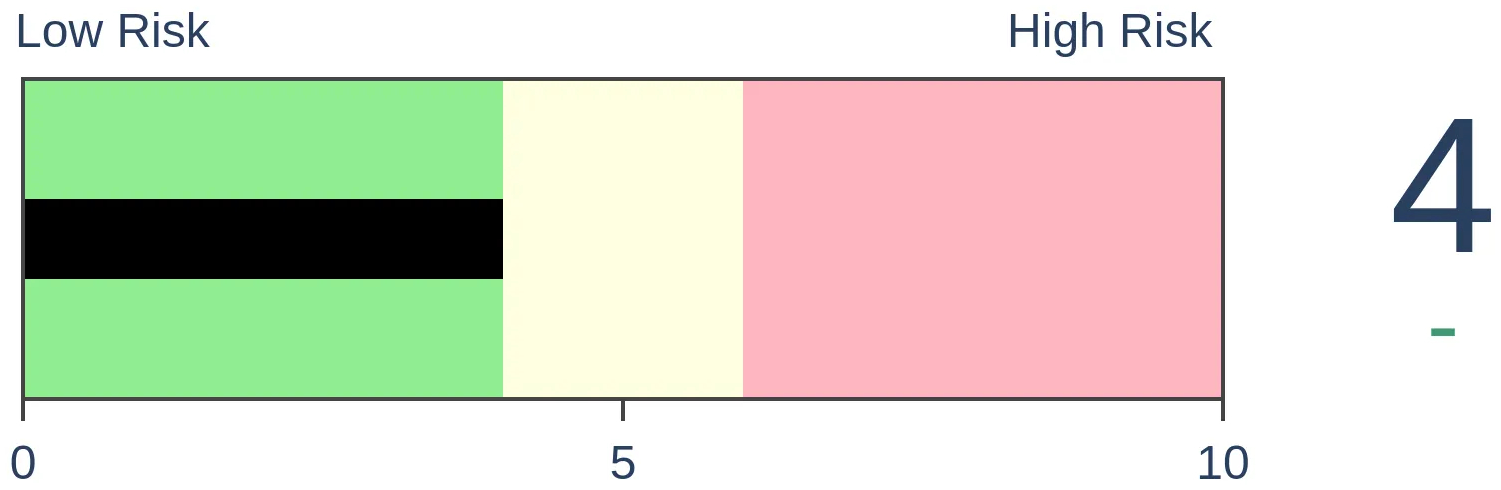
Crude Oil

|
|
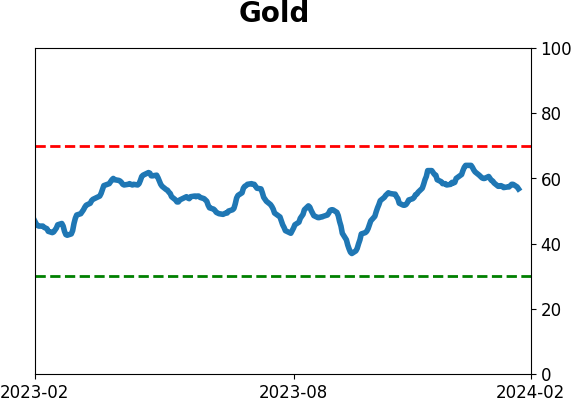
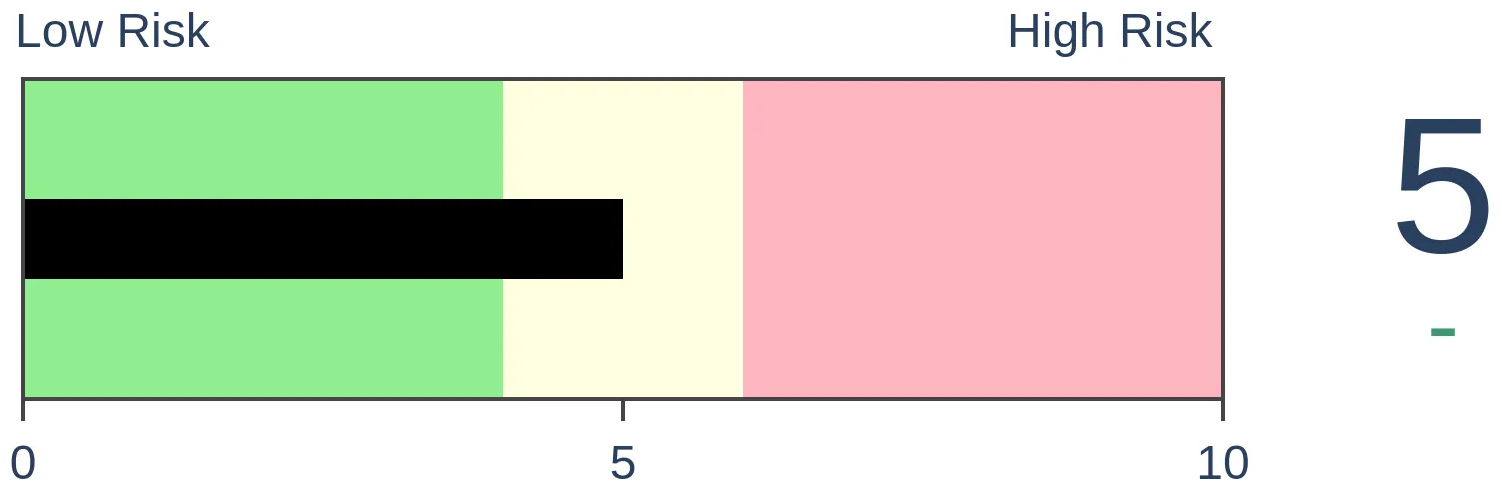
Gold
|
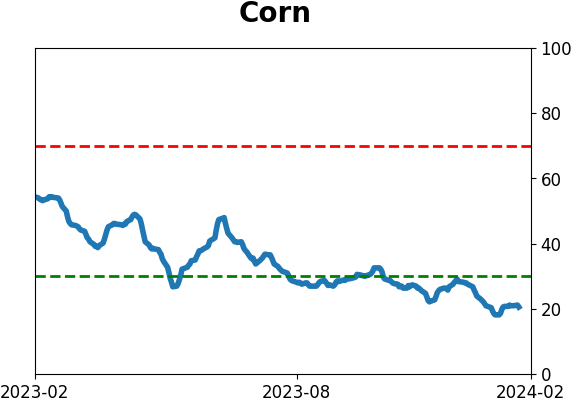
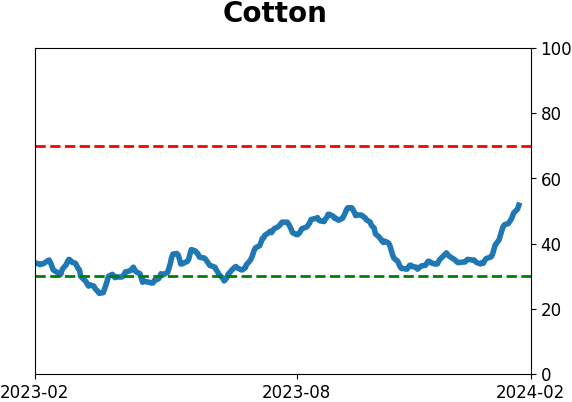
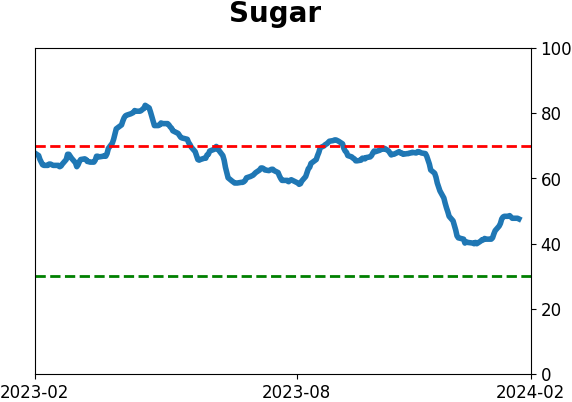
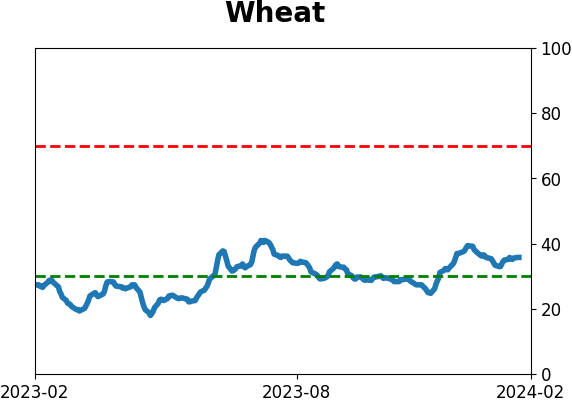
Agriculture
|
|
Research
By Jason Goepfert
BOTTOM LINE
While the Nasdaq Composite has consistently hit 52-week highs over the past few weeks, more stocks have been falling to new lows than have been rising to new highs. Signs of a split market are rising, and those have had a tendency to precede poor returns for the Nasdaq and S&P.
FORECAST / TIMEFRAME
None
|
Key points:
- Over the past three weeks, the Nasdaq has been hitting new highs, but an abnormal number of stocks are falling to new lows
- Signs of a split market are triggering on many days
- Clusters of days with split conditions have tended to lead to poor returns for the Nasdaq Composite and S&P 500
The Nasdaq is splitting again
A few times in recent weeks, we've noted nascent signs of odd behavior under the surface of superb index performance. This is really the first time since the October 2022 bottom that these issues have begun to appear with consistency.
There are more that are triggering. Due to many smaller and lower-quality stocks struggling while investors focus on spectacular gains available in some of the largest stocks, the list of securities falling to 52-week lows has been rising while 52-week highs are stagnant.
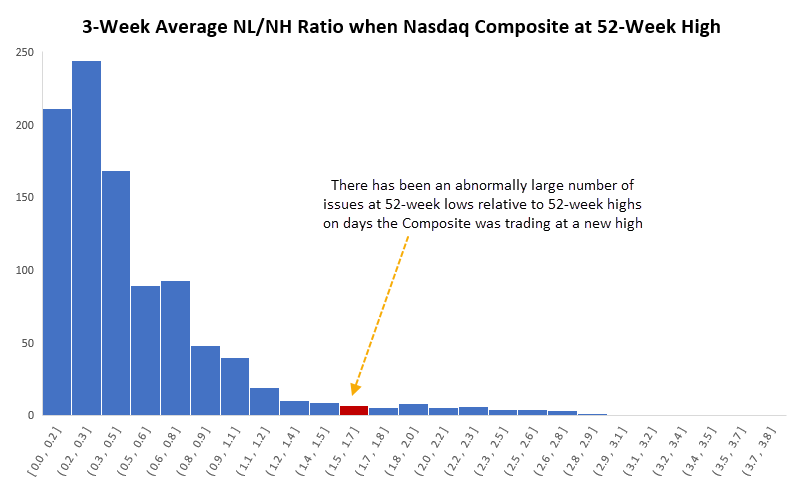
The divergence doesn't seem all that dramatic. That doesn't change the fact that it's highly unusual. Since 1990, when the Nasdaq Composite was trading at a 52-week high, there has been an average of three stocks on the Nasdaq exchange hitting a 52-week high for every stock falling to a 52-week low.
That dynamic has flipped in recent weeks, with many days recording more stocks at lows than highs. This pushes the current environment way out on a histogram.
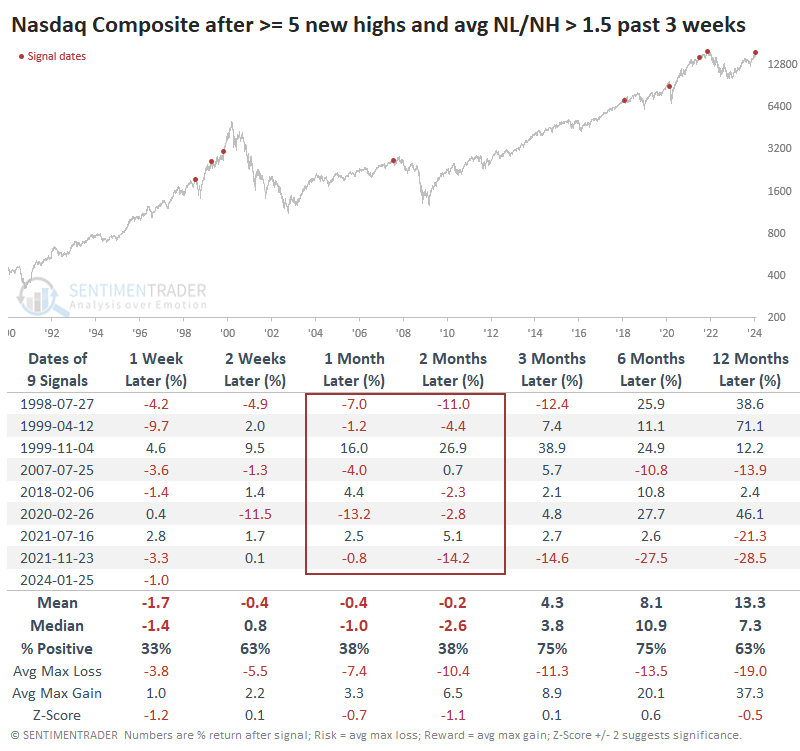
When this happened in 1999, the Nasdaq rocketed higher, jumping nearly 40% over the next few months before the bubble was pricked. But other than that, these conditions tended to precede weak returns.
The table below shows returns in the Nasdaq composite after it closed at a 52-week high at least five times over the past three weeks, while the average ratio of stocks at new lows versus new highs averaged more than 1.5. In other words, the Composite was consistently hitting new highs, but there were half again more stocks on the exchange falling to 52-week lows than rising to 52-week highs.
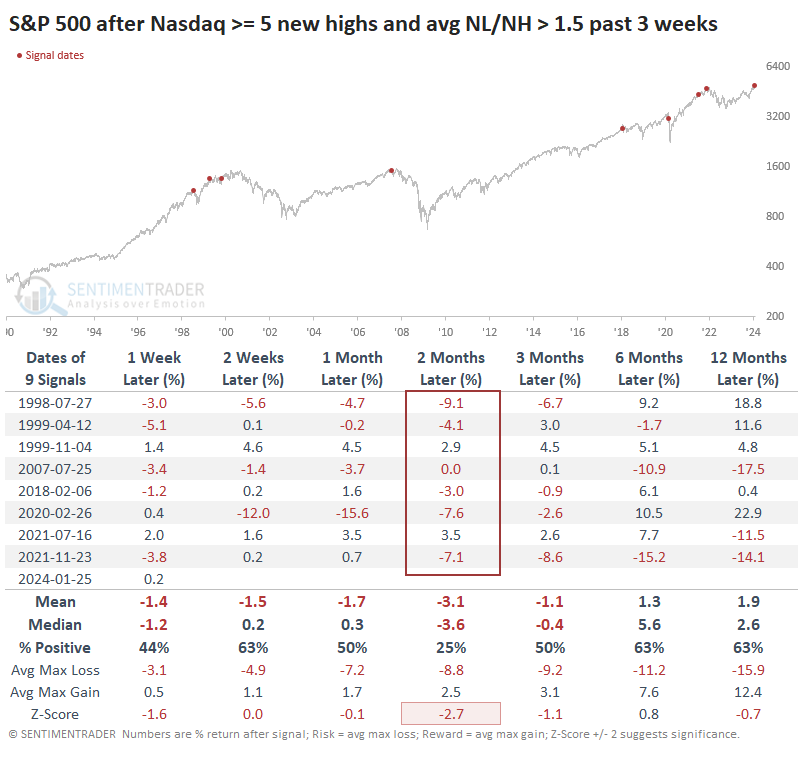
The S&P 500 didn't enjoy quite the upside in 1999, so its returns after these signals on the Nasdaq were even worse. Over the next two months, it managed to show a positive return only twice.
Other technical warnings are triggering
Since a relatively large number of stocks have hit new lows or new highs on any given day, the 50-day average of the HiLo Logic Index has spiked. It's now the highest in over 20 years, indicating a split market that indicates unhealthy market conditions.

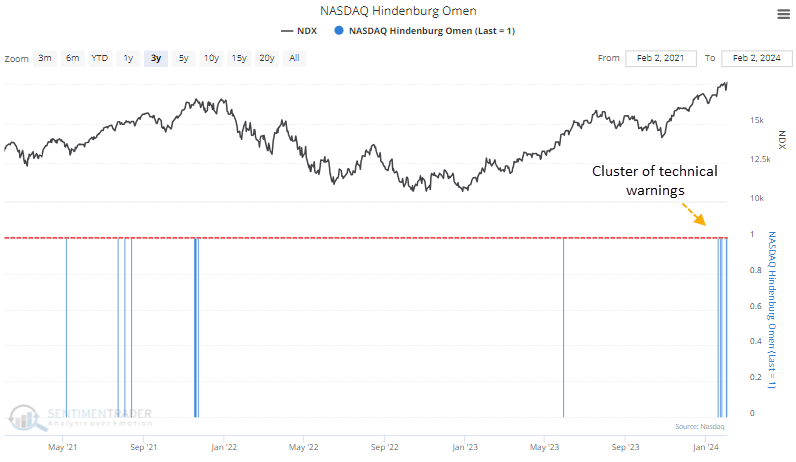
Some conditions are starting to resemble what we looked at in August 2021. There has now been a cluster of Hindenburg Omen technical warnings on the Nasdaq.
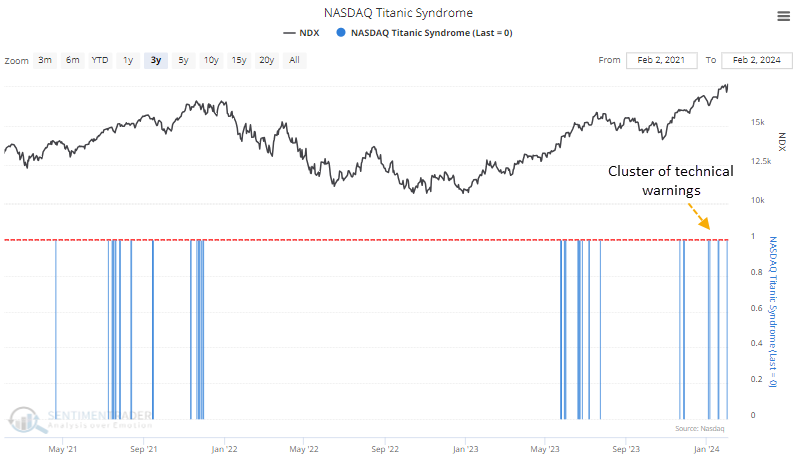
Same for the Titanic Syndrome warning signs.
What the research tells us...
Since October 2022, we've looked at a lot (a lot!) of supposed warning signs from financial and social media, analysts, and pundits. Not many, if any, showed a consistent predictive ability. Stocks continued to do what they should, given all the studies we looked at that summer and fall, and we couldn't find any reliably good reasons to doubt why they couldn't continue to follow through.
For the first time, that's starting to change. While momentum in the indexes has been fabulous, and breakouts to new highs tend to lead to even more new highs, we are seeing some deterioration under the surface that begs attention. It's not a glaring red light yet, but it's certainly yellow, particularly on the Nasdaq. That exchange is stuffed with more speculative issues, many of which are struggling. It's to a point now where it suggests a prudent swing trader snug up stop losses if they are fortunate enough to have long exposure to tech-heavy indexes.
Indicators at Extremes
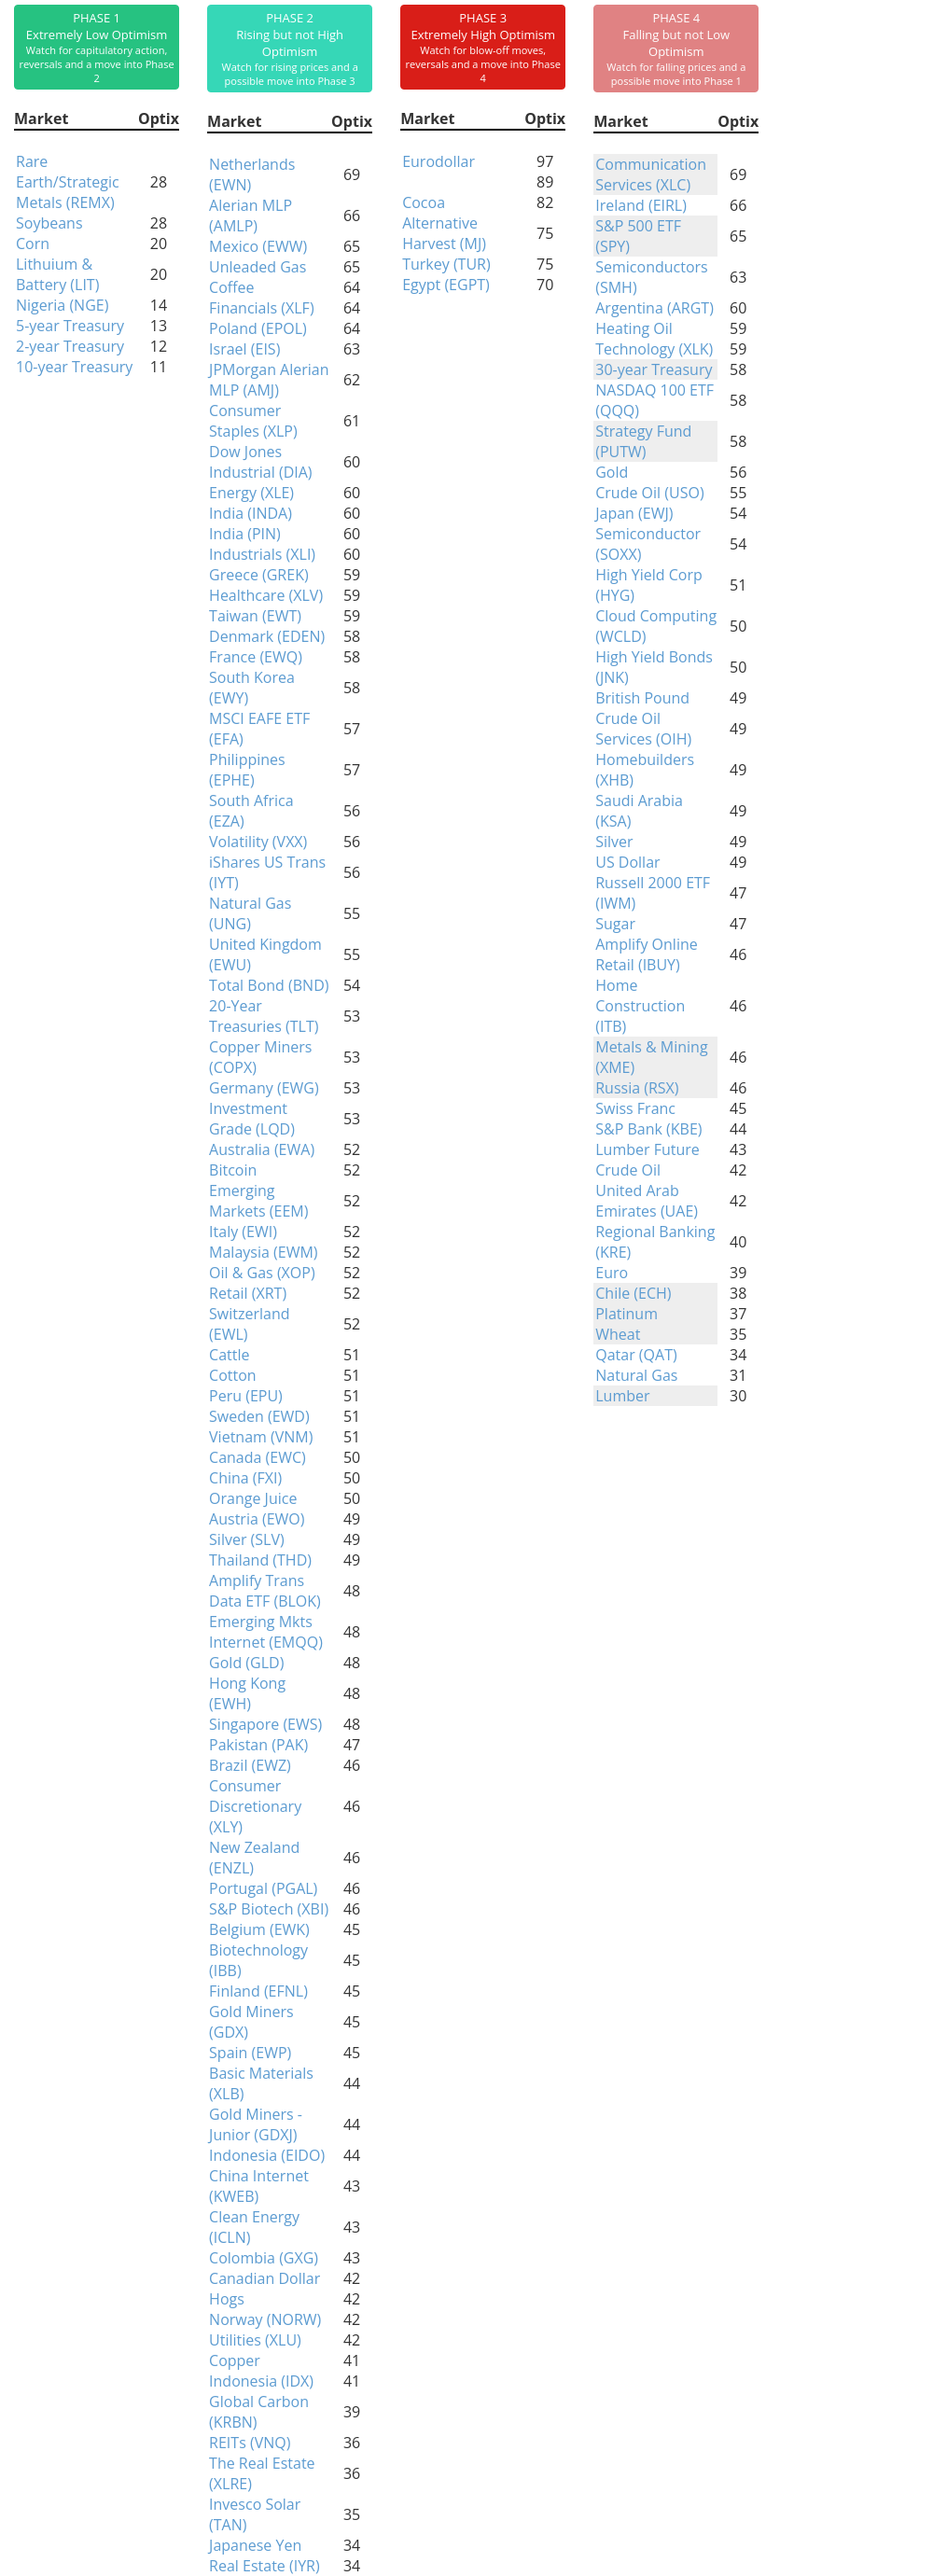
Phase Table
Ranks
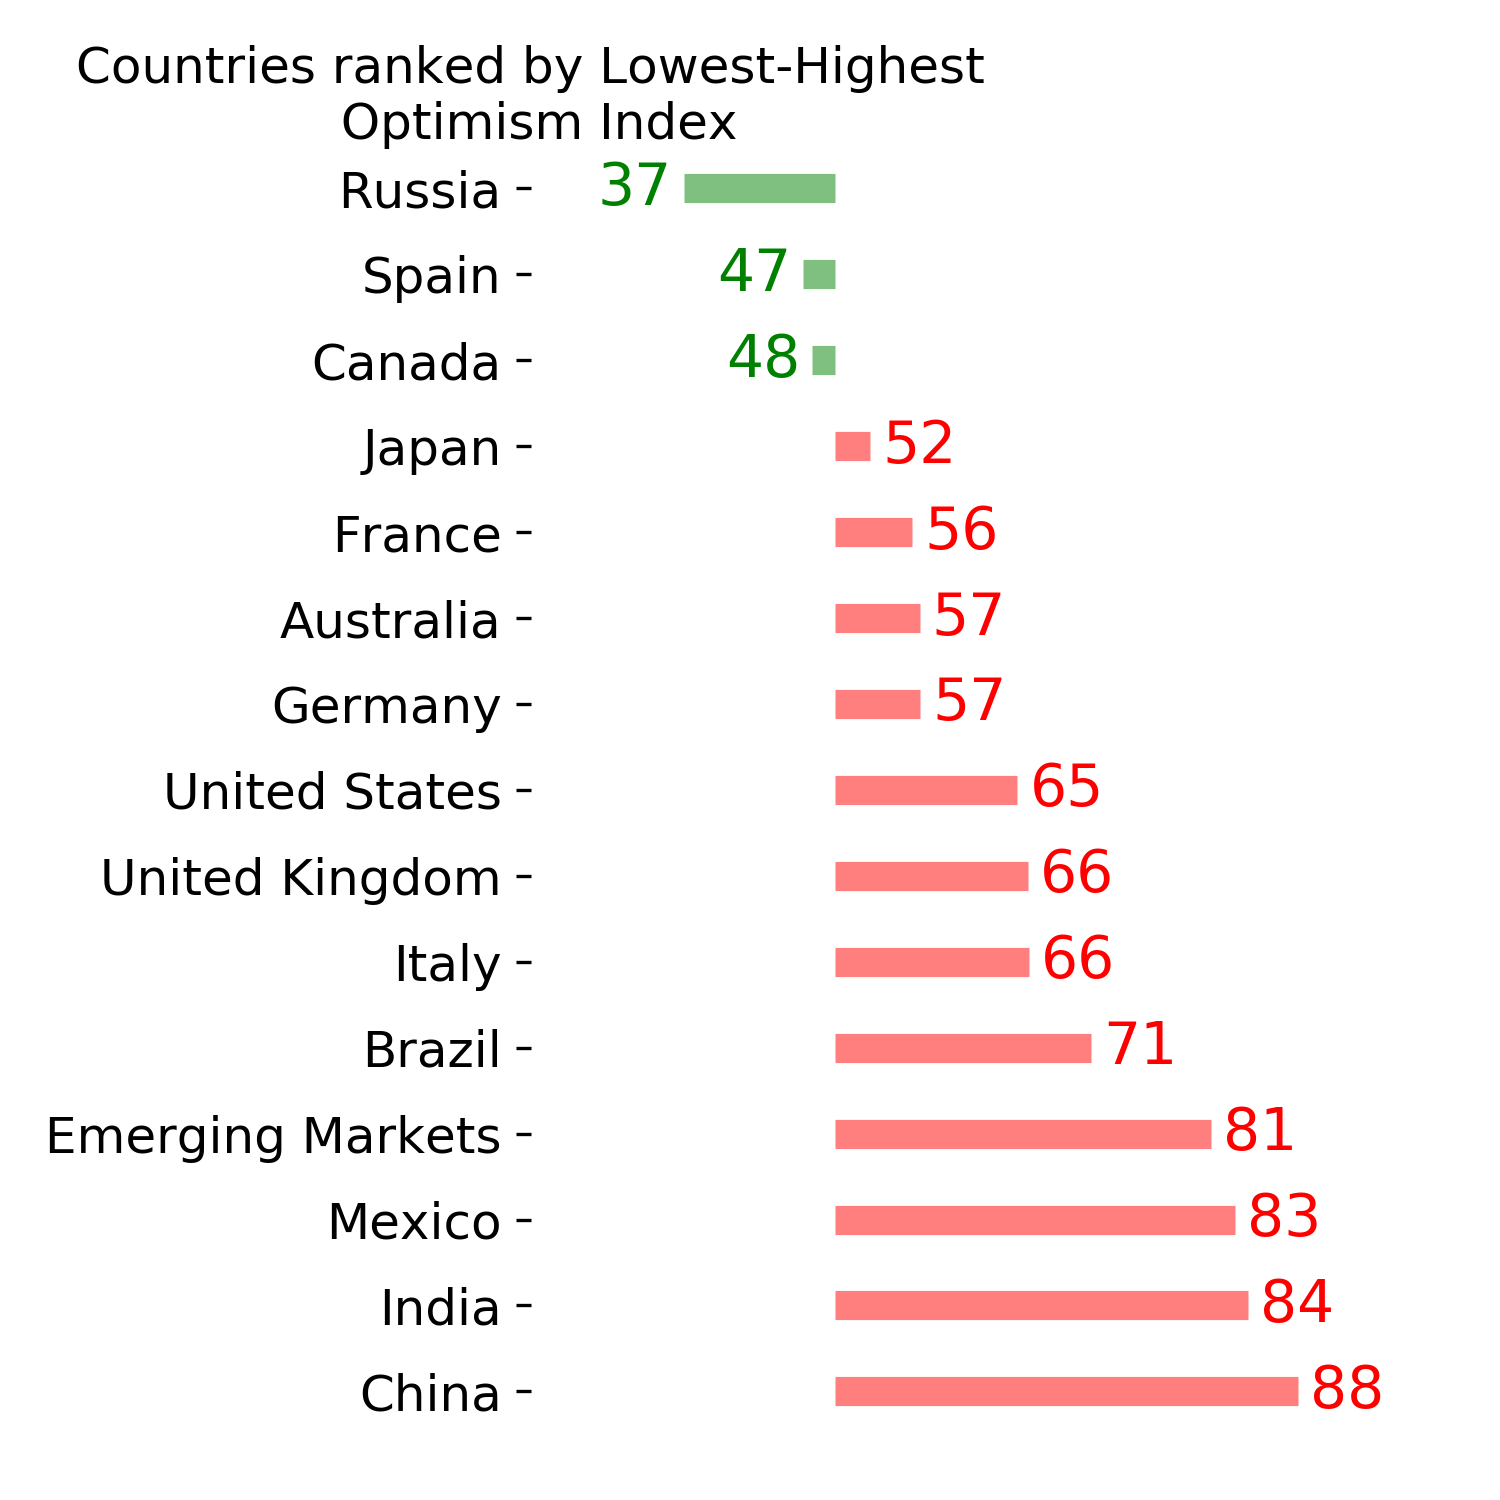
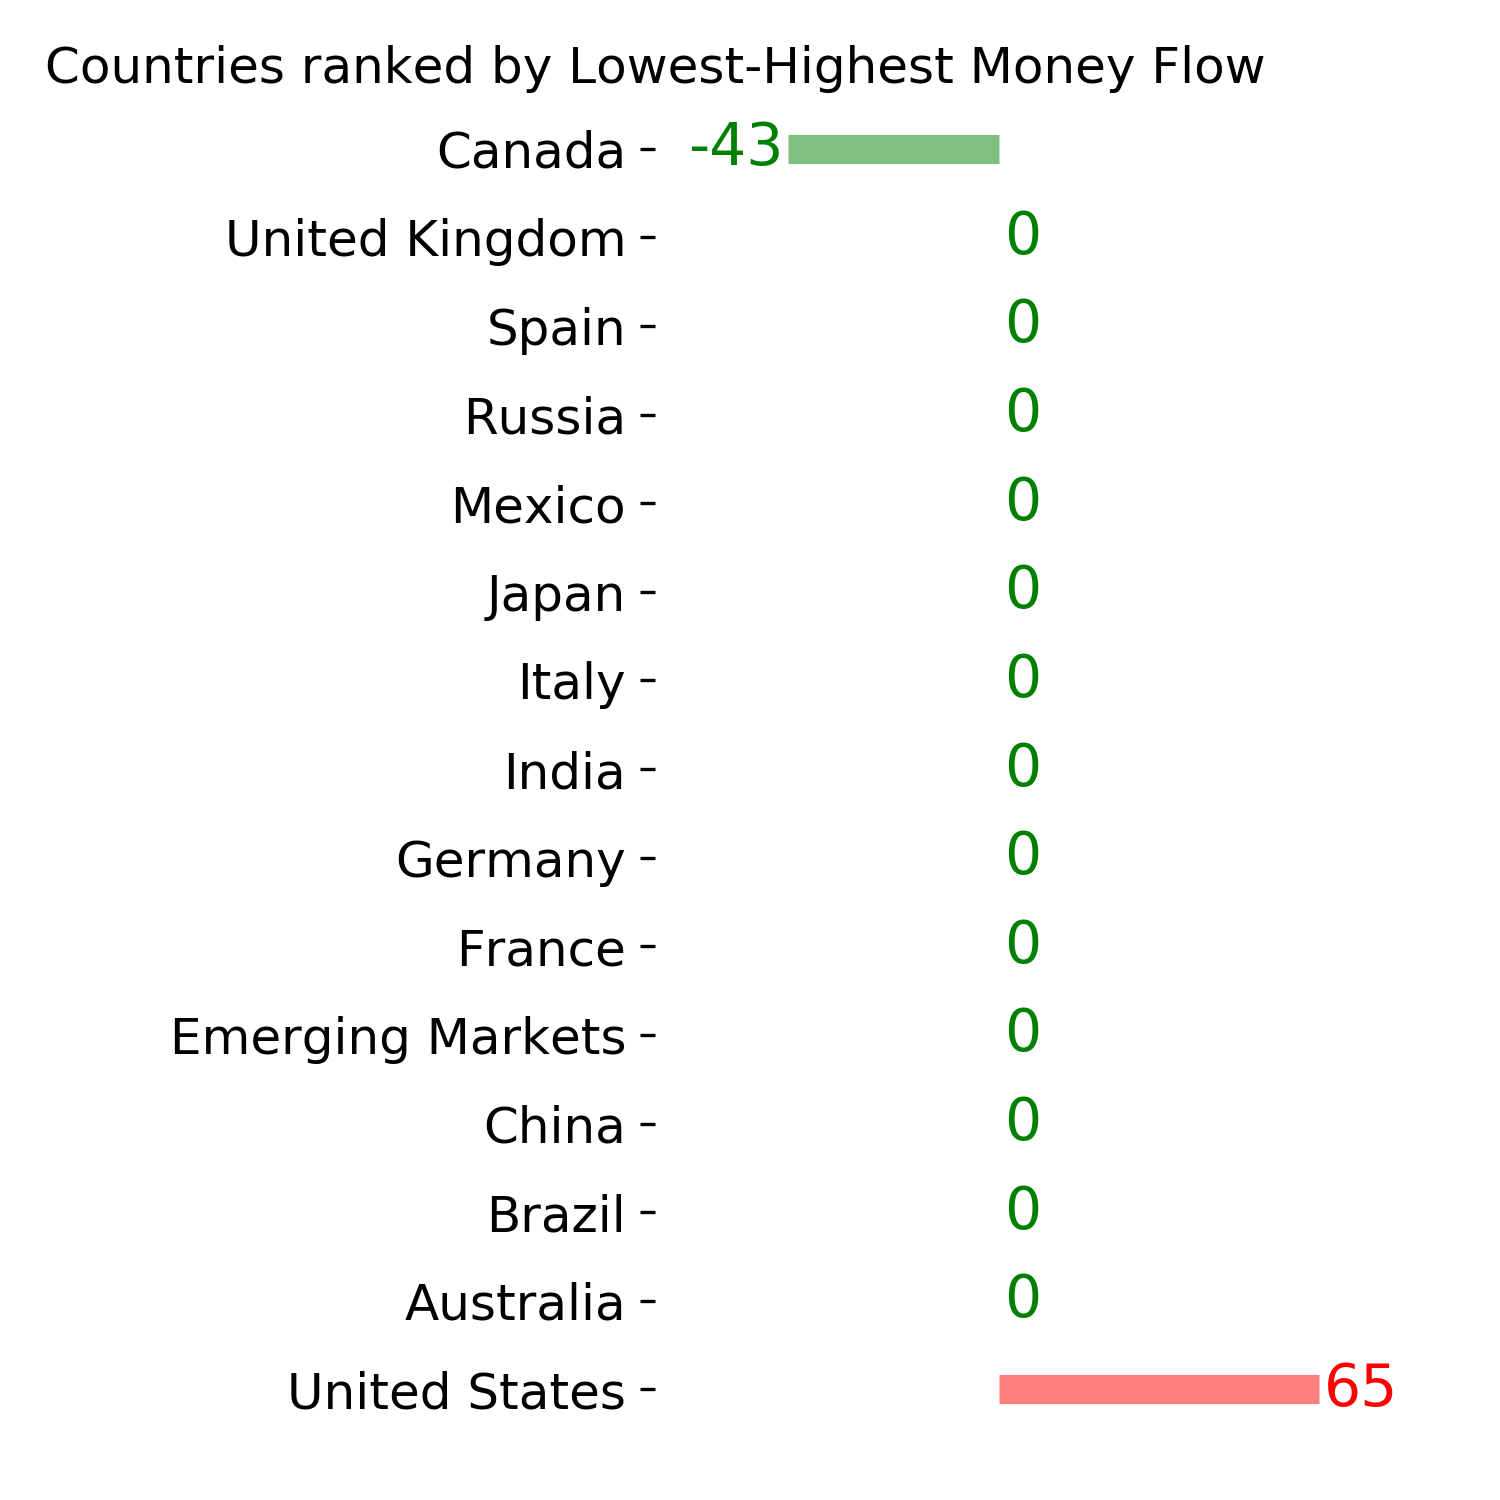
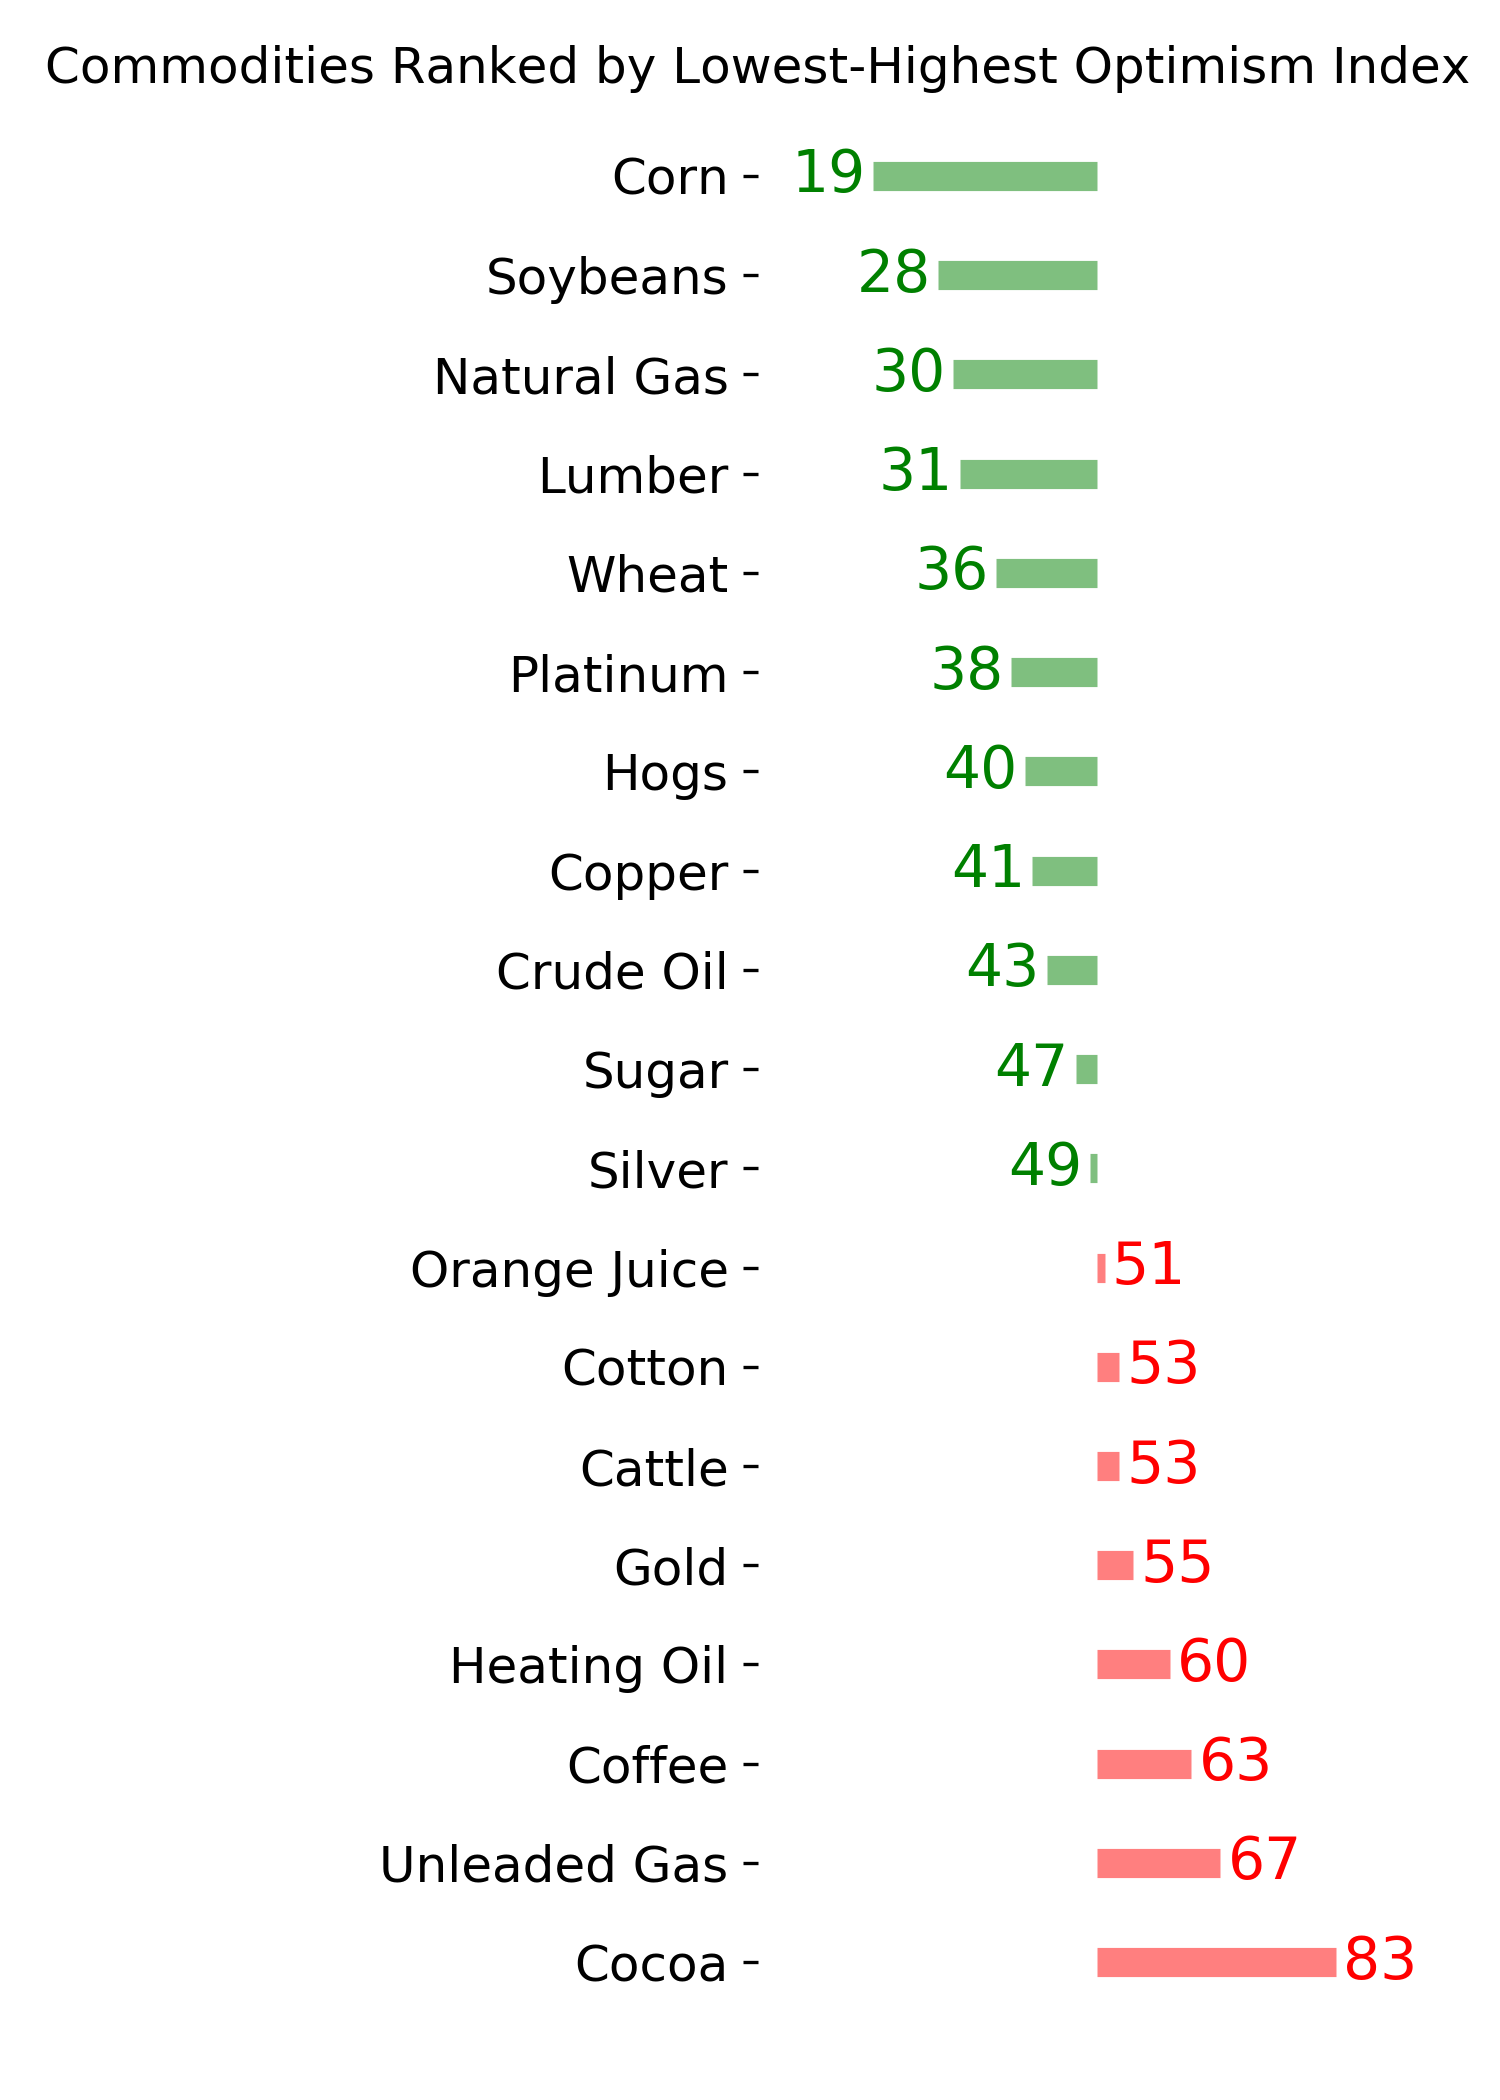
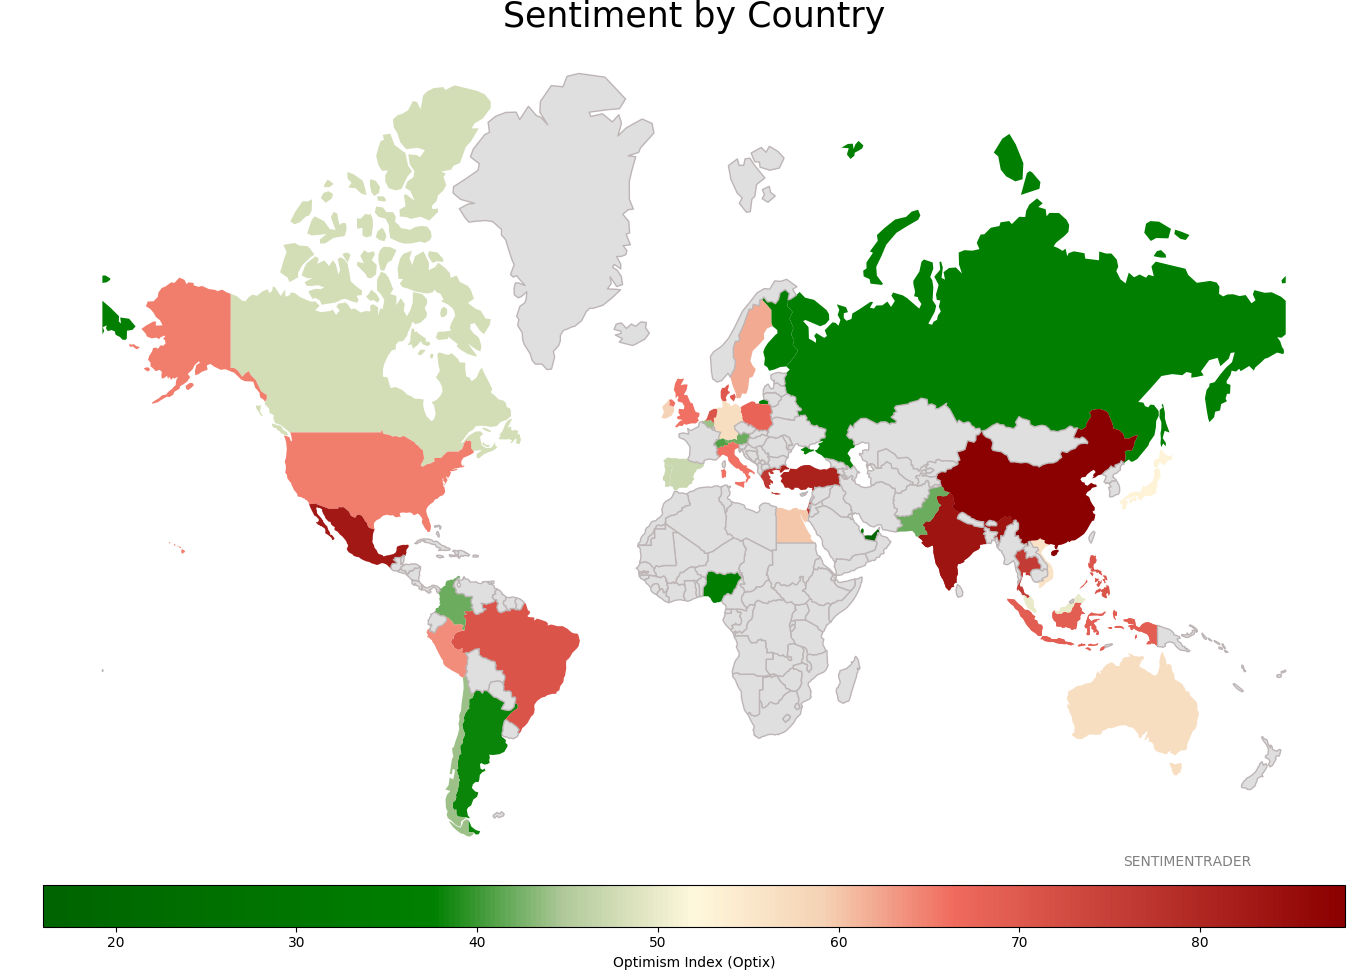
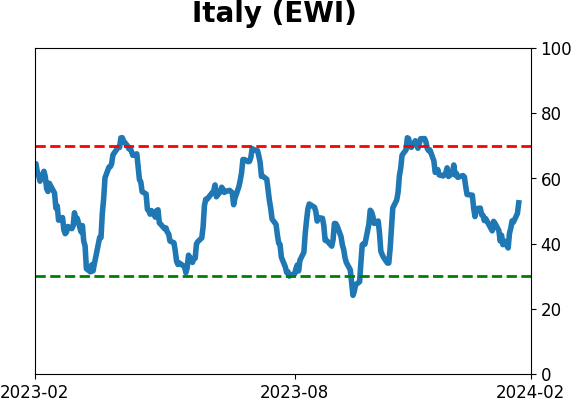
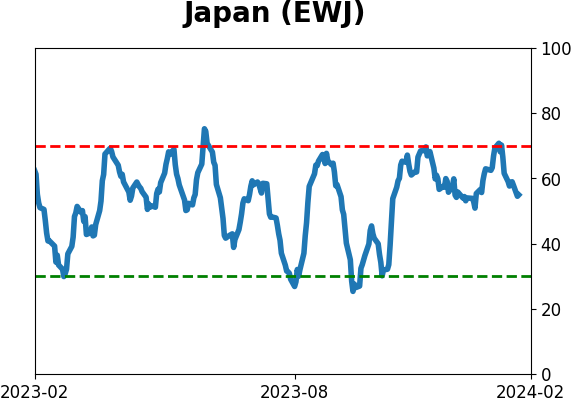
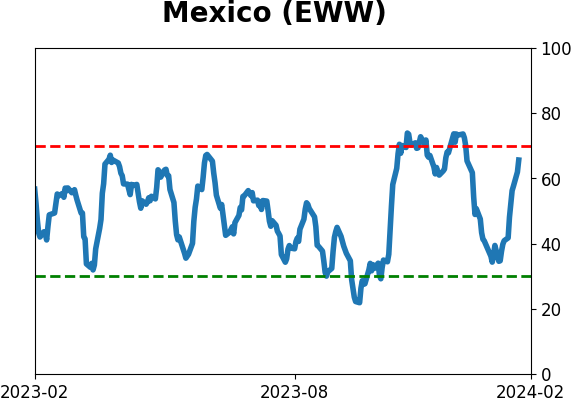
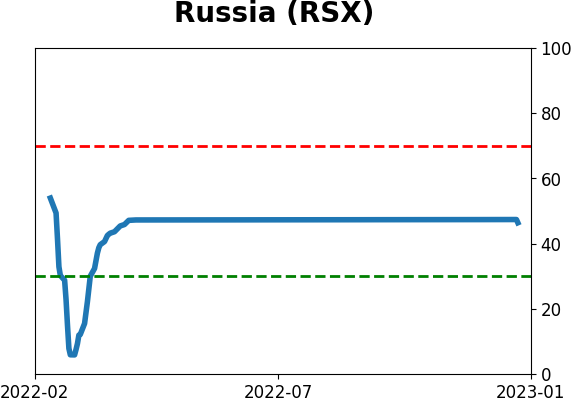
Sentiment Around The World
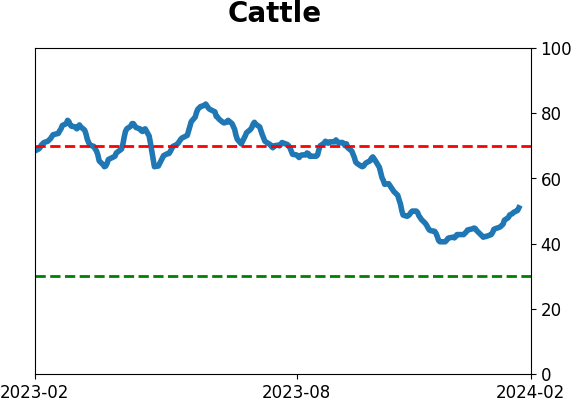
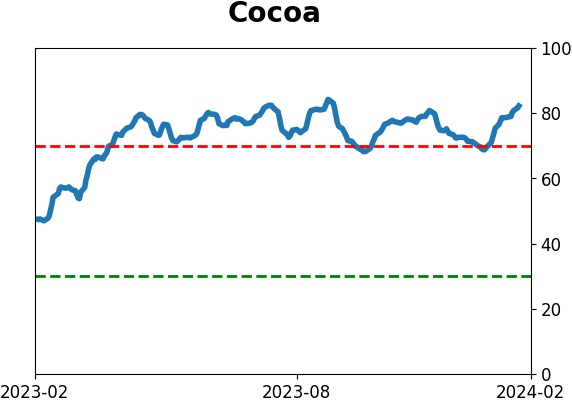
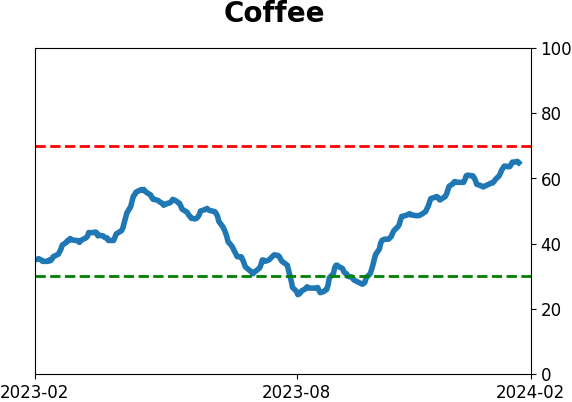
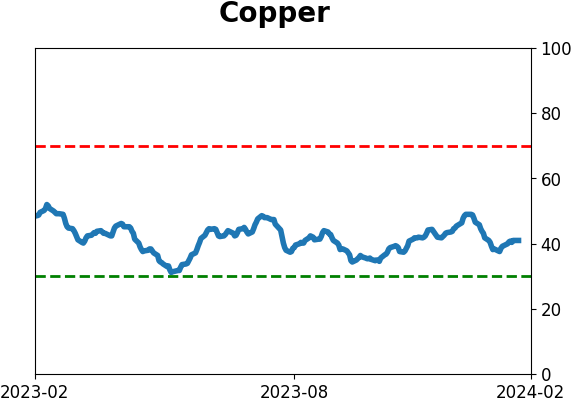
Optimism Index Thumbnails
|
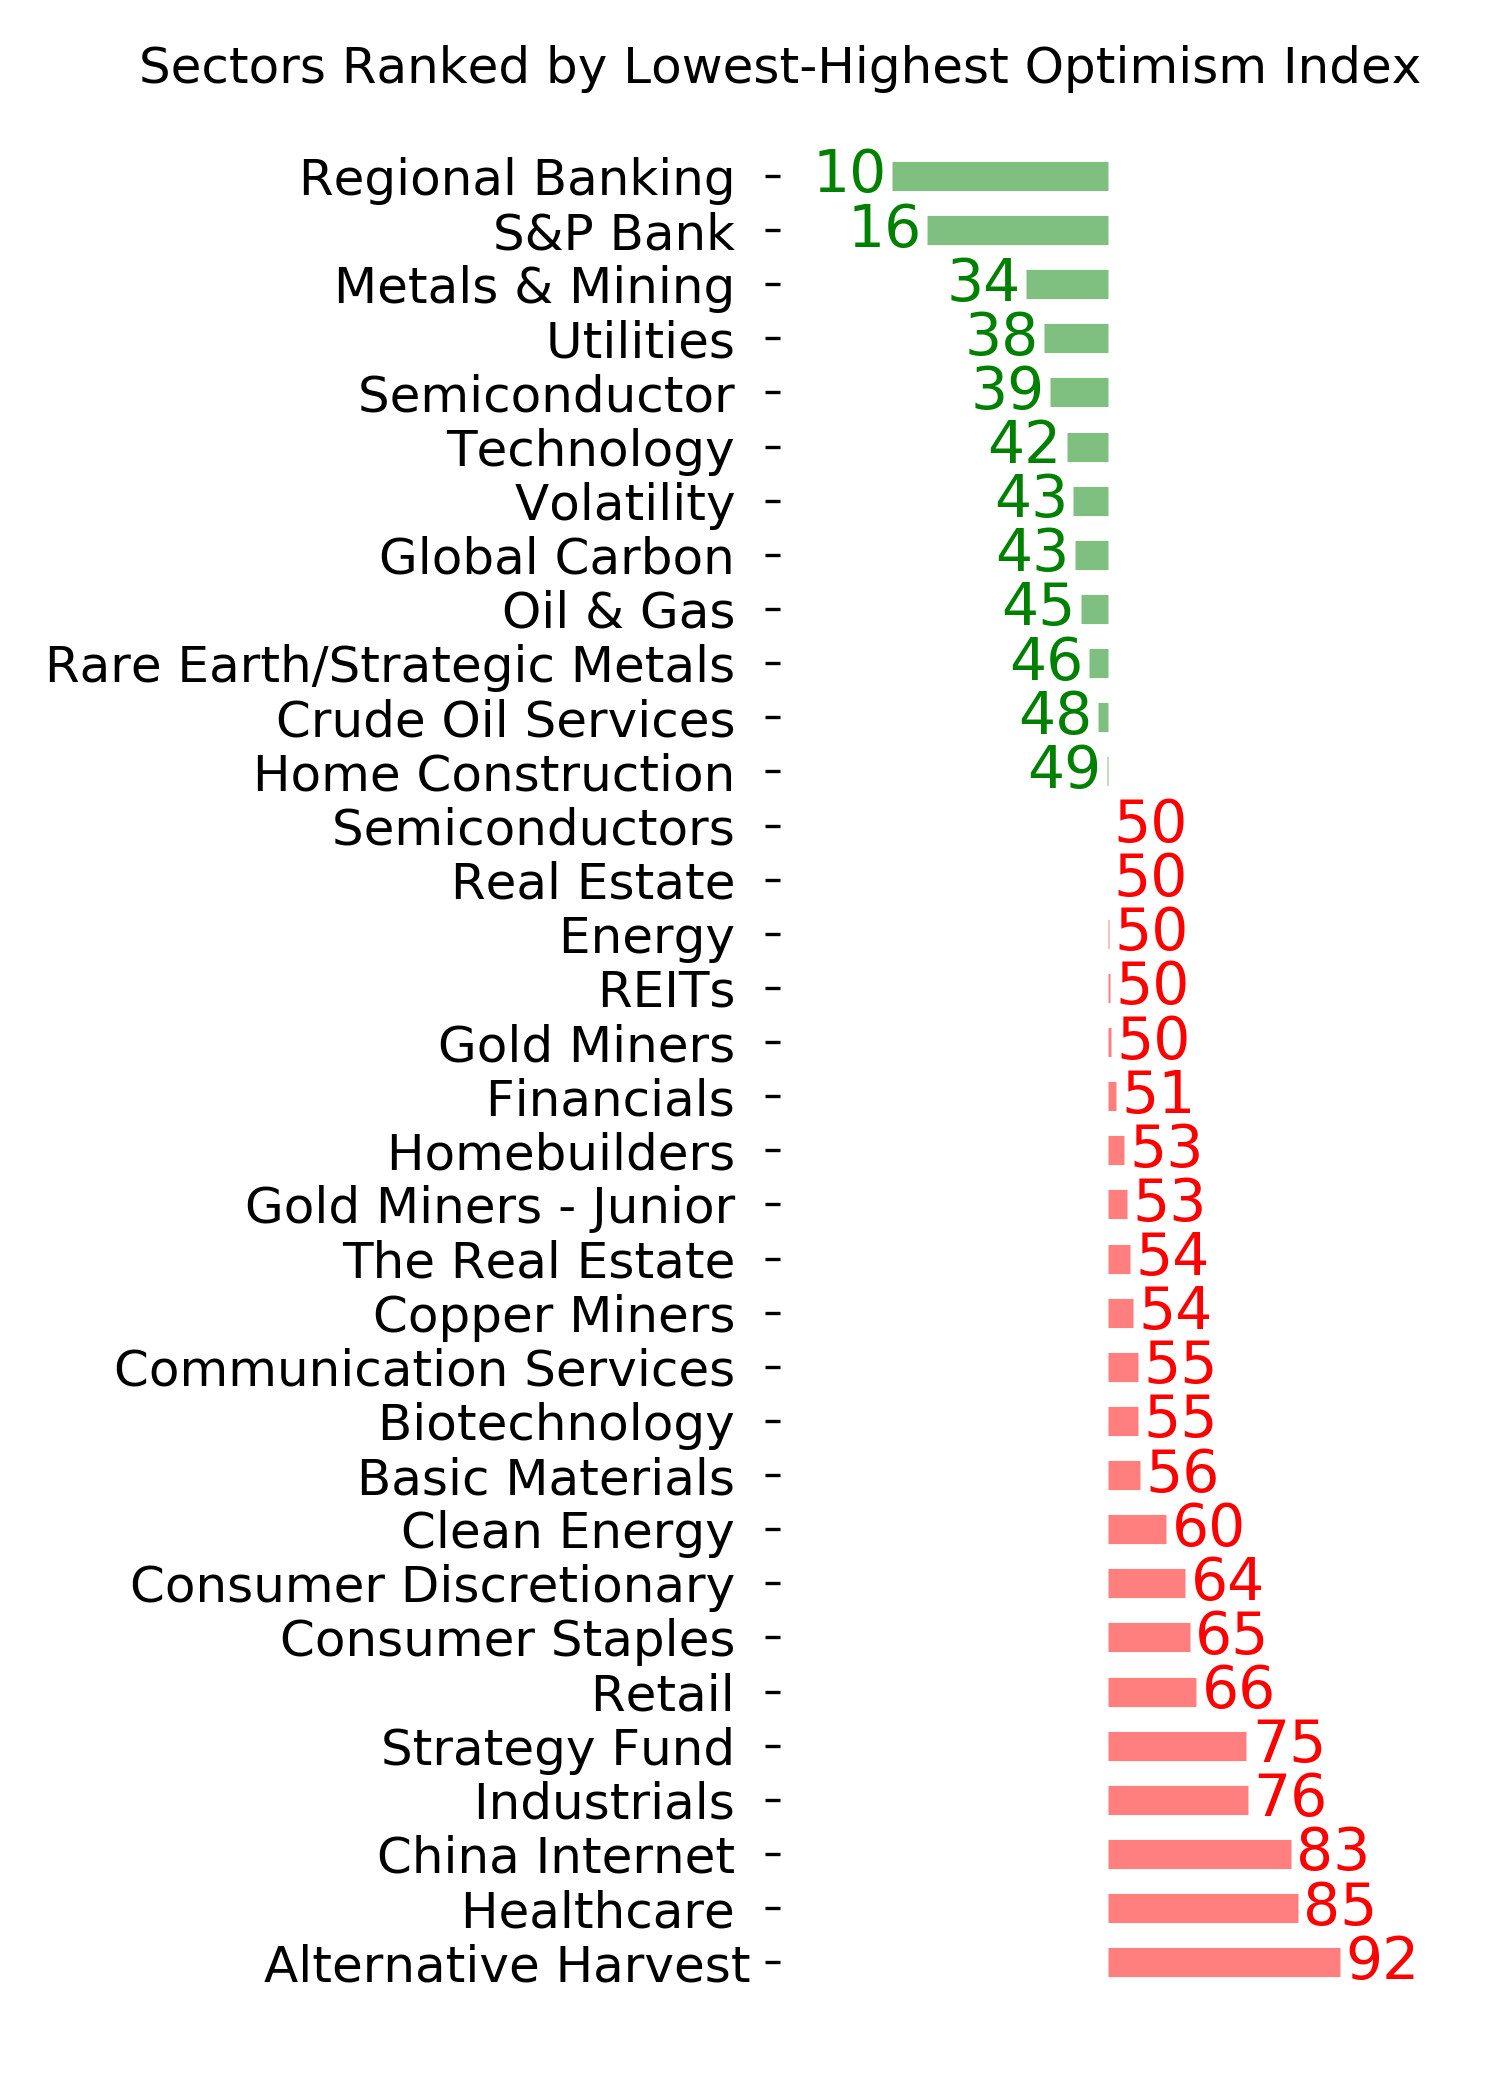
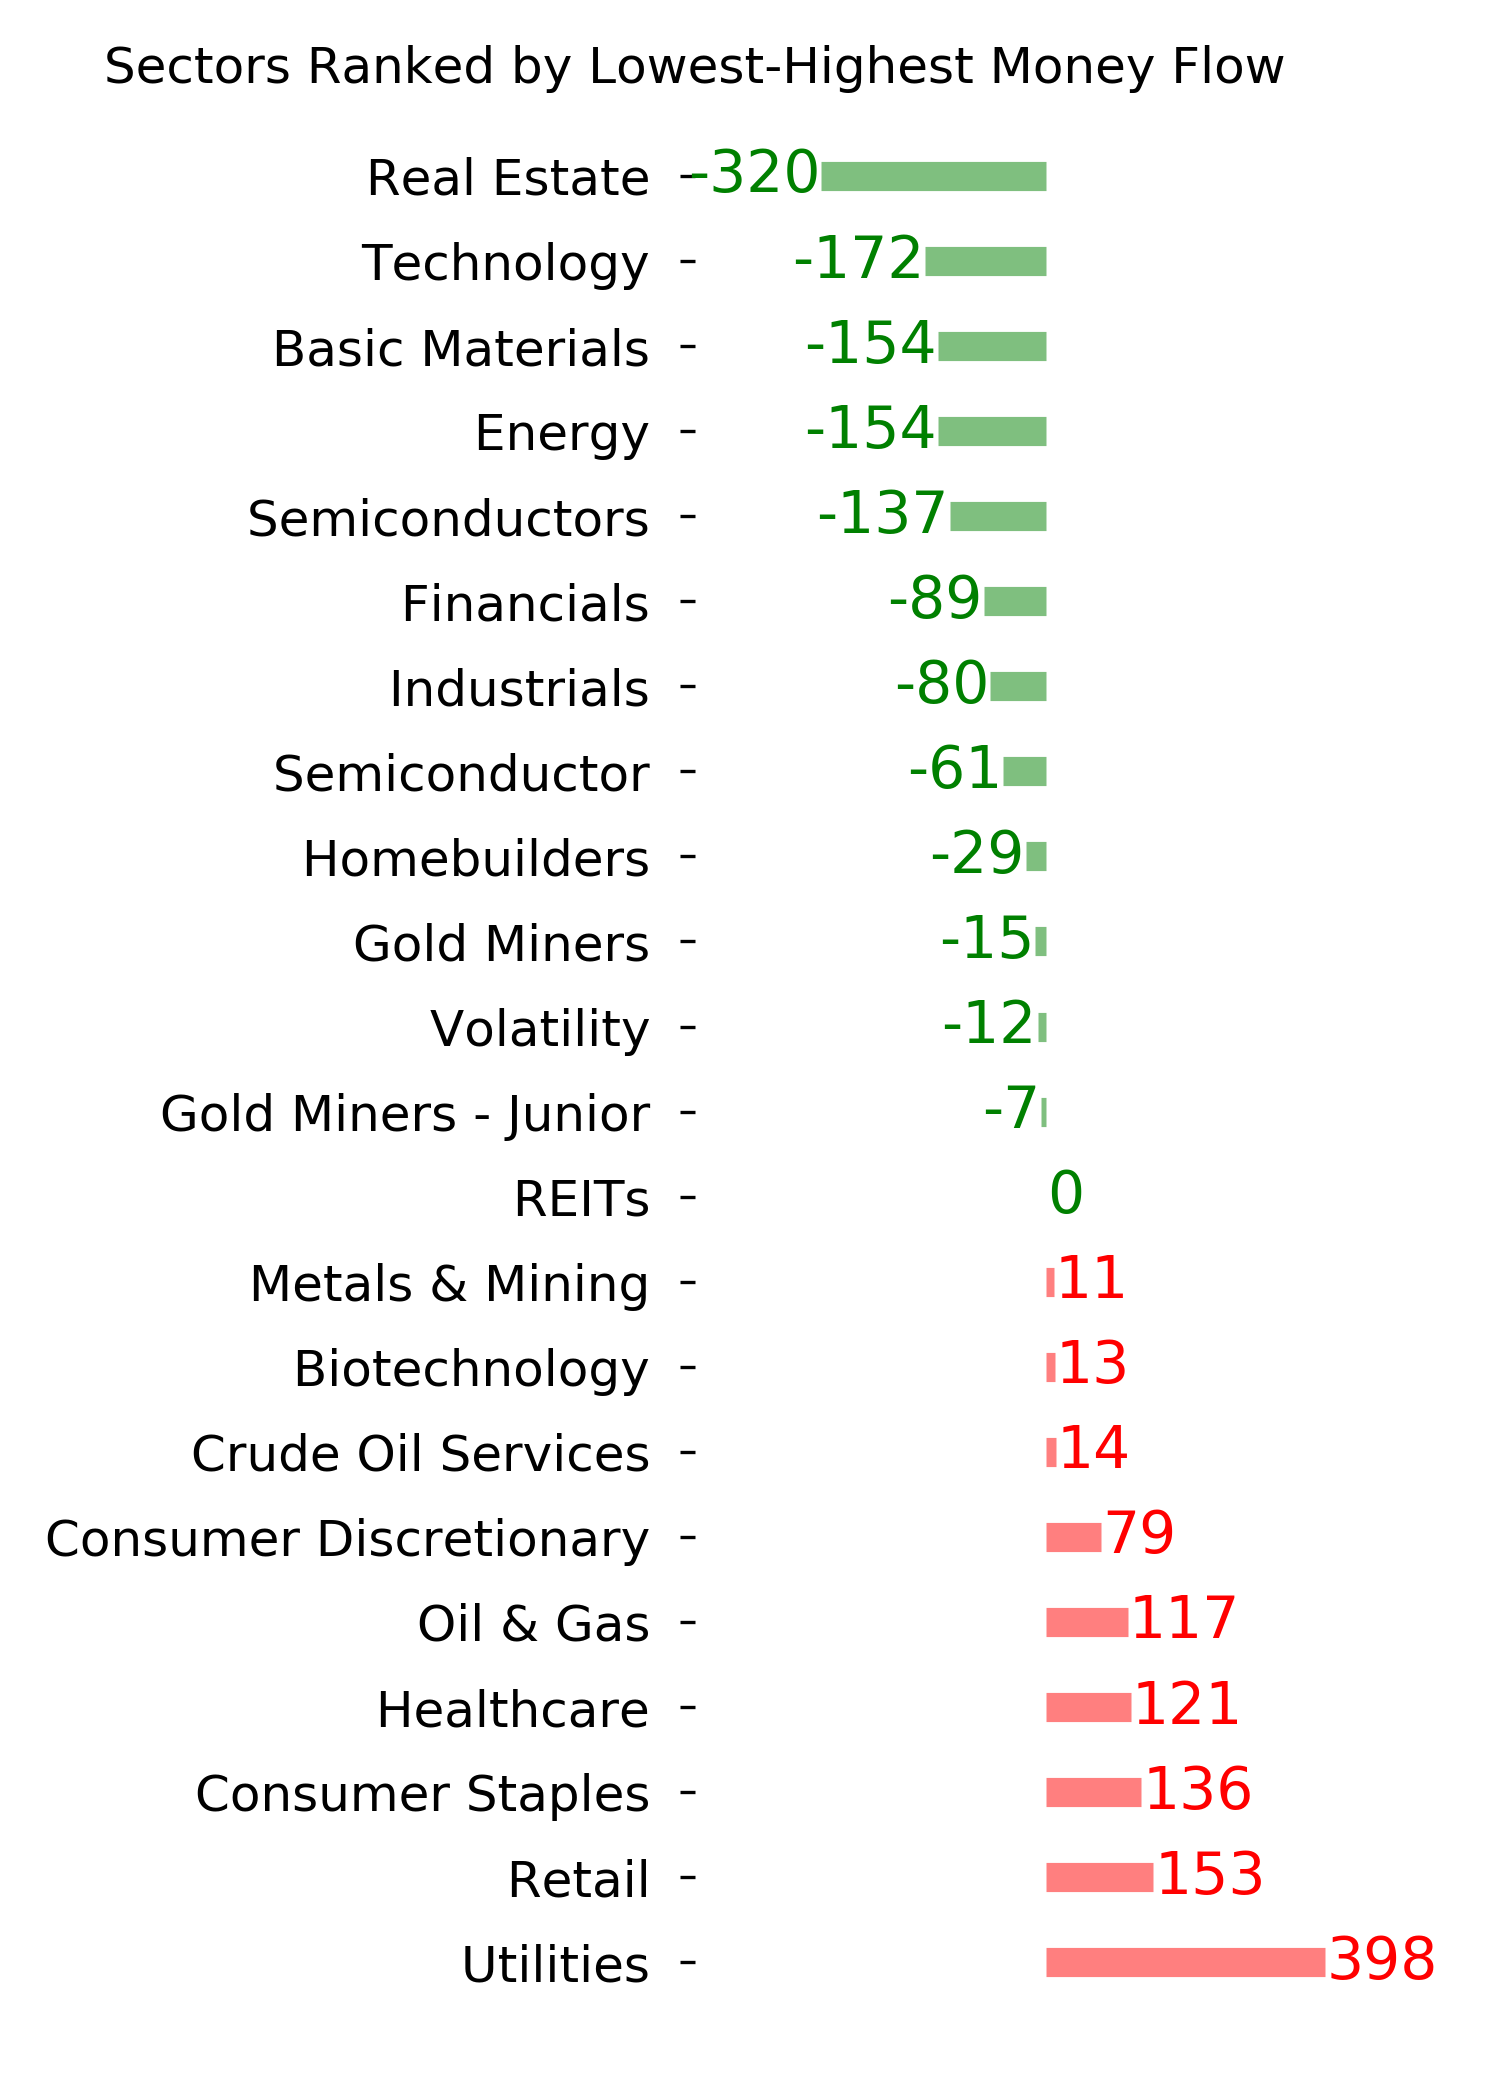
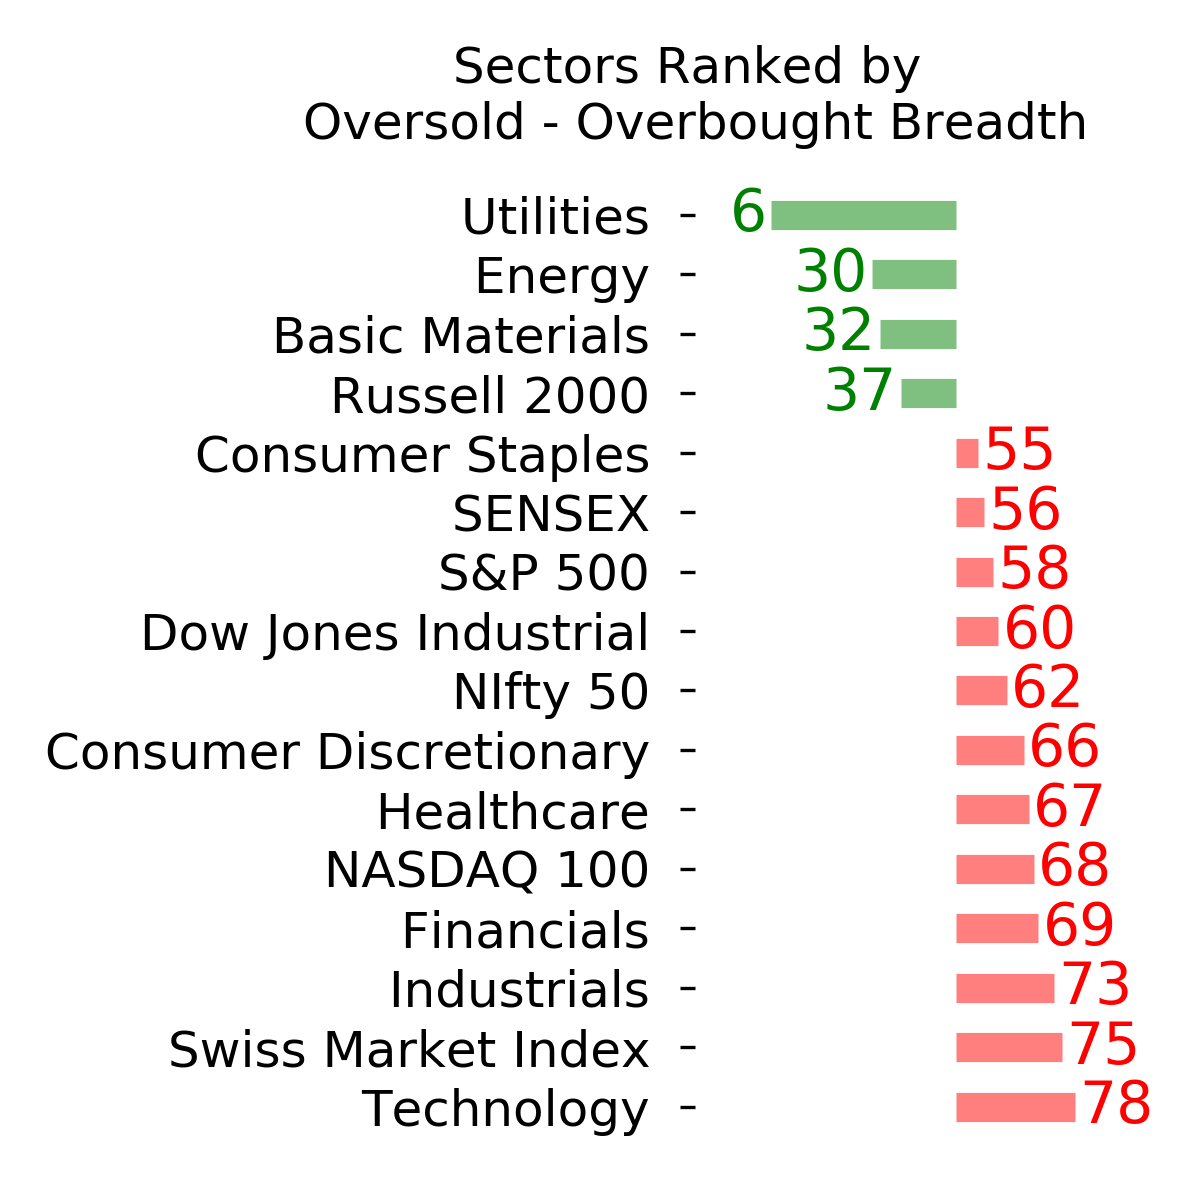
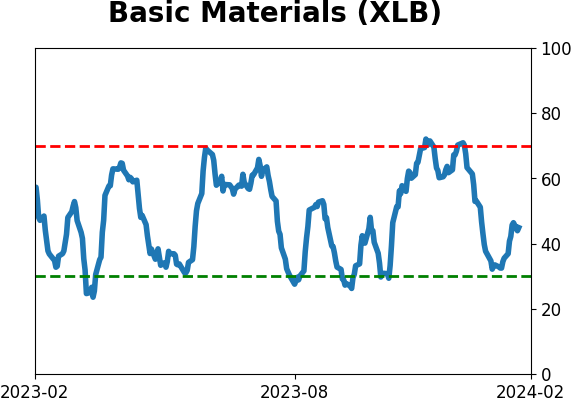
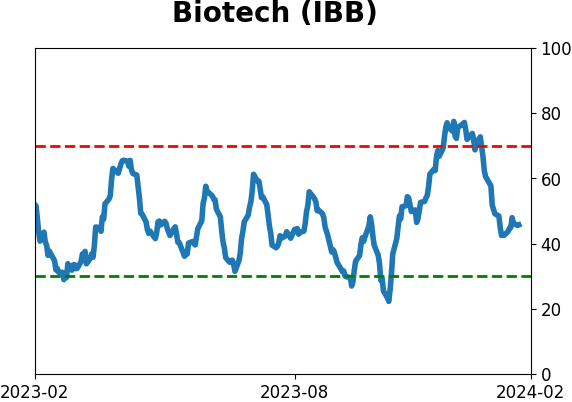
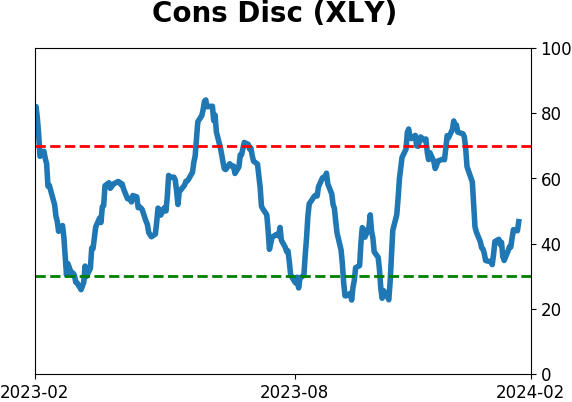
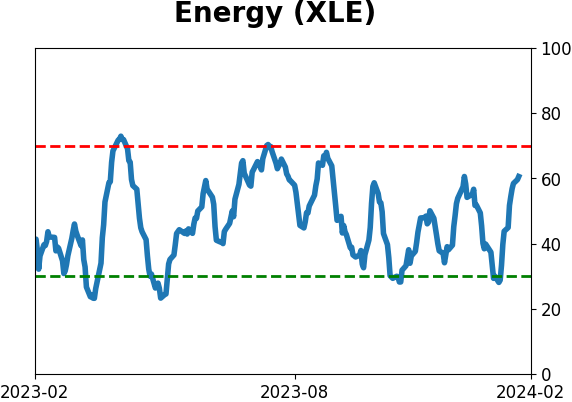
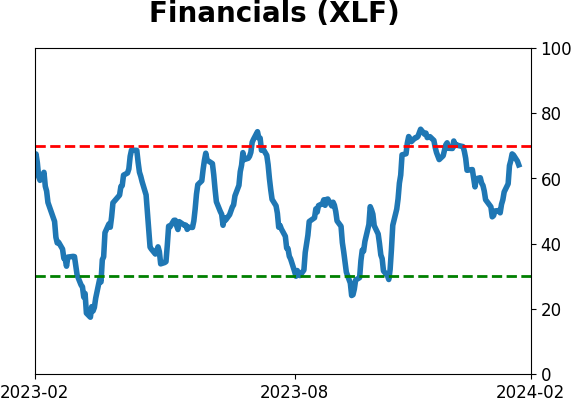
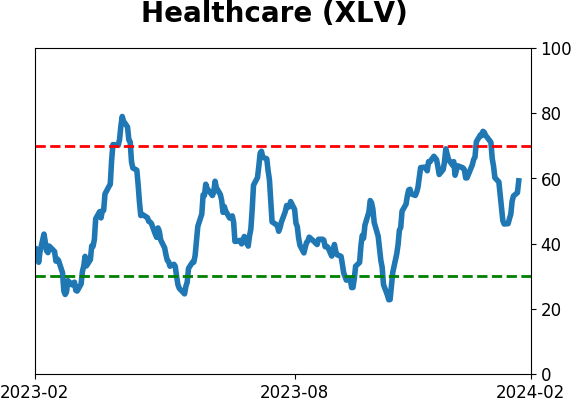
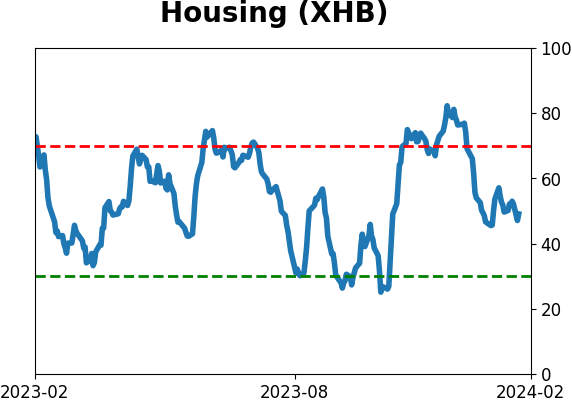
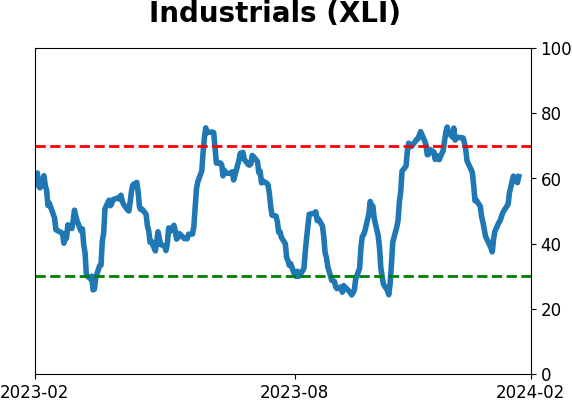
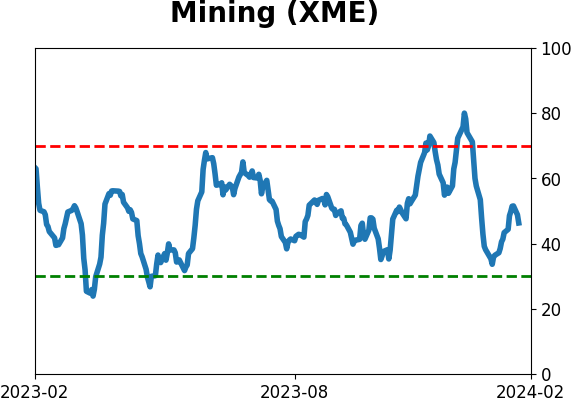
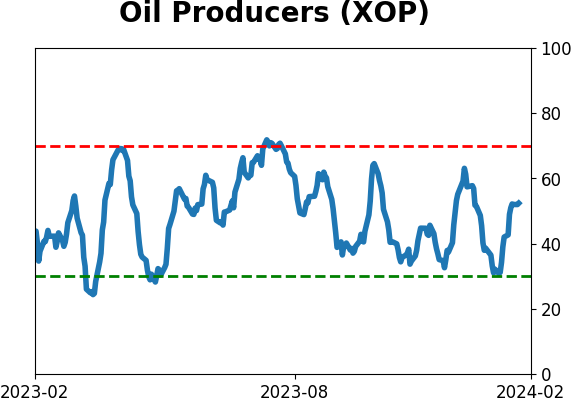
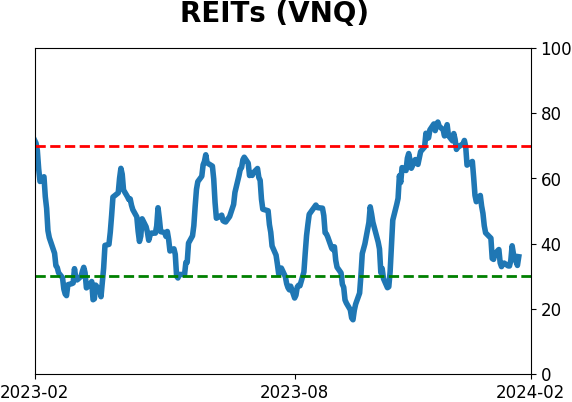
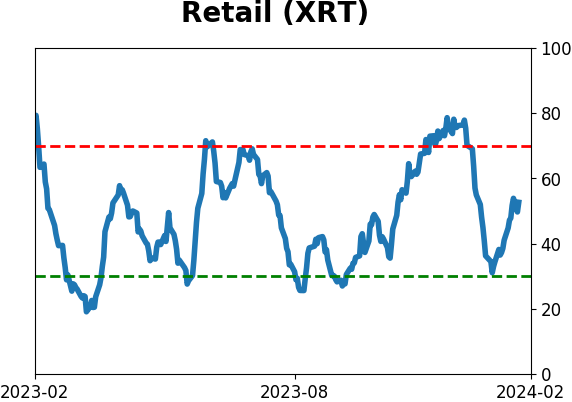
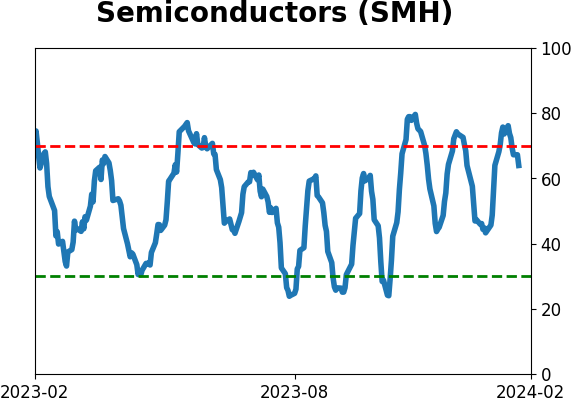
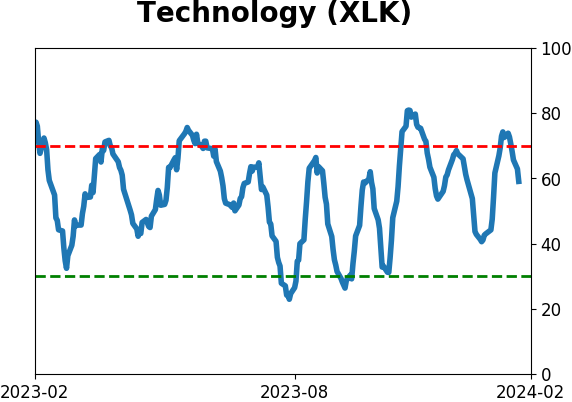
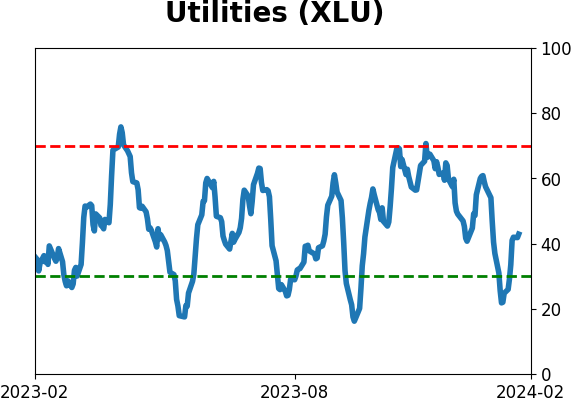
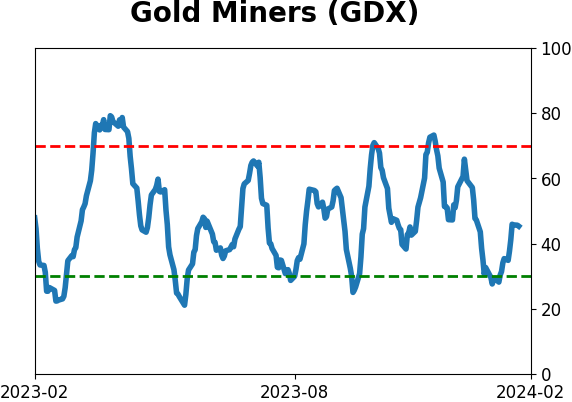
Sector ETF's - 10-Day Moving Average
|
|
|
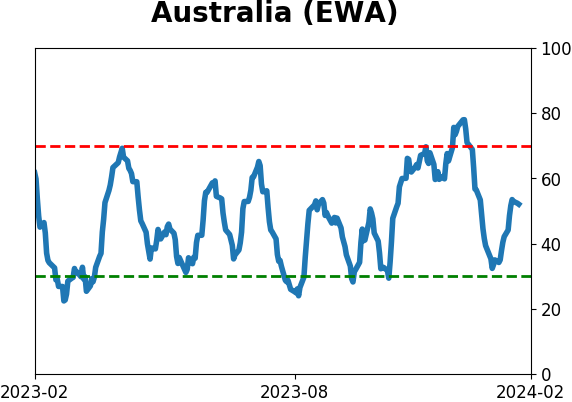
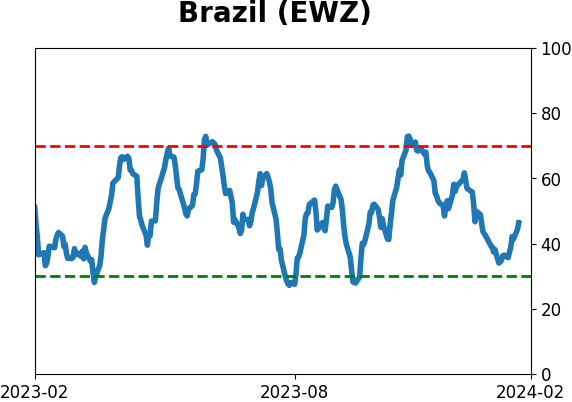
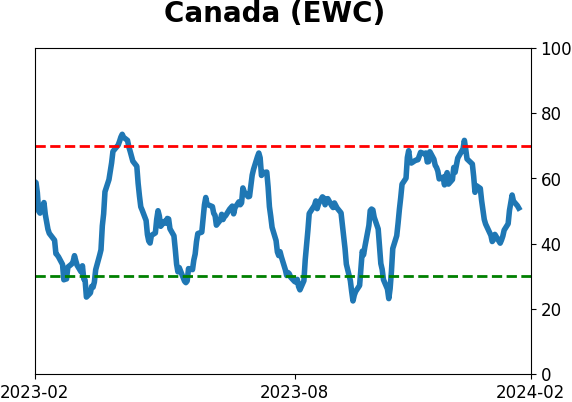
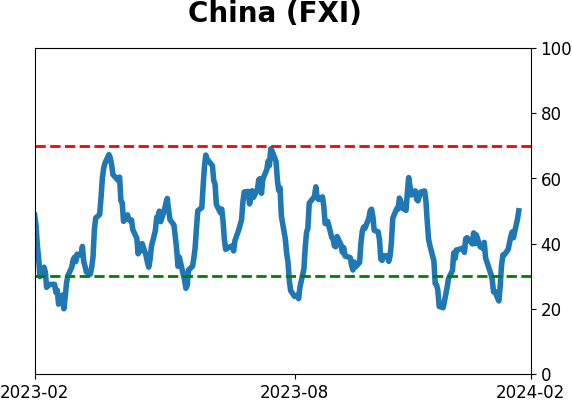
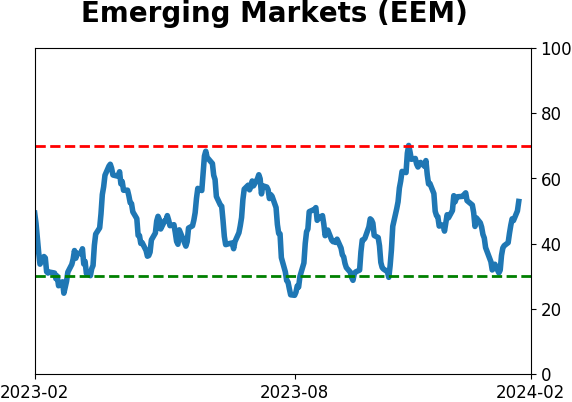
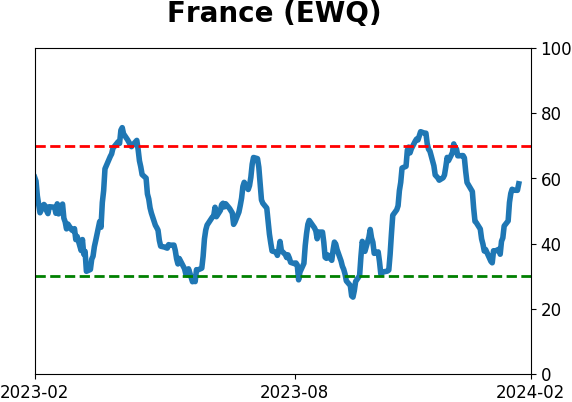
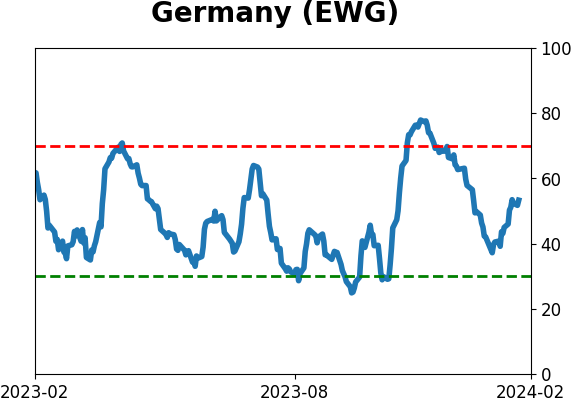
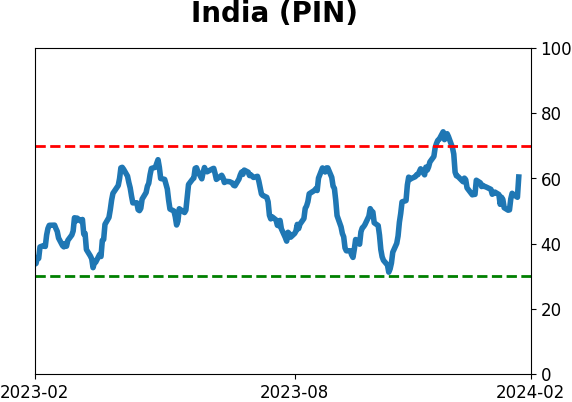
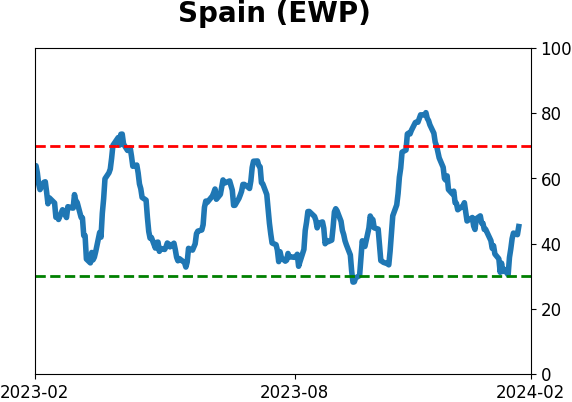
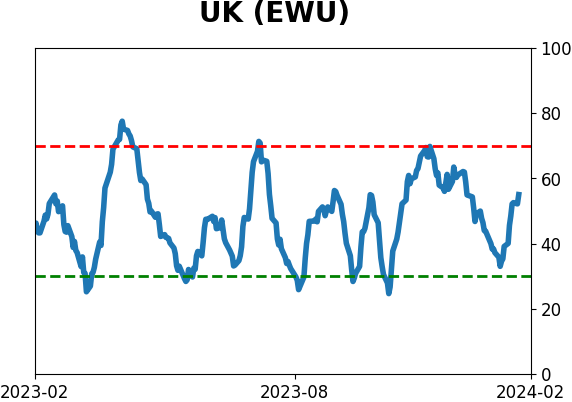
Country ETF's - 10-Day Moving Average
|
|
|
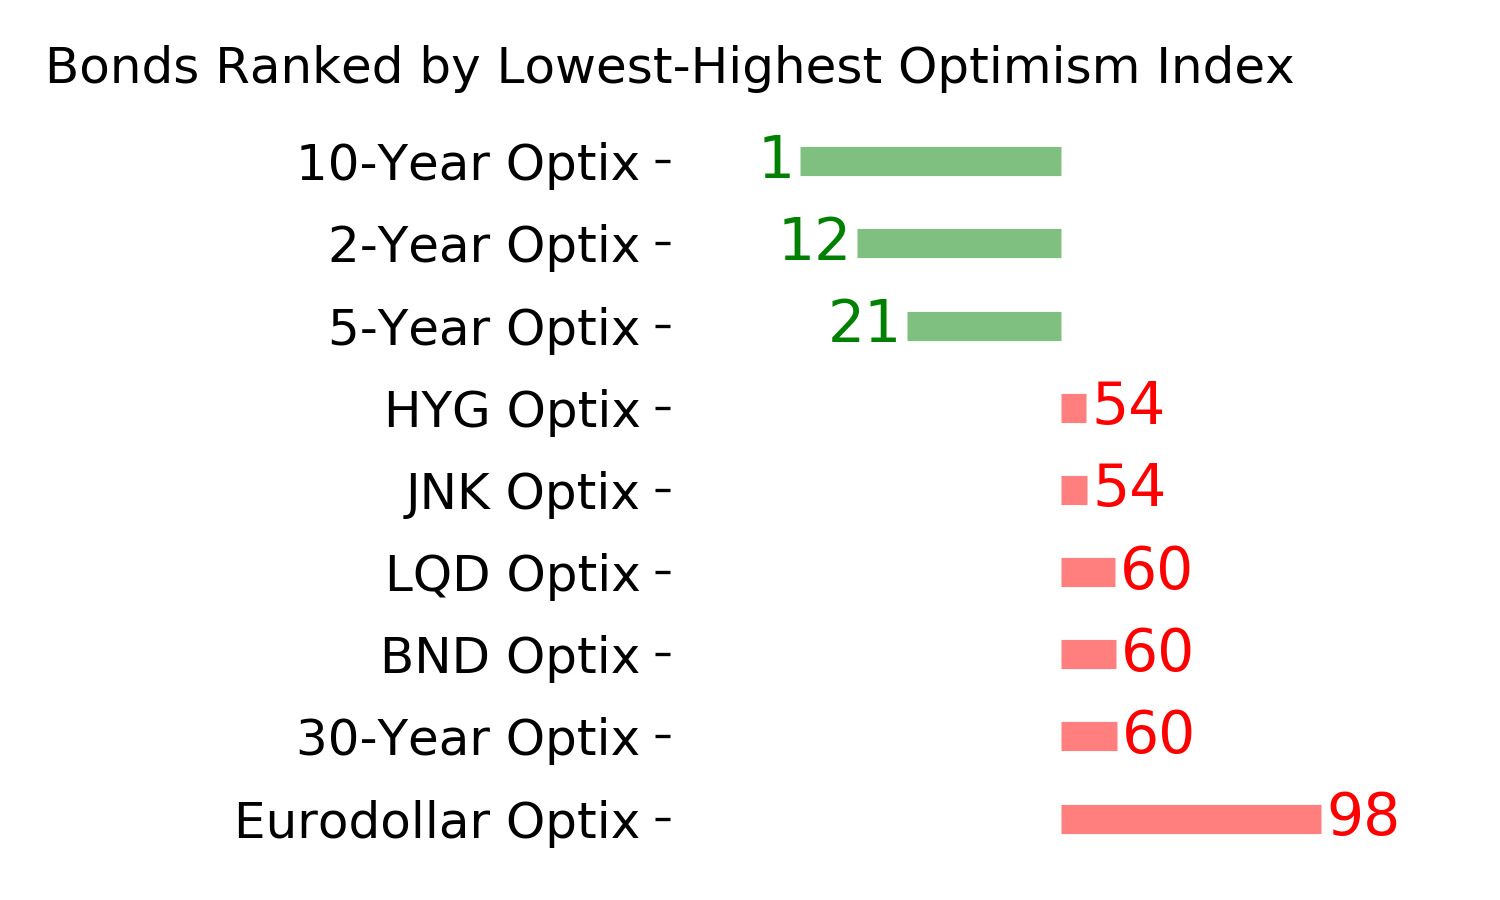
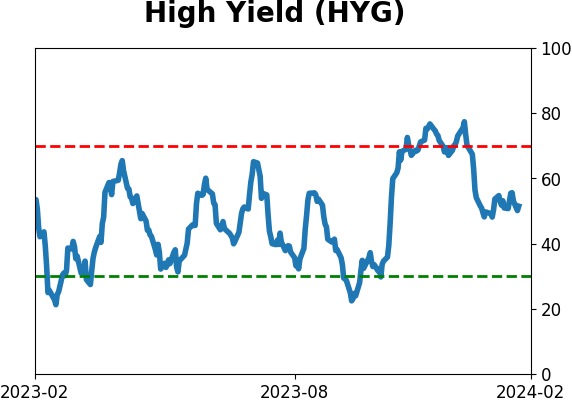
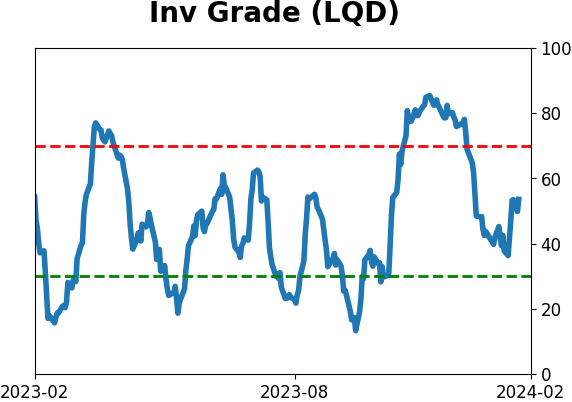
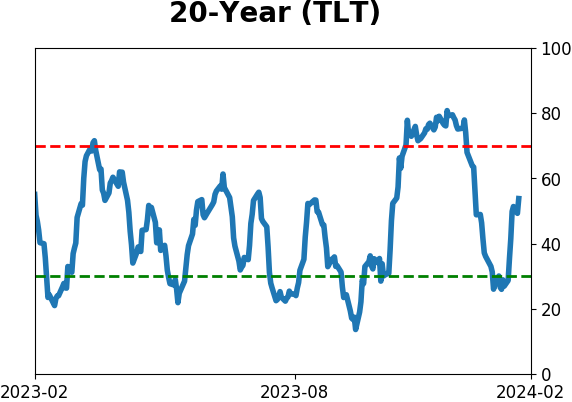
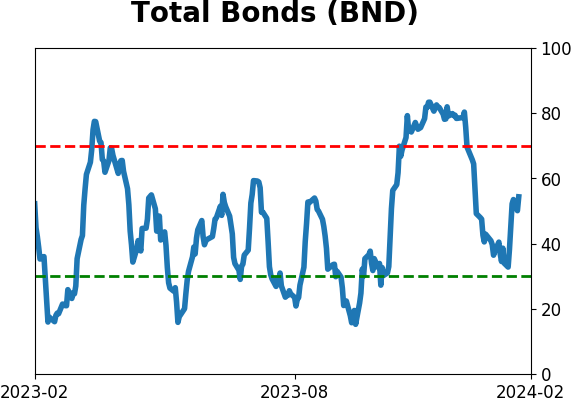
Bond ETF's - 10-Day Moving Average
|
|
|
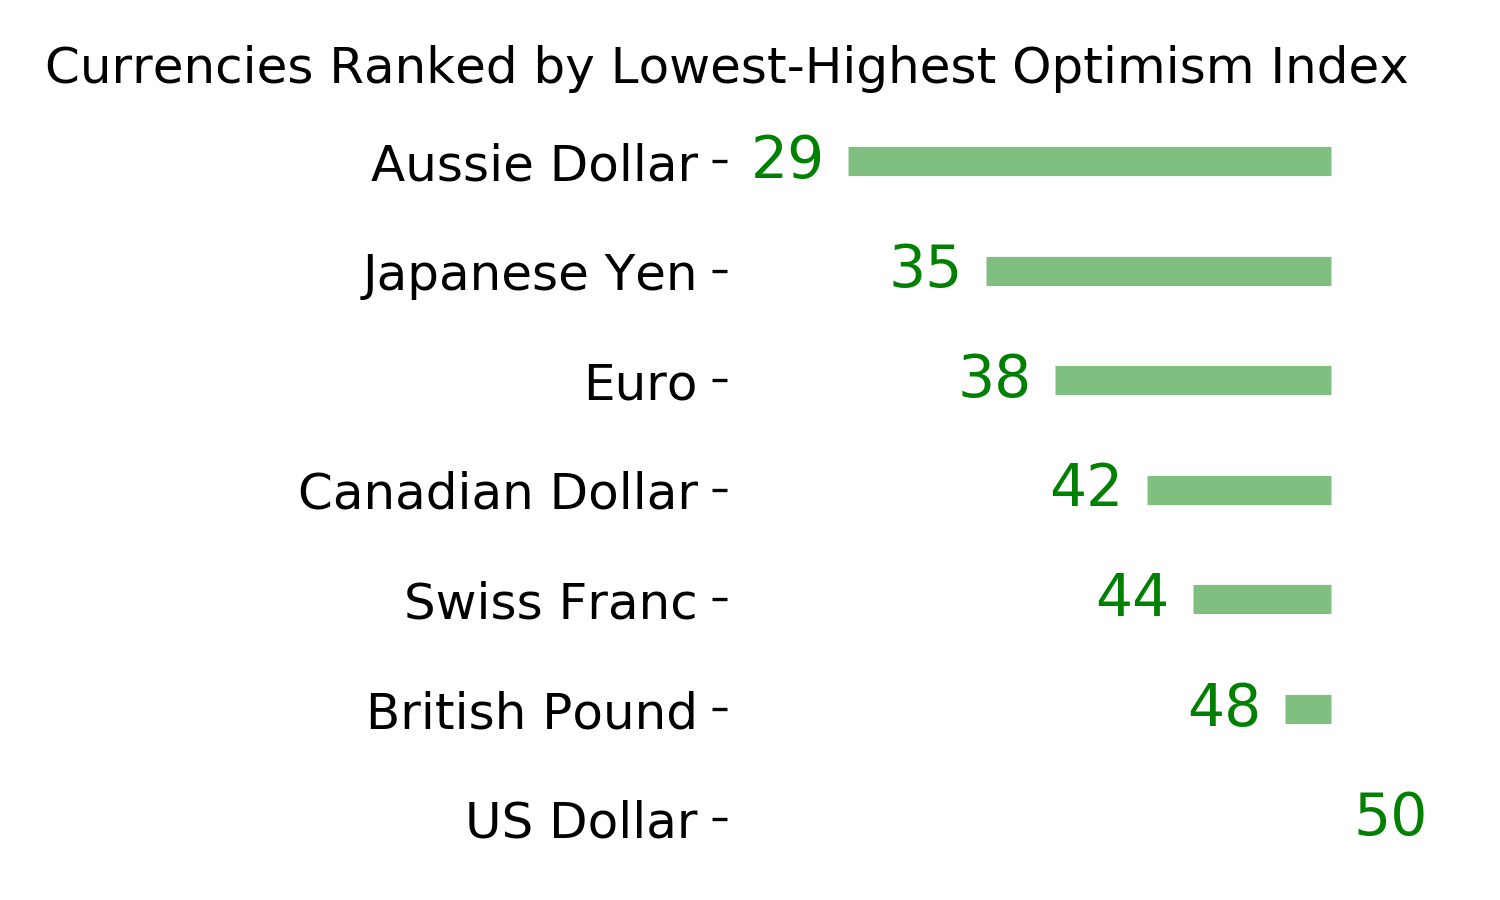
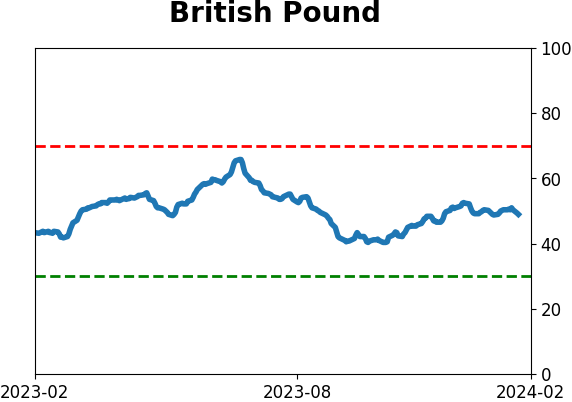
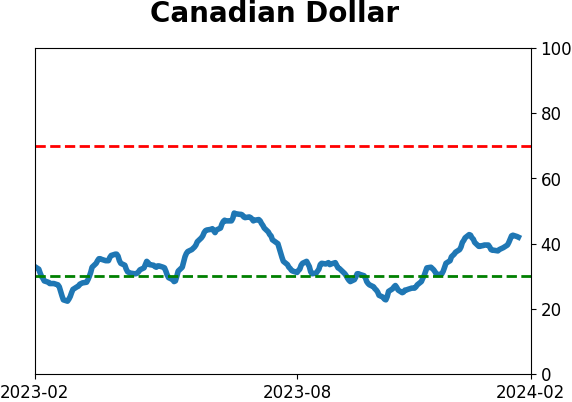
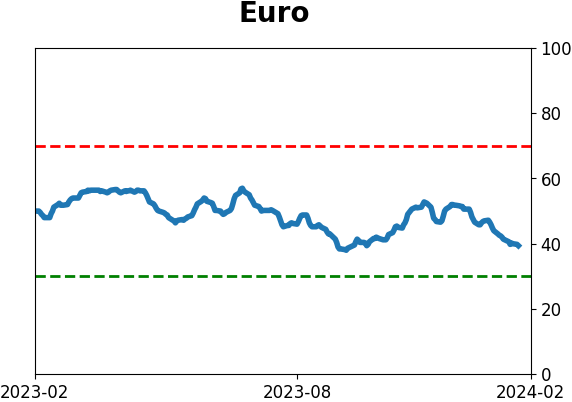
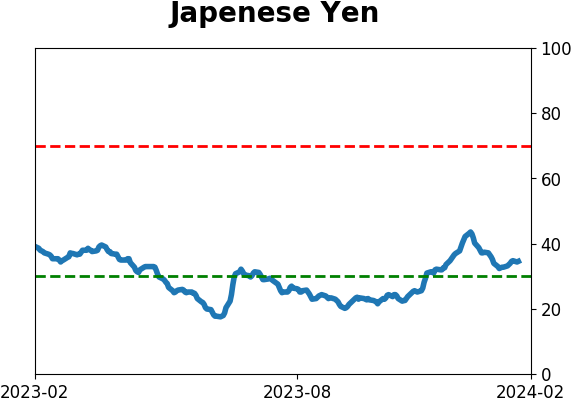
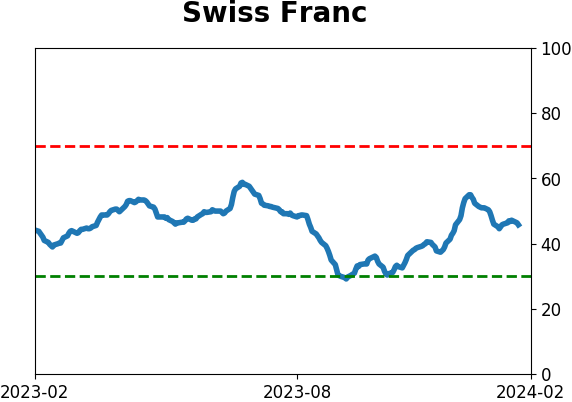
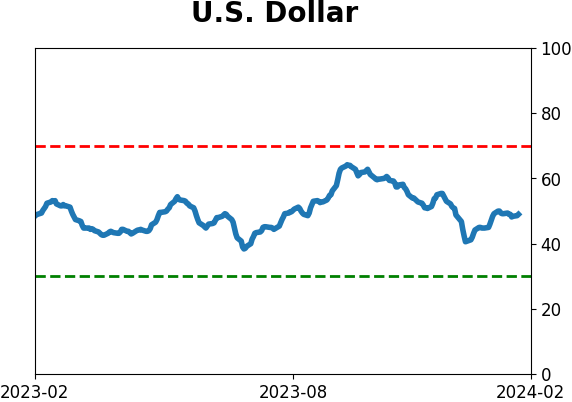
Currency ETF's - 5-Day Moving Average
|
|
|
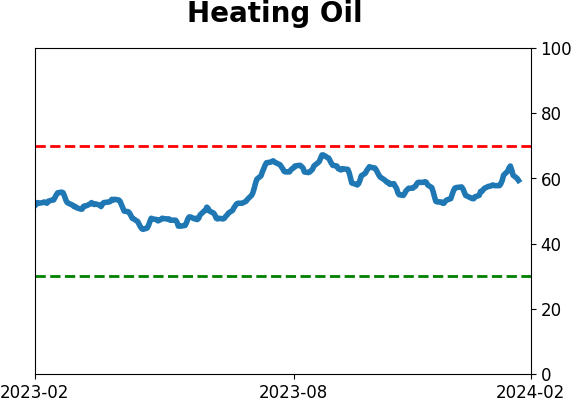
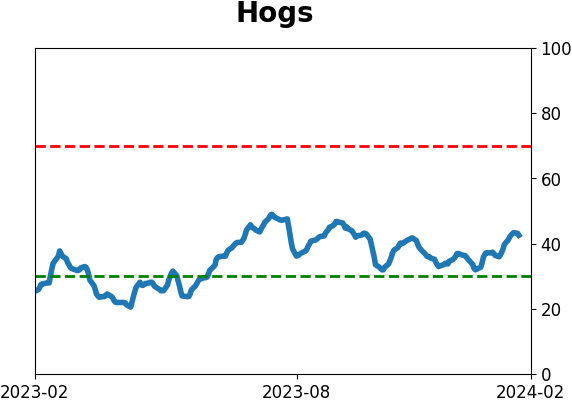
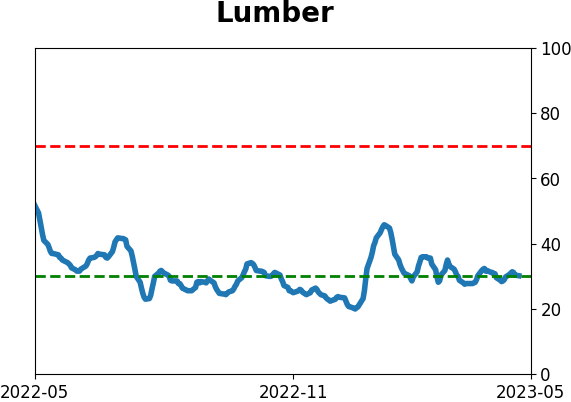
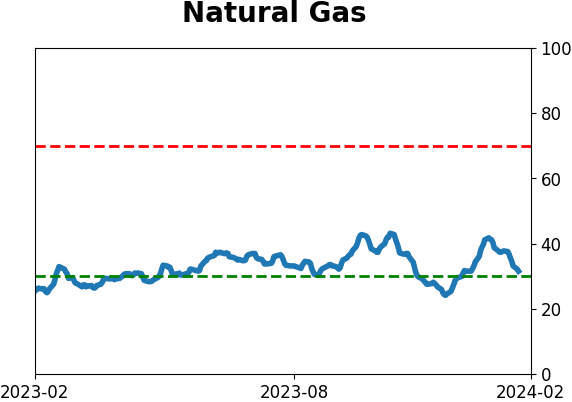
Commodity ETF's - 5-Day Moving Average
|
|